Thesis Summary Mechanical Behaviour of Rock Materials ... · Thesis Summary Mechanical Behaviour of...
39
Thesis Summary Mechanical Behaviour of Rock Materials under Dynamic Loading Qianbing ZHANG Rock Mechanics Laboratory Swiss Federal Institute of Technology in Lausanne Submitted to ISRM Rocha Medal Lausanne, November 2014
Transcript of Thesis Summary Mechanical Behaviour of Rock Materials ... · Thesis Summary Mechanical Behaviour of...

Thesis Summary
Mechanical Behaviour of Rock Materials under Dynamic Loading
Qianbing ZHANG
Rock Mechanics Laboratory
Swiss Federal Institute of Technology in Lausanne
Submitted to ISRM Rocha Medal
Lausanne, November 2014

Thesis Summary – Q.B. Zhang
Abstract
The deformation and fracture behaviours of rocks are of significance for analysing the safety and long term
stability of rock engineering structures when subjected to various loads. Mechanical behaviours of rock materials are
different under different loading conditions. In this thesis, combined experimental and analytical approaches are de-
veloped to investigate various aspects of mechanical behaviour over a wide range of strain rates, from quasi-static to
impact loadings.
A critical review is carried out to identify the validity and applicability of experimental techniques (i.e. loading tech-
niques, optical measurement techniques and testing methods), and to present the state-of-the-art in mechanical be-
haviour (including mechanical properties, physical mechanisms of strain rate, rate-dependent constitutive models,
and fracture criteria) of rock materials under dynamic loading.
Four types of testing methods have been developed using a modified split Hopkinson pressure bar system; notched
semi-circular bending method to determine the mode-I crack initiation and propagation toughness and fracture ener-
gy; Brazilian disc method to determine the tensile strength; uniaxial compression tests to determine the uniaxial com-
pressive strength; and passive confining pressure method to determine the triaxial compressive strength. The digital
image correlation method in conjunction with high-speed photography is developed for the measurement of full-field
strain fields and crack opening displacement. Three sets of shock wave experiments have been conducted to deter-
mine the shock Hugoniot behaviour, spall tensile strength and shear strength using a plate impact facility. Embedded
manganin stress gauges and a high-speed velocimeter using heterodyne techniques are used for the measurements of
stresses, shock velocity and free surface velocity. The detailed experimental procedures used to make measurements
are to great extent standard methods when determining mechanical properties and deformation fields under dynamic
loadings.
To systematically study the effect of strain rate, well-studied igneous, sedimentary, and metamorphic rocks in dynam-
ic experiments are selected in this research work. The normalized dynamic strength and fracture toughness (i.e. the
ratio of dynamic strength or toughness to the quasi-static one) of fine-grained marble and gabbro are apparently
higher than that of coarse-grained marble and sandstone, which are mainly governed by the following factors: micro-
structures, wave speeds, fracturing process, and induced microcrack features.
Micro-fractographic studies are carried out to characterize failure mechanisms using a scanning electron microscope
and a three-dimensional optical profilometry. The operating mechanisms of dynamic failure are mostly of transgranu-
lar microcracks, and moreover, with the increase of loading rate, the number of some typical microcrack modes, such
as multiple cleavage steps, opening microcracks and microbranches, is increased. The fractal dimension is dependent
to a large extent on microcrack modes. Based on macro- and microscopic experimental results and energy-based frac-
ture mechanics, a micromechanical mode is proposed to explain the failure transition from intergranular fracture to
transgranular fracture. The micromechanical model is also successful for predicting the fracture toughness of the grain
and the grain boundary under quasi-static and dynamic loadings.
This thesis critically reviews the state-of-the-art of experimental techniques and mechanical behaviour of rock materi-
als under dynamic loading. New results of experimental tests and analytical investigations are presented to gain an in-
depth understanding of rock dynamic problems in terms of stress wave propagation and dynamic fracture.
Keywords: Mechanical behaviour, dynamic loading, high strain rate, failure mechanisms, fracturing modes

Thesis Summary – Q.B. Zhang
1
1 Introduction
1.1 Overview of Rock Dynamics
Rock mechanics was defined by the US National Committee on Rock Mechanics in 1964 and subsequently modified in
1974: ‘Rock mechanics is the theoretical and applied science of the mechanical behaviour of rock and rock masses; it is
that branch of mechanics concerned with the response of rock and rock masses to the force fields of their physical
environment.’ Within the field of rock mechanics, an important subcategory is rock dynamics, dealing with the me-
chanical behaviour of rock materials and rock masses under dynamic loading conditions, where an increased rate of
loading induces a change in mechanical properties and fracture behaviour. Rock dynamic covers a wide scope ranging
from the initiation and forms of dynamic loads, transmission and attenuation of stress waves, rock dynamic damage
evolution and fracturing, to the support of rock structures subjected to dynamic loads. Figure 1 illustrates typical rock
dynamics issues related to the construction and utilization of an underground cavern. As schematically shown in Fig-
ure 2, there are four zones around an underground nuclear explosion. The vaporized and melted zones are in the
category of earth science at extremely high pressure, in which they will not be covered by the present study.
Figure 1 Overview of the rock dynamic problems and influencing factors in an underground engineering design
Figure 2 Schematic of an underground nuclear explosion (I: Vaporized, II: Melted, III: Crashed, and IV: Damaged Zones, data from Butkovich, 1965)
(a)
(b)

Thesis Summary – Q.B. Zhang
2
Dynamic behaviour of materials has been extensively investigated since the early 1900’s (Hopkinson 1901; Hopkinson
1914). However, it should be mentioned that guidance and standards in dynamic testing and design are generally
lacking. The following issues remain to be addressed:
Some inherent technical issues of dynamic experimental techniques and their validity and applicability need to be
carefully identified.
It is required to critically assess the state-of-the-art of numerous dynamic tests.
Accurate determination of mechanical properties over a wide range of strain rates is important to develop the
rate-dependent constitutive models and fracture criteria, and to validate numerical simulations.
Novel real-time optical methods, especially in combination with high-speed photography are extremely necessary
to perform high-rate deformation measurement accurately and quantitatively.
Microscopic experimental and theoretical investigations are required to study the physical mechanisms of strain-
rate effect.
Therefore, a comprehensive knowledge would benefit from quantitatively experimental and further theoretical ap-
proaches, and also is essential for research in leading to a deeper understanding of rock dynamics.
1.2 Objectives
The aim of this thesis is to perform the combined quantitatively experimental and theoretical methods gaining further
knowledge of dynamic mechanical behaviour of rocks. It is important to design reliable experimental methods, to
determine mechanical properties, to measure full-field deformation field, and to investigate failure mechanisms of
rock materials at laboratory scale. More specifically, the main objectives are classified into the following categories:
A Critical Review of Dynamic Experimental Techniques and Mechanical Behaviour: Various types of loading
techniques, optical measurement techniques, testing methods, and associated inherent technical issues are ana-
lysed and their applications to rock materials are critically reviewed. In-depth discussions are given on dynamic
mechanical properties, empirical rate-dependent equations, physical mechanisms of strain rate effect, phenome-
nological and mechanically-based rate-dependent constitutive models, and dynamic fracture criteria.
Quantitative Determination of Dynamic Mechanical Properties: An accurate knowledge of material properties is
of significance in rock engineering design. Dynamic mechanical properties of rock materials (including dynamic
uniaxial and triaxial compressive strength, splitting tensile strength, mode-I crack initiation and propagation
toughness, fracture energy, kinetic energy of fragments, Hugoniot elastic limit, spall tensile strength, shear
strength, etc.) are quantitatively obtained by a modified SHPB and a plate impact facility.
High-speed Optical Measurement Techniques: The digital image correlation (DIC) method in conjunction with
high-speed photography is developed for the measurement of full-field strain fields and crack opening displace-
ment in the SHPB tests. A high-speed velocimeter using heterodyne technique (HetV) is employed to determine
the free surface velocity in the plate impact experiments.
Micromeasurement and Micromechanical Modelling of Failure Mechanisms: Systematic micro-fractographic
studies on fracture surfaces are carried out, and a micromechanical model is established to examine failure mi-
cromechanisms under quasi-static and dynamic loads.

Thesis Summary – Q.B. Zhang
3
2 Experimental Techniques for Dynamic Testing
2.1 Loading Techniques
A classification of loading techniques and mechanical states for rocks over a wide range of strain rates is shown in
Figure 3, which is particularly based on experimental results of rock materials. Mechanical properties and fracture
behaviours exhibit a general trend: i.e. they change with the loading rate. In particular, the responses distinguishably
change after the loading rate exceeds a critical value. Two reviews of 50 years of research since the pioneering work in
the 1960s is intended to present the state of the art in experimental techniques for the determination of dynamic
behaviour of rock materials ranging from 10-1 to 106 s-1.
Figure 3 Classification of loading techniques and the state of rock materials over a wide range of strain rates
One of the most widely used loading techniques for HSR is the split Hopkinson bar (SHB) or the Kolsky bar. The princi-
ple of the traditional SHPB technique is briefly described in this section. We focus on the key techniques for character-
izing the dynamic response of rock materials, as summarized in Table 1.
Table 1 Major developments in split Hopkinson bar for rock materials
Year Major developments References
1966 Stress-strain relation (Hauser 1966)
1967 The first thesis: stress-strain; size effect; energy transmission and failure characteristics
(Hakalehto 1967)
1968 Temperature effect (Kumar 1968) 1968 High-speed camera for recording dynamic fracturing (Perkins and Green 1968) 1970 Stress-strain curve; temperature effect (Perkins et al. 1970)
1972 Hydrostatic confining pressure chamber; stress-strain curves; truncated cone striker
(Christensen et al. 1972)
1974 Anisotropy effect; cylindro-conical striker; direct tension test (Howe et al. 1974)
1974 Effects of confining pressure and temperature; hydrostatic confining pressure chamber
(Lindholm et al. 1974)
1976 Anisotropy effect; direct tension and torsion tests (Goldsmith et al. 1976) 1977 Pure shear test using the TSHB and a thin-walled tubular specimen (Lipkin et al. 1977) 1979 The radial inertia effects (Powell 1979) 1984 WLCT method for fracture toughness (Klepaczko et al. 1984) 1987 Spalling test (Khan and Irani 1987)
1990 SENB method for fracture toughness; an optical technique for measur-ing COD
(Tang and Xu 1990)
1993 BD method for tensile strength (Dutta and Kim 1993)
1993 Effects of stress waveforms produced by rams on energy dissipation and fragmentation
(Li et al. 1993)
1994 Saturation effect in the spalling test (Lou 1994)
1995 Dynamic Moiré method for detecting the time-to-fracture and measur-ing COD
(Yu and Zhang 1995)

Thesis Summary – Q.B. Zhang
4
1997 Inverse analysis for stress-strain curve; separation of stress waves (Zhao and Gary 1997) 1999-2001
SR method for fracture toughness; temperature effect; fracture charac-teristics; energy
(Zhang et al. 1999)
2000 A truncated-cone shaped striker; oscillation elimination (Li et al. 2000) 2001 Pulse shaper; size effect (Frew et al. 2001) 2005 75 mm diameter bar; intermediate strain rate; fracture modes; energy (Li et al. 2005) 2006 FBD method for tensile strength and elastic modulus (Wang et al. 2006) 2007 Wave propagation through fractured rocks with fractal joint surfaces (Ju et al. 2007) 2007 Infrared thermography for measuring temperature (Shi et al. 2007) 2008 SCB method for flexural strength (Dai et al. 2008) 2008 TSHB to study frictional slip resistance (Yuan and Prakash 2008) 2008 Size effects on both bars and specimens (Li et al. 2008a) 2008 Development of coupled quasi-static and dynamic SHPB (Li et al. 2008b) 2009 SHTB for direct tensile strength (Asprone et al. 2009) 2009 Rock pulverization under uniaxial compressive loading (Doan and Gary 2009) 2009-2012
CCNBD, NSCB and CCNSCB methods for fracture toughness, tempera-ture effect
(Xia et al.2009-2013)
2010 Triaxial SHPB; hydrostatic confining pressure chamber (Frew et al. 2010) 2010-2011
HCFBD and CSTFBD methods for mode I and mode II fracture toughness, size effect
(Wang et al. 2010, 2011)
2010-2012
Rock-SHPB; rock bars (Li et al. 2010)
2011 Punch shear method for shear strength (Huang et al. 2011) 2011 Rock pulverization under confining pressure; the shrink-fit metal sleeve (Yuan et al. 2011) 2011 The designed triaxially compressed split Hopkinson bar (TriSHB) (Cadoni and Albertini 2011) 2012 The coupling effects of the confining pressure and temperature (Fang et al. 2012) 2012 Suggested methods for UC, BD and NSCB testing (Zhou et al. 2012) 2013 HS-DIC for UC, BD and NSCB testing (Zhang and Zhao 2013)
2.2 Measurement Techniques
The ability to quantitatively obtain dynamic mechanical properties and deformation fields, to fully understand various
fracturing process and failure mechanisms and to effectively validate theoretical models of material behaviour is
largely dependent on measurement techniques.
2.3 Testing Methods
Suggested methods from the ISRM and ASTM for determining mechanical properties of rock materials under quasi-
static loading are based on core-shaped samples, since such specimens can be easily prepared. Most dynamic testing
methods are extended or modified from quasi-static ones, as summarized in Table 2, which also include measurement
techniques and methods for interpreting experimental data.
2.4 Summary
This review of 50 years of research since the pioneering work in the 1960s is intended to present the state of the art in
experimental techniques for the determination of dynamic behaviour of rock materials. The full understanding of
dynamic mechanical behaviour heavily depends on reliable experimental techniques, testing procedures and effective
numerical calibrations. This chapter presents some prospects requiring further investigation.

5
Table 2 Summary of testing methods for determining mechanical properties of rock materials under both quasi-static and dynamic loading conditions
Loading type Testing methods Quasi-static properties Dynamic properties Calculation for
)(d t ,
);(dynI vtK
Determination of
d vt ;f , DId,K
Tension DT t (ASTM 2008a) td (Goldsmith et al. 1976)
Pressure transducer or SG on bars
Peak load
Compression
BD t (ISRM 1978) td (Zhao and Li 2000)
FBD t (Wang et al. 2004) td (Wang et al. 2009)
UC uc (ISRM 1979) ucd (Zhou et al. 2012)
TC tc (ISRM 1983) tcd (Christensen et al. 1972)
Shear (Stacey 1980) d (Zhao et al. 1998)
HC(F)BD ICK (Fischer et al. 1996) IdK (Wang et al. 2010) Finite element meth-od and SG
SG CST(F)BD ICK , I ICK (Atkinson et al. 1982)
IdK , I IdK (Nakano et al. 1994)
SR ICK (Ouchterlony 1988) IdK (Zhang et al. 2000)
Quasi-static theory, FEM calibrating
)Ra(f
Dynamic Moiré
IdK (Costin 1981)
Peak load
WLCT ICK (Klepaczko et al. 1984) IdK (Klepaczko et al. 1984)
HCBD ICK (Fischer et al. 1996) IdK (Lambert and Ross 2000)
CCNBD ICK (Fowell 1995) IdK (Dai et al. 2010a)
Bending
TPB t (Jaeger 1967) td (Zhao and Li 2000)
SCB t (Van de Ven et al. 1997) td (Dai et al. 2008)
SENB ICK (ASTM 2011) IdK (Zhao et al. 1999b)
CNSCB ICK (Kuruppu 1997) IdK (Dai et al. 2011)
NSCB ICK (Chong and Kuruppu 1984;
Kuruppu et al. 2013)
IdK (Chen et al. 2009)
IDK (Chen et al. 2009) Thermodynamics+LGG LGG, HS-camera
IdK (Zhang and Zhao 2013a) Quasi-static theory SG, CPG, DIC, HS-camera
IDK (Zhang and Zhao 2013b) Thermodynamics +DIC

Thesis Summary – Q.B. Zhang
6
3 Dynamic Mechanical Behaviour of Rock Materials
3.1 Dynamic Uniaxial Compressive Behaviour
Figure 4 shows the results for the normalized uniaxial compressive strength as a function of strain rate obtained over
the last five decades.
Figure 4 Normalized dynamic uniaxial compressive strength as a function of strain rate
3.2 Dynamic Tensile Behaviour
Figure 5 shows the normalized dynamic tensile strength as a function of loading rate. It can be seen that the strain
rates of the DT results are higher than those obtained by indirect tension testing methods, since the specimen sizes
are usually smaller in indirect tension tests.
3.3 Dynamic Fracture Behaviour
The dynamic crack initiation toughness IdK is determined by the time to fracture ft and is given by the equation
)()( fdynI
dynIId tKKK . Figure 6 shows the normalized dynamic crack initiation toughness as a function of normalized load-
ing rate for several materials.

Thesis Summary – Q.B. Zhang
7
Figure 5 Normalized dynamic tensile strengths as functions of: loading rate
Figure 6 Normalized dynamic crack initiation toughness as a function of the normalized loading rate
3.4 Semi-Empirical Equations for Rate Dependent Strength
There have been many attempts to derive semi-empirical equations to express the relationship between
strain/loading rate and the mechanical properties of rock materials, as summarized in Table 3.
Table 3 Semi-empirical rate dependent strength equations for rock-like materials
Rock type Strain rate (s-1) Semi-empirical equation Material con-stants
Refs
Granite 10-8~10-4 ucucd )log( C C=13, 340uc
(Masuda et al. 1987)
Granite 10-4 ~100 ucsdducd )log( RSC ,
MPa/s 1~5.0s
11.9d RSC ,
170uc (Zhao et al. 1999a)
Rocks 100 ~105 na ucd a , 3/1max n (Grady and Lipkin 1980)
Limestone 10-6 ~104 )c1/(1
ucdn , ( 210 );
n/1ucd , ( 210 )
130c n , 3.0n (Lankford 1981)
Tuff 10-6 ~103 007.0
ucd , ( 176 s ); 35.0
ucd , ( 176 s ) (Olsson 1991)
Limestone 10-5 ~10-1 }02
)03(0{
/01
)0(
0tcd }{
kr
RTUk eek
, U , 401 k , (Serdengecti
and Boozer

Thesis Summary – Q.B. Zhang
8
ref30 , )(, 000 frk , e.g. MPa 8133 7252 k 1961)
Granite 10-4 ~100 3sductcd )log( NM M=34.46, N=3.95 (Li et al. 1999)
Concrete
10-5~103
s026.1
sucucd )(
, ( 130 s );
3
1
ssucucd )(
,
( 130 s ), 15s s 100.3
)10/5/(1 ucs ,
)0.2s156.6(s 10
(CEB 1988)
10-6~103
s016.1
sttd )(
, ( 130 s );
3/1
ssttd )(
,
( 130 s ), 16s s 100.3
)10610/(1 ts ,
)33.2s11.7(s 10
10-6 ~103 ]058.1log00965.0[ucucd , ( 11.63 s );
]289.0log758.0[ucucd , ( 11.63 s )
(Tedesco and Ross 1998)
10-5 ~101 ]833.1log1425.0[ttd , ( 132.2 s );
]814.0log929.2[ttd , ( 132.2 s );
Brazilian disc tests
3.5 Dynamic Fracture Criteria
A summary of dynamic fracture criteria and a brief description to rock materials are presented in Table 4.
Table 4 A summary of dynamic fracture criteria for quasi-brittle materials
Name of criterion Fracture criterion formula Applicability and comments Ref
Mohr-Coulomb
3ucd1d q q is hardly influenced by (Li et al. 1999)
)sin1/()sin1(3ucd1d ,
cos2/)sin1(ucdd c
Only applicable in low confining pressure; is unaffected by
(Zhao 2000)
Hoek-Brown 5.0ucd3ucd31d )0.1( m m is not affected by (Zhao 2000)
Dynamic SIF-based
2
I2s
d2
)]0),(,()([)(
1tltKvk
vRCE
Widely used in micromechanics based constitutive models
(Ravi-Chandar 2004)
Tuler-Butcher K)(f
0 0 dtt
Predicting spalling tensile strength and the location of the failure plane
(Tuler and Butcher 1968)
Modified TB K)(f
0 0 dtt
Dimensionally equivalents to (Tuler and Butcher 1968); pre-dicting dynamic fracture tough-ness
(Zhao 1995)
Critical impulse adtE 3/)2(0
21
Assuming the pulse duration is a constant; without physical ex-planation
(Steverding and Lehnigk 1970)
Incubation-time fracture
td),(
d
11
dxdttxx
x
t
t;
ICI )(1
KdttKt
t
Time-spatial domain is discre-tized by assuming two material constants, i.e. incubation time
and characteristic size d . Physi-
cal meanings of and d ?
(Petrov and Morozov 1994; Petrov and Utkin 1989)
3.6 Summary
This review of 50 years of research presents the state of the art in dynamic behaviour of rock materials. The full un-
derstanding of dynamic behaviour depends on reliable experimental techniques, testing procedures and effective
numerical simulations.

Thesis Summary – Q.B. Zhang
9
4 Dynamic Mechanical Properties and Full-Field Strain Measurements
4.1 Material Characterizations
Figure 7 shows the scanned images of thin-section at a resolution of 2,400 dpi and the optical cross-polarized micro-
graphs of four types of rock.
Figure 7 Scanned images of thin-section at a resolution of 2,400 dpi (top) and cross-polarized micrographs (bottom) of: (a) sandstone, (b) gabbro, (c) coarse-grained marble, (d) fine-grained marble
4.2 Split Hopkinson Pressure Bar
The SHPB consists of a striker bar, an incident bar and a transmission bar, with a specimen sandwiched between the
incident and transmission bars, as shown in Figure 8. Figure 9 shows the photos of the modified SHPB system. The
SHPB system consisted of a gas gun, a cone-shaped striker, an incident bar, a transmission bar, a momentum bar and a
momentum trap. The striking velocity was measured by a laser-beam velocity measurement system. The high-speed
imaging system consists of a CMOS sensor-based HS-camera (Photron Fastcam SA1.1), a macro-lens (Kenko PRO 300
2.0 objective lens), a set of extension tube (Kenko 12, 20 and 36 mm), and a ring-shaped flash light (Pallite VIII 120V).

Thesis Summary – Q.B. Zhang
10
Figure 8 Schematic of the split Hopkinson pressure bar system in Central South University (Not to scale)
Figure 9 Photos of the split Hopkinson pressure bar system: (a) the SHPB bars, (b) measurement systems in Central South University
4.3 High-Speed Digital Image Correlation
The DIC technique described above is implemented in Matlab to estimate in-plane surface strain fields. The procedure
of the HS-DIC technique was schematically illustrated in Figure 10.
Momentum trap
Momentum bar
Transmission bar
(a)
Incident bar Gas gun
Computer Time counter
Laser beam
Gas gun
CS-1D dynamic
strain meter
1 m
Oscilloscope (b)

Thesis Summary – Q.B. Zhang
11
Figure 10 Schematic and steps of the digital image correlation technique
4.4 Experimental Methods
NSCB, BD, UC and passive confining tests were performed for measuring Mode-I dynamic crack initiation toughness,
dynamic tensile strength, dynamic uniaxial compressive strength and dynamic triaxial compressive strength. The pho-
tographic view of dynamic testing methods was shown in Figure 11.
Figure 11 Photographic views of dynamic testing methods: (a) notched semi-circular bending, (b) Brazilian disc, (c) uniaxial compression, and (e) schematic of passive confining pressure
4.5 Dynamic Fracture Behaviour
Figure 12(a) represented a typical testing result with a striking velocity of 3.25 m/s. Ten images were captured before
the stress wave arrived at the specimen calculated using Eq. 4:9 and the value indicated in Figure 12(b). It can be seen
from Figure 12(c) that the time-to-fracture of SG1, 1ft was about 40 s and the time of crack propagating from SG1 to
SG2, 12t , was approximately 15 s.
(d)

Thesis Summary – Q.B. Zhang
12
Figure 12 Dynamic testing results of a typical NSCB test (No. FM-SCB8): (a) raw data, (b) magnitude view of the partial incident wave, (c) magnitude view of the partial data of strain gauges
It can been seen from Figure 13, individual white belt developed from the pre-notched tips in response to loading
prior to the initiation of any macroscopic observable crack, as indicated by a dashed arrow. The crack initiated at
about 38 s, after initiation, the observable crack tip formed and the crack tip position was denoted as a solid arrow.
It was shown in Figure 14 that the specimen was in a state of stress equilibrium through the time-to-fracture.
Figure 13 High-speed images at different stages of the typical NSCB test (No. FM-SCB8) (The development of white belt indicated by a dashed arrow, and the observable moving crack-tip is indicated by a solid arrow in the images.)
ZOC
ZOI
5 mm 0 s 8 s
24 s
24 s
24 s 32 s
64 s 56 s 48 s 40 s
(b) (c)
(a)

Thesis Summary – Q.B. Zhang
13
Figure 14 Force equilibrium check of the typical NSCB test (No. FM-SCB8)
The first image (0 s) was chosen as the reference image and a size of zone-of-interest (ZOI) of 15095 pixels was
selected for correlation calculation. The vertical strain fields were shown in Figure 15.
X (mm)
Y (
mm
)
0 2 4 6 8 10 12 14 16
0
2
4
6
8
10
-0.02
0
0.02
0.04
0.06
0.08
0.1
0.12
Strain
X (mm)
Y (
mm
)
0 2 4 6 8 10 12 14 16
0
2
4
6
8
10
-0.02
0
0.02
0.04
0.06
0.08
0.1
0.12
0.14Strain
X (mm)
Y (
mm
)
0 2 4 6 8 10 12 14 16
0
2
4
6
8
10
-0.02
0.0
0.02
0.04
0.06
0.08
0.10
0.12
0.14
Strain
X (mm)
Y (
mm
)
0 2 4 6 8 10 12 14 16
0
2
4
6
8
10
-0.02
0
0.04
0.08
0.12
0.16
0.2Strain
Figure 15 Dynamic vertical strain fields of the typical NSCB test (No. FM-SCB8) at different stages
The dynamic crack initiation toughness was approximately 1.65 mGPa at the loading rate of 45 /smGPa , as shown
in Figure 16. However, all SIF data to the right of the vertical becomes a function of the moving crack’s speed. This
process is typically identified in the literature as dynamic crack propagation toughness that is outside the scope of this
chapter. It can be seen from Figure 17 that the normalized dynamic crack initiation toughness increased almost linear-
ly with increasing loading rates ranging from 35 to 115 /smGPa .
40 s 48 s
56 s 64 s
(a) (b)
Thesis Summary – Q.B. Zhang
14
Figure 16 Evolution of dynamic SIF and determination of dynIK and loading rate of the typical NSCB test
Figure 17 Normalized dynamic crack initiation toughness as a function of loading rate
4.6 Tensile Behaviour
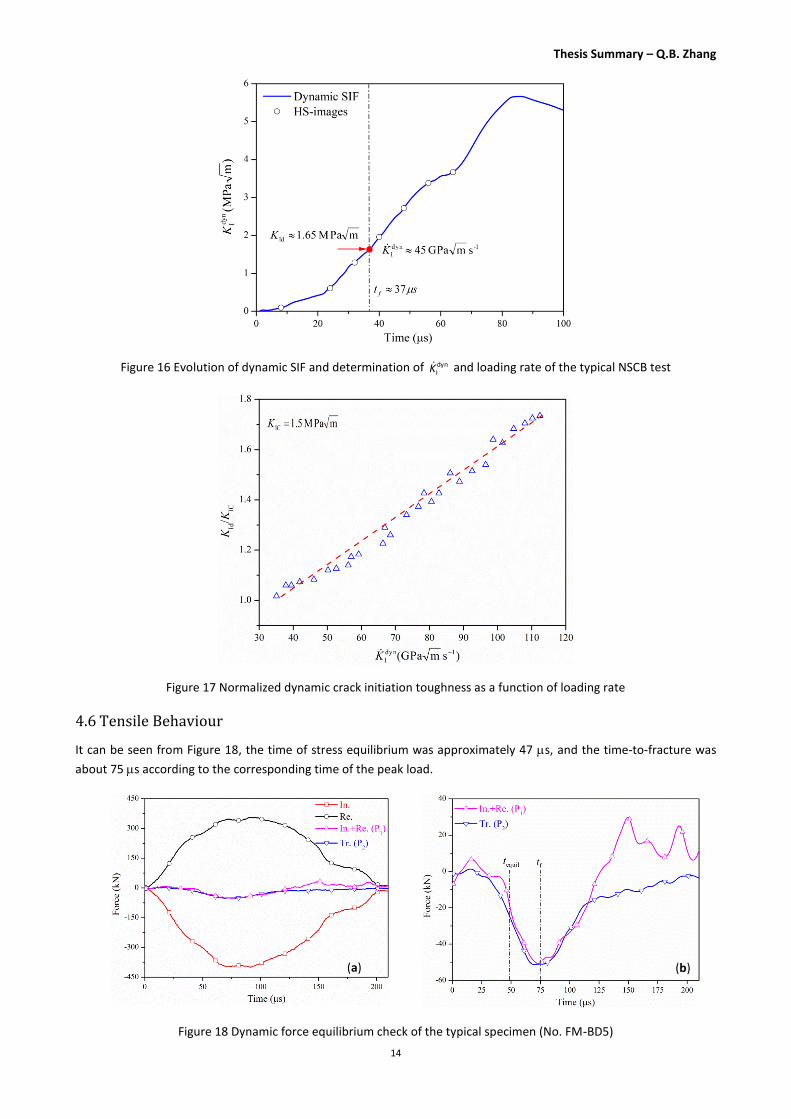
It can be seen from Figure 18, the time of stress equilibrium was approximately 47 s, and the time-to-fracture was
about 75 s according to the corresponding time of the peak load.
Figure 18 Dynamic force equilibrium check of the typical specimen (No. FM-BD5)
(b) (a)
Thesis Summary – Q.B. Zhang
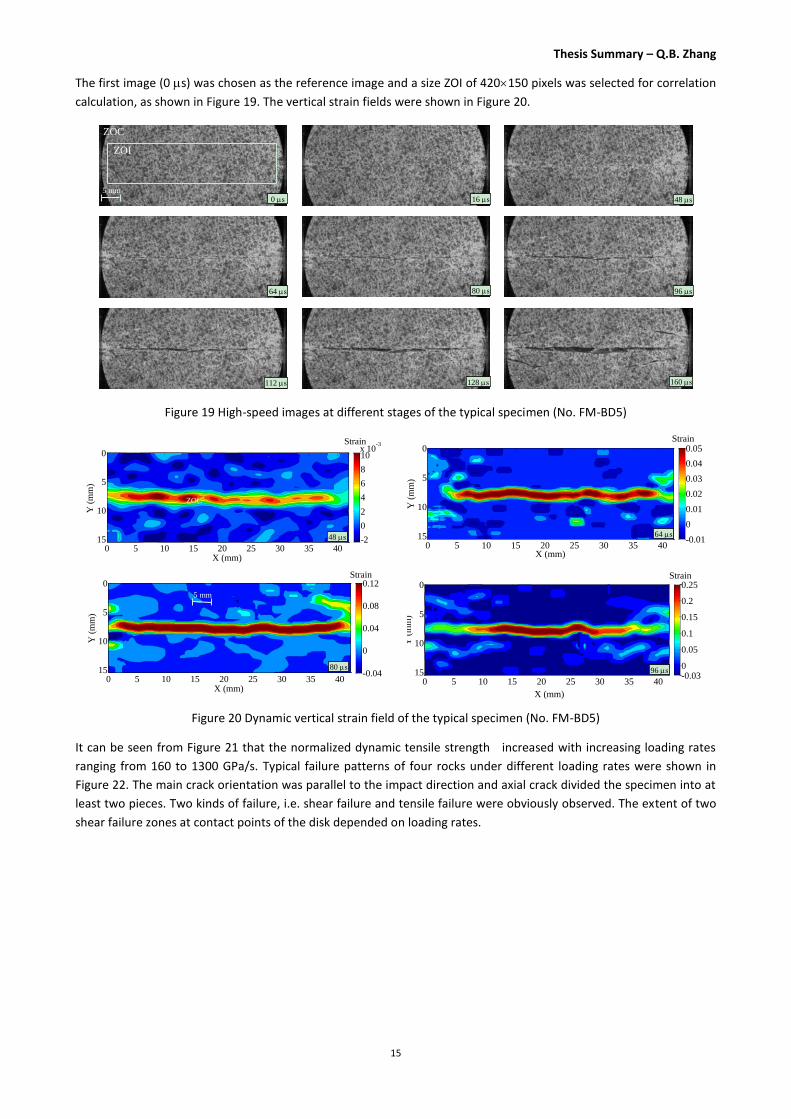
15
The first image (0 s) was chosen as the reference image and a size ZOI of 420150 pixels was selected for correlation
calculation, as shown in Figure 19. The vertical strain fields were shown in Figure 20.
Figure 19 High-speed images at different stages of the typical specimen (No. FM-BD5)
X (mm)
Y (
mm
)
0 5 10 15 20 25 30 35 40
0
5
10
15 -2
0
2
4
6
8
10x 10
-3Strain
X (mm)
Y (
mm
)
0 5 10 15 20 25 30 35 40
0
5
10
15 -0.01
0
0.01
0.02
0.03
0.04
0.05Strain
X (mm)
Y (
mm
)
0 5 10 15 20 25 30 35 40
0
5
10
15 -0.04
0
0.04
0.08
0.12Strain
X (mm)
Y (
mm
)
0 5 10 15 20 25 30 35 40
0
5
10
15 -0.030
0.05
0.1
0.15
0.2
0.25Strain
Figure 20 Dynamic vertical strain field of the typical specimen (No. FM-BD5)
It can be seen from Figure 21 that the normalized dynamic tensile strength increased with increasing loading rates
ranging from 160 to 1300 GPa/s. Typical failure patterns of four rocks under different loading rates were shown in
Figure 22. The main crack orientation was parallel to the impact direction and axial crack divided the specimen into at
least two pieces. Two kinds of failure, i.e. shear failure and tensile failure were obviously observed. The extent of two
shear failure zones at contact points of the disk depended on loading rates.
48 s 64 s
80 s 96 s
5 mm
5 mm 0 s 16 s 48 s
64 s 80 s 96 s
112 s 128 s 160 s
ZOC
ZOC
ZOI

Thesis Summary – Q.B. Zhang
16
Figure 21 Normalized dynamic tensile strength of four rock types as a function of loading rate
I II III IV
Figure 22 Failure patterns of Brazilian disc specimens of: (a) sandstone at loading rate of 225, 385, 620, and 786 GPa/s, (b) gabbro at loading rate of 345, 580, 842 and 1130 GPa/s, (c) coarse-grained marble at loading rate of 168, 238, 365,
and 582 GPa/s, (d) fine-grained marble at loading rate of 260, 556, 830, and 1150 GPa/s,
(a1) (a2) (a3) (a3)
(d1) (d2) (d3) (d4)
(c1) (c2) (c3) (c4)
(b1) (b2) (b3) (b4)

Thesis Summary – Q.B. Zhang
17
4.7 Uniaxial Compressive Behaviour
The first image was chosen as the reference image and a ZOI size of 18585 pixels was selected for correlation calcula-
tion in Figure 23. The horizontal strain fields were shown in Figure 24.
Figure 23 High-speed images of the typical UC test at different stages (No. FM-UC6)
X (mm)
Y (
mm
)
0 5 10 15 20 25 30 35 40
0
5
10
15
-2
-1
0
1
2
3
x 10-3
Strain
X (mm)
Y (
mm
)
0 5 10 15 20 25 30 35 40
0
5
10
15-2
-1
0
1
2
x 10-3Strain
X (mm)
Y (
mm
)
0 5 10 15 20 25 30 35 40
0
5
10
15
-5
0
5
x 10-3Strain
X (mm)
Y (
mm
)
0 5 10 15 20 25 30 35 40
0
5
10
15
-10
-5
0
5
x 10-3
Strain
Figure 24 Dynamic horizontal strain fields of the UC test (No. FM-UC6)
The comparison of the local strains obtained using the DIC technique and the average measure of strain obtained
using the 1-wave analysis method was performed. Figure 25 shows the effect of strain rate on the stress-strain curves
of rock materials, i.e. the increase in compressive strength and critical strain at the maximum stress increased with
48 s 64 s
80 s 96 s
0 s
ZOC
ZOI
10 mm 16 s 48 s
64 s 80 s 96 s
112 s 128 s 144 s

Thesis Summary – Q.B. Zhang
18
increasing strain rate, but the initial tangent modulus of rocks was not affected by strain rate. It should be noted that
the slope remains linear up to higher stress level under a higher strain rate.
Figure 25 Dynamic stress-strain curves of typical UC tests (No. UC2, 4, 6 and 8)
4.8 Triaxial Compressive Behaviour
Figure 26 shows the traces of hoop strain and axial strain measured from the middle strain gauges SG2 and SG4, re-
spectively, on different thickness of the sleeves at the striking velocity of about 25 m/s. Confining pressures of the
sleeves calculated are 12.21, 16.97, 8.60, and 8.03 MPa, respectively.
Figure 26 (a) Hoop strain (SG2) and (b) axial strain (SG4) measured from the middle strain gauges on different thick-ness of the sleeves at the striking velocity of about 25 m/s
Dynamic stress-strain curves were obtained by the one-wave analysis method, as shown in Figure 27. The confining
pressure of the brittle-ductile transition seems to be about 8.60 MPa. Compared with the results for uniaxial compres-
sive strength, a significant strength enhancement is observed. It can be seen that the Young’s modulus is unaffected
by the strain rate with increasing strain rate and confining pressure

Thesis Summary – Q.B. Zhang
19
Figure 27 Dynamic stress-strain curves under different confining pressures at impact velocity of 25 m/s
4.9 Summary
This section presented a detailed experimental procedure to determine dynamic crack initiation toughness, tensile
strength, uniaxial compressive strength, and triaxial compressive strength in the SHPB system. The DIC technique in
conjunction with high-speed photography was used to measure full-field strain fields of specimens. The proposed
procedure allows the cost-effective, non-contact, full-field strain measurements of specimens in dynamic testing
methods.

Thesis Summary – Q.B. Zhang
20
5 Effect of Loading Rate on Fracture Behaviour: Phenomena and Mechanisms
5.1 Experimental Procedures
The quasi-static tests were performed using a servo-hydraulic machine at the loading rate of 0.002 mm/s (Figure 28a-
b). The dynamic fracture tests were carried out by means of a SHPB system. Figure 28(c) shows the photograph of
loading configurations and a NSCB specimen with random speckle patterns on the surface that was applied to ensure
good contrast of the images for the calculation of strain fields.
Figure 28 Experimental techniques: (a) photos NSCB specimen in the servo-hydraulic machine and high-speed photog-raphy system, (b) magnified view of (a), (c) close-up view of the partial SHPB bars and a specimen with random speck-
le patterns (ZOI-Zone of interest, ZOC-Zone of camera)
5.2 Dynamic Fracture Behaviour
The dynamic crack initiation toughness IdK is the critical dynamic SIF at the time to fracture ft , and the dynamic crack
growth toughness IDK is the critical SIF at a specific crack speed v , which are given by the following equations (Ravi-
Chandar 2004)
)()( fdynI
dynIId tKKK at ftt Eq. 1
),();( dynI
dynIID vtKKvK for ftt Eq. 2
where the dynamic loading rate is generally expressed as fIddynI tKK .
(b) (a)
(c)
Thesis Summary – Q.B. Zhang
21
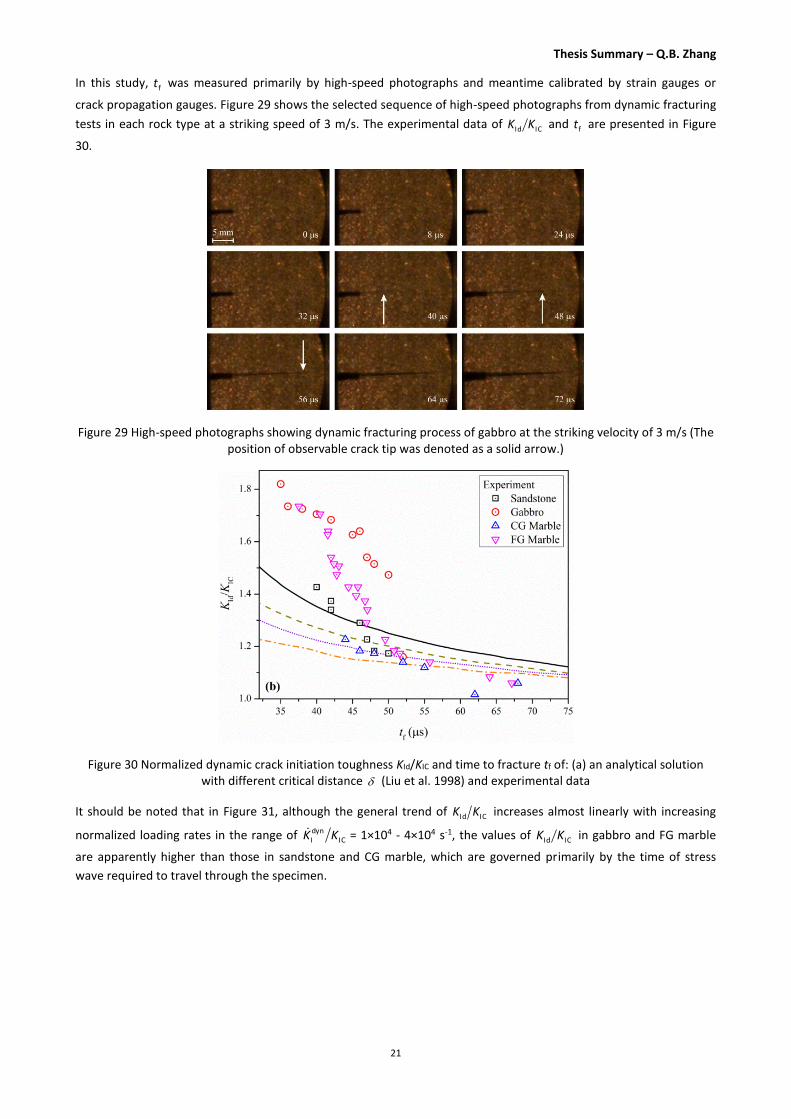
In this study, ft was measured primarily by high-speed photographs and meantime calibrated by strain gauges or
crack propagation gauges. Figure 29 shows the selected sequence of high-speed photographs from dynamic fracturing
tests in each rock type at a striking speed of 3 m/s. The experimental data of ICId KK and ft are presented in Figure
30.
Figure 29 High-speed photographs showing dynamic fracturing process of gabbro at the striking velocity of 3 m/s (The position of observable crack tip was denoted as a solid arrow.)
Figure 30 Normalized dynamic crack initiation toughness KId/KIC and time to fracture tf of: (a) an analytical solution with different critical distance (Liu et al. 1998) and experimental data
It should be noted that in Figure 31, although the general trend of ICId KK increases almost linearly with increasing
normalized loading rates in the range of ICdynI KK = 1×10⁴ - 4×10⁴ s-1, the values of ICId KK in gabbro and FG marble
are apparently higher than those in sandstone and CG marble, which are governed primarily by the time of stress
wave required to travel through the specimen.

Thesis Summary – Q.B. Zhang
22
Figure 31 Normalized dynamic crack initiation toughness KId/KIC as a function of IC
dynI KK for selected rock materials
Figure 32(b) showed the 3D profiles of the position of crack tip and the crack opening displacement (COD) associated
with the loading time for the typical dynamic test.
0246810121416
0 2 4 6 8 10
-1
0
1
Y (mm)X (mm)
CO
D (
mm
)
40 us 0246810
121416
0 2 4 6 8 10
-1
0
1
Y (mm)X (mm)
CO
D (
mm
)
48 us
0246810121416
0 2 4 6 8 10
-1
0
1
Y (mm)X (mm)
CO
D (
mm
)
56 us
Crack tip position
0246810
121416
0 2 4 6 8 10
-1
0
1
Y (mm)X (mm)
CO
D (
mm
)
COD
64 us
Figure 32 A typical NSCB test at a striking velocity of 4.8 m/s: (a) HS-images at different stages, (b) the crack tip posi-tion and crack opening displacement
As shown in Figure 33(a), at the initial stage, Tv shows a decreasing trend, but increases with the increase of time.
Figure 33(b) shows the dynamic fracture energy approaches to a low level when the crack speed v is small and in-
creases rapidly with the increase of v , which reveals that rock materials have the property of the crack speed-
toughening. A semi-empirical rate-dependent model is proposed for the simulation of crack propagation in rock mate-
rials using RC . The relationship between )(dC vG and v plotted in Figure 5:15(e) is fitted by a two-parameter expres-
sion.
(b)

Thesis Summary – Q.B. Zhang
23
Figure 33 (a) Translational and angular velocity of the flying fragments, (b) dynamic fracture energy as a function of crack speed
Figure 34 shows the normalized ICID KK increases with the increase of RCv . It is interesting to note that the rate-
sensitivity of growth toughness is more evident than that of initiation toughness.
Figure 34 Normalized dynamic crack growth toughness KID/KIC as a function of normalized crack speed v/CR
5.3 Characterizations of Failure Mechanisms
Under quasi-static loads, there are the predominant IG microcracks with some TG contribution in FG marble (see Fig-
ure 35a-c). At the high loading rate, cleavage and noticeably rugged surfaces with a high degree of TG microcracks
occurs more easily, as shown in Figure 35(d-f).
The cleavage planes perpendicular to the tensile stress have a pure normal stress across them, and others have a
combination of tensile and shear stresses acting on the cleavage plane. Cracking parallel to the cleavage plane is ac-
complished by the lowest energy dissipation, but it requires substantially more energy as the angle increases, as
shown in Figure 36.
(a) (b)

Thesis Summary – Q.B. Zhang
24
Figure 35 SEM micrographs at increasing magnification of: (a-c) quasi-static fracture, (d-f) dynamic fracture in fine-
grained marble (Micrographs were captured at a distance of 10 mm from the notch tip.
Figure 36 Cleavages, (a) parallel to, (b) perpendicular to the cleavage plane in sandstone, (c) parallel to, (d) perpendic-ular to the cleavage plane in gabbro, (e) parallel to, (f) perpendicular to the cleavage plane in coarse-grained marble,
(g) parallel to, (h) perpendicular to the cleavage plane in fine-grained marble

Thesis Summary – Q.B. Zhang
25
To further study the effect of loading rate on the surfaces roughness, micromeasurements were conducted using a 3D
laser profilometry with a resolution of 7 m. Figure 37 illustrated typical 3D profiles of the fractured surfaces.
Figure 37 3D fracture surface profiles and wireframes of: (a) a typical quasi-static specimen, (b) a dynamic specimen at crack velocity of 675 m/s (The arrow indicates the direction of crack propagation.)
5.4 Summary
Notched semi-circular bending tests were performed to study quasi-static and dynamic fracture behaviour of four
well-studied rock types. On-specimen strain gauges and high-speed photography were used to determine dynamic
fracture parameters at the macroscopic scale. The fracture surfaces were qualitatively and quantitatively investigated
by conducting fractographic examination and roughness measurements.
(a)
(b)

Thesis Summary – Q.B. Zhang
26
6 A Micromechanical Model for Quasi-static and Dynamic Fracture
6.1 A Micromechanical Model for Determining IG/TG Fracture
When a mode I crack propagates in an elastic solid and reaches an interface, one of the following situations may oc-
cur: (a) the crack penetrates the interface and continues to propagate along its original path, i.e. crack penetration; (b)
it kinks out to propagate along the interface and becomes a mixed-mode crack, which is often called ‘crack
kinking/deflection’. In selected rock materials, the primary minerals, quartz and dolomite, are belong to the hexagonal
crystal system (see Figure 38a). The interface can be regarded as grain boundary in the polycrystalline materials, and
therefore crack kinking/deflection and crack penetration are treated as intergranular (IG) fracture and transgranular
(TG) fracture, as shown in Figure 38(b). The angle between the crack plane and the grain boundary is defined as the
interfacial angle, .
Figure 38 Establishment of a micromechanical model: (a) Hexagonal crystal system of the dolomite in the marble, (b) schematic diagram showing the microscopic model of intergranular and transgranular fractures, (c) formation of sec-ondary microcracks nearly parallel to the twinning, TGp, (d) formation of secondary microcracks almost normal to the
twinning, TGn
The energy release rate can be obtained for various crack geometries and loading conditions, which can be expressed
in terms of stress intensity factors (SIFs) IK (Anderson 2005). Therefore, the ratio of energy release rates TG
s
IG
s GG is
given by
])2
3sin
2(sin)
2
3cos
2cos3[(
16
1)( 22
TGs
IGs
G
G Eq. 3
The IG fracture occurs at the interface when IGsG exceeds the fracture toughness of the interface (grain boundary),
ITICK ; or the TG fracture occurs when TG
sG reaches the fracture toughness of the grain, GICK .
For a mixed-mode crack subjected to remote dynamic stress, in analogy with the quasi-static crack problems, the
dynamic energy release rate, dG , can be related to the dynamic SIFs without considering the antiplane shear mode.
The ratio of two energy release rates TG
d
IG
d GG is given by

Thesis Summary – Q.B. Zhang
27
)()(
)sin)(sin()()coscos)(()(
)(
),(
II
IIIIII
TG
d
IG
d
12
1
22
22
22
22
1
2
162
3
22
3
23
vkvA
vkvAvkvA
vG
vG
)(16
)2
3sin
2)(sin()
2
3cos
2cos3)((
))(
)()(
1
1()(
12Id1
22
2IIs2
22
2Id2
2
1
2
12
1
2
vk
vkvk
vR
vR
v
v
v
v
Eq. 4
The IG fracture kinks at the grain boundary when IGdG reaches the dynamic crack growth toughness of the interface,
)( 2ITID vK ; or the TG fracture occurs when TG
dG reaches the dynamic crack growth toughness of the grain, )( 1GID vK .
6.2 Micro-measurement Results
It is observed from a typical fracture surface under quasi-static loads that IG fracture was the principal mode (see
Figure 39a), whereas TG fracture is rarely appeared. Figure 39(b) showed a typical fracture surface of the specimens
under dynamic loads at a striking speed 2.8 m/s ( 675v m/s). TG fracture was the major cracking form in the fracture
surface, even though there were some IG fractures simultaneously. With the increase of impact speed or loading rate,
TG fracture was becoming the dominant mode and there was little or no IG fracture, as shown in Figure 39(c).
(a) (b) (c)
Figure 39 Typical SEM micrographs of fractured surfaces for the marble specimens
6.3 Validation of Micromechanical Model
When the condition of o65 is satisfied, IG fracture occurs, while TG fracture take place at oo 0965 . Thus, the
ratio of grain-boundary fracture toughness ITICK
to grain fracture toughness G
ICK can be obtained as the value of 0.5. It
can be seen from Figure 40 that the zone of IG fracture covered a larger range of interfacial angles ( o650 ), im-
plying that IG fracture was the dominant mode under quasi-static loads. Since the fracture toughness ratio GIC
ITIC /KK
was 0.5 and the fracture toughness of fine-grained marble ICK was 1.5 mMPa , according to the Eq. 3 and the area
fractions, the values of ITICK and G
ICK were obtained as 1.17 and 2.34 mMPa for the grain boundary and the dolomite
grain, respectively.
Thesis Summary – Q.B. Zhang
28
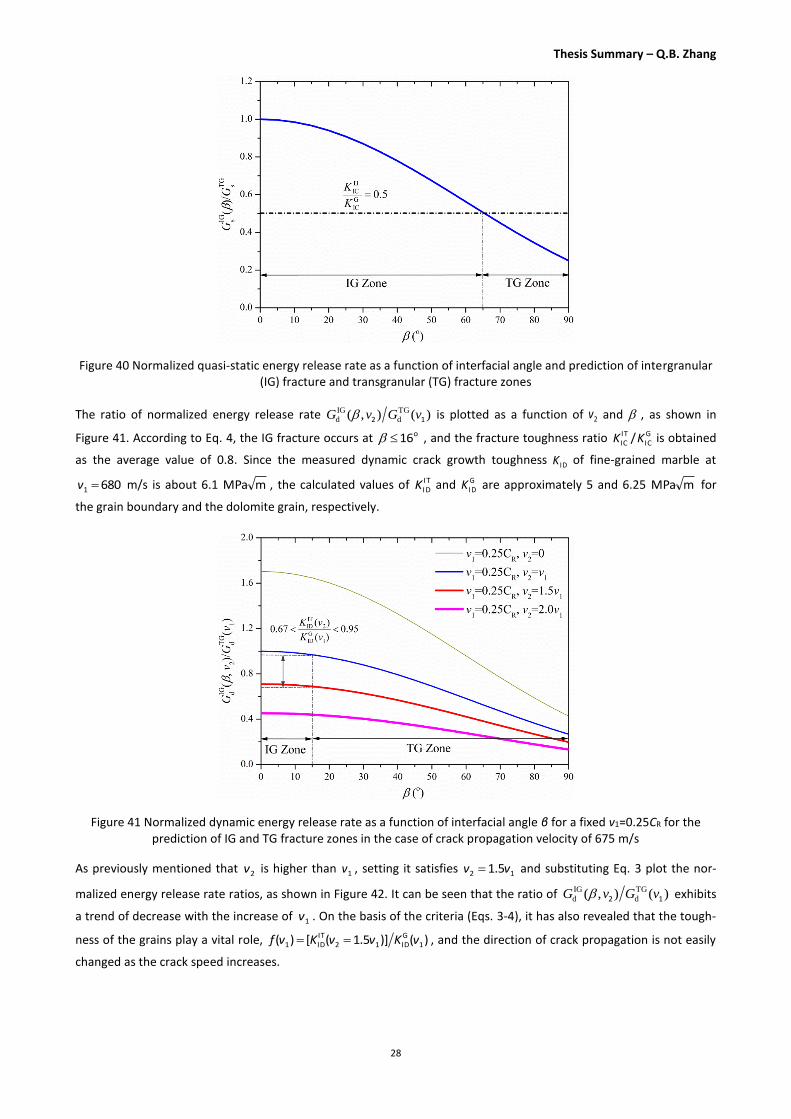
Figure 40 Normalized quasi-static energy release rate as a function of interfacial angle and prediction of intergranular (IG) fracture and transgranular (TG) fracture zones
The ratio of normalized energy release rate )(),( TG
d
IG
d 12 vGvG is plotted as a function of 2v and , as shown in
Figure 41. According to Eq. 4, the IG fracture occurs at o61 , and the fracture toughness ratio GIC
ITIC /KK is obtained
as the average value of 0.8. Since the measured dynamic crack growth toughness IDK of fine-grained marble at
6801 v m/s is about 6.1 mMPa , the calculated values of IT
IDK and GIDK are approximately 5 and 6.25 mMPa for
the grain boundary and the dolomite grain, respectively.
Figure 41 Normalized dynamic energy release rate as a function of interfacial angle β for a fixed v1=0.25CR for the prediction of IG and TG fracture zones in the case of crack propagation velocity of 675 m/s
As previously mentioned that 2v is higher than 1v , setting it satisfies 12 5.1 vv and substituting Eq. 3 plot the nor-
malized energy release rate ratios, as shown in Figure 42. It can be seen that the ratio of )(),( TG
d
IG
d 12 vGvG exhibits
a trend of decrease with the increase of 1v . On the basis of the criteria (Eqs. 3-4), it has also revealed that the tough-
ness of the grains play a vital role, )()]5.1([)( 1GID12
ITID1 vKvvKvf , and the direction of crack propagation is not easily
changed as the crack speed increases.

Thesis Summary – Q.B. Zhang
29
Figure 42 Normalized dynamic energy release rate as a function of interfacial angle at a given relationship of
12 5.1 vv
6.4 Summary
The fracture mechanics based micromechanical mode was proposed not only to explain the transition of failure
modes from intergranular fracture to transgranular fracture, but also to predict the fracture toughness of the grain
and the grain boundary under both quasi-static and dynamic loads. Fracture surfaces were qualitatively and quantita-
tively studied analysed using the SEM and an optical profilometry to identify failure mechanisms. Micro-
measurements revealed that the operating failure mechanism in quasi-static tests was mostly intergranular fracture,
which formed a rougher surface and resulted in a higher fractal dimension value.

Thesis Summary – Q.B. Zhang
30
7 Plate Impact Experiments and Shock Response of Rock Materials
7.1 The Plate Impact Facility
The ultra-high strain rate (UHSR) experiments were performed using the plate impact facility at the Cavendish Labora-
tory, as schematically shown in Figure 43. The facility consists of a projectile body and a target assembly. The barrel
has a bore of 50 mm and a length of 5 m, and a projectile is launched by the gas gun at velocities up to 1,100 m/s.
Figure 44 shows the images of the plate impact facility.
Figure 43 Schematic of the plate impact facility with measurement systems (Not to scale)
Figure 44 Photographs of the plate impact facility at the Cavendish Laboratory: (a) view down the barrel from the breech to the target chamber, (b) a polycarbonate sabot overlaid on the breech showing the mechanism for launch-
ing. (c) Catcher tank and expansion chamber, (d) target chamber
7.2 Measurement Techniques
The embedded manganin stress gauges gives a direct output of the stress in the material of interest. Stress gauges
placed in two distinct planes are used to determine longitudinal and lateral stresses interrogated by the piezoresistive
manganin gauges, respectively, as shown in Figure 45.

Thesis Summary – Q.B. Zhang
31
Figure 45 Manganin gauge experimental configuration. Gauges G2 and G3 record the transverse stress. Gauge G1 records the longitudinal stress at the specimen-back plate interface
In the present study, the photon Doppler velocimetry (PDV) system is used to measure the free surface velocity of the
target, as shown in Figure 46. The systems use Dopplet-shifted light reflected diffusely or specularly to infer velocity
data, and can be used to detect free surface motion or to detect interfacial motion between the desired sample and
an optically transparent window.
Figure 46 Schematic view of the PDV system
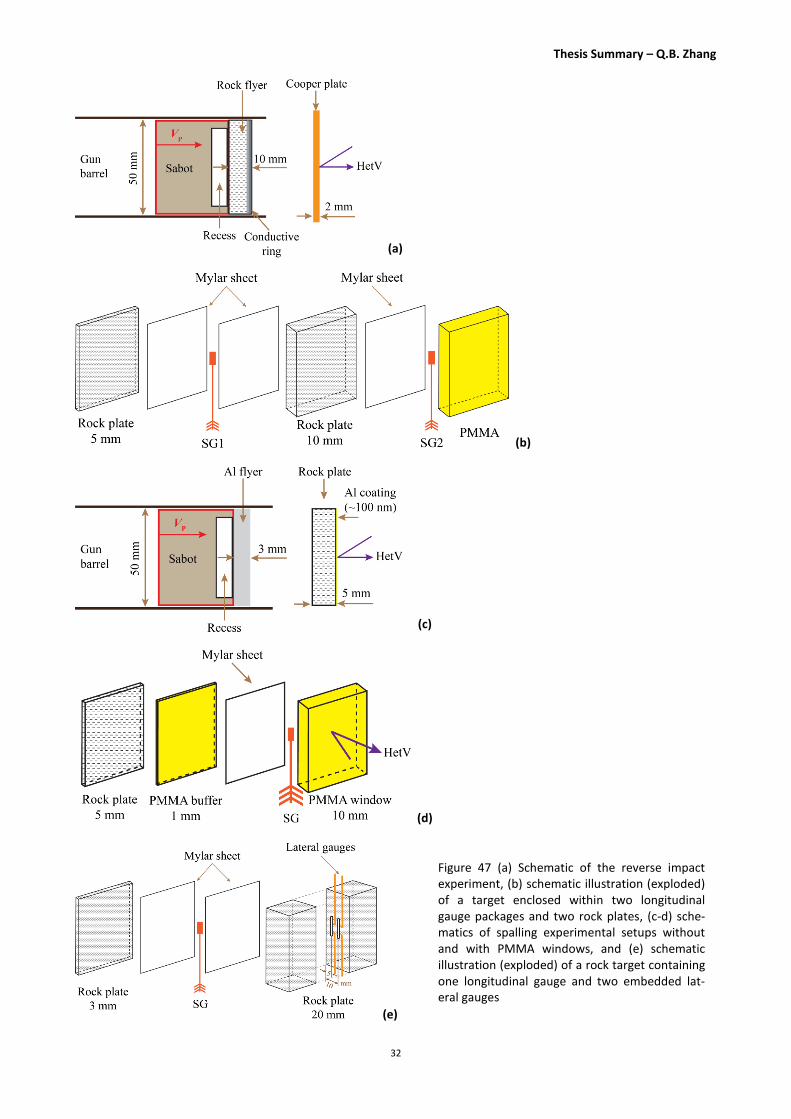
7.3 Testing Methods
Plate impact experiments are conducted to determine Hugoniot curves, spall tensile strength, shear strength and
Hugoniot elastic limit (HEL) of the fine-grained marble and coarse-grained gabbro. Two different types of shock com-
pression tests (i.e., reverse and conventional impact) were performed respectively, as shown in Figure 47(a-b). Two
distinct experimental setups to determine spalling tensile strength are employed, as shown in Figure 47(c-d). Figure
47(e) shows a typical plate impact target where two lateral gauges were embedded.
Thesis Summary – Q.B. Zhang
32
(a)
(b)
(c)
(d)
(e)
Figure 47 (a) Schematic of the reverse impact experiment, (b) schematic illustration (exploded) of a target enclosed within two longitudinal gauge packages and two rock plates, (c-d) sche-matics of spalling experimental setups without and with PMMA windows, and (e) schematic illustration (exploded) of a rock target containing one longitudinal gauge and two embedded lat-eral gauges

Thesis Summary – Q.B. Zhang
33
7.4 Experimental Results and Discussion
The Hugoniot data derived from the gauge and HetV records are shown in Figure 48. It can be seen that the Hugoniot
in pace of the longitudinal stress and particle velocity are well-fitted by a linear fit for gabbro px 30.17 u , and by a
second order polynomial fit for marble, 2px 92.7511.7 puu , respectively.
Figure 48 Measured Hugoniot states in stress particle velocity space for: (a) marble, (b) gabbro
It is possible therefore to plot this against the gradients of straight line fits to Hugoniot data, as shown in Figures 49-
50.
0 5 10 15 20 25
0
5
10
15
20
25
2.5<0 <3.0 g/cm
3
0 <2.5 g/cm
3
Igneous rocks
Braithwaite, Amphibolite
Baslaugh,1985, San Marcos Gabbr
Millett Gabbro
Marsh Virginia Diabase
Marsh Maryland Diabase
Tsembelis Dolerite
Marsh Granite
Shang Granite
Millett Granite
Larson, 1980, Water Westerly Gra
Larson Dry Westerly Granite
Braithwaite, Kimberlite
Nakazawa 1997, Basalt
Braithwaite, Basalt
Larson, 1977, Dry Mt.Helen Tuff
Larson, 1977, Water Mt.Helen Tuf
Davies, 1994, Tuff
Butcher,1975, Coal
Metamorphic rocks
Davies, Slate
Braithwaite, Quartz/feldspathic Gneiss
Braithwaite, Amphibolitic Gneiss
Braithwaite, Biotite Schist
Davies, Phyllite
Sedimentary rocks
Braithwaite, Siltstone
Furnish Limestone
Davies, 1994, UTTR Limestone
Larson, Indiana Water Limestone
Larson, Nugget Sandstone
Taylor, 2006, Yorkshire Sandstone
ZS =Z
E
Hugonio
t S
lope P
/up [G
Pa k
m-1 s
]
Elastic Impedance ZE [g cm
-3 km s
-1]
ZS =Z
E+4
ZS =Z
E-4
Figure 49 Plot of impedance, ZE, against Hugoniot, ZS, slope for various literature data
0.0 0.2 0.4 0.6 0.8 1.0
0
3
6
9
12
15
Dennen,1970,Granite, 2.67 g/cm3, 16.28
van Thiel,1977,Granite, 2.67 g/cm3, 14.47
Larson, 1980, Dry Westerly Grani, 2.65, 14.35
Larson, 1980, Water Westerly Grani, 2.69, 15.18
Furnish, 1995, Granite, 2.56, 13.14
Millett, 2000, Granite, 2.65, 13.67
Shang, 2000, Granite, 2.67, 18.18
Baslaugh,1985, Gabbr, 2.9, 18.87
Nakazawa 1997, Basalt, 2.69, 13.74
Millett, 2000, Gabbro, 2.88, 17.82
Tsembelis, 2002, Dolerite, 2.65, 17.29
Igneous rocks
P=15.42up
95% Prediction band
P (
GP
a)
up (km/s)
0.0 0.2 0.4 0.6 0.8 1.0
0
4
8
12
16
P=15up (Foliated)
95% Prediction band
Foliated metamorphic rocks
Davies, 1994-5, Thawed Phyllite, 2.79, 15.32
Davies, 1994-5, Refrozen Phyllite, 2.79, 15.04
Davies, 1994-5, Preserved Phyllite, 2.81, 15.37
Furnish, 1995, Phyllite, 2.56
Davies, 1995, Y Maine Slate, 2.772, 14.69
Davies, 1994-5, Y Penn Slate, 2.744, 14.42
Davies, 1994-5, Z Penn Slate, 2.736, 14.41
Furnish, 1995, Slate, 2.74, 15.12
Non-foliated metamorphic rocks
Lombard, 1961, Marble, 2.84
Furnish, 1994, Danby Marble, 2.695, 12.75
Braithwaite, 2006, Amphibolite, 3.0, 20.79
Metamorphic rocks
P (
GP
a)
up (km/s)
Figure 50 Equation of state (EOS) of (a) igneous rocks and (b) metamorphic rocks

Thesis Summary – Q.B. Zhang
34
7.5 Summary
Plate impact experiments are conducted to determine Hugoniot curves, spall tensile strength, shear strength and
Hugoniot elastic limit of the marble and gabbro. Manganin stress gauges and a laser interferometer HetV system are
used for the measurement of stress and shock particle velocity, respectively. The Hugoniots of two rocks were able to
be described by a linear relationship in pressure particle-velocity space, which were also similar with the theoretical
elastic behaviour calculated from the elastic impedance. Attempts were made to investigate the dynamic tensile
properties. Lateral stresses were measured using embedded lateral gauges. The shear strength has been calculated
during plate impact in the axial stress range 3-12 GPa, and is shown to increase significantly with shock stress.

Thesis Summary – Q.B. Zhang
35
8. Principal Findings and Conclusions
8.1 A Critical Review of Dynamic Experimental Techniques and Mechanical Behaviour
The loading techniques commonly used for intermediate strain rate testing of rock materials are pneumatic-hydraulic,
completely gas-driven, and drop-weight machines. At high strain rate, the split Hopkinson bar has been widely used,
and major developments of this technique for rock materials are summarized in detail. The plate impact techniques
have been successfully employed to determine shock properties at the ultra-high strain rate.
In terms of measurement techniques, a detailed description is made to present the principles and applications of the
most frequently used optical methods, including photoelastic coating, moiré, caustic, holographic interferometry,
digital image correlation, and infrared thermography. The testing methods to obtain dynamic strength and fracture
roughness as well as other parameters are primarily extended or modified from quasi-static methods.
Dynamic uniaxial and triaxial compressive, tensile and shear strength and fracture toughness are obtained by quanti-
tative assessment of corresponding testing methods, and the influencing factors and failure patterns are also dis-
cussed. Dynamic mechanical properties and fracture behaviour change with the loading rate; in particular, the re-
sponses distinguishably change after the strain/loading rate exceeds a critical value.
The effects of some influencing environmental factors and intrinsic rock factors are presented. Several popular semi-
empirical rate-dependent equations are put forward for predicting dynamic strength. On the basis of experimental
data and the physical mechanisms of strain-rate effect, phenomenological and physically based rate-dependent con-
stitutive models for modelling mechanical behaviour over a wide range of loading rates. The energy- and stress- based
dynamic fracture criteria are summarized, among which the dynamic Mohr-Coulomb and stress intensity factor based
criteria have been widely used for rock-like materials.
8.2 Quantitative Determination of Dynamic Mechanical Properties
Four types of testing methods, namely notched semi-circular bending, Brazilian disc, uniaxial compression, and passive
confining pressure tests are conducted using a modified SHPB technique. Detailed experimental procedures and cali-
brations are presented to determine dynamic Mode-I crack initiation and propagation toughness, tensile strength,
uniaxial compressive strength, and triaxial compressive strength. Moreover, the DIC technique in conjunction with
high-speed photography is developed to record fracturing process and to measure full-field deformation fields. Hu-
goniot elastic limit, spall tensile strength and shear strength of rock materials under shock loading are obtained using
Cambridge plate impact technique. Longitudinal and lateral stresses are measured by manganin gauges embedded in
specimens. A HetV system is applied to measure the rear surface velocity. The methods used to make measurements
are, to great extent, standard experimental procedures when determining dynamic mechanical properties.
8.3 High-speed Optical Measurement Techniques
The DIC in conjunction with high-speed photography is developed for the measurement of dynamic displace-
ment/strain fields. A close match between strain gauges and DIC measurements has shown that the HS-DIC technique
can reliably be used to measure full-field surface characteristics under dynamic loads. Especially, the DIC technique
continues strain measurements after failure of on-specimen contact measurement techniques. A HetV system is suc-
cessfully used for measuring free surface velocities of inhomogeneous rock-like materials.
8.4 Micromeasurement and Micromechanical Modelling of Failure Mechanisms
The SEM fractographic studies reveal that the operating failure mechanisms under dynamic loads are mostly of trans-
granular microcracks. With the increase of loading rate, the number of some typical microcrack modes, such as multi-
ple cleavage steps, opening microcracks and microbranches, is increased rapidly. The increases of surface areas gen-
erated by these typical modes are responsible for large energy dissipation, while it cannot be identified well by the
surface roughness measurements.

Thesis Summary – Q.B. Zhang
36
The 3D surface roughness measurements show that the fractal dimension of rock material is dependent primarily on
microcrack modes. The effect of loading rate on the fractal dimension is unapparent in sandstone, perhaps due to the
complicated cement fracture and surface pits.
Based on quasi-static and elasto-dynamic fracture mechanics and macroscopic experimental results, a micromechani-
cal mode is proposed not only to explain the failure transitions from intergranular fracture to transgranular fracture,
but also to predict the fracture toughness of the grain and the grain boundary under both quasi-static and dynamic
loads.

Thesis Summary – Q.B. Zhang
37
9. Selected References
1) Ben-Dor G, Dubinsky A, Elperin T (2005) Ballistic impact: recent advances in analytical modeling of plate pene-
tration dynamics--A review. Appl Mech Rev 58 (6):355-371.
2) Bischoff P, Perry S (1991) Compressive behaviour of concrete at high strain rates. Mater Struct 24 (6):425-450.
3) Bonamy D, Bouchaud E (2011) Failure of heterogeneous materials: A dynamic phase transition? Phys Rep 498
(1):1-44.
4) Cox BN, Gao H, Gross D, Rittel D (2005) Modern topics and challenges in dynamic fracture. J Mech Phys Solids 53
(3):565-596.
5) Davison L, Graham RA (1979) Shock compression of solids. Phys Rep 55 (4):255-379.
6) Field JE, Walley SM, Proud WG, Goldrein HT, Siviour CR (2004) Review of experimental techniques for high rate
deformation and shock studies. Int J Impact Eng 30 (7):725-775.
7) Fineberg J, Marder M (1999) Instability in dynamic fracture. Phys Rep 313 (1-2):1-108.
8) Gama BA, Lopatnikov SL, Gillespie JW (2004) Hopkinson bar experimental technique: A critical review. Appl
Mech Rev 57 (4):223-250.
9) Grady DE (1998) Shock-wave compression of brittle solids. Mech Mater 29 (3-4):181-203.
10) Grady DE (2010) Length scales and size distributions in dynamic fragmentation. Int J Frac 163 (1):85-99.
11) Gray III GT (2012) High-strain-rate deformation: Mechanical behavior and deformation substructures induced.
Annu Rev Mater Res 42 (1):285-303.
12) Goldsmith W (1999) Non-ideal projectile impact on targets. Int J Impact Eng 22 (2-3):95-395.
13) Heuzé FE (1990) An overview of projectile penetration into geological materials, with emphasis on rocks. Int J
Rock Mech Min Sci Geomech Abstr 27 (1):1-14.
14) Jiang F, Vecchio KS (2009) Hopkinson bar loaded fracture experimental technique: A critical review of dynamic
fracture toughness tests. Appl Mech Rev 62 (6):060802-060839.
15) Ramesh KT (2008) High rates and impact experiments. In: Sharpe WN (ed) Springer Handbook of Experimental
Solid Mechanics. Springer US, pp 929-960.
16) Saharan MR, Mitri HS, Jethwa JL (2006) Rock fracturing by explosive energy: Review of state-of-the-art. Frag-
blast 10 (1):6 -81.
17) Zhang QB, Zhao J (2014) A review of dynamic experimental techniques and mechanical behaviour of rock mate-
rials. Rock Mech Rock Eng: 47(4):1411-1478.


![[Owen] Mechanical Behaviour of the.](https://static.fdocuments.net/doc/165x107/577cd7161a28ab9e789e04ab/owen-mechanical-behaviour-of-the.jpg)