Thesis Hilton9 1 - University of Surreyepubs.surrey.ac.uk/770249/1/556469.pdf · 6.3.3 Comparisons...
209
FI NIT E ELEMENT - BASED STRENGTH PREDICTION FOR NOTCHED AND MECHANICALLY FASTENED WO VEN FABRIC COMPOSITES By HILTON AHMAD - Submitted for the degree of Doctor of Philosophy DIVISON OF MECHANICAL, MEDICAL AND AEROSPACE ENGINEERING, FACULTY OF ENGINEERING AND PHYSICAL SCIENCES, UNIVERSITY OF SURREY, GUILDFORD, UNITED KINGDOM MARCH 2012
Transcript of Thesis Hilton9 1 - University of Surreyepubs.surrey.ac.uk/770249/1/556469.pdf · 6.3.3 Comparisons...

FINITE ELEMENT-BASED STRENGTH PREDICTION FOR NOTCHED AND MECHANICALLY FASTENED WOVEN FABRIC COMPOSITES
By
HILTON AHMAD -
Submitted for the degree of Doctor of Philosophy
DIVISON OF MECHANICAL, MEDICAL AND AEROSPACE ENGINEERING, FACULTY OF ENGINEERING AND PHYSICAL SCIENCES,
UNIVERSITY OF SURREY, GUILDFORD,
UNITED KINGDOM
MARCH 2012

P a g e | i
PREFACE
This thesis and the work to which it refers are the results of my own efforts. Any ideas, data,
images or text resulting from the work of others (whether published or unpublished) are fully
identified as such within the work and attributed to their originator in the text, bibliography or in
footnotes. This thesis has not been submitted in whole or in part for any other academic degree
or professional qualification. I agree that the University has the right to submit my work to the
plagiarism detection service TurnitinUK for originality checks. Whether or not drafts have been
so-assessed, the University reserves the right to require an electronic version of the final
document (as submitted) for assessment as above.

P a g e | ii
ABSTRACT
A literature review has been carried out relating to the damage and fracture behaviour of
composite laminates based on woven fabric reinforcement containing a stress raiser in the form
of either a circular hole or of a mechanically fastened joint – the tensile failure modes in these
two types of problem are very similar. Closed form and finite element based approaches that
enable the stress distributions in these two classes of problem are presented prior to a review of
some of the existing failure models. The failure models considered are based on strength and
fracture mechanics approaches, which are applied in some cases at the laminate level and in
others on a ply-by-ply basis. A number of these approaches invoke the use of a characteristic
distance, which is a material property, but may also be specimen geometry dependent.
The aim of the present work is to develop a more unified model for damage and fracture at
tensile stress concentrations within a finite element analysis. To this end a traction-separation
law (based on physically meaningful material parameters) is implemented within ABAQUS
CAE and used to predict the strength of woven composite plates containing open holes and
mechanically fastened joints.
This approach is applied first to the open hole problem within a two-dimensional framework,
with reference to several data sets from the literature. Agreement is good, both with prior
experimental data and other modelling approaches. The bolted joint problem is then considered
and a two dimensional approach is applied to model net-tension failure data for woven GFRP
bolted joints from the literature, using the same traction-separation law as applied to the open
hole problem. Agreement is reasonable, but a need for a model that incorporates bolt clamp-up is
apparent. Subsequently an extensive experimental data set is obtained for the failure strength of a
range of woven CFRP bolted joints, both double-lap and single-lap construction with various
lay-ups, plate geometries, hole sizes and bolt clamp-up. These test configurations are then
modelled using a 3-D finite element framework. Good agreement between the predicted and
measured bearing stress at failure was obtained for double-lap joints that failed in the net tension
failure mode. Less good agreement was obtained for the single-lap joints, where the tensile
fracture mechanisms were more complex and not captured fully in the model.

P a g e | iii
ACKNOWLEDGEMENTS
This dissertation would not be a reality without the guidance of my main supervisor, Professor
Paul Smith. His patience and dedication in guiding me through the problems arising during the
process of learning in this project are much appreciated. I would like to extend my appreciation
to my co-supervisor Professor Andrew Crocombe who helped me so much in making this
dissertation a success through his advice and support.
To all my friends from UTHM, UNITEN, UPM, UM and my other friends, your assistance and
moral support whenever I need you are much appreciated.
Last but not least, I would like to acknowledge my employer, Universiti Tun Hussein Onn
Malaysia (UTHM) for offering me a scholarship to come to the University of Surrey to pursue
PhD study.

P a g e | iv
PUBLICATIONS
[1]. Ahmad, H., Crocombe, A.D., Smith, P.A., “Finite element based damage and fracture
modelling in notched composites”, UK-MEC 2nd Engineering Conference, London, 8-9th
April 2010.
[2]. Ahmad, H., Crocombe, A.D., Smith, P.A., “Modelling of Physically-based strength
prediction in notched woven laminates under quasi-static loading”, 2011 SIMULIA
Costumer Conference, Barcelona, 17-19th May 2011.
[3]. Ahmad, H., Crocombe, A.D., Smith, P.A., “Failure modelling of woven GFRP bolted joints
under quasi-static loading”, 18th International Conference on Composite Materials
(ICCM18), Jeju Island, 22-26th August 2011.

P a g e | v
Table of Contents
PREFACE ........................................................................................................................................... i
ABSTRACT ........................................................................................................................................ ii
ACKNOWLEDGEMENTS ................................................................................................................... iii
PUBLICATIONS ................................................................................................................................ iv
NOMENCLATURE ...............................................................................................................................x
LIST OF TABLES.............................................................................................................................. xiv
LIST OF FIGURES ............................................................................................................................. xv
Chapter 1 : Introduction .............................................................................................................. 1
1.1 Overview ................................................................................................................... 1
1.2 Open-hole and Joints - a design problem ............................................................... 1
1.3 Aim of this work ....................................................................................................... 2
1.4 Structure of this thesis ............................................................................................. 3
Chapter 2 : Literature Review .................................................................................................... 5
2.1 Introduction ............................................................................................................. 5
2.2 Woven Composites .................................................................................................. 5
2.2.1 Basic Features and Physical Modelling of Woven Composites................................. 5
2.2.2 Damage Mechanisms and Elastic Degradation .......................................................10
2.3 Composite Laminates Containing an Open-hole ................................................. 13
2.3.1 Introduction ............................................................................................................. 13
2.3.2 Experimental Observation of Damage in Open-hole Woven Composites .............. 14
2.3.3 Stress Distribution and Notch Sensitivity in Open Hole Laminate Plates .............. 16
2.3.4 Strength Prediction Approaches in Open-Hole Laminate Plates ............................ 19
2.3.4.1 Classical LEFM-based semi-empirical characteristic distance ................................................ 20 2.3.4.2 Stress Distribution based Semi-empirical Characteristic distance .......................................... 21 2.3.4.3 Fracture Mechanics based Modelling ...................................................................................... 24 2.3.4.4 Damage-based Modelling........................................................................................................ 31 2.3.4.5 Progressive Damage Modelling ............................................................................................... 33
2.4 Mechanical Fastened Composite Joints ............................................................... 34
2.4.1 Introduction ............................................................................................................ 34
2.4.2 Experimental Studies of Failure in Composite Bolted Joints ................................ 35
2.4.2.1 Overview.................................................................................................................................. 35 2.4.2.2 Behaviour of Joints based on Multi-directional (Non-woven) Laminate ................................. 36 2.4.2.3 Behaviour of Joints based on Woven Fabric reinforcement .................................................... 39
2.4.3 Stress Distribution in Composite Bolted Joints ...................................................... 41
2.4.4 Strength Prediction Methods in Composite Bolted Joints ..................................... 46
2.4.4.1 Introduction ............................................................................................................................ 46 2.4.4.2 Failure Criterion ..................................................................................................................... 46 2.4.4.3 Use of Characteristic Lengths ................................................................................................. 48

P a g e | vi
2.4.4.4 Fracture Mechanics method .................................................................................................... 51 2.4.4.5 Progressive Continuum Damage Method ................................................................................ 52 2.4.4.6 3-D Modelling incorporating Bolt Loads ................................................................................. 54
2.5 Concluding Remarks ............................................................................................. 56
Chapter 3 : Finite element modelling of Open-Hole Geometry .......................................... 58
3.1 Introduction ........................................................................................................... 58
3.2 Generation of FEA Models for Open-Hole Problem ............................................ 59
3.2.1 Introduction ............................................................................................................ 59
3.2.2 Geometry and Material Properties ......................................................................... 59
3.2.2.1 Open-hole Plate Geometry ...................................................................................................... 59 3.2.2.2 Material properties ................................................................................................................ 60 3.2.2.3 Fracture Energy ...................................................................................................................... 61
3.2.3 Meshing and Boundary Conditions ........................................................................ 63
3.2.4 Implementation of the constitutive damage law in FEA Modelling ...................... 64
3.2.4.1 Introduction ............................................................................................................................ 64 3.2.4.2 Cohesive Zone Model .............................................................................................................. 65 3.2.4.3 Extended Finite Element (X-FEM) Modelling ........................................................................ 66
3.2.5 Sensitivity study ...................................................................................................... 69
3.3 Open-hole Tensile Strength Predictions Based On Afaghi-Khatibi’s (1996b) Work ........................................................................................................................ 71
3.4 Open-hole Strength Prediction Based on Belmonte’s (2001, 2004) Work .......... 74
3.4.1 Stress Distribution Study ........................................................................................ 74
3.4.2 GFRP Strength Prediction ....................................................................................... 75
3.4.3 CFRP Strength Prediction ....................................................................................... 77
3.5 Concluding Remarks ............................................................................................. 79
Chapter 4 : 2-D Finite Element Modelling of Bolted Joints ............................................... 80
4.1 Introduction ........................................................................................................... 80
4.2 Generation of 2-D FEA Models for Composite Bolted Joints .............................. 81
4.2.1 Overview .................................................................................................................. 81
4.2.2 Joint geometries and material properties ............................................................... 81
4.2.3 Boundary conditions and contact interactions ...................................................... 83
4.2.4 Failure Models ........................................................................................................ 85
4.2.5 Determination of sliding load ................................................................................. 87
4.3 Results and Discussion .......................................................................................... 87
4.3.1 Strength of CFRP bolted joints (after Hollmann, 1996) ......................................... 87
4.3.2 Stress distribution in the vicinity of the bolt in pin-loaded quasi-isotropic GFRP woven fabric laminates ............................................................................................ 88
4.4.2 Strength prediction of GFRP woven fabric bolted joint ......................................... 90
4.5 Concluding Remarks ............................................................................................. 91
Chapter 5 : Experimental Methodology and Results for CFRP bolted joints ................... 92

P a g e | vii
5.1 Introduction ........................................................................................................... 92
5.2 Bolted Joints Components ..................................................................................... 92
5.2.1 Introduction ............................................................................................................ 92
5.2.2 CFRP Woven Fabric System Plates ........................................................................ 92
5.2.3 Steel Plates .............................................................................................................. 93
5.2.4 Fastener systems .................................................................................................... 93
5.3 Sample Preparation .............................................................................................. 94
5.3.1 Introduction ............................................................................................................ 94
5.3.2 Cutting of Composite Panels .................................................................................. 94
5.3.3 Drilling of Holes...................................................................................................... 95
5.3.4 Bolted Lap Joint Configurations ............................................................................ 95
5.3.5 Application of Clamp-up Torque ............................................................................ 96
5.4 Test Matrix ............................................................................................................ 96
5.5 Mechanical Testing................................................................................................ 98
5.6 Experimental Results ............................................................................................ 99
5.6.1 Introduction ............................................................................................................ 99
5.6.2 Load-displacement behaviour and failure modes for DLJs ................................... 99
5.6.3 Load-displacement behaviour and failure modes for SLJs ...................................103
5.6.4 Bearing Stress at failure as a function of W/d and material type ........................ 104
5.6.4 Discussion of effect of other joint variables on bearing stress at failure ............... 114
5.6.4.1 Effect of hole size ....................................................................................................................114 5.6.4.2 Effect of bolt loads..................................................................................................................114 5.6.4.3 Effect of joint type .................................................................................................................. 115
5.7 Concluding Remarks ............................................................................................ 116
Chapter 6 : 3-D Modelling of GFRP and CFRP Bolted Double-Lap Joints ..................... 117
6.1 Introduction .......................................................................................................... 117
6.2 Implementation of 3-D FEA Models .................................................................... 118
6.2.1 Determination of 3-D elastic properties ................................................................ 118
6.2.2 Generation of 3-D Model ....................................................................................... 119
6.2.2.1 Overview of model ..................................................................................................................119 6.2.2.2 The use of “Smeared-out” properties .....................................................................................119 6.2.2.2 Modelling Approaches and Techniques................................................................................. 120 6.2.2.3 Modelling of the bolt loads .................................................................................................... 122 6.2.2.4 Applications of failure criterion ............................................................................................ 124
6.3 Stress Distribution in Composite Double-Lap Joints ........................................ 125
6.3.1 Introduction ........................................................................................................... 125
6.3.2 Analytical analysis in clamp-up modelling ........................................................... 125
6.3.3 Comparisons of Analytical and FEA modelling..................................................... 127
6.3.4 Comparison of Stress Distributions for Laminates of Different Lay-ups .............130

P a g e | viii
6.4 Strength Prediction of Woven Fabric Bolted Double-Lap Joints ...................... 132
6.4.1 Introduction ........................................................................................................... 132
6.4.2 Typical Characterisation in Double-Lap Bolted Joint Problem ............................ 133
6.4.4 Strength Predictions of GFRP Bolted Double-Lap Bolted Joint ........................... 136
6.4.5 Strength Predictions of CFRP Bolted Double-Lap Joint ....................................... 137
6.4.6 Strength Predictions of CFRP Joint incorporating material softening ................ 140
6.5 Concluding Remarks ............................................................................................ 141
Chapter 7 : 3-D Modelling of CFRP Composites Bolted Single-Lap Joints .................... 143
7.1 Introduction ......................................................................................................... 143
7.2 Implementation of 3-D FEA Models in Single-Lap Joint .................................. 143
7.2.1Overview of model .................................................................................................. 144
7.2.2 Modelling Techniques and Approaches ................................................................ 144
7.3 Stress Distribution in Bolted Single-Lap Joint ................................................... 145
7.3.1 Introduction ........................................................................................................... 145
7.3.2 Secondary Bending Effects in Bolted Single-Lap Joints ....................................... 146
7.3.2 Comparisons of Bolted Single-Lap and Double-Lap Joints .................................. 147
7.3.3 Effect of different material combination ............................................................... 150
7.3.4 Effects of plate thickness ....................................................................................... 153
7.4 Strength Predictions of Bolted Single-Lap Joint .................................................155
7.4.1 Introduction ........................................................................................................... 155
7.4.2 Characterisation of Bolted Single-Lap Joint ......................................................... 156
7.4.3 Strength Predictions of Bolted Single-lap CFRP Joint .......................................... 157
7.5 Concluding Remarks ........................................................................................... 160
Chapter 8 : Conclusions and Recommendations ................................................................ 161
8.1 Conclusions ........................................................................................................... 161
8.2 Future Works ....................................................................................................... 162
References .................................................................................................................................... 164
Appendix A: CFRP Bolted Joint Experimental Data .................................................................. 172
A1: Experimental bearing stress at failure for PX2 ................................................. 172
A2: Experimental bearing stress at failure for PX4 .................................................174
A3: Experimental bearing stress at failure for PQ4 .................................................176
A4: Experimental bearing stress at failure for PQ8 ................................................ 178
A5: Experimental bearing stress at failure for 5X2 ................................................ 180
A6: Experimental bearing stress at failure for 5X4 ................................................ 182
A7: Experimental bearing stress at failure for 5Q12 ............................................... 184
Appendix B: Determination of out-of-plane elastic constants ................................................... 185

P a g e | ix
B1: Cross-ply laminates ............................................................................................ 185
B2: Quasi-Isotropic laminates .................................................................................. 189

P a g e | x
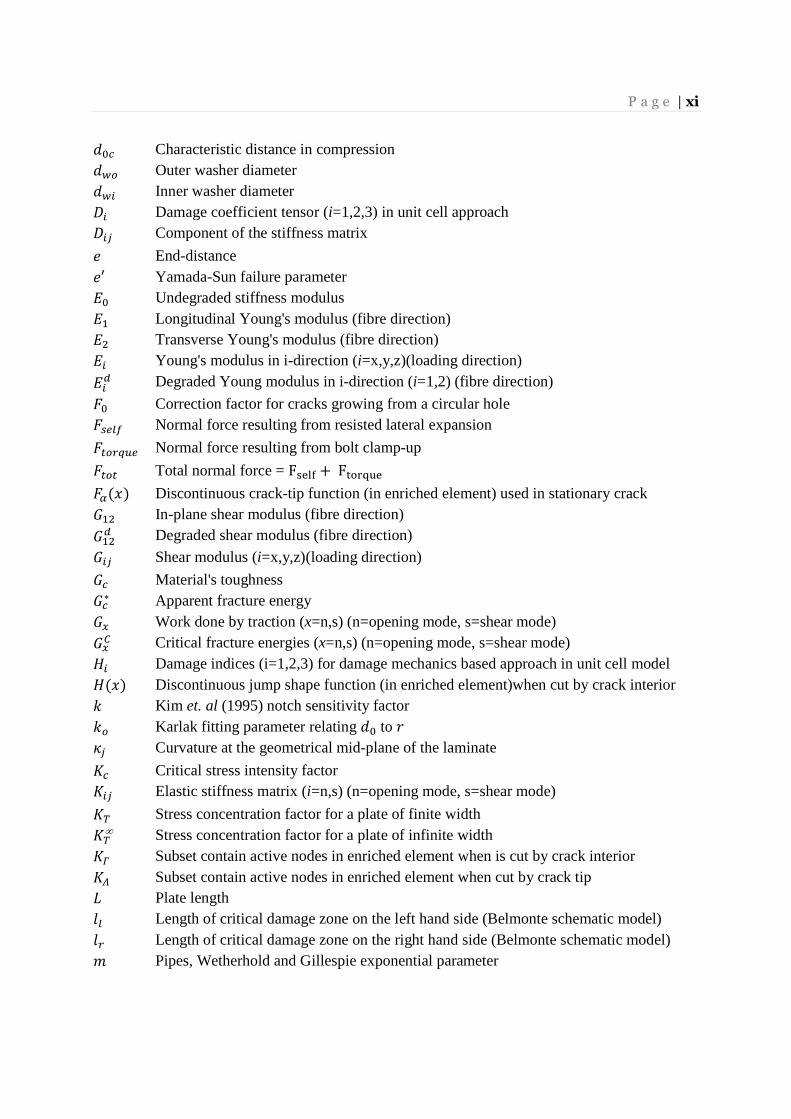
NOMENCLATURE
5HS Five harness satin 8HS Eight harness satin ASC Average stress criterion BS Applied bearing stress CDG Critical damage growth CF Clamping force CFRP Carbon fibre reinforced plastic CLPT Classical laminate plate theory CZM Cohesive zone model DLJ Double-lap joint DZC Damage zone criterion DZM Damage zone model ECGM Effective crack growth model FEA Finite element analysis FT Finger-tight GFRP Glass fibre reinforced plastic LEFM Linear elastic fracture mechanics PSC Point stress criterion SLJ Single-lap joint WN Whitney-Nuismer criterion XFEM Extended finite element method � Longitudinal distance from hole edge �� Whitney- Nuismer Average Stress Criterion characteristic distance ��� Characteristic distance (i= t (tension), c (compression)) for unloaded holes introduced
by Agrawal (1980) �� Waddoups, Eisenmann and Kaminski Characteristic region �� Enriched nodal D.O.F. vector when cut by crack interior � Single edge notch sample thickness ��� Enriched nodal D.O.F. vector when cut by crack tip � Straight crack half-length �� Critical damage zone length predicted by Critical Damage Growth Model � Compliance �� Pipes, Wetherhold and Gillespie notch sensitivity factor Hole diameter � Damage variable (i=1,2,3) � Damage variable (i,j=1,2,3) � Whitney- Nuismer Point stress criterion characteristic distance �� Characteristic distance in tension
P a g e | xi
�� Characteristic distance in compression � Outer washer diameter � Inner washer diameter �� Damage coefficient tensor (i=1,2,3) in unit cell approach �� Component of the stiffness matrix � End-distance �′ Yamada-Sun failure parameter �� Undegraded stiffness modulus �� Longitudinal Young's modulus (fibre direction) �� Transverse Young's modulus (fibre direction) �� Young's modulus in i-direction (i=x,y,z)(loading direction) ��� Degraded Young modulus in i-direction (i=1,2) (fibre direction) �� Correction factor for cracks growing from a circular hole ����� Normal force resulting from resisted lateral expansion ������� Normal force resulting from bolt clamp-up ���� Total normal force = F�� ! +F$%&'(� ��(*) Discontinuous crack-tip function (in enriched element) used in stationary crack ,�� In-plane shear modulus (fibre direction) ,��� Degraded shear modulus (fibre direction) ,� Shear modulus (i=x,y,z)(loading direction) ,� Material's toughness ,�∗ Apparent fracture energy ,. Work done by traction (x=n,s) (n=opening mode, s=shear mode) ,./ Critical fracture energies (x=n,s) (n=opening mode, s=shear mode) 0� Damage indices (i=1,2,3) for damage mechanics based approach in unit cell model 0(*) Discontinuous jump shape function (in enriched element)when cut by crack interior 1 Kim et. al (1995) notch sensitivity factor 1� Karlak fitting parameter relating � to 2 3 Curvature at the geometrical mid-plane of the laminate 4� Critical stress intensity factor 4� Elastic stiffness matrix (i=n,s) (n=opening mode, s=shear mode) 45 Stress concentration factor for a plate of finite width 45∞ Stress concentration factor for a plate of infinite width 46 Subset contain active nodes in enriched element when is cut by crack interior 47 Subset contain active nodes in enriched element when cut by crack tip 8 Plate length 9� Length of critical damage zone on the left hand side (Belmonte schematic model) 9� Length of critical damage zone on the right hand side (Belmonte schematic model) : Pipes, Wetherhold and Gillespie exponential parameter
P a g e | xii
;� Nodes in an element (i=1,2,3,….) ;<� Phantom nodes in an element (i=1,2,3,…) (Phantom node concept) ;= Number of tows between crimps in both orthogonal directions in balanced fabrics >�(*) Conventional FE (non-enriched) nodal shape function ? Cosinusoidal radial stress distribution @ Applied load @AB. Maximum load C� Reduced stiffness matrix component (i,j=1,2,3) 2 Hole radius 2� Pipes, Wetherhold and Gillespie reference radius D Shear strength D′ Remote tensile stress applied to a open-hole plate D� Shear strength (i=1,2,3) (fibre direction) E Plate thickness E. Nominal traction (x=n,s) (n=opening mode, s=shear mode) E.� Peak nominal traction (x=n,s) (n=opening mode, s=shear mode) F� Conventional FE (non-enriched) nodal displacement vector G� Volume fraction of fibre material H Plate width I� Width of critical damage zone on left hand side (Belmonte schematic model) I� Width of critical damage zone on right hand side (Belmonte schematic model) J� Longitudinal compressive strength J� Longitudinal tensile strength K� Finite width correction factor K� Finite width correction factor for a crack emanating from a hole K� Transverse compressive strength K� Transverse tensile strength L� Out-of-plane compressive strength L� Out-of-plane tensile strength ∆� Increment crack growth in ECGM N Displacement N� Critical displacement O� Strain(i=1,2,3)(fibre direction) O� Failure strain O. Strain (x=n,s) (n=opening mode, s=shear mode) OP Residual strain OQ Through-thickness strain R�� In-plane shear strain R� Shear strain (i,j=1,2,3)(fibre direction)

P a g e | xiii
S Angle from bearing plane T Factor relating the stress in the laminate to the stress in the 0° plies W�� In-plane Poisson's ratio (fibre direction) W� Poisson's ratio (i,j=x,y,z)(loading direction) X�� Degraded Poisson’s ratio (i,j=1,2,3)(fibre direction) Y Experimentally determined constant for non-linear Tsai-Hahn Z� Stress (i=1,2,3)(fibre direction) Z� Un-notched laminate strength ZB[[ Applied stress for shear modulus determination Z\ Bearing stress, =P/dt Z\,� Bearing stress on the composite to include effect of friction load transfer Z��^ Cohesive stress/traction Z_ Open-hole laminate strength of a finite plate Z_∞ Open-hole laminate strength of a infinite plate Z� Radial stress (polar coordinate system) Z� Ultimate strength Z` Normal stress ahead of hole Z<̀ Uniform tensile stress applied remotely from hole Z ∗̀ Normal stress ahead of hole with stress relaxation ZQQ Through-thickness stress Za Tangential/hoop/circumference stress (polar coordinate system) b�� In-plane shear stress (fibre direction) b� Shear stress (i,j=1,2,3)(fibre direction) b�a Shear stress (polar coordinate system) c� Sub-domain (i=A,B)elements after crossed by crack (Phantom node concept) d� Crack line to divide the element into two sub-domain (Phantom node concept)
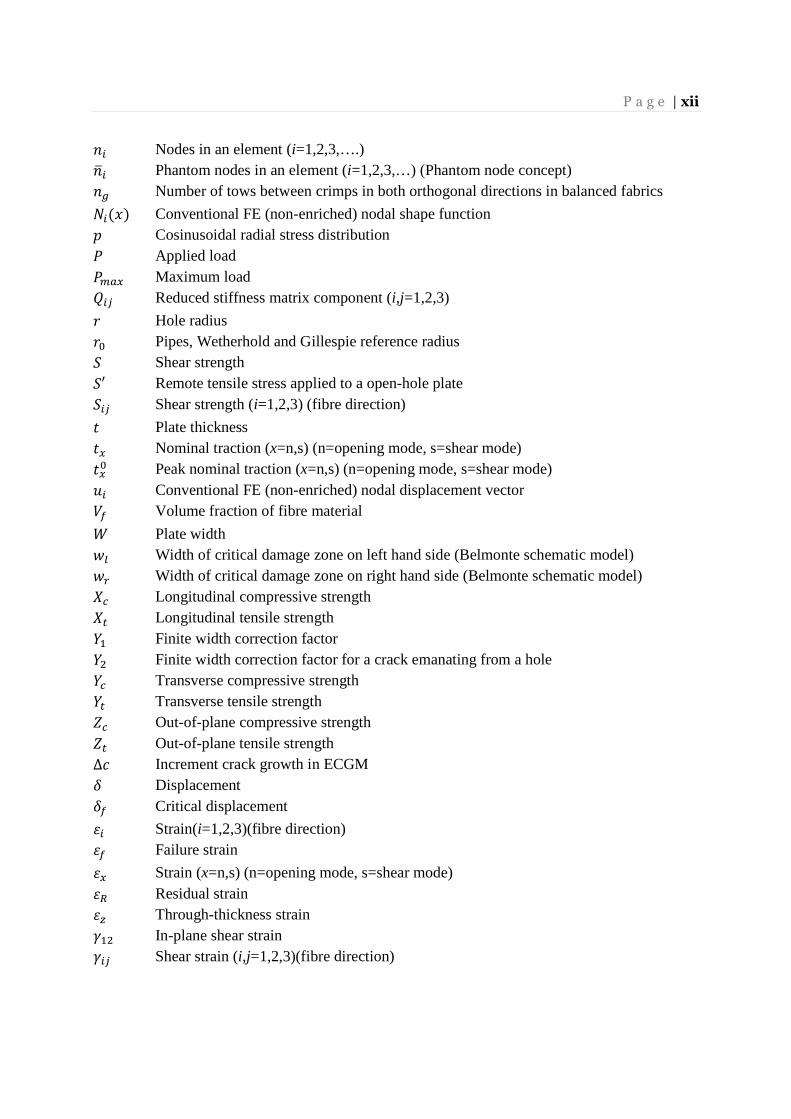
P a g e | xiv
LIST OF TABLES Table 2.1: Damage model for fibre bundle and matrix (after Lomov et. al. (2007)) ............................... 12
Table 2.2: Material degradation model proposed by Chang (1987) and Tan (1991) in progressive damage modelling approach. ........................................................................................................ 34
Table 2.3: Hashin failure criterion with associated failure mode.......................................................... 47
Table 3.1: Material properties of woven fabric system conducted by Kim et. al (1995) ......................... 60
Table 3.2: Material properties for woven GFRP from Belmonte et. al. (2001) ....................................... 61
Table 3.3: Material properties all woven CFRP from Belmonte et. al. (2004) ....................................... 61
Table 3.4: Comparison of experimental open-hole strength with XFEM modelling of Kim et al.’s work (1995) ............................................................................................................................ 72
Table 3.5: Comparison of woven GFRP open-hole strength prediction using XFEM and CZM with experimental data and other closed-form solutions (from Belmonte et. al., (2001)) ............... 77
Table 3.6: Comparison of woven CFRP open-hole strength prediction using XFEM (present work) and CZM with experimental data and other closed-form solution from (Belmonte et. al., (2004)) 77
Table 4.1: Experimental CFRP specimen geometries and average failure load (after Hollmann, 1996) .. 82
Table 4.2: Mechanical properties of the laminate idealised ................................................................. 82
Table 4.3: Geometry parameters for various W/d ratios ...................................................................... 83
Table 4.4: Material properties of components .................................................................................... 83
Table 4.5: Comparison of experimental and predicted bolted joint strengths for CFRP laminates investigated by Hollmann (1996) ..................................................................................... 88
Table 4.6: Comparison of modelling predictions and experimental results ............................................ 91
Table 5.1: Material properties of the woven CFRP laminates* under investigation ............................... 93
Table 5.2: Range of test parameters investigated for CFRP DLJ and SLJ tests ..................................... 97
Table 5.3: Maximum bearing stress at failure in different lay-up. ....................................................... 105
Table 6.1: Elastic properties of GFRP and CFRP lay-ups investigated in current study incorporating out-of-plane properties ......................................................................................................... 118
Table 6.2: Maximum traction and toughness values used in current model ......................................... 124
Table 6.3: Prediction of numerical modelling of bolted joint strength with experimental works. ........... 137
Table 6.4: Comparisons of FEA with experimental work in double-lap joint configuration .................. 138
Table 6.5: Parametric study with variation in the degree of material softening .................................... 141
Table 7.1: Comparisons of FEA with experimental work in single-lap joint configurations .................. 158
P a g e | xv
LIST OF FIGURES Figure 2.1: Unit cell of different woven fabric types ............................................................................ 6
Figure 2.2: Simplifications of yarn geometry in woven fabric (Ishikawa and Chou, 1982) ...................... 6
Figure 2.3: Unit cell (shown in bracket) in plain weave woven (left) (Naik and Ganesh, 1995) and five-harness satin (right) (Daggumati et. al., 2010) ......................................................................7
Figure 2.4: 3-D unit cell model (a) single unit cell (b) 4-unit cells with in-phase stacking (c) 4-unit cells with out-of-plane stacking (Daggumati et. al. (2010)) .......................................................... 9
Figure 2.5: Damage observations in satin weave carbon-PPS thermoplastic composite (after Daggumati et. al., 2010) ....................................................................................................................10
Figure 2.6: Normalized modulus, Poisson's ratio and cumulative residual strain for 2-layer eight harness satin CFRP woven composite. ........................................................................................... 12
Figure 2.7: Hole edge plain view in 8 layers 8HS weave with 2.5 mm circular hole .............................. 14
Figure 2.8: Hole edge fibre damage from SEM image at layer 1 (left), layer 6 (middle) and layer 8 (right) of 2.5 mm circular hole of 8-layer 8HS weave ................................................................... 15
Figure 2.9: Both side of sample 5Q4 at 98% failure load (198 MPa) (after Belmonte et. al., 2004) ......... 16
Figure 2.10: Damage observation at hole edge of 5 mm diameter hole size using secondary electron micrograph in each layer. ............................................................................................... 16
Figure 2.11: Typical stress distribution along the net-tension plane circular hole plate ........................... 18
Figure 2.12: Failure strength as a function of normalised hole diameter for notched sensitive and notch insensitive material ........................................................................................................ 18
Figure 2.13: High damage intensity at hole edge ................................................................................ 20
Figure 2.14: Whitney-Nuismer (1974) semi-empirical criterion ........................................................... 21
Figure 2.15: Damage zone and equivalent crack at notch vicinity (Backlund and Arronson, 1986) ........ 25
Figure 2.16: Barenblatt (left) and Dugdale (right) cohesive zone concept ............................................ 25
Figure 2.17: (a) Linear DZM model and (b) constant DZC criterion .................................................... 26
Figure 2.18: Modified elastic stress distribution in notched composite laminate (after Afaghi-Khatibi et. al., 1996a) .................................................................................................................... 27
Figure 2.19: Fictitious crack of cohesive stress-crack opening (after Afaghi-Khatibi et. al., 1996a) ....... 28
Figure 2.20: Flow chart for residual strength evaluation by ECGM (after Afaghi-Khatibi et. al., 1996a) 28
Figure 2.21: Open-hole strength prediction from CDG model as proposed by Hitchen et.al. (1994)....... 29
Figure 2.22: Illustration of damage zone model (after Belmonte et. al., 2004) ....................................... 31
Figure 2.23: Damage zone in [45/90/-45/0]s (Hallett et. al., 2009) ....................................................... 32
Figure 2.24: Types of mechanical lap joint in structural assembly ....................................................... 35
Figure 2.25: Geometry dimension used in bolted joint problems ......................................................... 36
Figure 2.26: Failure modes in mechanically fastened composite joints ................................................ 36
Figure 2.27: Effect of CFRP laminate width (left) and end-distance (right) on bearing strength (Collings, 1977) ........................................................................................................................... 37
Figure 2.28: Effect of bolt clamping torque upon critical W/d (left) and e/d (right) (Cooper and Turvey, 1995) ........................................................................................................................... 38
Figure 2.29: Macroscopic damage zone in specimen of W/d=4 from (a) top layer (b) bottom layer (c) exceeding critical damage zone leading to catastrophic failures (Kontolatis, 2000) ............. 41
Figure 2.30: Superposition of De Jong (1977) load cases .................................................................... 42

P a g e | xvi
Figure 2.31: Stress distribution (a) and (b) along hole boundary and (c) along net-tension using De Jong (1977) superposition method ......................................................................................... 43
Figure 2.32: Radial and tangential stress along hole boundary in different laminate lay-up as a function of W/d (after Crews et. al., 1981) ....................................................................................... 44
Figure 2.33: Tangential stress concentration factors as a function of W/d (after Crews et. al., 1981) ...... 44
Figure 2.34: Definition of characteristic lengths (after Agrawal, 1980) ................................................ 48
Figure 2.35: Chang-Scott-Springer (1982) characteristic curve ........................................................... 49
Figure 2.36: Progressive damage model algorithm (after Aktas et. al., 2009) ........................................ 51
Figure 2.37: Progressive damage model algorithm (after Dano et. al., 2000) ........................................ 53
Figure 3.1: Geometry of open-hole composite plate model, used for all experimental cases .................. 59
Figure 3.2: Graph of compliance against crack length of 5X2 Laminates (Belmonte et. al., 2002) ......... 62
Figure 3.3: Mesh of the model implemented ...................................................................................... 63
Figure 3.4: Boundary condition and loading applied in open hole problem .......................................... 63
Figure 3.5: Traction-separation constitutive material law used in the current analysis ........................... 65
Figure 3.6: Normal and tangential coordinates for an arbitrary crack (after ABAQUS) ......................... 67
Figure 3.7: Crack tip and crack interior enrichment nodes (after ABAQUS) ........................................ 68
Figure 3.8: Phantom node concept in damage propagation using XFEM (a) before (b) after partitioning (b) of crack element into sub-elements (after ABAQUS) ................................................... 68
Figure 3.9: Predicted open-hole specimen failure load as a function of damage stabilization coefficient for woven glass-epoxy system (W=10 mm, d=0.4 mm) following Kim et. al. (1995) ................ 70
Figure 3.10: Open-hole specimen failure load as a function of number of elements for woven glass-epoxy system (W=10 mm, d=0.4 mm) following Kim et. al (1995). ........................................... 70
Figure 3.11: Typical load-displacement plots resulting from implementing XFEM approach for the laminate reported by Kim et al. (1995). ........................................................................... 71
Figure 3.12: Damage plot of crack initiation and crack propagation using XFEM as labelled in Fig. 3.11 for glass/epoxy (W=10 mm, d =2 mm) ............................................................................ 71
Figure 3.13: Normalised open-hole strength plotted as a function of hole size for the laminates tested by Kim et. al. (1995). Comparison between experiment, ECGM approach (Afaghi-Khatibi et. al., 1996b), and current study of XFEM results ............................................................... 74
Figure 3.14: Stress concentration of (a) PW8, (b) 5Q8 and (c) series of 8-layer of 5 mm notch diameter . 75
Figure 3.15: Typical load-displacement curve from CZM (woven GFRP (0°/90°/±45°)s ....................... 76
Figure 3.16: Damage plot for cohesive damage modelling using CZM as labelled in Figure 3.15 for GFRP plate (d=10 mm). .......................................................................................................... 76
Figure 4.1: Configurations of bolted joint determined experimentally, left (after Hollmann, 1998) and right (after Kontolatis, 2000) ............................................................................................. 81
Figure 4.2: Dimensions of bolted joint geometry ................................................................................ 82
Figure 4.3: Two-dimensional model based on the geometry investigated by Hollmann (1996) .............. 84
Figure 4.4: Meshing of 2-D pin joint model following Kontolatis (2000) (a) Mesh (b) Boundary condition ...................................................................................................................................... 84
Figure 4.5: Physically-based material model used in current study (a) to represent shear-out mode of failure in Hollmann (1996) and (b) to represent net-tension failure in Kontolatis (2000) ...... 85
Figure 4.6: Cohesive elements path shear-out plane (after Hollmann, 1996) ........................................ 85
Figure 4.7: XFEM regions in pinned joint (after Kontolatis (2000)) .................................................... 86
Figure 4.8: Sliding force of all W/d analyzed ..................................................................................... 87

P a g e | xvii
Figure 4.9: Shear-out failure simulated using cohesive zone model (CZM) approach. .......................... 88
Figure 4.10: Stress distribution along net-tension plane of varying W/d ratio with bearing stress of 250 N/mm2 (a) Normalised radial stress (b) Normalised tangential stress ................................ 89
Figure 4.11: Stress distribution on hole boundary of varying W/d ratio with bearing stress of 250 N/mm2 (a) Normalised radial stress (b) Normalised tangential stress ............................................ 89
Figure 4.12: Typical load-displacement curve in pin joint from XFEM ............................................... 90
Figure 4.13: Crack propagation of pin joint in XFEM for (a) W/d =2, (b) W/d=3, ................................. 90
Figure 5.1: Schematic of single-lap joint configuration used in present study ....................................... 95
Figure 5.2: Schematic of the double-lap joint configuration used in present study ................................ 96
Figure 5.3: Range of tests carried out on PQ4 laminate (16 different W/d, hole diameter and clamp-up combinations for each joint type). .................................................................................... 97
Figure 5.4: Experimental set-up of bolted joint tests (a) double-lap joint (b) single-lap joint ................. 98
Figure 5.5: Joint behaviour of DLJ in (a) net-tension and (b) bearing failures ...................................... 99
Figure 5.6: Typical load-displacement curve in DLJ as a function of W/d .......................................... 100
Figure 5.7: Plan view photographs of failed double-lap joint (DLJ) specimen from PQ4 laminate at various W/d and clamped condition ................................................................................. 101
Figure 5.8: Plan view photographs of failed specimens from PQ4 laminate at different clamping conditions ..................................................................................................................... 102
Figure 5.9: Joint behaviour of SLJ in (a) net-tension and (b) bearing failures ......................................103
Figure 5.10: Plan view photographs of failed single-lap joint (SLJ) specimen from PQ4 laminate at various W/d and clamped condition .............................................................................. 104
Figure 5.11: Crack propagation through thickness elevated from bottom plane and top plane in single-lap joint ........................................................................................................................... 104
Figure 5.12: Bearing stress at failure as a function of W/d for PQ8 showing transition from net-tension to bearing failures (a) DLJ (b) SLJ ................................................................................... 106
Figure 5.13: Bearing stress at failure as a function of joint geometry and other test variables for PX2 lay-up ............................................................................................................................... 107
Figure 5.14: Bearing stress at failure as a function of joint geometry and other test variables for PX4 lay-up .............................................................................................................................. 108
Figure 5.15: Bearing stress at failure as a function of joint geometry and other test variables for 5X2 lay-up .............................................................................................................................. 109
Figure 5.16: Bearing stress at failure as a function of joint geometry and other test variables for 5X4 lay-up ............................................................................................................................... 110
Figure 5.17: Bearing stress at failure as a function of joint geometry and other test variables for PQ4 lay-up ................................................................................................................................ 111
Figure 5.18: Bearing stress at failure as a function of joint geometry and other test variables for PQ8 lay-up ............................................................................................................................... 112
Figure 5.19: Bearing stress at failure as a function of joint geometry and other test variables for 5Q12 lay-up ............................................................................................................................... 113
Figure 5.20: Bearing stress at failure as a function of normalised joint width for PQ4 laminates at two different hole sizes. ...................................................................................................... 114
Figure 5.21: Bearing stress at failure as a function of normalised joint width for PQ8 and PQ4 laminates at two different clamp-up conditions. ............................................................................ 115
P a g e | xviii
Figure 5.22: Bearing stress at failure as a function of normalized joint width for PQ4 laminate for different joint types and clamp-up condition. ................................................................. 116
Figure 6.1: Joint geometries required for 3-D modelling ................................................................... 120
Figure 6.2: Part components in double-lap joint ................................................................................ 121
Figure 6.3: FEA model of double-lap bolted joint implemented in ABAQUS CAE. ............................ 121
Figure 6.4: Two loading steps implemented in current modelling ....................................................... 122
Figure 6.5: Sliding load is overcome as load being applied ................................................................ 123
Figure 6.6: Illustrating an experimental sliding load .......................................................................... 123
Figure 6.7: Application of bolt load in the model .............................................................................. 124
Figure 6.8: Assigned XFEM region in woven fabric lay-up plate of double-lap joint. .......................... 125
Figure 6.9: Stress distributions local to the loaded hole in a woven fabric GFRP plate with W/d =5 and d= 5 mm at different values of bearing stress. Bolt clamping force = 2000 N. Comparison between analytical approach and 3-D FEA models (a) Radial stress around hole boundary (b) Tangential stress around hole boundary (c) Tangential stress on net-tension plane .............. 128
Figure 6.10: Stress distributions local to the loaded hole in a woven fabric GFRP plate with W/d =5 and d = 5 mm at different values of clamping force. Bearing stress = 500 N/mm2. Comparison between analytical approach and 3-D FEA models (a) Radial stress around hole boundary (b)Tangential stress around hole boundary (c) Tangential stress on net-section plane........ 129
Figure 6.11: Comparison of FEA stress distributions near loaded hole in quasi-isotropic (PQ4) and cross-ply (PX4) lay-ups with d = 10 mm in the finger-tight and clamped conditions at an applied bearing stress of 400 N/mm2 (a) Radial stress around hole boundary (b) Tangential stress around hole boundary (c) Tangential stress with normalised distance from the hole edge. . 131
Figure 6.12: Double-Lap joint configuration ..................................................................................... 133
Figure 6.13: Parametric study on mesh sensitivity effect on strength prediction results ........................ 134
Figure 6.14: Parametric study on the effect of varying the damage stabilization coefficient used in joint strength prediction ....................................................................................................... 134
Figure 6.15: Typical load-displacement curve for double-lap joint from 3-D FEA. .............................. 135
Figure 6.16: Maps of Von-Mises stress and crack growth at the four points marked on the load-displacement curve in Figure 6.15 ................................................................................. 136
Figure 6.17: Reduced modulus behind bolt to capture significant initial bearing prior to ultimate net-tension ....................................................................................................................... 140
Figure 7.1: Single-lap bolted joint implemented in FEA modelling (the model has been oriented so as to enhance the clarity of the mesh) ...................................................................................... 144
Figure 7.2: Interaction contact surfaces involved in a single-lap joint models. ..................................... 145
Figure 7.3: Secondary bending showed in single-lap bolted joint modelling (a) experimental observation (b) FEA models ............................................................................................................. 146
Figure 7.4: Stress distribution through thickness for single-lap joint ................................................... 147
Figure 7.5: Comparison of stress distributions in DLJ and SLJ configurations using PQ8 CFRP with d = 5 mm and a nominal bearing stress of 500 N/mm2 (a) Radial stress around the hole boundary (b) Tangential stress around the hole boundary (c) Tangential stress on net-tension plane ........148
Figure 7.6: Comparison of stress distribution at top and bottom plane using PQ8 CFRP with d = 5 mm and a nominal bearing stress of 500 N/mm2 in DLJ and SLJ configurations (a) Radial stress around the hole boundary (b) Tangential stress around the hole boundary .......................... 149

P a g e | xix
Figure 7.7: Comparison of stress distributions in C-C and C-S combinations using PX4 CFRP with d = 10 mm and a nominal stress of 250 N/mm2. (a) Radial stress around the hole boundary (b) Tangential stress around the hole boundary (c) Tangential stress on net-tension plane ........ 151
Figure 7.8: Comparison of stress distribution at top and bottom plane using PX4 CFRP with d= 10 mm and a nominal stress of 250 N/mm2 in C-C and C-S configurations. (a) Tangential stress around the hole boundary with clamping force = 500 N (b) Tangential stress around the hole boundary with clamping force = 2000 N(c) Tangential stress on net-tension plane with clamping force = 2000 N ................................................................................................ 152
Figure 7.9: Comparison of stress distribution in quasi-isotropic (PQ4 and PQ8) and cross-ply (PX2 and PX4) lay-ups with d = 10 mm at an applied bearing stress of 400 N/mm2 and clamping force = 500 N (a) Radial stress around hole boundary (b) Tangential stress around hole boundary (c) Tangential stress at net-tension plane ............................................................................... 154
Figure 7.10: Comparison of stress distribution in quasi-isotropic and cross-ply lay-ups with d= 10 mm on top and bottom plane at an applied bearing stress of 400 N/mm2 and clamping force = 500 N (a) PQ4, (b) PQ8, (c) PX2, and (d) PX4 ........................................................................ 155
Figure 7.11: Single-Lap joint configuration ...................................................................................... 156
Figure 7.12: Typical load-displacement plot in single-lap joint from current XFEM modelling. ........... 156
Figure 7.13: Damage plot of XFEM results in single-lap joint with respect to load-displacement curve 157
Figure 7.14: Bolt tilting in single-lap joint configuration ................................................................... 158
P a g e | 1
Chapter 1 : Introduction
1.1 Overview
Compared to traditional engineering materials such as steel and concrete, and even in
comparison with the light metals and alloys, composite materials offer excellent specific stiffness
and specific strength properties. This has led to these materials being used increasingly in
structural applications. In the past, as a result of their high cost, the use of composite materials
was confined mainly to aerospace (especially in defence applications) and niche markets, such as
sporting goods. More recently (i.e. over the last 20 years) the cost of the materials and processing
has fallen and as a result composites are used much more widely, including in the commercial
aircraft sector and increasingly in civil engineering applications, where composites are used in
bridge rehabilitation and also as components of bridge structures such as FRP bridge deck and
FRP bridge girders.
There are a wide range of composite materials available to the engineer based on different
materials and reinforcement types. Traditionally laminates are assembled from layers of
unidirectional material (plies) stacked at various orientations to each other to give the necessary
reinforcement in different directions. The engineering properties of the laminate depend on
parameters such as material properties, ply orientations and stacking sequence. As a variant on
unidirectional plies, woven fabric is another important class of reinforcement. It offers cost
saving in manufacturing as one layer of fabric is equivalent to two layers of unidirectional
reinforcement and the woven fabric provides enhancement in some property areas, notably impact
resistance. On the other hand the crimp of the fibres leads to a reduction in some of the primary
properties (notably compression strength) and also contributes to the complex damage that
develops under mechanical loading.
1.2 Open-hole and Joints - a design problem
Composite materials offer a flexibility in processing, which often leads to a reduction in part
count compared to conventional materials. Even so, many structures require joining, either
though mechanical fastening or adhesive bonding. Each of these methods has relative advantages
(and disadvantages), which means that both are likely to remain in use for the foreseeable future.
It is mechanical fastening that will provide the focus for the present work. Mechanically fastened

P a g e | 2
joints are preferred and widely used due to their effectiveness in transferring high loads, the
simplicity of preparation, the ease of disassembly for routine inspection and their insensitivity to
environmental conditions. The major challenge with mechanically fastened joints is that the
introduction of a hole to a composite plate leads to a stress concentration, which cannot be
relieved by plastic flow in the way that is possible in a metallic material. Hence there is a
significant reduction in strength as a result of the stress concentration introduced by any hole or
cut-out. Moreover the way in which damage develops in the composite in the presence of a
stress-raiser is complex and currently there is a lack of design tools to enable engineers to predict
reliably the strength of open-hole or mechanically fastened composites. The bolted joint problem
is a challenging one and in addition to the material properties the response depends on
considerations such as bolt clearance and friction between the bolt and the hole. The problem is
complicated further by the presence of bolt clamping loads which makes the required analysis
intrinsically three-dimensional in nature, at least to some extent. There are various mechanisms
by which a bolted joint can fail; specifically net-tension, shear-out and bearing. The net-tension
failure mode in a bolted joint problem is similar to tensile fracture at an open-hole. In both
situations damage develops at the edge of the hole until a situation is reached at which
catastrophic failure occurs. Hence in order to study bolted joint behaviour, the open-hole plate
subjected to tensile load should be considered first (i.e. the open-hole condition). Predictive
methods for this problem should then in principle be applicable to the prediction of bolted joint
strength in the net-tension failure mode.
1.3 Aim of this work
This project is concerned with strength prediction of open-hole and mechanically fastened
woven composite laminates by implementing fracture mechanics-based material models to be
implemented within a finite element framework. Constitutive models should incorporate explicitly
material parameters that can be obtained from literature or if not available, can be measured
independently from (simple) experiments. A particular aim is to develop a methodology that is
applicable to tensile failure at an open hole and net tension failure in a mechanically fastened
joint.
P a g e | 3
1.4 Structure of this thesis
To achieve the aim indicated in the previous section, the study has been broken down into the
following chapters:
Chapter 2 provides extensive coverage of previous literature that provides the background for
the current research. The first section outlines the basic features and damage behaviour of woven
composite materials that leads to material softening behaviour under load. The next section
concentrates on open-hole woven composites with consideration of experimental observations of
behaviour, the associated stress distribution around the hole and methods of strength prediction.
Several closed form approaches which are used widely in open-hole strength prediction, and
which may be embedded into finite element analysis, are discussed. Further sections discuss
experimental studies of composite bolted joint behaviour and strength prediction techniques, most
of which are based on a finite element modelling framework.
Chapter 3 is concerned with the analysis of open-hole composite plate using the finite
element programme ABAQUS. Stress distributions in a composite plate are presented which
capture the stress concentration that leads to a reduction in strength compared to un-notched
plates. This chapter also develops the physically-based constitutive approaches which will be used
in open-hole plate and bolted joint strength predictions. The cohesive zone model (CZM) and
extended finite element model (XFEM) approaches are implemented in the model to incorporate
traction-separation behaviour of the material to study the structural response. The CZM and
XFEM approaches are discussed and the associated open-hole strength predictions are compared
with literature data for open-hole woven GFRP and CFRP composite plates.
Two-dimensional finite element modelling of bolted joints is discussed in Chapter 4 which
begins by considering the stress distribution along the net-tension plane and around the hole
boundary. A strength prediction model is developed using XFEM with a similar constitutive
model to that used in open hole problem. The models for net-tension failure are then implemented
leading to strength predictions for GFRP bolted joints that can be compared with experimental
results from previous researchers.
Chapter 5 describes an experimental test programme for CFRP woven composite bolted
joints. A test matrix is developed which consists of double-lap joint and single-lap joints with
variations of joint geometries and clamp-up. The experimental results are discussed with regard to
the failure mechanisms and the bearing stress at failure.

P a g e | 4
Three-dimensional modelling of experimental studies of double-lap joints is discussed in
Chapter 6. The implementation in ABAQUS CAE 6.10 is described first, including determination
of out-of-plane properties, modelling stages and techniques to model this joint type for stress
distribution and strength prediction. Stress distributions are compared with analytical equations
and the effect of lay-ups is examined. Strength prediction used a similar constitutive material
model to that used in Chapter 3. The strength prediction is discussed and compared with
experimental data from Chapter 5.
Chapter 7 discusses 3D FEA modelling of the single-lap joint, also tested experimentally as
described in Chapter 5. Due to secondary bending, this joint type exhibited somewhat different
behaviour to the DLJ. Stress distribution in the SLJ is compared with DLJ and the effect of plate
types and thickness is explored. Strength prediction results are shown and discussed in the last
section of this chapter.
Conclusions are presented and recommendations are made for the future work in Chapter 8.
P a g e | 5
Chapter 2 : Literature Review
2.1 Introduction
The current study concentrates on characterising deformation and fracture of woven fabric
composite open-hole plates and bolted joints under quasi-static tensile loading. Both problems are
associated with the effect of stress concentration in the vicinity of the hole edge. Most of the
current strength prediction approaches are problem-specific, and a simple approach for generic
problems would be beneficial. This study also includes the effects of the problem parameters in
open-hole plates (woven fabric system, hole size, lay-up thickness) and bolted joints (joint
geometries, lap joint type, bolt loads). A range of related topics will be addressed in the following
sections in this chapter.
This chapter starts by describing the general features and behaviour of woven composites
under tensile loading including unit cell approaches, damage behaviour and property degradation.
The next section discusses the behaviour of open-hole woven plates including experimental
observations, FE stress analysis and the closed-form methods available to predict open-hole
strength. This is followed by a review of the bolted joints problem, covering experimental
observations, stress analysis, and strength prediction with associated joint variables (such as
friction, pre-load etc.). Concluding remarks are summarized in final section and used as a
framework for the present study.
2.2 Woven Composites
2.2.1 Basic Features and Physical Modelling of Woven Composites
The available range of woven materials, particularly CFRP and GFRP, show increased usage
in various sectors. Woven fabrics are hierarchically structured fibrous materials consisting of
several basic unit of long filament strands called yarn. Each yarn comprises many loose
unidirectional fibres and rows of yarn are arranged orthogonally in warp and weft direction to
form the woven fabric. Further description concentrates on balanced 2-D woven fabrics. This
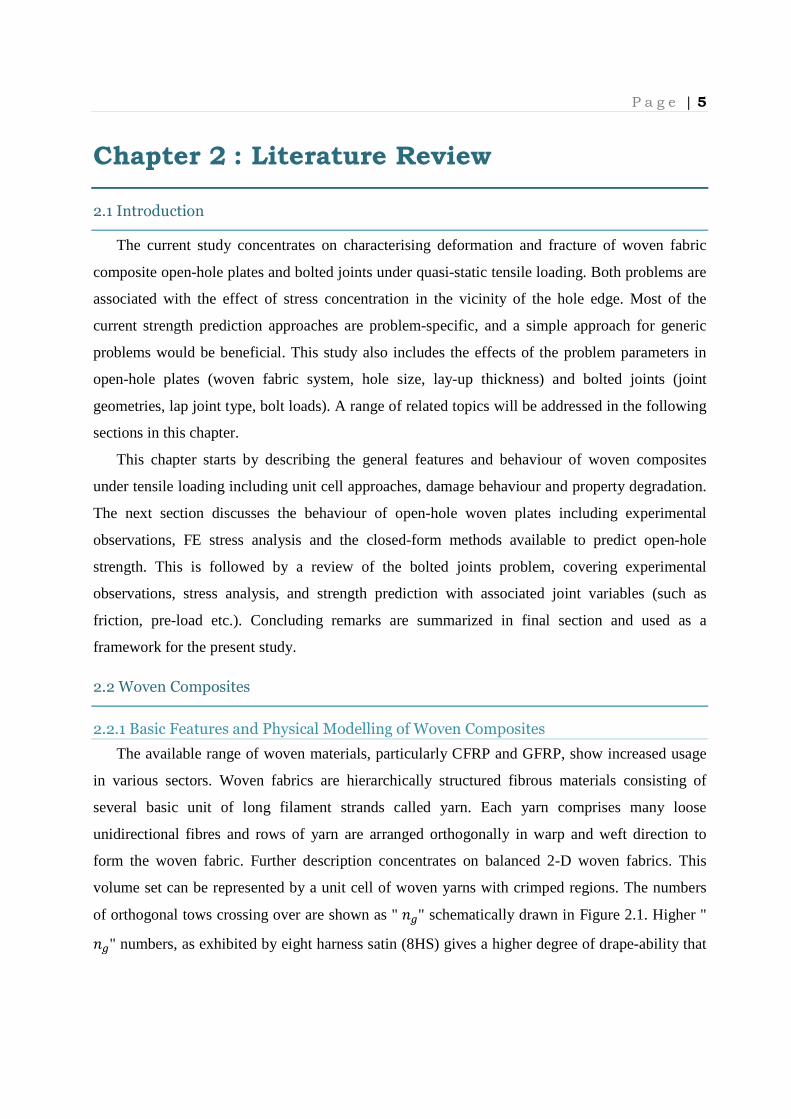
volume set can be represented by a unit cell of woven yarns with crimped regions. The numbers
of orthogonal tows crossing over are shown as " ;=" schematically drawn in Figure 2.1. Higher " ;=" numbers, as exhibited by eight harness satin (8HS) gives a higher degree of drape-ability that
P a g e | 6
is easier to form into complex shapes but reduces stability during manufacturing. A larger volume
of crimp regions are associated with strength and modulus reduction but nesting of the woven
fabric within the "crimp" region improves the impact resistance of the materials. Fibre volume
fractions of plain weave (PW) are generally slightly higher than five harness satin (5HS) for
identical reinforcement layers due to a tighter nesting and this may result in increased strength as
shown by Belmonte et. al. (2004).
(a) plain weave, ;= = 2 (b) twill weave, ;= = 3 (c) Eight harness satin weave, ;= = 8
Figure 2.1: Unit cell of different woven fabric types
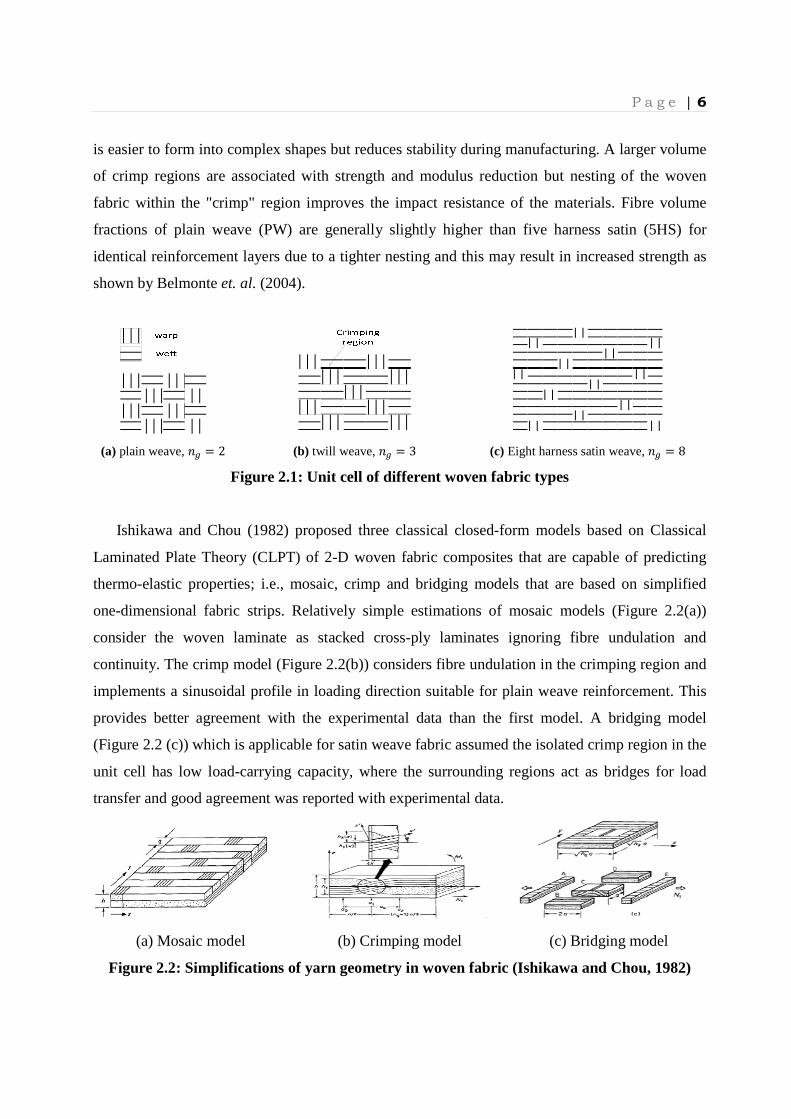
Ishikawa and Chou (1982) proposed three classical closed-form models based on Classical
Laminated Plate Theory (CLPT) of 2-D woven fabric composites that are capable of predicting
thermo-elastic properties; i.e., mosaic, crimp and bridging models that are based on simplified
one-dimensional fabric strips. Relatively simple estimations of mosaic models (Figure 2.2(a))
consider the woven laminate as stacked cross-ply laminates ignoring fibre undulation and
continuity. The crimp model (Figure 2.2(b)) considers fibre undulation in the crimping region and
implements a sinusoidal profile in loading direction suitable for plain weave reinforcement. This
provides better agreement with the experimental data than the first model. A bridging model
(Figure 2.2 (c)) which is applicable for satin weave fabric assumed the isolated crimp region in the
unit cell has low load-carrying capacity, where the surrounding regions act as bridges for load
transfer and good agreement was reported with experimental data.
(a) Mosaic model (b) Crimping model (c) Bridging model
Figure 2.2: Simplifications of yarn geometry in woven fabric (Ishikawa and Chou, 1982)
P a g e | 7
The complicated shapes and architectures of textile composites drive many researchers to
propose a diversity of geometric models in order to predict the effective strengths and stiffness of
woven composites. 2-D analytical and FEA models have been reported to predict mechanical
properties of 2-D woven fabric composites. Naik and Ganesh (1992) improved the Chou and
Ishikawa (1982) model prediction for plain weave fabric composites by considering undulations.
The unit cell is represented by a quarter of the interlaced repeating unit cell (RUC) of a plain
weave fabric that leads to the assumption of the undulation region as a circular or sinusoidal yarn
path as shown in Figure 2.3(a). Two models were proposed known as the slice array model and
the element array model. These gave good prediction of in-plane thermo-elastic properties,
however substantial analytical description of complicated yarn architectural features requires
substantial calculation. Naik and Ganesh (1995) then improved their earlier model by modelling
the unit cell as an asymmetric three layer cross-ply laminate that consists of pure matrix, warp
tows and weft tows. The unit cell is not sub-divided into smaller elements and the local reduced
compliance constants are averaged over the length of the tow to determine the effective tow
compliance, and then the thermo-elastic properties of the idealised cross-ply laminate are
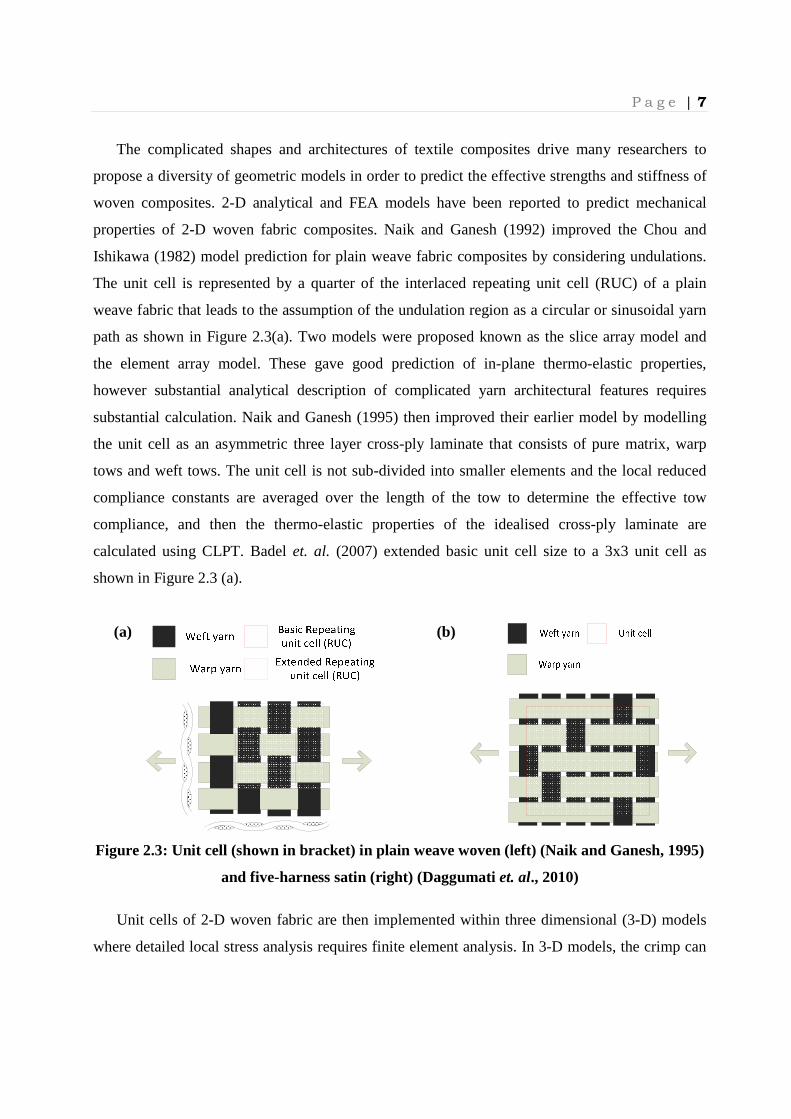
calculated using CLPT. Badel et. al. (2007) extended basic unit cell size to a 3x3 unit cell as
shown in Figure 2.3 (a).
(a)
(b)
Figure 2.3: Unit cell (shown in bracket) in plain weave woven (left) (Naik and Ganesh, 1995)
and five-harness satin (right) (Daggumati et. al., 2010)
Unit cells of 2-D woven fabric are then implemented within three dimensional (3-D) models
where detailed local stress analysis requires finite element analysis. In 3-D models, the crimp can
P a g e | 8
be modelled through angular yarn path and smooth curve can be represented in a more realistic
manner. Tan (1999) created two models, a FEA model (sinusoidal yarn model) and an analytical
model (sinusoidal beam model) to predict elastic constants and failure strength of plain weave
composites respectively. He concluded that by investigating major geometry variables in
T300/934 plain weave composites under tensile loading, failure strengths are closely dependent to
fibre volume fraction of a yarn and mechanical properties correspond with the overall fibre
volume fraction of the composites.
The above studies concentrate on single unit cells in FEA simulations to represent whole
stress field in the composite, but tend to ignore parameters such as fibre orientation, localised fibre
spacing and packing that may show localised stressed micro-volumes. LePage (2004) developed
2-D plane strain FEA models in plain weave woven fabric with in-phase, out-of-phase and
staggered nested unit cell models where relative layer shifts and laminate thickness have an
insignificant effect upon stiffness but larger effect on energy release rates due to matrix cracking.
Out-of-phase geometry of symmetric plain weave with cracks gave values of fracture energies
close to the equivalent cross-ply laminates with cracks while other geometries gave values up to
40% higher. They also found that crack formation occurred at lower strains, were more significant
in thin laminates associated with local bending and that the energy release rate increased with the
degree of bending.
Agreement between an FEA model (based on unit cell) and experiment for the local strain
profile is challenging, particularly in the undulating crimp region. The local strain profiles are
sensitive to the geometrical unit cell model and applied boundary conditions. Ivanov (2010) found
different stress distributions between outer layer and inner layers, and that the local strain profile
in a unit cell relies on yarn placement, the number of plies in the laminate and the stacking
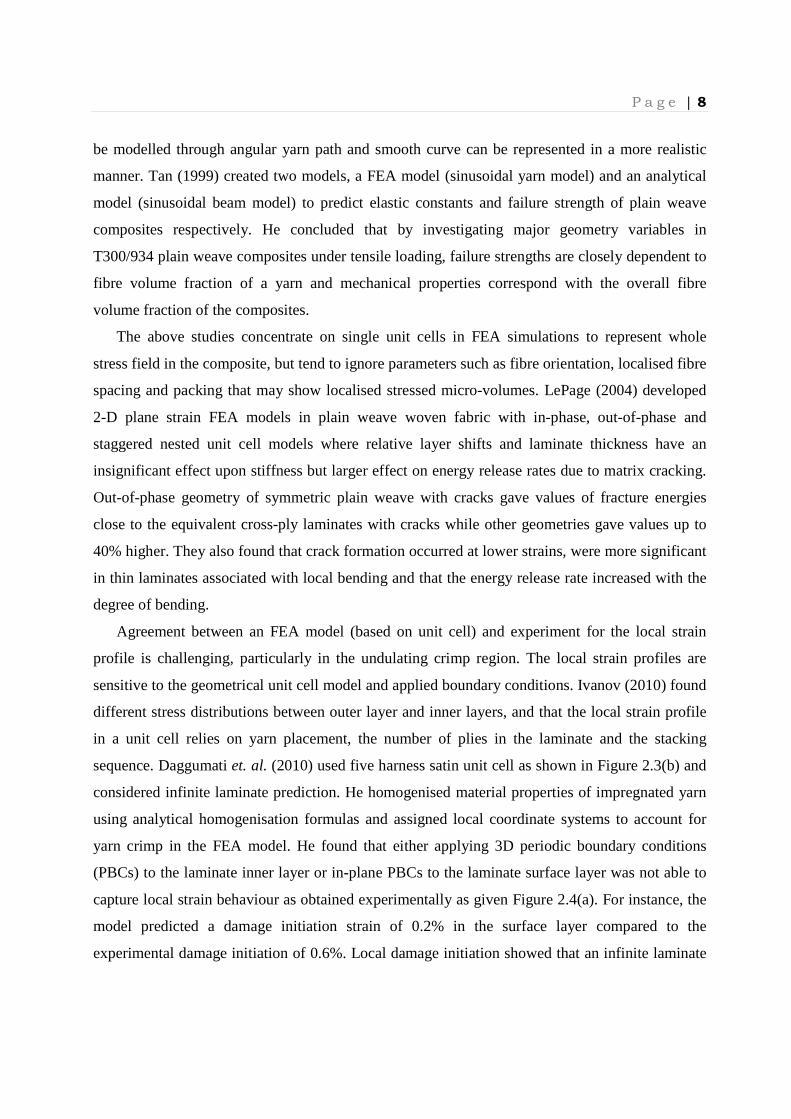
sequence. Daggumati et. al. (2010) used five harness satin unit cell as shown in Figure 2.3(b) and
considered infinite laminate prediction. He homogenised material properties of impregnated yarn
using analytical homogenisation formulas and assigned local coordinate systems to account for
yarn crimp in the FEA model. He found that either applying 3D periodic boundary conditions
(PBCs) to the laminate inner layer or in-plane PBCs to the laminate surface layer was not able to
capture local strain behaviour as obtained experimentally as given Figure 2.4(a). For instance, the
model predicted a damage initiation strain of 0.2% in the surface layer compared to the
experimental damage initiation of 0.6%. Local damage initiation showed that an infinite laminate
P a g e | 9
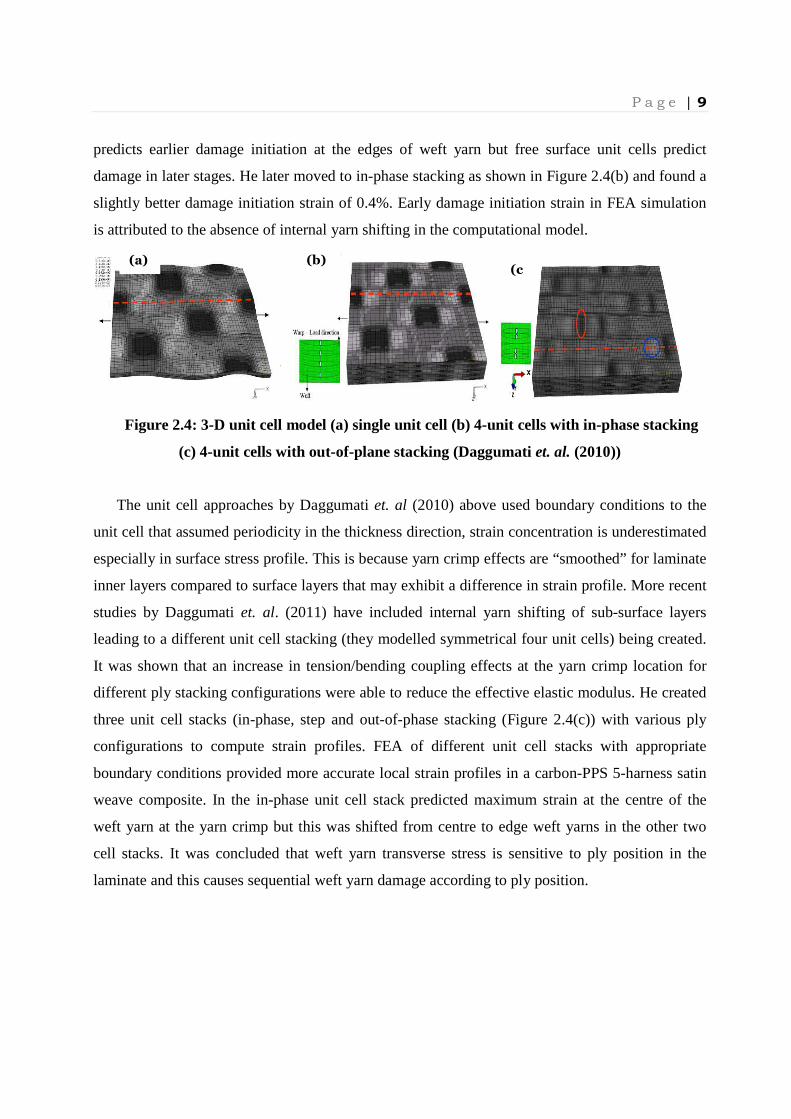
predicts earlier damage initiation at the edges of weft yarn but free surface unit cells predict
damage in later stages. He later moved to in-phase stacking as shown in Figure 2.4(b) and found a
slightly better damage initiation strain of 0.4%. Early damage initiation strain in FEA simulation
is attributed to the absence of internal yarn shifting in the computational model.
Figure 2.4: 3-D unit cell model (a) single unit cell (b) 4-unit cells with in-phase stacking
(c) 4-unit cells with out-of-plane stacking (Daggumati et. al. (2010))
The unit cell approaches by Daggumati et. al (2010) above used boundary conditions to the
unit cell that assumed periodicity in the thickness direction, strain concentration is underestimated
especially in surface stress profile. This is because yarn crimp effects are “smoothed” for laminate
inner layers compared to surface layers that may exhibit a difference in strain profile. More recent
studies by Daggumati et. al. (2011) have included internal yarn shifting of sub-surface layers
leading to a different unit cell stacking (they modelled symmetrical four unit cells) being created.
It was shown that an increase in tension/bending coupling effects at the yarn crimp location for
different ply stacking configurations were able to reduce the effective elastic modulus. He created
three unit cell stacks (in-phase, step and out-of-phase stacking (Figure 2.4(c)) with various ply
configurations to compute strain profiles. FEA of different unit cell stacks with appropriate
boundary conditions provided more accurate local strain profiles in a carbon-PPS 5-harness satin
weave composite. In the in-phase unit cell stack predicted maximum strain at the centre of the
weft yarn at the yarn crimp but this was shifted from centre to edge weft yarns in the other two
cell stacks. It was concluded that weft yarn transverse stress is sensitive to ply position in the
laminate and this causes sequential weft yarn damage according to ply position.
(a) (b) (c)

P a g e | 10
2.2.2 Damage Mechanisms and Elastic Degradation
Generally, composite materials exhibit brittle behaviour with little or no plastic deformation to
failure when subjected to tensile load. Woven composites are inherently weaker than non-woven
counterparts due to the crimping region producing lower strength and stiffness in the tensile
characteristics. On the other hand, compressive behaviour of woven composite is superior to non-
woven counterparts because a fabric can nest into adjacent fabrics so restraining delamination.
The damage accumulation process in fabric composites system is complicated, progressing from
micro-scale, meso-scale (ply-level) and macro-scale level (laminate level). Micro-scale
development initiates from fibre-matrix debonding (Figure 2.5(a)), matrix cracking and fibre
failure at the micro-scale. At ply-level, damage develops by intra-yarn cracking (Figure 2.5(b))
and delamination and depends on geometrical parameters such as yarn crimp and variation in
intra-yarn volume fraction. Lastly at the laminate scale, dense cracking (Figure 2.5(c)), interaction
of several small cracks and fibre rupture occurred depending on the different yarn nesting
patterns. The nesting conditions of the particular laminate are defined by random shifting of its
layer during the manufacturing process.
(a) Micro-level (b) Meso-level (c) Macro-level
Figure 2.5: Damage observations in satin weave carbon-PPS thermoplastic composite
(after Daggumati et. al., 2010)
There are two ways of damage modelling in woven fabric associated with the unit cell
approach. The first approach is a micromechanical approach, in which the crack (or a few cracks)
is introduced in the laminate. The crack location is determined by experimental observations or
failure stress criterion in un-cracked bodies using an FEA model. Next, the stress (or strain) field
in cracked lamina is required and simplified analysis is usually used, e.g., shear-lag based method.

P a g e | 11
Elastic degradation models for woven composite materials were studied by Gao et. al. (1999a,
1999b) who characterised damage development in eight harness satin woven CFRP composites.
The damage observed experimentally consisted of transverse matrix cracking, delaminations and
longitudinal splitting. Transverse matrix cracking was initiated at low strain levels leading to short
cracks spanning the fibre tow width and growing to the full coupon width at higher strain levels.
Delaminations were observed at higher strain levels at the intersection of transverse matrix cracks
and crimp regions of longitudinal tows and nearly half of the crimp regions exhibited
delaminations at failure. The longitudinal splits developed shortly after initiation of transverse
matrix cracking and almost always corresponded to the length of the fabric inter-crimp distance.
In a subsequent paper, Gao et. al. (1999b) extended their experimental observations to model
the effect of damage on macro-mechanical properties. Associated integration of weave patterns,
tow architectures and laminate configurations led to complicated range of damage morphologies.
The effect of mechanical degradation on laminate properties for two, four and six layer woven
carbon/epoxy laminates was investigated by (Gao et. al. 1999b). About 5% stiffness reduction
prior to failure in two layer laminates due to matrix cracking and delaminations was observed.
The stiffness degradation was modelled using a shear-lag approach based on an equivalent cross-
ply laminate. For the two layer laminate the crimp region was modelled and an associated
delamination was simulated by decoupling the interface between the warp and weft tows in the
region. The prediction of modulus of elasticity reduction for the two layer laminate was
satisfactory, but the models for the thicker laminates tended to over-predict the reduction in
Young's modulus. Normalised Poisson's ratio and cumulative residual strain were predicted with
increasing crack density, showing the trends satisfactorily. The normalised modulus, Poisson's
ratio and cumulative residual strain for two-layer laminates are shown in Figure 2.6. The value of
the shear lag parameter α depends on the detailed assumptions made in the shear-lag analysis and
is usually taken to be between 1 (assumption of a linear variation in the longitudinal displacement
in the transverse ply) and 3 (arising from a parabolic variation of these displacements). The shear-
lag models proved to provide reasonable prediction of degraded stiffness. These models do
require a dependence of crack density on applied strain to be known.

P a g e | 12
Figure 2.6: Normalized modulus, Poisson's ratio and cumulative residual strain for 2-layer
eight harness satin CFRP woven composite.
Another approach called damage mechanics is based on damage variables without introducing
cracks directly into the mesh, uses well established failure criteria and simple strength tests of
unidirectional composites as an input data. This approach is used in textile composites as reported
by Lomov et. al. (2007) and Zako et. al. (2003). Their damage mechanics formulation enables the
simulation of mechanical behaviour after the occurrence of damage based on damage modes and
loading conditions. The model was implemented in meso-FEA modelling in following steps: (1)
choice of the damage initiation criteria and damage indices, 0� where i = 1, 2, 3, (2) formulation
for stiffness degradation in the damaged elements; and (3) elastic equation in new global stiffness
matrix without increased applied displacement and calculation in redistributed stresses after
damage. Steps (1)-(3) are repeated until no damaged elements are detected. Then apply the next
displacement increment.
Table 2.1: Damage model for fibre bundle and matrix (after Lomov et. al. (2007))
Damage mode Anisotropic damage model for fibre bundle Isotropic damage model for matrix
Mode 1 Mode 2 & 12 Mode 3 & 31 Mode 23
Stress index 0� = Z��J�J� 0� = Z��K�K�
or 0�� =kb��D��l�
0m = Zm�L�L�
or 0m� =kbm�Dm�l�
0�m = kb�mD�ml�
n�� 0 00 �� 00 0 �mo n1 0 00 0 00 0 0o n0 0 00 1 00 0 0o n0 0 00 0 00 0 1o n0 0 00 1 00 0 1o n1 0 00 1 00 0 1o
0.9
0.92
0.94
0.96
0.98
1
1.02
0 0.5 1 1.5
No
rma
lise
d m
od
ulu
s, E
/E0
Crack density per layer, 1/mm
alpha =1
alpha = 3
0.60
0.70
0.80
0.90
1.00
1.10
0 0.5 1 1.5
No
rma
lise
d P
ois
son
's r
ati
o,
v1
2(s
)/v
12
Crack density per layer, 1/mm
alpha=1
alpha = 3
0
100
200
300
400
500
0 1
Cu
mu
lati
ve
re
sid
ua
l str
ain
,
εR
mic
ro-s
tra
in
Crack density per layer, 1/mm
alpha = 1
alpha = 3

P a g e | 13
Damage initiation criteria applied at the micro-level by Lomov et. al. (2007) in SACOM
software was the Hoffman’s (2007) failure criteria. The indication of damage mode is given by
the principal coordinates of orthotropic material, 1, 2 and 3, as shown in Table 2.1. Mode 1
represents the fibre breaking, 2 represents transverse cracking and 3 shear cracking. Damage in
one of the modes is assumed to occur when the stress index, 0. indicated in Table 2.1 equal to 1.
The parametersJ� , J� , K� , K� , and D indicate longitudinal tensile, longitudinal compressive,
transverse tensile, transverse compressive and shear strengths, defined experimentally for
unidirectional reinforced composites. The constitutive equation for damaged composite materials
can be written in matrix form as:
pqrqs Z�Z�Zmb�mbm�b��tqu
qv =wxxxxxy��C�� ��C�� m�C�m��C�� �mC�mm�Cmm
0 0 00 0 00 0 0z{:. �mC}} 0 0m�C~~ 0��C����
�����pqrqs O�O�OmR�mRm�R��tqu
qv
(2.1)
where the parameters, � are defined as follows:
� � = 1 − ��, � = 1 − ��, m = 1 − �m�m = k 2�m� + ml� , m� = k 2m�m + �l� , �� = k 2��� + �l��
(2.2)
2.3 Composite Laminates Containing an Open-hole
2.3.1 Introduction
Advances in computing technology reduce the amount of time-consuming and labour-
intensive laboratory work that is required. The optimum potential of composite materials used as a
structural member can be achieved by developing suitable methods for integrating stress analysis
and failure predictions. In this respect, closed-form approaches were reported in earlier literatures
with various degrees of simplicity and prediction accuracy. More recently, most analyses are
implemented within a FEA framework as a result of computer technology advancements. This
section starts by looking at damage observation in open-hole woven fabric systems. It is important
to characterise the damage event prior to ultimate failure, to produce a more reliable and
physically-based model. Stress distribution of open-hole plates, prone to exhibit stress raisers at

P a g e | 14
the hole edge, is discussed next. Lastly, various strength prediction approaches are presented that
have been implemented for the open-hole problem, including semi-empirical analysis using a
characteristic distance approach, homogeneous anisotropic properties with a known damage
length and a fracture mechanics approach, and progressive damage analysis based on a ply-by-ply
basis approach.
2.3.2 Experimental Observation of Damage in Open-hole Woven Composites
In this section, the essential behaviour of open-hole woven composite plates subjected to
tension loading is described. This is used as a framework to produce a closed-form solution for
predicting the open-hole strength of composite plates. Manger (1999) conducted experimental
work for cross-ply GFRP plain weave (PW) and eight harness satin weave (8HS) composites with
circular holes. From his observations just prior to laminate failure, he found a dense damage zone
at the hole edge perpendicular to the load direction associated predominately with fibre failure
(although not extending the full length of the damage zone), delamination, transverse matrix
cracking and longitudinal splitting. As shown in Figure 2.7 for an 8-layer laminate containing a
2.5 mm hole diameter, the dominant damage zone was approximately 1mm long showing tow
failures in most layers (Figure 2.8). Damage zones depend upon several factors such as
reinforcement type, hole shape and size, and the number of fabric layers. Manger (1999) found
that in PW laminates, damage zones were longer and narrower compared to identical thickness of
8HS weave laminates. Damage initiation and propagation is largely affected by the crimp region
in woven composites. The crack-like damage zones in PW laminates contributed to the tendency
of tow fractures to propagate directly along regular arrays of tow crimp fabric. The amount of
fabric layers exhibited an insignificant effect compared to weave architecture. However, an 8-
layer PW coupons exhibited a lower strength compared to 2-layer samples for all hole sizes.
Figure 2.7: Hole edge plain view in 8 layers 8HS weave with 2.5 mm circular hole
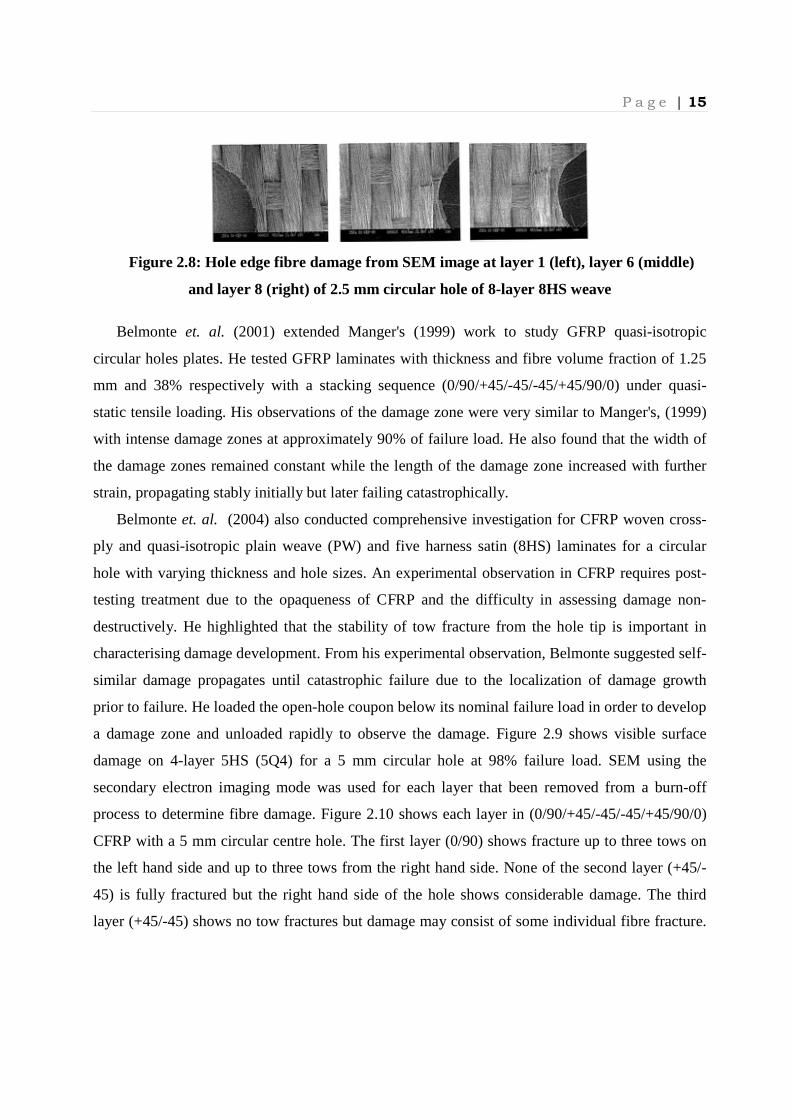
P a g e | 15
Figure 2.8: Hole edge fibre damage from SEM image at layer 1 (left), layer 6 (middle)
and layer 8 (right) of 2.5 mm circular hole of 8-layer 8HS weave
Belmonte et. al. (2001) extended Manger's (1999) work to study GFRP quasi-isotropic
circular holes plates. He tested GFRP laminates with thickness and fibre volume fraction of 1.25
mm and 38% respectively with a stacking sequence (0/90/+45/-45/-45/+45/90/0) under quasi-
static tensile loading. His observations of the damage zone were very similar to Manger's, (1999)
with intense damage zones at approximately 90% of failure load. He also found that the width of
the damage zones remained constant while the length of the damage zone increased with further
strain, propagating stably initially but later failing catastrophically.
Belmonte et. al. (2004) also conducted comprehensive investigation for CFRP woven cross-
ply and quasi-isotropic plain weave (PW) and five harness satin (8HS) laminates for a circular
hole with varying thickness and hole sizes. An experimental observation in CFRP requires post-
testing treatment due to the opaqueness of CFRP and the difficulty in assessing damage non-
destructively. He highlighted that the stability of tow fracture from the hole tip is important in
characterising damage development. From his experimental observation, Belmonte suggested self-
similar damage propagates until catastrophic failure due to the localization of damage growth
prior to failure. He loaded the open-hole coupon below its nominal failure load in order to develop
a damage zone and unloaded rapidly to observe the damage. Figure 2.9 shows visible surface
damage on 4-layer 5HS (5Q4) for a 5 mm circular hole at 98% failure load. SEM using the
secondary electron imaging mode was used for each layer that been removed from a burn-off
process to determine fibre damage. Figure 2.10 shows each layer in (0/90/+45/-45/-45/+45/90/0)
CFRP with a 5 mm circular centre hole. The first layer (0/90) shows fracture up to three tows on
the left hand side and up to three tows from the right hand side. None of the second layer (+45/-
45) is fully fractured but the right hand side of the hole shows considerable damage. The third
layer (+45/-45) shows no tow fractures but damage may consist of some individual fibre fracture.

P a g e | 16
The fourth layer (0/90) shows no fracture on the left side but fibre splitting of three tows away
from the hole edge at the right side.
Figure 2.9: Both side of sample 5Q4 at 98% failure load (198 MPa) (after Belmonte et.
al., 2004)
first layer (0/90) second layer (+45/-45)
left hand side right hand side left hand side right hand side
third layer (+45/-45) fourth layer (0/90)
left hand side right hand side left hand side right hand side
Figure 2.10: Damage observation at hole edge of 5 mm diameter hole size using secondary
electron micrograph in each layer.
From Manger (1999) and Belmonte et. al. (2001, 2004) work, the mechanism of damage
growth at stress raisers (the circular centre hole) is similar in quasi-isotropic and cross-ply GFRP
and CFRP woven fabric lay-ups, with matrix cracking preceding the formation of an intense
damage zone containing tow fracture, together with a limited amount of splitting (especially in the
cross-ply lay-up) and delamination.
2.3.3 Stress Distribution and Notch Sensitivity in Open Hole Laminate Plates
Failure in a composite plate containing a stress raiser is an area of research that has been
studied extensively for more than 40 years. In composite plates without any cut-out or holes, the
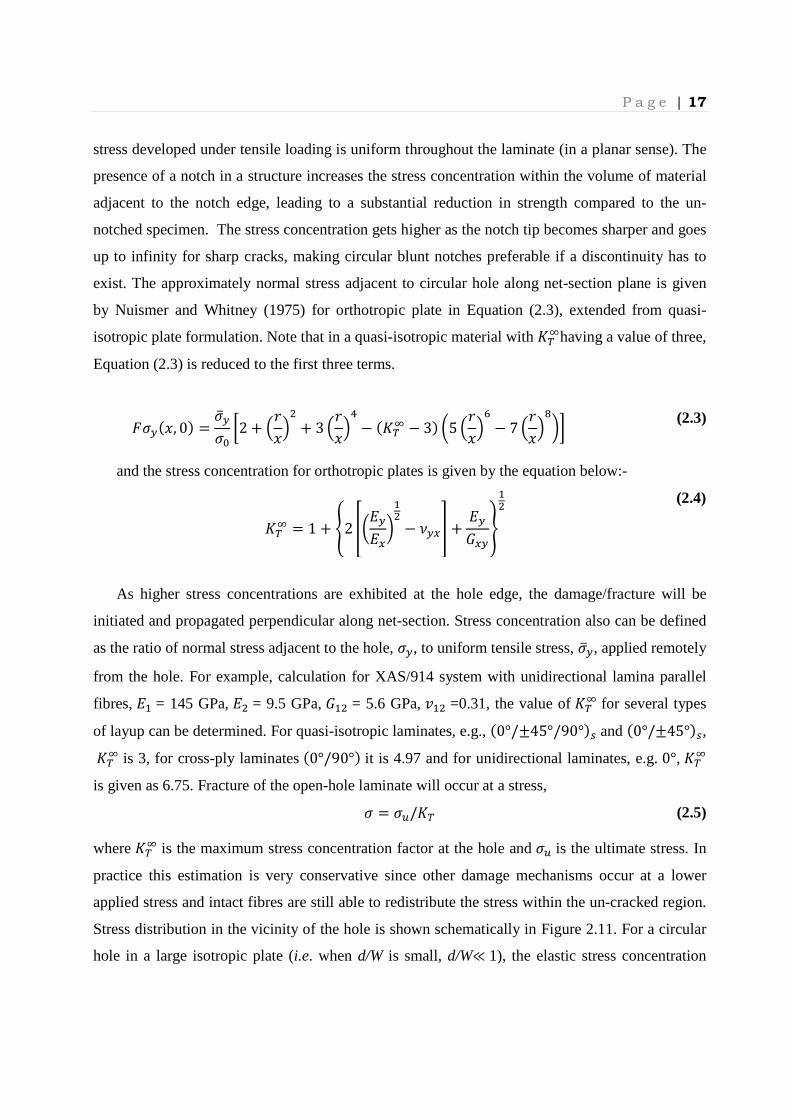
P a g e | 17
stress developed under tensile loading is uniform throughout the laminate (in a planar sense). The
presence of a notch in a structure increases the stress concentration within the volume of material
adjacent to the notch edge, leading to a substantial reduction in strength compared to the un-
notched specimen. The stress concentration gets higher as the notch tip becomes sharper and goes
up to infinity for sharp cracks, making circular blunt notches preferable if a discontinuity has to
exist. The approximately normal stress adjacent to circular hole along net-section plane is given
by Nuismer and Whitney (1975) for orthotropic plate in Equation (2.3), extended from quasi-
isotropic plate formulation. Note that in a quasi-isotropic material with 45�having a value of three,
Equation (2.3) is reduced to the first three terms.
�Z`(*, 0) = Z<̀Z� �2 + �2*�� + 3 �2*�} − (45� − 3) k5 �2*�� − 7 �2*��l� (2.3)
and the stress concentration for orthotropic plates is given by the equation below:-
45� = 1 + �2 �k�`�.l�� − W`.� + �`,.`���
(2.4)
As higher stress concentrations are exhibited at the hole edge, the damage/fracture will be
initiated and propagated perpendicular along net-section. Stress concentration also can be defined
as the ratio of normal stress adjacent to the hole, Z`, to uniform tensile stress, Z<̀ , applied remotely
from the hole. For example, calculation for XAS/914 system with unidirectional lamina parallel
fibres, �� = 145 GPa, �� = 9.5 GPa, ,�� = 5.6 GPa, X�� =0.31, the value of 45� for several types
of layup can be determined. For quasi-isotropic laminates, e.g., (0°/±45°/90°)� and (0°/±45°)�, 45� is 3, for cross-ply laminates (0°/90°) it is 4.97 and for unidirectional laminates, e.g. 0°, 45�
is given as 6.75. Fracture of the open-hole laminate will occur at a stress,
Z = Z�/45
(2.5)
where 45� is the maximum stress concentration factor at the hole and Z� is the ultimate stress. In
practice this estimation is very conservative since other damage mechanisms occur at a lower
applied stress and intact fibres are still able to redistribute the stress within the un-cracked region.
Stress distribution in the vicinity of the hole is shown schematically in Figure 2.11. For a circular
hole in a large isotropic plate (i.e. when d/W is small, d/W≪ 1), the elastic stress concentration
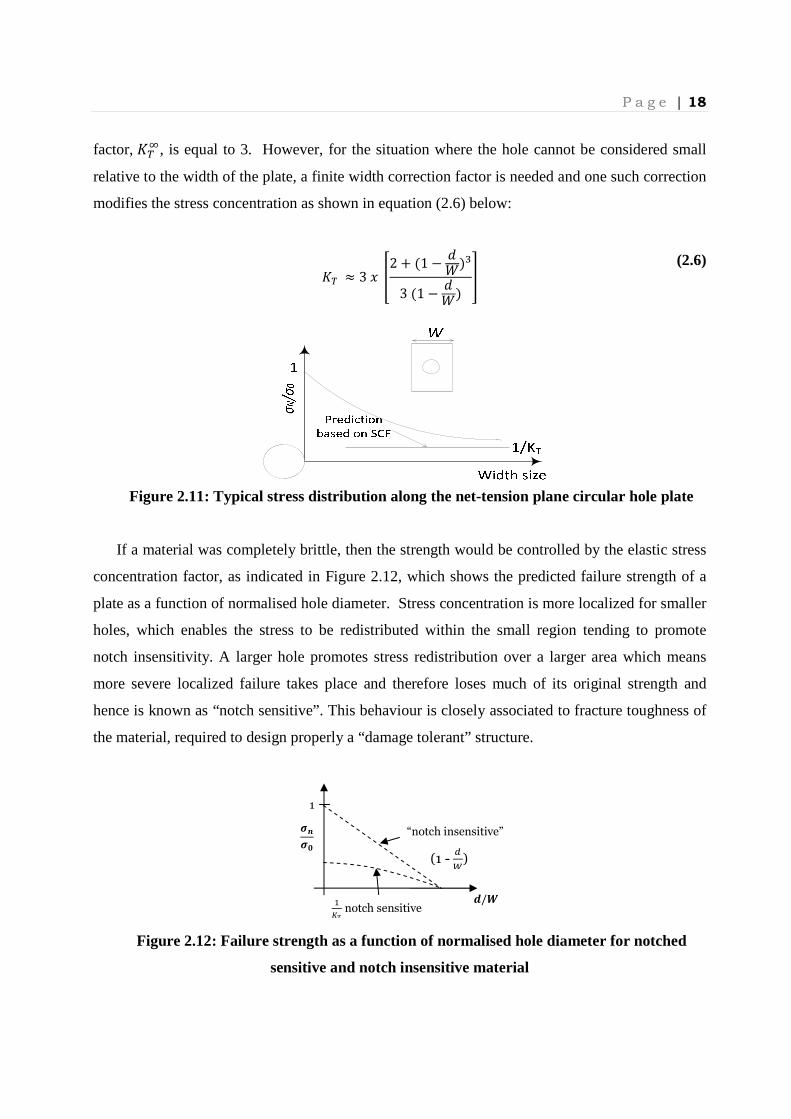
P a g e | 18
factor, 45�, is equal to 3. However, for the situation where the hole cannot be considered small
relative to the width of the plate, a finite width correction factor is needed and one such correction
modifies the stress concentration as shown in equation (2.6) below:
45 ≈ 3* �2 + (1 − H)m3(1 − H) �
(2.6)
Figure 2.11: Typical stress distribution along the net-tension plane circular hole plate
If a material was completely brittle, then the strength would be controlled by the elastic stress
concentration factor, as indicated in Figure 2.12, which shows the predicted failure strength of a
plate as a function of normalised hole diameter. Stress concentration is more localized for smaller
holes, which enables the stress to be redistributed within the small region tending to promote
notch insensitivity. A larger hole promotes stress redistribution over a larger area which means
more severe localized failure takes place and therefore loses much of its original strength and
hence is known as “notch sensitive”. This behaviour is closely associated to fracture toughness of
the material, required to design properly a “damage tolerant” structure.
Figure 2.12: Failure strength as a function of normalised hole diameter for notched
sensitive and notch insensitive material
�/�
1
“notch insensitive”
��� notch sensitive
����
(1 - ��)

P a g e | 19
Fabric laminates tend to be more resistant to splitting and delamination than their counterpart
unidirectional tape laminates (Curtis and Bishop (1984) and Lagace (1986)). The laminate
splitting in unidirectional prepreg is caused by low transverse strength, while delamination occurs
due to mismatch in both Poisson’s ratio and shear coupling. In balanced woven laminates, these
damage mechanisms are naturally restrained due to woven artichectures where crimped fibres
prevent a crack in the matrix from propagating. Curtis and Bishop (1984) demonstrated woven
(0,90) and (0,90,±45) lay-up were slightly more notch-sensitive than similar non-woven lay-ups.
Lower strength in (0,90) woven material is due to the absence of stress relieving and energy-
absorbing mechanisms at the hole tip (and tendency for tow fractures at crimps). For non-woven
counterparts, it has been shown that the failure stress of open-hole specimens is greater for thicker
layers because increased delamination allows more 0º shear cracking. This effect was not seen for
(0,90) woven material because delamination between 0º and 90º layers and shear cracking is
restricted to the undistorted length in the weave. This leads to the fact the woven fabrics exhibited
smaller damage zone prior to failures and reduced fracture energy properties. On the other hand,
(±45) lay-ups were effectively notch-insensitive to both open-hole woven and non-woven
laminates. 45º cracking would be limited mainly to the undistorted length of the weave, and this
slightly reduced stress concentration intensity. It is expected that quasi-isotropic lay-ups show
lower stress concentration than cross-ply lay-ups. Lagace (1986) tested graphite/epoxy fabric
laminates and graphite/epoxy tape laminates of similar configuration in static tension and found
similar notch sensitivity are obtained. He suggested that the method to correlate and predict tensile
open-hole fracture for tape laminate can also be used for fabric laminates. Although splitting is
able to redistribute stress and increase material fracture energies (Harris and Morris (1986)), it can
degrades the fracture strength, leading to catastrophic failures.
2.3.4 Strength Prediction Approaches in Open-Hole Laminate Plates
Several analytical approaches have been proposed by previous researchers and can be largely
divided into linear elastic fracture mechanics (LEFM), stress-distribution based characteristic
distance, fracture mechanics-based characteristic distance, and damage-based models. In general,
most of these approaches consider a small region in the vicinity of the hole edge where local
damage takes place prior to catastrophic failure as observed experimentally (Manger (1999) and
Belmonte et. al. (2001, 2004)). Closed form formulations prior to 1985 are extensively reviewed
by Aberwuch and Madhukar (1985).

P a g e | 20
2.3.4.1 Classical LEFM-based semi-empirical characteristic distance
The earliest semi-empirical fracture model, based on LEFM was developed by Waddoups,
Eishmann and Kaminski (1971) to extend their applications from metal to composites containing
open-hole, also known as “Inherent flaw model”. It is assumed that inherent flaws exists in the
material at the hole edge and these are treated as a material property (effective flaw length), �� .
Irwin (1948) correlated the relationship between material toughness, ,� , and stress intensity
factor, 4�, for an isotropic circular hole expressed in equations (2.7). Later, Paris and Sih (1965)
took the characteristic distance, ��, of the high energy region in a function � �B � � at the hole edge
as shown in Figure 2.11 to produce the relationship given in equation (2.8).
Figure 2.13: High damage intensity at hole edge
,� = (1 − W)¡2, 4�� = (1 − W)¡� 4�� (2.7)
4� = Z`<<<¢¡��� ���2 �
(2.8)
where ,, W, 2 and Z<̀ are the shear modulus, Poisson ratio, hole radius and remote applied stress
respectively. Combining Equation (2.7) and (2.8) with the assumption that 2 ≫ �� gave the
equation (2.9). Semi-empirical constant, ��, varies with hole radius but good agreement between
predicted and experimental open-hole strength was achieved. However, ��is not a true material
property but depends on lay-up and cannot represent different forms of damage at the crack tip.
Z�Z`<<< = � ���2 � (2.9)
Later researchers highlighted the restriction of application of LEFM due to the majority of
failures in composite does not exhibited self-similar damage growth. However, for simplicity in
�� intense energy region
Z`<<<
Z`<<<

P a g e | 21
open-hole problems at the laminate level, dense damage event at the edge of stress concentration
region can be smeared throughout the thickness.
2.3.4.2 Stress Distribution based Semi-empirical Characteristic distance
This characteristic distance approach, introduced by Whitney and Nuismer (1974) uses the
stress distribution to predict the tensile open-hole strength of composite lay-up containing a
through thickness hole. They proposed two criteria; Point Stress Criterion (PSC) and Average
Stress Criterion (ASC) which hypothesises that laminate failure occurs when the stress at
characteristic (damage zone) distance from the hole edge reaches the un-notched laminate
strength. Both models requires the knowledge of characteristic distance parameters � or ��
(determined experimentally), the un-notched strength, Z� and normal stress distribution, Z`, in the
vicinity of the hole edge.
Figure 2.14: Whitney-Nuismer (1974) semi-empirical criterion
The Point Stress Criterion (PSC) assumes that failure occurs when the stress at some distance �from the hole edge reaches the un-notched strength of the laminate, shown schematically in
Figure 2.14. The parameter �was said to represent the distance over which the material must be
critically stressed to encounter a sufficiently large flaw to initiate failure. Therefore, the PSC
expression for the open-hole strength of an isotropic plate is given as:
Z_�Z� = 2k2 + ( 22 + �)� + 3 � 22 + ��}l (2.10)
where Z_�and Z�are the open-hole laminate plate and un-notched laminate strengths respectively.
For an orthotropic plate, PSC becomes: Z_�Z� = 2
¤2 + � 22 + ��� + 3 � 22 + ��} − (45� − 3) k5 � 22 + ��� − 7 � 22 + ���l¥ (2.11)
�
σ
r
Z`
Z�
�� x
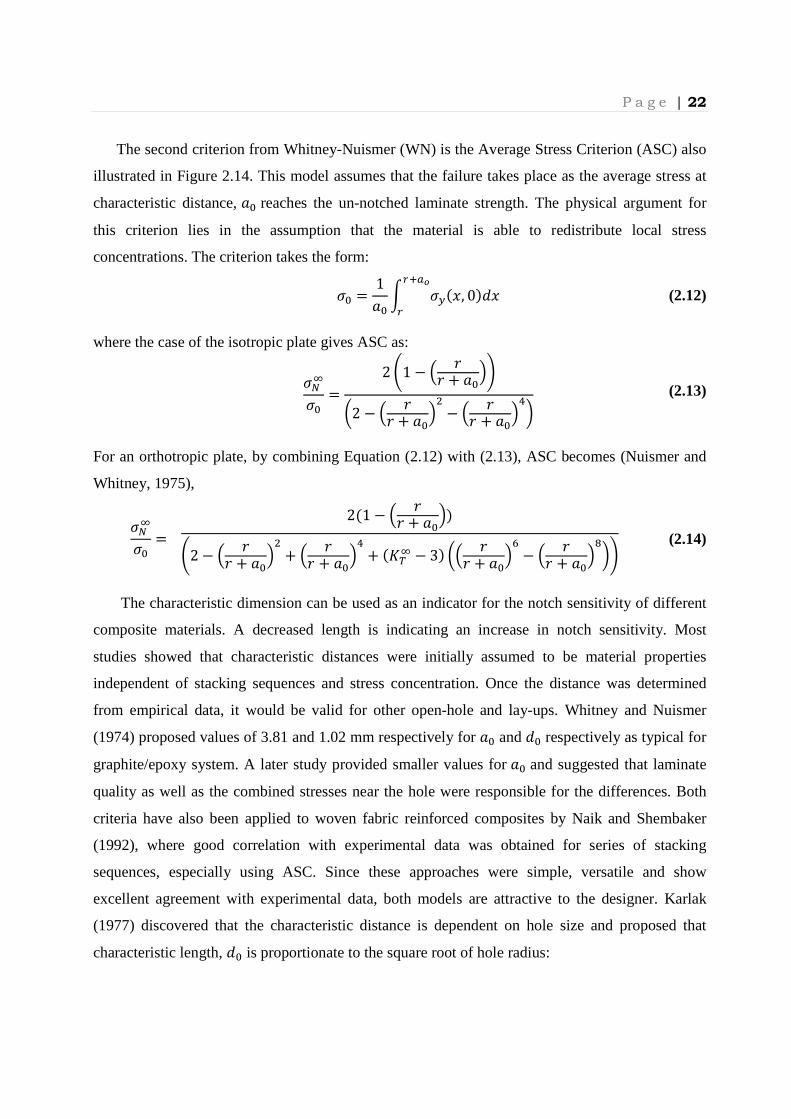
P a g e | 22
The second criterion from Whitney-Nuismer (WN) is the Average Stress Criterion (ASC) also
illustrated in Figure 2.14. This model assumes that the failure takes place as the average stress at
characteristic distance, �� reaches the un-notched laminate strength. The physical argument for
this criterion lies in the assumption that the material is able to redistribute local stress
concentrations. The criterion takes the form:
Z� = 1�� ¦ Z`(*, 0)*�§B¨�
(2.12)
where the case of the isotropic plate gives ASC as: Z_�Z� = 2 ¤1 − � 22 + ���¥
k2 − � 22 + ���� − � 22 + ���}l
(2.13)
For an orthotropic plate, by combining Equation (2.12) with (2.13), ASC becomes (Nuismer and
Whitney, 1975),
Z_�Z� =
2(1 − � 22 + ���)¤2 − � 22 + ���� + � 22 + ���} + (45� − 3) k� 22 + ���� − � 22 + ����l¥
(2.14)
The characteristic dimension can be used as an indicator for the notch sensitivity of different
composite materials. A decreased length is indicating an increase in notch sensitivity. Most
studies showed that characteristic distances were initially assumed to be material properties
independent of stacking sequences and stress concentration. Once the distance was determined
from empirical data, it would be valid for other open-hole and lay-ups. Whitney and Nuismer
(1974) proposed values of 3.81 and 1.02 mm respectively for �� and � respectively as typical for
graphite/epoxy system. A later study provided smaller values for �� and suggested that laminate
quality as well as the combined stresses near the hole were responsible for the differences. Both
criteria have also been applied to woven fabric reinforced composites by Naik and Shembaker
(1992), where good correlation with experimental data was obtained for series of stacking
sequences, especially using ASC. Since these approaches were simple, versatile and show
excellent agreement with experimental data, both models are attractive to the designer. Karlak
(1977) discovered that the characteristic distance is dependent on hole size and proposed that
characteristic length, � is proportionate to the square root of hole radius:

P a g e | 23
� = 1�2��
(2.15)
The constant 1�has units of √i;�ℎ and is dependent on factors such as stacking sequence.
The Karlak fracture model can be expressed as:
Z_�Z� = 2 «2 + k1 + 1�2¬��l¬� + 3 k1 + 1�2¬��l¬}¬�
(2.16)
Karlak (1977) initially formulated the model for the case of quasi-isotropic laminates then
extended to orthotropic laminates but reported validity for selected laminates only. Compared to
original WN model, this approach requires additional experimental testing to determine the
relationship between � and hole size. Whitney and Kim (1977) found that stacking sequence
does have a significant effect on the notch sensitivity of composite laminates. Pipes, Watherhold
and Gillespie (PWG) (1979) further extended the concept of characteristic distances in WN
fracture models to include hole size and laminate stacking sequences. They suggest that the
characteristic distance, � is assumed to be a function of hole radius, 2A and a notch sensitivity
factor has been introduced, which can be expressed as:
� = �22��A��
(2.17)
where 2� is a reference radius and normally taken as 1 for simplicity and affects the notch
sensitivity curves. The exponential parameter, : (ranging from zero in unmodified WN PSC to
one in notched strength is independent of hole radius) and WN PSC becomes:
Z_�Z� = 2®2 + ¯�� + 3¯�} − (45� − 3)(5¯�� − 7¯��)°
(2.18)
where ¯� = ±1 + 2A¬�2�¬A��¬�²¬�
(2.19)
Open-hole strength can be predicted using Equation (2.18) if three parameters,Z�,:, and �� are
determined experimentally. �� = 0 shows notch insensitivity whereas �� = ∞ results in Z_� Z� = 1 45�⁄⁄ . The exponential parameter, :, ranges from zero to 1. When : = 0, the WN
PSC retains its original form and : = 1 is independent of the hole radius.
Belmonte et. al. (2001, 2004) and Afaghi-Khatibi et. al. (1996b) used this formulation to
predicted open-hole strength in woven fabric systems. Belmonte found that the characteristic
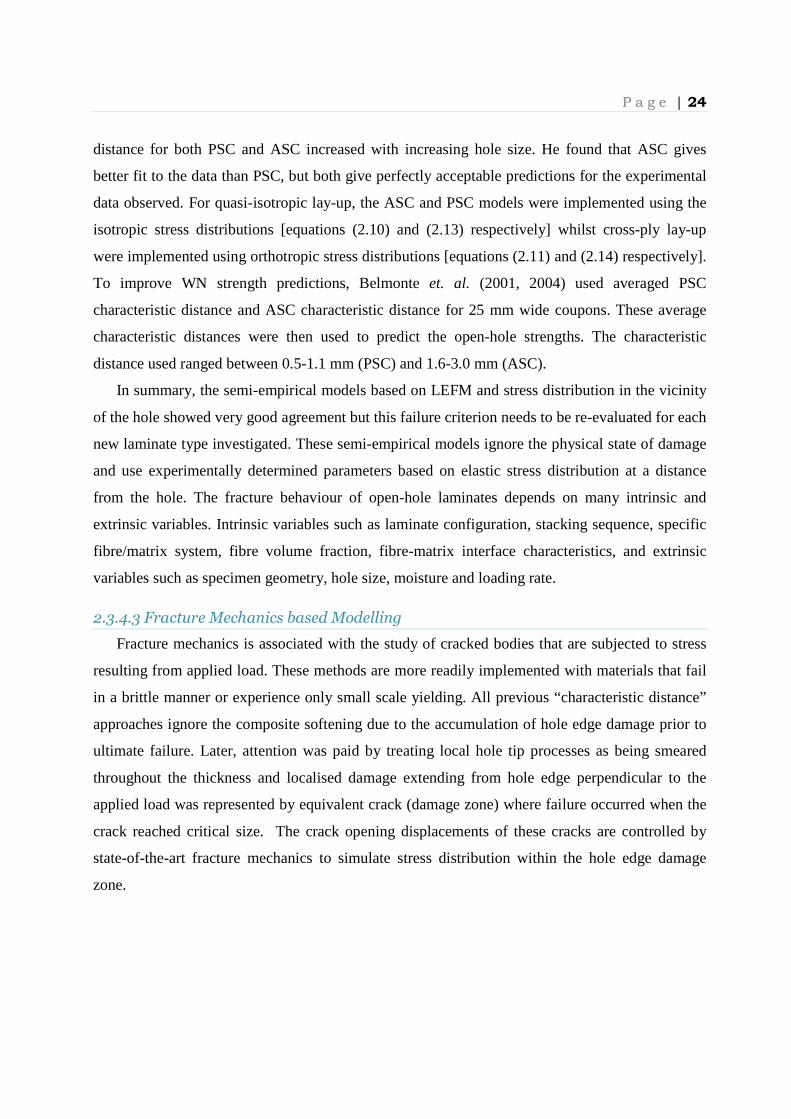
P a g e | 24
distance for both PSC and ASC increased with increasing hole size. He found that ASC gives
better fit to the data than PSC, but both give perfectly acceptable predictions for the experimental
data observed. For quasi-isotropic lay-up, the ASC and PSC models were implemented using the
isotropic stress distributions [equations (2.10) and (2.13) respectively] whilst cross-ply lay-up
were implemented using orthotropic stress distributions [equations (2.11) and (2.14) respectively].
To improve WN strength predictions, Belmonte et. al. (2001, 2004) used averaged PSC
characteristic distance and ASC characteristic distance for 25 mm wide coupons. These average
characteristic distances were then used to predict the open-hole strengths. The characteristic
distance used ranged between 0.5-1.1 mm (PSC) and 1.6-3.0 mm (ASC).
In summary, the semi-empirical models based on LEFM and stress distribution in the vicinity
of the hole showed very good agreement but this failure criterion needs to be re-evaluated for each
new laminate type investigated. These semi-empirical models ignore the physical state of damage
and use experimentally determined parameters based on elastic stress distribution at a distance
from the hole. The fracture behaviour of open-hole laminates depends on many intrinsic and
extrinsic variables. Intrinsic variables such as laminate configuration, stacking sequence, specific
fibre/matrix system, fibre volume fraction, fibre-matrix interface characteristics, and extrinsic
variables such as specimen geometry, hole size, moisture and loading rate.
2.3.4.3 Fracture Mechanics based Modelling
Fracture mechanics is associated with the study of cracked bodies that are subjected to stress
resulting from applied load. These methods are more readily implemented with materials that fail
in a brittle manner or experience only small scale yielding. All previous “characteristic distance”
approaches ignore the composite softening due to the accumulation of hole edge damage prior to
ultimate failure. Later, attention was paid by treating local hole tip processes as being smeared
throughout the thickness and localised damage extending from hole edge perpendicular to the
applied load was represented by equivalent crack (damage zone) where failure occurred when the
crack reached critical size. The crack opening displacements of these cracks are controlled by
state-of-the-art fracture mechanics to simulate stress distribution within the hole edge damage
zone.
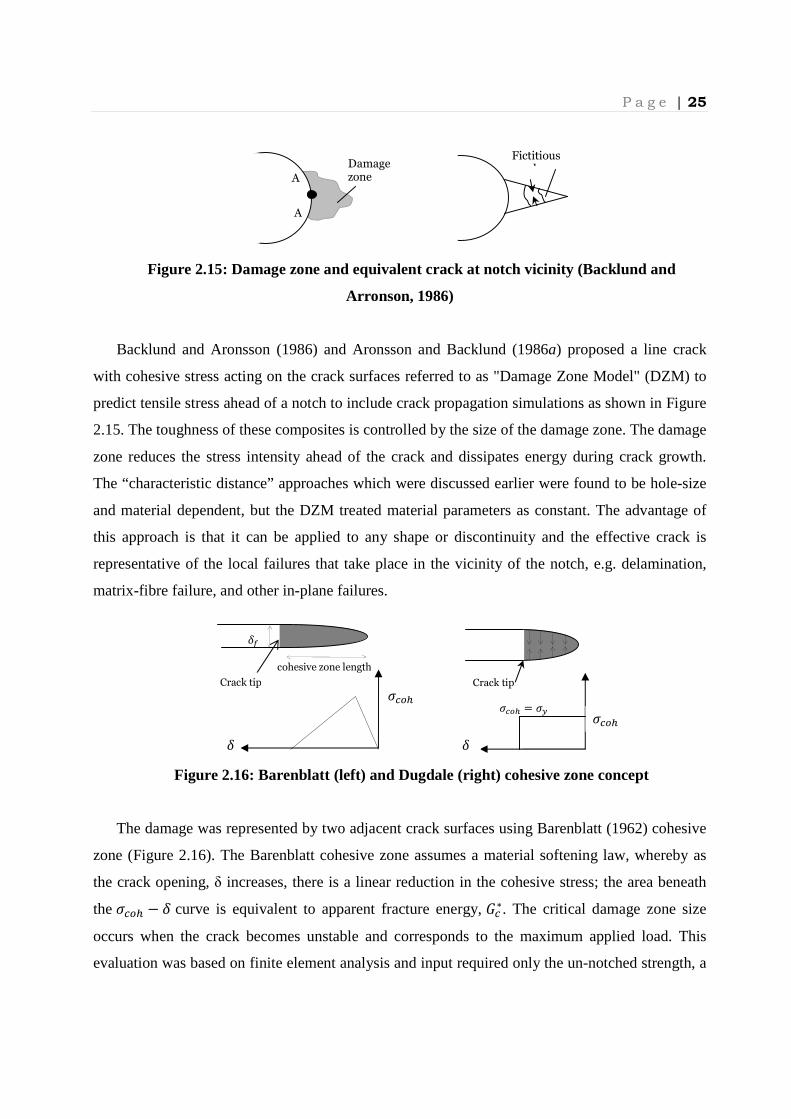
P a g e | 25
Figure 2.15: Damage zone and equivalent crack at notch vicinity (Backlund and
Arronson, 1986)
Backlund and Aronsson (1986) and Aronsson and Backlund (1986a) proposed a line crack
with cohesive stress acting on the crack surfaces referred to as "Damage Zone Model" (DZM) to
predict tensile stress ahead of a notch to include crack propagation simulations as shown in Figure
2.15. The toughness of these composites is controlled by the size of the damage zone. The damage
zone reduces the stress intensity ahead of the crack and dissipates energy during crack growth.
The “characteristic distance” approaches which were discussed earlier were found to be hole-size
and material dependent, but the DZM treated material parameters as constant. The advantage of
this approach is that it can be applied to any shape or discontinuity and the effective crack is
representative of the local failures that take place in the vicinity of the notch, e.g. delamination,
matrix-fibre failure, and other in-plane failures.
Figure 2.16: Barenblatt (left) and Dugdale (right) cohesive zone concept
The damage was represented by two adjacent crack surfaces using Barenblatt (1962) cohesive
zone (Figure 2.16). The Barenblatt cohesive zone assumes a material softening law, whereby as
the crack opening, δ increases, there is a linear reduction in the cohesive stress; the area beneath
the Z��^ − N curve is equivalent to apparent fracture energy, ,�∗. The critical damage zone size
occurs when the crack becomes unstable and corresponds to the maximum applied load. This
evaluation was based on finite element analysis and input required only the un-notched strength, a
cohesive zone length
N�
Crack tip Crack tip
Z��^ Z��^ = Z`
Z��^
N N
Fictitious crack
A
A
Damage zone

P a g e | 26
stiffness value and apparent fracture energy. Rather than using independent experimental
measurements, material toughness values are often assumed to fit experimental data and
commonly referred to as apparent fracture energy, ,�∗. Aronsson and Backlund (1986b) found that
the notched strength of laminates containing smooth notches was found to be more sensitive than
sharp notches to the precise shape of the Z��^ − N plot.
(a)
(b)
Figure 2.17: (a) Linear DZM model and (b) constant DZC criterion
Although it produced excellent results in notched strength predictions the DZM approach was
not attractive to earlier composite designers because it required an FEA framework. Eriksson and
Aronsson (1990) proposed an alternate Damage Zone Criterion (DZC) which assumed constant
cohesive stresses upon crack opening in damage zone, based on the Dugdale (1960) strip yield
model (Figure 2.17), simplify the closed-form formulations. Soutis and Fleck (1990) and Soutis
et. al. (1991) used this approach to model the behaviour of notched CFRP laminates in
compression and their work included a closed form version of the model, in which a damage
growth law based on the average stress criterion was combined with a fracture mechanics-based
failure criterion, as well as a softening law implemented within FEA. Damage initiates from the
DZM and grows from the notch edge with the assumption that a stress relaxation is present within
this damage zone and results in the existence of a stress lower than un-notched strength, Z�, within
the damage zone at the notch edge, Z ∗̀, and is given as:
Z ∗̀ = Z` + ∆Z ∗̀ = Z` + ®Z� − Z`│.¶�§� ∗° (2.20)
The basis of DZC is the following closed form expression based on the equilibrium between the
applied load and the axial force acting on the net-tension plane of the laminate:
Z��∗E + ¦ Z ∗̀E* = Z_ H2 E�/��§� ∗
(2.21)
σ
N�
,� Z�
·
σ
N� ,�
Z�
·

P a g e | 27
Combination of equations (2.20) and (2.21) with linear elastic stress distribution produces an
expression for the ratio of the notched to un-notched strength of the laminate. The PSC
characteristic distance, � , and the apparent fracture energy, ,/∗ required for DZM were
determined from the same notched strength as that used to determine the critical length of the
damage zone, �∗. The DZC gives a significant improvement in accuracy compared to the PSC and
is at least as accurate as DZM. This model requires a set of experimental data to calibrate the
damage zone and therefore seems similar to characteristic approach.
The majority of the models discussed previously are generally formulated to predict the stress
state or damage size adjacent to the notch at a given applied load. Afaghi-Khatibi et. al. (1996a)
introduced a reverse approach using an iterative technique, i.e., the applied load was predicted for
a given damage, known as the effective crack growth model (ECGM) and based on the closed
form expressions used in the DZC. The main features of ECGM compared to other models are the
stress redistribution and damage growth predicted adjacent to the discontinuity as illustrated in
Figure 2.18. Like DZC, ECGM approximates the damage zone adjacent to the hole using an
effective crack with cohesive stress acting on the crack faces as given in Figure 2.19. ,/∗ values
are obtained as described earlier in DZC.
Figure 2.18: Modified elastic stress distribution in notched composite laminate (after
Afaghi-Khatibi et. al., 1996a)
ECGM is based upon a balance of forces given by the general expression:
¸ �¹ + ¦ Z ∗̀�/�P§�(º» )
�
¹¶�E* = @(�)
(2.22)
where �¹ = ∆�Z�E describes the redistribution of stress within the damage zone which is
controlled by the "predictive" material toughness, known as apparent fracture energy, ,�∗ . By
Z�
Z
*
Z` Z ∗̀∆Z∗
Projected damage zone
� �∗
t = thickness

P a g e | 28
repeating the above procedure iteratively as shown in the flow chart (Figure 2.20) for each
damage increment, ∆�, the applied load, ZB[[, associated with particular damage zone size can be
determined. This results in a maximum load at which the crack becomes unstable and fracture is
assumed to occur. This fracture load corresponds to a critical damage zone length, assumed in the
model as indicating the damage zone size at failure.
Figure 2.19: Fictitious crack of cohesive stress-crack opening (after Afaghi-Khatibi et.
al., 1996a)
Figure 2.20: Flow chart for residual strength evaluation by ECGM (after Afaghi-Khatibi
et. al., 1996a)
i = 0, �(�) = 0
�(�) = �(�¬�) + ∆�
i = i + 1
¼;iEi�9N(¹)
Z��^ = �(N(¹), ,�∗)
¸ �¹ +¦ Z` ∗ E* = ZB[[EI/2
X(¹) = �(Z��^, ZB[[)
Convergent?
½FE?FE:ZB[[(i)
ZB[[(i) > ZB[[(i − 1)DEÀ?
>À
K�z
>�IN(¹) >À
∆� ∆�
N
N > N� N < N�
∆� ∆�
fictitious crack

P a g e | 29
The characteristic distances for the woven laminates were obtained by averaging over the
range of hole diameter and it appears that the ECGM requires further experimental verification in
order to assess its performance compared to the other available models. ECGM is a model
developed to predict the residual strength of open-hole composite laminates and requires un-
notched laminate strength and the apparent fracture energy properties. ECGM does not require
experimental calibrations as in WN models (1974), but requires an iterative approach significantly
more complex than WN models. The apparent fracture energy obtained from recalibration from
literatures is also contentious. Afaghi-Khatibi (1996b) later implemented this approach in
prediction of open-hole woven fabric composites, following experimental work by Kim and Kim
(1995). He showed that this approach is sensitive to crack iterative increments and fine increments
(∆c~3000) gave the best prediction of the experimental data.
Another potential model for predicting the open-hole strength of a composite is known as the
"Crack Growth Model" (CGM) introduced by Soutis and Fleck and later used by Hitchen et. al.
(1994), Manger (1999) and Belmonte et. al. (2001, 2004). This model incorporates damage
accumulation at the hole edge, and combines fracture mechanics and stress analysis. It was
proposed by Hitchen et al. (1994) to predict the open-hole strength of short carbon fibre/epoxy
laminates. The analysis is based upon the stable growth and subsequent catastrophic failure of a
damage zone, or effective crack, at the hole edge. Manger (1999) and Belmonte et. al. (2001,
2004) applied the closed form version of the model to extensive data sets for woven fabric glass
and carbon composites and obtained very good agreement with experiment.
Figure 2.21: Open-hole strength prediction from CDG model as proposed by Hitchen
et.al. (1994)
Crack Growth/ Stable Growth
Crack Propagation/ Fracture Mechanics
STRESS
DAMAGE ZONE SIZE
Predicted Damage Zone Length
Predicted Open-Hole Strength, Z_

P a g e | 30
CGM model is based on growth of the damage zone, which is calculated on the basis of the
elastic stress distribution and the un-notched strength. This modelling techniques requires a crack
growth equation which increased with damage zone size, propagating from the hole edge when
the applied stress, Z`, reaches the value given in Equation (2.23) with the finite width correction
factor given by Equation (2.24);
Z = 1� ¦ K�Z`*�§��
(2.23)
K� = 2 +Â1 −�22H�Ãm3 Â1 −�22H�Ã
(2.24)
Catastrophic fracture is based on fracture mechanics to determine the damage zone at the edge
of the circular hole and, therefore, material fracture toughness is required. Catastrophic failure
occurs when the stress reaches
ZB = 4�√¡���K�
(2.25)
where ��and K� are given by equations 2.26 and 2.27.
�� =k3 − � �� + 2�l2 n1 + 1.243 ¤1 −� �� + 2�¥mo
(2.26)
K� =Äsec � πr2W� sec k¡(2 + �)2H l
(2.27)
Based on this model, fracture is assumed to occur when stresses from both crack growth and
fracture mechanics are equal. Therefore, as illustrated in Figure 2.21, with known un-notched
laminate strength and fracture toughness, the damage zone size at failure and the corresponding
open-hole strength can be determined. This approach is easy to implement and from a simple
crack growth approach and fracture mechanics, the open-hole strength can be predicted. This
model states that fracture is assumed to occur when the stress required to advance the damage
zone is equal to the stress required for catastrophic crack growth. The model open-hole strength
predictions were satisfactory but tended to under-predict the experimental data especially in cross-
ply lay-up after orthotropic correction. Another drawback of this fracture-mechanics based model
P a g e | 31
is the discrepancy between assumed equivalent crack and actual damage observed prior to failure.
The measured length of the critical damage zone (shown in Figure 2.22) in GFRP woven fabric
system is rather less in the cross-ply lay-up (around 1 mm – from Manger (1999)) than in the
quasi-isotropic lay-up tested by Belmonte (2 – 3 mm). The reduced extent of the critical damage
zone length in the cross-ply may be associated with the greater proportion of 0º tows in that lay-
up. For example, in Belmonte’s (2004) work, critical damage zone length in 5Q4 lay-up with 10
mm hole size was measured as 2.28 mm and was not very different from the ASC criterion (3.09
mm), but the experimental damage zones were larger (about 4.5 mm).
Figure 2.22: Illustration of damage zone model (after Belmonte et. al., 2004)
2.3.4.4 Damage-based Modelling
The stress levels at ultimate failures can be modified by the presence of damage with stress
relief at hole tip developed at relatively low loads, corresponding to higher open-hole strength.
Kortshot et. al. (1990, 1991) proposed a model for notched (sharp edge) strength prediction which
was taken from an experimental investigation and involved considering the effect of damage at
the ply (intra-ply splitting of 0°) and inter-ply (showed as narrow triangular areas of delamination
between 0° and 90° plies) level on the stress distribution near the notch tip in the longitudinal
fibre plies of notched cross-ply laminates. They developed an FEA model for (0¹/90¹)¹�
graphite/epoxy where damage was assigned at appropriate locations to obtain the relationship of
stress and damage and subsequently used to predict the damage initiation and growth. A Weibull
statistics based failure criterion for longitudinal failure was then applied, leading to very good
strength predictions for the notched laminates under investigation.
Wisnom and Chang (2000) considered splitting and delamination for (0/90)� laminate and
notched (sharp crack) cross-ply laminates and showed good agreement between experimental
I��=^� I����
9��=^� 9����

P a g e | 32
measurements and numerical results for the split length as a function of tensile stress applied.
Consistent experimental observations were also observed in self-similar damage growth and
triangular delamination zone. Both predicted damages are insensitive to mesh size, assumed
interface stiffness and the effect of transverse ply cracking. Their approach included non-shear
behaviour and allowed the effect of damage in redistribution of load at stress raisers, leading to an
accurate model that can be applied to other geometries and lay-ups.
Hallett et. al (2009) then extended their work to quasi-isotropic laminates and modelled more
detail of sub-critical damage discretely, as shown in Figure 2.23, using cohesive interface element
with independently measured material data to model splitting and delamination propagation and
Weibull based statistical analysis for longitudinal fibre failure. They conducted an extensive study
of the tensile strength of open-hole composites assembled according to "sub-laminate-level
scaling" and "ply-level scaling". FEA models of sub-critical damages are correlated excellently
with experimental observations. Their findings confirmed that the failure stress and associated
micro-mechanisms of failure depend on hole size and laminate assembly. In the majority of ply-
level scaled specimens delamination occurs at -45/0 interface, where the failure stress increased
with hole diameter. On the other hand, laminate level scaled specimens showed reduction of
damage propagation through the gauge section where increasing hole diameter reduced stress
relief leading to fibre failure.
Figure 2.23: Damage zone in [45/90/-45/0]s (Hallett et. al., 2009)

P a g e | 33
From the above description, it is well-documented that for materials based on non-woven
reinforcement, the intra- and inter-laminar damage which occurs can lead to a very complex
problem to analyse. It has been shown from experimental observation, that the architecture of
woven fabric composites reduces this complexity somewhat, leading to the propagation of a self-
similar damage zone which can be modelled using a physically-based critical damage and fracture
models. A general conclusion was that open-hole composite failures incorporating damage
mechanisms incurred local damage that varies with lay-up and specimen size.
2.3.4.5 Progressive Damage Modelling
The most prominent approach in FEA methods nowadays to predict the laminate strength
associated with stress raisers is the progressive damage modelling. This approach takes into
account the damage and stress redistribution (corresponding to reduced stress concentration at
hole tip) that takes place throughout the loading process by reducing local laminate stiffness. It is
carried out in three steps: firstly, a stress analysis, secondly, failure criteria (most authors use
Hashin (1980) and Yamada-Sun (1978) failure criteria); lastly, degradation of material properties
if failure has taken place. The challenge in this approach is to choose appropriate combinations of
failure criteria and material degradation law. The advantage of this type of model is that it uses a
ply-by-ply criterion, like Hashin (1980), assessing damage accumulated in individual plies with
arbitrary ply orientations.
Chang and Chang (1987) developed a two-dimensional progressive damage model for open-
hole laminates subjected to tensile loading. Four different failure mechanisms, following the
Hashin criterion, were considered using the Yamada-Sun (1978) failure criterion. Fibre-matrix
shear-out and fibre breakage, both �� and X��are reduced to zero but the longitudinal modulus ��
and shear modulus ,�� of the failed region degenerate according to a Weibull distribution which
are not easily determined.
Tan (1991) also developed a 2-D progressive damage model but assumed that the stiffness
reduction in fibre failure was predicted using Hashin’s (1980) quadratic stress criterion. This
utilises the longitudinal tensile and compressive strength of a lamina. Matrix cracking was
predicted by the Tsai-Wu (1971) criterion. Once a layer fails, stress is redistributed to the
remaining intact layers. Ultimate failure occurs when fibres spanning the entire laminate width are
broken or when substantial matrix failure has occurred in all the laminate. Predicted damage
progression basically agreed with experimental results obtained by X-radiographic examination of
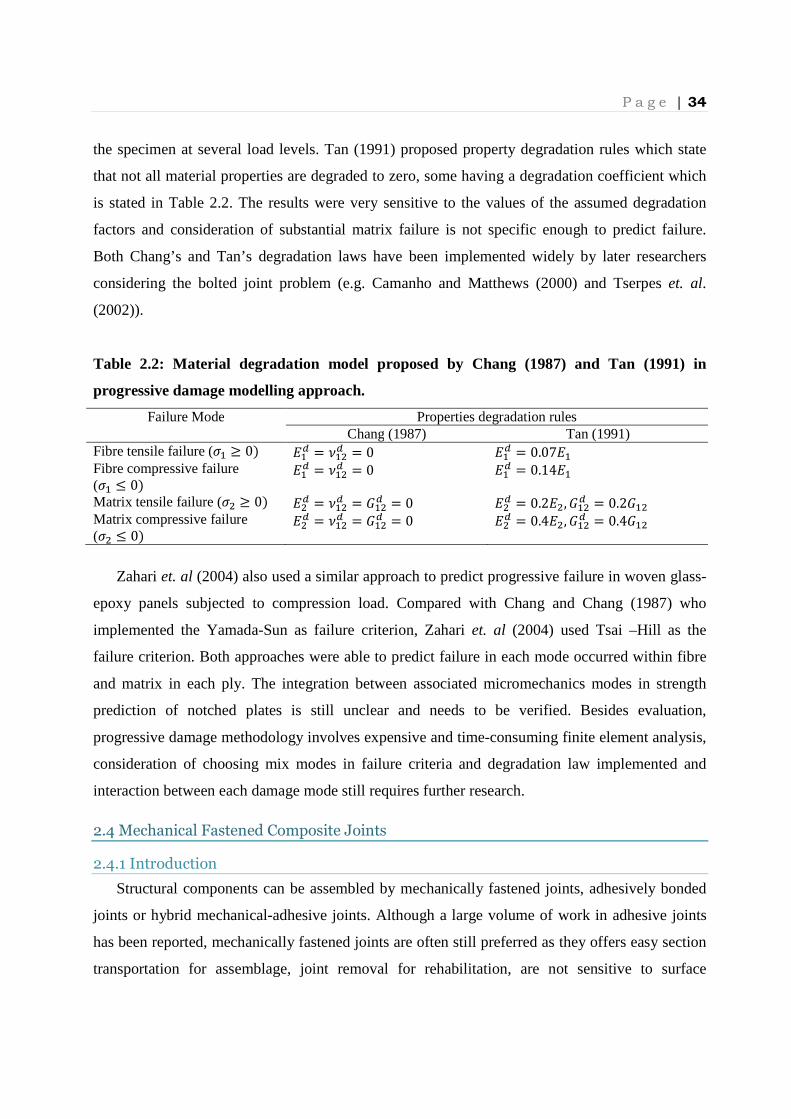
P a g e | 34
the specimen at several load levels. Tan (1991) proposed property degradation rules which state
that not all material properties are degraded to zero, some having a degradation coefficient which
is stated in Table 2.2. The results were very sensitive to the values of the assumed degradation
factors and consideration of substantial matrix failure is not specific enough to predict failure.
Both Chang’s and Tan’s degradation laws have been implemented widely by later researchers
considering the bolted joint problem (e.g. Camanho and Matthews (2000) and Tserpes et. al.
(2002)).
Table 2.2: Material degradation model proposed by Chang (1987) and Tan (1991) in
progressive damage modelling approach.
Failure Mode Properties degradation rules Chang (1987) Tan (1991)
Fibre tensile failure (Z� ≥ 0) ��� = W��� = 0 ��� = 0.07�� Fibre compressive failure (Z� ≤ 0)
��� = W��� = 0 ��� = 0.14��
Matrix tensile failure (Z� ≥ 0) ��� = W��� = ,��� = 0 ��� = 0.2��, ,��� = 0.2,�� Matrix compressive failure (Z� ≤ 0)
��� = W��� = ,��� = 0 ��� = 0.4��, ,��� = 0.4,��
Zahari et. al (2004) also used a similar approach to predict progressive failure in woven glass-
epoxy panels subjected to compression load. Compared with Chang and Chang (1987) who
implemented the Yamada-Sun as failure criterion, Zahari et. al (2004) used Tsai –Hill as the
failure criterion. Both approaches were able to predict failure in each mode occurred within fibre
and matrix in each ply. The integration between associated micromechanics modes in strength
prediction of notched plates is still unclear and needs to be verified. Besides evaluation,
progressive damage methodology involves expensive and time-consuming finite element analysis,
consideration of choosing mix modes in failure criteria and degradation law implemented and
interaction between each damage mode still requires further research.
2.4 Mechanical Fastened Composite Joints
2.4.1 Introduction
Structural components can be assembled by mechanically fastened joints, adhesively bonded
joints or hybrid mechanical-adhesive joints. Although a large volume of work in adhesive joints
has been reported, mechanically fastened joints are often still preferred as they offers easy section
transportation for assemblage, joint removal for rehabilitation, are not sensitive to surface

P a g e | 35
preparation, service temperature, or humidity, etc. Two common bolted joint types are double-lap
and single-lap joint as shown in Figure 2.24. Although most practical joints consist of multiple
bolt rows and columns, researchers focus more on single-bolt joints. This review concentrates on
stress distributions and strength prediction in single-hole bolted joints.
This section starts with experimental observations on composite bolted joint behaviour by
previous researchers; focus is given to net-tension failure modes. Stress analyses are discussed
next (both analytical and finite element approaches). The final sub-sections discusses strength
prediction work using semi-empirical, fracture mechanics and progressive damage approach
(including 3-D model with both loads) which are largely implemented within finite element
method.
(a) Single-Lap Joint (SLJ) (b) Double-Lap Joint (DLJ)
Figure 2.24: Types of mechanical lap joint in structural assembly
2.4.2 Experimental Studies of Failure in Composite Bolted Joints
2.4.2.1 Overview
Structural integrity, reliability and efficient load carrying joints in composite structures can be
achieved by using optimum geometric parameters and materials. Experimental studies by previous
researchers mostly consider single-bolted connections and investigate bearing strength, failure
modes and failure mechanisms. The geometry of the bolted joint problem, which is used in further
discussion, is given in Figure 2.25. A vast body of work exists, addressing the effect of varying
single joint geometry (such as laminate thickness, hole diameter, W/d and e/d ratios) in each lay-
up system (other dimensions are constants) as this has a great influence on ultimate bearing
strength.

P a g e | 36
Figure 2.25: Geometry dimension used in bolted joint problems
Three distinct failure modes can occur in composite bolted joints as shown in Figure 2.26.
Net-tension failures are given by sudden crack propagations to failure due to relatively small area
of sample cross-section. Shear-out failure occurs in small end-distance to hole centre or in highly
orthotropic laminates such as cross-ply lay-up. Bearing failure is given as compressive failure
close to contact region at the hole edge, exhibiting more ductile failure behaviour. Failures may
also exist due to secondary failure modes, such as mixed net-tension and shear-out failure known
as cleavage failure.
(a) net-tension failure (b) Shear-out failure (c) Bearing failure (d) Cleavage failure
Figure 2.26: Failure modes in mechanically fastened composite joints
2.4.2.2 Behaviour of Joints based on Multi-directional (Non-woven) Laminate
Several studies have been reported investigating the effect of lateral constraint on composite
bolted joint strength. Net-tension and shear-out failure are catastrophic failure-types leading to a
preference for bearing mode. Most experimental work includes investigation on transition of net-
tension or shear-out to bearing failure known as critical W/d and e/d respectively. For a testing
series of CFRP laminate configurations and hole sizes, Collings (1977), investigated critical W/d

P a g e | 37
and e/d ratio, as shown in Figure 2.27. Similar observations were also found in glass/epoxy
laminates by Kretsis and Matthews (1985). They emphasised that bearing strength and micro-
mechanism of failure are strongly dependent on lay-up orientations. Larger holes undergo less
stress concentration relief prior to failure, which relates to reduced strength for larger holes.
Figure 2.27: Effect of CFRP laminate width (left) and end-distance (right) on bearing
strength (Collings, 1977)
Lay-up stacking also affects both the bearing strength and failure mode in pin joints as
reported by Quinn and Matthews (1977) and in clamped bolted joints reported later by Park
(2001). They found that placing 90º layers on the surface inhibits delamination bearing strength in
the region θ = 0º (θ is defined in Figure 2.25) but does not affect the ultimate bearing strength.
Stockdale and Matthews (1976) reported a 40% increase in pin loaded bearing strength for a
finger-tight case and increased as much as 100% at a maximum clamping load (14.7 kN)
compared to a pin joint in GFRP system. Eriksson (1987) found that normalised strength of
clamped to pin joint in CFRP system rose by up to 2.4 times. This is expected as lower stiffness in
GFRP gives instability effects which reduced its strength performance. Smith (1985) found that
increasing bolt load changed the initial failure mechanism from local bearing (splitting and
interlaminar cracking) to local shear and compression damage under the bolt head resulting in
increased bearing stress. Remote bearing failure (more significant in low torque conditions) was
shown to be a mixture of compressive damage and delamination failures.
Collings (1982) and Eriksson (1990) suggested that clamped bearing strength increased with
clamp-up due to the washers preventing lateral “brooming” type failure of outer plies associated
with an unconstrained joint. Stockdale and Matthews (1976) showed that including restraining
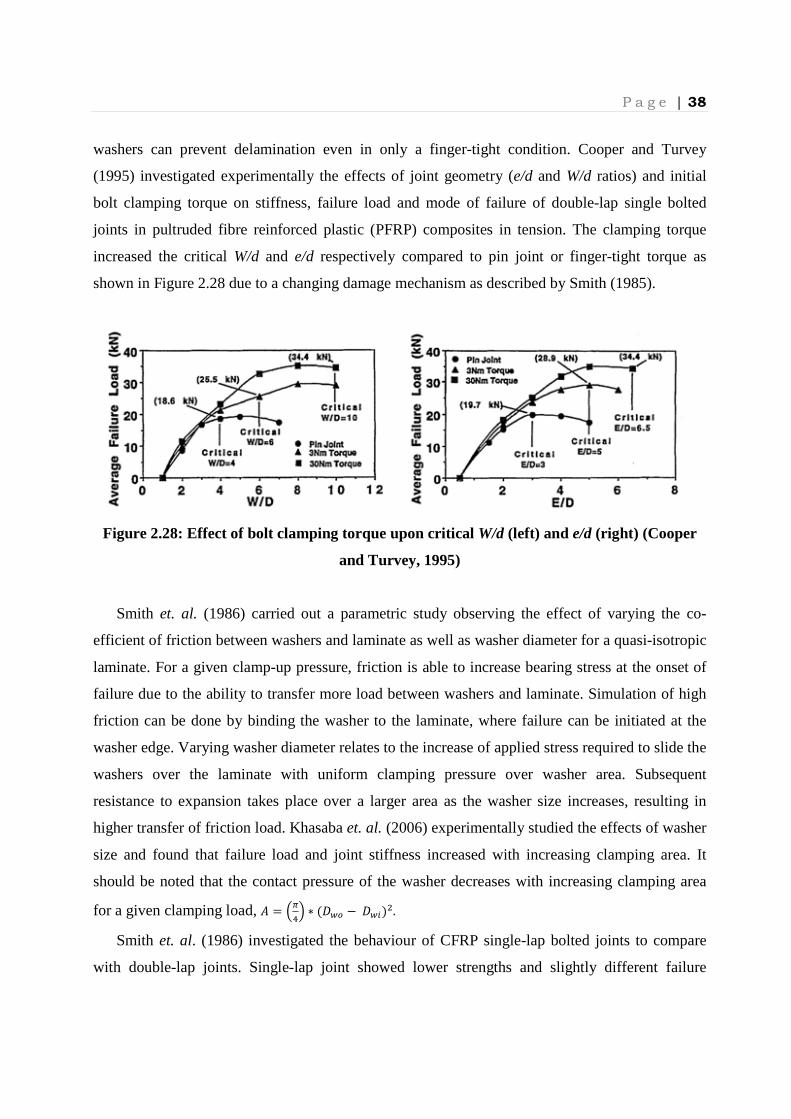
P a g e | 38
washers can prevent delamination even in only a finger-tight condition. Cooper and Turvey
(1995) investigated experimentally the effects of joint geometry (e/d and W/d ratios) and initial
bolt clamping torque on stiffness, failure load and mode of failure of double-lap single bolted
joints in pultruded fibre reinforced plastic (PFRP) composites in tension. The clamping torque
increased the critical W/d and e/d respectively compared to pin joint or finger-tight torque as
shown in Figure 2.28 due to a changing damage mechanism as described by Smith (1985).
Figure 2.28: Effect of bolt clamping torque upon critical W/d (left) and e/d (right) (Cooper
and Turvey, 1995)
Smith et. al. (1986) carried out a parametric study observing the effect of varying the co-
efficient of friction between washers and laminate as well as washer diameter for a quasi-isotropic
laminate. For a given clamp-up pressure, friction is able to increase bearing stress at the onset of
failure due to the ability to transfer more load between washers and laminate. Simulation of high
friction can be done by binding the washer to the laminate, where failure can be initiated at the
washer edge. Varying washer diameter relates to the increase of applied stress required to slide the
washers over the laminate with uniform clamping pressure over washer area. Subsequent
resistance to expansion takes place over a larger area as the washer size increases, resulting in
higher transfer of friction load. Khasaba et. al. (2006) experimentally studied the effects of washer
size and found that failure load and joint stiffness increased with increasing clamping area. It
should be noted that the contact pressure of the washer decreases with increasing clamping area
for a given clamping load, Ì = �Í}� ∗ (� � − � �)�.
Smith et. al. (1986) investigated the behaviour of CFRP single-lap bolted joints to compare
with double-lap joints. Single-lap joint showed lower strengths and slightly different failure

P a g e | 39
mechanisms due to secondary bending phenomenon and this was more significant for large W/d.
This is because the controlling parameter for net-tension failures is stress distribution ahead of the
hole on θ=90º plane associated to the area constrained by washers that inhibited bending and
hence bending stresses. Strength reduction up to 25% (especially at higher W/d) occurred for
single-lap in quasi-isotropic lay-up and slightly smaller for cross-ply lay-ups as compared to
double-lap joint. This is because the stress concentration due to the washer digging in the
laminates as the bolt rotates leads to a lower bearing strength than with no washer rotation that
occurs in the double-lap. Similar failure mechanisms in double-lap joints are exhibited where
local damage initiation (one or a combination of local tension, shear or bearing) and final failure is
given as appreciable damage and hole elongation (net-tension) or catastrophic compression failure
at the washer edge (remote bearing). Lower strength reduction in a cross-ply (10-15%) may be
due to different bending stiffness of two laminates lay-ups. Smith et. al. (1986) also suggested
using thicker laminates will improved predictions, but no further testing was reported.
Riccio and Marciano (2005a) investigated damage onset and propagation under tensile loading
in single-lap joints to compare with numerical modelling (2005b). They found protruding bolts
able to sustain more load prior to damage onset but less in damage evolution. The damage area
with protruding bolts is distributed all round the hole due to the contact between bolt head and top
composite plate while damage area in a countersunk bolt is localised between the hole and the
plate edge. They also found that damage distributions in composite-composite joints is not
uniform along the thickness, more damage is localised where damage onset was observed. More
uniform damage distribution in composite-aluminium configurations has been found.
2.4.2.3 Behaviour of Joints based on Woven Fabric reinforcement
In woven fabric composite system, there is a limited amount of experimental work reported
with bolted joints. Early work with this system such as Okutan et. al. (2001), Aktas and Dirikolu
(2003) and Karakuzu et. al. (2006) has considered pin joint (not clamped) looking at how strength
and failure modes relate with geometrical parameters such as hole diameter, d, laminate thickness,
t, width, W, and edge distance, e. Due to low bearing compressive strength of woven system
compared to non-woven counterparts, critical W/d is increased and dependent on woven system
investigated. The effect of stacking sequence on bearing strengths in woven fabric systems has
been investigated by Ujjin et. al. (2004) and Aktas et. al. (2009).
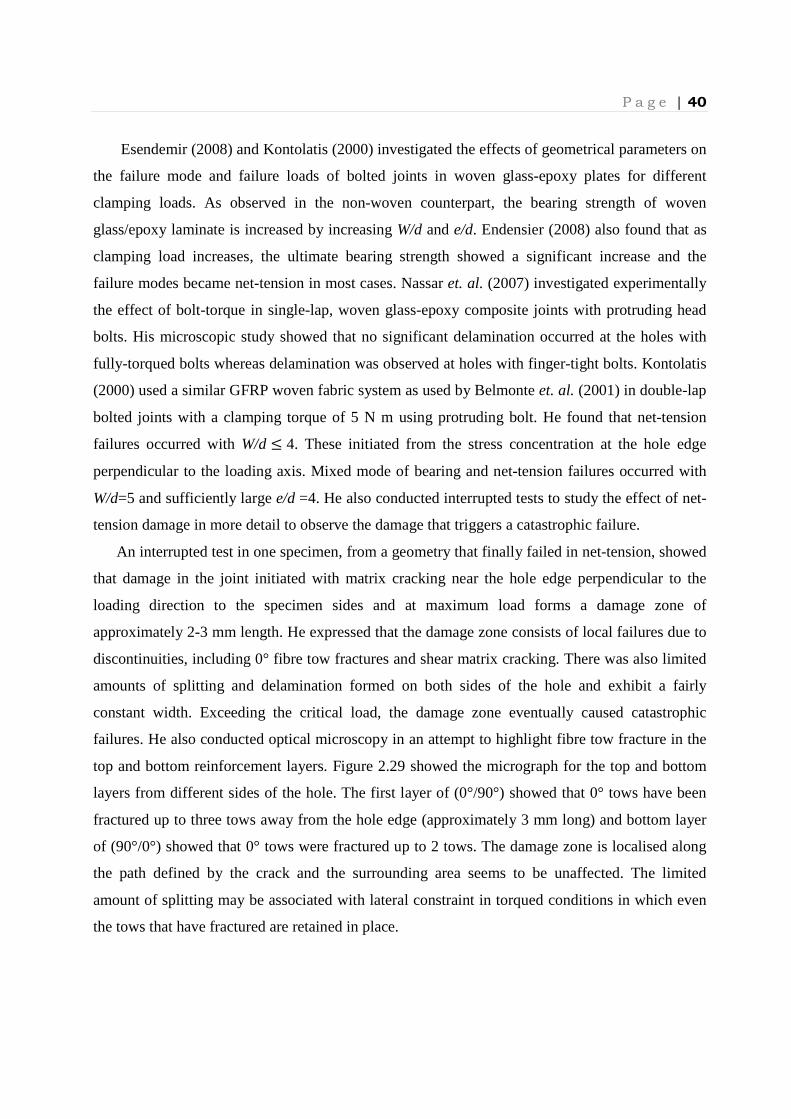
P a g e | 40
Esendemir (2008) and Kontolatis (2000) investigated the effects of geometrical parameters on
the failure mode and failure loads of bolted joints in woven glass-epoxy plates for different
clamping loads. As observed in the non-woven counterpart, the bearing strength of woven
glass/epoxy laminate is increased by increasing W/d and e/d. Endensier (2008) also found that as
clamping load increases, the ultimate bearing strength showed a significant increase and the
failure modes became net-tension in most cases. Nassar et. al. (2007) investigated experimentally
the effect of bolt-torque in single-lap, woven glass-epoxy composite joints with protruding head
bolts. His microscopic study showed that no significant delamination occurred at the holes with
fully-torqued bolts whereas delamination was observed at holes with finger-tight bolts. Kontolatis
(2000) used a similar GFRP woven fabric system as used by Belmonte et. al. (2001) in double-lap
bolted joints with a clamping torque of 5 N m using protruding bolt. He found that net-tension
failures occurred with W/d ≤ 4. These initiated from the stress concentration at the hole edge
perpendicular to the loading axis. Mixed mode of bearing and net-tension failures occurred with
W/d=5 and sufficiently large e/d =4. He also conducted interrupted tests to study the effect of net-
tension damage in more detail to observe the damage that triggers a catastrophic failure.
An interrupted test in one specimen, from a geometry that finally failed in net-tension, showed
that damage in the joint initiated with matrix cracking near the hole edge perpendicular to the
loading direction to the specimen sides and at maximum load forms a damage zone of
approximately 2-3 mm length. He expressed that the damage zone consists of local failures due to
discontinuities, including 0° fibre tow fractures and shear matrix cracking. There was also limited
amounts of splitting and delamination formed on both sides of the hole and exhibit a fairly
constant width. Exceeding the critical load, the damage zone eventually caused catastrophic
failures. He also conducted optical microscopy in an attempt to highlight fibre tow fracture in the
top and bottom reinforcement layers. Figure 2.29 showed the micrograph for the top and bottom
layers from different sides of the hole. The first layer of (0°/90°) showed that 0° tows have been
fractured up to three tows away from the hole edge (approximately 3 mm long) and bottom layer
of (90°/0°) showed that 0° tows were fractured up to 2 tows. The damage zone is localised along
the path defined by the crack and the surrounding area seems to be unaffected. The limited
amount of splitting may be associated with lateral constraint in torqued conditions in which even
the tows that have fractured are retained in place.
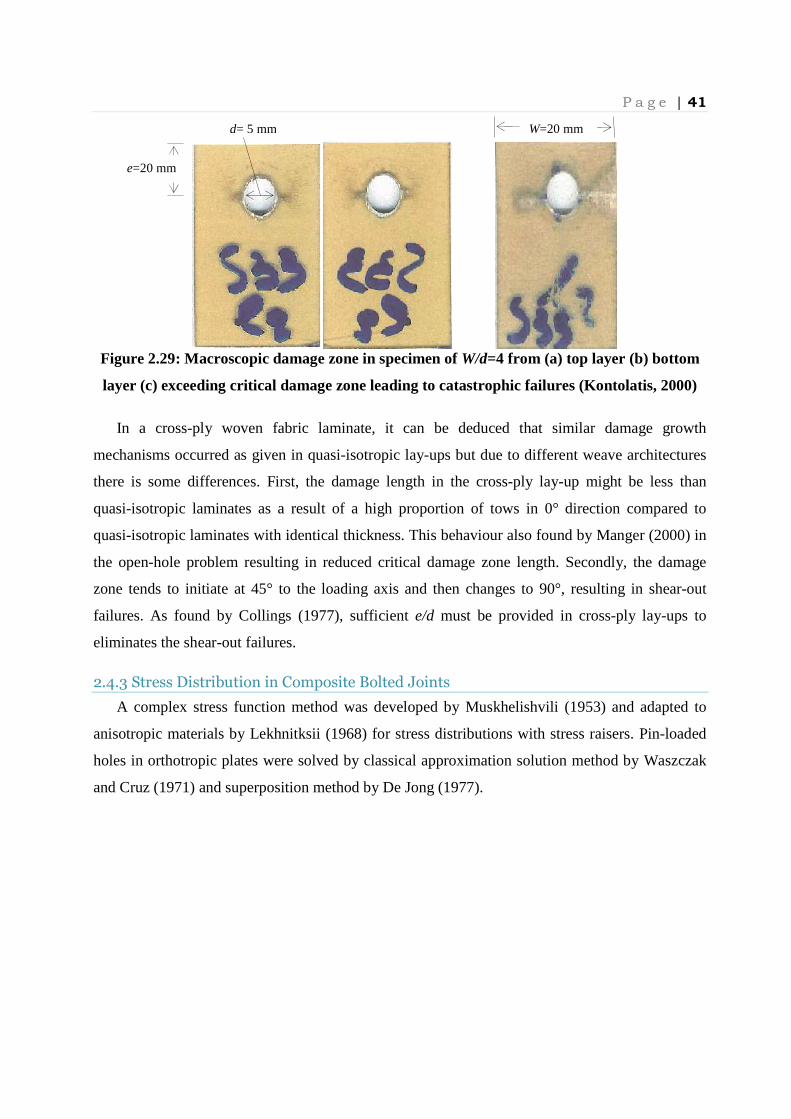
P a g e | 41
Figure 2.29: Macroscopic damage zone in specimen of W/d=4 from (a) top layer (b) bottom
layer (c) exceeding critical damage zone leading to catastrophic failures (Kontolatis, 2000)
In a cross-ply woven fabric laminate, it can be deduced that similar damage growth
mechanisms occurred as given in quasi-isotropic lay-ups but due to different weave architectures
there is some differences. First, the damage length in the cross-ply lay-up might be less than
quasi-isotropic laminates as a result of a high proportion of tows in 0° direction compared to
quasi-isotropic laminates with identical thickness. This behaviour also found by Manger (2000) in
the open-hole problem resulting in reduced critical damage zone length. Secondly, the damage
zone tends to initiate at 45° to the loading axis and then changes to 90°, resulting in shear-out
failures. As found by Collings (1977), sufficient e/d must be provided in cross-ply lay-ups to
eliminates the shear-out failures.
2.4.3 Stress Distribution in Composite Bolted Joints
A complex stress function method was developed by Muskhelishvili (1953) and adapted to
anisotropic materials by Lekhnitksii (1968) for stress distributions with stress raisers. Pin-loaded
holes in orthotropic plates were solved by classical approximation solution method by Waszczak
and Cruz (1971) and superposition method by De Jong (1977).
e=20 mm
W=20 mm d= 5 mm

P a g e | 42
Figure 2.30: Superposition of De Jong (1977) load cases
De Jong’s superposition (1977) was primarily formulated for isotropic material with pin
loading but can be applied to quasi-isotropic composite materials. The pin was assumed rigid; the
uniformly distributed load (remote stress) in the plate was applied at an infinite distance and a
cosinusoidal radial stress distribution represented the pin-hole interaction. The solution was
obtained as the combination of the two load cases shown in Figure 2.30. Firstly, a pin-loaded hole,
where loads with the same direction and value were applied at the plate edges. The series
coefficients were calculated using the boundary conditions in the assumed loaded zone of the
hole. The other case was an open hole where loads with the same value but with opposite
directions were applied at the plate edges. The stresses in the vicinity of the hole are given by
hoop stress,Zaa, radial stress,Z��, and shear stress,b�a, respectively as follows,
Z�� = [�Í �1 − �ÎBÎ� − [� �B cos S ¤1 − �¬Ð} �1 − �Î
BÎ�¥ − [}Í B� cosS �1 + 4 �ÎBÎ − �Ñ
BÑ� tan¬� ¤��/B∙Ö%� a�¬×ÎØÎ ¥ −
[�Í B� sinS �1 − �ÎBÎ�� 9ÀÚ �§��/B∙�ÛÜ a§×ÎØÎ�¬��/B∙�ÛÜ a§×ÎØÎ
(2.28)
Zaa = [�Í �3 + �ÎBÎ� − �¬Ð� ? �B cos S �1 + �ÎBÎ� − [}Í B� cos S �3 + �ÑBÑ� tan¬� ¤��/B∙Ö%�a�¬×ÎØÎ ¥ − [�Í B� sin S �3 − 2 �ÎBÎ −�ÑBÑ� 9ÀÚ �§��/B∙�ÛÜ a§×ÎØÎ�¬��/B∙�ÛÜ a§×ÎØÎ
(2.29)
b�a = �¬Ð� ? �B sin S �1 − �ÎBÎ� − [}Í B� sin S �1 − �ÑBÑ� tan¬� ¤��/B∙��� a�¬×ÎØÎ ¥ + [�Í B� cos S �1 − �ÎBÎ�� 9ÀÚ �§��/B∙�ÛÜ a§×ÎØÎ�¬��/B∙�ÛÜ a§×ÎØÎ
(2.30)
Z� = D′2 ¤1 − 2���¥ + D′2 ¤1 + 32}�} − 42��¥ cos2S
(2.31)
+ =

P a g e | 43
Za = D′2 ¤1 + 2�
��¥ − D′2 ¤1 + 32}
�} ¥ cos 2S
(2.32)
b�a = − D′2 ¤1 − 32}
�} + 22��� ¥ sin 2S
(2.33)
where �, 2, S is given as polar co-ordinates, circular hole radius and angle from bearing plane
(shown in Figure 2.25) respectively, ? = �}Í� ∗ Z\ and D = 0.5 ∗ ��
� ∗ Z\. An example of stress
distribution in an infinite plate using the de Jong formulation with a 20 mm plate width, 5 mm
hole diameter, and 1.2 mm plate thickness subjected to a tensile load of 2400 N, giving applied
bearing stress of 400 >/::�. The radial stress, tangential stress and shear stress distributions
were plotted along the hole boundary or the net-tension plane, shown in Figure 2.31. The plotted
radial, tangential and shear stresses are normalized by the applied stress.
Figure 2.31: Stress distribution (a) and (b) along hole boundary and (c) along net-tension
using De Jong (1977) superposition method
In early finite element work, most of the researchers were working with 2-D finite element
models and plane stress state following CLPT theory. The simplified 2D models ignore the effect
from the bolt load. Crews, Hong and Raju (1981) completed a parametric study on stress
distributions around the hole boundary for a variation of W/d values to include bolt properties and
contact between bolt and the laminate as shown in Figure 2.32. Stress distributions are strongly
dependent on the anisotropy for both magnitude and location of peak hoop stress on the hole
boundary. Figure 2.33 shows stress concentrations for the tested lay-up in the range 2 ≤ W/d ≤ 10.
The 0º lay-up gave largest stress concentration (about 4.5), followed by cross-ply lay-up (about
3.75) and the lowest stress concentration is with the quasi-isotropic lay-up (about 1.7). This is
consistent with the open-hole problem. This work is later extended to include the effects of
-1.5
-1
-0.5
0
0 45 90 135 180
σr\
σb
Hole boundary, θ°
Euation (2.28)Equation (2.31)Equation (2.28) + (2.31)
(a)
-0.2
0
0.2
0.4
0.6
0.8
1
1.2
0 45 90 135 180
σθ\σ
b
Hole boundary, θ°
Equation (2.29)Equation (2.32)Equation (2.29) + (2.32)
00.2
0.4
0.6
0.8
1
1.2
1 2 3 4 5
σθ\σ
b
a/r
Equation (2.29)
Equation (2.32)
Equation (2.29) + (2.32)

P a g e | 44
friction, pin elasticity, clearance and laminate properties in FEA work by Eriksson et. al (1986)
and Hyer and Klang (1987). These parameters change the location and value of ultimate hoop
stress. Rowlands et. al. (1982) compared strain obtained from finite element model to
experimental strains using strain gauges on the bearing plane. They found that increased friction
was able to redistribute the load and correspondingly the position of the main load-carrying fibres
away from the bearing plane towards the net-tension plane.
Figure 2.32: Radial and tangential stress along hole boundary in different laminate lay-
up as a function of W/d (after Crews et. al., 1981)
Figure 2.33: Tangential stress concentration factors as a function of W/d (after Crews et.
al., 1981)
(0º/±45º/90º) 0º ±45º
(0º/90º)
P a g e | 45
Smith et. al. (1986) developed a stress analysis to incorporate the effect of the lateral pressure
by obtaining averaging through-thickness strain, OQ under the washer area from Bickley (1928) for
a tight fit pin, cosine radial pressure boundary condition and frictionless contact between pin and
composites hole. The OQ in the composite ahead of bolt caused an increase lateral expansion of the
bolt. Thus bolt load increased frictional load transfer and produced greater material compressive
strength due to confining pressure. The increase in axial force generates a larger normal force
(contact force between washer and composite surface) to increase load transfer through friction.
3-D FEA have been computationally expensive, and restrictions in mesh size in layered
models can produce problems in element aspect ratio. A relatively limited amount of work has
been reported in the 3-D analysis of bolted joints. Using 3-D FEA and assuming a perfectly rigid
pin and frictionless contact, Matthews et. al. (1982) studied stress distributions around a single-
bolt and considered three configurations: pin-loaded hole, finger-tight bolt and fully tightened
bolt. In fully tightened bolted joints, significant through-thickness compressive stress was present
but in the pin-loaded case, the maximum through-thickness tensile stress, ZQQ, was found to be
about 7% of the bearing stress. Marshall et. al. (1989) also performed a similar study investigating
the effect of clamping load and stacking sequence. They concluded that an improved stress profile
resulted from clamping where fibre axial, transverse stresses and shear stresses were reduced and
less anisotropic materials were shown to exhibit lower stress concentration factors. Both studies
considered double-lap joint in their analysis and the contact surface is considered uniform through
the laminate thickness.
Secondary bending and bolt bending in single-lap joint create a non-uniform contact stress
distribution between the bolt and hole edge. Ireman (1998) developed a bolted single-lap joint
model to investigate non-uniform stress distributions through the thickness of the laminate in the
bolt vicinity. He modelled a rigid plate to represent the lateral support used to eliminate secondary
bending. Good agreement between measured and calculated strain were obtained. However,
secondary bending was greater in the experiments than the FEA models due to using overly-stiff
elements. A clamped condition case reduced the strain level compared to finger-tight conditions,
and higher strain level were found in countersunk bolts compared to protruding head bolts. Ekh
and Schon (2005) studied the effect of secondary bending and found that it has potential to shift
the failure mode and affect the strength. Secondary bending increased the contact area between
bolt and hole edge which reduced the bearing stress and increased the bearing strength. Secondary

P a g e | 46
bending also increased the plate bending and generated more severe net-tensile conditions leading
to reduced net-tensile strength. Therefore, it is difficult to predict the bearing strength with this
effect of secondary bending and this must be evaluated on an individual basis.
2.4.4 Strength Prediction Methods in Composite Bolted Joints
2.4.4.1 Introduction
Design work in mechanically fastened joints of composite materials is largely based on
experimental data and implementations of analytical models are largely empirical in nature. Most
of the predictive tools discussed in this section are based on two-dimensional models. More
recently, with advanced computing technology, researchers have considered using three-
dimensional models, which are more time and cost-consuming (three dimensional models are
required to consider bolt clamp-up properly). The determination of the joint strength depends
upon the definition of failure, which varies from the maximum load sustained by the joint to a
criterion based on the deformation of the hole.
2.4.4.2 Failure Criterion
Based on a detailed two-dimensional analysis of the stress distribution at the hole boundary,
the peak local stresses are used in a failure criterion to predict laminate strength and mode of
failures. Early works includes Waszak and Cruse (1971) who applied the maximum stress,
maximum strain and distortional energy criteria around the hole. Oplinger and Ghandhi (1974)
used the Hoffman criterion. Chang et. al. (1984) assumed frictionless contact and a cosinusoidal
boundary radial stress distribution and applied progressive failure model. A particular ply was
removed from further analysis on a ply-by-ply basis once the failure criterion in any ply was
achieved, the new stress distribution (as a result of load redistribution to other plies) was
recalculated and the procedure repeated until the total laminate failed. However, predicted
strength was consistently conservative.
The strength of a single layer of composite material can be predicted using a micromechanics
approach or using experimental data. Hashin's (1980) macromechanical analytical models
considered independent fibre and matrix failure modes, generally leading to a very conservative
solution to satisfy the criterion, and hence non-cost effectiveness predictions. Table 2.3 reports the
Hashin failure criteria associated with respective failure modes. Dano et. al. (2000) includes non-
linear shear stress-shear strain relation which was introduced by Tsai-Hahn (1973) and given as;

P a g e | 47
R�� = b��,�� + Yb��m (2.34)
where Ý is a constant that is determined experimentally.
Table 2.3: Hashin failure criterion with associated failure mode
Failure mode Hashin Criteria Non-linear Linear
Matrix tensile failure Z�> 0
kZ�K� l� + b���2,�� + 3Yb��}4D�2,�� + 3YD}4 > 1 kZ�K� l
� + �b��D �� > 1
Matrix Compression Failure
Z�< 0
kZ�K�l� + b���2,�� + 3Yb��}4D�2,�� + 3YD}4 > 1 kZ�K�l� + �b��D �� > 1
Fibre/matrix Shear Failure
Z�< 0
kZ�J�l� + b���2,�� + 3Yb��}4D�2,�� + 3YD}4 > 1 kZ�J�l
� + �b��D �� > 1
Fibre Tensile Failure Z�> 0
kZ�J�l� + b���2,�� + 3Yb��}4D�2,�� + 3YD}4 > 1
kZ�J�l� + �b��D �� > 1
Fibre Compression Failure
Z�< 0
kZ�J�l� > 1
Tsujimoto and Wilson (1986) created a 2-D elasto-plastic finite element model with rigid pin
assuming a cosine load distribution which also included the effects of friction and non-linear shear
stress-shear strain behaviour. A combination of an elastic-perfectly plastic constitutive model and
the Hill yield criterion (flow rule) for orthotropic materials was used. It was found that net-tension
failures were insensitive to friction effects and this particular type of failure mode was predicted
imprecisely. On the other hand, increasing friction, shear-out and bearing strengths increased.
Since cosinusoidal loads were idealized for an isotropic lay-up, the application to modelling non-
isotropic lay-ups was limited.
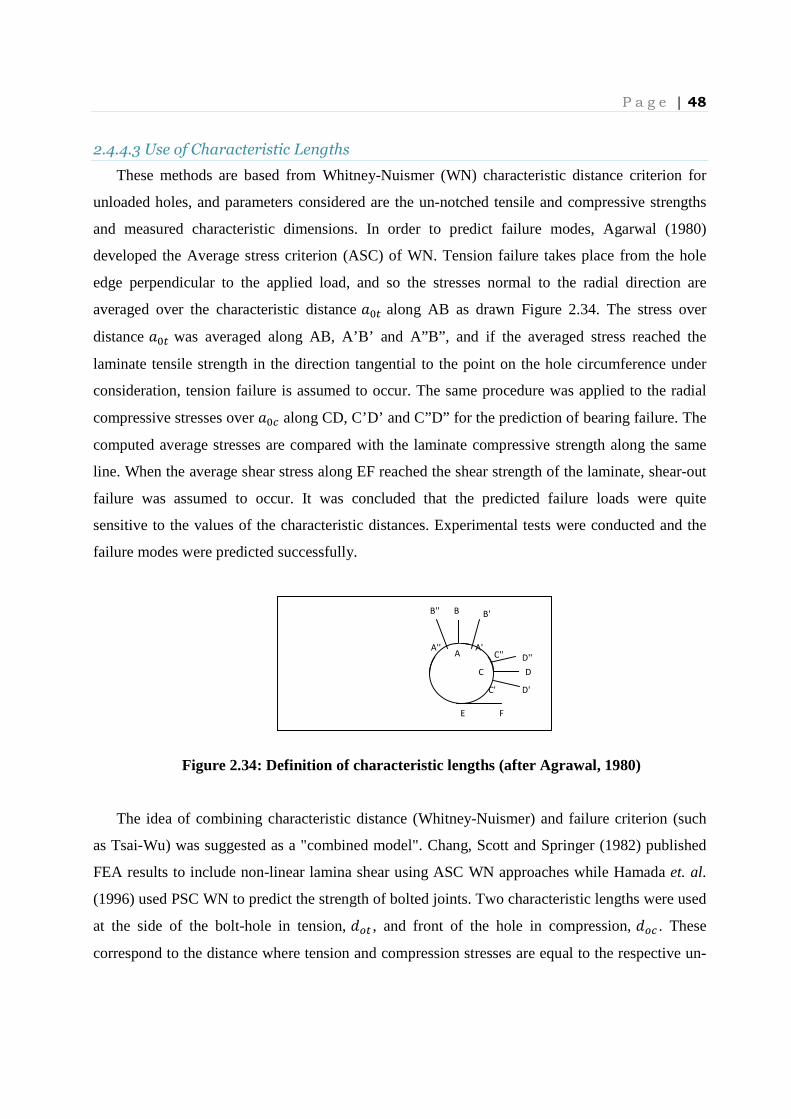
P a g e | 48
2.4.4.3 Use of Characteristic Lengths
These methods are based from Whitney-Nuismer (WN) characteristic distance criterion for
unloaded holes, and parameters considered are the un-notched tensile and compressive strengths
and measured characteristic dimensions. In order to predict failure modes, Agarwal (1980)
developed the Average stress criterion (ASC) of WN. Tension failure takes place from the hole
edge perpendicular to the applied load, and so the stresses normal to the radial direction are
averaged over the characteristic distance ��� along AB as drawn Figure 2.34. The stress over
distance ��� was averaged along AB, A’B’ and A”B”, and if the averaged stress reached the
laminate tensile strength in the direction tangential to the point on the hole circumference under
consideration, tension failure is assumed to occur. The same procedure was applied to the radial
compressive stresses over ��� along CD, C’D’ and C”D” for the prediction of bearing failure. The
computed average stresses are compared with the laminate compressive strength along the same
line. When the average shear stress along EF reached the shear strength of the laminate, shear-out
failure was assumed to occur. It was concluded that the predicted failure loads were quite
sensitive to the values of the characteristic distances. Experimental tests were conducted and the
failure modes were predicted successfully.
Figure 2.34: Definition of characteristic lengths (after Agrawal, 1980)
The idea of combining characteristic distance (Whitney-Nuismer) and failure criterion (such
as Tsai-Wu) was suggested as a "combined model". Chang, Scott and Springer (1982) published
FEA results to include non-linear lamina shear using ASC WN approaches while Hamada et. al.
(1996) used PSC WN to predict the strength of bolted joints. Two characteristic lengths were used
at the side of the bolt-hole in tension, �� , and front of the hole in compression, �� . These
correspond to the distance where tension and compression stresses are equal to the respective un-
D''
D
D'
C''
C'
C
A A'' A'
B B' B''
E F

P a g e | 49
notched laminate, as shown in Figure 2.35. A characteristic curve which connects the
characteristic lengths in tension and compression is therefore needed. Such a curve was
introduced by Scott-Chang-Springer (1982) where the pin joint is modelled by a cosinusoidal
radial stress on loaded side of the hole. Later, Hamada et. al. (1996) improved the definition of
characteristic length for compression. He created new experimental apparatus to obtain �� which
he referred as "bearing failure test". Both papers implemented a two-dimensional finite element
model, assuming a frictionless contact, a crude contact model pin-composite interface and
combine both characteristic lengths with the Yamada-Sun (1978) failure criterion to predict
failure strength and failure mode.
Figure 2.35: Chang-Scott-Springer (1982) characteristic curve
The Yamada-Sun failure criterion equations are given by Equation (2.35). Failure is said to
occur when the parameter, e’ is equal to or greater than unity at any point on the characteristic
curve. When the parameter e is equal to unity on the characteristic curve and the corresponding
angle θ is 0° < S < 15°, the failure mode is the bearing mode. If 30° < S < 60° then it is the
shear-out mode, and if 75° < S < 90°, then it is the tension mode. Failure may be caused by a
combination of these failure modes if the value of θ is in the intermediate range.
kZ.J�l + �b.`D � = �′� ß�′ < 1;À��i9F2��′ ≥ 1��i9F2� � (2.35)
S�
��=1
Characteristic
curve
À�
ÀE
P a g e | 50
where Z. , b.` are longitudinal and shear stresses in each ply, respectively. J� and D are the
longitudinal tensile strength and the shear strength of a symmetric cross-ply laminate having same
number of plies as the laminate under consideration. The characteristic curve is independent of
geometry and stress distribution, but dependent on the material, and is defined as;
2�(S) = 2 + �� + (�� + ��) cosS (2.36)
Eriksson (1987) used a two-dimensional finite element model to apply the point stress
criterion to predict tension failure. It was assumed that failure initiation occurred at points on the
hole boundary where fibres are either tangential or normal to the boundary. The characteristic
distance should be calculated at each one of these points. The concept of a characteristic curve
together with the Yamada-Sun (1978) failure criterion was used to predict bearing failure which
was strongly dependent on lay-up. As the tension failure generally occurred in one defined plane,
the points where the characteristic distances were determined could have been limited. No
comparison with experimental results was made. More recently, Whitworth et. al. (2008) applied
a similar method to Eriksson (1987). They evaluated Chang et. al. (1982) characteristic
dimensions in tension and compression using point stress failure criterion and joint bearing failure
was predicted using Yamada-Sun failure criterion for AS4/3501-6 graphite/epoxy laminates.
Good agreement was found with experimental data in bearing strength as a function of e/d but
conservative results in W/d were obtained. However, prediction of failure mode using Yamada-
Sun failure theory gave good agreement in both e/d and W/d analysis.
Aktas et. al (2004, 2009) determined the failure strength and failure mode experimentally and
numerically of woven-glass epoxy lay-up in a pinned joint using a method which is illustrated in
Figure 2.36. They determined the characteristic length for tension, �� from a tensile test with a
hole and for compression, �� determined from a bearing failure test, both implementing point
stress criterion (PSC) from WN (1974). Stress analysis and stress distribution in each ply were
carried out numerically, then failure criterion and characteristic curves implemented within the
ANSYS finite element package. Good agreement between numerical and experimental results for
strength and failure mode of single-lap and double-lap pinned joints. This approach is more
appropriate to bearing failure, as compressive length behind pin is taken into account.

P a g e | 51
Figure 2.36: Progressive damage model algorithm (after Aktas et. al., 2009)
2.4.4.4 Fracture Mechanics method
As observed in the open-hole case, a fracture mechanics approach treats the local damage at
the hole vicinity as equivalent crack opening with cohesive forces acting on the crack surfaces.
The respective crack demonstrated by matrix cracking and delamination in the tension case
displays linearly decreasing relation between the cohesive stress, Z��^ and the crack opening, δ, as
shown in Figure 2.17(b). To predict the open-hole strength of the composite plate, the normalized
strength obtained in experimental tests was plotted versus the fracture energy, and the results were
plotted versus the fracture energy. For a given crack length, the value of ,� which gives the
fracture load equal to the experimental result is chosen. This method of determining ,� which
most authors referred to "apparent fracture energy" is widely used and reported in the literature.
"Apparent fracture energy" here tends to be "predictive" rather than "actual" as fracture value is
obtained by calibration.
Hollmann (1996) works with an improved damage zone model (DZM) that was initially used
for notched strength prediction by Arronsson and Backlund (1986), to model the failure of
graphite/epoxy bolted joint composite. Hollmann (1996) models the bolt by fixing the contact
angle of the bolt-hole at a predefined angle rather than calculating it. The DZM determined
whether in-plane failure mode was net-tension or shear-out. DZM requires only one FEA
computation as compared with the PDM (progressive damage model), and this makes the DZM
faster and easier to use when analyzing the strength of bolted joints. The PDM models predict the
lamina strength and material degradation without considering the lamina interaction effects and
Bearing Failure
test
Point Stress
Criterion
Characteristic Length for
compressive ��
FEM Stress
Analysis
Stress Distribution
in each ply
Tensile test
with a hole
Point Stress
Criterion
Characteristic Length
for tension ��
Yamada-Sun Criterion +
Characteristic Curve
Prediction of joint failure load &
failure mode
P a g e | 52
dissipated fracture energy. However, Hollmann (1996) determined the fracture energy by
calibration of data from previous researchers associated with extreme temperature normalised to
room temperature. Since the work of Hollmann (1996), there does not appear to have been any
further studies simulating crack growth in bolted joints using the Cohesive Zone Model (CZM)
approach. In other areas of the literature (such as in adhesive joint), there have been many studies
which develop CZM further taking advantages of increased computer power.
Compared to CZM, the developed Extended Finite Element Method (XFEM) were presented
by Belytschko and Black (1999) and consists of local enrichment functions for the nodal
displacement to model crack growth and separation between crack faces. Moes and Belytschko
(2000) successfully simulated crack initiation and propagation along arbitrary path without
requiring the mesh to match the geometry of the discontinuities or remeshing near the crack.
Discontinuities of the crack are simulated as enriched features by allowing discontinuities to grow
through the enrichment of degree of freedom of nearby nodes with special displacement functions.
As the crack-tip changes position and path due to loading conditions, the XFEM algorithm creates
necessary enrichment functions for the nodal points of the finite elements around the crack tip. It
is very attractive because a crack in structures can be easily tracked, and failure mode can be
observed visually.
More recent work by Campilho et. al. (2011) studied the fracture characterization of adhesive
joints in opening mode using XFEM. He used a traction-separation relationship which is
commonly used in CZM in his XFEM model. However, due to mixed mode propagation in
adhesive joints, XFEM fracture prediction is unfeasible as current ABAQUS limitation only
allows a single value of maximum strength for damage initiation. The developments of XFEM
give new possibilities in using traction-separation relationship which is already widely used in
CZM.
2.4.4.5 Progressive Continuum Damage Method
Use of progressive damage modelling had been reported extensively in the literature to predict
failure strength and failure modes in pinned, rivet and bolted joints. Similar steps as discussed in
open-hole plate problem are used in the bolted joint challenge (Section 2.3.4.5). These are able to
provides information for defining failure loads based on design constraints such as maximum hole
deformation or the load at which matrix cracking first appear.
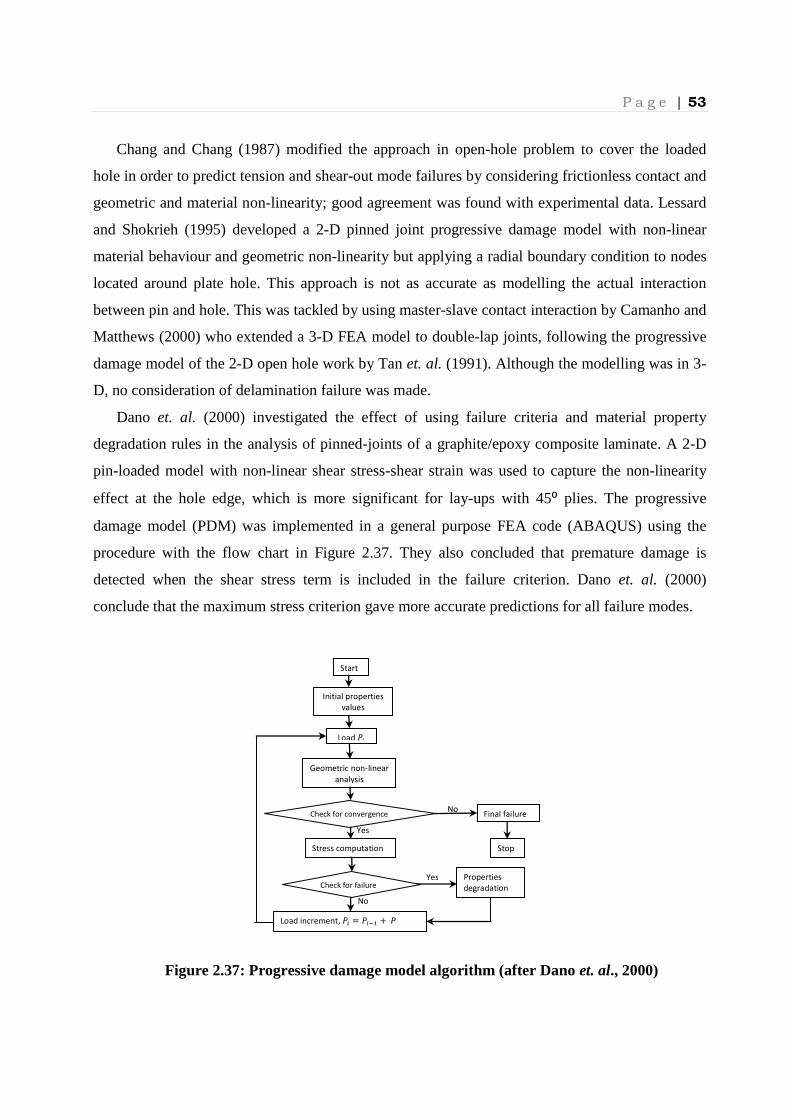
P a g e | 53
Chang and Chang (1987) modified the approach in open-hole problem to cover the loaded
hole in order to predict tension and shear-out mode failures by considering frictionless contact and
geometric and material non-linearity; good agreement was found with experimental data. Lessard
and Shokrieh (1995) developed a 2-D pinned joint progressive damage model with non-linear
material behaviour and geometric non-linearity but applying a radial boundary condition to nodes
located around plate hole. This approach is not as accurate as modelling the actual interaction
between pin and hole. This was tackled by using master-slave contact interaction by Camanho and
Matthews (2000) who extended a 3-D FEA model to double-lap joints, following the progressive
damage model of the 2-D open hole work by Tan et. al. (1991). Although the modelling was in 3-
D, no consideration of delamination failure was made.
Dano et. al. (2000) investigated the effect of using failure criteria and material property
degradation rules in the analysis of pinned-joints of a graphite/epoxy composite laminate. A 2-D
pin-loaded model with non-linear shear stress-shear strain was used to capture the non-linearity
effect at the hole edge, which is more significant for lay-ups with 45⁰ plies. The progressive
damage model (PDM) was implemented in a general purpose FEA code (ABAQUS) using the
procedure with the flow chart in Figure 2.37. They also concluded that premature damage is
detected when the shear stress term is included in the failure criterion. Dano et. al. (2000)
conclude that the maximum stress criterion gave more accurate predictions for all failure modes.
Yes
Start
Initial properties
values
Load
Geometric non-linear
analysis
Check for convergence Final failure No
Stress computation
No
Yes Check for failure
Stop
Properties
degradation
Load increment,
Figure 2.37: Progressive damage model algorithm (after Dano et. al., 2000)

P a g e | 54
A similar outcome was found later by Tserpes et. al. (2002) who developed a 3-D model using
the FEA code ANSYS to implement progressive damage modelling in order to predict the
strength behaviour of finger-tight bolted graphite/epoxy composite laminates joints using Tan’s
degradation law as implemented by Camanho and Matthews (2000). They showed that the
predicted failure load is influenced significantly by the failure criteria and material property
degradation rules chosen. They concluded that introducing a shear stress term into the 3D Hashin-
type failure criteria leads to overestimation of the damage, but that this can be compensated by
using the Maximum Stress Criterion for longitudinal fibre failure mode. They predicted accurately
the stiffness of composite single-lap joint subjected to quasi-static tensile loading and claimed that
using a combination of Maximum Stress for prediction in fibre tensile failure and Hashin failure
criterion for other failure modes, as well as mixed degradation rules led to satisfactory agreement
with experiments.
There are a number of works reported in the literature on woven fabric composites
incorporating progressive damage modelling. Pierron and Cerisier (2000) conducted 2-D
numerical modelling validated against experimental study determining the stiffness and bearing
strength of pinned woven glass fibre epoxy joints. They also include the effect of clearance,
frictional contact and non-linear shear material behaviour. A 10% discrepancy between strength
prediction and the experimental work are reported when using maximum stress as a failure
criterion. İçten and Karakuzu (2002) developed a model for pinned-joint carbon epoxy woven
composite plates using Hashin and Hoffmann’s criteria to predict failure load and failure mode.
They did not model true contact but assumed cosine normal load distribution inside the hole bore.
Close agreement between experimental results and numerical prediction was reported. Karakuzu
et. al. (2006) studied two geometrical effects (W/d and e/d between 1-5) and determines bearing
strength, damage progression in woven glass-vinylester composite plates using experimental tests
and FEA modelling. Although they developed a 3-D model, the bore of the hole was constrained
in a radial direction to idealise the pin traction. The FE code LUSAS was used and the Hashin
failure criteria were incorporated. Good agreement was reported.
2.4.4.6 3-D Modelling incorporating Bolt Loads
Most of the analytical and numerical models discussed so far only consider pin joints, which
do not incorporate the benefits from bolt compression. Composite joints incorporating bolt
loading require a 3D model due to the existence of out-of-plane stresses as imposed by the bolt.
P a g e | 55
Contribution from the clamping load will restrain the lateral splitting that can occur in plates and
also increase the load transfer due to friction between the plates so reducing the pin bearing loads.
These factors tend to increase the failure load of the joint as described in experimental
observations and can change failure mechanisms too. As emphasised by Ireman (1998), through-
thickness effects in composite bolted joints need to be investigated to develop engineering design
methods.
Most 3-D strength prediction work has been implemented within a progressive damage
modelling framework. McCarthy and McCarthy (2005a, 2005b) conducted extensive 3-D
modelling of single-bolt, single-lap joint configurations. They discuss in detail the use of proper
contact interaction between bolt-hole and other contact regions. Using a three-dimensional model
the computational work is able to capture through-thickness behaviour, such as secondary bending
and out-of-plane stresses. Although they did not conduct strength prediction work, they did
compared stress, strain and stiffness reduction and compared these with experimental data.
However, this work concentrated more on bearing failures and the use of Hashin failure criterion,
to evaluate the damage state along hole boundary where first fibre compressive was detected.
As the single-lap joint exhibits secondary bending due to the eccentricity of the load, a 3-D
model exhibits non-uniformity of contact stresses as the tension load is applied. This is also the
case in double-lap joints but to a much lesser extent. Bolt torques induce lower interlaminar
tensile direct stress or higher interlaminar compressive direct stress near the hole. Riccio (2005b)
developed a 3-D progressive damage FEA model based on Hashin’s failure criteria and ply
discount degradation rules for bolted single-lap joints. The ply discount method is easily
implemented as when failure occurs, the elastic material properties are set to zero or small fraction
of original value (0.1 was used in this case). He analyzed in-depth damage onset and propagation
under tensile loading and correlated with experimental data for both protruding and countersunk
bolt heads. Numerical and experimental load-displacement curves were shown to be in good
agreement.
Chisti et. al. (2010) investigated single-lap countersunk bolted composite joints of plain weave
carbon/epoxy using Hashin’s failure criterion and a crack-band based continuum damage
mechanics approach were both used to track ply fracture. Both approaches are reported to
accurately predict the damage progression, initial stiffness and ultimate failure loads where both

P a g e | 56
experimental and numerical investigation showed that bolt torque has a minimum effect on the
strength. They later expanded the work to include delamination by using cohesive elements.
2.5 Concluding Remarks
A comprehensive review of the published literature concerned with stress analysis and
strength prediction approaches relating to open holes and bolted joints in composite plate and
associated experimental data has been presented. Particular focus has been given to the relatively
small number of studies concerned specifically with composites based on woven fabric
reinforcement.
Experimental observations have been reported for both open-hole (woven GFRP and woven
CFRP) and bolted joints (woven GFRP) under quasi-static loading. It has been shown that for
tensile fracture at open holes and for net-tension failure at bolted joints, local damage occurs in a
self-similar fashion with the damage comprising matrix cracking and splitting, delaminations and
fibre tow fractures.
There are a great many models available in the literature, which enable the strength of
laminates with open holes to be predicted. Many of these are semi-empirical, with the Whitney-
Nuismer models perhaps being the most widely used. For woven fabric composite, because of the
nature of the damage, fracture mechanics models are perhaps appropriate. These can be either of a
relatively simple form, such as the closed-form damage growth model, or can involve the use of a
Cohesive Zone Model (CZM) type of approach (representing material softening) within a FEA
framework. For the latter, it should perhaps be possible to use independently measured values of
strength and toughness, rather than fitting these to experimental data. Work is also needed to see
whether this can be treated using an Extended Finite Element Method (XFEM) framework.
With regard to the bolted joint problem, there are some relatively simple analytical
approaches to the stress analysis; these mainly treat the problem as two-dimensional. In reality,
the effects of finite joint geometry, friction between the bolt and hole and the effect of bolt clamp-
up can only really be treated rigorously within a finite element framework and most strength
prediction methods are based on FEA. Again the characteristic distance approaches have been
popular and there are some ply-by-ply approaches. Relatively few authors have considered using
the CZM (fracture mechanics) type of approach, even though this would seem relevant for net
tension failure, especially in woven fabric systems. An exception is the study by Hollman (1996),
although the simplifications in his FEA models mean that load transfer is not properly modelled

P a g e | 57
and the constitutive law parameters are fitted rather than measured independently. Hence there is
considerable scope to develop this approach, using CZM and XFEM, possibly using 3-D FEA to
capture clamp-up effects. There is also a need for further experimental data to validate strength
predictions, especially for woven CFRP.
The next part of this thesis considers strength prediction of woven composite plates
containing open-holes using CZM and XFEM with independently measured material parameters,
where available. This work is then extended to bolted joints in GFRP woven fabric, with reference
to the experimental study carried out by Kontolatis (2000). Initial work will use a 2-D FEA. An
experimental programme for CFRP woven fabric is then presented, which will include single-lap
joint (SLJ) as well as double-lap joint (DLJ) and the effect of hole size. Two FEA approaches for
incorporating damage will be used within 3-D FEA models for both GFRP and CFRP (a) the
cohesive zone model (CZM) and (b) the extended finite element (XFEM). The computational
results will be compared with results from a series of physical tests.

P a g e | 58
Chapter 3 : Finite element modelling of
Open-Hole Geometry
3.1 Introduction
Based on the literature review in Chapter 2, it is apparent that an appropriate failure model for
open-hole woven fabric composites under tensile loading must consider the damage growth from
the hole explicitly. There are a number of essentially similar techniques that treat the problem in
this way. A particular stress-displacement relation is assumed within the damage zone and the
energy absorbed in separating the crack faces corresponds to the material toughness, ,�. One of
the first models to adopt this method was that of Eriksson and Aronsson (1990) who assumed a
constant cohesive stress-displacement relationship within the damage zone. An approximate
analytical version of this approach, a "critical damage growth" (CDG) model, was presented by
Hitchen et. al (1994), building on earlier work by Soutis and Fleck (1990), and this was applied
subsequently to woven composites by Belmonte (2001, 2004). Afaghi-Khatibi et. al. (1996a,
1996b) presented an "equivalent crack growth model" (ECGM) which assumed a linear decrease
of cohesive stress with displacement in the damage zone, which they applied successfully to the
data of Kim et al. (1995).
The present work explores further the applicability of this type of approach, which in the
present chapter is incorporated within an extended finite element method (XFEM) formulation. A
method limitation of the previous studies is that the material parameters within the models have
generally been calibrated against experimental data rather than determined independently. Here
the author use independent measurements of un-notched strength and toughness, where available,
to develop numerical models for the experimental studies on woven fabric systems conducted
using GFRP (Kim et. al. (1995)) and using GFRP (Belmonte et al., (2001)) and CFRP (Belmonte
et al., (2004)). In the next section, details of the numerical procedure are provided. XFEM
predictions are compared with experiment and other closed-form solutions in subsequent sections.
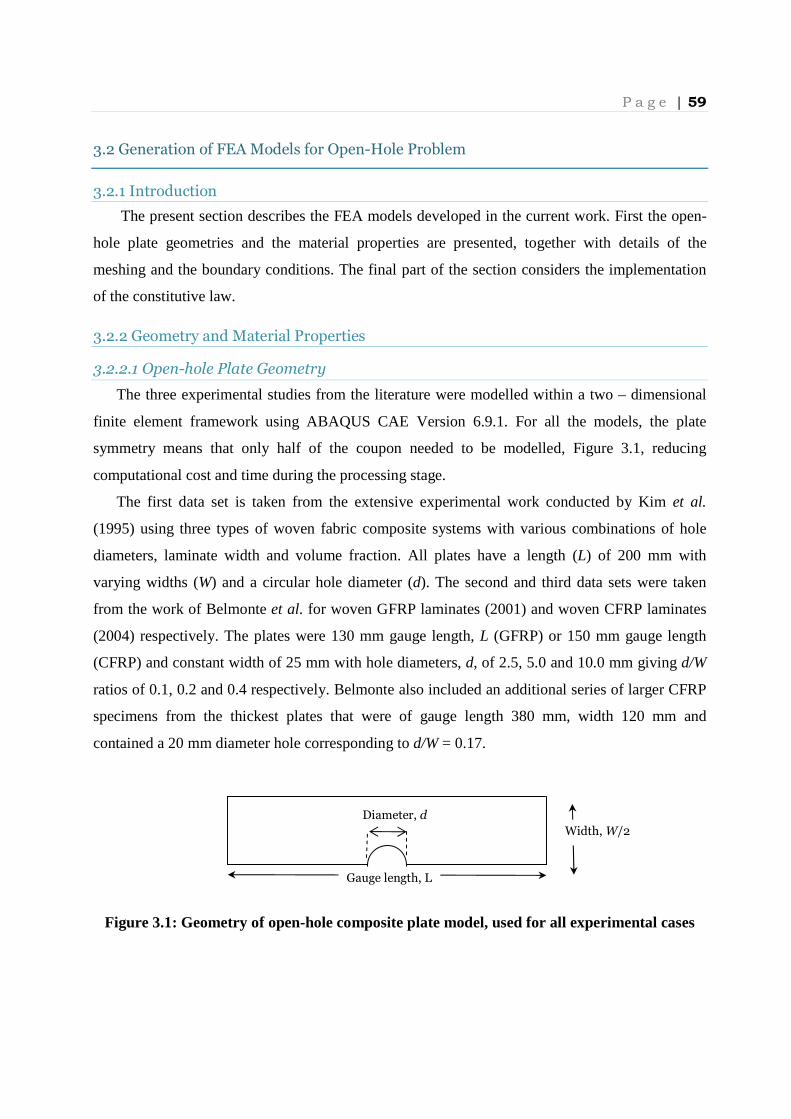
P a g e | 59
3.2 Generation of FEA Models for Open-Hole Problem
3.2.1 Introduction
The present section describes the FEA models developed in the current work. First the open-
hole plate geometries and the material properties are presented, together with details of the
meshing and the boundary conditions. The final part of the section considers the implementation
of the constitutive law.
3.2.2 Geometry and Material Properties
3.2.2.1 Open-hole Plate Geometry
The three experimental studies from the literature were modelled within a two – dimensional
finite element framework using ABAQUS CAE Version 6.9.1. For all the models, the plate
symmetry means that only half of the coupon needed to be modelled, Figure 3.1, reducing
computational cost and time during the processing stage.
The first data set is taken from the extensive experimental work conducted by Kim et al.
(1995) using three types of woven fabric composite systems with various combinations of hole
diameters, laminate width and volume fraction. All plates have a length (L) of 200 mm with
varying widths (W) and a circular hole diameter (d). The second and third data sets were taken
from the work of Belmonte et al. for woven GFRP laminates (2001) and woven CFRP laminates
(2004) respectively. The plates were 130 mm gauge length, L (GFRP) or 150 mm gauge length
(CFRP) and constant width of 25 mm with hole diameters, d, of 2.5, 5.0 and 10.0 mm giving d/W
ratios of 0.1, 0.2 and 0.4 respectively. Belmonte also included an additional series of larger CFRP
specimens from the thickest plates that were of gauge length 380 mm, width 120 mm and
contained a 20 mm diameter hole corresponding to d/W = 0.17.
Figure 3.1: Geometry of open-hole composite plate model, used for all experimental cases
Gauge length, L
Width, W/2
Diameter, d

P a g e | 60
3.2.2.2 Material properties
Table 3.1 shows the cross-sectional and material properties for all the woven fabric systems
investigated experimentally by Kim et al. (1995) that are to be modelled. The elastic properties
are required for the stress analysis while to implement the damage model the un-notched strength,
σo and the fracture energy, Gc are also required. Independently measured values for the latter were
not reported by Kim et al.(1995). Instead they derived their values from an analysis of the open-
hole tensile strength experimental data and this is the origin of the hole size dependent data
(strength and fracture energy) seen in Table 3.1, apparent with the glass-epoxy in particular. In the
absence of independently measured properties, these fracture energy values are used in the current
work as it enables comparison not only with the experimental data from Kim (1995) but also with
the ECGM approach, which has been applied to the same data set (Afaghi-Khatibi, 1996b).
Table 3.1: Material properties of woven fabric system conducted by Kim et. al (1995)
Materials type
Thickness, t (mm)
Vf (%)
Exx (GPa)
Eyy (GPa)
Gxy
vxy Width (mm)
Un-notched strength, σo (MPa)
Fracture energy, àá (kJ/m2)
Glass-
Epoxy
2.0 62 23.6 23.6 4.0 0.11 10 351 12.6
20 40
319 275
21.2 33.1
Glass-
Polyester
2.3 60 21.6 21.6 3.9 0.16 10 30
309 296
14.9 17.5
2.3 44.5 14.7 14.7 2.7 0.17 10 30
218 198
7.50 8.00
Carbon-
Epoxy
1.2 60 56.7 56.7 8.7 0.22 10 20
596 581
30.5 45.0
Vf = fibre volume fraction
Exx = longitudinal modulus of elasticity
Eyy = transverse modulus of elasticity
vxy = Major Poisson’s ratio
t = laminate thickness
The material properties for the system investigated by Belmonte et. al. (2001, 2004) are listed
in Tables 3.2 and 3.3. The GFRP systems comprised two stacking sequences of a four-layer quasi-
isotropic composite (Table 3.2). The woven CFRP systems investigated were of two types (a plain
weave and a five harness satin weave, two different lay-ups (cross-ply and quasi-isotropic) and
three different plate thickness for each giving 12 systems in total (Table 3.3). In contrast with

P a g e | 61
other researchers such as Kim et al. (1995), Belmonte et al. (2001, 2004) reported values of
fracture energy that were measured independently for each lay-up using single-edge-notch
fracture mechanics specimens in accordance with ASTM E 399-90.
Table 3.2: Material properties for woven GFRP from Belmonte et. al. (2001)
Stacking
sequence
t
(mm)
Ex
(GPa)
Ey
(GPa)
vxy
Gxy
(GPa)
σo
(MPa)
Gc
(kJ/m2)
(0°/90°/±45°)s 1.25 15.9 ± 0.3 15.9 ± 0.3 0.3 ± 0.001 6.10 291 20.3 ± 2.2
(90°/0°/±45°)s 1.25 16.0 ± 0.3 16.0 ± 0.3 0.3 ± 0.001 6.10 291 20.3 ± 2.2
*The un-notched strength and toughness values for the (90°/0°/±45°)s stacking sequence was assumed to be the same as for the (90°/0°/±45°)s stacking sequence
Table 3.3: Material properties all woven CFRP from Belmonte et. al. (2004)
Series Laminate
code
t
(mm)
Ex
(GPa)
Ey
(GPa)
vxy
Gxy
(GPa)
σo
(MPa)
Gc
(kJ/m2)
Plain weave cross-
ply (PX)
PX2 0.51 50.4 ± 0.6 50.4 ± 0.6 0.103 4.42 481 ± 9.2 26.0 ± 3.2
PX4 1.03 51.4 ± 1.4 51.4 ± 1.4 0.092 4.42 527 ± 67 27.7 ± 5.8
PX8 2.03 53.1 ± 1.8 53.1 ± 1.8 0.083 4.42 538 ± 54 22.7 ± 3.4
Plain weave quasi-
isotropic (PQ)
PQ4 1.02 37.2 ± 0.3 37.2 ± 0.3 0.353 13.8 390 ± 11 21.6 ± 5.1
PQ8 2.03 36.8 ± 0.8 36.8 ± 0.8 0.328 13.9 428 ± 14 17.9 ± 3.4
PQ12 3.17 35.2 ± 0.8 35.2 ± 0.8 0.297 13.6 372 ± 13 18.3 ± 3.7
5 Harness satin
cross-ply (5X)
5X2 0.81 45.1 ± 0.8 45.1 ± 0.8 0.077 3.78 419 ± 49 28.8 ± 8.5
5X4 1.60 47.0 ± 0.8 47.0 ± 0.8 0.062 3.78 535 ± 14 20.0 ± 5.2
5X8 3.15 47.4 ± 0.9 47.4 ± 0.9 0.053 3.78 456 ± 8.4 17.6 ± 2.0
Plain weave quasi-
isotropic (5Q)
5Q4 1.53 34.1 ± 0.3 34.1 ± 0.3 0.296 13.2 375 ± 22 19.2 ± 2.2
5Q8 3.17 33.5 ± 0.8 33.5 ± 0.8 0.320 12.7 347 ± 16 16.8 ± 2.5
5Q12 4.59 34.8 ± 0.9 34.8 ± 0.9 0.322 13.2 370 ± 17 12.9 ± 2.1
3.2.2.3 Fracture Energy
Fracture energy was determine independently by Belmonte (2002) and as this parameter is
essential for further work, this sub-section briefly summarises that work. The critical strain energy
release rate (SERR) measured from single-edge notch (SEN) specimens follows ASTM Standard
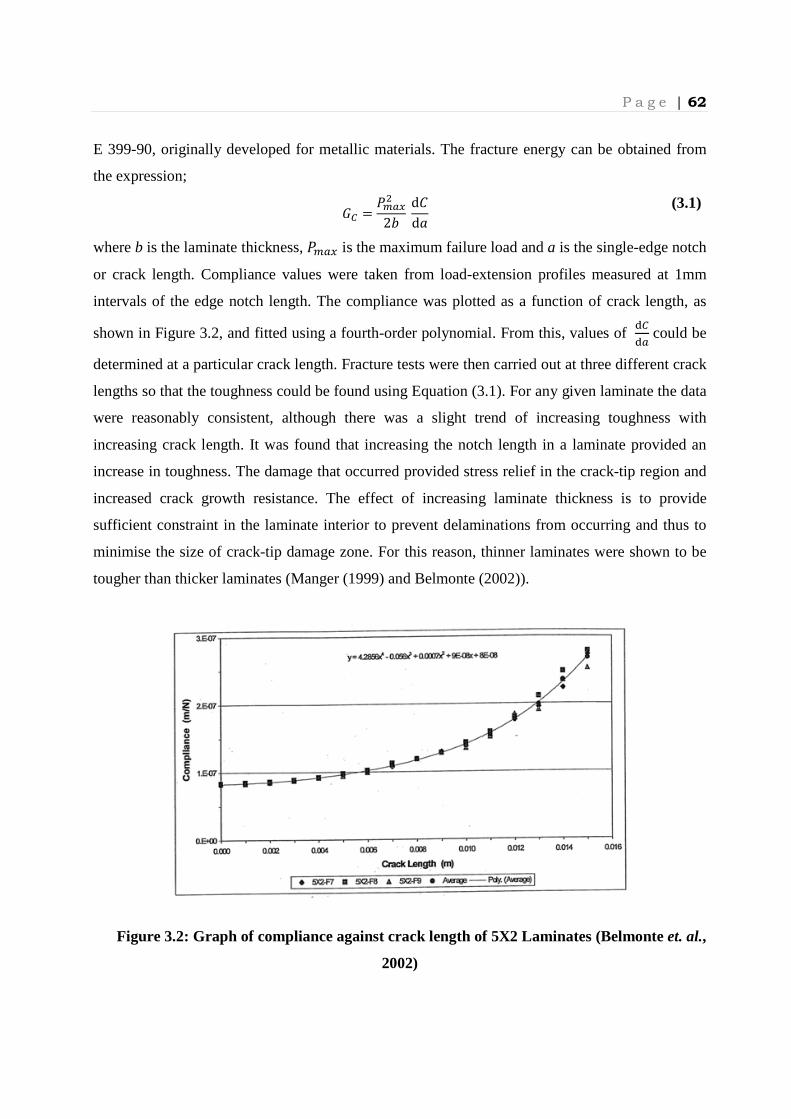
P a g e | 62
E 399-90, originally developed for metallic materials. The fracture energy can be obtained from
the expression;
,/ = @AB.�2� d�d�
(3.1)
where b is the laminate thickness, @AB. is the maximum failure load and a is the single-edge notch
or crack length. Compliance values were taken from load-extension profiles measured at 1mm
intervals of the edge notch length. The compliance was plotted as a function of crack length, as
shown in Figure 3.2, and fitted using a fourth-order polynomial. From this, values of ã/ãB could be
determined at a particular crack length. Fracture tests were then carried out at three different crack
lengths so that the toughness could be found using Equation (3.1). For any given laminate the data
were reasonably consistent, although there was a slight trend of increasing toughness with
increasing crack length. It was found that increasing the notch length in a laminate provided an
increase in toughness. The damage that occurred provided stress relief in the crack-tip region and
increased crack growth resistance. The effect of increasing laminate thickness is to provide
sufficient constraint in the laminate interior to prevent delaminations from occurring and thus to
minimise the size of crack-tip damage zone. For this reason, thinner laminates were shown to be
tougher than thicker laminates (Manger (1999) and Belmonte (2002)).
Figure 3.2: Graph of compliance against crack length of 5X2 Laminates (Belmonte et. al.,
2002)

P a g e | 63
Table 3.2 shows that in CFRP woven fabric systems, cross-ply lay-ups give significantly higher
fracture energy than quasi-isotropic lay-ups. This is a consequence of the higher proportion of 0°
fibres in the cross-ply lay-up. This parameter can be treated as a material property as it is
measured independently from separate experimental set-up and potentially used in other types of
problems.
3.2.3 Meshing and Boundary Conditions
A typical plane stress mesh used in the FEA modelling for the open-hole plate problem is
shown in Figure 3.3. The meshes are refined in the vicinity of hole edge, while away from the
hole the mesh can be made coarser. A mesh refinement sensitivity study was undertaken and is
discussed in a Section 3.2.5. Belmonte has described that local failure events concentrate at the
vicinity of the hole edge including delamination, matrix cracking and ultimately fibre tow failures.
When the damage reaches a certain distance from the hole edge, catastrophic failure occurs.
Hence the hole edge vicinity is the region of interest for researchers and sufficient mesh
refinement should be made in this region.
Figure 3.3: Mesh of the model implemented
The boundary and loading conditions for the half open-hole plate geometry are shown in
Figure 3.4. The left hand side of the plate is held fixed and displacement is applied on the right
free edge. Bottom edge of the plate is assigned y-symmetry as only half of the plate is modelled.
Figure 3.4: Boundary condition and loading applied in open hole problem
XFEM/CZM region

P a g e | 64
3.2.4 Implementation of the constitutive damage law in FEA Modelling
3.2.4.1 Introduction
Physically-based constitutive laws are used in this study to implement opening mode response
based on fracture mechanics fundamentals. As indicated earlier, in the open-hole plate under
increasing tensile load, damage is assumed to grow in a self-similar manner along the plane of net
section (reduced area). Hence only the crack opening (mode 1) needs to be considered. In this
work, two methods for modelling the damage have been used, namely the cohesive zone model
(CZM) and the extended finite element method (XFEM). All of the data were modelled using
XFEM and some of Belmonte et al.’s (2001, 2004) data was also modelled using CZM. Both
methods use the same traction-separation material model, illustrated schematically in Figure 3.5,
embedded within a mesh of 2D continuum elements having a linear elastic plane stress response.
This material model behaves in a linear manner until the stress reaches a critical value
(strength parameter) and then unloads with increasing displacement dissipating the fracture energy
(,�) in the process. Three particular points are highlighted in Figure 3.5. Between Points 1 and 2,
entire cohesive energy is absorbed and no material separation has occurred. With increasing
interface separation, cohesive traction reaches a maximum shown as Point 2 (NAB. , ZAB.) then
decreases and eventually vanishes at Point 3 permitting complete material separation (N��[ ,
Z��^ = 0) providing the energy absorption required for decohesion. The area under traction-
separation plot is numerically equal to the toughness, ,�. This traction-separation relationship is
described by two independently measured parameters; the cohesive strength parameter has been
taken as the un-notched tensile strength (Z�) and toughness (,�) of the laminate. Parameters for
the first data set of Afaghi-Khatibi (1996b) are taken by calibration from available literature, given
in Table 3.1. Second and third data set parameters are independently measured from experimental
work (Belmonte et al. (2001, 2004) and are shown in Table 3.2 and Table 3.3 respectively. In the
next sub-sections, the CZM and XFEM approaches are discussed in more detail.
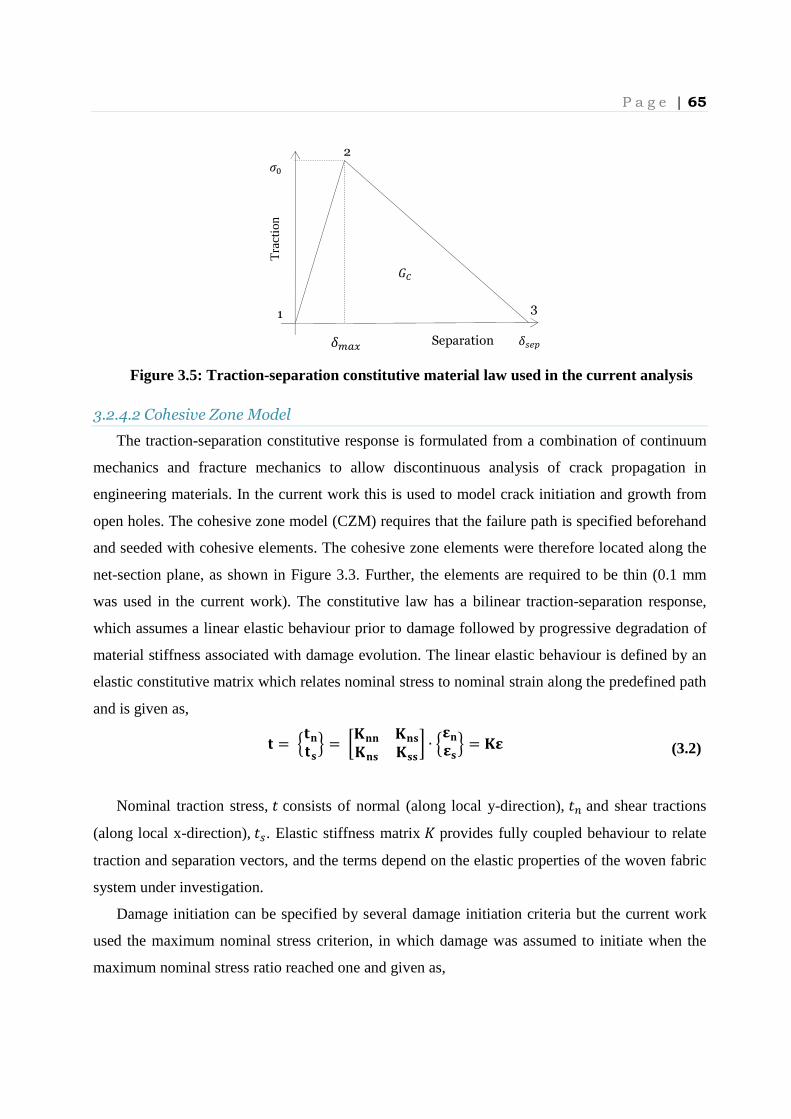
P a g e | 65
Figure 3.5: Traction-separation constitutive material law used in the current analysis
3.2.4.2 Cohesive Zone Model
The traction-separation constitutive response is formulated from a combination of continuum
mechanics and fracture mechanics to allow discontinuous analysis of crack propagation in
engineering materials. In the current work this is used to model crack initiation and growth from
open holes. The cohesive zone model (CZM) requires that the failure path is specified beforehand
and seeded with cohesive elements. The cohesive zone elements were therefore located along the
net-section plane, as shown in Figure 3.3. Further, the elements are required to be thin (0.1 mm
was used in the current work). The constitutive law has a bilinear traction-separation response,
which assumes a linear elastic behaviour prior to damage followed by progressive degradation of
material stiffness associated with damage evolution. The linear elastic behaviour is defined by an
elastic constitutive matrix which relates nominal stress to nominal strain along the predefined path
and is given as,
ä = åäæäçè = �éææ éæçéæç éçç� ∙ åêæêçè = éê (3.2)
Nominal traction stress, E consists of normal (along local y-direction), E¹ and shear tractions
(along local x-direction),E�. Elastic stiffness matrix 4 provides fully coupled behaviour to relate
traction and separation vectors, and the terms depend on the elastic properties of the woven fabric
system under investigation.
Damage initiation can be specified by several damage initiation criteria but the current work
used the maximum nominal stress criterion, in which damage was assumed to initiate when the
maximum nominal stress ratio reached one and given as,
Z�
3
,/ Tra
ctio
n
Separation
1
2
N��[ NAB.

P a g e | 66
:�* ë⟨E¹⟩E¹�
, E�E��î = 1
(3.3)
where E¹�and E�� represent peak nominal stress for normal or shear components respectively. The
Macaulay bracket ⟨ ⟩ prevents compression damage. In practice the effect of the second term is
negligible for Mode I problems. After the damage initiation criterion is met, damaged material
stiffness is degraded according to damage evolution law. The damage evolution law controls the
damage process zone associated with rate of material stiffness degradation after the initiation
criterion had met. Damage evolution relates to the ability of remaining un-cracked region to
sustain more loads, with the damage variable, � ranging from 0 (damage initiation) to 1 (fully
damaged). Current work concentrates on Mode I failure, the effect from shear mode being
negligible. Failure occurs when
,¹,� = 1
(3.4)
where the parameter ,¹ is the work done by the traction and corresponding relative displacements
in the normal directions, and ,� is the critical fracture energy for Mode 1. The mode-mix is
insignificant; therefore “mode-independent” option in ABAQUS is used as damage evolution for
this study.
Cohesive elements (COH2D4) were used within cohesive zone region and 8-noded quadratic
plane stress elements (CPS8) were used in the un-cracked region. Along common interfaces the
elements were connected using a tie constraint.
3.2.4.3 Extended Finite Element (X-FEM) Modelling
Damage propagation can also be simulated using extended finite element method (XFEM).
The XFEM formulation is embedded in ABAQUS CAE and the basic principles and analysis
techniques are briefly described here. It is an extension to conventional FEA which is based on the
integration of an enriched function with additional degrees of freedom but retaining properties
such as sparsity and symmetry. This enriched function consists of near-tip asymptotic functions to
capture singularity around the crack-tip and a discontinuity function that allows modelling of the
displacement jump between crack faces during crack propagation. The displacement vector F that
includes the displacement enrichment can be approximated as,

P a g e | 67
F = ¸ >�(*)wxxxyF� + 0(*)��ïðñðò�∈�ô
+ ¸ ��(*)���}
�¶�ïðððñðððò�∈�õ �����_
�¶� (3.5)
where the first expression of >�(*)and F� are associated with conventional FEM techniques
corresponding to the element shape functions and nodal displacement vector, linked to the
continuous part of the formulation. The second expression, Heaviside function type, 0(*)�� is
active in the nodes (46)when the related shape function is cut by an interior crack and can be
expressed as a product of nodal enriched degree of freedom vector �� with associated
discontinuous jump shape function, 0(*) across the crack surfaces that is given as
0(*) = å1i�(* − * ∗) ∙ ; ≥ 0−1ÀEℎ�2Iiz� � (3.6)
*is a Gauss integration point, x* is the point of the crack closest to x, and n is the unit vector
normal to the crack at x* as shown in Figure 3.6. 0(*) = 1 when * is on or above the crack, and
H(x) = -1 if otherwise.
Figure 3.6: Normal and tangential coordinates for an arbitrary crack (after ABAQUS)
The last expression is considered in nodes (47)whose shape function support is cut by the
crack tip and is given by the product of nodal enriched degree of freedom vector of this node set, ��� and the associated elastic asymptotic crack tip functions, ��(*) used in ABAQUS for
stationary cracks and not used in current case.
The approach is based on establishing phantom nodes that subdivide an element cut by the
crack and simulate separation between the newly created sub-elements. This approach discards the
asymptotic functions and the formulations only includes displacement jump. From Figure 3.7, 46
and 47 enriched nodes are represented by squares and circles respectively.
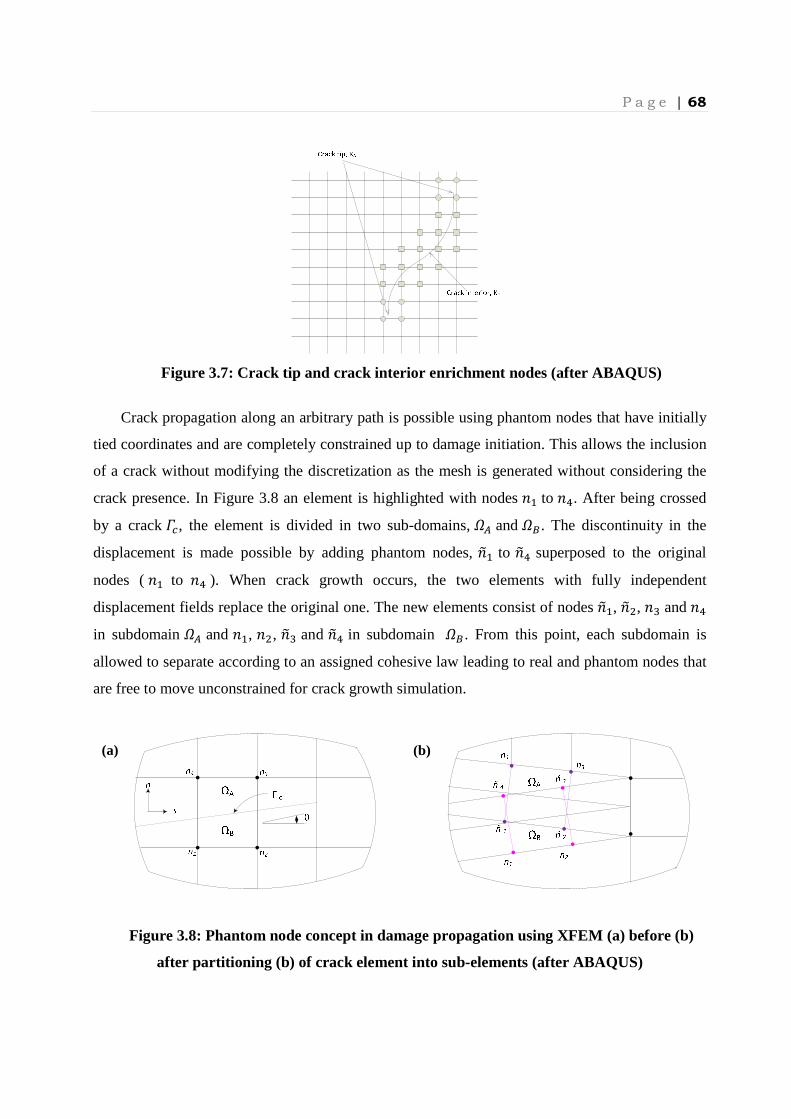
P a g e | 68
Figure 3.7: Crack tip and crack interior enrichment nodes (after ABAQUS)
Crack propagation along an arbitrary path is possible using phantom nodes that have initially
tied coordinates and are completely constrained up to damage initiation. This allows the inclusion
of a crack without modifying the discretization as the mesh is generated without considering the
crack presence. In Figure 3.8 an element is highlighted with nodes ;� to ;}. After being crossed
by a crack d�, the element is divided in two sub-domains, cö and c÷. The discontinuity in the
displacement is made possible by adding phantom nodes, ;ø� to ;ø} superposed to the original
nodes (;� to ;} ). When crack growth occurs, the two elements with fully independent
displacement fields replace the original one. The new elements consist of nodes ;ø�, ;ø�, ;m and ;}
in subdomain cö and ;�, ;�, ;øm and ;ø} in subdomain c÷. From this point, each subdomain is
allowed to separate according to an assigned cohesive law leading to real and phantom nodes that
are free to move unconstrained for crack growth simulation.
Figure 3.8: Phantom node concept in damage propagation using XFEM (a) before (b)
after partitioning (b) of crack element into sub-elements (after ABAQUS)
(a) (b)

P a g e | 69
Regardless of the choice taken, ABAQUS initiates and propagates damage at regions
experiencing principal stresses or strains greater than corresponding limiting values (critical
traction and material toughness) specified in traction-separation law. Crack initiation and crack
propagation will always take place orthogonally to the maximum principal stresses. The strength
prediction is relatively mesh independent since crack growth is ruled by energetic criteria. Similar
parameters to those used in CZM are implemented in XFEM. It should be emphasized that, due to
the intrinsic principles of XFEM, only one strength parameter is introduced in ABAQUS
corresponding to maximum principal strength/strain that will trigger the damage initiation.
Damage evolution is controlled by a damage parameter, �which is determined from the current
separation, and the release separation (determined from ,� and Z�). Fracture makes the structural
response non-linear and numerical methods can experience difficulty converging to a solution. A
damage stabilisation coefficient has been used to facilitate convergence and a parametric study
was undertaken to determine the optimum value (small enough not to influence the solution
values but large enough to allow convergence to be obtained).
The XFEM region (i.e. the region capable of sustaining damage) was assigned to a band of the
model adjacent to the hole edge (see Figure 3.3). Four-node two-dimensional plane stress
elements (CPS4) were used as the current implementation of XFEM only worked in conjunction
with first order-elements. Although XFEM is associated with nodal enrichment that increases
number of degree of freedom the required computational effort to solve the system equations is
usually modest because nodal enrichment is performed locally in the neighbourhood of the crack.
3.2.5 Sensitivity study
Two types of parametric studies were carried out to determine the sensitivity of the strength
prediction to key model parameters (10 mm wide glass/epoxy with 0.4 mm hole diameter was
chosen for this purpose). The first study was to determine an acceptable viscous regularisation
value to use to ensure the strength prediction results were independent from the viscosity constant.
It was found that it was difficult to obtain converged solutions if the viscosity was too low,
however, as can be seen, high viscosity values gave excessive and non-physical results. From
Figure 3.9 a viscosity of 0.0001 is sufficient as lower values produce similar results. In this work a
maximum value of 10-5 was used.
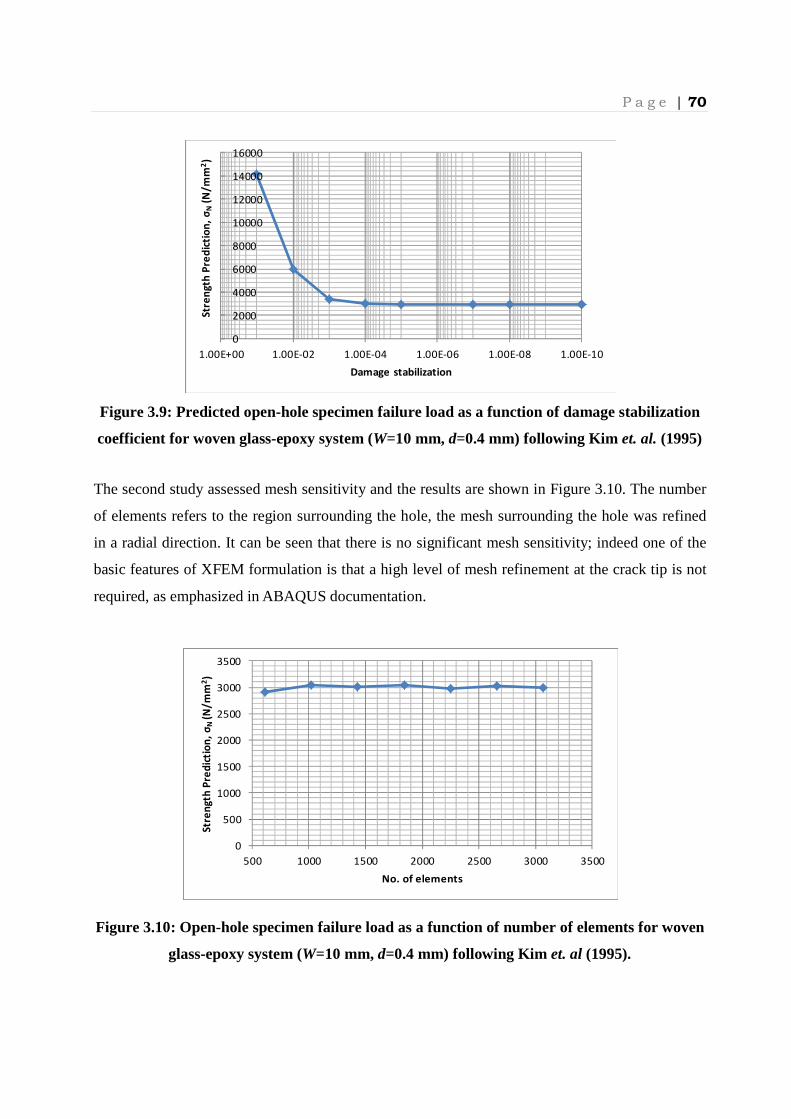
P a g e | 70
Figure 3.9: Predicted open-hole specimen failure load as a function of damage stabilization
coefficient for woven glass-epoxy system (W=10 mm, d=0.4 mm) following Kim et. al. (1995)
The second study assessed mesh sensitivity and the results are shown in Figure 3.10. The number
of elements refers to the region surrounding the hole, the mesh surrounding the hole was refined
in a radial direction. It can be seen that there is no significant mesh sensitivity; indeed one of the
basic features of XFEM formulation is that a high level of mesh refinement at the crack tip is not
required, as emphasized in ABAQUS documentation.
Figure 3.10: Open-hole specimen failure load as a function of number of elements for woven
glass-epoxy system (W=10 mm, d=0.4 mm) following Kim et. al (1995).
0
2000
4000
6000
8000
10000
12000
14000
16000
1.00E-101.00E-081.00E-061.00E-041.00E-021.00E+00
Stre
ngt
h P
red
icti
on
, σ
N(N
/mm
2)
Damage stabilization
0
500
1000
1500
2000
2500
3000
3500
500 1000 1500 2000 2500 3000 3500
Stre
ngt
h P
red
icti
on
, σ
N (N
/mm
2)
No. of elements

P a g e | 71
3.3 Open-hole Tensile Strength Predictions Based On Afaghi-Khatibi’s (1996b) Work
Typical load-displacement plots from the XFEM modelling are shown in Figure 3.11, giving
results from 10 mm wide glass/epoxy lay-up plates with hole diameter, d of 0.3, 2 and 5 mm.
Corresponding damage plots at specific points on the loading history with d = 2 mm , indicated on
the graph, are illustrated in Figure 3.12. Due to the stress concentration at the hole under tension,
the onset of damage is located at the hole edge as expected. After damage initiation, the coupon
was still able to carry increased load until the extent of damage reached about one hole diameter
in length, at which point ultimate failure occurred. It would appear that the length of the process
zone is critical in determining ultimate failure. This separation process continued until the plate
separated completely associated with catastrophic failure after maximum load been achieved.
Figure 3.11: Typical load-displacement plots resulting from implementing XFEM
approach for the laminate reported by Kim et al. (1995).
Figure 3.12: Damage plot of crack initiation and crack propagation using XFEM as
labelled in Fig. 3.11 for glass/epoxy (W=10 mm, d =2 mm)
0
500
1000
1500
2000
2500
3000
3500
0 0.5 1 1.5 2 2.5 3
Fo
rc
e,
P (
N)
Displacement, δ (mm)
d = 0.3 mm
d = 2.0 mm
d = 5.0 mm
(C)
(C) (B) (A)
(A)
(B)
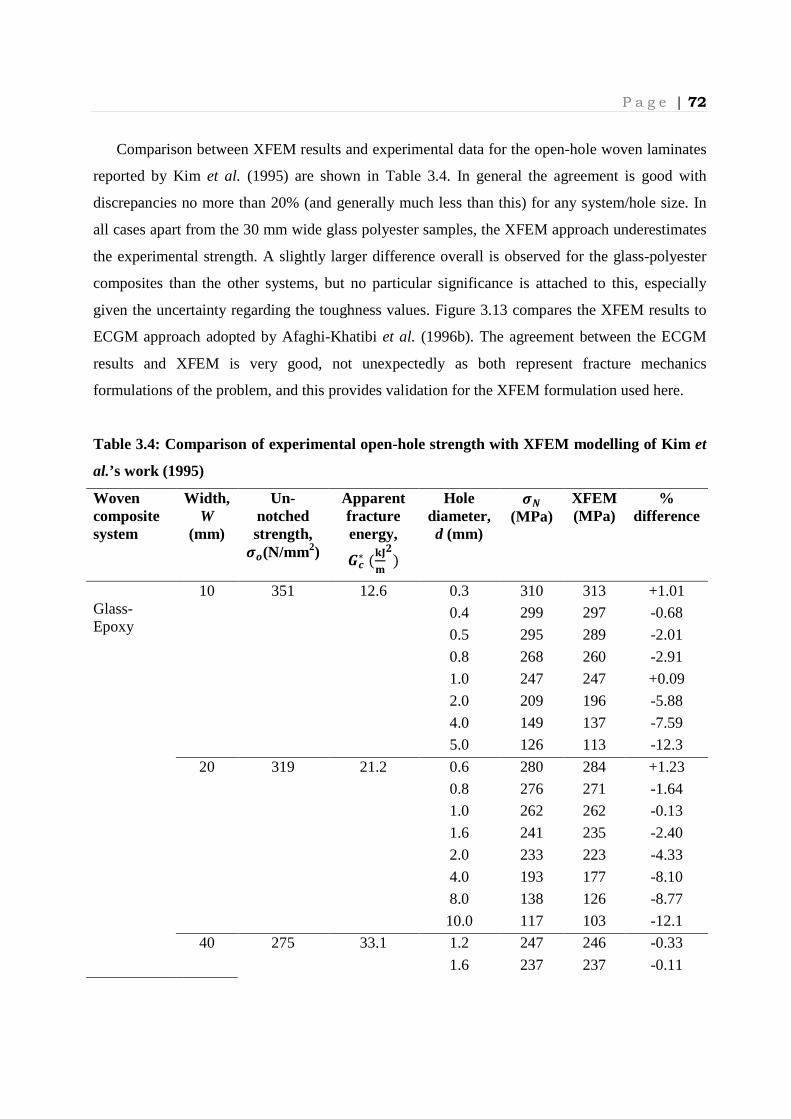
P a g e | 72
Comparison between XFEM results and experimental data for the open-hole woven laminates
reported by Kim et al. (1995) are shown in Table 3.4. In general the agreement is good with
discrepancies no more than 20% (and generally much less than this) for any system/hole size. In
all cases apart from the 30 mm wide glass polyester samples, the XFEM approach underestimates
the experimental strength. A slightly larger difference overall is observed for the glass-polyester
composites than the other systems, but no particular significance is attached to this, especially
given the uncertainty regarding the toughness values. Figure 3.13 compares the XFEM results to
ECGM approach adopted by Afaghi-Khatibi et al. (1996b). The agreement between the ECGM
results and XFEM is very good, not unexpectedly as both represent fracture mechanics
formulations of the problem, and this provides validation for the XFEM formulation used here.
Table 3.4: Comparison of experimental open-hole strength with XFEM modelling of Kim et
al.’s work (1995)
Woven composite system
Width, W
(mm)
Un-notched strength, �ù(N/mm2)
Apparent fracture energy,
àá∗ (úûü
ý)
Hole diameter, d (mm)
�þ (MPa)
XFEM (MPa)
% difference
Glass-Epoxy
10 351 12.6 0.3 310 313 +1.01
0.4 299 297 -0.68
0.5 295 289 -2.01
0.8 268 260 -2.91
1.0 247 247 +0.09
2.0 209 196 -5.88
4.0 149 137 -7.59
5.0 126 113 -12.3
20 319 21.2 0.6 280 284 +1.23
0.8 276 271 -1.64
1.0 262 262 -0.13
1.6 241 235 -2.40
2.0 233 223 -4.33
4.0 193 177 -8.10
8.0 138 126 -8.77
10.0 117 103 -12.1
40 275 33.1 1.2 247 246 -0.33
1.6 237 237 -0.11
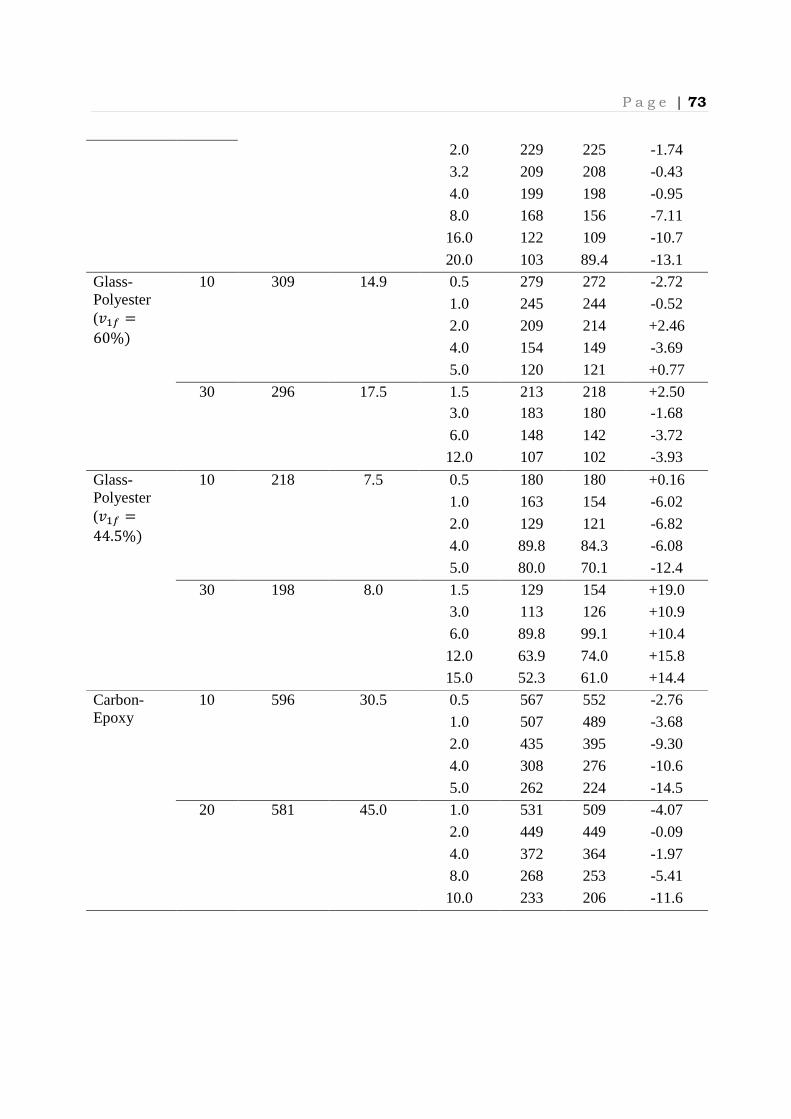
P a g e | 73
2.0 229 225 -1.74
3.2 209 208 -0.43
4.0 199 198 -0.95
8.0 168 156 -7.11
16.0 122 109 -10.7
20.0 103 89.4 -13.1
Glass-Polyester (X�� =60%)
10 309 14.9 0.5 279 272 -2.72
1.0 245 244 -0.52
2.0 209 214 +2.46
4.0 154 149 -3.69
5.0 120 121 +0.77
30 296 17.5 1.5 213 218 +2.50 3.0 183 180 -1.68
6.0 148 142 -3.72
12.0 107 102 -3.93
Glass-Polyester (X�� =44.5%)
10 218 7.5 0.5 180 180 +0.16
1.0 163 154 -6.02
2.0 129 121 -6.82
4.0 89.8 84.3 -6.08
5.0 80.0 70.1 -12.4
30 198 8.0 1.5 129 154 +19.0
3.0 113 126 +10.9
6.0 89.8 99.1 +10.4
12.0 63.9 74.0 +15.8
15.0 52.3 61.0 +14.4
Carbon-Epoxy
10 596 30.5 0.5 567 552 -2.76
1.0 507 489 -3.68
2.0 435 395 -9.30
4.0 308 276 -10.6
5.0 262 224 -14.5
20 581 45.0 1.0 531 509 -4.07
2.0 449 449 -0.09
4.0 372 364 -1.97
8.0 268 253 -5.41
10.0 233 206 -11.6

P a g e | 74
(a) Glass-Epoxy, W=10 mm (b) Glass-polyester, W=30 mm, G�= 60%
(c) Glass-polyester, W=30 mm, Vf = 44.5% (d) Carbon-Epoxy, W=10 mm
Figure 3.13: Normalised open-hole strength plotted as a function of hole size for the
laminates tested by Kim et. al. (1995). Comparison between experiment, ECGM approach
(Afaghi-Khatibi et. al., 1996b), and current study of XFEM results
3.4 Open-hole Strength Prediction Based on Belmonte’s (2001, 2004) Work
3.4.1 Stress Distribution Study
This section will discuss the stress distribution in the composite plate to highlight the stress
concentration that promotes crack initiation as tensile loading is applied. This study extends
Belmonte’s work on both woven composite systems, incorporating them within an FEA
framework. Three hole sizes of 2.5 mm, 5.0 mm and 10 mm in plates of woven composite systems
with a width of 25 mm were implemented. The larger hole displayed a slightly higher stress
concentration due to edge finite width effects. As can be predicted, a larger hole size produces a
lower strength due to the reduction in load-carrying capacity in comparison to a smaller hole in
the same laminate width. Large volume of damage occurred in larger hole plates and this
contributes to ultimate catastrophic failure of composite plate. This behaviour is clearly
0.0
0.2
0.4
0.6
0.8
1.0
0.0 0.1 0.2 0.3 0.4 0.5 0.6
No
rma
lize
d s
tre
ng
th,
σN/σ
o
d/W
ECGM XFEM Exp
0.0
0.2
0.4
0.6
0.8
1.0
0.0 0.1 0.2 0.3 0.4 0.5
No
rma
lize
d s
tre
ng
th,
σN/σ
o
d/W
ECGM XFEM Exp.
0.0
0.2
0.4
0.6
0.8
1.0
0.0 0.1 0.2 0.3 0.4 0.5 0.6
No
rma
lize
d s
tre
ng
th,
σN/σ
0
d/W
ECGM XFEM Exp.
0.0
0.2
0.4
0.6
0.8
1.0
0.0 0.1 0.2 0.3 0.4 0.5 0.6
No
rma
lize
d s
tre
ng
th,
σN/σ
0
d/W
ECGM XFEM Exp.

P a g e | 75
demonstrated from the stress distribution curve plotted along the net-tension plane (perpendicular
to the applied tensile load) as shown in Figure 3.14.
Figure 3.14: Stress concentration of (a) PW8, (b) 5Q8 and (c) series of 8-layer of 5 mm
notch diameter
Figure 3.14(a) and 3.14(b) displays the stress distribution of all the hole sizes investigated in
eight layers plain weave and eight layers five harness satin CFRP plate. From the stress
distribution, it was observed that the stress concentration, 45� (the stress normalized by the far-
field stress) exhibited a value of about three for the quasi-isotropic lay-up (5Q8) and about 4.9 for
cross-ply lay-up (PW8). Stress distributions from quasi-isotropic and orthotropic cross-ply lay-ups
for a similar hole size respectively produce a single curve as shown on Figure 3.14(c).
3.4.2 GFRP Strength Prediction
As expected, all of the models showed failure along the net-tension plane, which is within the
enriched XFEM region specified in the model. The XFEM predicted open-hole strengths are
compared with experimental data, CZM predictions and various analytical approaches (Belmonte
et. al., 2001) in Table 3.5. Typical load-displacement plots in CZM are given in Figure 3.15, with
associated damage plots at crack initiation and propagation points displayed in Figure 3.16. The
XFEM results showed a similar form of load-displacement plot to those observed in Kim’s dataset
(Figure 3.14).
0.0
1.0
2.0
3.0
4.0
5.0
6.0
0 5 10 15
No
rma
lize
d s
tre
ss,
σy/σ
0
Distance from centreline
PW8, 2.5mm
notch diameterPW8, 5 mm
notch diameterPW8, 10 mm
notch diameter
(a)
0
0.5
1
1.5
2
2.5
3
3.5
4
0 5 10 15
No
rma
lize
d s
tre
ss,
σy/σ
0
5Q8, 2.5 mm
notch diameter5Q8, 5mm notch
diameter5Q8, 10mm
notch diameter
Distance from centreline(b)
0
1
2
3
4
5
6
0 5 10 15
No
rma
lize
d s
tre
ss,
σy/σ
0
Distance from centreline
PX8
PQ8
5X8
5Q8
(c)

Figure 3.15: Typical load
*Note that failure in cohesive zones is denoted as SDEG=1 and given as red colour (D, E) and blue colour (F).
Figure 3.16: Damage pl
Figure
XFEM gives very reasonable agreement with experimental data, to within less than 6% and
with the CZM (Table 3.5). Minor discrepancies between the XFEM and CZM are most likely due
to the different element types (the elements used in CZM wer
linear elements could be used as suggested in
45)s lay-up the Whitney-Nuismer point and average stress criterion (PSC and ASC), give excellent
agreement as expected (these semi
strength results). The CDG model also gives good agreement. The strength pr
(90/0/+45/-45)s are reasonable. Note that for this stacking sequence, the same strength and
toughness values were assigned as for the other stacking sequence. The results perhaps suggest
that this stacking sequence has a lower strength an
0
500
1000
1500
2000
2500
3000
3500
0
Fo
rce
, P
(N
)
(D)
Typical load-displacement curve from CZM (woven GFRP (0°/90°/±45°)
*Note that failure in cohesive zones is denoted as SDEG=1 and given as red colour (D, E) and blue colour (F).
Damage plot for cohesive damage modelling using CZM as labelled
Figure 3.15 for GFRP plate (d=10 mm).
XFEM gives very reasonable agreement with experimental data, to within less than 6% and
Minor discrepancies between the XFEM and CZM are most likely due
to the different element types (the elements used in CZM were quadratic while in XFEM only
linear elements could be used as suggested in the relevant ABAQUS manual
Nuismer point and average stress criterion (PSC and ASC), give excellent
agreement as expected (these semi-empirical models are calibrated at one of the open
strength results). The CDG model also gives good agreement. The strength pr
are reasonable. Note that for this stacking sequence, the same strength and
toughness values were assigned as for the other stacking sequence. The results perhaps suggest
that this stacking sequence has a lower strength and/or toughness – a lower toughness would be
0 0.5 1 1.5
Displacement,
d = 2.5 mm
d = 5 mm
d = 10 mm
(E)
P a g e | 76
(woven GFRP (0°/90°/±45°)s
*Note that failure in cohesive zones is denoted as SDEG=1 and given as red colour (D, E) and blue colour (F).
using CZM as labelled in
XFEM gives very reasonable agreement with experimental data, to within less than 6% and
Minor discrepancies between the XFEM and CZM are most likely due
e quadratic while in XFEM only
the relevant ABAQUS manual). For the (0/90/+45/-
Nuismer point and average stress criterion (PSC and ASC), give excellent
calibrated at one of the open-hole
strength results). The CDG model also gives good agreement. The strength predictions for the
are reasonable. Note that for this stacking sequence, the same strength and
toughness values were assigned as for the other stacking sequence. The results perhaps suggest
a lower toughness would be
2
Displacement, δ (mm)
(F)

P a g e | 77
consistent with the surface 90º layers restricting the extent of 0º ply splitting, which seems
plausible.
Table 3.5: Comparison of woven GFRP open-hole strength prediction using XFEM and
CZM with experimental data and other closed-form solutions (from Belmonte et. al., (2001))
Laminate sequence
Hole diameter Size (mm)
d/W Ratio
Exp. Strength, �þ (MPa)
XFEM (MPa)
Difference (%)
CZM PSC (MPa)
ASC (MPa)
CDG (MPa)
(0°/90°/±45°)s 2.5 0.1 184 ± 4 185 +0.8 194 201 190 194 5.0 0.2 151 ± 4 149 -1.4 149 152 152 156 10.0 0.4 112 ± 2 105 -5.8 110 105 108 114
(90°/0°/±45°)s 2.5 0.1 169 ± 1 197 +16.6 188 - - - 5.0 0.2 141 ± 2 155 +10.3 152 - - - 10.0 0.2 103 ± 1 111 +7.9 106 - - -
3.4.3 CFRP Strength Prediction
The results for the cross-ply and quasi isotropic woven CFRP composite systems with
different hole sizes are presented in a similar way in Table 3.6. Both CZM and XFEM modelling
of failure initiation and propagation in woven CFRP exhibited similar trends to those shown in
woven GFRP. Overall agreement is very good, within ±10% for most systems (the range of
difference is 0.09% - 19.41%). Similar size difference were found in larger width (40 mm) and
smaller width (25 mm) specimens. In almost all cases XFEM tends to underestimate the
experimental strength, with a higher discrepancy for the cross-ply systems than the quasi-isotropic
systems. The underestimation may be a result of the simplifying assumptions within the
constitutive law. For instance the tow fractures tend to follow the crimp regions and this means
that the assumption of self-similar crack growth is not entirely realistic.
Table 3.6: Comparison of woven CFRP open-hole strength prediction using XFEM (present
work) and CZM with experimental data and other closed-form solution from (Belmonte et.
al., (2004))
Laminate Hole diameter
Size, d (mm)
d/W Ratio
Exp. Strength, σN (MPa)
XFEM (MPa)
Difference (%)
CZM (MPa)
PSC (MPa)
ASC (MPa)
CDG (MPa)
PX2
2.5 0.1 317 ± 17 319 +0.8 317 334 340 288
5.0 0.2 287 ± 10 251 -12.5 255 252 274 225
10.0 0.4 185 ± 10 173 -6.8 179 175 193 162

P a g e | 78
PX4
2.5 0.1 342 ± 28 339 -0.9 335 362 368 306
5.0 0.2 294 ± 23 264 -10.07 271 274 296 237
10.0 0.4 211 ± 8 184 -13.0 191 190 209 171
PX8 2.5 0.1 349 ± 11 324 -7.2 325 355 362 291
5.0 0.2 291 ± 6 252 -13.3 262 269 290 224
10.0 0.4 195 ± 3 177 -9.5 187 189 206 163
20.0 0.17 188 ± 15 169 -10.0 170 204 215 199
PQ4
2.5 0.1 273 ± 11 290 +6.3 283 306 287 275
5.0 0.2 239 ± 7 229 -2.4 227 235 234 226
10.0 0.4 170 ± 13 156 -8.1 159 158 165 165
PQ8
2.5 0.1 277 ± 14 288 +3.8 281 299 284 275
5.0 0.2 234 ± 8 228 -2.4 228 226 227 220
10.0 0.4 160 ± 6 160 +0.1 161 157 162 162
PQ12 2.5 0.1 254 ± 5 266 +4.6 264 280 263 253
5.0 0.2 211 ± 6 211 -0.1 211 213 213 205
10.0 0.4 156 ± 10 148 -5.1 148 145 150 150
20.0 0.17 170 ± 5 159 -6.7 160 153 157 142
5X2
2.5 0.1 305 ± 33 297 -2.7 290 309 313 268
5.0 0.2 245 ± 37 228 -6.8 234 234 256 213
10.0 0.4 187 ± 6 163 -13.0 165 160 180 153
5X4
2.5 0.1 304 ± 14 303 -0.3 301 331 337 265
5.0 0.2 268 ± 12 231 -13.8 241 253 269 204
10.0 0.4 182 ± 2 166 -8.6 176 182 194 150
5X8 2.5 0.1 306 + 31 271 -11.3 276 316 322 240
5.0 0.2 255 ± 15 210 -17.7 226 239 261 185
10.0 0.4 188 + 8 152 -19.4 159 165 184 134
20.0 0.17 165 ± 6 142 -13.8 146 174 187 165
5Q4
2.5 0.1 242 ± 8 267 +10.4 266 273 257 255
5.0 0.2 202 ± 5 209 +3.4 213 207 206 207
10.0 0.4 155 ± 6 150 -3.0 148 142 146 152
5Q8
2.5 0.1 240 ± 14 251 +4.4 247 260 245 237
5.0 0.2 200 ± 8 194 -3.2 196 198 198 193
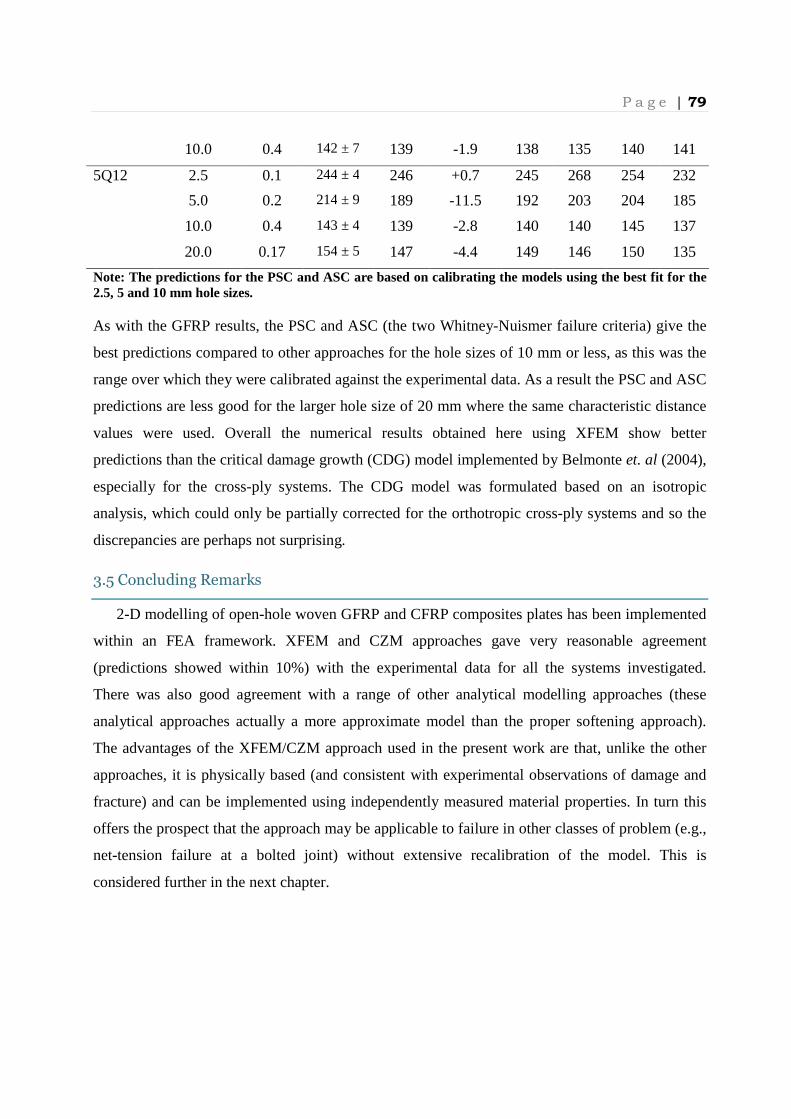
P a g e | 79
10.0 0.4 142 ± 7 139 -1.9 138 135 140 141
5Q12 2.5 0.1 244 ± 4 246 +0.7 245 268 254 232
5.0 0.2 214 ± 9 189 -11.5 192 203 204 185
10.0 0.4 143 ± 4 139 -2.8 140 140 145 137
20.0 0.17 154 ± 5 147 -4.4 149 146 150 135
Note: The predictions for the PSC and ASC are based on calibrating the models using the best fit for the 2.5, 5 and 10 mm hole sizes.
As with the GFRP results, the PSC and ASC (the two Whitney-Nuismer failure criteria) give the
best predictions compared to other approaches for the hole sizes of 10 mm or less, as this was the
range over which they were calibrated against the experimental data. As a result the PSC and ASC
predictions are less good for the larger hole size of 20 mm where the same characteristic distance
values were used. Overall the numerical results obtained here using XFEM show better
predictions than the critical damage growth (CDG) model implemented by Belmonte et. al (2004),
especially for the cross-ply systems. The CDG model was formulated based on an isotropic
analysis, which could only be partially corrected for the orthotropic cross-ply systems and so the
discrepancies are perhaps not surprising.
3.5 Concluding Remarks
2-D modelling of open-hole woven GFRP and CFRP composites plates has been implemented
within an FEA framework. XFEM and CZM approaches gave very reasonable agreement
(predictions showed within 10%) with the experimental data for all the systems investigated.
There was also good agreement with a range of other analytical modelling approaches (these
analytical approaches actually a more approximate model than the proper softening approach).
The advantages of the XFEM/CZM approach used in the present work are that, unlike the other
approaches, it is physically based (and consistent with experimental observations of damage and
fracture) and can be implemented using independently measured material properties. In turn this
offers the prospect that the approach may be applicable to failure in other classes of problem (e.g.,
net-tension failure at a bolted joint) without extensive recalibration of the model. This is
considered further in the next chapter.
P a g e | 80
Chapter 4 : 2-D Finite Element Modelling of
Bolted Joints
4.1 Introduction
The current chapter is concerned with developing finite element-based models for failure of
composite bolted joints, in particular for single bolted configuration with a quasi-isotropic GFRP
woven fabric laminate. In previous experimental work described in the literature review, damage
and fracture in open hole geometries was investigated. It was shown that tensile failure involved
the development of a damage zone at the edge of the hole. The damage was modelled as an
effective crack, which propagated catastrophically at the peak load. Subsequently the behaviour of
double-lap bolted joints from the same woven fabric system was investigated experimentally
(Kontolatis, 2000) and it was shown that the net-tension failure mode involved similar damage
phenomena to those seen in the open hole experiments. This suggests that it should be possible to
apply a similar modelling approach to the two problems. In Chapter 3 the open hole problem was
modelled within a finite element framework, using either a cohesive zone model (CZM) or XFEM
to simulate the crack growth, and was found to give strength predictions in good agreement with
experiment.
A similar approach is adopted in this chapter in the context of composite bolted joints. The
next section describes the two dimensional finite element model used, which simulates the full
contact between the bolt and the laminate. The model is then used to simulate crack growth (net-
tension and shear-out failures) in composite bolted joints. The failure criterion is implemented in
two ways, first through the use of a CZM to simulate net-tension and shear-out failures in a joint
and then through the use of XFEM to represent net-tension failure. The approach based on CZM
is compared with the work of Hollmann (1996), who studied shear-out failure in CFRP bolted
joints using a CZM approach and then the XFEM results are compared with the experimental
results from Kontolatis (2000) relating to net-tension failure in woven fabric bolted joints.

P a g e | 81
4.2 Generation of 2-D FEA Models for Composite Bolted Joints
4.2.1 Overview
The models developed in this chapter are based on two-dimensional representations of the
bolted joint configuration tested experimentally by Hollmann (1996) and Kontolatis (2000). This
is shown in Figure 4.1. Hollmann (1996) investigated three lay-ups of laminated CFRP while
Kontolatis (2000) examined a woven fabric CFRP. Hollmann (1996) also carried out 2-D finite
element analysis with various simplifying boundary conditions to represent the bolt-hole
interaction and used a CZM model to determine joint strength. In the present work the pin-hole
contact problem is modelled explicitly while failure is treated using CZM to compare with
Hollmann (1996) and XFEM method to predict the strength of the net-tension failure joints tested
by Kontolatis (2000). The remainder of this chapter presents details of the models developed.
Figure 4.1: Configurations of bolted joint determined experimentally, left (after
Hollmann, 1998) and right (after Kontolatis, 2000)
4.2.2 Joint geometries and material properties
The first set of models developed in the current work is based on the geometry used by
Hollmann (1996) for which the geometry parameters are shown in Figure 4.2. Three CFRP
laminate lay-ups were investigated. The lay-ups and corresponding joint geometries are given in
Table 4.1. The small end distance (associated with e/d) means that the shear-out failure mode
dominates. The laminates consisted of a 0⁰ dominated lay-up (Laminate A), a 90⁰ dominated lay-
up (Laminate B) and a quasi-isotropic lay-up (Laminate C). The average ply thickness was given
as 0.127 and this gives a plate thickness of 2.54 mm for laminates A and B and 4.064 mm for
laminate C. The material properties (moduli, strength, fracture energies) were based on
recalibration of joint models from previous literatures are given in Table 4.2.
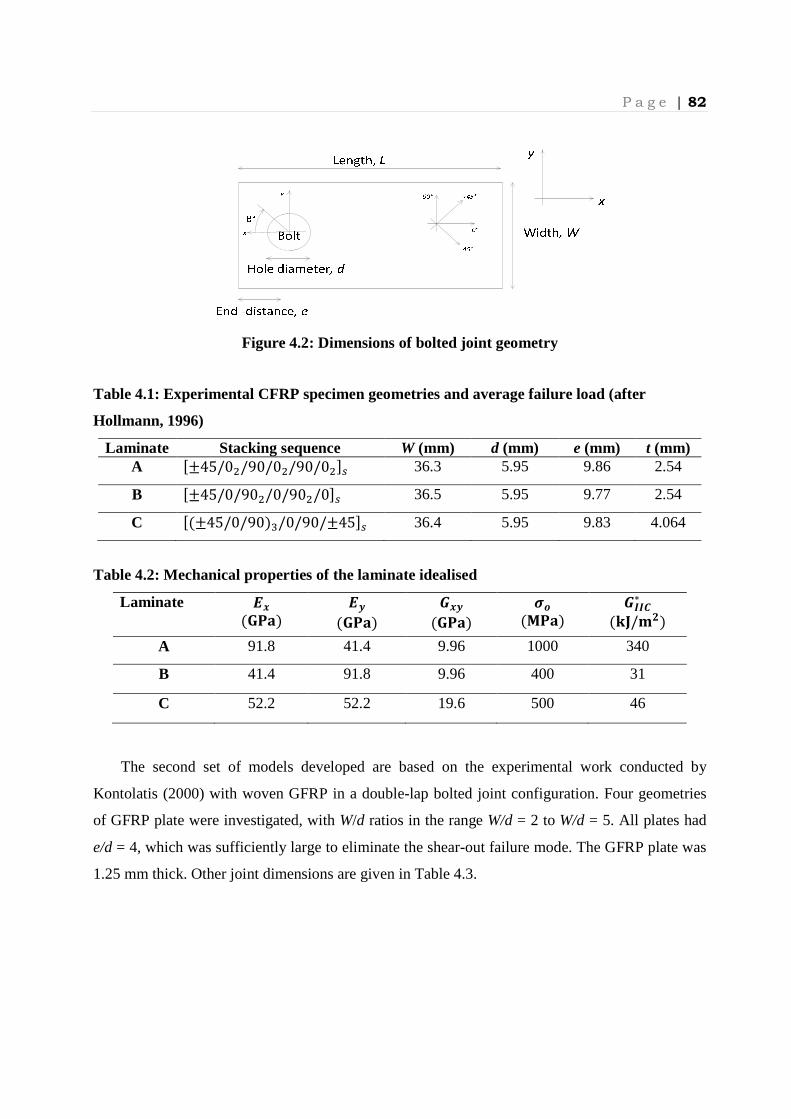
P a g e | 82
Figure 4.2: Dimensions of bolted joint geometry
Table 4.1: Experimental CFRP specimen geometries and average failure load (after
Hollmann, 1996)
Laminate Stacking sequence W (mm) d (mm) e (mm) t (mm) A ±±45/0�/90/0�/90/0�²� 36.3 5.95 9.86 2.54
B ±±45/0/90�/0/90�/0²� 36.5 5.95 9.77 2.54
C ±(±45/0/90)m/0/90/±45²� 36.4 5.95 9.83 4.064
Table 4.2: Mechanical properties of the laminate idealised
Laminate �� (���) �� (���) � (���)
�ù (��) à�∗ (úû/üý) A 91.8 41.4 9.96 1000 340
B 41.4 91.8 9.96 400 31
C 52.2 52.2 19.6 500 46
The second set of models developed are based on the experimental work conducted by
Kontolatis (2000) with woven GFRP in a double-lap bolted joint configuration. Four geometries
of GFRP plate were investigated, with W/d ratios in the range W/d = 2 to W/d = 5. All plates had
e/d = 4, which was sufficiently large to eliminate the shear-out failure mode. The GFRP plate was
1.25 mm thick. Other joint dimensions are given in Table 4.3.

P a g e | 83
Table 4.3: Geometry parameters for various W/d ratios
W/d e/d Width, W (mm)
End-distance, e (mm)
Length, L (mm)
Diameter, d (mm)
2 4 25 20 40 5
3 4 25 20 60 5
4 4 25 20 80 5
5 4 25 20 100 5
The mechanical properties of the GFRP were taken from Belmonte et. al. (2001) and are given in
Table 4.4 together with the typical bolt properties.
Table 4.4: Material properties of components
Laminate Hole size, d (mm)
Laminate thickness, t (mm)
�� =�� (GPa)
��� � (GPa)
�ù (MPa) à�( úûüý)
Glass Woven
fabric (0/90/±45)s
5 1.25 16.0 ± 0.3 0.3 6.15 291 20.25 ±
2.2
Steel - - 210 0.3 - - -
4.2.3 Boundary conditions and contact interactions
Figure 4.3 show the pin joint model developed in ABAQUS CAE Version 6.10 to represent
Hollmann’s work. A full contact model was used to capture the bolt-hole interaction. In general
at any load level, the bolt/hole contact surface for close-fit bolts lies in the range 80º ≤ θ ≤ 85º
where θ is defined in Figure 4.2. This full contact model is in contrast to the approach used by
Hollmann, who did not model the bolt. Instead he investigated three boundary conditions
corresponding to no friction, sticking friction and a mixed condition. To load the model, tensile
load was applied on the right edge while the left edge remained free and the steel pin was fixed.
The interaction between the bolt and the inner surface of the hole are assigned as a “master-slave”
interaction. In this approach, contact between the master surface (steel bolt) and the slave surface
(hole edge) leads to relative displacements. Interaction between the two surfaces of bearing
contact is assumed to be frictionless. Meshing in the vicinity of the hole and in the contact region
is refined as this region is of interest as local failure and damage occurs within this region prior to

P a g e | 84
ultimate failure of the joint. The region furtherest away from the hole had a less refined mesh to
reduce the computational effort as shown later in Figure 4.4.
Figure 4.3: Two-dimensional model based on the geometry investigated by Hollmann (1996)
In contrast to the first set of models, only half the coupon is modelled in the FEA of the bolted
joints of Kontolatis. The model made use of symmetry in the y-direction to save computational
effort, see Figure 4.4. The plate and the steel pin (bolt) of 5 mm diameter are again modelled
explicitly with a refined mesh around the hole (see Figure 4.2 for joint geometry descriptions)
using the commercial software ABAQUS CAE Version 6.10.1. Similar boundary and loading
conditions are implemented in both model sets investigated, except for the y-symmetry.
(a)
(b)
Figure 4.4: Meshing of 2-D pin joint model following Kontolatis (2000) (a) Mesh (b)
Boundary condition

P a g e | 85
4.2.4 Failure Models
Figure 4.5: Physically-based material model used in current study (a) to represent shear-out
mode of failure in Hollmann (1996) and (b) to represent net-tension failure in Kontolatis
(2000)
Two similar fracture models were implemented in the present work. The first method,
implemented in the models of the CFRP laminates, used CZMs to represent shear-out and net-
tension failures. Each CZM required a strength property (at which damage initiates) and the
fracture energy – see Figure 4.5. These material properties are given in Table 4.2. For the material
and joint geometry combinations investigated, it was found that failure occurred in shear-out. It is
important to note that to use the CZM approach it is necessary that the crack path is pre-defined.
A strip of cohesive elements was assigned along the planes of the shear-out failure path, as shown
in Figure 4.6.
Figure 4.6: Cohesive elements path shear-out plane (after Hollmann, 1996)
In order to predict failure in the net tension mode in the woven GFRP laminates the XFEM
approach, applied to open hole geometries in Chapter 3 was used. The XFEM approach within
ABAQUS allows the crack to propagate along an arbitrary path within a specified region, rather
CZM region
(a) (b)
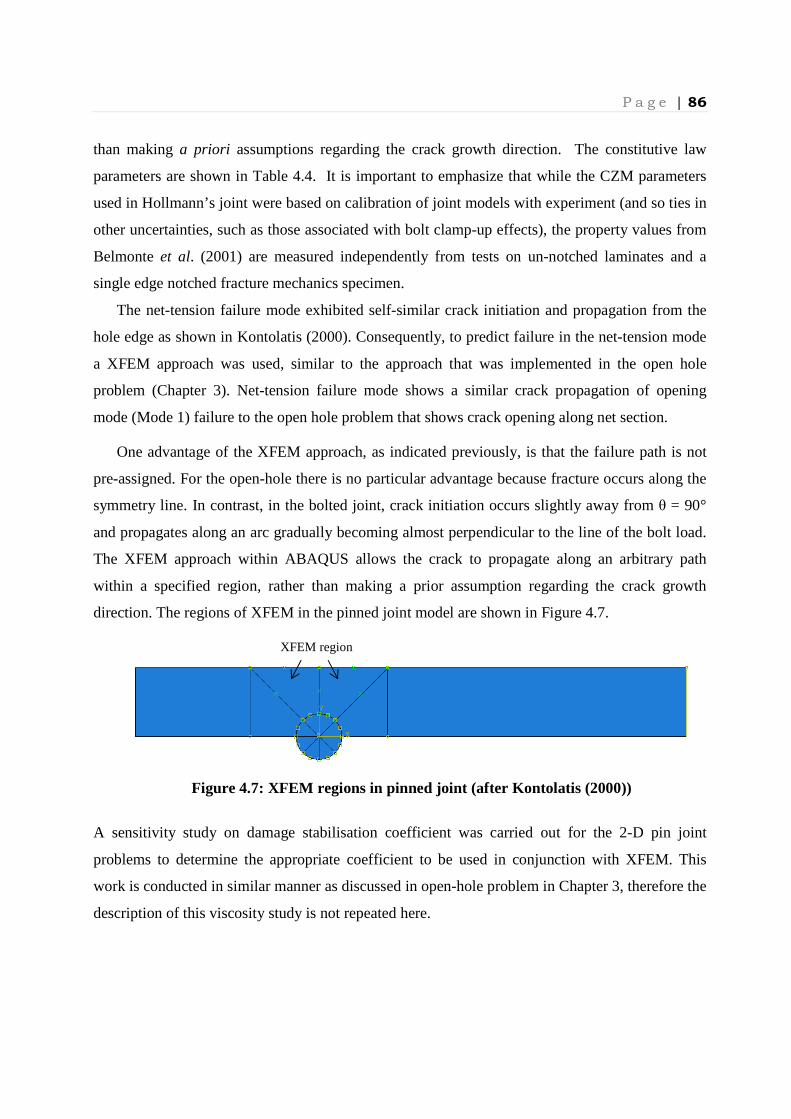
P a g e | 86
than making a priori assumptions regarding the crack growth direction. The constitutive law
parameters are shown in Table 4.4. It is important to emphasize that while the CZM parameters
used in Hollmann’s joint were based on calibration of joint models with experiment (and so ties in
other uncertainties, such as those associated with bolt clamp-up effects), the property values from
Belmonte et al. (2001) are measured independently from tests on un-notched laminates and a
single edge notched fracture mechanics specimen.
The net-tension failure mode exhibited self-similar crack initiation and propagation from the
hole edge as shown in Kontolatis (2000). Consequently, to predict failure in the net-tension mode
a XFEM approach was used, similar to the approach that was implemented in the open hole
problem (Chapter 3). Net-tension failure mode shows a similar crack propagation of opening
mode (Mode 1) failure to the open hole problem that shows crack opening along net section.
One advantage of the XFEM approach, as indicated previously, is that the failure path is not
pre-assigned. For the open-hole there is no particular advantage because fracture occurs along the
symmetry line. In contrast, in the bolted joint, crack initiation occurs slightly away from θ = 90°
and propagates along an arc gradually becoming almost perpendicular to the line of the bolt load.
The XFEM approach within ABAQUS allows the crack to propagate along an arbitrary path
within a specified region, rather than making a prior assumption regarding the crack growth
direction. The regions of XFEM in the pinned joint model are shown in Figure 4.7.
Figure 4.7: XFEM regions in pinned joint (after Kontolatis (2000))
A sensitivity study on damage stabilisation coefficient was carried out for the 2-D pin joint
problems to determine the appropriate coefficient to be used in conjunction with XFEM. This
work is conducted in similar manner as discussed in open-hole problem in Chapter 3, therefore the
description of this viscosity study is not repeated here.
XFEM region
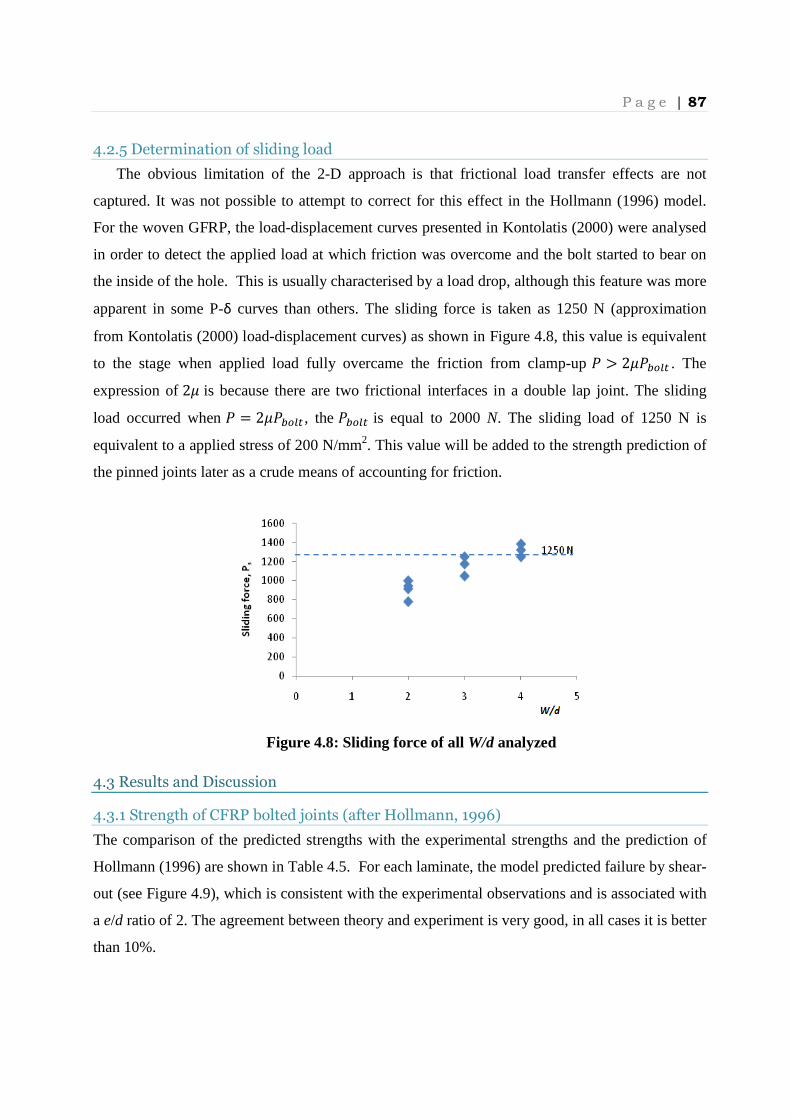
P a g e | 87
4.2.5 Determination of sliding load
The obvious limitation of the 2-D approach is that frictional load transfer effects are not
captured. It was not possible to attempt to correct for this effect in the Hollmann (1996) model.
For the woven GFRP, the load-displacement curves presented in Kontolatis (2000) were analysed
in order to detect the applied load at which friction was overcome and the bolt started to bear on
the inside of the hole. This is usually characterised by a load drop, although this feature was more
apparent in some P-δ curves than others. The sliding force is taken as 1250 N (approximation
from Kontolatis (2000) load-displacement curves) as shown in Figure 4.8, this value is equivalent
to the stage when applied load fully overcame the friction from clamp-up @ > 2 @\��� . The
expression of 2 is because there are two frictional interfaces in a double lap joint. The sliding
load occurred when @ = 2 @\��� , the @\��� is equal to 2000 N. The sliding load of 1250 N is
equivalent to a applied stress of 200 N/mm2. This value will be added to the strength prediction of
the pinned joints later as a crude means of accounting for friction.
Figure 4.8: Sliding force of all W/d analyzed
4.3 Results and Discussion
4.3.1 Strength of CFRP bolted joints (after Hollmann, 1996)
The comparison of the predicted strengths with the experimental strengths and the prediction of
Hollmann (1996) are shown in Table 4.5. For each laminate, the model predicted failure by shear-
out (see Figure 4.9), which is consistent with the experimental observations and is associated with
a e/d ratio of 2. The agreement between theory and experiment is very good, in all cases it is better
than 10%.
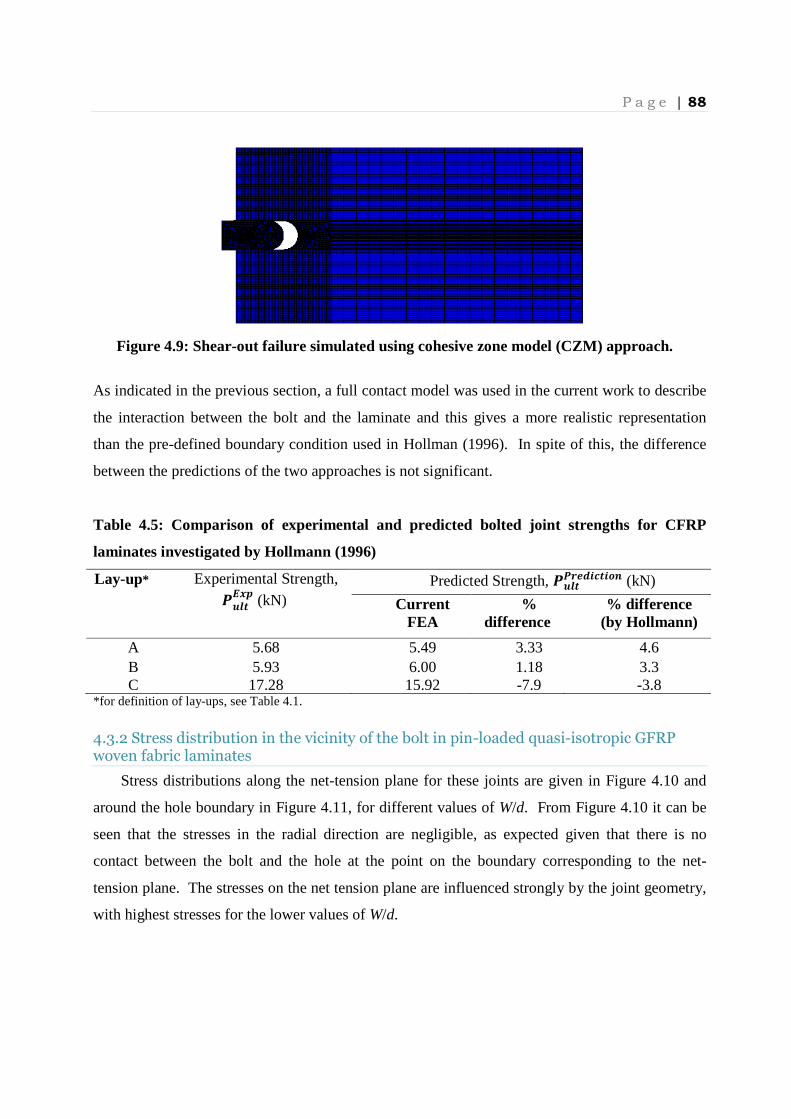
P a g e | 88
Figure 4.9: Shear-out failure simulated using cohesive zone model (CZM) approach.
As indicated in the previous section, a full contact model was used in the current work to describe
the interaction between the bolt and the laminate and this gives a more realistic representation
than the pre-defined boundary condition used in Hollman (1996). In spite of this, the difference
between the predictions of the two approaches is not significant.
Table 4.5: Comparison of experimental and predicted bolted joint strengths for CFRP
laminates investigated by Hollmann (1996)
Lay-up* Experimental Strength, ������� (kN)
Predicted Strength, ���������á��ù� (kN)
Current FEA
% difference
% difference (by Hollmann)
A 5.68 5.49 3.33 4.6 B 5.93 6.00 1.18 3.3 C 17.28 15.92 -7.9 -3.8
*for definition of lay-ups, see Table 4.1.
4.3.2 Stress distribution in the vicinity of the bolt in pin-loaded quasi-isotropic GFRP woven fabric laminates
Stress distributions along the net-tension plane for these joints are given in Figure 4.10 and
around the hole boundary in Figure 4.11, for different values of W/d. From Figure 4.10 it can be
seen that the stresses in the radial direction are negligible, as expected given that there is no
contact between the bolt and the hole at the point on the boundary corresponding to the net-
tension plane. The stresses on the net tension plane are influenced strongly by the joint geometry,
with highest stresses for the lower values of W/d.

P a g e | 89
Figure 4.10: Stress distribution along net-tension plane of varying W/d ratio with bearing
stress of 250 N/mm2 (a) Normalised radial stress (b) Normalised tangential stress
Figure 4.11 shows the extent of the contact region for each value of W/d, with the pin and the
hole separating when the radial stress is equal to zero. Within the contact region, the radial stress
distribution shows the expected trend with the maximum value immediately below the pin.
Interestingly, the location of the maximum tangential stress, which is associated with the initiation
of net-tension failure, varies slightly with joint geometry. For larger values of W/d the maximum
tangential stress occurs at about 85°, while for the joint with the smallest W/d the maximum
tangential shear stress occurs at slightly more than 85°. Larger widths show lower tensile stresses,
corresponding to the capability of the laminate plate to sustain higher load.
Figure 4.11: Stress distribution on hole boundary of varying W/d ratio with bearing
stress of 250 N/mm2 (a) Normalised radial stress (b) Normalised tangential stress
0
0.01
0.02
0.03
0.04
0.05
0.06
0.07
0 2 4
No
rma
lise
d r
ad
ial
stre
ss, -
σr/
σb
a/r
W/d=2
W/d=3
W/d=4
W/d=5
(a)
0
0.5
1
1.5
2
2.5
0 1 2 3 4 5
No
rma
lise
d t
an
ge
nti
al
stre
ss, σ
θ/σ
b
a/r
W/d=2
W/d=3
W/d=4
W/d=5
(b)
0
0.2
0.4
0.6
0.8
1
1.2
0 10 20 30 40 50 60 70 80 90
No
rma
ilse
d r
ad
ial
stre
ss, σ
r/σ
b
Hole boundary, θ°°°°
W/d=2
W/d=3
W/d=4
W/d=5
(a)
0
0.5
1
1.5
2
2.5
0 10 20 30 40 50 60 70 80 90
No
rma
lise
d t
an
ge
nti
al
stre
ss, σ
θ/σ
b
Hole boundary, θ°
W/d=2
W/d=3
W/d=4
W/d=5
(b)

P a g e | 90
4.4.2 Strength prediction of GFRP woven fabric bolted joint
The predicted results for the bearing stress at the net-tension failure mode, as a function of
normalised joint width, are given in the third column in Table 4.6. However, this idealisation
does not represent the experimental tests that have been carried out by Kontolatis (2000) as a
tightening torque of 5 Nm was applied experimentally. It will be most appropriate to incorporate
this bolt pre-loading in the 3-D modelling explicitly. Figure 4.12 shows typical load-displacement
plot of pin-joint determined by the XFEM approach.
Figure 4.12: Typical load-displacement curve in pin joint from XFEM
Typical predicted crack paths are shown in Figure 4.13. The circular hole appears as an ellipse
because the figures have been stretched in the y-direction. The predicted strengths from the
XFEM model (second column in Table 4.6) are much lower than the experimental results given in
the first column. The approach here is based on a 2-D model and so ignores frictional load transfer
arising from bolt clamp-up in the experiments.
Figure 4.13: Crack propagation of pin joint in XFEM for (a) W/d =2, (b) W/d=3,
(c) W/d=4, (d) W/d=5
0
200
400
600
800
1000
1200
1400
0 0.2 0.4 0.6 0.8 1 1.2
Loa
d,
P (
N)
Displacement, δ (mm)
8HS, W/d=3, pin joint
(a)
(c) (d)
(b)

P a g e | 91
Sliding stress, as introduced in sub-section 4.2.5, needs to be added to the FEA results before
they can be compared with experimental data. Table 4.6 shows that agreement is improved
somewhat, especially at smaller W/d, although the predictions are still low. While this initial
agreement is encouraging, the frictional correction used by the author is somewhat simplistic;
improved strength predictions may result from using a 3-D model. It is also noted that the
relatively low thickness of the GFRP laminates means that the proportion of the load transfer
associated with friction is very high. It would be useful to validate the method presented here for
laminates with a range of thicknesses.
Table 4.6: Comparison of modelling predictions and experimental results
W/d Exp. bearing stress (MPa)
XFEM bearing stress (MPa)
[1]
Sliding stress (MPa)
[2]
Prediction bearing stress (MPa)
[1]+[2]
Difference (%)
2 357.5 ± 56 116.66 200 317 11
3 580.8 ± 81 191.63 200 392 33
4 655.2 ± 108 237.10 200 437 33
5 724 270.55 200 471 35
4.5 Concluding Remarks
Both CZMs and XFEM have been implemented within two-dimensional finite element
analyses of composite bolted joints. The CZM approach gives good agreement with experimental
data and the strength predictions reported by Hollmann (1996) for three lay-ups of CFRP. The
XFEM approach has been implemented within a pin-joint model for a woven quasi-isotropic
GFRP laminate (similar material and lay-up in previous open-hole problem by Belmonte, 2001),
joint strength was determined experimentally by Kontolatis (2000). Predictions for failure
strength in net-tension show reasonable agreement with experiment, provided that an allowance is
made for the load transfer associated with friction, as a result of bolt clamp-up. Further work is
needed to develop an improved 3-D model incorporating clamp-up and such a model will need to
be tested against a wider range of experimental data.
P a g e | 92
Chapter 5 : Experimental Methodology and
Results for CFRP bolted joints
5.1 Introduction
In the previous chapter initial 2-D finite element models were developed for composite bolted
joints and applied to experimental data from the literature. It was recognised that further
development of the model was required. At the same time, validation of the approach is only
possible with additional experimental data. Hence the present chapter comprises a wide ranging
experimental study of mechanically fastened woven CFRP using both double-lap joint (DLJ) and
single-lap joint (SLJ) configurations. The structure of the chapter is as follows. In Section 5.2
details of the bolted joint materials are given. This is followed by an account of the sample
preparation process and a description of the range of joint types and variables investigated.
Mechanical testing set-up and test method are then described. Experimental results relating to
damage observations and ultimate strength are then presented. This is followed by discussion on
the effects of the various test parameters.
5.2 Bolted Joints Components
5.2.1 Introduction
In this section the different elements of bolted joints are described, i.e. the woven fabric
composite and steel plates used in assembling the joints, together with details of the fasteners
used.
5.2.2 CFRP Woven Fabric System Plates
Seven sets of CFRP woven fabric lay-up systems are studied in current work. Together these
laminates represent a sub-set of those tested by Belmonte et. al. (2004) in their investigation of
open-hole behaviour. The materials comprised four plain weave (PW) and three five-harness satin
weave (5HS) continuous carbon fibre reinforcements. The PW and 5HS woven fabric laminates
used are based upon Toray T300 high strength carbon fibres and are manufactured from Primco
prepregs with a layer thickness of about 0.2 mm. The epoxy resin system, which controls the
matrix dominated properties, such as the transverse strength, is Vantico MY750. All sets of CFRP

P a g e | 93
woven fabric systems were fabricated by St. Bernards Composite Ltd. First column of Table 5.1
gives the laminate designation codes assigned to each laminate. They are in accordance with those
used by Belmonte (2004) and their material properties are given in Table 5.1.
The laminates produced have been ultrasonically scanned to identify any internal defects,
mainly associated porosity or delamination, and marked with waterproof marker pen to highlight
the presence of the defects. Defects were more prominent in the thicker panels of five harness
satin with less porosity observed in thinner panels. During the sectioning of the panels, care was
taken to avoid the areas containing defects.
Table 5.1: Material properties of the woven CFRP laminates* under investigation
Laminate
designation
Thickness �(üü) �� (���) �� (���) ��� à�� (���) �� (%) �� (��) àá (úû/üý) PX2 0.51 50.4 ± 0.6 50.4 ± 0.6 0.1026 4.42 44.3 481 ± 9.2 26.0 ± 3.2
PX4 1.03 51.4 ± 1.4 51.4 ± 1.4 0.0924 4.42 43.4 527 ± 67 27.7 ± 5.8
5X2 0.81 45.1 ± 0.8 45.1 ± 0.8 0.0766 3.78 38.8 419 ± 49 28.8 ± 8.5
5X4 1.60 47.0 ± 0.8 47.0 ± 0.8 0.0618 3.78 38.3 535 ± 14 20.0 ± 5.2
PQ4 1.02 37.2 ± 0.3 37.2 ± 0.3 0.3528 13.75 44.3 390 ± 11 21.6 ± 5.1
PQ8 2.03 36.8 ± 0.8 36.8 ± 0.8 0.3276 13.86 45.0 428 ± 14 17.9 ± 3.4
5Q12 4.62 34.8 ± 0.9 34.8 ± 0.9 0.3224 13.15 39.6 370 ± 17 12.9 ± 2.1
*data from Belmonte et. al., 2004
5.2.3 Steel Plates
Composite/steel joints were investigated. A high yield strength stainless steel (with Z` = 720
N/mm2) of thickness 3 mm was used. This was chosen because the high yield strength prevents
bearing failure in the steel and this means that it can be reused. A range of size of steel plates and
hole sizes (a total of 16 sets) was prepared corresponding to the different joint geometries tested
(see Section 5.4).
5.2.4 Fastener systems
The fastener systems used in this joint configuration system are steel washers and steel bolts.
Bolt fasteners and washers with 5 mm holes are commercially identified as M5 and those for use

P a g e | 94
with 10 mm diameter holes are designated M10. In this study, high grade stainless steel bolts with
protruding hexagon bolt head, in accordance with standard in DIN 913, were used. The fastener
systems are able to provide lateral constraint through joint thickness which is expected to improve
the joint behaviour by contributing to a higher bearing strength. This study used a consistent size
of washer (and associated clamping area) and bolt type throughout all joints in the test matrix to
avoid any effects from variations in these test parameters. A4 stainless steel washers are used for
the two bolt sizes as specified in DIN 125A, M5 (outer diameter, � = 10 mm and inner
diameter, � = 5 mm) and M10 ( � = 21 mm and � = 10 mm). Protruding fasteners are
chosen rather than countersunk fastener because they offer higher bearing strength. On the
contrary, singularity stress is exhibited at the head tip in countersunk fasteners. Service limit state
(SLS) in mechanically-fastened joints requires the composite plate to fail before the fastener
systems.
5.3 Sample Preparation
5.3.1 Introduction
This section describes the different stages involved in the preparation of the joints. This
includes the sectioning of the CFRP laminates, the drilling of holes and the experimental
configuration used for the double-lap joint and single-lap joint tests.
5.3.2 Cutting of Composite Panels
The available CFRP panels are measured and exact measurements are drafted in CAD
program (SOLIDEDGE). This program is easy to use and is able to optimize the number of plates
produced as required. For each cut edge, a 3 mm gap was needed to allow for the width of the cut
and this was taken into account during drafting stage. Thicker lay-ups with significant region of
internal defects from C-scan are drafted particularly carefully to ensure the coupons are free from
defects.
CFRP panels were sectioned with a water-cooled diamond saw to produce the required
number of coupons. A slow cutting speed was used to achieve a better finish. The coupons are
numbered and labelled according to the respective series using a designated code. Following
cutting, the plate width and thickness are then measured and recorded for future reference. A total
of 624 coupons were prepared.
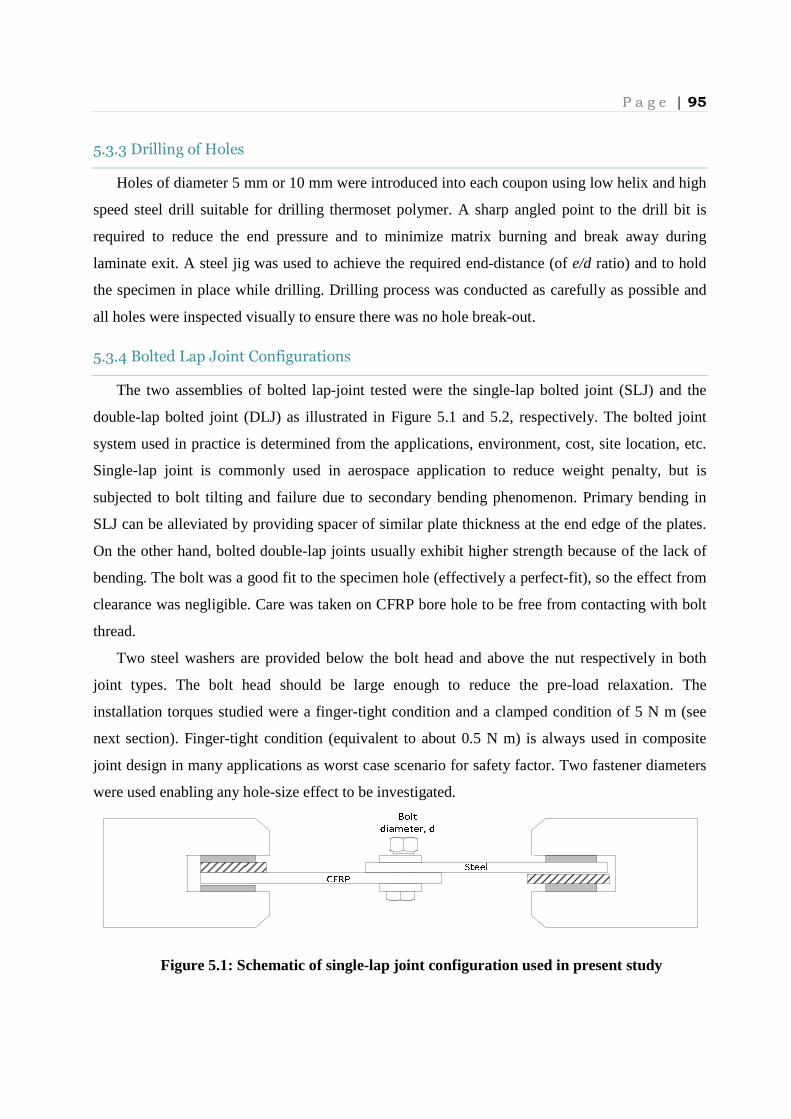
P a g e | 95
5.3.3 Drilling of Holes
Holes of diameter 5 mm or 10 mm were introduced into each coupon using low helix and high
speed steel drill suitable for drilling thermoset polymer. A sharp angled point to the drill bit is
required to reduce the end pressure and to minimize matrix burning and break away during
laminate exit. A steel jig was used to achieve the required end-distance (of e/d ratio) and to hold
the specimen in place while drilling. Drilling process was conducted as carefully as possible and
all holes were inspected visually to ensure there was no hole break-out.
5.3.4 Bolted Lap Joint Configurations
The two assemblies of bolted lap-joint tested were the single-lap bolted joint (SLJ) and the
double-lap bolted joint (DLJ) as illustrated in Figure 5.1 and 5.2, respectively. The bolted joint
system used in practice is determined from the applications, environment, cost, site location, etc.
Single-lap joint is commonly used in aerospace application to reduce weight penalty, but is
subjected to bolt tilting and failure due to secondary bending phenomenon. Primary bending in
SLJ can be alleviated by providing spacer of similar plate thickness at the end edge of the plates.
On the other hand, bolted double-lap joints usually exhibit higher strength because of the lack of
bending. The bolt was a good fit to the specimen hole (effectively a perfect-fit), so the effect from
clearance was negligible. Care was taken on CFRP bore hole to be free from contacting with bolt
thread.
Two steel washers are provided below the bolt head and above the nut respectively in both
joint types. The bolt head should be large enough to reduce the pre-load relaxation. The
installation torques studied were a finger-tight condition and a clamped condition of 5 N m (see
next section). Finger-tight condition (equivalent to about 0.5 N m) is always used in composite
joint design in many applications as worst case scenario for safety factor. Two fastener diameters
were used enabling any hole-size effect to be investigated.
Figure 5.1: Schematic of single-lap joint configuration used in present study
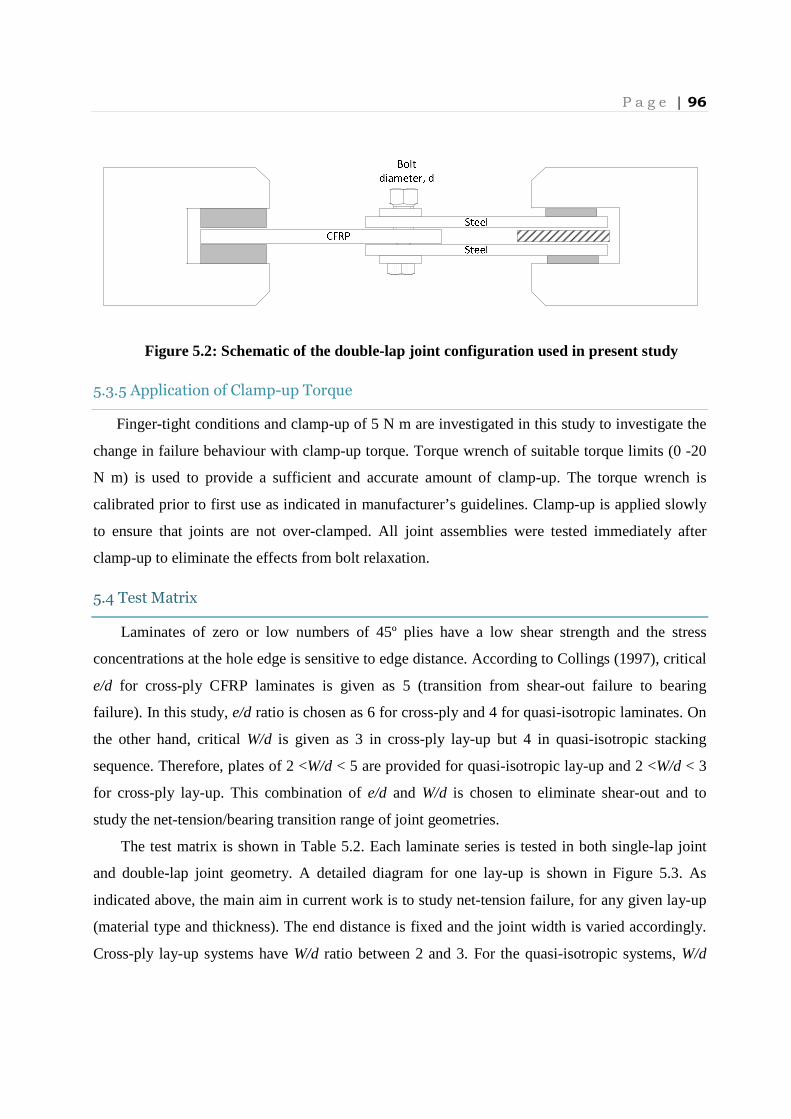
P a g e | 96
Figure 5.2: Schematic of the double-lap joint configuration used in present study
5.3.5 Application of Clamp-up Torque
Finger-tight conditions and clamp-up of 5 N m are investigated in this study to investigate the
change in failure behaviour with clamp-up torque. Torque wrench of suitable torque limits (0 -20
N m) is used to provide a sufficient and accurate amount of clamp-up. The torque wrench is
calibrated prior to first use as indicated in manufacturer’s guidelines. Clamp-up is applied slowly
to ensure that joints are not over-clamped. All joint assemblies were tested immediately after
clamp-up to eliminate the effects from bolt relaxation.
5.4 Test Matrix
Laminates of zero or low numbers of 45º plies have a low shear strength and the stress
concentrations at the hole edge is sensitive to edge distance. According to Collings (1997), critical
e/d for cross-ply CFRP laminates is given as 5 (transition from shear-out failure to bearing
failure). In this study, e/d ratio is chosen as 6 for cross-ply and 4 for quasi-isotropic laminates. On
the other hand, critical W/d is given as 3 in cross-ply lay-up but 4 in quasi-isotropic stacking
sequence. Therefore, plates of 2 <W/d < 5 are provided for quasi-isotropic lay-up and 2 <W/d < 3
for cross-ply lay-up. This combination of e/d and W/d is chosen to eliminate shear-out and to
study the net-tension/bearing transition range of joint geometries.
The test matrix is shown in Table 5.2. Each laminate series is tested in both single-lap joint
and double-lap joint geometry. A detailed diagram for one lay-up is shown in Figure 5.3. As
indicated above, the main aim in current work is to study net-tension failure, for any given lay-up
(material type and thickness). The end distance is fixed and the joint width is varied accordingly.
Cross-ply lay-up systems have W/d ratio between 2 and 3. For the quasi-isotropic systems, W/d

P a g e | 97
ratio is varied in the range of 2 - 5. Furthermore, two different hole sizes (d = 5 mm, d = 10 mm)
and two clamp-up conditions (FT (≈ 0.5 N m) and T = 5 N m) were studied.
Table 5.2: Range of test parameters investigated for CFRP DLJ and SLJ tests
Laminate Thickness, t (üü) e/d W/d Hole size, d (üü) Clamp-up
torques
PX2 0.51 6 (fixed) 2 - 3 5, 10 FT, 5 N m
PX4 1.03 6 (fixed) 2 - 3 5, 10 FT, 5 N m
5X2 0.81 6 (fixed) 2 - 3 5, 10 FT, 5 N m
5X4 1.60 6 (fixed) 2 - 3 5, 10 FT, 5 N m
PQ4 1.02 4 (fixed) 2 - 5 5, 10 FT, 5 N m
PQ8 2.03 4 (fixed) 2 - 5 5, 10 FT, 5 N m
5Q12 4.62 4 (fixed) 2 - 5 5, 10 FT, 5 N m
W/d Hole diameter Preload torque
PQ4
(e/d fixed
t fixed)
(DLJ/SLJ)
2
d = 5 mm
d = 10 mm
Finger-tight
T = 5 N m
Finger-tight
T = 5 N m
3
d = 5 mm
d = 10 mm
Finger-tight
T = 5 N m
Finger-tight
T = 5 N m
4
d = 5 mm
d = 10 mm
Finger-tight
T = 5 N m
Finger-tight
T = 5 N m
5
d = 5 mm
d = 10 mm
Finger-tight
T = 5 N m
Finger-tight
T = 5 N m
Figure 5.3: Range of tests carried out on PQ4 laminate (16 different W/d, hole diameter
and clamp-up combinations for each joint type).

P a g e | 98
5.5 Mechanical Testing
The tensile testing of the bolted lap-joint systems is described next. The aim of the testing was
to determine the load-displacement response, the ultimate strength and associated failure
mechanisms. In general, at least three specimens for each test matrix joint were tested and the
average bearing stress at failure was recorded. However, due to limited panel size available, some
joint systems of certain lay-up have only two coupons. The numbers seem sufficient as most test
configurations showed good reproducibility.
ASTM Standard D3039B was referred to in designing the test set-up for measuring quasi-
static tensile strength properties of bolted joints. Quasi-static tensile loading on bolted joints was
carried out using INSTRON 1175 upgraded to 5550, which is located in Mechanical Testing
Laboratory, University of Surrey. The cross-head speed used was 0.5 mm/min and the load cell
capacity was 100 kN. Data required from the test are applied load and displacement which is
obtained from PC data log recorded every second. For larger hole size (d= 10 mm) coupons, a
servo-hydraulic fatigue machine was used due to the capability of this machine to accommodate
the largest coupon width of 50 mm. Samples of double-lap joint and single-lap joint assemblies
installed experimentally are displayed in Figure 5.4.
Figure 5.4: Experimental set-up of bolted joint tests (a) double-lap joint (b) single-lap
joint
(a) (b)
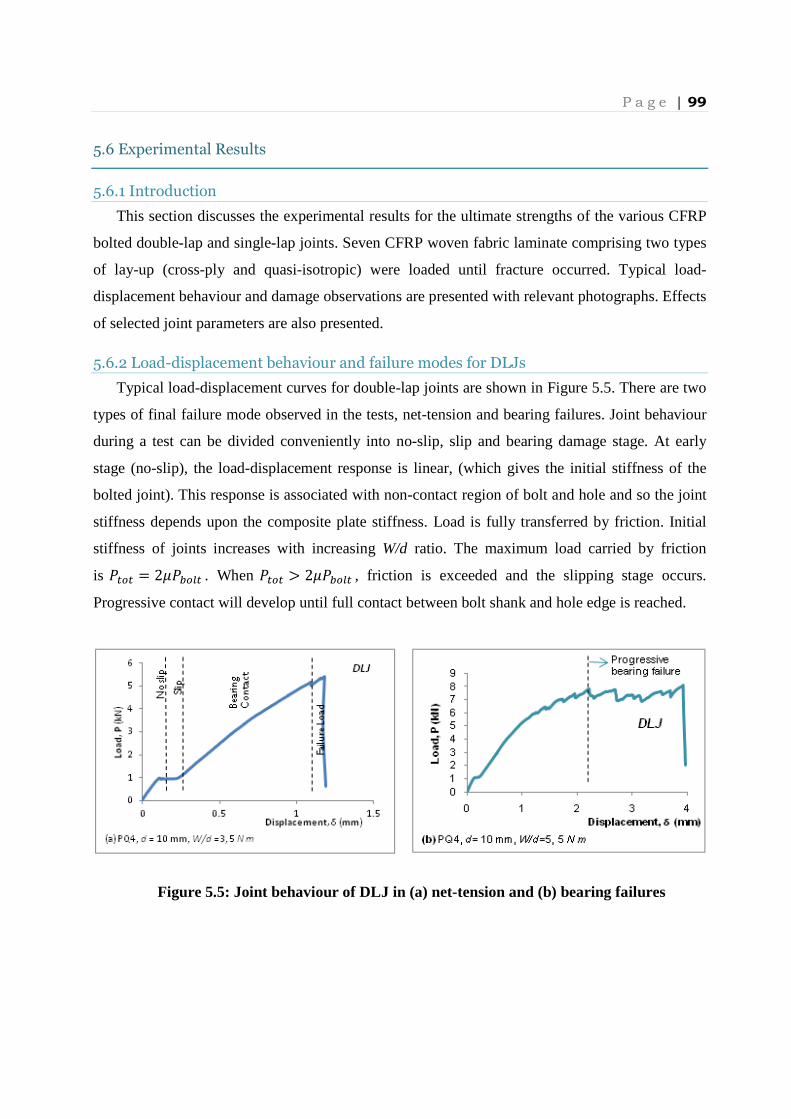
P a g e | 99
5.6 Experimental Results
5.6.1 Introduction
This section discusses the experimental results for the ultimate strengths of the various CFRP
bolted double-lap and single-lap joints. Seven CFRP woven fabric laminate comprising two types
of lay-up (cross-ply and quasi-isotropic) were loaded until fracture occurred. Typical load-
displacement behaviour and damage observations are presented with relevant photographs. Effects
of selected joint parameters are also presented.
5.6.2 Load-displacement behaviour and failure modes for DLJs
Typical load-displacement curves for double-lap joints are shown in Figure 5.5. There are two
types of final failure mode observed in the tests, net-tension and bearing failures. Joint behaviour
during a test can be divided conveniently into no-slip, slip and bearing damage stage. At early
stage (no-slip), the load-displacement response is linear, (which gives the initial stiffness of the
bolted joint). This response is associated with non-contact region of bolt and hole and so the joint
stiffness depends upon the composite plate stiffness. Load is fully transferred by friction. Initial
stiffness of joints increases with increasing W/d ratio. The maximum load carried by friction
is @��� = 2 @\��� . When@��� > 2 @\��� , friction is exceeded and the slipping stage occurs.
Progressive contact will develop until full contact between bolt shank and hole edge is reached.
Figure 5.5: Joint behaviour of DLJ in (a) net-tension and (b) bearing failures

P a g e | 100
In general, maximum loads are achieved between 1 – 2.5 mm displacements and thereafter
load decreases with increasing displacement in all lay-ups depending on mode of failures. Net-
tension failures displayed the lowest failure loads and failure is catastrophic. Failure load
increases with W/d ratio. Progressive bearing failures occurred at larger W/d ratios. Figure 5.6
shows the load-displacement curve for all tested geometries of double-lap joint in PQ4 lay-up
with finger-tight and clamped conditions. The greater hole elongation in the finger-tight coupons
is clear.
Figure 5.6: Typical load-displacement curve in DLJ as a function of W/d
In some joint geometries of low W/d (W/d ≤ 3), especially in the finger-tight condition,
bearing damage occurred at the hole edge, as indicated by local drops, followed by bolt movement
leading to considerable non-linearity in the load-displacement curve. After the initial damage,
(which is audible), the load applied will drop slightly. These load drops may be repeated several
times until the specimen fails catastrophically with a major drop due to the formation and
propagation of cracks at the hole edges. The progressive bearing damage is likely to be associated
with a combination of matrix cracking, delamination and fibre compressive failure. It is known
that these events can lead to repeated load drops at a loaded hole. For the joints that fail in net-
tension, it is possible, following Kontolatis (2000), that tow fractures may develop at the hole
edge before ultimate failure. Testing CFRP materials meant that such tow fractures, if present,
could not be visual observed directly.
Net-tension
Bearing
Net-tension
Bearing
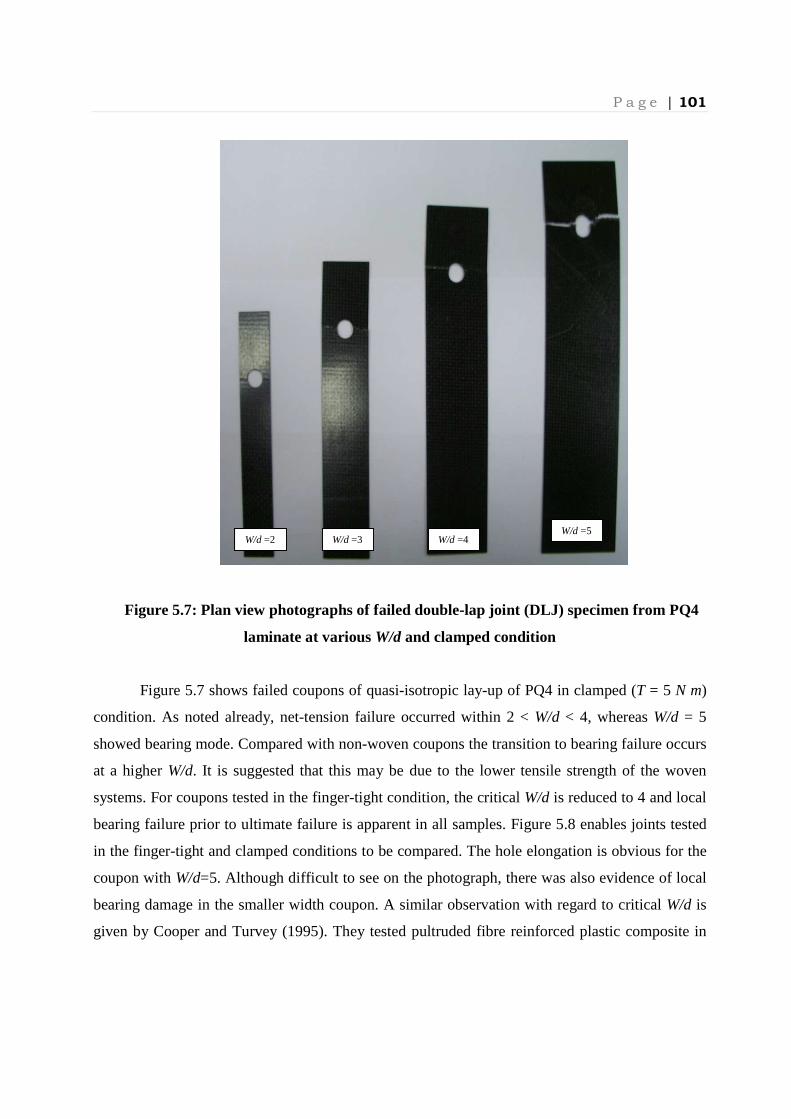
P a g e | 101
Figure 5.7: Plan view photographs of failed double-lap joint (DLJ) specimen from PQ4
laminate at various W/d and clamped condition
Figure 5.7 shows failed coupons of quasi-isotropic lay-up of PQ4 in clamped (T = 5 N m)
condition. As noted already, net-tension failure occurred within 2 < W/d < 4, whereas W/d = 5
showed bearing mode. Compared with non-woven coupons the transition to bearing failure occurs
at a higher W/d. It is suggested that this may be due to the lower tensile strength of the woven
systems. For coupons tested in the finger-tight condition, the critical W/d is reduced to 4 and local
bearing failure prior to ultimate failure is apparent in all samples. Figure 5.8 enables joints tested
in the finger-tight and clamped conditions to be compared. The hole elongation is obvious for the
coupon with W/d=5. Although difficult to see on the photograph, there was also evidence of local
bearing damage in the smaller width coupon. A similar observation with regard to critical W/d is
given by Cooper and Turvey (1995). They tested pultruded fibre reinforced plastic composite in
W/d =5 W/d =4 W/d =3 W/d =2

P a g e | 102
which critical W/d increased from 4 in pin joint to W/d = 6 with clamping torque 3 N m and
W/d=10 with clamping torque 30 N m.
For the two cross-ply woven materials (PX and 5X) net-tension failure was observed for
all the joints tested, except for the unclamped, larger hole size with W/d=3. In non-woven
materials bearing failure might be expected with W/d=3. Again, it is the lower strength of the
woven material that is believed to be associated with the greater occurrence of net-tension
failures. Two types of bearing failures are observed prior to ultimate failures. The first type
showed local bearing initially but ultimate failures are given as net-tension mode (failures given in
net-tension showed ultimate failures from hole edge and failed catastrophically). This type of
bearing failure is more pronounced in thin coupons. Second type showed pure bearing failures
which exhibited compression behind the bolt up to certain length (no net-tension failures are
observed).
Figure 5.8: Plan view photographs of failed specimens from PQ4 laminate at different
clamping conditions
FT
5 N m
FT
5 N m
W/d =2
W/d =5

P a g e | 103
5.6.3 Load-displacement behaviour and failure modes for SLJs
Representative load-displacements curve for single-lap joints are shown in Figure 5.9. The
features on the curves for the single-lap joints are similar to those for the double-lap joints. The
secondary bending effect does not lead to any obvious change in the shape of the load-
displacement response, but does affect the bearing stress at failure.
Figure 5.9: Joint behaviour of SLJ in (a) net-tension and (b) bearing failures
Figure 5.10 showed the photographs of failed single-lap joint coupons of PQ4 lay-up in
clamped condition over the full range of joint widths tested. Compared to double-lap joint, washer
pull-through onto the laminate is apparent in single-lap joint, as shown more clearly in W/d=5. At
the smallest joint widths, one failure mechanism leads to a tensile fracture, which is similar to that
seen in double-lap joints. For W/d=3, again, the failure is by net-tension, but for this geometry
inspection of the elevation of the failures (Figure 5.11) suggests that the final fracture may be
through-thickness rather than a cross the width. For W/d=4 progressive bearing failure is apparent
with final failure showing the bolt pulling through the laminate. The effect of washer pull through
tends to chip off the area of damaged area as shown in Figure 5.10. It is also observed that the
crack is initiated at the bottom plane and propagated to top plane, due to the secondary bending as
a result of unsymmetrical line path.
0
1
2
3
4
0 0.2 0.4 0.6 0.8 1
Lo
ad
, P
(k
N)
Displacement, δ (mm)
Sli
p
No S
lip
Bea
ring
Conta
ct
Failu
re L
oad
(a) PQ4, d = 10 mm, W/d =2, 5 N m
SLJ
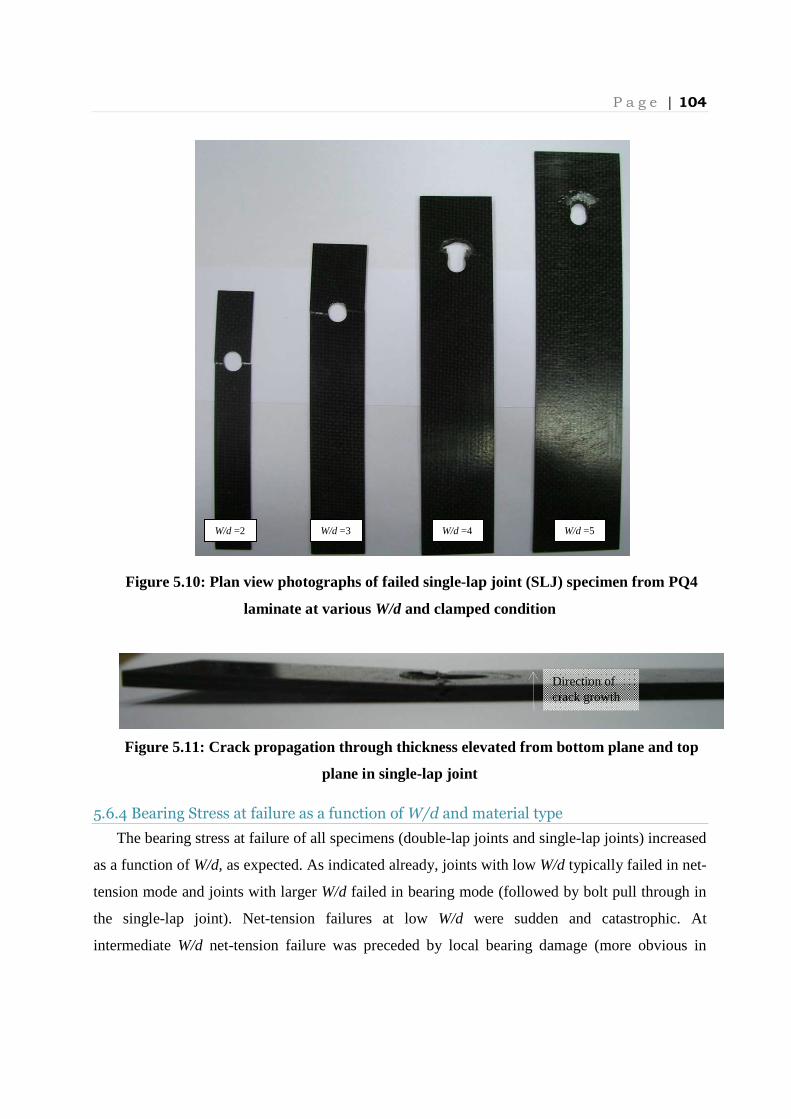
P a g e | 104
Figure 5.10: Plan view photographs of failed single-lap joint (SLJ) specimen from PQ4
laminate at various W/d and clamped condition
Figure 5.11: Crack propagation through thickness elevated from bottom plane and top
plane in single-lap joint
5.6.4 Bearing Stress at failure as a function of W/d and material type
The bearing stress at failure of all specimens (double-lap joints and single-lap joints) increased
as a function of W/d, as expected. As indicated already, joints with low W/d typically failed in net-
tension mode and joints with larger W/d failed in bearing mode (followed by bolt pull through in
the single-lap joint). Net-tension failures at low W/d were sudden and catastrophic. At
intermediate W/d net-tension failure was preceded by local bearing damage (more obvious in
W/d =2 W/d =3 W/d =4 W/d =5
Direction of crack growth
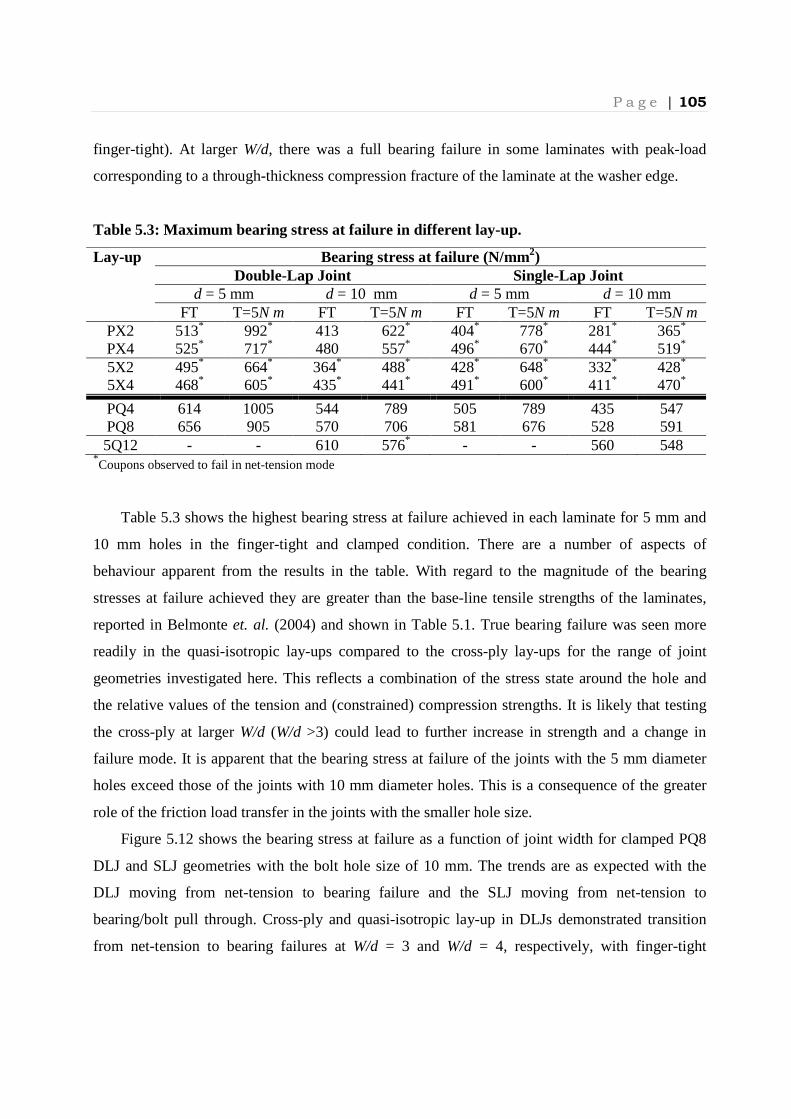
P a g e | 105
finger-tight). At larger W/d, there was a full bearing failure in some laminates with peak-load
corresponding to a through-thickness compression fracture of the laminate at the washer edge.
Table 5.3: Maximum bearing stress at failure in different lay-up.
Lay-up Bearing stress at failure (N/mm2) Double-Lap Joint Single-Lap Joint
d = 5 mm d = 10 mm d = 5 mm d = 10 mm FT T=5N m FT T=5N m FT T=5N m FT T=5N m
PX2 513* 992* 413 622* 404*
778* 281*
365*
PX4 525* 717* 480 557* 496*
670* 444*
519*
5X2 495* 664*
364* 488* 428*
648* 332*
428*
5X4 468* 605*
435* 441* 491*
600* 411*
470*
PQ4 614 1005 544 789 505 789 435 547 PQ8 656 905 570 706 581 676 528 591 5Q12 - - 610 576* - - 560 548
*Coupons observed to fail in net-tension mode
Table 5.3 shows the highest bearing stress at failure achieved in each laminate for 5 mm and
10 mm holes in the finger-tight and clamped condition. There are a number of aspects of
behaviour apparent from the results in the table. With regard to the magnitude of the bearing
stresses at failure achieved they are greater than the base-line tensile strengths of the laminates,
reported in Belmonte et. al. (2004) and shown in Table 5.1. True bearing failure was seen more
readily in the quasi-isotropic lay-ups compared to the cross-ply lay-ups for the range of joint
geometries investigated here. This reflects a combination of the stress state around the hole and
the relative values of the tension and (constrained) compression strengths. It is likely that testing
the cross-ply at larger W/d (W/d >3) could lead to further increase in strength and a change in
failure mode. It is apparent that the bearing stress at failure of the joints with the 5 mm diameter
holes exceed those of the joints with 10 mm diameter holes. This is a consequence of the greater
role of the friction load transfer in the joints with the smaller hole size.
Figure 5.12 shows the bearing stress at failure as a function of joint width for clamped PQ8
DLJ and SLJ geometries with the bolt hole size of 10 mm. The trends are as expected with the
DLJ moving from net-tension to bearing failure and the SLJ moving from net-tension to
bearing/bolt pull through. Cross-ply and quasi-isotropic lay-up in DLJs demonstrated transition
from net-tension to bearing failures at W/d = 3 and W/d = 4, respectively, with finger-tight
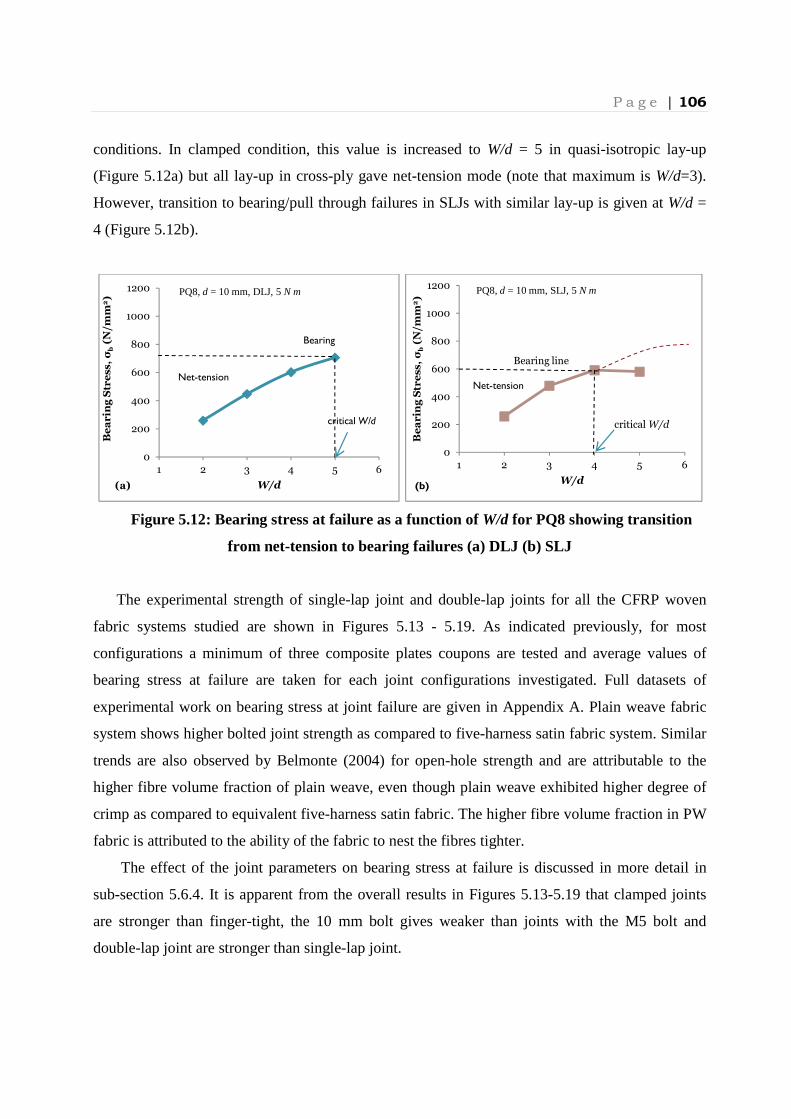
P a g e | 106
conditions. In clamped condition, this value is increased to W/d = 5 in quasi-isotropic lay-up
(Figure 5.12a) but all lay-up in cross-ply gave net-tension mode (note that maximum is W/d=3).
However, transition to bearing/pull through failures in SLJs with similar lay-up is given at W/d =
4 (Figure 5.12b).
Figure 5.12: Bearing stress at failure as a function of W/d for PQ8 showing transition
from net-tension to bearing failures (a) DLJ (b) SLJ
The experimental strength of single-lap joint and double-lap joints for all the CFRP woven
fabric systems studied are shown in Figures 5.13 - 5.19. As indicated previously, for most
configurations a minimum of three composite plates coupons are tested and average values of
bearing stress at failure are taken for each joint configurations investigated. Full datasets of
experimental work on bearing stress at joint failure are given in Appendix A. Plain weave fabric
system shows higher bolted joint strength as compared to five-harness satin fabric system. Similar
trends are also observed by Belmonte (2004) for open-hole strength and are attributable to the
higher fibre volume fraction of plain weave, even though plain weave exhibited higher degree of
crimp as compared to equivalent five-harness satin fabric. The higher fibre volume fraction in PW
fabric is attributed to the ability of the fabric to nest the fibres tighter.
The effect of the joint parameters on bearing stress at failure is discussed in more detail in
sub-section 5.6.4. It is apparent from the overall results in Figures 5.13-5.19 that clamped joints
are stronger than finger-tight, the 10 mm bolt gives weaker than joints with the M5 bolt and
double-lap joint are stronger than single-lap joint.
0
200
400
600
800
1000
1200
1 2 3 4 5 6
Be
ar
ing
Str
ess,
σb
(N/m
m2)
W/d
PQ8, d = 10 mm, DLJ, 5 N m
critical W/d
Net-tension
Bearing
(a)
0
200
400
600
800
1000
1200
1 2 3 4 5 6
Be
ar
ing
Str
ess,
σb
(N/m
m2)
W/d
T = 5 N mPQ8, d = 10 mm, SLJ, 5 N m
Bearing line
critical W/d
Net-tension
(b)
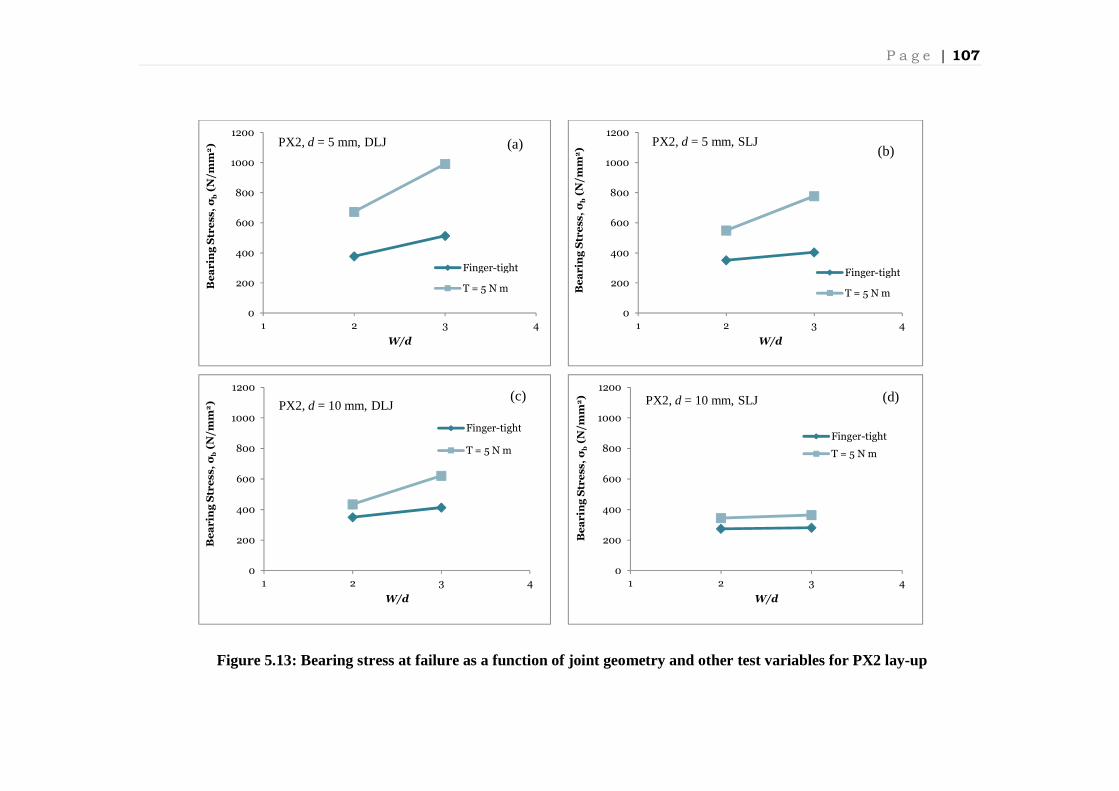
P a g e | 107
Figure 5.13: Bearing stress at failure as a function of joint geometry and other test variables for PX2 lay-up
0
200
400
600
800
1000
1200
1 2 3 4
Be
ar
ing
Str
ess,
σb
(N/m
m2)
W/d
Finger-tight
T = 5 N m
PX2, d = 5 mm, DLJ
0
200
400
600
800
1000
1200
1 2 3 4
Be
ar
ing
Str
ess,
σb
(N/m
m2)
W/d
Finger-tight
T = 5 N m
PX2, d = 5 mm, SLJ(b)
0
200
400
600
800
1000
1200
1 2 3 4
Be
ar
ing
Str
es
s,
σb
(N/m
m2)
W/d
Finger-tight
T = 5 N m
PX2, d = 10 mm, DLJ(c)
0
200
400
600
800
1000
1200
1 2 3 4B
ea
rin
g S
tre
ss,
σb
(N/m
m2)
W/d
Finger-tight
T = 5 N m
PX2, d = 10 mm, SLJ (d)
(a)
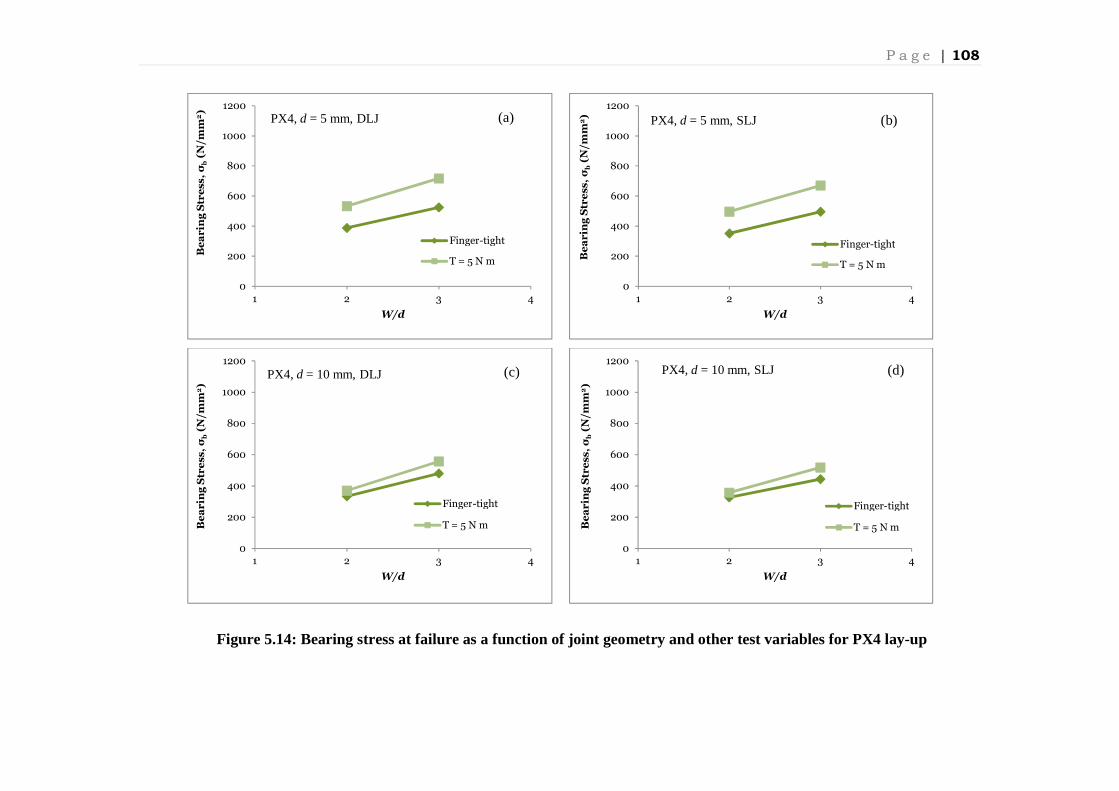
P a g e | 108
Figure 5.14: Bearing stress at failure as a function of joint geometry and other test variables for PX4 lay-up
0
200
400
600
800
1000
1200
1 2 3 4
Be
ar
ing
Str
ess
, σ
b(N
/mm
2)
W/d
Finger-tight
T = 5 N m
PX4, d = 5 mm, DLJ (a)
0
200
400
600
800
1000
1200
1 2 3 4
Be
ar
ing
Str
ess,
σb
(N/m
m2)
W/d
Finger-tight
T = 5 N m
PX4,d = 5 mm, SLJ (b)
0
200
400
600
800
1000
1200
1 2 3 4
Be
ar
ing
Str
ess,
σb
(N/m
m2)
W/d
Finger-tight
T = 5 N m
PX4, d = 10 mm, DLJ (c)
0
200
400
600
800
1000
1200
1 2 3 4
Be
ar
ing
Str
ess,
σb
(N/m
m2)
W/d
Finger-tight
T = 5 N m
PX4, d = 10 mm, SLJ (d)

P a g e | 109
Figure 5.15: Bearing stress at failure as a function of joint geometry and other test variables for 5X2 lay-up
0
200
400
600
800
1000
1200
1 2 3 4
Be
ar
ing
Str
ess
, σ
b(N
/mm
2)
W/d
Finger-tight
T = 5 N m
5X2, d = 5 mm, DLJ (a)
0
200
400
600
800
1000
1200
1 2 3 4
Be
ar
ing
Str
ess,
σb
(N/m
m2)
W/d
Finger-tight
T = 5 N m
5X2, d = 5 mm, SLJ (b)
0
200
400
600
800
1000
1200
1 2 3 4
Be
ar
ing
Str
ess,
σb
(N/m
m2)
W/d
Finger-tight
T = 5 N m
5X2, d = 10 mm, DLJ (c)
0
200
400
600
800
1000
1200
1 2 3 4
Be
ar
ing
Str
ess,
σb
(N/m
m2)
W/d
Finger-tight
T = 5 N m
5X2, d = 10 mm, SLJ (d)
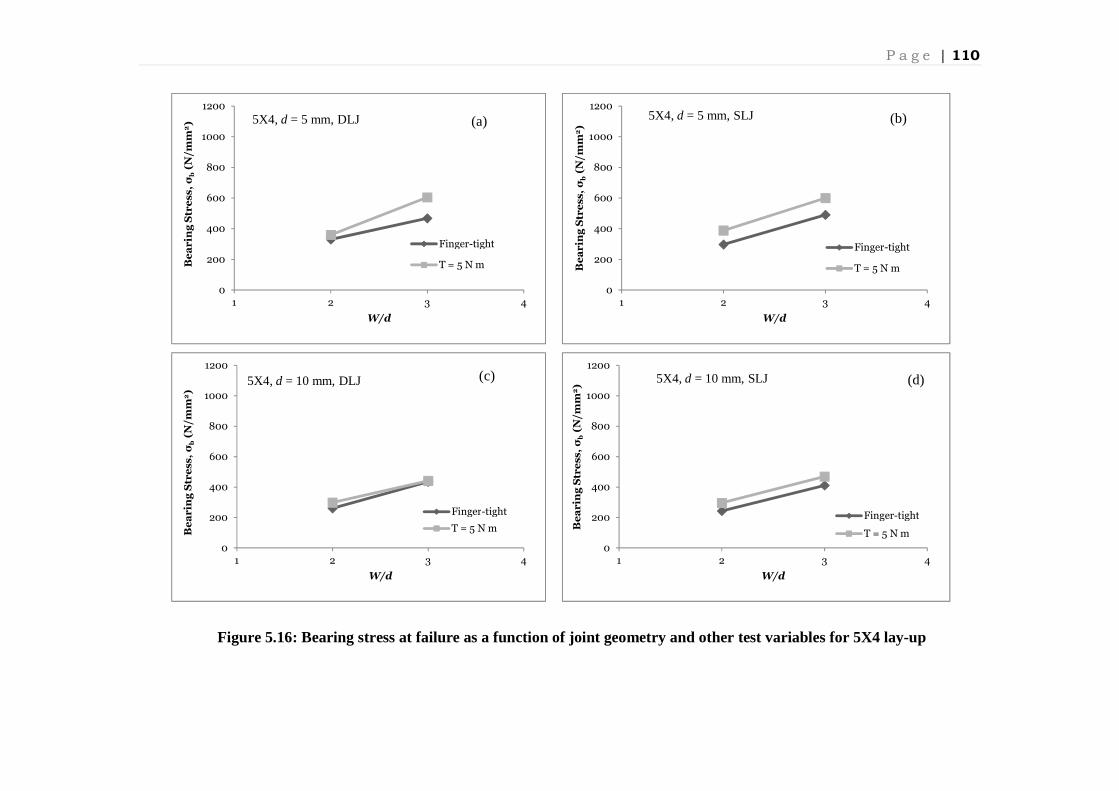
P a g e | 110
Figure 5.16: Bearing stress at failure as a function of joint geometry and other test variables for 5X4 lay-up
0
200
400
600
800
1000
1200
1 2 3 4
Be
ar
ing
Str
ess
, σ
b(N
/mm
2)
W/d
Finger-tight
T = 5 N m
5X4, d = 5 mm, DLJ (a)
0
200
400
600
800
1000
1200
1 2 3 4
Be
ar
ing
Str
ess,
σb
(N/m
m2)
W/d
Finger-tight
T = 5 N m
5X4, d = 5 mm, SLJ (b)
0
200
400
600
800
1000
1200
1 2 3 4
Be
ar
ing
Str
ess,
σb
(N/m
m2)
W/d
Finger-tight
T = 5 N m
5X4, d = 10 mm, DLJ (c)
0
200
400
600
800
1000
1200
1 2 3 4
Be
ar
ing
Str
ess,
σb
(N/m
m2)
W/d
Finger-tight
T = 5 N m
5X4, d = 10 mm, SLJ (d)
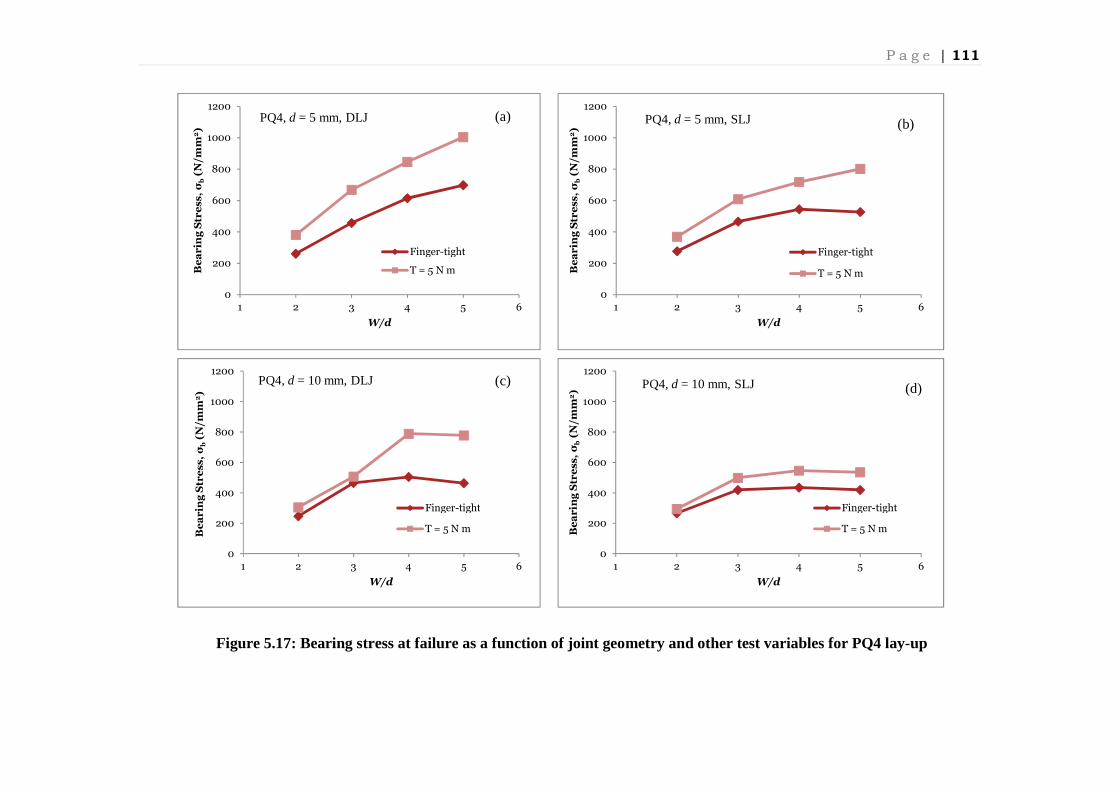
P a g e | 111
Figure 5.17: Bearing stress at failure as a function of joint geometry and other test variables for PQ4 lay-up
0
200
400
600
800
1000
1200
1 2 3 4 5 6
Be
ar
ing
Str
ess,
σb
(N/m
m2)
W/d
Finger-tight
T = 5 N m
PQ4, d = 5 mm, DLJ (a)
0
200
400
600
800
1000
1200
1 2 3 4 5 6
Be
ar
ing
Str
ess,
σb
(N/m
m2)
W/d
Finger-tight
T = 5 N m
PQ4,d = 5 mm, SLJ (b)
0
200
400
600
800
1000
1200
1 2 3 4 5 6
Be
ar
ing
Str
ess,
σb
(N/m
m2)
W/d
Finger-tight
T = 5 N m
PQ4,d = 10 mm, DLJ (c)
0
200
400
600
800
1000
1200
1 2 3 4 5 6B
ea
rin
g S
tre
ss,
σb
(N/m
m2)
W/d
Finger-tight
T = 5 N m
PQ4, d = 10 mm, SLJ (d)

P a g e | 112
Figure 5.18: Bearing stress at failure as a function of joint geometry and other test variables for PQ8 lay-up
0
200
400
600
800
1000
1200
1 2 3 4 5 6
Be
ar
ing
Str
ess,
σb
(N/m
m2)
W/d
Finger-tight
T = 5 N m
PQ8, d = 5 mm, DLJ (a)
0
200
400
600
800
1000
1200
1 2 3 4 5 6
Be
ar
ing
Str
ess,
σb
(N/m
m2)
W/d
Finger-tight
T = 5 N m
PQ8, d = 5 mm, SLJ (b)
0
200
400
600
800
1000
1200
1 2 3 4 5 6
Be
ar
ing
Str
ess,
σb
(N/m
m2)
W/d
Finger-tight
T = 5 N m
PQ8, d = 10 mm, DLJ (c)
0
200
400
600
800
1000
1200
1 2 3 4 5 6
Be
ar
ing
Str
ess,
σb
(N/m
m2)
W/d
Finger-tight
T = 5 N m
PQ8, d = 10 mm, SLJ (d)
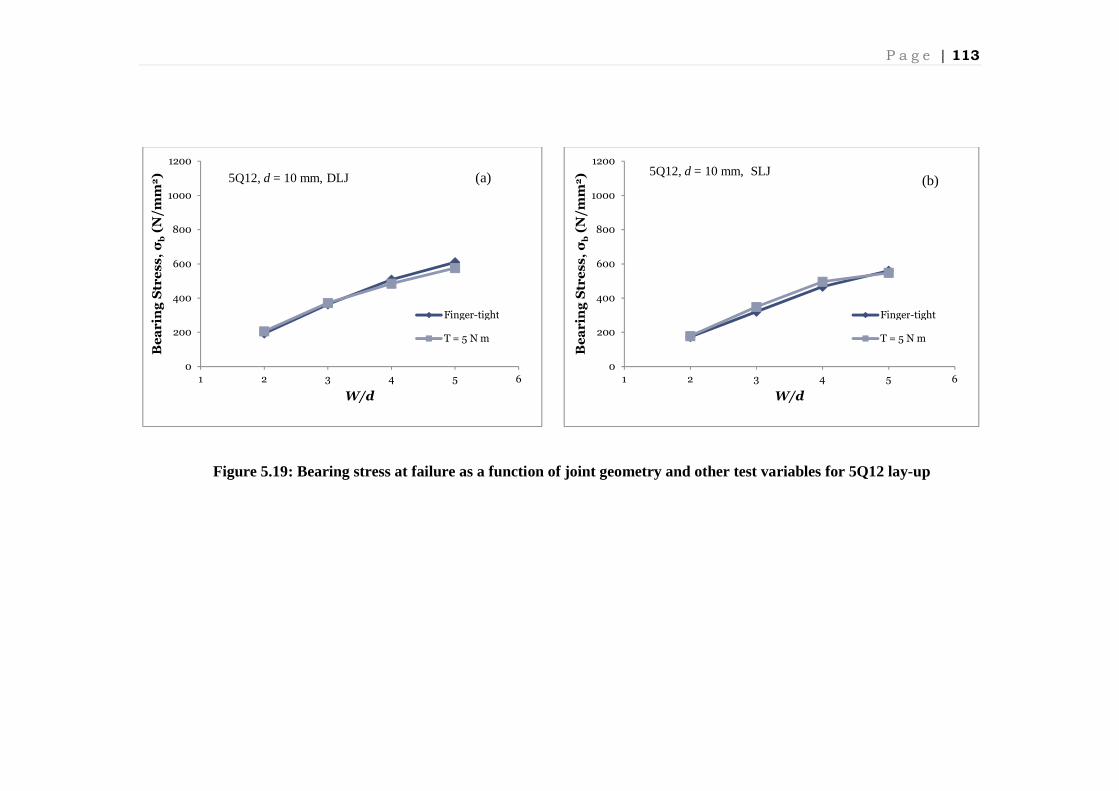
P a g e | 113
Figure 5.19: Bearing stress at failure as a function of joint geometry and other test variables for 5Q12 lay-up
0
200
400
600
800
1000
1200
1 2 3 4 5 6
Be
ar
ing
Str
es
s,
σb
(N/m
m2)
W/d
Finger-tight
T = 5 N m
5Q12, d = 10 mm, DLJ (a)
0
200
400
600
800
1000
1200
1 2 3 4 5 6
Be
ar
ing
Str
es
s,
σb
(N/m
m2)
W/d
Finger-tight
T = 5 N m
5Q12, d = 10 mm, SLJ(b)
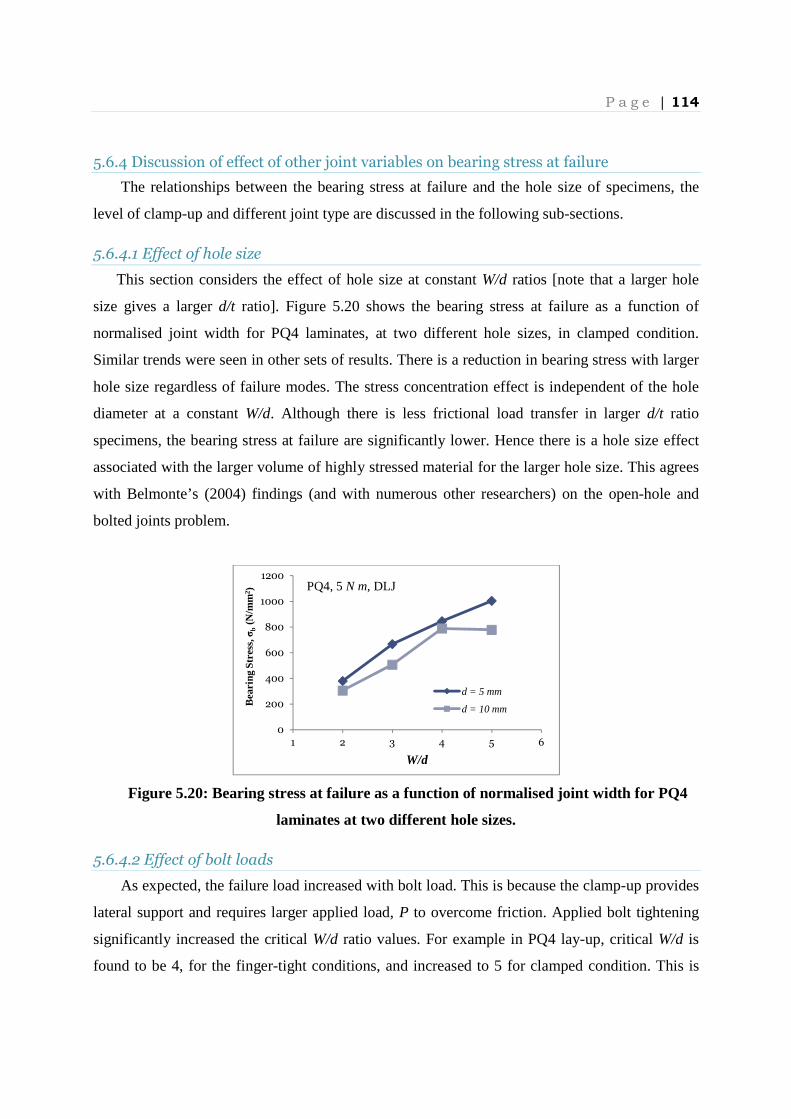
P a g e | 114
5.6.4 Discussion of effect of other joint variables on bearing stress at failure
The relationships between the bearing stress at failure and the hole size of specimens, the
level of clamp-up and different joint type are discussed in the following sub-sections.
5.6.4.1 Effect of hole size
This section considers the effect of hole size at constant W/d ratios [note that a larger hole
size gives a larger d/t ratio]. Figure 5.20 shows the bearing stress at failure as a function of
normalised joint width for PQ4 laminates, at two different hole sizes, in clamped condition.
Similar trends were seen in other sets of results. There is a reduction in bearing stress with larger
hole size regardless of failure modes. The stress concentration effect is independent of the hole
diameter at a constant W/d. Although there is less frictional load transfer in larger d/t ratio
specimens, the bearing stress at failure are significantly lower. Hence there is a hole size effect
associated with the larger volume of highly stressed material for the larger hole size. This agrees
with Belmonte’s (2004) findings (and with numerous other researchers) on the open-hole and
bolted joints problem.
Figure 5.20: Bearing stress at failure as a function of normalised joint width for PQ4
laminates at two different hole sizes.
5.6.4.2 Effect of bolt loads
As expected, the failure load increased with bolt load. This is because the clamp-up provides
lateral support and requires larger applied load, P to overcome friction. Applied bolt tightening
significantly increased the critical W/d ratio values. For example in PQ4 lay-up, critical W/d is
found to be 4, for the finger-tight conditions, and increased to 5 for clamped condition. This is
0
200
400
600
800
1000
1200
1 2 3 4 5 6
Bea
ring
Str
ess,
σ b(N
/mm
2 )
W/d
d = 5 mm
d = 10 mm
PQ4, 5 N m, DLJ

P a g e | 115
because the constraint (as a result from clamp-up) restrained the movement of washers and bolt
leading to higher strength and produced net-tension mode.
Figure 5.21 compares the effects of finger-tight conditions and clamped torque of 5 N m in
PQ4 and PQ8 lay-up at 5 mm hole size. The effect from clamp-up is more apparent in thin
laminates than thicker laminates. This is likely to be because the load transfer through friction is
less in thicker laminates. Hence for the thicker laminates, there is less difference in bearing stress
at failure between clamped and finger-tight conditions.
Figure 5.21: Bearing stress at failure as a function of normalised joint width for PQ8
and PQ4 laminates at two different clamp-up conditions.
5.6.4.3 Effect of joint type
Figure 5.22 shows the bearing stress at failure as a function of normalised joint width for
PQ4 laminate for different joint types and bolt loads. In double-lap joint, cracks are initiated and
propagated uniformly through the thickness. On the other hand, single-lap joint configuration,
secondary bending is observed and fractures initiates at bottom plane (on most tension side of
specimen) and propagate through the thickness to top plane (the less tension side). This is shown
in Figure 5.11. Although secondary bending is associated with strength reduction, the tensile
failures in the SLJs did not show consistently lower strengths than the DLJs. It may that this
failure mechanism might be stronger than double-lap joint configuration due to redistribution of
stresses to adjacent lay-up if current lay-up had failed. However, only certain lay-up and joint
geometries showed these characteristics, especially in thicker plates.
In single-lap joints, with W/d ratio found to ~ 4 for quasi-isotropic and W/d ~ 3 for cross-ply)
the washer edge is found to dig into the CFRP specimen due to bolt bending and tilting. Apart
0
200
400
600
800
1000
1200
1 2 3 4 5 6
Bea
ring
Str
ess,
σ b(N
/mm
2 )
W/d
Finger-tight, PQ8T = 5 N m, PQ8Finger-tight, PQ4T = 5 N m, PQ4
PQ8, d = 10 mm, DLJ

P a g e | 116
from showing bearing failure as exhibited in double-lap joint, the single-lap joint is prone to
show washer bending in composite plate. On the other hand, joints with smaller W/d ratio
showed net-tension failure mode in both joint configurations.
Figure 5.22: Bearing stress at failure as a function of normalized joint width for PQ4
laminate for different joint types and clamp-up condition.
5.7 Concluding Remarks
An extensive experimental study has been carried out on the bearing stress at failure of
bolted joints assembled using woven fabric CFRP based on two fabric types and of two lay-ups.
Joint geometries were chosen to give failure in net-tension or bearing. The trends of the
experimental data were consistent with previous studies in the literature, although investigations
of fabric systems are limited. Clamped joints were stronger than pinned joints. DLJs were
stronger than SLJs. There was a hole size effect whereby joints with holes of diameter 10 mm
were weaker than those with a hole diameter of 5 mm. The results from this experimental
programme will be used in Chapter 6 and Chapter 7 to validate finite element (FEA) modelling
results which is discussed in next chapter on double-lap bolted joint model and subsequent
chapter on single-lap bolted joint model.
0
200
400
600
800
1000
1200
1 2 3 4 5 6Be
ar
ing
Str
ess,
σb
(N/m
m2)
W/d
DLJ, 5 N mSLJ, 5 N mDLJ, FTSLJ, FT
PQ4, d = 5 mm

P a g e | 117
Chapter 6 : 3-D Modelling of GFRP and CFRP
Bolted Double-Lap Joints
6.1 Introduction
This chapter extends the 2-D woven fabric bolted joint modelling of Chapter 4 into 3-D
bolted double-lap joint modelling, incorporating the effect of the bolt tension from application of
a tightening torque (i.e., the clamp-up condition). The idealisation used in the 2D models for
interaction with the bolt and the friction were found to be too simplistic. The 3-D modelling
presented here has improved on this by explicitly including all parts of the joint using contact
surfaces with friction to control the interaction of the parts. A similar failure model to that used
in the open-hole problem (described in Chapter 3) is implemented, using properties for the GFRP
and CFRP woven fabric systems of Chapter 4 and 5 taken from Belmonte et. al. (2001, 2004).
There are limited cases of 3-D modelling reported in the literature associated with strength
prediction - most previous studies used 2-D pin joint models.
Full 3-D elastic properties are required in the modelling. These properties are calculated
using equations taken from the literature and derivation from simple Classical Laminate Plate
Theory (CLPT). The results are presented in Section 6.2. Following this, the stages involved in
implementing 3-D FEA models are described. The resulting stress distributions from the FEA
models are compared with available closed-form equations. A parametric study of the stress
distribution in the composite plates is undertaken to show the effect of different lay-ups and
degree of clamp-up. Strength predictions from 3-D modelling are developed by implementing
traction-separation relationship incorporating XFEM and a sensitivity study is presented. These
analyses are carried out for bolted GFRP joints (after Kontolatis’s experimental work (2000))
and the CFRP joints from the experimental test programme (Chapter 5). Strength predictions are
compared with experimental data and discussed in the final section. It should be noted that all
joints include a steel substrate but are referred to in the following chapter as “GFRP joints” and
“CFRP joints” for brevity.

P a g e | 118
6.2 Implementation of 3-D FEA Models
The work presented in this chapter concentrates on bolted double-lap joints. Determination of
3-D properties is considered first. This is followed by description of the modelling stages which
include the use of “smeared-out” properties, the development of the FE models and the
associated boundary conditions and the implementation of the failure criterion.
6.2.1 Determination of 3-D elastic properties
In-plane and out-of-plane elastic properties of the CFRP and GFRP woven fabric composites
are required in 3-D modelling. In-plane elastic properties were determined experimentally and
are reproduced from Belmonte’s work (2002) in Table 5.1. Out-of-plane elastic properties have
been estimated following a simple approach. It seems likely that net-tension failure is governed
mainly by the in-plane properties. The out-of-plane elastic constants required are�Q, XQ., XQ`, ,Q. and ,Q`. For the cross-ply lay-ups these properties are estimated from idealisations based on
simple CLPT principles and are presented in Appendix B1. This leads to averaged values over
the thickness of the laminate. Out-of-plane properties for the quasi-isotropic lay-ups are taken
from Akkerman (2002) and given in Appendix B2. The resulting in-plane and out-of-plane
elastic properties for all lay-ups are listed in Table 6.1.
Table 6.1: Elastic properties of GFRP and CFRP lay-ups investigated in current study
incorporating out-of-plane properties
Material �� (GPa)
�� (GPa)
�� (GPa)
��� ��� ��� � (GPa)
� (GPa)
� (GPa)
GFRP 16.0 16.0 10 0.3 0.31 0.31 6.15 3.54 3.54
PX2 50.73 50.73 12 0.07 0.10 0.10 4.34 3.98 3.98
PX4 51.40 51.40 12 0.09 0.10 0.10 4.42 3.90 3.90
5X2 45.07 45.07 13 0.08 0.11 0.11 3.78 3.89 3.89
5X4 47.00 47.00 13 0.06 0.11 0.11 3.78 3.85 3.85
PQ4 37.19 37.19 12 0.35 0.30 0.30 13.75 3.98 3.98
PQ8 36.80 36.80 12 0.33 0.30 0.30 13.86 4.04 4.04
5Q12 34.79 34.79 13 0.32 0.30 0.30 13.15 3.96 3.96
P a g e | 119
6.2.2 Generation of 3-D Model
6.2.2.1 Overview of model
The bolted joint system may exhibit high non-linearity due to frictional load transfer which is
more prominent with increased bolt tensioning. 3-D models are able to include friction load
transfer explicitly, leading to a more representative simulation. GFRP bolted joints (from
Kontolatis’s work) and CFRP bolted joints (from the experimental work in Chapter 5) are
generated using ABAQUS CAE 6.10. Elastic properties of the woven fabric composite used in
the model are based on smeared-out in-plane and out-of-plane properties, the latter determined as
described in sub-section 6.2.1. All joint parts are assembled by defining interaction (with
appropriate friction values) between all contacting surfaces. Boundary conditions and applied
loading are assigned to appropriate plane surfaces and edges to simulate mechanical testing in
bolted joint configurations. Due to symmetry only half of the configuration is modelled to save
computational costs and efforts. Sensitivity studies are conducted to determine appropriate mesh
sizes and values for the damage stabilization coefficient (required to obtain solution
convergence).
6.2.2.2 The use of “Smeared-out” properties
In woven composite modelling, the behaviour at the sub-lamina level is far from fully
understood due to the effects of complex fibre architecture. Although much work in predicting
mechanical properties of woven fabric systems has been implemented using a unit cell approach,
this cannot readily be applied to local failure at a stress raiser. A simple approach that takes into
account the orthotropic elastic properties of composite materials is by smearing (averaging) to
provide “equivalent homogeneous properties”. Using smeared properties for a woven fabric
system is inherently a better approximation than for non-woven systems because two separate
plies in a pre-preg based laminate are replaced by a single layer in a woven fabric composite.
Homogeneous elastic properties unable to distinguish between in-plane and flexural stiffness.
The flexural response of a laminate depends on ���� terms in CLPT and smearing-out becomes
more appropriate in thicker plates of many plies. This will be discussed further with reference to
bolted single-lap joints in Chapter 7.

P a g e | 120
6.2.2.2 Modelling Approaches and Techniques
A schematic view of the composite substrate and the associated geometry definition is shown
in Figure 6.1. The bolted joint systems in the test matrix (described in section 5.4) have varying
dimensions. The models used are the same for GFRP and CFRP, the only difference being the
assigned values of material properties. All joints have a fixed e/d ratio but their W/d and/or d/t
ratios, and bolt tension may change. Although these variations may change composite failure
mechanisms the main aim is to predict the failure that is exhibited through net-tension mode.
Other failure mechanisms may therefore not be physically represented in the following
modelling approach.
End-distance, e
Wid
th, W
Length, L
x
y
z
tx
θ Ø Hole Diameter, d
Figure 6.1: Joint geometries required for 3-D modelling
In the double-lap joint, seven separate parts are assembled and shown in Figure 6.2. The
composite plate is sandwiched between two steel plates and fastened with a single steel bolt. The
washers and bolt are modelled separately to represent the real load transfer due to friction. This
is in contrast to previous research work which simplified both parts as a single unit. The bolt
head and nut are modelled as one unit as shown in Figure 6.2. The bolt head and nuts are
modelled using the actual dimensions.

P a g e | 121
Figure 6.2: Part components in double-lap joint
A typical mesh of the joint model is shown schematically in Figure 6.3. Symmetry about the
x-axis is modelled in all cases for computational efficiency. The mesh was refined in the vicinity
of the hole (under washers), while away from the hole, the mesh was made coarser. A similar
implementation was used in the open hole model of Chapter 3. The number of degrees of
freedom for the bolted joint models is about 100,000. 8-node linear brick elements (C3D8 in
ABAQUS CAE) are used because these elements are compatible with the XFEM-based failure
model. Boundary conditions should be assigned properly to provide realistic loading. Steel plates
are restrained in all degrees of freedom at one end of the model [A], while displacement is
applied to the composite plate at the other end of the model [B] as shown in Figure 6.3.
Figure 6.3: FEA model of double-lap bolted joint implemented in ABAQUS CAE.
B
A
Steel Plates
Composite Plate
Bolt
Nut
Washers
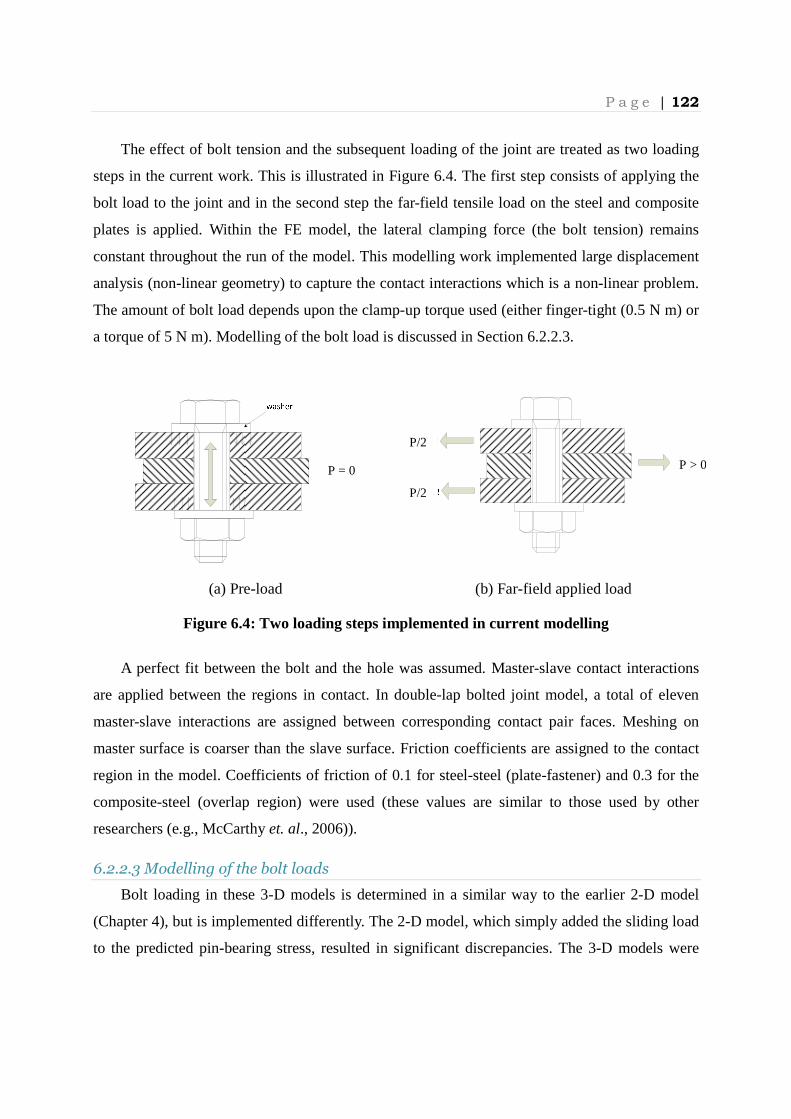
P a g e | 122
The effect of bolt tension and the subsequent loading of the joint are treated as two loading
steps in the current work. This is illustrated in Figure 6.4. The first step consists of applying the
bolt load to the joint and in the second step the far-field tensile load on the steel and composite
plates is applied. Within the FE model, the lateral clamping force (the bolt tension) remains
constant throughout the run of the model. This modelling work implemented large displacement
analysis (non-linear geometry) to capture the contact interactions which is a non-linear problem.
The amount of bolt load depends upon the clamp-up torque used (either finger-tight (0.5 N m) or
a torque of 5 N m). Modelling of the bolt load is discussed in Section 6.2.2.3.
(a) Pre-load (b) Far-field applied load
Figure 6.4: Two loading steps implemented in current modelling
A perfect fit between the bolt and the hole was assumed. Master-slave contact interactions
are applied between the regions in contact. In double-lap bolted joint model, a total of eleven
master-slave interactions are assigned between corresponding contact pair faces. Meshing on
master surface is coarser than the slave surface. Friction coefficients are assigned to the contact
region in the model. Coefficients of friction of 0.1 for steel-steel (plate-fastener) and 0.3 for the
composite-steel (overlap region) were used (these values are similar to those used by other
researchers (e.g., McCarthy et. al., 2006)).
6.2.2.3 Modelling of the bolt loads
Bolt loading in these 3-D models is determined in a similar way to the earlier 2-D model
(Chapter 4), but is implemented differently. The 2-D model, which simply added the sliding load
to the predicted pin-bearing stress, resulted in significant discrepancies. The 3-D models were
P > 0
P/2
P/2
P = 0

P a g e | 123
able to include the bolt load and friction load transfer directly. During the early stage of external
loading (prior to plate sliding), the load is transferred by friction. As applied load increases the
plates start to slide until the hole bore and the bolt shank came into contact.
F/2
F/2
F > 2µPmaxCFRP Plate
Steel Plate
Steel Plate
Figure 6.5: Sliding load is overcome as load being applied
From the experimental load-displacement curve, as displacement increases with constant
load, the friction load is overcome and the plate starts to slide, see Figure 6.5(� Ê 2 @���).
From basic law of friction, assuming a friction coefficient of 0.3, the average load in the bolt
associated with GFRP tests was found to be 2000 N when a torque of 5 N m was applied to the
bolt. A similar approach was taken with the CFRP lay-ups. Figure 6.6 (an enlargement of the part
of Figure 5.5) shows the sliding in a CFRP joint.
Figure 6.6: Illustrating an experimental sliding load
The procedure used to model the bolt load was suggested by ABAQUS CAE 6.10, whereby
the bolt is pre-tensioned prior to the application of the far-field tensile load. Application of bolt
load is implemented in pre-load loading step (Figure 6.4a) by tightening the bolt for carrying
specified load. The bolt load is applied at the centreline of the bolt as shown in Figure 6.7.
0
0.5
1
1.5
2
2.5
3
0 0.1 0.2 0.3 0.4 0.5
Lo
ad
, P
(N
)
Displacement, δ (mm)PQ4, d = 5 mm, W/d =2, 5 N m
Sliding load
P > 2μPmax
P /2
P /2
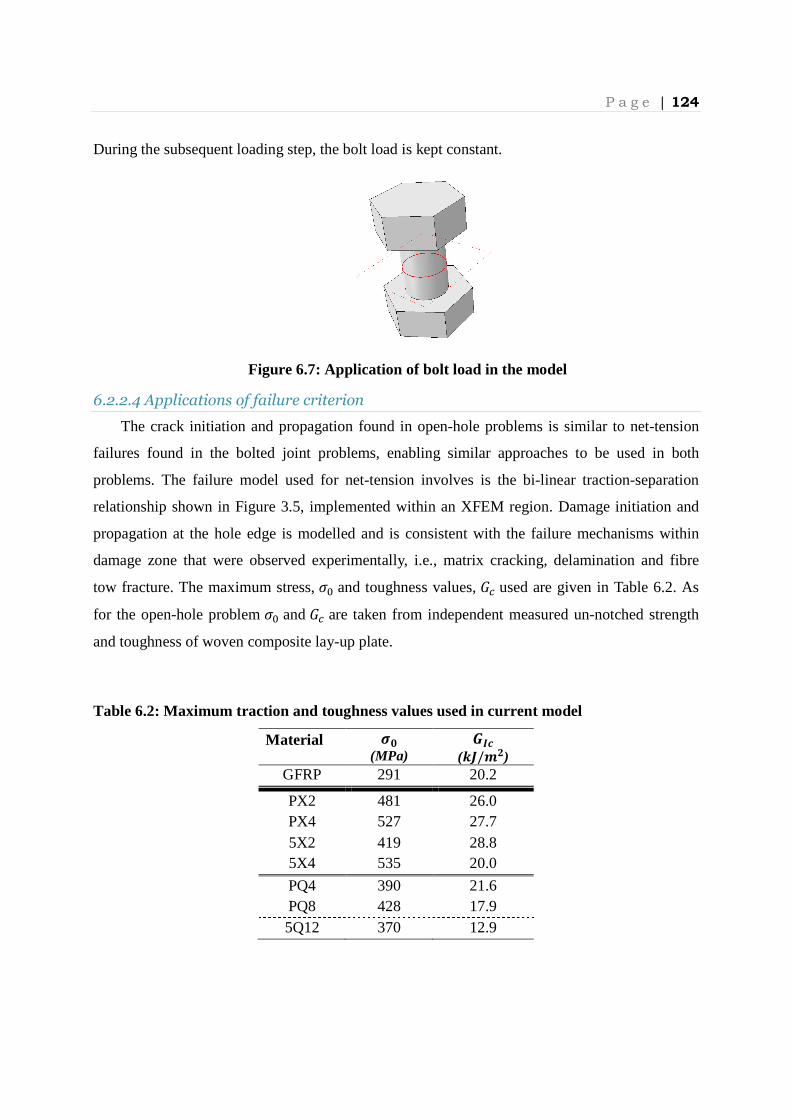
P a g e | 124
During the subsequent loading step, the bolt load is kept constant.
Figure 6.7: Application of bolt load in the model
6.2.2.4 Applications of failure criterion
The crack initiation and propagation found in open-hole problems is similar to net-tension
failures found in the bolted joint problems, enabling similar approaches to be used in both
problems. The failure model used for net-tension involves is the bi-linear traction-separation
relationship shown in Figure 3.5, implemented within an XFEM region. Damage initiation and
propagation at the hole edge is modelled and is consistent with the failure mechanisms within
damage zone that were observed experimentally, i.e., matrix cracking, delamination and fibre
tow fracture. The maximum stress, Z� and toughness values, ,� used are given in Table 6.2. As
for the open-hole problem Z� and ,� are taken from independent measured un-notched strength
and toughness of woven composite lay-up plate.
Table 6.2: Maximum traction and toughness values used in current model
Material �� (MPa)
àá (��/�ý)
GFRP 291 20.2
PX2 481 26.0 PX4 527 27.7 5X2 419 28.8 5X4 535 20.0
PQ4 390 21.6 PQ8 428 17.9 5Q12 370 12.9
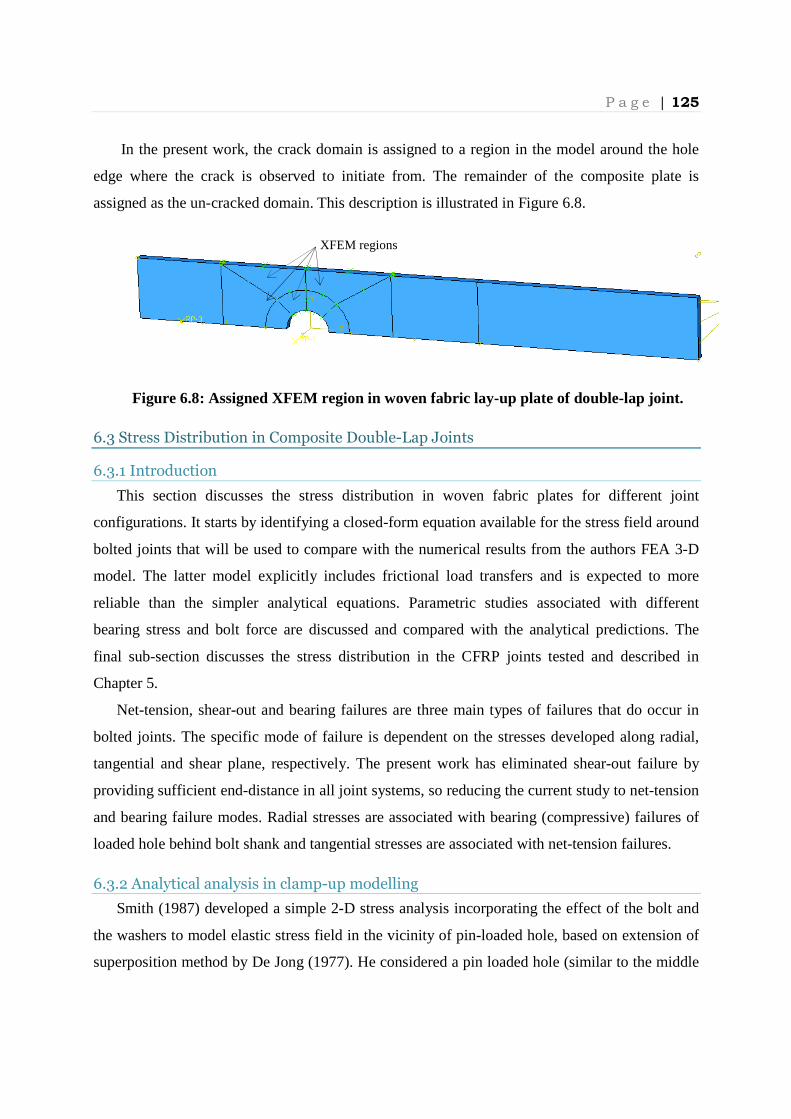
P a g e | 125
In the present work, the crack domain is assigned to a region in the model around the hole
edge where the crack is observed to initiate from. The remainder of the composite plate is
assigned as the un-cracked domain. This description is illustrated in Figure 6.8.
Figure 6.8: Assigned XFEM region in woven fabric lay-up plate of double-lap joint.
6.3 Stress Distribution in Composite Double-Lap Joints
6.3.1 Introduction
This section discusses the stress distribution in woven fabric plates for different joint
configurations. It starts by identifying a closed-form equation available for the stress field around
bolted joints that will be used to compare with the numerical results from the authors FEA 3-D
model. The latter model explicitly includes frictional load transfers and is expected to more
reliable than the simpler analytical equations. Parametric studies associated with different
bearing stress and bolt force are discussed and compared with the analytical predictions. The
final sub-section discusses the stress distribution in the CFRP joints tested and described in
Chapter 5.
Net-tension, shear-out and bearing failures are three main types of failures that do occur in
bolted joints. The specific mode of failure is dependent on the stresses developed along radial,
tangential and shear plane, respectively. The present work has eliminated shear-out failure by
providing sufficient end-distance in all joint systems, so reducing the current study to net-tension
and bearing failure modes. Radial stresses are associated with bearing (compressive) failures of
loaded hole behind bolt shank and tangential stresses are associated with net-tension failures.
6.3.2 Analytical analysis in clamp-up modelling
Smith (1987) developed a simple 2-D stress analysis incorporating the effect of the bolt and
the washers to model elastic stress field in the vicinity of pin-loaded hole, based on extension of
superposition method by De Jong (1977). He considered a pin loaded hole (similar to the middle
XFEM regions

P a g e | 126
plate of double-lap joint) in an isotropic plate of large width. The equations also assume a rigid
bolt and that the washers remain perpendicular to the bolt axis. Stress distribution in radial
direction is calculated by combining Equation (6.1), following Bickley (1928), and (6.3),
similarly the tangential stresses is given by combining (6.2), again following Bickley (1928), and
(6.4) given below,
Z� = ?2¡¤1 − 2���¥ − ?22� cos S �1 − 1 − X.`4 ¤1 − 2���¥�− ?4¡�2 cos S ¤1 + 4 2��� − 2}�}¥ tan¬� 22� cos S
1 − 2���!
− ?8¡ �2 sin S ¤1 − 2���¥
�log1 + 22� ∙ sin S + 2�
��1 − 22� ∙ sin S + 2�
��
(6.1)
Za = ?2¡ ¤3 + 2���¥ + 1 − X.`8 ? 2� cosS �¤1 + 2���¥�− ?4¡�2 cosS ¤3 + 2}�}¥ tan¬�
22� cos S1 − 2��� !− ?8¡ �2 sinS ¤3 − 2 2��� − 2}�}¥ log 1 + 22� ∙ sin S + 2���1 − 22� ∙ sin S + 2���
(6.2)
Z� = D′2 ¤1 − 2���¥ + D′2 ¤1 + 32}�} − 42��¥ cos 2S (6.3)
Z$ = D′2 ¤1 + 2���¥ − D′2 ¤1 + 32}�} ¥ cos2S (6.4)
where, X.` is in-plane Poisson’s ratio and D% = 0.5 ∗ ���� ∗ Z\. Terms � and 2 are distance from
the centre bolt axis and the hole (bolt) radius. Other terms used in equation (6.1) - (6.4) are
expressed as follows (6.5) – (6.9):
P a g e | 127
? = k4¡lZ\,� (6.5)
Z\,� = (@ − 2 ����+/E
(6.6)
���� = ������� + ����� (6.7)
������� = �/& (6.8)
����� = 'X k��� lk@ − 2 ����E l¡) � − �+/4 (6.9)
���� is the sum of the two components, with ������� the clamping force due to initial bolt
tensioning and �����the clamping force resulting from resisted lateral expansion of the laminate.
In this way, the bearing stress on the composite, Z\,� includes the effects of frictional load
transfer as given in (6.6). Stress distributions from analytical equations will be compared with 3-
D FEA models in Section 6.3.3.
6.3.3 Comparisons of Analytical and FEA modelling
This study involved the analysis of 3-D models of GFRP 8-harness satin lay-up in double-lap
joints systems. Stress distributions in radial and tangential directions along hole circumferences
with a bearing stress of 500 N/mm2 and variations in the bolt tension are compared with stresses
from the analytical equations (6.1) - (6.4). A coupon with W/d = 5 is chosen and comparisons
between the two stress predictions are shown in Figure 6.9 - 6.10.
Physically, friction loads are transferred through all contact surfaces under the washers.
During early stages of applied bearing load the composite plates showed full load transfer via
friction. When friction is overcome at approximately2 @\��� = @ , the connection force P are
partially transferred through friction and partially through bearing. In a double-lap joint, it is
assumed that uniform stresses are exhibited throughout the plate thickness. A net-tension failure
is associated with local tensile stress. On the other hand, bearing failures are associated with
compressive stresses on the part of the hole in contact with the bolt.
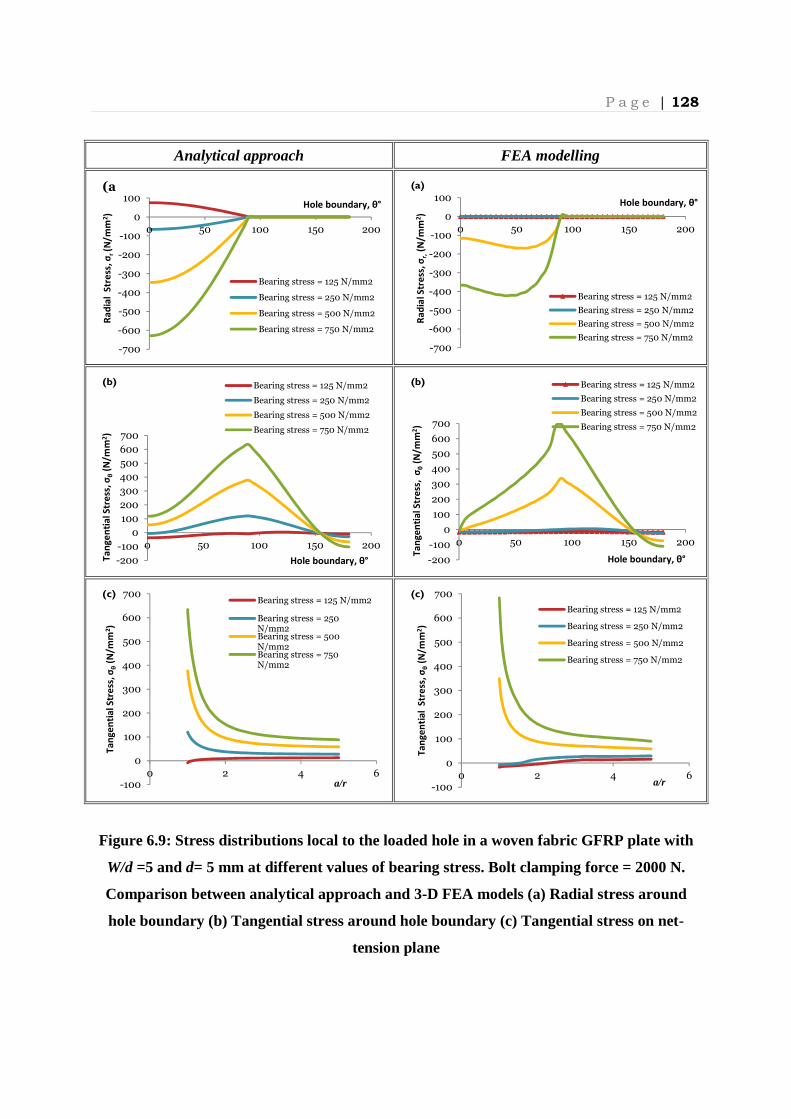
P a g e | 128
Analytical approach FEA modelling
Figure 6.9: Stress distributions local to the loaded hole in a woven fabric GFRP plate with
W/d =5 and d= 5 mm at different values of bearing stress. Bolt clamping force = 2000 N.
Comparison between analytical approach and 3-D FEA models (a) Radial stress around
hole boundary (b) Tangential stress around hole boundary (c) Tangential stress on net-
tension plane
-700
-600
-500
-400
-300
-200
-100
0
100
0 50 100 150 200
Ra
dia
l S
tre
ss, σ
r (N
/mm
2)
Hole boundary, θ°
Bearing stress = 125 N/mm2
Bearing stress = 250 N/mm2
Bearing stress = 500 N/mm2
Bearing stress = 750 N/mm2
(a
-700
-600
-500
-400
-300
-200
-100
0
100
0 50 100 150 200
Ra
dia
l Str
ess
, σr,
(N/m
m2)
Hole boundary, θ°
Bearing stress = 125 N/mm2
Bearing stress = 250 N/mm2
Bearing stress = 500 N/mm2
Bearing stress = 750 N/mm2
(a)
-200
-100
0
100
200
300
400
500
600
700
0 50 100 150 200
Ta
ng
en
tia
l Str
ess
, σθ
(N/m
m2)
Hole boundary, θ°
Bearing stress = 125 N/mm2
Bearing stress = 250 N/mm2
Bearing stress = 500 N/mm2
Bearing stress = 750 N/mm2
(b)
-200
-100
0
100
200
300
400
500
600
700
0 50 100 150 200
Ta
ng
en
tia
l Str
ess
, σ
θ(N
/mm
2)
Hole boundary, θ°
Bearing stress = 125 N/mm2
Bearing stress = 250 N/mm2
Bearing stress = 500 N/mm2
Bearing stress = 750 N/mm2
(b)
-100
0
100
200
300
400
500
600
700
0 2 4 6
Ta
ng
en
tia
l S
tre
ss, σ
θ(N
/mm
2)
a/r
Bearing stress = 125 N/mm2
Bearing stress = 250 N/mm2Bearing stress = 500 N/mm2Bearing stress = 750 N/mm2
(c)
-100
0
100
200
300
400
500
600
700
0 2 4 6
Ta
ng
en
tia
l S
tre
ss, σ
θ(N
/mm
2)
a/r
Bearing stress = 125 N/mm2
Bearing stress = 250 N/mm2
Bearing stress = 500 N/mm2
Bearing stress = 750 N/mm2
(c)

P a g e | 129
Analytical approach FEA modelling
Figure 6.10: Stress distributions local to the loaded hole in a woven fabric GFRP plate with
W/d =5 and d = 5 mm at different values of clamping force. Bearing stress = 500 N/mm2.
Comparison between analytical approach and 3-D FEA models (a) Radial stress around
hole boundary (b)Tangential stress around hole boundary (c) Tangential stress on net-
section plane.
-600
-500
-400
-300
-200
-100
0
100
0 50 100 150 200
Ra
dia
l str
ess
, σr
(N/m
m2)
Hole boundary, θ°
Clamping Force = 0 N
Clamping Force= 200 N
Clamping Force= 500 N
Clamping Force= 1000 N
Clamping Force= 1500 N
Clamping Force= 2000 N
(a)
-600
-500
-400
-300
-200
-100
0
100
0 50 100 150 200
Ra
dia
l str
ess
, σr
(N/m
m2)
Hole boundary, θº
Clamping Force = 0 N
Clamping Force = 200 N
Clamping Force = 500 N
(a)
-200
-100
0
100
200
300
400
500
600
700
0 50 100 150 200
Ta
ng
en
tia
l str
ess
, σθ
(N/m
m2)
Hole boundary, θ°
Clamping Force = 0 N
Clamping Force=200 N
Clamping Force= 500 N
Clamping Force= 1000 NClamping Force= 1500 N
Clamping Force= 2000 N
(b)
-200
-100
0
100
200
300
400
500
600
700
0 50 100 150 200
Ta
ng
en
tia
l st
ress
, σθ
(N/m
m2)
Hole boundary, θ°
Clamping Force = 0 NClamping Force = 200 NClamping Force = 500 NClamping Force = 1000 NClamping Force = 1500 NClamping Force = 2000 N
(b)
0
100
200
300
400
500
600
700
0 2 4 6
Ta
ng
en
tia
l st
ress
, σθ
(N/m
m2)
a/r
Clamping Force = 0 N
Clamping Force=200 N
Clamping Force= 500 N
Clamping Force= 1000 N
Clamping Force= 1500 N
Clamping Force= 2000 N
(c)
0
100
200
300
400
500
600
700
0 2 4 6
Ta
ng
en
tia
l str
ess
, σθ
(N/m
m2)
a/r
Clamping Force=0 N
Clamping Force = 200 N
Clamping Force = 500 N
Clamping Force = 1000 N
Clamping Force = 1500 N
Clamping Force = 2000 N
(c)(c)
P a g e | 130
Figure 6.9 and 6.10 display the results from analytical and 3-D FEA models. From the
analytical approach at low bearing stresses, the radial stress around the bolt perimeter is tensile.
This is physically unrealistic but is due to the second term in Equation 6.4 being negative,
when2 @\��� < @ . This is also observed in early stage of tangential stress distribution where
the stresses from the analytical solution are slightly negative (again physically unrealistic). 3-D
models are able to model the full friction transfer condition correctly giving zero stress in radial
and tangential direction around the hole perimeter for low levels of bearing stress. The analytical
solution also showed the maximum radial stress occurs on the bearing plane (0º on hole
boundary) but 3-D FEA models showed this to shift about 45° . This is expected because
analytical solution is unable to include friction load transfers effect of frictional contact between
the bolt and the hole. A similar trend to for the radial stress distribution from FEA was also
found by Yavari et. al. (2009).
The slightly higher values tangential stress obtained from FEA are, at least, in part, because
the analytical solution has not been corrected for finite width effects. As can be observed from
Figure 6.10 (a) and (b), increased clamping force will reduce both the radial stress and tangential
stress. Figure 6.10 (c) shows the tangential stress along net-section; for a fixed bearing stress the
tangential stress reduced with bolt load. With fixed bearing stress, lower bolting forces increase
the tangential stress concentration. In summary, while there is reasonable consistency between
the trends of the two approaches, these comparisons suggested that the 3-D finite element model
intuitively that is to incorporate load-transfer mechanisms than the simplified analytical
approaches.
6.3.4 Comparison of Stress Distributions for Laminates of Different Lay-ups
The stress distribution around the circumference of the bolt hole of cross-ply laminates is
somewhat different from quasi-isotropic materials due to the lower ratio of shear modulus-to-
longitudinal modulus. In open hole problem, quasi-isotropic lay-up showed a lower stress
concentration than cross-ply lay-up. However, in a bolted joint problem, the stress concentration
is reduced at low bearing stress due to the effect of friction as a result of lateral load in the
vicinity of the hole edge.
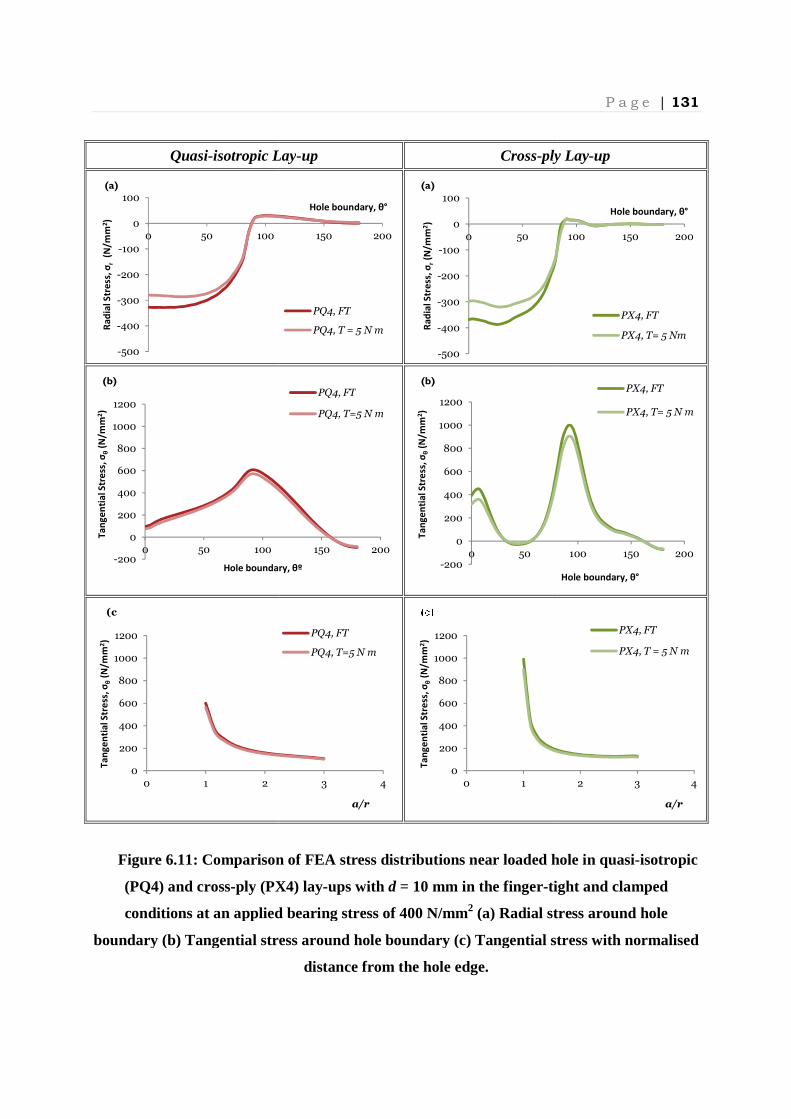
Quasi-isotropic Lay
Figure 6.11: Comparison of FEA stress distributions near loaded hole in quasi
(PQ4) and cross-ply (PX4) lay
conditions at an applied bearing stress of 400 N/mm
boundary (b) Tangential stress around hole boundary (c) Tangential stress with normalised
-500
-400
-300
-200
-100
0
100
0 50 100
Ra
dia
l Str
ess
, σr
(N/m
m2)
(a)
-200
0
200
400
600
800
1000
1200
0 50 100
Ta
ng
en
tia
l Str
ess
, σθ
(N/m
m2)
Hole boundary,
(b)
0
200
400
600
800
1000
1200
0 1 2
Ta
ng
en
tia
l Str
ess
, σθ
(N/m
m2)
(c
isotropic Lay-up Cross-ply Lay
Comparison of FEA stress distributions near loaded hole in quasi
ply (PX4) lay-ups with d = 10 mm in the finger-tight and clamp
conditions at an applied bearing stress of 400 N/mm2 (a) Radial st
boundary (b) Tangential stress around hole boundary (c) Tangential stress with normalised
distance from the hole edge.
150 200
Hole boundary, θ°
PQ4, FT
PQ4, T = 5 N m
-500
-400
-300
-200
-100
0
100
0 50
Ra
dia
l Str
ess
, σ
r(N
/mm
2)
(a)
150 200
Hole boundary, θº
PQ4, FT
PQ4, T=5 N m
-200
0
200
400
600
800
1000
1200
0 50
Ta
ng
en
tia
l Str
ess
, σθ
(N/m
m2)
(b)
3 4
a/r
PQ4, FT
PQ4, T=5 N m
0
200
400
600
800
1000
1200
0 1
Ta
ng
en
tia
l Str
ess
, σθ
(N/m
m2)
P a g e | 131
ply Lay-up
Comparison of FEA stress distributions near loaded hole in quasi-isotropic
tight and clamped
(a) Radial stress around hole
boundary (b) Tangential stress around hole boundary (c) Tangential stress with normalised
100 150 200
Hole boundary, θ°
PX4, FT
PX4, T= 5 Nm
100 150 200
Hole boundary, θ°
PX4, FT
PX4, T= 5 N m
2 3 4
a/r
PX4, FT
PX4, T = 5 N m
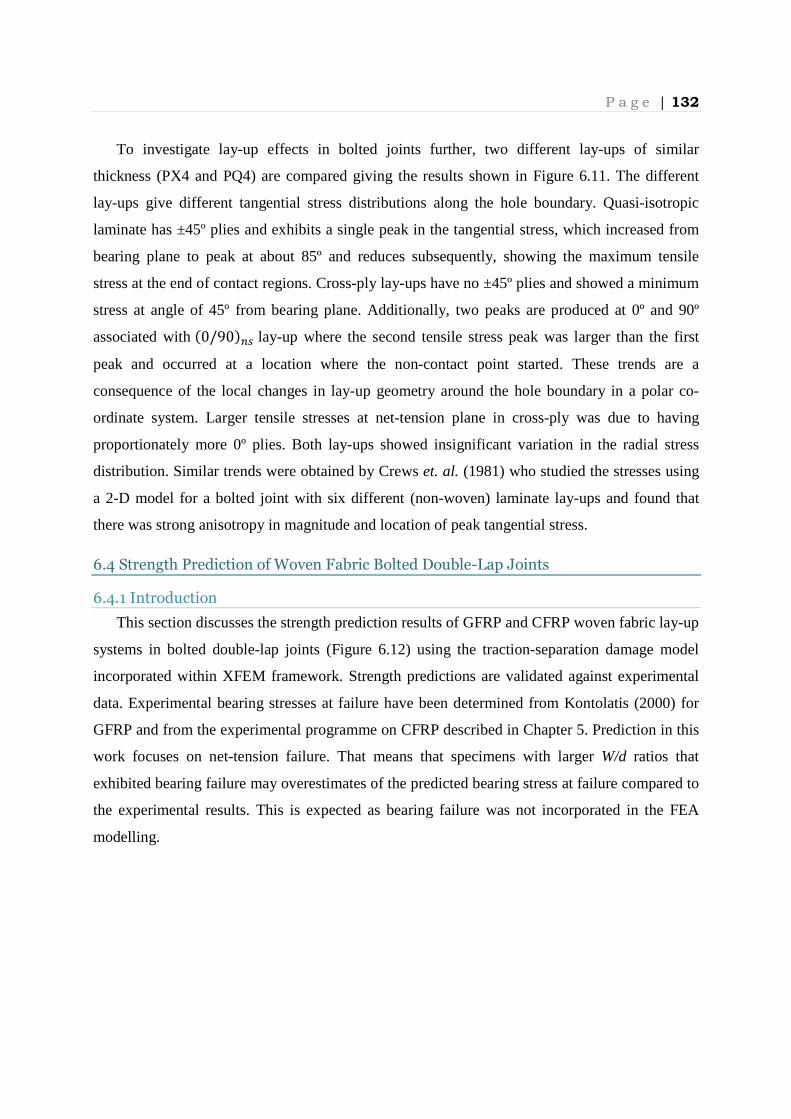
P a g e | 132
To investigate lay-up effects in bolted joints further, two different lay-ups of similar
thickness (PX4 and PQ4) are compared giving the results shown in Figure 6.11. The different
lay-ups give different tangential stress distributions along the hole boundary. Quasi-isotropic
laminate has ±45º plies and exhibits a single peak in the tangential stress, which increased from
bearing plane to peak at about 85º and reduces subsequently, showing the maximum tensile
stress at the end of contact regions. Cross-ply lay-ups have no ±45º plies and showed a minimum
stress at angle of 45º from bearing plane. Additionally, two peaks are produced at 0º and 90º
associated with (0/90)¹� lay-up where the second tensile stress peak was larger than the first
peak and occurred at a location where the non-contact point started. These trends are a
consequence of the local changes in lay-up geometry around the hole boundary in a polar co-
ordinate system. Larger tensile stresses at net-tension plane in cross-ply was due to having
proportionately more 0º plies. Both lay-ups showed insignificant variation in the radial stress
distribution. Similar trends were obtained by Crews et. al. (1981) who studied the stresses using
a 2-D model for a bolted joint with six different (non-woven) laminate lay-ups and found that
there was strong anisotropy in magnitude and location of peak tangential stress.
6.4 Strength Prediction of Woven Fabric Bolted Double-Lap Joints
6.4.1 Introduction
This section discusses the strength prediction results of GFRP and CFRP woven fabric lay-up
systems in bolted double-lap joints (Figure 6.12) using the traction-separation damage model
incorporated within XFEM framework. Strength predictions are validated against experimental
data. Experimental bearing stresses at failure have been determined from Kontolatis (2000) for
GFRP and from the experimental programme on CFRP described in Chapter 5. Prediction in this
work focuses on net-tension failure. That means that specimens with larger W/d ratios that
exhibited bearing failure may overestimates of the predicted bearing stress at failure compared to
the experimental results. This is expected as bearing failure was not incorporated in the FEA
modelling.

P a g e | 133
Fixed
Figure 6.12: Double-Lap joint configuration
6.4.2 Typical Characterisation in Double-Lap Bolted Joint Problem
Most researchers seek to determine critical W/d ratios and joint dimensions are chosen to
ensure that the bearing failure mode will occur. The study of net-tension failure has been given
less attention among researchers who claim that this catastrophic failure can be avoided by
providing sufficient W/d ratios. Additionally, multi-bolt configurations with additional stress
contribute by by-pass stress also showed greater tendency for net-tension failures. However,
maximum structural efficiency occurs with low W/d ratios that are prone to net-tension failure.
The bolt which is made from steel (E is taken to be 210>/::�) has a relatively high
modulus compared to the woven composite plate. Under these conditions bolt tilting is unlikely
to occur. The strength predictions of all composite plates investigated are given as static failure
strength in the form of:
Z� = @AB.E (6.10)
where @AB., and E are given as ultimate failure load, hole diameter and thickness of woven
fabric composite laminates specimens.
Two studies have been carried out to determine appropriate mesh size and coefficient of
damage stabilization. Similar parametric studies were undertaken for the open-hole modelling,
presented in Chapter 3. This part of the study was conducted using PQ4 lay-up with hole
diameter of 5mm with W/d=3 and clamped condition. Different mesh sizes have been considered
in the vicinity of the hole because this is the region of interest (failure). As shown in Figure 6.13,
there is no apparent effect of mesh size on strength prediction; this finding is expected as the
approach is driven by energetic approach.

P a g e | 134
Figure 6.13: Parametric study on mesh sensitivity effect on strength prediction results
Damage stabilisation studies have also been conducted to determine the most appropriate
coefficient to use. Large damage stabilization coefficient may achieve convergence faster but
may produce non-physically meaningful behaviour, over-predicting the bearing stress at failure
as shown in Figure 6.14. Nevertheless, too small a coefficient of damage stabilisation may
produce convergence difficulties. From the plot in Figure 6.14, a coefficient of 1 x 10⁻⁵ is
sufficient to achieve convergence, without affecting the predicted strengths.
Figure 6.14: Parametric study on the effect of varying the damage stabilization
coefficient used in joint strength prediction
0
100
200
300
400
500
600
700
800
1000 2000 3000 4000 5000 6000
Be
ar
ing
Str
en
gth
, σ
b(N
/mm
2)
No. of elements under washer in CFRP plates
0
1000
2000
3000
4000
5000
6000
1.E-111.E-091.E-071.E-051.E-031.E-01
Be
arin
g S
tre
ngt
h,
σb
(N/m
m2)
Damage stabilization coefficient

P a g e | 135
A typical predicted double-lap bolted joint load-displacement curve is shown in Figure 6.15.
The stress distribution is uniform through the thickness and so crack initiation and propagation
events occur simultaneously throughout. Figure 6.15 shows a similar P-δ trend to the
corresponding curve for the open-hole problem (as shown in Figure 3.11 in Chapter 3). Figure
6.16 shows damage plots at selected points on the load-displacement curve indicated on Figure
6.15. Crack initiation is exhibited as shown in Point a, at this point the plate still able to carry
more load until ultimate failure as given by Point b. Point b is the maximum failure load
(predicted joint strength) from current modelling work. Beyond point b, the joint will exhibit
catastrophic behaviour due to inability of plate to carry more load, as given in Point c and Point
d. Maximum failure load from FEA modelling of all lay-ups system is compared with
experimental data in sub-section 6.4.4.
Figure 6.15: Typical load-displacement curve for double-lap joint from 3-D FEA.
0
200
400
600
800
1000
1200
1400
1600
0 0.1 0.2 0.3 0.4 0.5
Lo
ad
, P
(N
)
Displacement, δ (mm)PX4, DLJ, d=5mm, W/d=3, FT
(a)
(b)
(c)
(d)

P a g e | 136
Figure 6.16: Maps of Von-Mises stress and crack growth at the four points marked on
the load-displacement curve in Figure 6.15
6.4.4 Strength Predictions of GFRP Bolted Double-Lap Bolted Joint
The main purpose of the work was to make strength predictions based on the 3D model to
compare with the previous 2D model and the experimental work from Kontolatis (2000). The
FEA models of the GFRP bolted double-lap joints were run and the failure loads determined.
Table 6.3 summarises the results. In the previous 2D work, the failure strength was predicted on
the basis of applying the XFEM approach to a pin-loaded hole and then making an empirical
correction for frictional load transfer. This method gave a reasonable value (in comparison with
experiment) for the smallest width joint, but the calculated values for W/d > 4 were lower than
experiment, by around 30%.
(a) (b)
(c) (d)
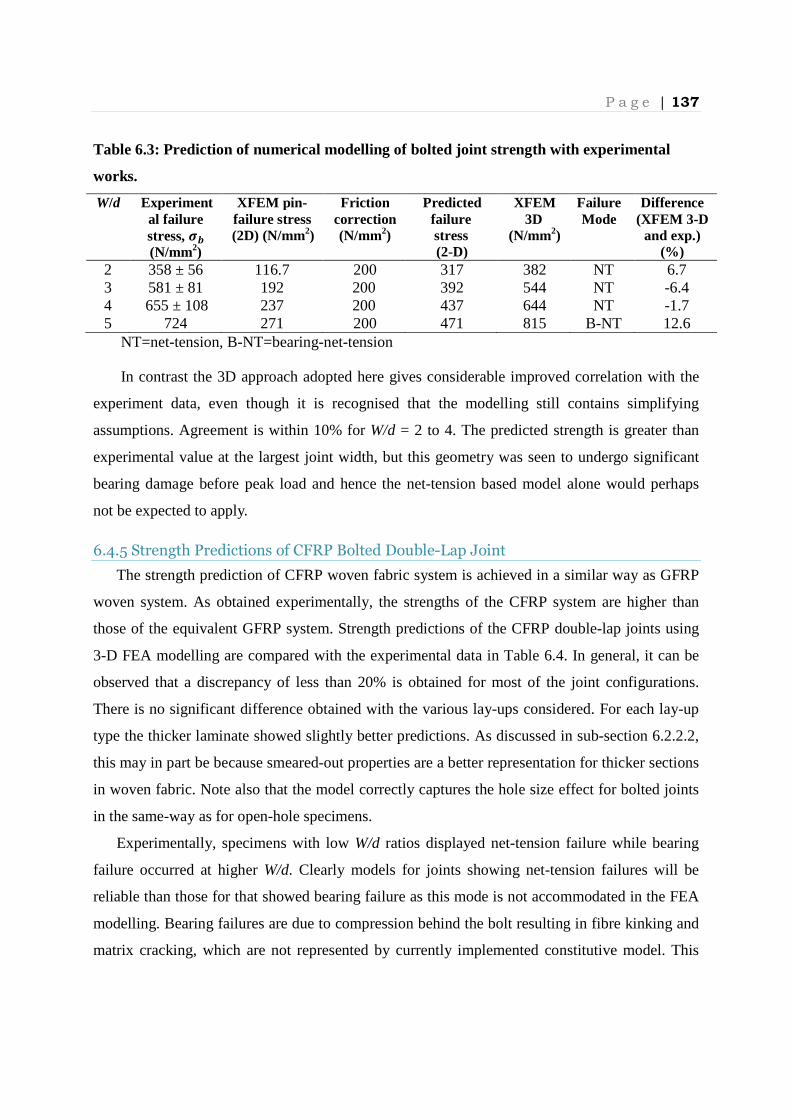
P a g e | 137
Table 6.3: Prediction of numerical modelling of bolted joint strength with experimental
works.
W/d Experimental failure stress, �( (N/mm2)
XFEM pin -failure stress (2D) (N/mm2)
Friction correction (N/mm2)
Predicted failure stress (2-D)
XFEM 3D
(N/mm2)
Failure Mode
Difference (XFEM 3-D
and exp.) (%)
2 358 ± 56 116.7 200 317 382 NT 6.7 3 581 ± 81 192 200 392 544 NT -6.4 4 655 ± 108 237 200 437 644 NT -1.7 5 724 271 200 471 815 B-NT 12.6
NT=net-tension, B-NT=bearing-net-tension
In contrast the 3D approach adopted here gives considerable improved correlation with the
experiment data, even though it is recognised that the modelling still contains simplifying
assumptions. Agreement is within 10% for W/d = 2 to 4. The predicted strength is greater than
experimental value at the largest joint width, but this geometry was seen to undergo significant
bearing damage before peak load and hence the net-tension based model alone would perhaps
not be expected to apply.
6.4.5 Strength Predictions of CFRP Bolted Double-Lap Joint
The strength prediction of CFRP woven fabric system is achieved in a similar way as GFRP
woven system. As obtained experimentally, the strengths of the CFRP system are higher than
those of the equivalent GFRP system. Strength predictions of the CFRP double-lap joints using
3-D FEA modelling are compared with the experimental data in Table 6.4. In general, it can be
observed that a discrepancy of less than 20% is obtained for most of the joint configurations.
There is no significant difference obtained with the various lay-ups considered. For each lay-up
type the thicker laminate showed slightly better predictions. As discussed in sub-section 6.2.2.2,
this may in part be because smeared-out properties are a better representation for thicker sections
in woven fabric. Note also that the model correctly captures the hole size effect for bolted joints
in the same-way as for open-hole specimens.
Experimentally, specimens with low W/d ratios displayed net-tension failure while bearing
failure occurred at higher W/d. Clearly models for joints showing net-tension failures will be
reliable than those for that showed bearing failure as this mode is not accommodated in the FEA
modelling. Bearing failures are due to compression behind the bolt resulting in fibre kinking and
matrix cracking, which are not represented by currently implemented constitutive model. This

P a g e | 138
behaviour is exhibited when W/d ≥ 3 (finger-tight, cross-ply lay-up), W/d ≥ 4 (finger-tight, quasi-
isotropic lay-up) and W/d ≥ 5 (all bolt loads, quasi-isotropic lay-up). Therefore, the composite
joints that showed this failure mode showed larger discrepancy between predicted and actual
failure strengths. The predicted load-displacement plots showed the same trend in all bolted
double-lap joint studied. The length of damage zone/effective crack at the point of sudden failure
is in the range of 0.4 – 0.8 mm from the hole edge at the net-section plane.
Table 6.4: Comparisons of FEA with experimental work in double-lap joint configuration
Materials Hole
diameter,
d (mm)
Clamp-
up
torque
W/d Experimental
bearing
(N/mm2)
Failure
Mode
3D Model
(N/mm2)
%
difference
PX2 5 FT 2 377 ± 15 NT 367 -2.8 3 513 ± 39 NT 565 10.1 5 N m 2 673 ± 41 NT 726 7.9 3 992 ± 56 NT 978 -1.4 10 FT 2 350 ± 42 NT 301 -13.9 3 413 ± 40 B-NT 440 6.4 5 N m 2 434 ± 6 NT 390 -10.3 3 622 ± 46 NT 530 14.8
PX4 5 FT 2 388 ± 19 NT 387 0.4 3 525 ± 32 NT 588 12.1 5 N m 2 533 ± 21 NT 563 5.7 3 717 ± 80 NT 773 7.8 10 FT 2 334 ± 25 NT 312 - 6.6 3 480 ± 21 B-NT 453 -5.8 5 N m 2 370 ± 25 NT 347 -6.4 3 557 ± 22 NT 486 -12.7
5X2 5 FT 2 357 ± 2 NT 345 -3.3 3 495 ± 21 NT 552 11.5 5 N m 2 442 ± 41 NT 511 15.6 3 664 ± 83 NT 785 18.3 10 FT 2 275 ± 22 NT 289 5.0 3 364 ± 13 NT 425 16.7 5 N m 2 336 ± 19 NT 330 1.7 3 488 ± 26 NT 466 -4.41
5X4 5 FT 2 330 ± 37 NT 308 -6.7 3 468 ± 26 NT 511 9.2

P a g e | 139
5 N m 2 360 ± 10 NT 474 32.0 3 605 ± 34 NT 631 4.4 10 FT 2 261 ± 18 NT 281 7.6 3 435 ± 7 NT 404 -6.5 5 N m 2 298 ± 36 NT 300 0.8 3 441 ± 12 NT 418 -5.2
PQ4 5 FT 2 261 ± 15 NT 297 12.1 3 457 ± 18 NT 543 18.7 4 615 ± 28 B-NT 688 11.9 5 698 ± 45 B-NT 796 14.0 5 N m 2 380 ± 16 NT 437 15.0 3 668 ± 77 NT 712 6.5 4 847 ± 67 NT 872 3.0 5 1005 ± 66 B-NT 972 3.2 10 FT 2 247 ± 13 NT 287 15.9 3 466 ± 2 NT 442 -5.3 4 505 ± 85 B 544 7.7 5 464 ± 9 B 613 32.1 5 N m 2 306 ± 15 NT 311 1.7 3 508 ± 37 NT 464 -8.4 4 789 ± 115 NT 570 -27.8 5 779 ± 6 B 637 -18.2
PQ8 5 FT 2 242 ± 7 NT 275 13.5 3 454 ± 18 NT 550 21.1 4 656 ± 25 NT 662 0.8 5 782 ± 66 B-NT 757 -3.2 5 N m 2 288 ± 13 NT 342 18.9 3 536 ± 11 NT 601 12.1 4 713 ± 19 NT 736 3.4 5 905 ± 23 B-NT 829 -8.4 10 FT 2 243 ± 7 NT 293 20.4 3 434 ± 19 NT 442 1.8 4 571 ± 25 B 526 -7.8 5 613 ± 9 B 597 -2.7 5 N m 2 259 ± 8 NT 294 13.2 3 448 ± 12 NT 446 -0.6 4 603 ± 1 NT 538 -10.8 5 707 ± 42 B 603 -14.7
5Q12 10 FT 2 194 ± 6 NT 207 6.8 3 364 ± 4 NT 386 6.0

P a g e | 140
4 508 ± 34 NT 449 11.6 5 610 ± 30 B-BT 512 16.0
5 N m 2 206 ± 4 NT 225 9.1 3 372 ± 10 NT 378 1.7 4 485 ± 27 NT 455 6.2 5 576 ± 56 NT 505 12.3
FT = finger-tight, NT = net-tension, B = bearing, B-NT = Bearing-Net-tension
6.4.6 Strength Predictions of CFRP Joint incorporating material softening
The implementation of traction-separation constitutive model in the current 3-D modelling is
in order to predict the strength of composite plate that failed in opening crack mode, i.e., net-
tension failure. Further work in this section attempts to incorporate bearing failure that occurred
behind the bolt to capture the bearing-net-tension mode. Bearing failure involves different
damage mechanism events such as matrix cracking, delamination and fibre instability that reduce
the load carrying capability behind the bearing bolt as failure initiation and its propagation occur.
A similar bolted double lap joint model was used, but a small region behind the bolt was
assigned a material with degraded stiffness as shown in Figure 6.17.
Figure 6.17: Reduced modulus behind bolt to capture significant initial bearing prior to
ultimate net-tension
Bearing failure exhibits progressive failure. However, only limited bearing damage can be
modelled using the approach developed here. It is not possible to model pure bearing mode
failure with large bearing. It is expected that the higher material stiffness of CFRP produces an
increase in radial stress, therefore softening the material behind bolt will reduce the radial stress
to resemble initiation of bearing failures at the hole edge prior to net-tension failures. Table 6.5
shows results from a parametric study with different degrees of material softening. Slightly
increased failure strength is obtained as the percentage of softening increases from 40% to 100%.
XFEM region
Reduced material properties
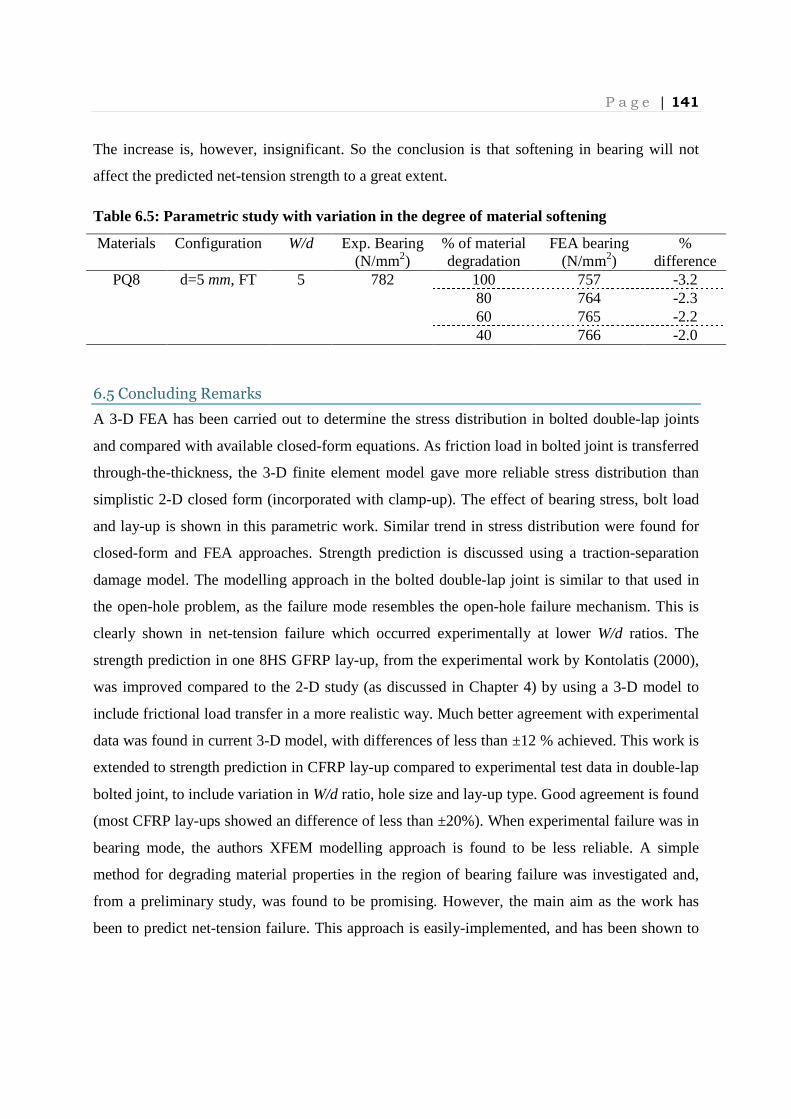
P a g e | 141
The increase is, however, insignificant. So the conclusion is that softening in bearing will not
affect the predicted net-tension strength to a great extent.
Table 6.5: Parametric study with variation in the degree of material softening
Materials Configuration W/d Exp. Bearing (N/mm2)
% of material degradation
FEA bearing (N/mm2)
% difference
PQ8 d=5 mm, FT 5 782 100 757 -3.2 80 764 -2.3 60 765 -2.2 40 766 -2.0
6.5 Concluding Remarks
A 3-D FEA has been carried out to determine the stress distribution in bolted double-lap joints
and compared with available closed-form equations. As friction load in bolted joint is transferred
through-the-thickness, the 3-D finite element model gave more reliable stress distribution than
simplistic 2-D closed form (incorporated with clamp-up). The effect of bearing stress, bolt load
and lay-up is shown in this parametric work. Similar trend in stress distribution were found for
closed-form and FEA approaches. Strength prediction is discussed using a traction-separation
damage model. The modelling approach in the bolted double-lap joint is similar to that used in
the open-hole problem, as the failure mode resembles the open-hole failure mechanism. This is
clearly shown in net-tension failure which occurred experimentally at lower W/d ratios. The
strength prediction in one 8HS GFRP lay-up, from the experimental work by Kontolatis (2000),
was improved compared to the 2-D study (as discussed in Chapter 4) by using a 3-D model to
include frictional load transfer in a more realistic way. Much better agreement with experimental
data was found in current 3-D model, with differences of less than ±12 % achieved. This work is
extended to strength prediction in CFRP lay-up compared to experimental test data in double-lap
bolted joint, to include variation in W/d ratio, hole size and lay-up type. Good agreement is found
(most CFRP lay-ups showed an difference of less than ±20%). When experimental failure was in
bearing mode, the authors XFEM modelling approach is found to be less reliable. A simple
method for degrading material properties in the region of bearing failure was investigated and,
from a preliminary study, was found to be promising. However, the main aim as the work has
been to predict net-tension failure. This approach is easily-implemented, and has been shown to

P a g e | 142
be applicable to woven fabric composite materials in double-lap bolted joint. This study will
implemented further in bolted single-lap joint discussed in Chapter 7.

P a g e | 143
Chapter 7 : 3-D Modelling of CFRP
Composites Bolted Single-Lap Joints
7.1 Introduction
Single-lap joints are an important class of bolted joint in the aerospace and automotive
industries. This type of joint is preferred as it can reduce weight and hence help to optimize fuel
efficiency. However, bolted single-lap joints exhibit secondary bending due to eccentricity of the
applied loads. This produces a different joint response from the bolted double-lap joint
[discussed in Chapter 6]. Flexure of plates during loading alters the contact regions in the single-
lap joint significantly, resulting in more non-linear behaviour and a stress gradient across the
plate thickness. This physical perturbation may change the load transfer and strength compared
to the double-lap joint.
This chapter is presented in a similar manner as Chapter 6. It starts by describing the
generation of the 3-D FEA bolted single-lap joint models. FEA modelling is based on the CFRP
test matrix experimental programme [Chapter 5], as with the bolted double-lap joints in Chapter
6. The description of the models is followed by a section considering the stress distribution in the
single-lap joint as compared to double-lap joint. The effect of joint construction is considered
further by examining the stress in a composite-composite joint and comparing with a composite-
steel joint. In a related investigation the effect of varying composite thickness in the composite-
steel joints is studied. Strength predictions of the single-lap joints are described in sub-section
7.4.3 by implementing a similar progressive damage approach to than employed with the bolted
double-lap joints of Chapter 6.
7.2 Implementation of 3-D FEA Models in Single-Lap Joint
The bolted single-lap joints used in the experimental programme are modelled in this FEA
study. Flexural behaviour of the CFRP plate in the single-lap joint produces a non-uniform stress
distribution across plate thickness. 3-D models implemented in this section will be used to study
the stress distributions and to give predictions of joint strength.

P a g e | 144
7.2.1Overview of model
In bolted single-lap joint, fewer parts are involved because only one steel plate is used
instead of two in the double-lap joint. This results in fewer contact interactions and so friction
load transfer is modified significantly. Symmetry is used to reduce the model size and the model
also incorporates different clamping conditions and associated level of frictional load transfer.
7.2.2 Modelling Techniques and Approaches
The elastic properties used in the current model are based on smeared-out properties and
include the out-of-plane elastic properties given in Table 6.1. As bending behaviours occurs in a
single-lap joint, implementation of smeared-out properties may not properly represent bending as
flexural rigidity of stacked material is dependent on layer sequence. Cross-ply woven lay-up is
arguably better represented as smeared-out than a quasi-isotropic woven system because of
similar repetitive sequence in adjacent layers. The other components are made from isotropic
stainless steel which has a modulus elasticity of 210 N/mm2 and Poisson’s ratio of 0.3.
Six components are assembled in each model of the single-lap joint. Parameters that are
varied are hole diameter, d width W, and lay-up. Sufficient mesh refinement is used to ensure the
strength predictions are mesh independent. A similar mesh sensitivity study to that used with the
bolted double-lap joint FEA model (as shown in Figure 6.11) was carried out. An example of the
mesh used in the current 3-D model is shown in Figure 7.1. Mesh is refined in the vicinity of the
hole edge in the composite (and steel) plates and the volume under the washers, as ultimate
failure occurred within these regions. The boundary conditions are assigned so that end A is held
fixed and displacement is applied to end B, as shown in Figure 7.1.
Figure 7.1: Single-lap bolted joint implemented in FEA modelling (the model has been
oriented so as to enhance the clarity of the mesh)
A
B
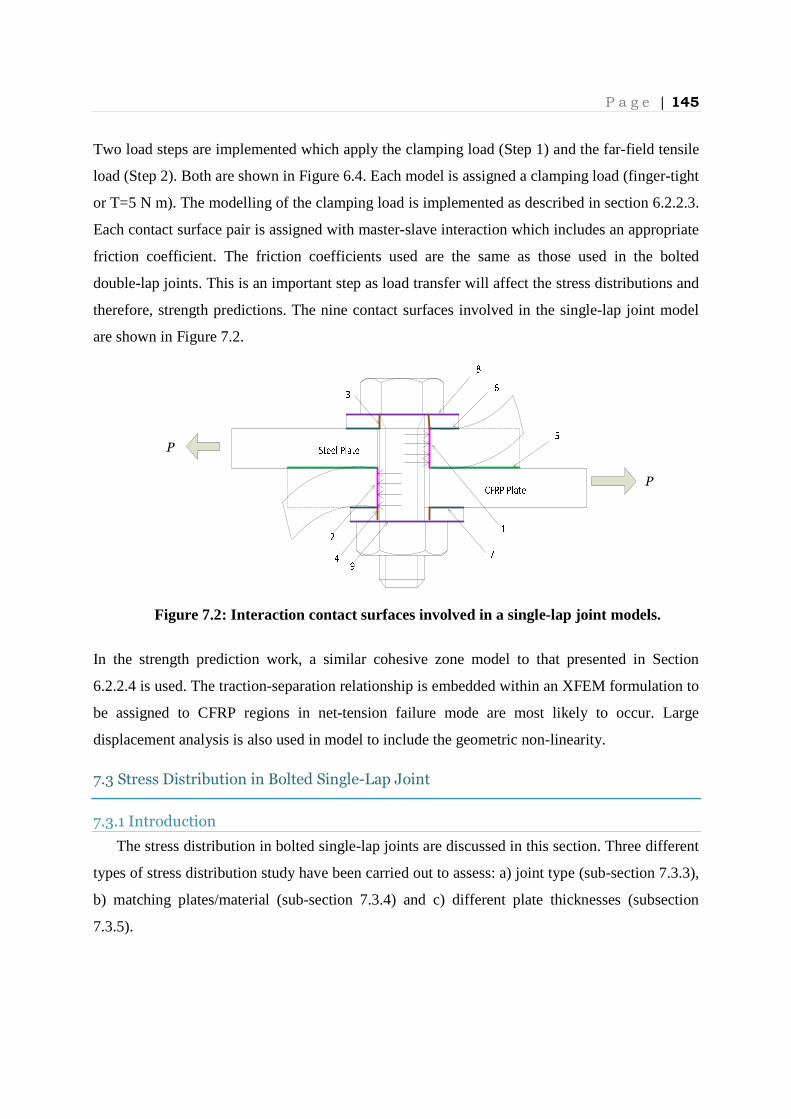
P a g e | 145
Two load steps are implemented which apply the clamping load (Step 1) and the far-field tensile
load (Step 2). Both are shown in Figure 6.4. Each model is assigned a clamping load (finger-tight
or T=5 N m). The modelling of the clamping load is implemented as described in section 6.2.2.3.
Each contact surface pair is assigned with master-slave interaction which includes an appropriate
friction coefficient. The friction coefficients used are the same as those used in the bolted
double-lap joints. This is an important step as load transfer will affect the stress distributions and
therefore, strength predictions. The nine contact surfaces involved in the single-lap joint model
are shown in Figure 7.2.
Figure 7.2: Interaction contact surfaces involved in a single-lap joint models.
In the strength prediction work, a similar cohesive zone model to that presented in Section
6.2.2.4 is used. The traction-separation relationship is embedded within an XFEM formulation to
be assigned to CFRP regions in net-tension failure mode are most likely to occur. Large
displacement analysis is also used in model to include the geometric non-linearity.
7.3 Stress Distribution in Bolted Single-Lap Joint
7.3.1 Introduction
The stress distribution in bolted single-lap joints are discussed in this section. Three different
types of stress distribution study have been carried out to assess: a) joint type (sub-section 7.3.3),
b) matching plates/material (sub-section 7.3.4) and c) different plate thicknesses (subsection
7.3.5).
P
P

P a g e | 146
7.3.2 Secondary Bending Effects in Bolted Single-Lap Joints
The issue of secondary bending has been studied by most researchers (e.g., Smith et. al.
(1986)), who investigate this joint type. When compared to a double-lap joint, the single-lap joint
exhibits an eccentric load path. As shown in Figure 7.3, the CFRP plate flexes as P is applied.
This generates non-uniform contact pressure between the fasteners and the hole edge. At the
same time, the contact region is reduced and this may change the friction load transfer. This may
also introduce a stress concentration as a result of bolt head tilting.
The degree of secondary bending depends on plate flexural rigidity (EI). Bolted joint failures
occurred in the vicinity of the hole edge. Failure in SLJ is more complex than in DLJ as
secondary bending can change the failure mechanisms and load redistributions. Steel plate
showed small (negligible) plate bending due to higher EI, but plate bending in CFRP tends to
initiate the crack formation from the most tensile surface and propagates towards the other
surface. This is discussed in sub-section 5.6.3. The non-uniformity of cracks produces a stress
gradient and allows for stress redistribution of a failed ply to un-cracked adjacent plies.
Secondary bending produces higher tensile stresses leading to reduced strength than for
equivalent DLJ for the same P.
Figure 7.3: Secondary bending showed in single-lap bolted joint modelling (a)
experimental observation (b) FEA models
In some circumstances, the washer edge may dig into the composite plate and failure is
initiated at the washer edge and progressively damages until failure (as shown experimentally in
sub-section 5.6.4.3). This failure mode is more prominent in thin plates which are prone to
(a)
(b)
Top plane
Bottom plane
3 mm thick steel plate
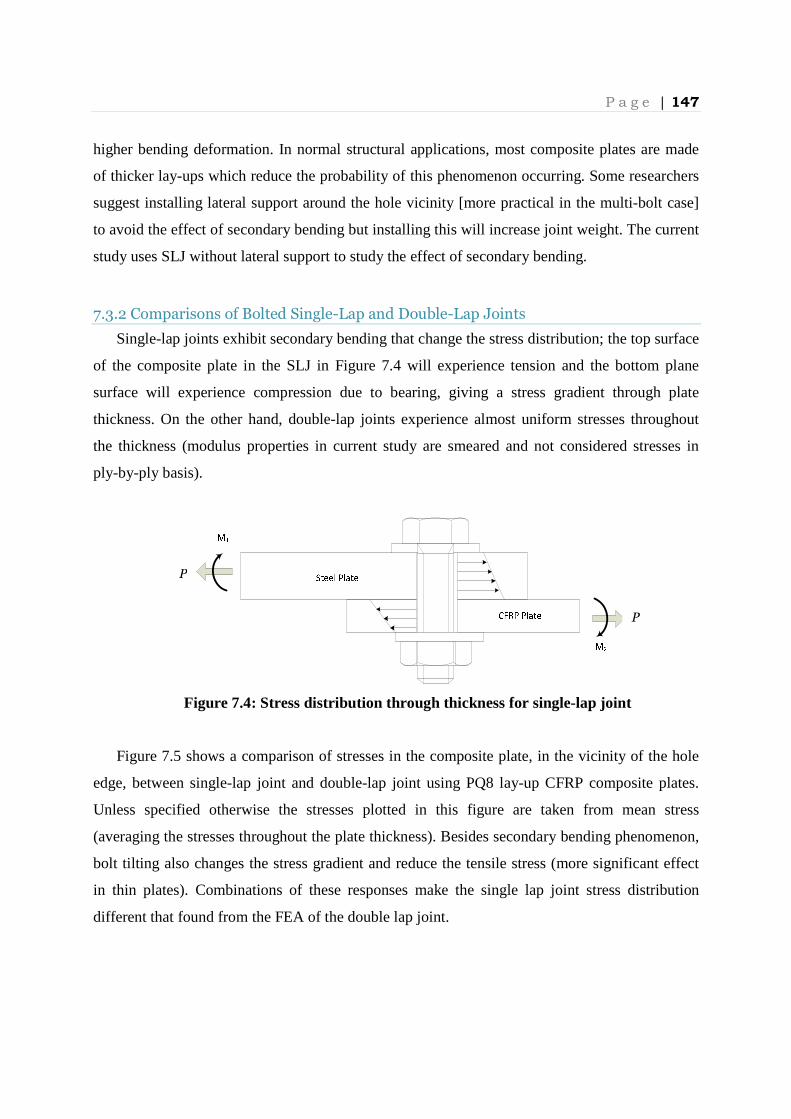
P a g e | 147
higher bending deformation. In normal structural applications, most composite plates are made
of thicker lay-ups which reduce the probability of this phenomenon occurring. Some researchers
suggest installing lateral support around the hole vicinity [more practical in the multi-bolt case]
to avoid the effect of secondary bending but installing this will increase joint weight. The current
study uses SLJ without lateral support to study the effect of secondary bending.
7.3.2 Comparisons of Bolted Single-Lap and Double-Lap Joints
Single-lap joints exhibit secondary bending that change the stress distribution; the top surface
of the composite plate in the SLJ in Figure 7.4 will experience tension and the bottom plane
surface will experience compression due to bearing, giving a stress gradient through plate
thickness. On the other hand, double-lap joints experience almost uniform stresses throughout
the thickness (modulus properties in current study are smeared and not considered stresses in
ply-by-ply basis).
Figure 7.4: Stress distribution through thickness for single-lap joint
Figure 7.5 shows a comparison of stresses in the composite plate, in the vicinity of the hole
edge, between single-lap joint and double-lap joint using PQ8 lay-up CFRP composite plates.
Unless specified otherwise the stresses plotted in this figure are taken from mean stress
(averaging the stresses throughout the plate thickness). Besides secondary bending phenomenon,
bolt tilting also changes the stress gradient and reduce the tensile stress (more significant effect
in thin plates). Combinations of these responses make the single lap joint stress distribution
different that found from the FEA of the double lap joint.
P
P

P a g e | 148
Double-Lap Joint Single-Lap Joint
Figure 7.5: Comparison of stress distributions in DLJ and SLJ configurations using
PQ8 CFRP with d = 5 mm and a nominal bearing stress of 500 N/mm2 (a) Radial stress
around the hole boundary (b) Tangential stress around the hole boundary (c) Tangential
stress on net-tension plane
-500
-400
-300
-200
-100
0
100
0 50 100 150 200
Ra
dia
l S
tre
ss, σ
r(N
/mm
2)
Hole boundary, (θ°)
Clamping Force=50 NClamping Force=100 NClamping Force=500 NClamping Force=1000 NClamping Force=1500 NClamping Force=2000 N
(a)
-500
-400
-300
-200
-100
0
100
0 50 100 150 200
Ra
dia
l Str
ess
, σθ
(N/m
m2)
Hole boundary, (θ°)
Clamping Force=50 NClamping Force=100 NClamping Force=500 NClamping Force=1000 NClamping Force=1500 NClamping Force=2000 N
(a)
-200
-100
0
100
200
300
400
500
600
700
0 50 100 150 200
Ta
ng
en
tia
l Str
ess
, σθ
(N/m
m2)
Hole boundary, (θ°)
Clamping Force=50 N
Clamping Force=100 N
Clamping Force=500 N
Clamping Force=1000 N
Clamping Force=1500 N
Clamping Force=2000N
(b)
-200
-100
0
100
200
300
400
500
600
700
0 50 100 150 200
Ta
ng
en
tia
l Str
ess
, σ
θ(N
/mm
2)
Hole boundary, (θ°)
Clamping Force=50 N
Clamping Force=100 N
Clamping Force=500 N
Clamping Force=1000 N
Clamping Force=1500 N
Clamping Force=2000 N
(b)
0
100
200
300
400
500
600
700
0 2 4 6
Ta
ng
en
tia
l Str
ess
, σθ
(N/m
m2)
a/r
Clamping Force=50 N
Clamping Force=100 N
Clamping Force=500 N
Clamping Force=1000 N
Clamping Force=1500 N
Clamping Force=2000 N
(c)
0
100
200
300
400
500
600
700
0 2 4 6
Ta
ng
en
tia
l Str
ess
, σθ
(N/m
m2)
a/r
Clamping Force=50 N
Clamping Force=100 N
Clamping Force=500 N
Clamping Force=1000 N
Clamping Force=1500 N
Clamping Force=2000 N
(c)

P a g e | 149
For double-lap configurations, at fixed applied nominal bearing stress of 500 N/mm2, the
tangential and radial stresses are observed to reduce with increase clamping force. Radial stress
in single-lap joint showed larger compressive stress around hole circumference compared to
double-lap (Figure 7.5a), caused by bolt tilting and bending. No significant difference was found
in tangential stress (Figure 7.5b) but the effect of clamping load was suppressed more for the
single lap joint. As observed experimentally by Smith et al. (1986), extra tension stress from
secondary bending of single-lap joint may contribute to strength reduction in respective
configurations.
Double-Lap Joint Single-Lap Joint
Figure 7.6: Comparison of stress distribution at top and bottom plane using PQ8 CFRP
with d = 5 mm and a nominal bearing stress of 500 N/mm2 in DLJ and SLJ configurations
(a) Radial stress around the hole boundary (b) Tangential stress around the hole boundary
-600
-500
-400
-300
-200
-100
0
100
0 50 100 150 200
Ra
dia
l Str
ess
, σ
r(N
/mm
2)
Hole boundary, (θ°)
Top Plane
Bottom Plane
(a)
-600
-500
-400
-300
-200
-100
0
100
0 50 100 150 200
Ra
dia
l S
tre
ss, σ
r(N
/mm
2)
Hole boundary, (θ°)
Top Plane
Bottom Plane
(a)
-200
-100
0
100
200
300
400
500
600
0 50 100 150 200Ta
ng
en
tia
l Str
ess
, σ
θ(N
/mm
2)
Hole boundary, (θ°)
Top Plane
Bottom Plane
(b)
-200
-100
0
100
200
300
400
500
600
0 50 100 150 200Ta
ng
en
tia
l Str
ess
, σr
(N/m
m2)
Hole boundary, (θ°)
Top Plane
Bottom Plane
(b)
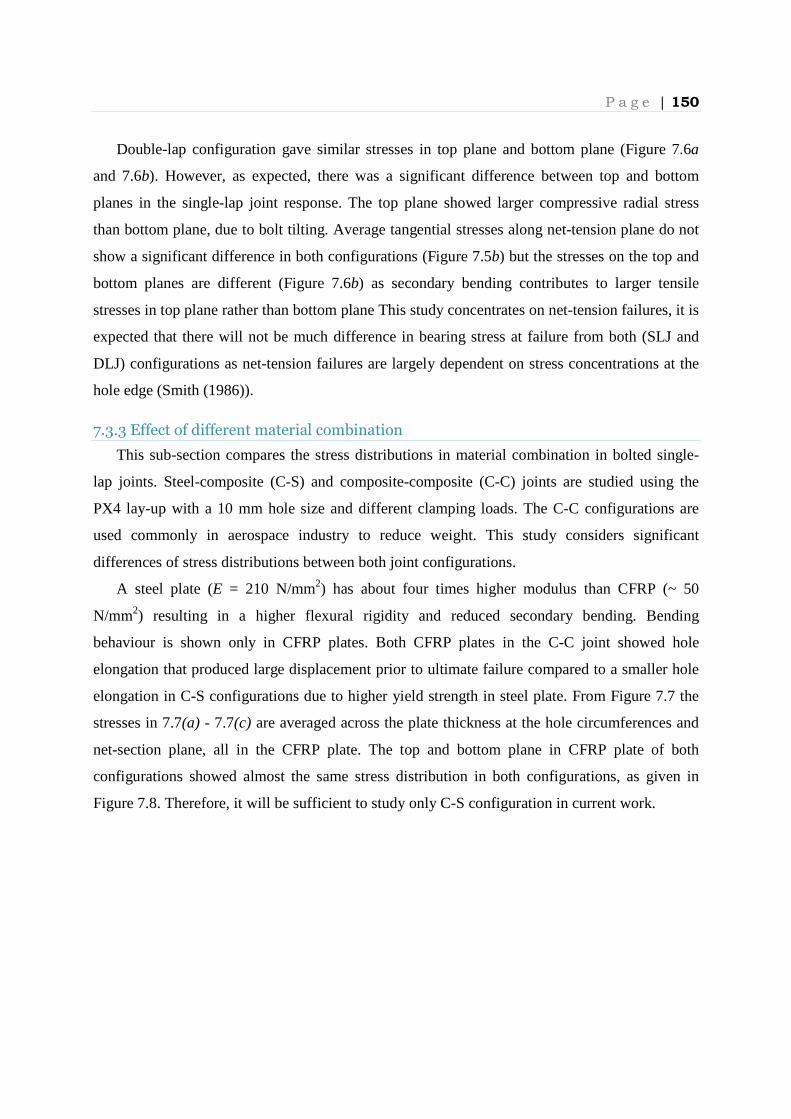
P a g e | 150
Double-lap configuration gave similar stresses in top plane and bottom plane (Figure 7.6a
and 7.6b). However, as expected, there was a significant difference between top and bottom
planes in the single-lap joint response. The top plane showed larger compressive radial stress
than bottom plane, due to bolt tilting. Average tangential stresses along net-tension plane do not
show a significant difference in both configurations (Figure 7.5b) but the stresses on the top and
bottom planes are different (Figure 7.6b) as secondary bending contributes to larger tensile
stresses in top plane rather than bottom plane This study concentrates on net-tension failures, it is
expected that there will not be much difference in bearing stress at failure from both (SLJ and
DLJ) configurations as net-tension failures are largely dependent on stress concentrations at the
hole edge (Smith (1986)).
7.3.3 Effect of different material combination
This sub-section compares the stress distributions in material combination in bolted single-
lap joints. Steel-composite (C-S) and composite-composite (C-C) joints are studied using the
PX4 lay-up with a 10 mm hole size and different clamping loads. The C-C configurations are
used commonly in aerospace industry to reduce weight. This study considers significant
differences of stress distributions between both joint configurations.
A steel plate (E = 210 N/mm2) has about four times higher modulus than CFRP (~ 50
N/mm2) resulting in a higher flexural rigidity and reduced secondary bending. Bending
behaviour is shown only in CFRP plates. Both CFRP plates in the C-C joint showed hole
elongation that produced large displacement prior to ultimate failure compared to a smaller hole
elongation in C-S configurations due to higher yield strength in steel plate. From Figure 7.7 the
stresses in 7.7(a) - 7.7(c) are averaged across the plate thickness at the hole circumferences and
net-section plane, all in the CFRP plate. The top and bottom plane in CFRP plate of both
configurations showed almost the same stress distribution in both configurations, as given in
Figure 7.8. Therefore, it will be sufficient to study only C-S configuration in current work.
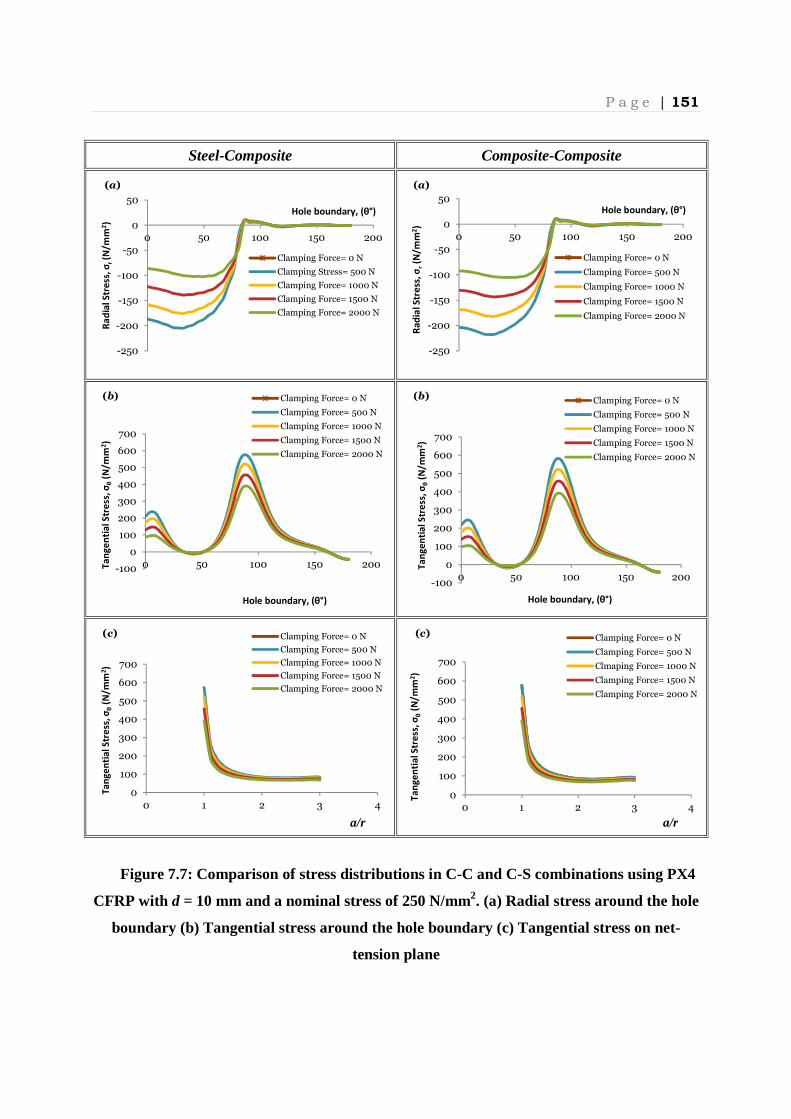
P a g e | 151
Steel-Composite Composite-Composite
Figure 7.7: Comparison of stress distributions in C-C and C-S combinations using PX4
CFRP with d = 10 mm and a nominal stress of 250 N/mm2. (a) Radial stress around the hole
boundary (b) Tangential stress around the hole boundary (c) Tangential stress on net-
tension plane
-250
-200
-150
-100
-50
0
50
0 50 100 150 200
Ra
dia
l S
tre
ss, σ
r (N
/mm
2)
Hole boundary, (θ°)
Clamping Force= 0 N
Clamping Stress= 500 N
Clamping Force= 1000 N
Clamping Force= 1500 N
Clamping Force= 2000 N
(a)
-250
-200
-150
-100
-50
0
50
0 50 100 150 200
Ra
dia
l Str
ess
, σr
(N/m
m2)
Hole boundary, (θ°)
Clamping Force= 0 N
Clamping Force= 500 N
Clamping Force= 1000 N
Clamping Force= 1500 N
Clamping Force= 2000 N
(a)
-100
0
100
200
300
400
500
600
700
0 50 100 150 200Ta
ng
en
tia
l Str
ess
, σθ
(N/m
m2)
Hole boundary, (θ°)
Clamping Force= 0 N
Clamping Force= 500 N
Clamping Force= 1000 N
Clamping Force= 1500 N
Clamping Force= 2000 N
(b)
-100
0
100
200
300
400
500
600
700
0 50 100 150 200
Ta
ng
en
tia
l Str
ess
, σθ
(N/m
m2)
Hole boundary, (θ°)
Clamping Force= 0 N
Clamping Force= 500 N
Clamping Force= 1000 N
Clamping Force= 1500 N
Clamping Force= 2000 N
(b)
0
100
200
300
400
500
600
700
0 1 2 3 4
Ta
ng
en
tia
l S
tre
ss, σ
θ(N
/mm
2)
a/r
Clamping Force= 0 N
Clamping Force= 500 N
Clamping Force= 1000 N
Clamping Force= 1500 N
Clamping Force= 2000 N
(c)
0
100
200
300
400
500
600
700
0 1 2 3 4
Ta
ng
en
tia
l Str
ess
, σθ
(N/m
m2)
a/r
Clamping Force= 0 N
Clamping Force= 500 N
Clmaping Force= 1000 N
Clamping Force= 1500 N
Clamping Force= 2000 N
(c)
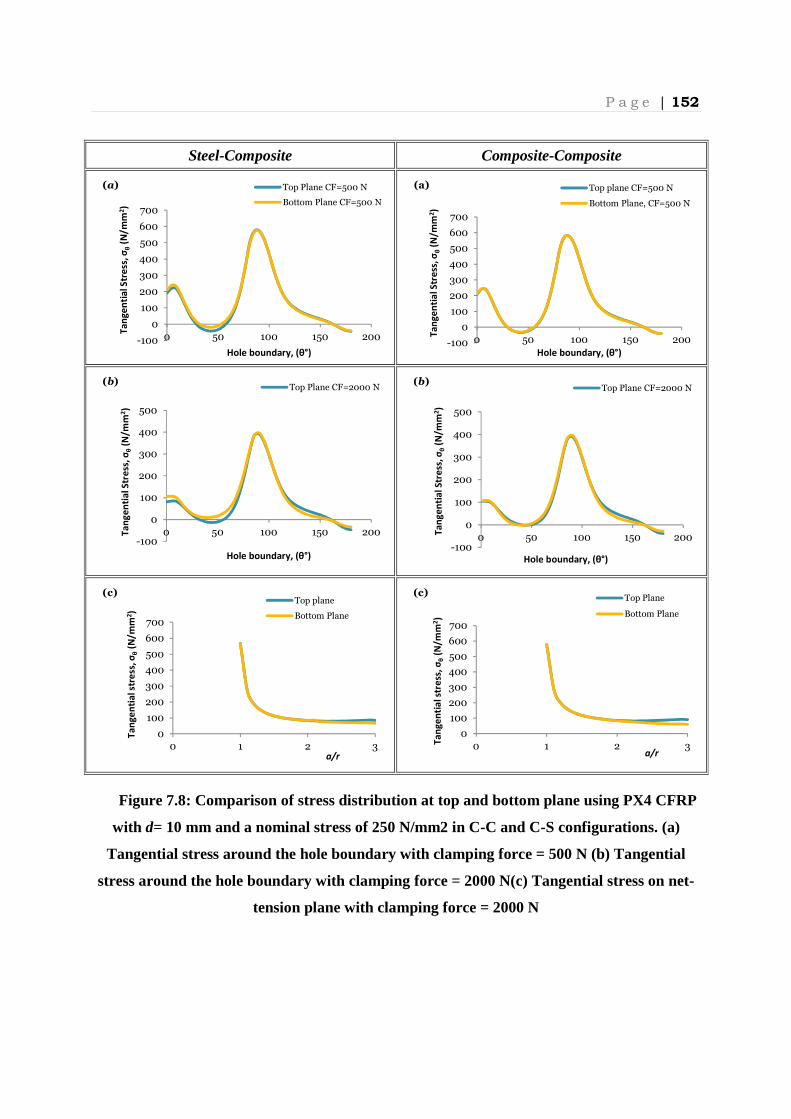
P a g e | 152
Steel-Composite Composite-Composite
Figure 7.8: Comparison of stress distribution at top and bottom plane using PX4 CFRP
with d= 10 mm and a nominal stress of 250 N/mm2 in C-C and C-S configurations. (a)
Tangential stress around the hole boundary with clamping force = 500 N (b) Tangential
stress around the hole boundary with clamping force = 2000 N(c) Tangential stress on net-
tension plane with clamping force = 2000 N
-100
0
100
200
300
400
500
600
700
0 50 100 150 200
Ta
ng
en
tia
l Str
ess
, σθ
(N/m
m2)
Hole boundary, (θ°)
Top Plane CF=500 N
Bottom Plane CF=500 N
(a)
-100
0
100
200
300
400
500
600
700
0 50 100 150 200
Ta
ng
en
tia
l Str
ess
, σθ
(N/m
m2)
Hole boundary, (θ°)
Top plane CF=500 N
Bottom Plane, CF=500 N
(a)
-100
0
100
200
300
400
500
0 50 100 150 200Ta
ng
en
tia
l Str
ess
, σ
θ(N
/mm
2)
Hole boundary, (θ°)
Top Plane CF=2000 N(b)
-100
0
100
200
300
400
500
0 50 100 150 200
Ta
ng
en
tia
l S
tre
ss, σ
θ(N
/mm
2)
Hole boundary, (θ°)
Top Plane CF=2000 N(b)
0
100
200
300
400
500
600
700
0 1 2 3
Ta
ng
en
tia
l str
ess
, σθ
(N/m
m2)
a/r
Top plane
Bottom Plane
(c)
0
100
200
300
400
500
600
700
0 1 2 3Ta
ng
en
tia
l str
ess
, σ
θ(N
/mm
2)
a/r
Top Plane
Bottom Plane
(c)

P a g e | 153
7.3.4 Effects of plate thickness
The previous sub-section discussed behaviour of different plate types (with different flexural
rigidity) in single-lap joints. Second moment of area, I is largely dependent on plate thickness, t.
Thicker CFRP plates show larger flexural resistance than thinner plates, resulting in lower
secondary bending effects in thicker plates. Thicker laminates showed insignificant increases in
bearing stress at failure when clamp-up is increased from finger-tight condition to T=5 N m as
discussed in Section 5.6.4.2. This is because load transfer through friction is less in thicker
laminate resulting to less pronounced difference between clamped and finger-tight conditions. In
this parametric study, all joint systems were modelled with a bolt load of 500 N.
Figure 7.9 show the average radial and tangential stress distributions around the hole edge in
joints for two different lay-ups type (quasi-isotropic and cross-ply), each one at two different
thicknesses (PQ4/PQ8, PX2/PX4). The radial stress distributions in Figure 7.9a showed a small
increase with thickness. This is expected because there is a smaller contribution from frictional
load transfer in the thicker laminate. Slightly larger tangential stress in thicker plates (thickness
has doubled) of both lay-up systems (Figure 7.9b and 7.9c). As has already been mentioned in
the lay-up studies of the double-lap joint in Chapter 6, tangential stress in cross-ply lay-up (as a
results of larger amount of 0º plies) produced higher tangential stress than quasi-isotropic lay-up.
Figure 7.10(a-d) showed comparison of all lay-ups investigated at top and bottom planes, but
insignificant difference is seen.

P a g e | 154
Quasi-isotropic Lay-up Cross-ply Lay-up
Figure 7.9: Comparison of stress distribution in quasi-isotropic (PQ4 and PQ8) and
cross-ply (PX2 and PX4) lay-ups with d = 10 mm at an applied bearing stress of 400 N/mm2
and clamping force = 500 N (a) Radial stress around hole boundary (b) Tangential stress
around hole boundary (c) Tangential stress at net-tension plane
-400
-350
-300
-250
-200
-150
-100
-50
0
50
0 50 100 150 200
Ra
dia
l Str
ess
, σr
(N/m
m2)
Hole boundary, (θ°)
PQ4, CF=500 N, BS=400
N/mm2
PQ8, CF=500 N, BS=400
N/mm2
(a)
-400
-350
-300
-250
-200
-150
-100
-50
0
50
0 50 100 150 200
Ra
dia
l Str
ess
, σ
r(N
/mm
2)
Hole boundary, (θ°)
PX2, T=500 N, BS=500
N/mm2
PX4, T=500 N, BS=500
N/mm2
(a)
-200
0
200
400
600
800
1000
0 50 100 150 200Ta
ng
ne
tia
l S
tre
ss, σ
θ(N
/mm
2)
Hole boundary, (θ°)
PQ4, CF=500 N,
BS=400 N/mm2
PQ8, CF=500 N,
BS=400 N/mm2
(b)
-200
0
200
400
600
800
1000
0 50 100 150 200Ta
ng
en
tia
l str
ess
, σ
θ(N
/mm
2)
Hole boundary, θ°
PX2, T=500 N,
BS=400 N/mm2
PX4, T=500 N,
BS=400 N/mm2
(b)
0
200
400
600
800
1000
0 1 2 3
Ta
ng
en
tia
l Str
ess
, σθ
(N/m
m2)
a/r
PQ4, CF=500 N,
BS=400 N/mm2
PQ8, CF=500 N,
BS=400 N/mm2
(c)
0
200
400
600
800
1000
0 1 2 3
Ta
ng
en
tia
l Str
ess
, σθ
(N/m
m2)
a/r
PX2, T=500 N,
BS=400 N/mm2
PX4, T=500 N,
BS=400 N/mm2
(c)
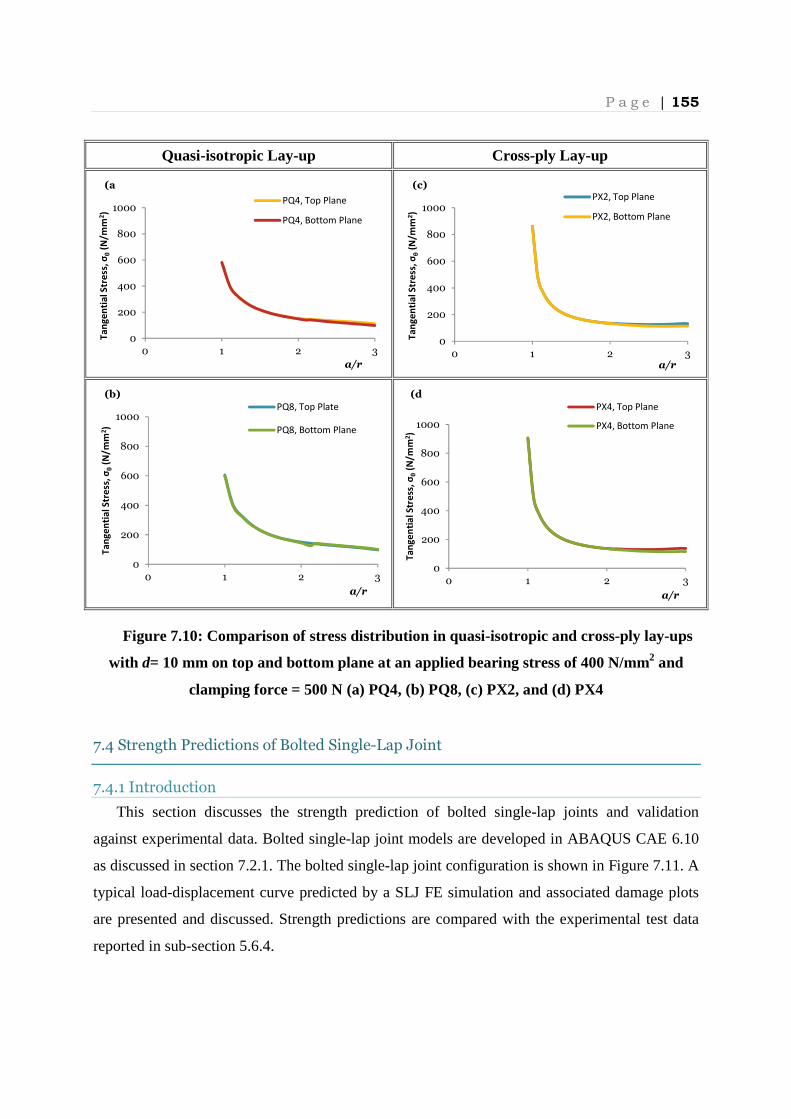
P a g e | 155
Quasi-isotropic Lay-up Cross-ply Lay-up
Figure 7.10: Comparison of stress distribution in quasi-isotropic and cross-ply lay-ups
with d= 10 mm on top and bottom plane at an applied bearing stress of 400 N/mm2 and
clamping force = 500 N (a) PQ4, (b) PQ8, (c) PX2, and (d) PX4
7.4 Strength Predictions of Bolted Single-Lap Joint
7.4.1 Introduction
This section discusses the strength prediction of bolted single-lap joints and validation
against experimental data. Bolted single-lap joint models are developed in ABAQUS CAE 6.10
as discussed in section 7.2.1. The bolted single-lap joint configuration is shown in Figure 7.11. A
typical load-displacement curve predicted by a SLJ FE simulation and associated damage plots
are presented and discussed. Strength predictions are compared with the experimental test data
reported in sub-section 5.6.4.
0
200
400
600
800
1000
0 1 2 3
Ta
ng
en
tia
l Str
ess
, σθ
(N/m
m2)
a/r
PQ4, Top Plane
PQ4, Bottom Plane
(a
0
200
400
600
800
1000
0 1 2 3
Ta
ng
en
tia
l Str
ess
, σθ
(N/m
m2)
a/r
PX2, Top Plane
PX2, Bottom Plane
(c)
0
200
400
600
800
1000
0 1 2 3
Ta
ng
en
tia
l Str
ess
, σθ
(N/m
m2)
a/r
PQ8, Top Plate
PQ8, Bottom Plane
(b)
0
200
400
600
800
1000
0 1 2 3
Ta
ng
en
tia
l Str
ess
, σ
θ(N
/mm
2)
a/r
PX4, Top Plane
PX4, Bottom Plane
(d
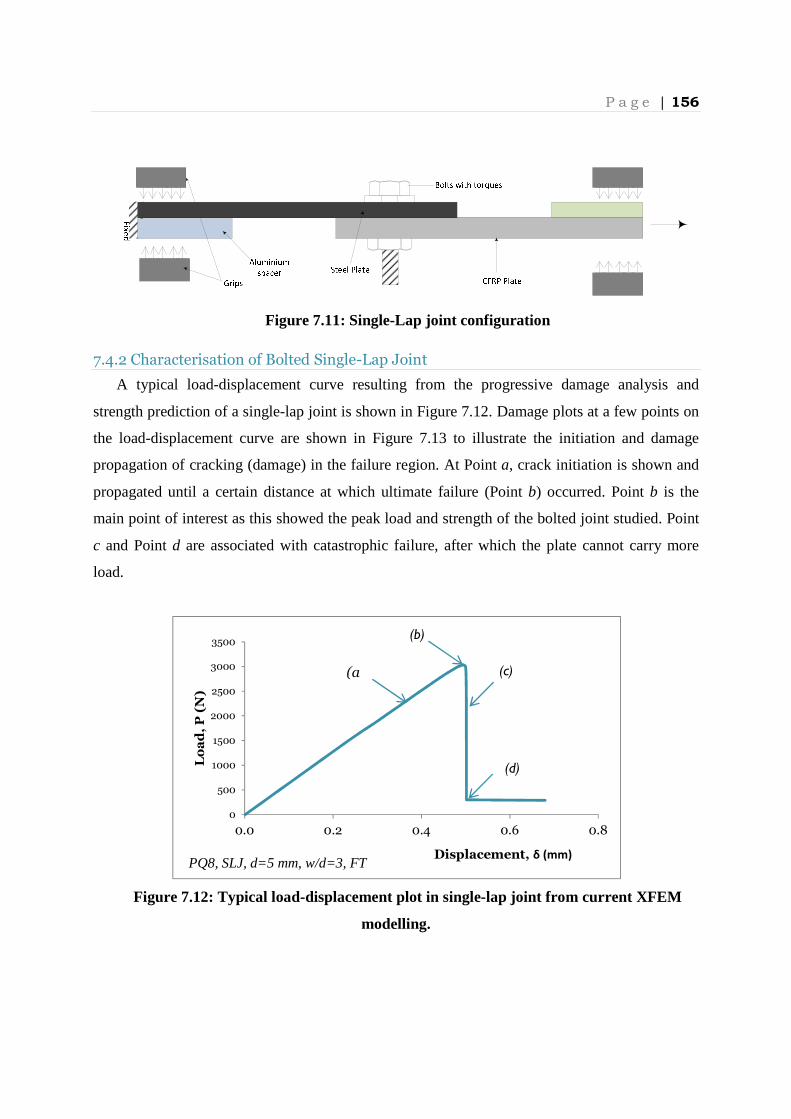
P a g e | 156
Figure 7.11: Single-Lap joint configuration
7.4.2 Characterisation of Bolted Single-Lap Joint
A typical load-displacement curve resulting from the progressive damage analysis and
strength prediction of a single-lap joint is shown in Figure 7.12. Damage plots at a few points on
the load-displacement curve are shown in Figure 7.13 to illustrate the initiation and damage
propagation of cracking (damage) in the failure region. At Point a, crack initiation is shown and
propagated until a certain distance at which ultimate failure (Point b) occurred. Point b is the
main point of interest as this showed the peak load and strength of the bolted joint studied. Point
c and Point d are associated with catastrophic failure, after which the plate cannot carry more
load.
Figure 7.12: Typical load-displacement plot in single-lap joint from current XFEM
modelling.
0
500
1000
1500
2000
2500
3000
3500
0.0 0.2 0.4 0.6 0.8
Lo
ad
, P
(N
)
Displacement, δ (mm)PQ8, SLJ, d=5 mm, w/d=3, FT
(a
(b)
(c)
(d)

P a g e | 157
Figure 7.13: Damage plot of XFEM results in single-lap joint with respect to load-
displacement curve
7.4.3 Strength Predictions of Bolted Single-lap CFRP Joint
Table 7.1 reports the strength prediction results of the single-lap joint and compares them
with the experimental test data. The single-lap joints generally showed a larger discrepancy (with
some joint even producing a discrepancy of > +50%) as compared to the DLJ configuration
(where all joints showed less than ±20% differences). Smearing-out properties may not be a
good representation in single-lap joints. Secondary bending gives larger tensile stresses which
can be associated with strength reduction.
Cross-ply lay-up exhibited better predictions than quasi-isotopic lay-up using this “smeared-
out” approach. Repetitions of similar plies in subsequent layers in cross-ply lay-up provide a
better prediction of bending. Thicker plies showed better bending behaviour as ���� terms are
smeared throughout the thickness. The predicted net-tension failures in single-lap joints are in
good agreement with experimental results, as expected. The net-tension stress variation
(a) (b)
(c) (d)

P a g e | 158
associated with secondary bending are not significant compared to the secondary bending effect
on bearing stresses because the dominant factor is stress concentration at the hole edge as
reported by Smith (1985).
Figure 7.14: Bolt tilting in single-lap joint configuration
Bolt tilting is observed (illustrated in Figure 7.14) but ultimate failures showed net-tension
failures. As with the double-lap joints, composite plates of larger W/d in single-lap joint
produced bearing failures. In single-lap joints, failure initiation at the washer edge tends to dig in
the composite giving premature failures as observed experimentally and discussed in Chapter 5.
This cannot be predicted in the current model. As explained in the double-lap bolted joint case,
joint systems with pure bearing failures showed larger discrepancies than net-tension (sub-
section 6.4.5). This is expected because the current constitutive model is only able to predict
opening mode crack as described earlier.
Table 7.1: Comparisons of FEA with experimental work in single-lap joint configurations
Materials Hole
diameter,
d (mm)
Clamp-
up
torque
W/d Experimental
strength
(N/mm2)
Failure
mode
3D Model
(N/mm2)
%
difference
PX2 5 FT 2 351 ± 13 NT 391 11.3 3 404 ± 23 NT 601 48.9 5 N m 2 550 ± 30 NT 746 35.7 3 778 ± 84 NT 866 11.3 10 FT 2 274 ±21 NT 362 32.1 3 281 ± 13 NT 438 55.9 5 N m 2 344 ± 1 NT 362 5.1 3 365 ± 20 NT 504 38.2
PX4 5 FT 2 351 ± 65 NT 406 15.4
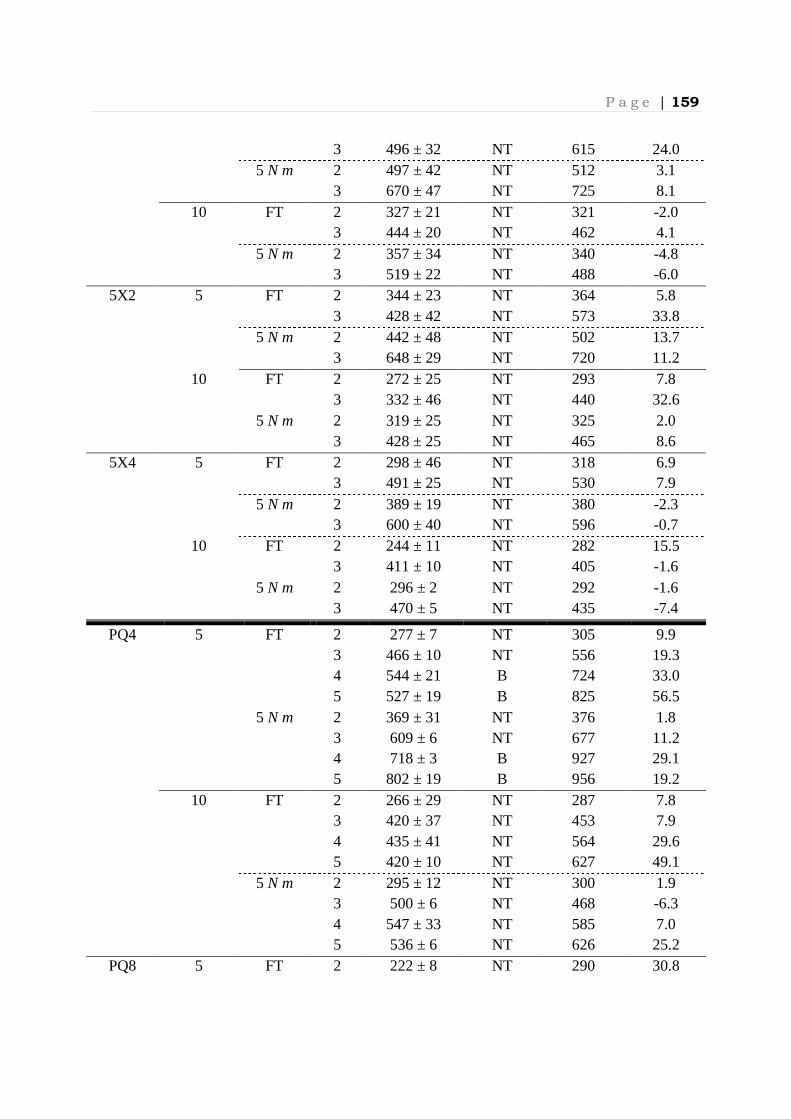
P a g e | 159
3 496 ± 32 NT 615 24.0 5 N m 2 497 ± 42 NT 512 3.1 3 670 ± 47 NT 725 8.1 10 FT 2 327 ± 21 NT 321 -2.0 3 444 ± 20 NT 462 4.1 5 N m 2 357 ± 34 NT 340 -4.8 3 519 ± 22 NT 488 -6.0
5X2 5 FT 2 344 ± 23 NT 364 5.8 3 428 ± 42 NT 573 33.8 5 N m 2 442 ± 48 NT 502 13.7 3 648 ± 29 NT 720 11.2 10 FT 2 272 ± 25 NT 293 7.8 3 332 ± 46 NT 440 32.6 5 N m 2 319 ± 25 NT 325 2.0 3 428 ± 25 NT 465 8.6
5X4 5 FT 2 298 ± 46 NT 318 6.9 3 491 ± 25 NT 530 7.9 5 N m 2 389 ± 19 NT 380 -2.3 3 600 ± 40 NT 596 -0.7 10 FT 2 244 ± 11 NT 282 15.5 3 411 ± 10 NT 405 -1.6 5 N m 2 296 ± 2 NT 292 -1.6 3 470 ± 5 NT 435 -7.4
PQ4 5 FT 2 277 ± 7 NT 305 9.9 3 466 ± 10 NT 556 19.3 4 544 ± 21 B 724 33.0 5 527 ± 19 B 825 56.5 5 N m 2 369 ± 31 NT 376 1.8 3 609 ± 6 NT 677 11.2 4 718 ± 3 B 927 29.1 5 802 ± 19 B 956 19.2 10 FT 2 266 ± 29 NT 287 7.8 3 420 ± 37 NT 453 7.9 4 435 ± 41 NT 564 29.6 5 420 ± 10 NT 627 49.1 5 N m 2 295 ± 12 NT 300 1.9 3 500 ± 6 NT 468 -6.3 4 547 ± 33 NT 585 7.0 5 536 ± 6 NT 626 25.2
PQ8 5 FT 2 222 ± 8 NT 290 30.8

P a g e | 160
3 460 ± 9 NT 554 20.5 4 582 ± 27 B-NT 702 20.6 5 630 ± 88 B 794 26.0 5 N m 2 266 ± 14 NT 305 14.6 3 511 ± 15 NT 599 17.0 4 676 ± 12 B-NT 745 10.3 5 682 ± 16 B 834 22.2 10 FT 2 252 ± 14 NT 295 17.2 3 460 ± 17 NT 458 -0.4 4 529 ± 19 B 551 4.3 5 507 ± 14 B 610 20.4 5 N m 2 259 ± 3 NT 299 15.4 3 480 ± 10 NT 461 -3.8 4 591 ± 20 B 552 -7.0 5 581 ± 12 B 620 6.7
5Q12 10 FT 2 173 ± 10 NT 202 16.8 3 321 ± 4 NT 365 13.7 4 469 ± 2 NT 450 4.1 5 560 ± 20 B-NT 511 8.8 2 178 ± 15 NT 222 24.9 3 349 ± 12 NT 373 6.9 4 496 ± 44 NT 465 4.1 5 548 ± 43 B-NT 517 5.7
FT = finger-tight, NT = net-tension, B = bearing, B-NT = Bearing-Net-tension
7.5 Concluding Remarks
This chapter extends the previous work on double-lap joints, implementing similar
approaches and techniques. However, due to secondary bending, the stress distribution through
the CFRP woven fabric system single-lap joint changes significantly, as shown in parametric
study. In the experimental work, secondary bending altered the strength of CFRP composite
behaviour. Strength prediction in single-lap joint is not as good as in double-lap joints.
Secondary bending, bolt tilting and bolt bending tend to initiate the failure at the washer edge
and dig in the composite plate which promotes premature failures. Additional consideration may
be required in this type of joint, but strength prediction for the single-lap joint in net-tension
mode still shows reasonable agreement with experiment.

P a g e | 161
Chapter 8 : Conclusions and
Recommendations
8.1 Conclusions
The use of a simple physically-based traction-separation relationship as a material
constitutive law within finite element framework to predict the strength of woven fabric
composite plates has been investigated. The approach has been applied to plates containing an
open-hole and to bolted joints that fail by the net-tension failure mode. Both GFRP and CFRP
woven fabric materials have been considered. An important aspect of the work is that the
material properties needed for the constitutive law have been obtained from independent
experiments, rather than from fitting notched strength data.
Initial work concentrated on laminates containing open holes. Three sets of data were taken
from the literature (from Belmonte et. al. (2001, 2004) and Kim et. al (1995)) and the FE based
models from the present work, which involved use of cohesive zone model (CZM) and extended
finite element model (XFEM) in ABAQUS CAE, were validated against both these data sets and
alternative closed-form and numerical models. Good agreement was found between the predicted
strengths and experimental data and the strength predictions were as accurate as any of those
from the other models.
Following this, 2-D models were developed for double-lap joints. The model was validated
against a previous study by Hollmann (1996) for joints that failed by shear-out and focus then
switched to predicting net-tension failure in the double-lap bolted joints of woven GFRP tested
by Kontolatis (2000). The model used considered realistic interaction behaviour between the pin
and hole edge (earlier researchers do not model the bolt). The addition of sliding load (from
clamp-up) to the pin joint strength prediction produced reasonable agreement at low W/d, but
larger discrepancy for higher W/d. It was clear that a full 3-D model was likely to be needed to
capture the effect of bolt clamp-up in a more realistic way.
Prior to developing 3-D models, an experimental study was carried out to measure bearing
stress at failure as a function of failure mode in a range of double-lap and single-lap joints
assembled from woven CFRP (the same material as tested previously by Belmonte et. al. 2004).
The effect of material lay-up and plate thickness, other aspects of joint geometry (including hole
P a g e | 162
size) and bolt clamp-up were investigated. Amongst the results from these experiments were the
demonstration of a hole-size effect for net-tension failure and the conclusion that the single-lap
joints were not much weaker than the double-lap joints. Overall the experimental programme
provided a comprehensive experimental data set for subsequent modelling.
3-D models were then developed for double-lap joints and single-lap joints, incorporating
contact interactions and frictional load transfer via bolt clamp-up. The XFEM method was used
to implement the failure criterion as the crack can be tracked and visualize explicitly. Both GFRP
and CFRP double-lap joints showed good agreement between the predicted strengths and the
experimental data for the coupons that failed in net-tension mode, even when there was some
degree of initial damage in bearing. Not surprisingly, there were larger discrepancies for the
joints that failed in bearing, a failure mode not treated in the model.
The strength prediction work is further expanded to single-lap joint, but with a somewhat
larger discrepancy between the predicted strengths and the experimental data. This may due to
the implementation of “smeared-out” properties in single-lap joint. This joint type exhibits
secondary bending that may not be representative for bending behaviour but some lay-ups
(cross-ply and/or thicker lay-ups) produced better agreement than other lay-ups. Similar to
double-lap joint, good prediction is gained for joint failed in net-tension failures.
In summary, the work has been successful in achieving the aims set at the outset. The use of
a constitutive relationship to predict the strength in two different load cases (open-hole and
bolted joint) gives confidence in the methodology (in particular given that for a particular
material the same properties are assigned to the constitutive relation throughout). Moreover the
3-D model for the bolted joint appears to work well. Compared to other composite systems the
problem is simplified by treating the woven fabric material as homogeneous.
8.2 Future Works
Perhaps the most obvious area for future work is to explore ways in which the model could be
extended to predict bearing failure. There are various ways in which this could be done. Given
the progressive nature of the damage, it may be necessary to develop a ply-by-ply approach, with
consequent substantial increase in computing requirement. The final failure (through-thickness
compression) would need to be handled at laminate level. Another interesting area of work

P a g e | 163
would be to extend the study to consider multi-bolt joints, where combinations of bearing and
by-pass load can lead to net-tension failure.
Further areas for consideration could include
[1]. Application of the open hole approach to strength prediction for other shape of cut-outs, such
as elliptical notch (there are further experimental studies reported by Manger (1999) that
could be investigated in this way)
[2]. Investigation of the effects of environmental conditions such as temperature and moisture
exposure. These conditions will significantly degrade the elastic material properties of joint
structure, mostly applied to aerospace applications. Acceleration tests may be appropriate
for testing conditions.
[3]. Application of some of the modelling methods developed in the present work to other
composite systems based on different materials and reinforcement types.

P a g e | 164
References
6.9.1, ABAQUS®V. User’s Manual and Theory Manual. Hibbit, Karlson and Sorensen, Inc.
Afaghi-Khatibi A., Ye L.,. "Notched Strength and Effective Crack Growth in Woven Fabric Laminates with Circular Holes." Journal Reinforced Plastic and Composites, 1996b: 15:344-358.
Afaghi-Khatibi, A., Ye, L., Ma, Y.W.,. "An Effective Crack Growth Model for Residual Strength Evaluation of Composite Laminates with Circular Holes." Journal of Composite Materials, 1996a: 30:142-163.
Agrawal, B.L.,. "Static Strength Prediction of Bolted Joint in Composite Materials." AIAA Journal, 1980: 18:1371-1375.
Akkerman, R.,. "On the Properties of Quasi-isotropic Laminates." Composites: Part B, 2002: 33:133-140.
Aktas, A., Dirikolu, M.H. "An Experimental and Numerical Investigation of Strength Characteristics of Carbon-Epoxy Pinned-joint Plates." Composites Science and Technology, 2004: 64:1605-1611.
Aktas, A., Imrek H, Cunedioğlu, Y.,. "Experimantal and Numerical Failure Analysis of Pinned-joints in Composite Materials." Composite Structures, 2009: 89:459-466.
Aronsson CG, Backlund JA. "Sensitivity Analysis of the Damage Zone Model." Computers and Structures, 1986b: 22:669-676.
Aronsson, C.G., Backlund, J.A.,. "Tensile Fracture of Laminates with Cracks." Journal of Composite Materials, 1986a: 20:287-307.
Awerbuch, J., Madhukar, S.M.,. "Notched Strength of Composite Laminates: Predictions and Experiments - A Review." Journal of Reinforced Plastics and Composites, 1985: 4:3-165.
Backlund, J., Aronsson, C.G.,. "Tensile Fracture of Laminates with Holes." Journal of Composite Materials, 1986: 20:259-285.
Badel, P., Vidal-Salle, E., Boisse, P.,. "Computational Determination of In-plane Shear Mechanical Behaviour of Textile Composite Reinforcements." Computational Materials Science, 2007: 40:439-448.
Barenblatt, G.I.,. "The Mathematical Theory of Equilibrium Cracks in Brittle Fracture." Advanced Applied Mechanics, 1962: 7:55-129.
Belmonte, H.M.S., Manger, C.I.C., Ogin, S.L., Smith, P.A., Lewin, R.,. "Characterisation and Modeling of the Notched Tensile Fracture of Woven Quasi-isotropic GFRP Laminates." Composites Science and Technology, 2001: 61:585-597.
Belmonte, H.M.S.,. Notched Strength of Woven Fabric Composites. Ph.D. Thesis, University of Surrey, 2002.
Belmonte, H.M.S., Ogin, S.L., Smith, P.A., Lewin, R.,. "A Physically-based Model for the Notched Strength of Woven Quasi-isotropic CFRP Laminates." Composite Part A, 2004: 35:763-778.
P a g e | 165
Belytschko, T., Black, T.,. "Elastic Crack Growth in Finite Elements with Minimal Remeshing." International Journal for numerical methods in Engineering, 1999: 45:601-620.
Camanho, P.P., Matthews, F.L. "A Progressive Damage Model for Mechanically Fastened Joints in Composite Laminates." Journal of Composite Materials, 2000: 33(24):2248-2280.
Campilho, R.D.S.G., Banea, M.D.,Chaves, F.J.P., Da Silva, L.F.M.,. "Extended Finite Element for Fracture Characterization of Adhesive Joints in Pure Mode I." Computational Materials Science, 2011: 50:1543-1549.
Chang, F.K., Chang, K.Y.,. "A Progressive Damage Model for Laminated Composites Containing Stress Concentrations." Journal of Composite Materials, 1987: 21(3):834-855.
Chang, F.K., Chang, K.Y.,. "Post-failure Analysis of Bolted Composite Joints in Tension or Shear-out Mode Failure." Journal of Composite Materials, 1987: 21:809-833.
Chang, F.K., Scott, R.A., Springer, G.S.,. "Failure of Composite Laminates Containing Pin Loaded Holes – Method of Solution." Journal Composite Materials, 1984: 18:255-278.
Chang, F.K., Scott, R.A., Springer, G.S.,. "Strength of Mechanically Fastened Composite Joints." Journal Composite Materials, 1982: 16:470-494.
Chishti, M., Wang, C.H., Thomson, R.S., Orifici, A.,. "Progressive Damage in Single-Lap Countersunk Composite Joints." WCCM/APCOM2010. Sydney: IOM Publishing Ltd, 2010. 1-10.
Collings, T.A.,. On the Bearing Strengths of CFRP Laminates. RAE Technical Report 82033, 1982, 1-23.
Collings, T.A.,. "The Strength of Bolted Joints in Multi-directional CFRP Laminates." Composites, 1977: 43-55.
Cooper, C., Turvey, G.J.,. "Effects of Joint Geometry and Bolt Torque on the Structural Performance of Single Bolt Tension Joints in Pultruded GRP Sheet Material." Composite Structures, 1995: 32:217-226.
Crews, J.H., Hong, C.S., and Raju, I.S.,. Stress Concentration Factors for Finite Orthotropic Laminates with a Pin-loaded Hole. 1-40, 1981: NASATechnology Paper 1862, 1981.
Curtis, P.T., Bishop, S.M.,. "An Assessment of the Potential of Woven Carbon Fibre-Reinforced Plastics for High Performance Applications." Composites, 1984: 15:259-265.
Daggumati, S., Paepegem, W.V., Degrieck, J., Xu, J., Lomov, S.V., Verpoest, I.,. "Local Damage in a 5-harness Satin Weave Composite under Static Tension: Part II-Meso-FE Modelling." Composites Science and Technology, 2010b: 70:1934-1941.
Daggumati, S., Paepegem, W.V., Degrieck, J., Xu, J., Lomov, S.V., Verpoest, I.,. "Local Strain in a 5-harness Satin Weave Composite under Static Tension: Part II-Meso FE Analysis." Composites Science and Technology, 2011: 71:1217-1224.

P a g e | 166
Daggumati, S., Paere, I.D., Paepegem, W.V., Degrieck, J., Xu, J., Lomov, S.V., Verpoest, I.,. "Local Damage in a 5-harness Satin Weave Composite under Static Tension: Part I - Experimental Analysis." Composite Science and Technology, 2010a: 13:1926-1933.
Dano, M.L., Gendron, G., Picard, A.,. "Stress and Failure Analysis of Mechanically Fastened Joints in Composite Laminates." Composite Structures, 2000: 287-296.
de Jong, T.,. "Stresses around Pin-loaded Holes in Elasticity Orthotrophic or Isotropic Plates." Journal Composite Materials, 1977: 11:313-331.
Dugdale, D.S.,. "Yielding of Steel Sheets Containing Slits." Journal of Mechanical Physics Solids, 1960: 8:100-104.
Ekh, J., Schon, J.,. "Effect of Secondary Bending on Strength Prediction of Composite, Single Shear Lap Joints." Composites Science and Technology, 2005: 65:953-965.
Eriksson, I.,. "An Analysis Method for Bolted Joints in Primary Composite." AGARD Conference Proceedings 427. Madrid, Spain, 1987. 6.1-6.19.
Eriksson, I., Aronsson, C.G.,. "Strength of Tensile Loaded Graphite/Epoxy Laminates Containg Crack, Open and Filled Holes." Journal of Composite Materials, 1990: 24:456-482.
Eriksson, L.I.,. "Contact Stresses in Bolted Joints of Composite Laminates." Composite Structures, 1986: 6:57-75.
Esendemir, U.,. "Failure Analysis of Woven Glass-epoxy Prepeg Bolted Joints under Different Clamping Moments." Advanced Composites Letters, 20085: 17:165-175.
Gao, F., Boniface, L., Ogin, S.L., Smith, P.A., Greaves, R.P. "Damage Accumulation in Woven Fabric CFRP Laminates under Tensile Loading: Part 2-Modelling the Effect of Damage on Macro-Mechanical Properties." Composite Science and Tehnology, 1999b: 59:137-145.
Gao, F., Boniface, L., Ogin, S.L., Smith, P.A., Greaves, R.P.,. "Damage Accumulation in Woven Fabric CFRP Laminates under Tensile Loading: Part I-Observations of Damage Accumulation." Composite Science and Technology, 1999a: 59:123-136.
Green, B.G., Wisnom, M.R., Hallet, S.R.,. "An Experimental Investigation into the Tensile Strength Scaling of Notched Composites." Composite Part A, 2007: 38:867-878.
Hahn, H.T., Tsai, S.W.,. "Nonlinear Elastic Behavior of Unidirectional Composite Laminates." Journal of Composite Materials, 1973: 7:102-118.
Hallett, S.R., Green, B.G., Jiang, W.G., Wisnom, M.R.,. "An Experimental and Numerical Investigation into the Damage Mechanisms in Notched Composites." Composites: Part A, 2009: 40: 613-624.
Hallett, S.R., Wisnom, M.R.,. "Experimental Investigation of Progressive Damage and the Effect of Layup in Notched Tensile Tests." Journal of Composite Materials, 2006: 40(2):119-141.
P a g e | 167
Hamada, H., Maekawa, Z., Haruna, K.,. "Strength Prediction of Mechanically Fastened Quasi-Isotropic Carbon/Epoxy Joints." Journal of Composite Materials, 1996: 30:1596-1612.
Harris, C.E., Morris, D.H.,. "Effect of Laminate Thickness and Specimen Configuration on the Fracture of Laminated Composites." Composite Materials: Testing and Design (Seventh Conference), ASTM STP 893, 1986: 177-195.
Harris, C.E., Morris, D.H.,. "The Effects of Laminate Thickness on the Fracture Behaviour of Composite Laminates." Composite Structures, 1983: 2:511-524.
Hashin, Z.,. "Failure Criteria for Unidirectional Fibre Composites." Journal of Applied Mechanics, 1980: 47:329-334.
Hitchen, S.A., Ogin, S.L., Smith, P.A., Soutis, C.,. "The Effect of Fibre Length on Fracture Toughness and Notchness and Notched Strength of Short Carbon Fibre/Epoxy Composites." Composites, 1994: 6:407-413.
Hollmann, K.,. "Failure Analysis of Bolted Composite Joints In-plane Failure Modes." Journal of Composite Materials, 1996: 30(3):358-383.
Hyer, M.W., Klang, E.C. and Cooper, D.E.,. "The Effects of Pin Elasticity, Clearance and Friction on the Stresses in a Pin-loaded Orthotropic Plate." Journal Composite Material, 1987: 21:190-206.
İcten, B.M., Karakuzu, R.,. "Progressive Failure Analysis of Pin-loaded Carbon-Epoxy Woven Composite Plates." Composites Science and Technology, 2002: 62:1259-1271.
Ireman, T.,. "Three Dimensional Stress Analysis of Bolted Single-lap Composite." Composite Structures, 1998: 43:195-216.
Irwin, G.R.,. "Fracture dynamics." In Fracturing of Metals, by G.R., Irwin, 147-166. USA: American Society For Metals, 1948.
Ishikawa, T., Chou, T.W.,. "Stiffness and Strength Behaviour of Woven Fabric Composites." Journal Material Science, 1982: 17:3211-3220.
Ivanov, D.S., Lomov, S.V., Ivanov, S., Verpoest, I.,. "Stress Distribution in Outer and Inner Plies of Textile Laminates and Novel Boundary Conditions for Unit Cell Analysis." Composites Part A, 2010: 41:571-580.
Karakuzu, R., Gulem, T., İcten, B.M.,. "Failure Analysis of Woven Laminated Glass-Vinylester Composites with Pin-loaded Hole." Composite Structures, 2006: 72:27-32.
Karlak, R.F.,. "Hole Effects in a Related Series of Symmetrical Laminates." Proc. Failure Modes in Composites IV. Chicago, USA: The Metallurgical Society of AIME, 1977. 105-117.
Khashaba, U.A., Sallam, H.E.M., Al-Shorbagy, A.E., Seif, M.A.,. "Effect of Washer Size and Tightening Torque on the Performance of Bolted Joints in Composite Structures." Composite Structures, 2006: 73(3):213-221.

P a g e | 168
Kim, J.K., Kim, D.S., Takeda, N.,. "Notched Strength and Fracture Criterion in Fabric Composite Plates Containing a Circular Hole." Journal Composite Materials, 1995: 29(7):982-998.
Kontolatis, A.,. Failure of Composite Bolted Joints Made from Woven fabric GFRP Composite. MSc dissertation, Guildford: University of Surrey, 2000.
Kortschot, M.T., Beaumont, P.W.R., Ashby, M.F.,. "Damage Mechanics of Composite Materials. III: Prediction of Damage Growth and Notched Strength." Composites Science and Technology, 1991: 40(2):147-165.
Kortschot, M.T., Beaumont, P.W.R.,. "Damage Mechanics of Composite Materials: II - A Damaged-based Notched Strength Model." Composites Science and Technology, 1990: 39: 303-326.
Kretsis, G., Matthews, F.L.,. "The Strength of Bolted Joints in Glass Fibre/Epoxy Laminates." Composites, 1985: 16(2):92-102.
Lagace, P.A.,. "Notch Sensitivity of Graphite/Epoxy Eabric Laminates." Composite Science and Technology, 1986: 26:95-117.
Lapczyk, I., Hurtado, J.A.,. "Progressive Damage Modeling in Fibre-Reinforced Materials." Composite Part A, 2007: 38:2333-2341.
Le Page, B.H., Guild, F.J., Ogin, S.L., Smith, P.A.,. "Finite Element Ssimulation of Woven Fabric Composites." Composites Part A, 2004: 35:861-872.
Lekhnitskii, S.G.,. Anisotropic Plates. London: Gordon and Breach, 1998.
Lessard, L.B., Shokrieh, M.M.,. "Two-dimensional Modelling of Composite Pinned-Joint Failure." Journal of Composite Materials, 1995: 29:671-697.
Lomov, S.V., Ivanov, D.S., Verpoest, I., Zako, M., Kurashiki, T., Nakai, H., Hirosawa, S.,. "Meso-FE Modelling of Textile Composites: Road Map, Data Flow and Algorithms." Composites Science and Technology, 2007: 67:1870-1891.
Manger, C.I.C.,. Failure of Notched Woven GFRP Composites: Damage Analysis and Strength Modelling. PhD Thesis, Guildford: University of Surrey, 1999.
Marshall, I.H., Arnold, W.S., Wood, J., Mousley, R.F.,. "Observations on Bolted Connections in Composite Structures." Composite Structures, 1989: 13:133-151.
Matthews, F.L., Kilty, P.F., and Godwin, E.W.,. "Load-carrying Joints in Fibre Reinforced Plastics." Plastic and Rubber Process and Applications, 1982: 2:19-25.
McCarthy, C.T., McCarthy, M.A.,. "Three-dimensional Finite Element Analysis of Single-bolt, Single-lap Composite Bolted Joints: Part II-Effects of Bolt-hole Clearance." Composite Structures, 2005a: 71:159-175.

P a g e | 169
McCarthy, M.A., McCarthy, C.T., Lawlor, V.P., Stanley, W.F.,. "Three-dimensional Finite Element Analysis of Single-bolt, Single-lap Composite Bolted Joints: Part I- Model Development and Validation." Composite Structures, 2005: 71:140-158.
Naik, N.K., Ganesh, V.K. "An analytical Model For Plain Weave Fabric Composites." Composites, 1995: 4:281-289.
Naik, N.K., Ganesh, V.K. "Prediction of On-Axes Elastic Properties of Plain Weave Fabric Composites." Composite Science Technology, 1992: 45:135-152.
Naik, N.K., Shembaekar, P.S. "Notched Strength of Fabric Laminates I:Prediction." Composites Science Technology, 1992: 1-12.
Nassar, S., Virupaksha, V.L., Ganeshmurthy, S.,. "Effect of Bolt Tightness on the Behaviour of Composite Joints." Journal of Pressure Vessel Technology, 2007: 129:43-51.
Nuismer, R.J., Whitney, J.M.,. "Uniaxial Failure of Composite Laminates Containing Stress Concentrations." Fractures Mechanics of Composites, ASTM STP 593, American Society for Testing and Materials, 1975: 117-142.
Okutan, B., Aslan, Z., Karakuzu, R.,. "A Study of the Effects of Various Geometric Parameters on the Failure Strength of Pin-loaded Woven-Glass-Fibre Reinforced Epoxy Laminate." Composites Science and Technology, 2001: 61:1491-1497.
Oplinger, D.W., Gandhi, K.R.,. "Analtyical Studies of Structural Performance in Mechanically Fastened Fibre-Reinforced Plates." Army Symposium on Soild Mechanics. 1974. 211-240.
Pakdil, M.,. "Failure Analysis of Composite Single Bolted-joints Subjected to Bolt Pretension." Indian Journal of Engineering & Materials Sciences, 2009: 16:79-85.
Paris, P.C., Sih, G.C.,. "Stress Analysis of Cracks." In Fracture Toughness Testing and its Applications, ASTM STP 381, 30-85. Philadephia, PA, USA: American Society of Testing and Materials, 1965.
Park, H.J.,. "Effects of Stacking Sequence and Clamping Force on the Bearing Strengths of Mechanically Fastened Joints in Composite Laminates." Composite Structures, 2001: 53:213-221.
Pierron, F., Cerisier, F., Grediac, M.,. "A Numerical and Experimental Study of Woven Composite Pin-joints." Journal of Composite Materials, 2000: 34:1028-1054.
Pierron, F., Green, B., Wisnom, M.R., Hallet, S.R.,. "Full-field Assessment of the Damage Process of Laminated Composite Open-hole Tensile Specimens. Part II: Experimental Results." Composite Part A: Applied Science and Manufacturing, 2007: 38:2321-2332.
Pipes, R.B., Wetherhold, R.C., Gillespie, J.W.,. "Notched Strength of Composite Materials." Journal Composite Materials, 1979: 13:148-160.
Quinn, W.J., Matthews, F.L.,. "The Effect of Stacking Sequence on the Pin-Bearing Strength in Glass Fibre Reinforced Plastic." Journal of Composite Materials, 1977: 11:139-145.
P a g e | 170
Riccio, A.,. "Effects of Geometrical and Material Features on Damage onset and Propagation in Single-lap Bolted Joints under Tensile Load: Part II - Numerical Studies." Journal of Composite Materials, 2005: 39:2091-2112.
Riccio, A., Marciano, L.,. "Effects of Geometrical and Material Features on Damage onset and Propagation in Single-lap Bolted Composite Joints under tensile load, Part I: Experimental Studies." Journal of Composite Materials, 2005: 39:2071-2090.
Rowlands, R.E., Rahman, M.U., Wilkinson, T.L., Chiang, Y.I.,. "Single and Multiple-bolted Joints in Orthotropic Materials." Composites, 1982: 13:273-279.
Schulz, K.C., Packman, P.L., Eisenmann, J.R. "A Tension-mode Fracture Model for Bolted Joints in Laminated Composites." Journal of Composite Materials, 1995: 29(1):37-58.
Smith, P.A., Ashby, M.F., Pascoe, K.J.,. "Modelling Clamp-up Effects in Composite Bolted Joints." Journal of Composite Materials, 1987: 21:879-897.
Smith, P.A.,. Aspects of the Static and Fatigue Behaviour of Composite Laminates, including Bolted Joints. PhD thesis, Cambridge, UK: Cambridge University, 1985.
Smith, P.A., Pascoe, K.J., Polak, C., Stroud, D.O.,. "The Behaviour of Single-lap Bolted Joints in CFRP Laminates." Composite Structures, 1986: 41-55.
Soutis C., Fleck N.A., Smith P.A.,. "Failure Prediction Technique for Compression Loaded Carbon Fibre-Epoxy Laminate with Open Holes." Journal Composite Materials, 1991: 25:1476-1498.
Soutis C., Fleck N.A.,. "Static Compression Failure of Carbon Fibre T800/924C Composite Plate with a Single Hole." Journal Composite Materials, 1990: 24:536-558.
Stockdale, J.H., Matthews, F.L.,. "The Effect of Clamping Pressure on Bolt Bearing Loads in Glass Fibre Reinforced Plastics." Composites, 1976: 34-39.
Tan, P., Tong, L., Steven, G.P.,. "Micromechanics Models for the Elastic Constants and Failure Strengths of Plain Weave Composites." Composite Structures, 1999:47(1-4): 797-804.
Tan, S.C.,. "A Progressive Failure Model for Composite Laminates Containing Openings." Journal of Composite Materials, 1991: 25:556-577.
Tsai, S.W., Wu, E.M.,. "A General theory of Strength for Anisotropic Materials." Journal of Composite Materials, 1971: 5:58-80.
Tserpes, K.I., Labeasb, G., Papanikos, P., and Kermanidis, T.H.,. "Strength Prediction of Bolted Joints in Graphite/Epoxy Composite Laminates." Composites: Part B, 2002: 33(7):521-529.
Tsujimoto, Y., Wilson, D.,. "Elasto-plastic Failure analysis of Composite Bolted Joints." Journal of Composite Material, 1986: 20:236-252.
Turvey, G.J., Wang, P.,. "An FE Analysis of the Stresses in Pultruded GRP Single-Bolt Tension Joints and their Implications for Joint Design." Computers and Structures, 2008: 86:1014-1021.
P a g e | 171
Ujjin, R., Crosky, A., Schmidt, L., Kelly, D., Li, R., Carr, D.,. "Damage Developement during Pin Loading of a Hole in a Quasi-isotropic Carbon Fibre Reinforced Epoxy Composite." Structural Integrity and Fracture International Conference (SIF'04). Brisbane, 2004. 359-365.
Waddops, M.E., Eisenmann, J.R., Kaminiski, B.E.,. "Macroscopic Fracture Mechanics of Advanced Composite Materials." Journal of Composite Materials, 1971: 5:446-454.
Waszak, J.P., Cruse, T.A.,. "Failure Mode and Strength Prediction of Anisotropic Bolt Bearing Specimens." Journal of Composite Materials, 1971: 5:421-425.
Whitney, J.M., Kim, R.Y.,. "Effect of Stacking Sequence on the Notched Strength of Laminated Composites." Composite Materials: Testing and Design (Forth Conference). ASTM STP 617, American Society for Testing and Materials, 1977. 229-242.
Whitney, J.M., Nuismer, R.J.,. "Stress Fracture Criteria for Laminated Composites Containing Stress Concentrations." Journal of Composite Materials, 1974: 8:253-265.
Whitworth, H.A., Aluko, O., Tomlinson, N.A.,. "Application of the Point Stress Criterion to the Failure of Composite Pinned Joints." Engineering Fracture Mechanics, 2008: 75:1829-1839.
Wisnom, M.R., Chang, F.K.,. "Modelling of Splitting and Delamination in Notched Cross-ply Laminates." Composites Science and Technology, 2000: 60:2849-2856.
Yamada, S.E. and Sun, C.T.,. "Analysis of Laminate Strength and its Distribution." Journal Composite Material, 1978: 12:275-284.
Yavari, V., Rajabi, I., Daneshvar, F., Kadivar, M.H.,. "On the Stress Distribution around the Hole in Mechanically Fastened Joints." Mechanics Research Communications, 2009: 36:373-380.
Zahari, R., Azmee, A.H., Mustapha, Salit, F., Varatharajoo, M.S., Shakrine, R.,. "Prediction of Progressive Failure in Woven Glass/Epoxy Composite Laminated Panels." Journal Mekanikal, 2008: 25: 80-91.
Zako, M., Uetsuji, Y., Kurashiki, T.,. "Finite Element Analysis of Damaged Woven Fabric Composite Materials." Composites Science and Technology, 2003: 63:507-516.

P a g e | 172
Appendix A: CFRP Bolted Joint Experimental Data
A1: Experimental bearing stress at failure for PX2
P X
2
Joint type
Hole diameter, d
(mm)
Clamp- Up
W/d Sample no.*
Plate thickness, t
(mm)
Bearing stress at failure, �((þ/��ý)
Mean bearing stress, �((þ/��ý)
DLJ
5
FT 2 3 0.508 367 377 ± 15 4 0.517 388
3 22 0.505 472 513 ± 39 24 0.499 517
5 0.502 550 5 N m 2 2 0.516 674
673 ± 41 6 0.518 713 23 0.505 631
3 21 0.510 1020 992 ± 56 14 0.494 927
17 0.503 1029
10
FT 2 16 0.497 398 350 ± 42 24 0.491 328
5 0.488 323 3 18 0.497 418
413 ± 40 9 0.498 370 11 0.503 451
5 N m 2 6 0.492 439 434 ± 5.7 7 0.491 436
21 0.496 428 3 13 0.513 671
622 ± 46 1 0.518 616 16 0.513 579
SLJ
5
FT 2 19 0.516 367 351 ± 13 5 0.516 356
22 0.515 336 21 0.508 347
3 10 0.502 415 404 ± 23 1 0.501 391
8 0.514 430 15 0.516 378
5 N m
2 17 0.514 534 550 ± 30 18 0.519 531
16 0.507 584 3 11 0.504 876
778 ± 84 13 0.502 819 18 0.506 692 9 0.490 725
10
FT 2 22 0.501 254 274 ± 21 9 0.489 272
23 0.500 296 3 7 0.509 278
281 ± 13 21 0.499 265 8 0.490 286 3 0.529 296
5 N m 2 12 0.477 345 344 ± 1.2 3 0.489 345

P a g e | 173
2 0.482 343 3 12 0.510 364
365 ± 20 20 0.494 338 17 0.493 386 22 0.521 371
*Sample no. meant for author references
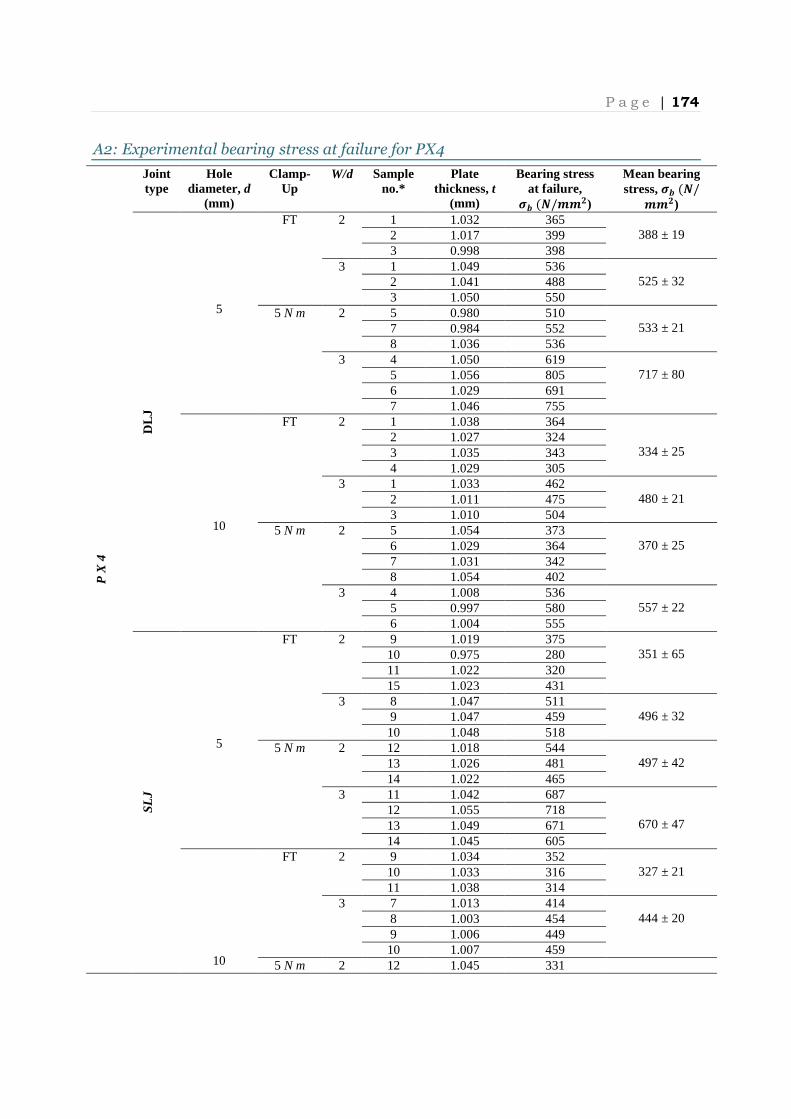
P a g e | 174
A2: Experimental bearing stress at failure for PX4
P X
4
Joint type
Hole diameter, d
(mm)
Clamp- Up
W/d Sample no.*
Plate thickness, t
(mm)
Bearing stress at failure, �((þ/��ý)
Mean bearing stress, �((þ/��ý)
DLJ
5
FT 2 1 1.032 365 388 ± 19 2 1.017 399
3 0.998 398 3 1 1.049 536
525 ± 32 2 1.041 488 3 1.050 550
5 N m 2 5 0.980 510 533 ± 21 7 0.984 552
8 1.036 536 3 4 1.050 619
717 ± 80 5 1.056 805 6 1.029 691 7 1.046 755
10
FT 2 1 1.038 364
334 ± 25 2 1.027 324 3 1.035 343 4 1.029 305
3 1 1.033 462 480 ± 21 2 1.011 475
3 1.010 504 5 N m 2 5 1.054 373
370 ± 25 6 1.029 364 7 1.031 342 8 1.054 402
3 4 1.008 536 557 ± 22 5 0.997 580
6 1.004 555
SLJ
5
FT 2 9 1.019 375 351 ± 65 10 0.975 280
11 1.022 320 15 1.023 431
3 8 1.047 511 496 ± 32 9 1.047 459
10 1.048 518 5 N m
2 12 1.018 544 497 ± 42 13 1.026 481
14 1.022 465 3 11 1.042 687
670 ± 47
12 1.055 718 13 1.049 671 14 1.045 605
10
FT 2 9 1.034 352 327 ± 21 10 1.033 316
11 1.038 314 3 7 1.013 414
444 ± 20 8 1.003 454 9 1.006 449 10 1.007 459
5 N m 2 12 1.045 331

P a g e | 175
13 1.041 407 357 ± 34 14 1.050 352 15 1.050 339
3 12 0.996 493 519 ± 22 13 1.018 536
14 0.998 538 15 1.034 507
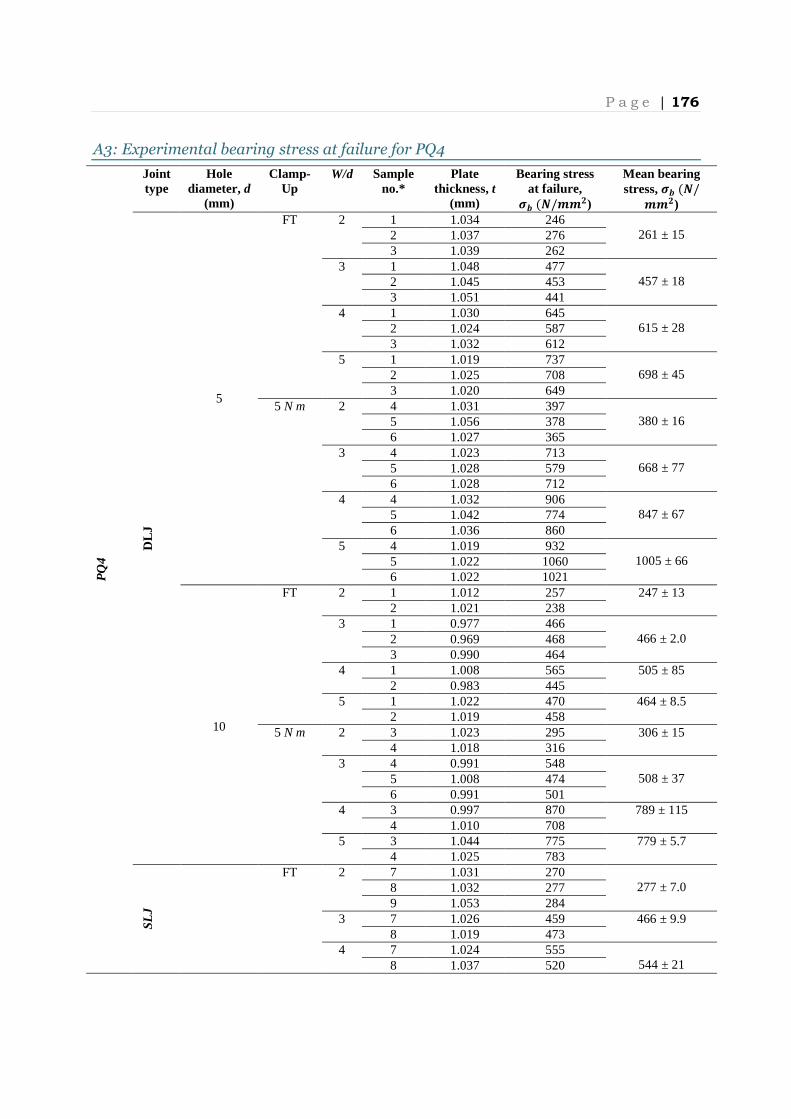
P a g e | 176
A3: Experimental bearing stress at failure for PQ4
PQ
4
Joint type
Hole diameter, d
(mm)
Clamp- Up
W/d Sample no.*
Plate thickness, t
(mm)
Bearing stress at failure, �((þ/��ý)
Mean bearing stress, �((þ/��ý)
DLJ
5
FT 2 1 1.034 246 261 ± 15 2 1.037 276
3 1.039 262 3 1 1.048 477
457 ± 18 2 1.045 453 3 1.051 441
4 1 1.030 645 615 ± 28 2 1.024 587
3 1.032 612 5 1 1.019 737
698 ± 45 2 1.025 708 3 1.020 649
5 N m 2 4 1.031 397 380 ± 16 5 1.056 378
6 1.027 365 3 4 1.023 713
668 ± 77 5 1.028 579 6 1.028 712
4 4 1.032 906 847 ± 67
5 1.042 774 6 1.036 860
5
4 1.019 932 1005 ± 66 5 1.022 1060
6 1.022 1021
10
FT 2 1 1.012 257 247 ± 13 2 1.021 238
3 1 0.977 466 466 ± 2.0 2 0.969 468
3 0.990 464 4 1 1.008 565 505 ± 85
2 0.983 445 5
1 1.022 470 464 ± 8.5 2 1.019 458
5 N m 2 3 1.023 295 306 ± 15 4 1.018 316
3 4 0.991 548 508 ± 37 5 1.008 474
6 0.991 501 4 3 0.997 870 789 ± 115
4 1.010 708 5 3 1.044 775 779 ± 5.7
4 1.025 783
SLJ
FT 2 7 1.031 270 277 ± 7.0 8 1.032 277
9 1.053 284 3 7 1.026 459 466 ± 9.9
8 1.019 473 4 7 1.024 555
544 ± 21 8 1.037 520

P a g e | 177
5
9 1.043 557 5 7 1.024 549
527 ± 19 8 1.019 516 9 1.015 516
5 N m
2 10 1.060 345 369 ± 31 11 1.032 405
12 1.033 359 3 10 1.022 605 609 ± 5.7
11 1.044 613 4 10 1.039 720 718 ± 2.8
11 1.028 716 5 10 1.017 805
802 ± 19 11 1.017 782 12 1.026 819
10
FT 2 5 1.026 300 266 ± 29 6 1.024 253
9 1.023 245 3 8 0.996 394 420 ± 37
9 0.995 446 4 5 1.011 406 435 ± 41
6 1.013 464 5 5 0.996 428 420 ± 10
6 1.015 413 5 N m 2 7 1.019 303 295 ± 12
8 1.017 286 3 10 0.991 499
500 ± 5.6 11 1.010 495 12 0.996 506
4 7 1.005 570 547 ± 33 8 1.008 524
5 7 1.010 540 536 ± 6.3 8 1.018 531
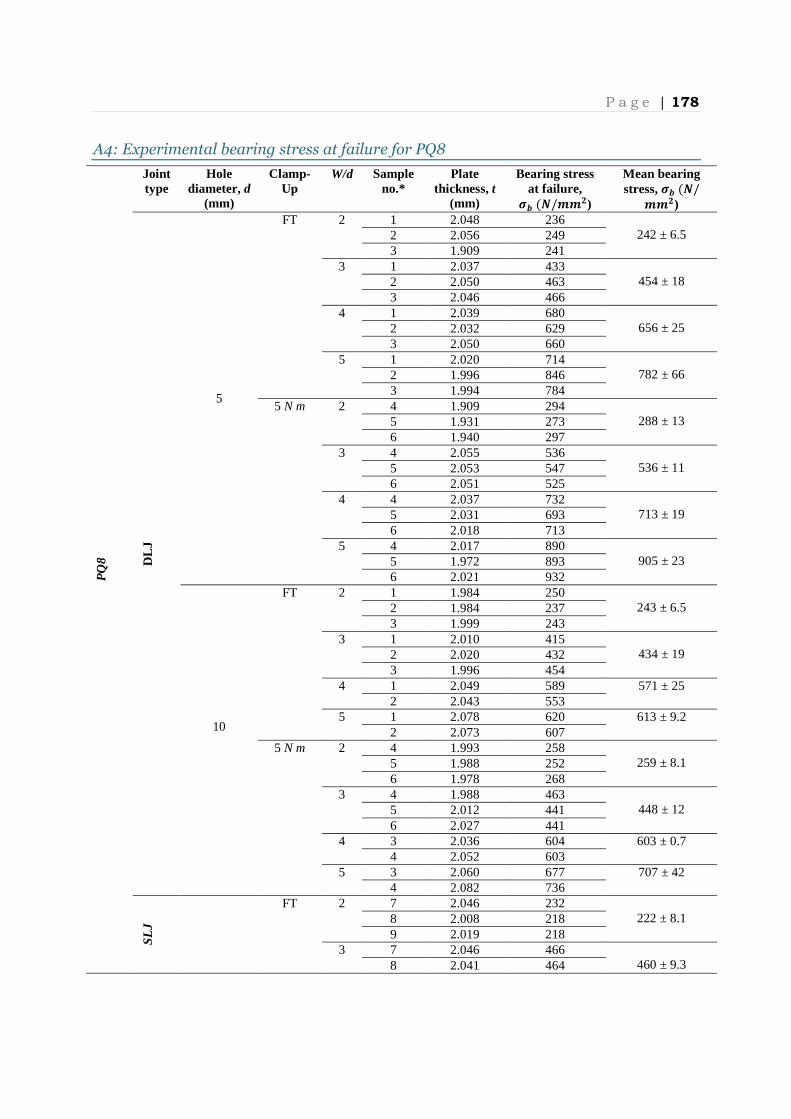
P a g e | 178
A4: Experimental bearing stress at failure for PQ8
PQ
8
Joint type
Hole diameter, d
(mm)
Clamp- Up
W/d Sample no.*
Plate thickness, t
(mm)
Bearing stress at failure, �((þ/��ý)
Mean bearing stress, �((þ/��ý)
DLJ
5
FT 2 1 2.048 236 242 ± 6.5 2 2.056 249
3 1.909 241 3 1 2.037 433
454 ± 18 2 2.050 463 3 2.046 466
4 1 2.039 680 656 ± 25 2 2.032 629
3 2.050 660 5 1 2.020 714
782 ± 66 2 1.996 846 3 1.994 784
5 N m 2 4 1.909 294 288 ± 13 5 1.931 273
6 1.940 297 3 4 2.055 536
536 ± 11 5 2.053 547 6 2.051 525
4 4 2.037 732 713 ± 19 5 2.031 693
6 2.018 713 5
4 2.017 890 905 ± 23 5 1.972 893
6 2.021 932
10
FT 2 1 1.984 250 243 ± 6.5 2 1.984 237
3 1.999 243 3 1 2.010 415
434 ± 19 2 2.020 432 3 1.996 454
4 1 2.049 589 571 ± 25 2 2.043 553
5
1 2.078 620 613 ± 9.2 2 2.073 607
5 N m 2 4 1.993 258 259 ± 8.1 5 1.988 252
6 1.978 268 3 4 1.988 463
448 ± 12 5 2.012 441 6 2.027 441
4 3 2.036 604 603 ± 0.7 4 2.052 603
5 3 2.060 677 707 ± 42 4 2.082 736
SLJ
FT 2 7 2.046 232 222 ± 8.1 8 2.008 218
9 2.019 218 3 7 2.046 466
460 ± 9.3 8 2.041 464
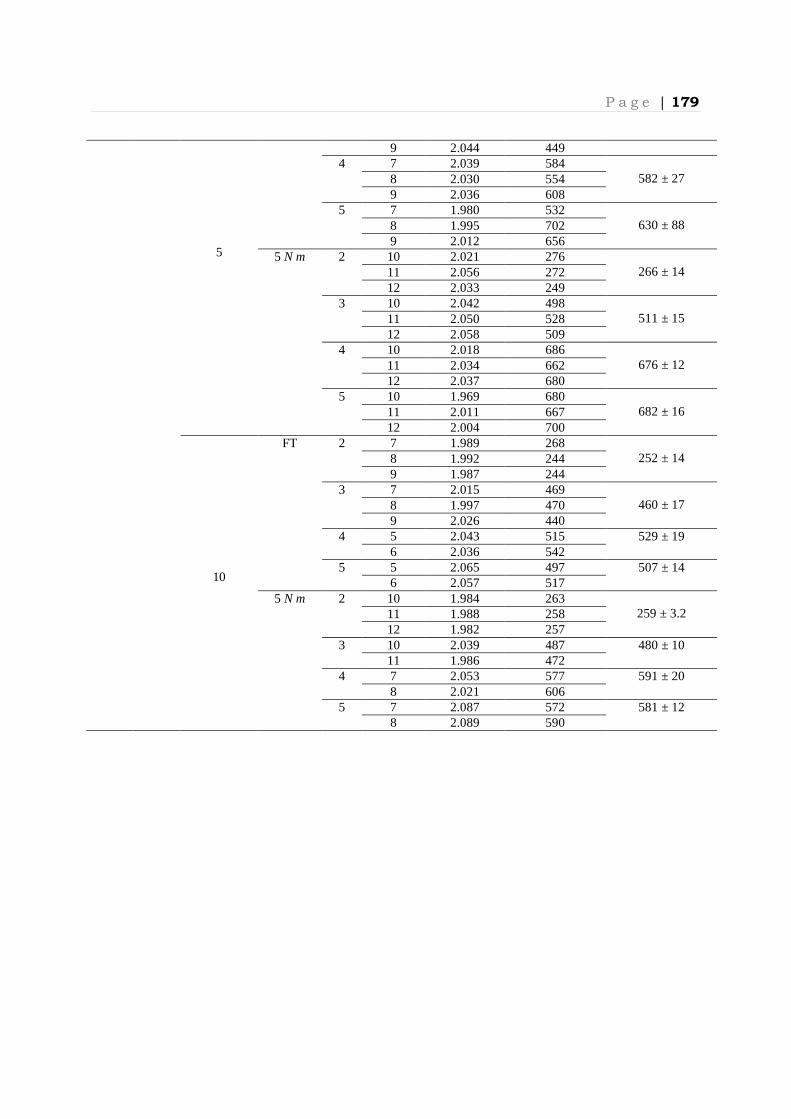
P a g e | 179
5
9 2.044 449 4 7 2.039 584
582 ± 27 8 2.030 554 9 2.036 608
5 7 1.980 532 630 ± 88 8 1.995 702
9 2.012 656 5 N m
2 10 2.021 276 266 ± 14 11 2.056 272
12 2.033 249 3 10 2.042 498
511 ± 15 11 2.050 528 12 2.058 509
4 10 2.018 686 676 ± 12 11 2.034 662
12 2.037 680 5 10 1.969 680
682 ± 16 11 2.011 667 12 2.004 700
10
FT 2 7 1.989 268 252 ± 14 8 1.992 244
9 1.987 244 3 7 2.015 469
460 ± 17 8 1.997 470 9 2.026 440
4 5 2.043 515 529 ± 19 6 2.036 542
5 5 2.065 497 507 ± 14 6 2.057 517
5 N m 2 10 1.984 263 259 ± 3.2 11 1.988 258
12 1.982 257 3 10 2.039 487 480 ± 10
11 1.986 472 4 7 2.053 577 591 ± 20
8 2.021 606 5 7 2.087 572 581 ± 12
8 2.089 590

P a g e | 180
A5: Experimental bearing stress at failure for 5X2
5 X
2
Joint type
Hole diameter, d
(mm)
Clamp- Up
W/d Sample no.*
Plate thickness, t
(mm)
Bearing stress at failure, �((þ/��ý)
Mean bearing stress, �((þ/��ý)
DLJ
5
FT 2 1 0.752 354 357 ± 2.1 2 0.799 357
3 0.800 358 3 1 0.803 518
495 ± 21 2 0.810 493 3 0.811 475
5 N m 2 4 0.805 424 442 ± 41 5 0.796 489
6 0.799 413 3 4 0.812 788
664 ± 83 5 0.789 626 6 0.816 631 13 0.807 612
10
FT 2 1 0.801 296 275 ± 22 2 0.810 278
3 0.778 251 3 1 0.803 350
364 ± 13 2 0.780 375 3 0.809 367
5 N m 2 4 0.783 358 336 ± 19 5 0.780 324
6 0.787 325 3 4 0.785 500
488 ± 26 5 0.794 457 6 0.804 506
SLJ
5
FT 2 7 0.807 357 344 ± 23 8 0.800 317
9 0.809 358 3 7 0.808 472
428 ± 42 8 0.783 387 9 0.802 427
5 N m
2 10 0.749 493 442 ± 48 11 0.798 436
12 0.812 397 3 10 0.786 615
648 ± 29 11 0.796 660 12 0.805 669
10
FT 2 7 0.783 281 272 ± 25 8 0.791 240
9 0.775 266 15 0.787 301
3 7 0.787 305 332 ± 46 8 0.808 304
9 0.790 385 5 N m 2 10 0.786 295
319 ± 25 11 0.780 346 12 0.786 316
3 10 0.796 453 428 ± 25 12 0.788 428

P a g e | 181
14 0.802 403

P a g e | 182
A6: Experimental bearing stress at failure for 5X4
5 X
4
Joint type
Hole diameter, d
(mm)
Clamp- Up
W/d Sample no.*
Plate thickness, t
(mm)
Bearing stress at failure, �((þ/��ý)
Mean bearing stress, �((þ/��ý)
DLJ
5
FT 2 1 1.571 352 330 ± 37 2 1.633 287
3 1.609 352 3 1 1.613 453
468 ± 26 2 1.607 454 3 1.648 499
5 N m 2 4 1.632 369 360 ± 9.8 5 1.563 358
6 1.634 366 13 1.636 347
3 4 1.642 611 605 ± 34 5 1.613 636
6 1.643 568
10
FT 2 1 1.585 263 261 ± 18 2 1.583 278
3 1.580 242 3 1 1.637 438
435 ± 7.4 2 1.622 441 3 1.643 427
5 N m 2 4 1.581 333 298 ± 36 5 1.575 261
6 1.564 301 3 4 1.630 451
441 ± 12 5 1.637 427 6 1.548 446
SLJ
5
FT 2 7 1.499 271 298 ± 46 8 1.587 356
9 1.617 312 14 1.642 251
3 7 1.628 487 491 ± 25 8 1.637 518
9 1.605 468 5 N m
2 10 1.619 370 389 ± 19 11 1.548 408
12 1.596 387 3 10 1.613 549
600 ± 40 11 1.635 588 12 1.633 636 13 1.644 628
10
FT 2 7 1.587 231 244 ± 11 8 1.600 250
9 1.594 251 3 7 1.638 411
411 ± 9.5 8 1.625 421 9 1.611 402
5 N m 2 10 1.598 298 296 ± 2.1 11 1.594 294
12 1.588 297 3 10 1.630 475

P a g e | 183
11 1.535 470 470 ± 5.0 12 1.638 465
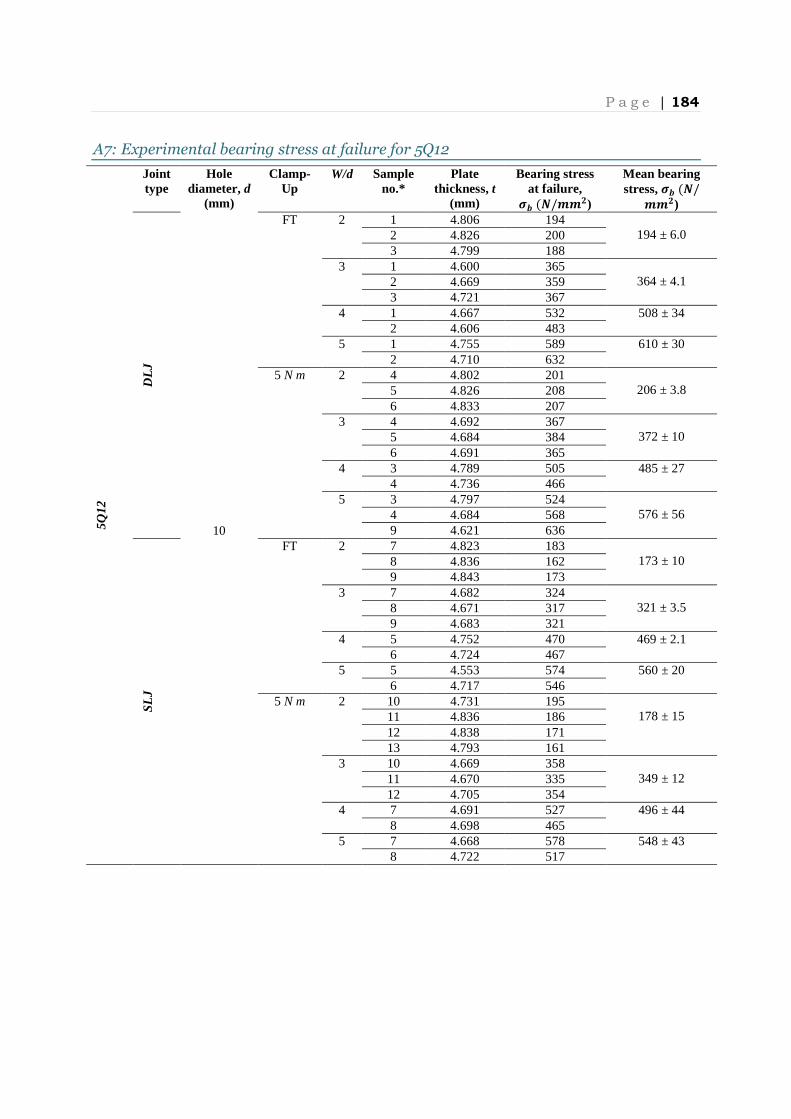
P a g e | 184
A7: Experimental bearing stress at failure for 5Q12
5Q12
Joint type
Hole diameter, d
(mm)
10
Clamp- Up
W/d Sample no.*
Plate thickness, t
(mm)
Bearing stress at failure, �((þ/��ý)
Mean bearing stress, �((þ/��ý)
DL
J
FT 2 1 4.806 194 194 ± 6.0 2 4.826 200
3 4.799 188 3 1 4.600 365
364 ± 4.1 2 4.669 359 3 4.721 367
4 1 4.667 532 508 ± 34 2 4.606 483
5
1 4.755 589 610 ± 30 2 4.710 632
5 N m 2 4 4.802 201 206 ± 3.8 5 4.826 208
6 4.833 207 3 4 4.692 367
372 ± 10 5 4.684 384 6 4.691 365
4 3 4.789 505 485 ± 27 4 4.736 466
5 3 4.797 524 576 ± 56 4 4.684 568
9 4.621 636
SLJ
FT 2 7 4.823 183 173 ± 10 8 4.836 162
9 4.843 173 3 7 4.682 324
321 ± 3.5 8 4.671 317 9 4.683 321
4 5 4.752 470 469 ± 2.1 6 4.724 467
5 5 4.553 574 560 ± 20 6 4.717 546
5 N m
2 10 4.731 195 178 ± 15 11 4.836 186
12 4.838 171 13 4.793 161
3 10 4.669 358 349 ± 12 11 4.670 335
12 4.705 354 4 7 4.691 527 496 ± 44
8 4.698 465 5 7 4.668 578 548 ± 43
8 4.722 517

P a g e | 185
Appendix B: Determination of out-of-plane elastic constants
B1: Cross-ply laminates
Now ZQ is constant then the thickness OQ� = ZQ�m −X�mZ.��� − X�mZ �̀��
OQ)� = ZQ�m −X�mZ.)��� − X�mZ)̀���
Effective stresses in z-direction, OQ* = OQ� +OQ)�2
OQ* = ZQ�Q = ZQ�m −12 �X�m�� ®Z.� +Z)̀�° +X�m�� ®Z.)� +Z �̀°�
Also have strain compatibility in the x- and y- direction, O.� =Z.��� − X��Z�̀�� − Xm�ZQ�m
O.)� = Z.)��� − X��Z )̀��� − X�mZQ�m
O�̀ = Z�̀�� − X��Z.��� − X�mZQ�m
O)̀� =Z)̀��� − X��Z.)��� − Xm�ZQ�m
As composite shows similar strain in each layer, O.� = O.)�,
ZQ
ZQ
0°
0° 90°
For equal thickness of 0’s and 90’s Z.� + Z.)� = 0 Z �̀ + Z)̀� = 0 .
Z.�, Z�̀
Z.)�, Z)̀�

P a g e | 186
Z.��� − X��Z �̀�� − Xm�ZQ�m = Z.)��� − X��Z)̀��� − X�mZQ�m
(A1)
Z�̀�� − X��Z.��� − X�mZQ�m = Z)̀��� − X��Z.)��� − Xm�ZQ�m
(A2)
From equilibrium as given by A1 and A2, Z.� = −Z.)� (A3) Z�̀ = −Z )̀�
(A4)
If we substitute (A3) and (A4) into (A1) and (A2), it should be possible to solve for Z.)�, Z)̀� in terms of ZQ, −Z.)��� + X��Z)̀��� + ZQ�m (X�m − Xm�+ = Z.)��� − X��Z )̀���
Z.)� k 1�� + 1��l − Z )̀� kX���� + X���� l = ZQ�m (X�m − Xm�+ (A5)
−Z)̀��� + X��Z.)��� − ZQ�m (X�m − Xm�+ = Z)̀��� − X��Z.)���
Z.)� kX���� + X���� l − Z )̀� k 1�� + 1��l = ZQ�m (X�m − Xm�+ (A6)
By inspection, Z.)� = Z �̀ Z)̀� = Z.�
OQ* = ZQ�Q = ZQ�m −X�m�� Z.� − X�m�� Z.)� = ZQ�m −X�m�� Z.� − X�m�� )−Z.�+ = ZQ�m +kX�m�� − X�m�� l Z.� Determination of �Q From (A5), Z.)� �� + ������ − Z )̀� 2X���� = ZQ�m (X�m − Xm�+ −Z.� k�� + ������ l − Z.� 2X���� = ZQ�m (X�m − Xm�+
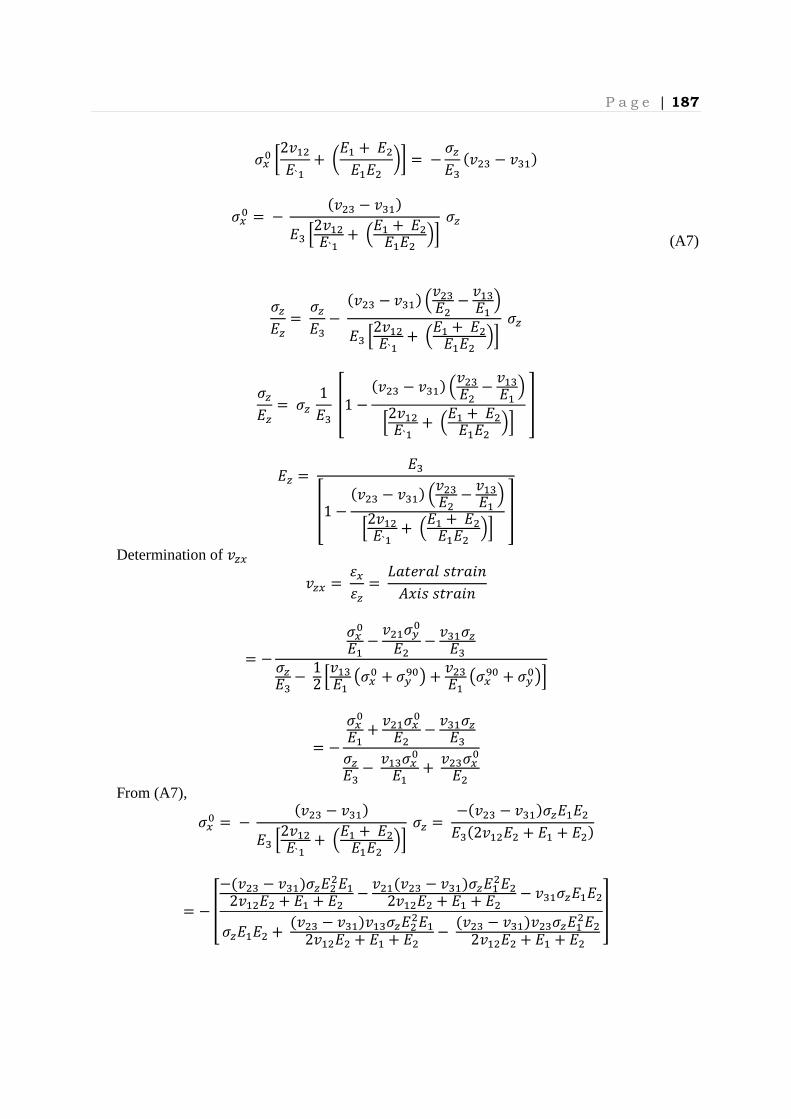
P a g e | 187
Z.� �2X���`� + k�� + ������ l� = − ZQ�m (X�m − Xm�+ Z.� = − (X�m − Xm�+�m Â2X���`� + ��� + ������ �à ZQ
(A7)
ZQ�Q = ZQ�m −(X�m − Xm�+ �X�m�� − X�m�� ��m Â2X���`� + ��� + ������ �à ZQ
ZQ�Q =ZQ 1�m ,1 − (X�m − Xm�+ �X�m�� − X�m�� �Â2X���`� + ��� + ������ �à -
�Q = �m,1 − (X�m − Xm�+ �X�m�� − X�m�� �Â2X���`� + ��� + ������ �à -
Determination of XQ. XQ. =O.OQ =8�E�2�9zE2�i;Ì*izzE2�i;
= − Z.��� − X��Z�̀�� − Xm�ZQ�mZQ�m − 12 ÂX�m�� ®Z.� + Z)̀�° + X�m�� ®Z.)� + Z�̀°Ã
= − Z.��� + X��Z.��� − Xm�ZQ�mZQ�m − X�mZ.��� + X�mZ.���
From (A7), Z.� = − (X�m − Xm�+�m Â2X���`� + ��� + ������ �à ZQ = −(X�m − Xm�+ZQ�����m)2X���� + �� + ��+
= − ,−)X�m − Xm�+ZQ�����2X���� + �� + �� − X��)X�m − Xm�+ZQ�����2X���� + �� + �� − Xm�ZQ����ZQ���� + (X�m − Xm�+X�mZQ�����2X���� + �� + �� − (X�m − Xm�+X�mZQ�����2X���� + �� + �� -
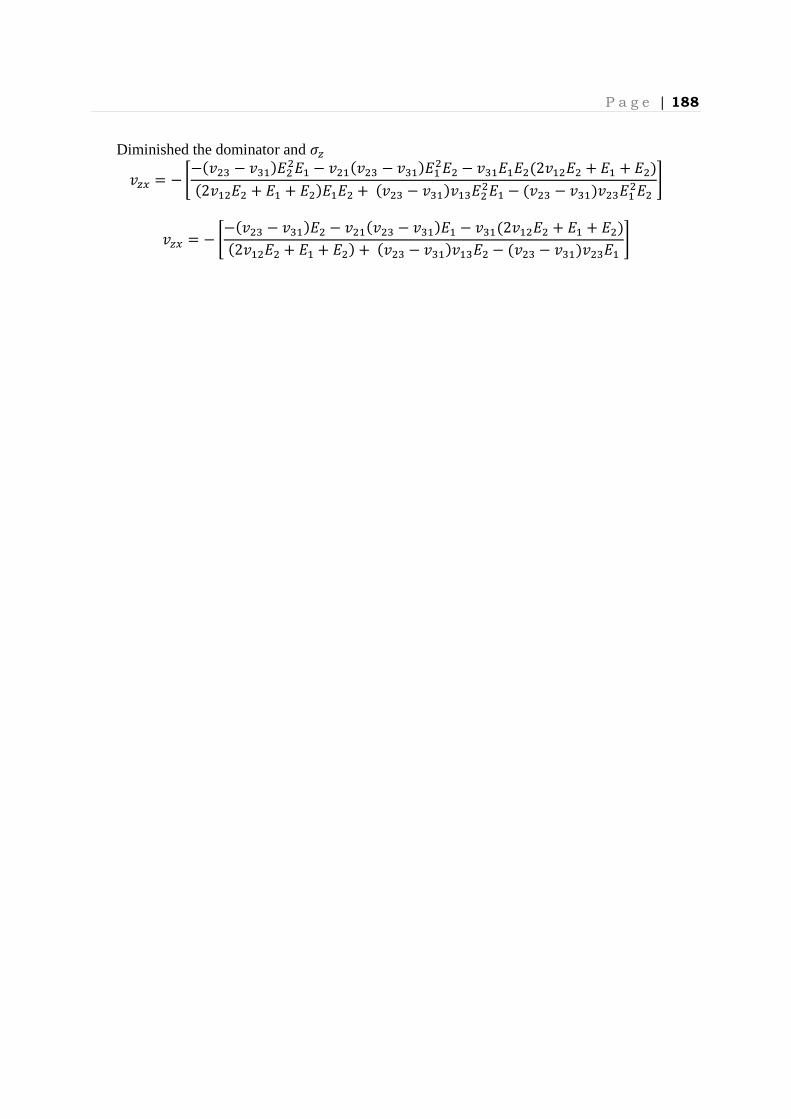
P a g e | 188
Diminished the dominator and ZQ XQ. = −«−(X�m − Xm�+����� − X��)X�m − Xm�+����� − Xm�����)2X���� + �� + ��+)2X���� + �� + ��+���� + (X�m − Xm�+X�m����� − )X�m − Xm�+X�m����� XQ. = − «−)X�m − Xm�+�� − X��)X�m − Xm�+�� − Xm�)2X���� + �� + ��+)2X���� + �� + ��+ + (X�m − Xm�+X�m�� − )X�m − Xm�+X�m��
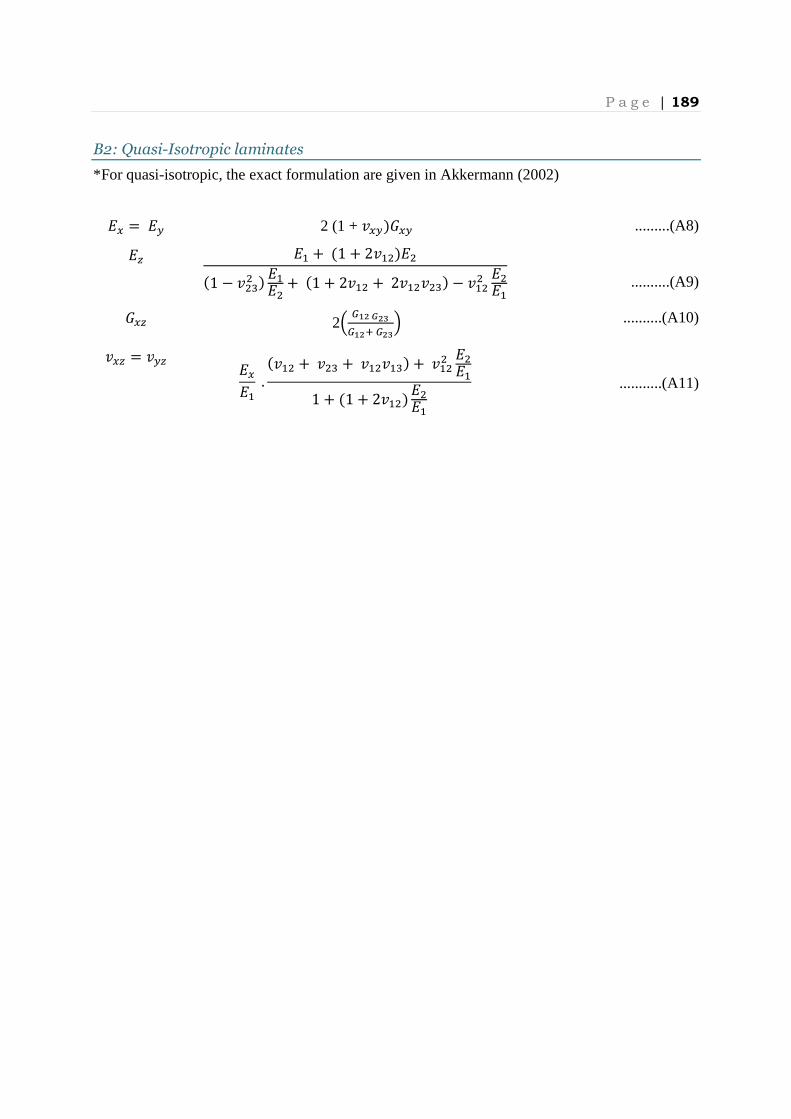
P a g e | 189
B2: Quasi-Isotropic laminates
*For quasi-isotropic, the exact formulation are given in Akkermann (2002)
�. = �` 2 (1 + X.`),.` .........(A8) �Q �� + (1 + 2X��+��)1 − X�m� + ���� + (1 + 2X�� + 2X��X�m+ − X��� ����
..........(A9)
,.Q 2� . Î/Î0. Χ.Î0� ..........(A10)
X.Q = X`Q �.�� . (X�� + X�m + X��X�m+ + X��� ����1 + )1 + 2X��+ ����
...........(A11)