NEW LIMITATION CHANGE TO - dtic. · PDF fileNEW LIMITATION CHANGE TO - dtic.mil ... unclassified

NAVAL POSTGRADUATE SCHOOL Monterey, California
THESIS
Approved for public release; distribution is unlimited.
RE-ENGINEERING THE ENROLLMENT MANAGEMENT SYSTEM AT THE MONTEREY PENINSULA UNIFIED
SCHOOL DISTRICT (MPUSD)
by
Stanley Dobbs
June 2001
Thesis Advisor: Samuel E. Buttrey Second Reader: Lyn R. Whitaker

Form SF298 Citation Data
Report Date("DD MON YYYY") 15 Jun 2001
Report TypeN/A
Dates Covered (from... to)("DD MON YYYY")
Title and Subtitle RE-ENGINEERING THE ENROLLMENT MANAGEMENTSYSTEM AT THE MONTEREY PENINSULA UNIFIEDSCHOOL DISTRICT (MPUSD)
Contract or Grant Number
Program Element Number
Authors Project Number
Task Number
Work Unit Number
Performing Organization Name(s) and Address(es) Naval Postgraduate School Monterey, CA 93943-5138
Performing Organization Number(s)
Sponsoring/Monitoring Agency Name(s) and Address(es) Monitoring Agency Acronym
Monitoring Agency Report Number(s)
Distribution/Availability Statement Approved for public release, distribution unlimited
Supplementary Notes
Abstract
Subject Terms
Document Classification unclassified
Classification of SF298 unclassified
Classification of Abstract unclassified
Limitation of Abstract unlimited
Number of Pages 108

i
REPORT DOCUMENTATION PAGE Form Approved OMB No. 0704-0188 Public reporting burden for this collection of information is estimated to average 1 hour per response, including the time for reviewing instruction, searching existing data sources, gathering and maintaining the data needed, and completing and reviewing the collection of information. Send comments regarding this burden estimate or any other aspect of this collection of information, including suggestions for reducing this burden, to Washington headquarters Services, Directorate for Information Operations and Reports, 1215 Jefferson Davis Highway, Suite 1204, Arlington, VA 22202-4302, and to the Office of Management and Budget, Paperwork Reduction Project (0704-0188) Washington DC 20503. 1. AGENCY USE ONLY (Leave blank)
2. REPORT DATE June 2001
3. REPORT TYPE AND DATES COVERED Master’s Thesis
4. TITLE AND SUBTITLE: Re-engineering the Enrollment Management System at the Monterey Peninsula Unified School District (MPUSD) 6. AUTHOR(S) Stanley Dobbs
5. FUNDING NUMBERS
7. PERFORMING ORGANIZATION NAME(S) AND ADDRESS(ES) Naval Postgraduate School Monterey, CA 93943-5000
8. PERFORMING ORGANIZATION REPORT NUMBER
9. SPONSORING / MONITORING AGENCY NAME(S) AND ADDRESS(ES) Monterey Peninsula Unified School District (MPUSD) 700 Pacific Street, Monterey, CA 93940 (831)-649-1592
10. SPONSORING / MONITORING AGENCY REPORT NUMBER
11. SUPPLEMENTARY NOTES The views expressed in this thesis are those of the author and do not reflect the official policy or position of the Department of Defense or the U.S. Government.
12a. DISTRIBUTION / AVAILABILITY STATEMENT Approved for public release; distribution is unlimited
12b. DISTRIBUTION CODE
13. ABSTRACT (maximum 200 words)
This thesis establishes a Forecasting Enrollment Management (FEM) system within the Monterey Peninsula Unified School District (MPUSD). In particular, it examines the effect the forecasting of student enrollment since the untimely departure of the Deputy Superintendent (DepSup) who had performed the function as Chief Enrollment Official for over two decades. The closure of the Fort Ord Army Facility had a significant impact on the accuracy of enrollment projections and inadvertently affected the funding for special program allocations and staffing. The MPUSD has within its control twenty-three schools that service over 12,000 students each year using public funds. Four schools are located within military housing communities and typically service the school-age military dependents residing nearby. Each year’s funding is determined by an estimate projected from the previous year’s enrollment. The District is required to provide a budget request by April 15th of each school operating year. The school district currently has no computational model adequate for projecting student enrollment; MPUSD uses a working group process to achieve its objective. A model that can more precisely project the number of students in each future year is developed; it can provide a more efficient enrollment management process and provide the necessary checks and balances for the current method. The thesis considers independent community related variables and historical data, and shows that prior-year enrollment figures can forecast future -year enrollment projections with smaller variance than the current working group method.
15. NUMBER OF PAGES
108
14. SUBJECT TERMS Enrollment, Enrollment Management, Forecasting, Data Analysis, Data Collection, Process Engineering, Quality Assurance, Continuous Process Improvement
16. PRICE CODE
17. SECURITY CLASSIFICATION OF REPORT
Unclassified
18. SECURITY CLASSIFICATION OF THIS PAGE
Unclassified
19. SECURITY CLASSIFICATION OF ABSTRACT
Unclassified
20. LIMITATION OF ABSTRACT
UL NSN 7540-01-280-5500 Standard Form 298 (Rev. 2-89) Prescribed by ANSI Std. 239-18

ii
THIS PAGE INTENTIONALLY LEFT BLANK

iii
Approved for public release; distribution is unlimited
RE-ENGINEERING THE ENROLLMENT MANAGEMENT SYSTEM AT THE MONTEREY PENINSULA UNIFIED SCHOOL DISTRICT (MPUSD)
Stanley Dobbs Lieutenant Commander, United States Navy
B.S., University of Memphis, 1991 M.B.A., Florida Institute of Technology, 1999
Submitted in partial fulfillment of the requirements for the degree of
MASTER OF SCIENCE IN OPERATIONS RESEARCH
from the
NAVAL POSTGRADUATE SCHOOL June 2001
Author: ____________________________________________ Stanley Dobbs
Approved by: _____________________________________________ Samuel E. Buttrey, Thesis Advisor
_____________________________________________ Lyn R. Whitaker, Second Reader
_____________________________________________ James N. Eagle, Chairman
Department of Operations Research

iv
THIS PAGE INTENTIONALLY LEFT BLANK

v
ABSTRACT
This thesis establishes a Forecasting Enrollment Management (FEM) system
within the Monterey Peninsula Unified School District (MPUSD). In particular, it
examines the effect the forecasting of student enrollment since the untimely departure of
the Deputy Superintendent (DepSup) who had performed the function as Chief
Enrollment Official for over two decades. The closure of the Fort Ord Army Facility had
a significant impact on the accuracy of enrollment projections and inadvertently affected
the funding for special program allocations and staffing. The MPUSD has within its
control twenty-three schools that service over 12,000 students each year using public
funds. Four schools are located within military housing communities and typically
service the school-age military dependents residing nearby. Each year’s funding is
determined by an estimate projected from the previous year’s enrollment. The District is
required to provide a budget request by April 15th of each school operating year. The
school district currently has no computational model adequate for projecting student
enrollment; MPUSD uses a working group process to achieve its objective. A model that
can more precisely project the number of students in each future year is developed; it can
provide a more efficient enrollment management process and provide the necessary
checks and balances for the current method. The thesis considers independent
community related variables and historical data, and shows that prior-year enrollment
figures can forecast future-year enrollment projections with smaller variance than the
current working group method.

vi
THIS PAGE INTENTIONALLY LEFT BLANK

vii
TABLE OF CONTENTS
I. INTRODUCTION........................................................................................................1 A. RESEARCH PROBLEM ................................................................................1 B. BACKGROUND ..............................................................................................3 C. RESEARCH OBJECTIVE .............................................................................5
II. LITERATURE REVIEW ...........................................................................................7 A. OVERVIEW.....................................................................................................7 B. MPUSD .............................................................................................................9 C. FEDERAL IMPACT AID (PL 81-874 & PL 81-815) .................................11 D. BIRTH RATES ..............................................................................................14 E. CENSUS 2000 .................................................................................................14 F. GOODWILL ..................................................................................................16 G. WATER...........................................................................................................16 H. ENROLLMENT MANAGEMENT .............................................................18 I. SUMMARY....................................................................................................20
III. METHODOLOGY ....................................................................................................23 A. ENROLLMENT DATABASE......................................................................23
1. Description of the MPUSD Database...............................................23 2. MPUSD Feeder Matrix......................................................................24 3. Data Extraction/Database Formulation...........................................26
B. ANALYSIS OF DEMOGRAPHIC TRENDS .............................................26 C. SPECIAL OR UNIQUE SITUATIONS.......................................................27 D. ANALYSIS PROCEDURE...........................................................................27
1. Enrollment Projection Methods .......................................................27 2. Grade-Level Progression Cohort Analysis ......................................27 3. Regression Analysis ...........................................................................28 4. Exponential Weighted Moving Average (EWMA) .........................28 5. Time Series Analysis ..........................................................................29
a. Using Forecasting Enrollment Management (FEM) Model .......................................................................................32
b. Using Insight XLA EXCEL Add-in Package.........................35 E. CONVERTING ENROLLMENT TO ADA................................................44
IV. RESULTS ...................................................................................................................47 A. DESCRIPTIVE STATISTICS......................................................................47
1. Summary Enrollment Statistics ........................................................47 2. Statistical Analysis .............................................................................48
V. RECOMMENDATIONS AND FOLLOW UP........................................................57 A. RECOMMENDATIONS...............................................................................57
1. Process Improvement ........................................................................63 B. SUPPLEMENTAL RECOMMENDATIONS.............................................66

viii
C. FOLLOW-UP.................................................................................................68
APPENDIX A. MPUSD MASTER DATABASE...............................................................71
APPENDIX B. FEM METHOD ON A SPREADSHEET.................................................73
APPENDIX C. FORECAST.XLA ON A SPREADSHEET..............................................77
APPENDIX D. FEM MPUSD ENROLLMENT OUTPUT ..............................................79
APPENDIX E. FEM MPUSD STAFFING OUTPUT .......................................................81
APPENDIX F. ACTUAL BIRTHS MPUSD BY ZIP CODE ...........................................83
LIST OF REFERENCES ......................................................................................................85
INITIAL DISTRIBUTION LIST.........................................................................................87
ix
LIST OF FIGURES Figure 3.1. MPUSD Enrollment Feeder Matrix. ................................................................25 Figure 3.2. Time Series Graph of Trouble Calls. ...............................................................30 Figure 3.3. Advantages and Disadvantages of the Forecast Models. .................................31 Figure 3.4. Forecasting Enrollment Management (FEM) Model.......................................32 Figure 3.5. FORECAST.xla Menu and Dialog Box. ..........................................................36 Figure 3.6. RUN FORECAST Dialog Box. .......................................................................36 Figure 3.7. Forecast Graph Using Two-Parameter Smoothing. .........................................38 Figure 3.8. Numbers Dialog Box. ......................................................................................39 Figure 3.9. Deseason Dialog Box. ......................................................................................39 Figure 3.10. Optimized Smoothing Data..............................................................................40 Figure 3.11. Optimized Forecast Graph. ..............................................................................41 Figure 4.1. MPUSD Enrollment Percentages.....................................................................49 Figure 4.2. MPUSD Audited Budget Section Values, Section J-201R. .............................50 Figure 4.3. MPUSD Birth (MCHD, 2001). ........................................................................51 Figure 4.4. Monterey Peninsula Population by the Numbers: Census 2000 (Herrera,
2001). ...............................................................................................................52 Figure 4.5. Goodwill Variable (MPUSD, 2001). ...............................................................54 Figure 5.1. Quality Assessment Group Structure. ..............................................................60 Figure 5.2. Improvement Cycle Methodology. ..................................................................65

x
THIS PAGE INTENTIONALLY LEFT BLANK

xi
LIST OF TABLES Table 3.1. Number of Trouble Calls for Alpha Technical Services (ATS). .....................30 Table 4.1. Forecast Model Output Enrollment Errors. .....................................................48

xii
THIS PAGE INTENTIONALLY LEFT BLANK

xiii
ACKNOWLEDGMENTS
The author would like to acknowledge and express appreciation to my thesis
committee members, Professor Samuel Buttrey, Military Instructor CDR Kevin Maher,
Professor Lyn R. Whitaker and Professor Gordon Nagakawa for their assistance,
direction and dedication throughout this endeavor and to the Reference Librarians that
went beyond the call of service to locate necessary materials.
Gratitude is expressed also to Professor Samuel Buttrey for his never-ending
fountain of knowledge in statistical analysis, entertaining discussions and willingness to
always help a student and Professor Arnie Buss for his guidance and wisdom throughout
the graduate education process.
To the Kappa Alpha Lambda Chapter of Alpha Phi Alpha (AΦA) Fraternity,
Incorporated of Monterey, thank you for your ninety - five year commitment to the
preservation of manly deeds, scholarship, and love for all mankind in your quest for
continuous youth development. Your financial support made this project possible and
assisted greatly in regaining the community trust in public education.
To Dr. Robert Infelise and Mrs. Irene Hufford for having the professional courage
to ask for assistance on matters that pertained to the welfare and stability of the school
district. They put their responsibilities to the community before self and as a result the
MPUSD is on track to becoming one of America's success stories in public school
financial reform and community-based dedication. It has been said that it takes a village
to raise a child, but the committed school district leadership team that guarantees that
child's quality education is often overlooked.

xiv
THIS PAGE INTENTIONALLY LEFT BLANK

xv
DEDICATION
To my four wonderful blessings, Fentrice, Nia, Naomi and Niles who often
questioned why Daddy had so much schoolwork to do, you are my joy and I love you all
more than you can realize. To my Mother and family who have supported me my entire
life and continue to do so, once again I humbly say I am glad God put me in this family
and I will never forget your support and love. To Jesus Christ, my Lord and Savior, I
will continue to endure the trials and tribulations, as long as you continue to walk beside
me. Thanks for the long walks through the halls of the Naval Postgraduate School
Department of Operations Research. Amen!
To Brother Robert Holmes, the first African-American United States Navy
Supply Corps Officer to nearly complete the Operations Analysis 360 curriculum thanks
for paving the way for others to pursue this noteworthy endeavor.

xvi
THIS PAGE INTENTIONALLY LEFT BLANK

xvii
EXECUTIVE SUMMARY
Fort Ord was slated for base closure in 1991 and eventually closed three years
later around September 30, 1994. The military retained part of the base for housing staff
and students at the Defense language Institute and the Naval Postgraduate School. About
15 percent of the military and civilian personnel lived off base, primarily in the adjoining
cities of Marina, Monterey, Salinas, Seaside, and Pacific Grove.
The ability to accurately estimate the projected enrollment and the Average Daily
Attendance (ADA) for the ensuing school year at the Monterey Peninsula Unified School
District’s (MPUSD) is an annual challenge to be faced. The major source of revenue to
the district is the base revenue limit per ADA. The revenue limit per ADA is the
equivalent to the amount of funds provided by public sources to educate one child for one
school year. The major expenditure of the district is the salary and benefit costs for
staffing. Consequently, estimates of income and expenditures depend on the accuracy of
the enrollment projections and accurate projections are vital to the on-going financial
well-being of the school district. The fragmented departure of Fort Ord personnel and
families during the school year instead of during the summer months as planned caused a
dramatic deficit for the MPUSD from which it has not properly recovered.
This thesis establishes a Forecasting Enrollment Management (FEM) system
within the Monterey Peninsula Unified School District (MPUSD). In particular, it
examines the effect the forecasting of student enrollment since the untimely departure of
the Deputy Superintendent (DepSup) who had performed the function as Chief
Enrollment Official for over two decades. The closure of the Fort Ord Army Facility had

xviii
a significant impact on the accuracy of enrollment projections and inadvertently affected
the funding for special program allocations and staffing. The MPUSD has within its
control twenty-three schools that service over 12,000 students each year using public
funds. Four schools are located within military housing communities and typically
service the school-age military dependents residing nearby. Each year’s funding is
determined by an estimate projected from the previous year’s enrollment. The District is
required to provide a budget request by April 15th of each school operating year. The
school district currently has no computational model adequate for projecting student
enrollment; MPUSD uses a working group process to achieve its objective. A model that
can more precisely project the number of students in each future year is developed; it can
provide a more efficient enrollment management process and provide the necessary
checks and balances for the current method. The thesis considers independent
community related variables and historical data, and shows that prior-year enrollment
figures can forecast future-year enrollment projections with smaller variance than the
current working group method.
In addition, this thesis is to provide a low-cost scientific model (mathematical,
computational, and programmable) for analysis and forecasting enrollment projections.
This output will then be used to project the student enrollment and the level of personnel
staffing for the ensuing school year. The user will be able to simply compute the
required enrollment figures for each school by grade using the Forecasting and
Enrollment Management (FEM) Model program, the newly established FEM database
and an existing Commercial Off The Shelf (COTS) software program named
FORECAST.XLA that will calculate the next twelve data points in the forecast. This

xix
information will support the District’s efforts to maintain solvency by incorporating
current forecasting technology into their management decision process.

1
I. INTRODUCTION A. RESEARCH PROBLEM
The purpose of this thesis was to use basic operations research techniques to
reverse engineer the unrecorded enrollment management process used by the late Deputy
Superintendent (DepSup) at Monterey Peninsula Unified School District (MPUSD) or to
establish a process within the guidelines of the California Association of School Business
Officer (CASBO) regulations. In addition, a computational model was to be developed
to perform the enrollment forecasting procedures necessary to provide increased accuracy
and reduced variance within the process.
In the summer of 2000, a blue ribbon commission was established by the
Monterey School Board of Education to investigate allocations of insolvency at the
MPUSD. Several commission members came from the academia of Monterey including
the Naval Postgraduate School (NPS). The Operations Research Department’s Curricular
Officer was contacted regarding a forecast modeling project. The author was selected to
solve the problem by the Curricular Officer and began work. The MPUSD required a
forecasting model that was multi- functional. The model needed to be able to provide the
following services:
• Project student enrollment for any grade at any school for at least one year (twelve periods) in the future
• Provide the necessary staffing assignments by school and grade
• Use existing hardware and software systems
• Provide a scalable and portable database management system with the following attributes:

2
Ø Low-cost or no-cost
Ø Easy to train existing personnel for use
Ø Developed, tested and operational before the 15th April deadline for submission of budget requests to the California Department of Education
What MPUSD was truly requesting was an enrollment management system.
Since the current process did not include any computer-readable historical records, a
database was created from volumes of data of written reports stored since the 1994 base
closure of Fort Ord.
The ability to accurately estimate the projected enrollment and the Average Daily
Attendance (ADA) for the ensuing school year at the Monterey Peninsula Unified School
District (MPUSD) is an annual challenge to be faced. The major source of revenue to the
district is the base revenue limit per ADA. The base revenue limit per ADA is the
equivalent to the amount of funds provided by the state authorities to educate one child
for one school year. The major expenditure of the district is the salary and benefit costs
for staffing. Consequently, a suitable estimate for budgeting depends on the accuracy of
the enrollment projections and is vital to the on-going financial well-being of the school
district. The accuracy of the proposed budget is based on the level of accuracy of the
prior year’s projected enrollment estimates.
The base closure of Fort Ord in 1994 removed from the District’s coffers vital
supplemental Federal dollars that previously had substantially subsidized the thriving
District’s fiscal operations. In 1999, the unexpected retirement and death of the Deputy
Superintendent (DepSup) who had served as the Chief Financial, Enrollment and
Business Officer created a void in the level of corporate knowledge for forecasting and

3
budgeting processes. Since the DepSup had worked independently for nearly twenty-
seven years, the new learning curve for enrollment management was very steep. As a
result, the attempted forecast was much too low enrollment for school year 2000-2001
was significantly under-forecasted. Because of the level of communication between the
MPUSD staff and the DepSup, short-term analysis revealed that the management team at
MPUSD had an understanding of the term “forecasting” as it pertained to student
enrollment different from the mathematical denotation. At MPUSD, the enrollment
management process included and was responsible for projections related to student
enrollment, staff manning levels and initial budget formulation, but it was simply referred
to as enrollment forecasting. As a result, the thesis was expanded to include the
reengineering of the enrollment management process that included deve lopmental
training, auditing, process controls and new technology implementation.
B. BACKGROUND
Enrollment projections determine both the revenue and staffing patterns of the
district. As any projection is based on analyzing historical data and determining trends in
that data, the consistent and timely gathering of base data is essential. Selecting a
particular month of the school year for comparison purposes is critical to the accuracy of
the projection. Enrollment data for a specific month (e.g., the second school month) plus
the resulting First Period (P-1, day 71 of 180 days) and Second Period (P-2, day 131 of
180 days) attendance figures are used to project the estimated ADA as a percent of
enrollment for the upcoming year (CASBO, 1998). The monthly attendance values are
used as indicators for trend analysis.

4
The enrollment projections need to be made early in the budget planning cycle to
allow for staffing flexibility. Preliminary estimates made in December or January are
reviewed in April or May and again during the summer to be sure that adequate staffing
has been provided and that the estimated ADA for revenue purposes provides an accurate
projection of income for the district for the coming year. (CASBO, 1998) MPUSD
reviews are in December and April.
Forecasting is the prediction, projection, or estimation of the occurrences of
uncertain future events or levels of activity. (Tersine, 1994) The staff responsible for
projecting enrollment should take into consideration the following key points relative to
forecasting:
• That which has happened in the past should be considered likely to recur
• By searching past occurrences, one may find regularities that can be used to predict the future
• By analyzing variables, the district can discover what relationship these variables will have on the forecast
After the enrollment data has been collected and the historical data has been
arranged by such factors as “years,” “school month,” “grade level,” “date of birth” of
entering student, and so on, a time series analysis may be used to examine the data.
A time series analysis considers the following components:
• Secular Trend (Long-Term Movement) – refers to the general direction or trend of enrollments over a long period of time
• Seasonal Variation – refers to those patterns that appear at regular intervals in a series, such as a comparison of “School Month Two” to “School Month Ten” of each year. These movements are generally recurring annual events (CASBO, 1998).
• Cyclical Variation – refers to relatively long-term patterns around the trend line. Cycles may or may not follow regular patterns and are described as cycles only if they are repeated (Savage, 1998).

5
• Irregular or Random Variation – refers to small random movements or large variations in an enrollment pattern due to chance events that will likely not recur, such as strikes, weather conditions, and school closure (these affect the school-by-school historical comparisons.) These events cannot be systematically analyzed; however, they must be accounted for in the future projections, and allowances must be made for possible future recurrence (CASBO, 1998).
C. RESEARCH OBJECTIVE
The objective of this thesis is to provide a low-cost scientific model
(mathematical, computational, or programmable) for analyzing and forecasting
enrollment projections as they relate to the enrollment management process. This output
will then be used to project the student enrollment and the level of personnel staffing for
the ensuing school year which completes the forecasting and enrollment process. The
user will be able to simply compute the required enrollment figures for each school by
grade using the Forecasting and Enrollment Management (FEM) Model program, the
newly established FEM database and an existing Commercial Off The Shelf (COTS)
software program named FORECAST.XLA that will calculate the next twelve data points
in the forecast. This decision support information will support the District’s efforts to
maintain solvency by implementing technology into their management decision process.
In addition, the reengineered enrollment management process will provide the level of
accuracy required to maintain fiscal controls and optimal operational efficiency. By
using management science techniques, the MPUSD will maximize efficiency with its
operations. Though there was no internal budget for this project, this thesis action was
formally requested by the School Board appointed Blue Ribbon Commission and funded
in part by a local community service organization Alpha Phi Alpha Fraternity of the
Monterey Peninsula.

6
Chapter II contains a literature review of the nature of the problem. In Chapter
III, the methodology used to study this problem is discussed. Chapter IV presents the
results of this study in detail. Lastly, Chapter V's conclusions include findings and
recommendations.

7
II. LITERATURE REVIEW A. OVERVIEW
One of the most politically contentious adjustments to the decline in defense
spending after the end of the Cold War has been the subject of military base closures.
While the decline in military force structure and in weapons procurement has largely
been a matter for the Department of Defense to decide, the question of which military
bases to close was deemed too sensitive to be left to traditional legislative decision
channels (Schmitt, 1993). Instead, the Base Realignment and Adjustment Commission
(BRAC) was established in order to shield the process from political influences (Dardia,
1996).
Much of this sensitivity is due to concern for the fate of the communities
surrounding the closed bases; such concerns are understandable in light of the fact that in
many of these communities the base personnel – both military and civilian – represent a
significant share of local employment and population. Even communities with promising
alternative uses for the local base seem wary of the immediate effects of the closures,
with its loss of civilian jobs and service members’ local purchases. While the long-run
experience with closed bases seems benign (Office of Economic Adjustment, 1993), little
is known about the size or distribution of the more immediate impacts of base closures.
If the effects are adverse, they should be most severe immediately after the closure,
before there is time for labor markets to adjust and for the compensatory effects of base
reuse to come into play. One such community is the one surrounding Fort Ord.

8
Fort Ord was located in Monterey County, adjacent to Monterey Bay, on
California’s Central Coast. It was the home of the Army’s 7th Infantry Division and was
designated as a major training center. It was used extensively during the Vietnam War for
training infantrymen. Fort Ord also provided support and administrative services to other
military facilities in the region, including Fort Hunter Liggett, the Presidio of Monterey
(which houses the Defense Language Institute (DLI)), the Naval Postgraduate School
(NPS), and a Coast Guard station.
Fort Ord was slated for base closure in 1991 and eventually closed three years
later around September 30, 1994. The military retained part of the base for housing staff
and students at the Defense language Institute and the Naval Postgraduate School. About
15 percent of the military and civilian personnel lived off base, primarily in the adjoining
cities of Marina, Monterey, Salinas, Seaside, and Pacific Grove (Dardia, 1996).
Fort Ord’s presence in Monterey County added another element to what was
already one of the most disparate counties in the state, combining the affluent retirement
and recreation centers of Carmel and the Monterey peninsula, the increasingly
professional population of Monterey, the more blue-collar communities of Seaside and
Marina, and the growing agricultural center of Salinas. Since the closure of Fort Ord, the
surrounding housing prices have climbed dramatically, especially for the Seaside
Community; unemployment is virtually non-existent; and the number of housing units is
insufficient to meet current demand. Economic impact studies projected the only actual
decline to be found in the K–12th grade student enrollment within the MPUSD (RKG
Associates, 1992). K–12th grade student enrollments were projected to decrease by as
much as 32% (Dardia, 1996). The actual decrease was 30% in the first year alone. In the

9
2001 school year, the financia l impacts generated by that substantial decrease in
enrollment are still evident.
Sections B through H will highlight some major contributing variables to the
overall calculations within the forecasting enrollment management process and their
ancillary impact on the community and the decision makers at MPUSD.
B. MPUSD
In the Summer of 2000, the MPUSD reported a possible budgeting deficit
estimated to be in the millions of dollars. In August of 2000, the Monterey Herald
newspaper released a three-part series that highlighted the issues that led to the potential
financial insolvency position of the MPUSD. The story explained in vivid detail how the
solvency issue began and its relationship to the Fort Ord base closure. An estimated
funding deficit of an estimated $6.5 million, approximately 10 percent of the total budget,
was reported. The problem had its roots years earlier, when the district income shrank by
tens of millions of dollars with the closing of Fort Ord, but spending continued relatively
unabated (Friedrich, 2000). The shrinking income was due to a lost of Federal Impact
Aid (PL 874), a subsidy paid by the federal government to local school districts for the
burden of educating the children of military and civil services children. Details on Public
Law 874 and Federal Impact Aid will be discussed later in Section C. The deficit forced
the district to lay off more than 100 personnel, including more than 70 teachers, and
instantly dropped millions of dollars of programs including MAGNET, GATE (Gifted
and Talented Education), music and alternative teen parenting. Enrollment and staffing
are among the most critical elements in a school district budget. Accurately projecting
how many students will enroll in the district is the key to calculating state revenue - the

10
bulk of a district’s income. Additionally, keeping unbudgeted employees off the payroll
is the key to keeping costs down, because salaries make up about 85 percent of a
district’s expenses. (Freidrich, 2000) When Fort Ord closed in 1994, 25 percent of the
district's revenue went with it in the form of lost ADA and Federal Impact Aid. In
addition, the district lost approximately 3,400 students and 322 employees. Four schools
on post were closed. To cushion the impact of the drastic decrease in income, the district
requested an $11 million loan under a provision of state AB 160, which was a program
designed to assist districts suffering because of military base closures. The repayment of
the loan coupled with the vastly decreased enrollment and associated loss of ADA and
Impact Aid income nearly put the district in an insolvent condition six years after the
base closure of Fort Ord.
The program closures that affected the military communities of La Mesa and Old
Fort Ord military communities the most were the loss of the GATE and MAGNET
programs. The GATE program allowed gifted students, identified through testing and
recommended by a teacher, to go beyond the basic curriculum and develop higher- level
thinking skills. Without funding for the GATE programs, affected schools have searched
for alternatives. One military community school, Fitch Middle School, has developed a
program called “Great Explorations” that allows seventh- and eighth-graders of all
abilities to learn about county history through poetry, reading, art and drama. But
educators are concerned that the substitute program is not challenging enough for the
brighter students (Duman, 2000).
The loss of the MAGNET programs at La Mesa and Ord Terrace Elementary
Schools left the district with no program that specializes in advanced exposure to math,

11
science, and computers. The MAGNET math, science and technology programs not only
broadened diversity at the two schools by bringing in children from other schools, but
they also gave students at La Mesa and Ord Terrace Elementary in Seaside a chance to
immerse themselves in science and technology (Duman, 2000). The majority of the
students in the program were military dependents. Military parents who can afford the
additional expense may well engage their bright children with extracurricular activities,
or by sending their children to private schools. But those families which cannot afford
the extended financial burden will not receive any financial assistance to ensure that their
gifted children are challenged. As more military parents shift their children to private or
home schooling, the result will be fewer candidates for Federal Impact Aid (PL 874). The
result will be a public school system funded at lower levels. This problem places the
quality of military children’s education at the economic level of the military member.
This dilemma may pose an unfair advantage for those members forced to rely on the local
public school system while stationed on the Peninsula in the future.
C. FEDERAL IMPACT AID (PL 81-874 & PL 81-815)
Monitoring Federal Impact Aid eligibility and disbursements can give advanced
insight into funding shortages within the district. One of the highest priorities for a
military family when moving to a new installation is the quality of education that is
available to its children. Congress recognized that federal military activities were having
an adverse effect on some local school districts’ ability to raise revenue by executing
federal employees local tax exemption rights. In addition, Congress was concerned that
the children of military personnel should have adequate funds for their education. In
1950, Congress passed PL-81-874 (Impact Aid for Operating Expenses) and PL 81-815

12
(Impact Aid for Construction) in order to assist local schools affected by federal
activities. These two laws were designed to make up for the financial losses of having a
federal installation nearby may have caused many local schools. Later, other types of
federal students were added to the program. These students included Indian Land
students, Low Rent Housing students, and students whose parents work on federal
property. In 1994, Congress reauthorized these Impact Aid laws as Title VIII of PL 103-
382. In doing so, PL 81-874 and PL 81-815 were repealed. Federal Impact Aid was
amended again in October 2000.
Federal Impact Aid is one of the only federal education programs where funds are
sent directly to the school district, and thus there is almost no bureaucracy or regulatory
oversight. As a result, the funds are used for the education of all students, and there is no
“rake-off” by states or federal government to fund bureaucrats. In addition, these funds
go into the general fund, and may be used as the local school district decides. There are
“no strings attached” to the funds, and they may be used for any purpose within the
guidelines of state law (NMISA, 2001).
Impact Aid is necessary because of the uncollectible tax revenue or opportunity
loss for the area by federal exemptions. A non-federally impacted school has three main
sources of revenue for each student. In theory, state aid amounts to about 50% of the
total revenue, and local taxes account for the other 50%. The local portion of school
revenue is made up of two main parts: (1) taxes on local businesses amount to about 25%
of the total, and (2) local property taxes on homes account for the remaining 25%. When
businesses are located on federal land, they are exempt from local taxes. In the case of
the military, in addition to the services and commercial activities provided on federal

13
property, the Soldiers and Sailors Relief Act exempts those personnel from local personal
property taxes and any state income taxes. In theory, the result is that 25% of the school
district's revenue is lost when a base closes. In cases where homes are located on federal
property, residents are exempted from local taxes. As a result, the school district has lost
25% of its revenue that would otherwise have been collectable. Sometimes, both
students’ homes and the place of business of their parents are located on federal property.
Both are exempt from local taxation. In theory, the school district loses all the local
sources of revenue for these children, and only state aid (50% of the normal total
revenue) is available (NMISA, 2001). For example, since the closing of Fort Ord,
MPUSD has suffered a 90 percent decrease in PL874 funding from 1994 to 2000
amounting to loss revenue of an average $4.7 million dollars per year.
Department of Defense Supplemental Impact Aid Funding, which is different
from the Federal Impact Aid, began in FY'91. The funding was established to help
school districts with significant concentrations in military students to compensate for (1)
a lack of adequate funding for over a decade, (2) challenges associated with base
closures, and (3) realignments, deteriorating facilities, and reduced support for Impact
Aid. Less than 40% of the Federal Impact Aid program funds go to military children
(NMISA, 2001).
The Department of Defense Supplemental Impact Aid Funding is intended to
address quality of life, readiness, and retention issues in an all-volunteer service.
MPUSD may qualify for Supplemental Impact Aid Funding.

14
D. BIRTH RATES
One would assume that the rate of births within the MPUSD area of responsibility
would be vital to the accurate projection of student enrollment. Birth rates could be used
to forecast student enrollment for kindergarten five years later using correlation or
regression analysis. Since the closure of Fort Ord, the gradual inflow of new residents,
mostly Hispanic, has slowly and only partially replaced some of the void left by the
military families (Moore, 2001). In addition, the lagging reutilization process developed
and managed by the Fort Ord Reuse Authority (FORA) for the availability of low-income
housing that was projected by the economic impact survey before the base closure has not
produced a population influx. It was hypothesized that these new families would bring in
additional population growth, revenue and jobs. In past MPUSD predictions, projections
of any variables using birth rates were made using county-wide birth rates rather than
using birth rates for the relevant zip codes (see Appendix F) which are more germane to
the MPUSD. Higher accuracy should be obtained by making projections with those
numbers. As a result, birth rates for Monterey (93940), Old Fort Ord Community
(93941), Naval Postgraduate School (93942&3) and Defense Language Institute (93944),
Marina (93933), and Seaside (93955) were analyzed. A high correlation between birth
rates and kindergarten start rates or district total second month enrollment would enable a
more accurate prediction of future enrollment figures and assist in a more structured
budget and staffing projections. Chapter IV will highlight the results of the birth rate
analysis.
E. CENSUS 2000
The release of the Census 2000 figures provided some clarity to the question of
the population and demographics of the future for the MPUSD. On the Peninsula,

15
Census 2000 results for the MPUSD show that every city, except Sand City, lost
population since 1990. Sand City grew by 30.5 percent, but it took just 61 new residents
to cause that increase. The decline was sharpest in Seaside and Marina, which suffered
huge losses following the closure of Fort Ord in the early 1990s. But, significantly, the
census showed that both Seaside and Marina have begun rebounding after their
populations bottomed out in the late 1990s (Moore, 2001).
Though Seaside's population was down by 18.5 percent from 1990 and Marina's
was down 5 percent, both cities actually grew significantly in the closing years of the
decade. With the base closing, both cities also lost significant African-American
populations, contributing to an overall 33 percent drop in the peninsula's African-
American population (Moore, 2001).
In both cities, however, the Hispanic population increased dramatically. In
Seaside, the Hispanic population grew by 75 percent to nearly 11,000 which is more than
a third of the total population. In Marina, the number of Hispanics more than doubled, to
5,822 (Moore, 2001).
The City of Monterey's population fluctuated during the 1990s, growing some in
the latter part of the decade only to dip again in 2000. Though state estimates put
Monterey's population above 30,000 each year of the 1990s, it fell to 29,674 in 2000,
according to the first wave of California census numbers (Moore, 2001). The initially
released Census figures will presumably undergo several revisions over the next year
before being declared official (Moore, 2001) but are assumed valid for analysis purposes
in this thesis. The declining population could provide some insight into the rapidly

16
declining enrollment within the MPUSD during the 2000-2001 school year discussed
earlier.
F. GOODWILL
Although there was significant publicity associated with the district’s solvency
issue, the Proposition 38 Draper Voucher Initiative presented on the November 2000
California elections ballot made the MPUSD a target for further scrutiny. The Draper
Voucher Initiative proposed providing annual $4,000 vouchers funded by public tax
dollars to students currently enrolled in parochial or private schools. In addition,
vouchers would have been provided to every public school student who left a public
school to attend a private school. The money would have been paid directly to the latter
school. The initiative did not receive enough votes to pass into law. The exact
quantitative impact of the two issues of financial solvency and Proposition 38 on the
district’s goodwill is difficult to establish. For MPUSD, no current metric reports
indicators of goodwill. Due to the sudden drop in enrollment for the 2000-2001 school
year, independent variables to model the decline would be helpful. A proper measure of
performance (MOP) for goodwill could form a bridge to assessing fluctuations in future
enrollment associated with an economic recession, remodernization, or other
developments.
G. WATER
The allocation of fresh and gray water on the Monterey Peninsula has been a
growing concern for citizens and city planners alike. For the past three years, most
construction requests that require that require an allocation of additional sources of water
have been put on hold or denied. According to city planners and city managers of

17
affected MPUSD areas, the lack of the ability to construct adversely affects their ability
to attract new residents and collect additional revenue (Kim, 2001).
Over 93 percent of the distric t’s water is derived from a network of water sources
collectively known as the Monterey Peninsula Water Resources System (MPWRS),
which includes the Carmel River and its tributaries, the Carmel Valley Alluvial Aquifer,
and the Seaside Coastal Ground Water basin. The District's Water Allocation Program
limits MPWRS production to twenty distinct, 287 acre-feet units per year. During the
1998-1999 reporting year, production totaled 16,537 acre-feet. Production from wells
and water distribution systems outside of the MPWRS was approximately 1,225 acre-feet
of water (MPWMD, 2000).
In 1999, the greatest factor limiting the water supply was not drought, but the
State Water Resources Control Board Order 95-10 that required California-American
Water Company (Cal-Am) to cut back its water production from the Carmel River by 20
percent in the near term and up to 75 percent in the long term. The cutbacks were
ordered because Cal-Am does not hold a valid right to the water and because the excess
pumping was harming the Carmel River environment. At the end of 1999, approximately
42 acre-feet of water remained for new construction and remodel projects within the Cal-
Am service area. Most of that water had been set aside by the jurisdictions for projects
that are awaiting final planning department approval. Presently, no new water source is
available to serve Cal-Am customers within the District (MPWMD, 2000).
All new construction or remodeling projects that include the installation of water
fixtures must obtain a water permit from the water authority before construction. The

18
District maintains a record of the amount of water assigned to new uses and remodels, so
that the total remains under the amount of water allocated to the jurisdictions for
construction projects. No additional water will be allocated to the jurisdictions for water
permits until Cal-Am's water production shortfall identified in State Order 95-10 is
satisfied. (MPWMD, 2000) In consideration of the current water and construction
moratorium, the population growth of the Peninsula will be constrained by its inability to
provide water for some time. As a result, the construction or remodernization of public
schools or any major housing structures will be delayed.
Fresh water availability is directly related to the ability of the Peninsula to
conduct major construction projects. The value of water as a variable in an enrollment
management model comes from the fact that the Peninsula’s population growth may be
stymied by the lack of water to construct housing. This may explain the sudden decrease
in enrollment at the MPUSD.
H. ENROLLMENT MANAGEMENT
Enrollment management is an organizational concept and systematic set of
activities whose purpose is to exert influence over student enrollments (Hossler, Bean,
and Associates, 1990). Many school districts public and private currently use the term. It
is a method of using new tools and creative talents to better manage the district
operations. At its best, enrollment management creates a highly interactive team of
committed staff and faculty that uses established principles of planning, implementation,
evaluation, and revision to ensure the institution’s constant and consistent success in
meeting its educational commitments to students while remaining accountable to the

19
taxpaying local constituents. Enrollment management is a mature concept, one that now
deserves high visibility within MPUSD (Dixon, 1995).
The need to manage student enrollment from the point of initial contact
(kindergarten or early kindergarten) through high school graduation has become
increasingly important to fiscal budgeting and forecasting projections. The need has
taken on more importance as education professionals begin to examine the serious
financial problems confronting many publicly funded institutions today (Freidrich, 2000).
Enrollment managers must have access to information about federal and state sources of
funding, and must understand demographic factors to be able to appropriately assist their
superintendents to face the challenges before them.
Numerous surveys and studies over the course of 15 years show the impact of
enrollment management systems on public institutions. Declining enrollments are second
only to declining appropriations as the reason for public school districts’ financial
problems. Additionally, enrollment management is one important technique by which to
assist public institutions to attain their budgetary and manning goals, and remain
financially solvent (Penn, 1999).
Enrollment managers’ concentration on data, quality service, cooperation,
communication, and collaboration is important to institutional success. Those in the field
must have broader formal and informal education. The chief enrollment manager must
stay abreast of state and federal legislation, be able to discuss funding allocations, and
know how to measure the general public's support for public education. This
professional needs background in computers, communications, marketing, research and

20
analysis, personnel management, and fiscal concepts (Noel-Levitz, 1996). The support
generated for a comprehensive enrollment management program may be the result of the
managers’ ability to influence, communicate, persuade, lobby, and bargain with others.
If a program is to be successful, the Superintendent and district staff must not only
endorse the program verbally, but also make sure it is properly funded. Therefore, the
relationship of the chief enrollment manager to the superintendent can be a critical
element in a successful enrollment program (Penn, 1999).
Effective enrollment management is the backbone to optimum operational
performance of the district. A broad understanding of the depth of this management
acumen could benefit the district management team in future decision making ventures.
The thesis will use the Forecasting and Enrollment Management (FEM) model and the
FORECAST.XLA Excel add-in to provide forecasting and enrollment management
services for MPUSD. Both models will be discussed in detail in Chapter III.
I. SUMMARY
There are several extrinsic factors that can have an impact negatively or positively
on the district student enrollment. We just took a look at several. Any correlation
between these variables could result in a more accurate prediction of enrollment and
provide a decreased level of variance. In addition, any achieved accuracy could be used
for the continuous improvement of the forecasting enrollment management process. The
professional enrollment manager can, by using information technology and a
combination of theory and practice, provide staff and principals with information about
programs, the quality of student learning, demographics trends for graduates/non-
graduates, attrition, and measures of goodwill. By bringing management sciences to the

21
forefront of the process, decision-making can be made optimal as soon as possible. We
have discussed some of the external factors that may have an impact on the accuracy of a
computational forecast. An understanding and basic level of knowledge is necessary for
decision-makers to properly evaluate whether anticipated results match the calculated
results from the model. This serves as validation for the enrollment management process.

22
THIS PAGE INTENTIONALLY LEFT BLANK

23
III. METHODOLOGY
Data for this study was taken entirely from the attendance archives of the
MPUSD. This chapter describes the data and the methods used to analyze the data and to
forecast student enrollment and staffing requirements.
A. ENROLLMENT DATABASE
1. Description of the MPUSD Database
The MPUSD Enrollment database consists of two binders of enrollment figures
ranging from 1980 to the present. The last seven years appear to be printouts using
LOTUS 1-2-3 software. The data includes the number of students present at each of the
twenty-three schools by month; some reports are special reports used for budgeting. This
quantitative information, once digitized, can be used for analysis purposes.
Because of the reviews within the Monterey Herald regarding the financial
solvency of the MPUSD, a verification, validation and accreditation (VV&A) procedure
was developed for the data. First, we sifted through several boxes of written notes and
archives of finished reports to create a working database in matrix form (see Appendix
A), interviewed all of the key employees who provided input reports to the previous
process and became very familiar with the formal guidelines for attendance accounting.
Second, the VV&A consisted of a random sample of 100 of the records on the master
matrix which were compared to the archive records within the MPUSD vault. The
verification process entailed comparing the sample to the remaining records within the set
to verify whether the records was correct. The validation process entailed comparing the
sample value with the records provided by the teacher’s hand written homeroom reports.

24
The accreditation process was conducted annually by an independent auditor who
verified the accounting values used by the Business Office for budgeting purposes. There
were no negative reports in the reviewed audits from the independent auditor. In the
VV&A process, a 100% of the sampled records were valid. The continuing assumption
was made that the data was valid and used as recorded throughout the thesis to create
other databases and spreadsheets.
School systems within California operate on a 180-day cycle. Their reporting
cycles are nearly divided equally into ten, 18 workday sessions called school months.
MPUSD followed this type of schedule. Some schools were opened since the closure of
Fort Ord and had smaller sample sizes than the established schools. Specifically, Larkin
and Del Monte Elementary Schools both opened in 1998. The Forecasting Enrollment
Management (FEM) Model (see Appendix B) and its associated output reports (see
Appendices D & E) developed in this thesis was designed to handle small sample sizes.
Larkin and Del Monte did not have the thirty-six data points required by the
FORECAST.XLA forecasting model (see Appendix C). Besides requiring thirty-six data
points, FORECAST.XLA provides a forecast of exactly twelve periods. The model
assumption is that the data is organized as a twelve-period seasonality index. Since the
MPUSD data set is based on a ten-period seasonality index, the data set was adjusted to
include periods eleven and twelve. This addition enhanced the accuracy of the forecast
and allowed the full use of the model’s computational structure.
2. MPUSD Feeder Matrix
The MPUSD assigns students to elementary, middle and high schools through a
feeder system shown in Figure 3.1. The feeder system promotes a more effective

25
management process and supports budget forecasting compared to a random enrollment
system. For operational reasons and since the closure of Fort Ord, the MPUSD had made
several revisions to the feeder system. In particular, the closing and opening of several
schools near Fort Ord and the consolidation of enrollments from those adjustments into
nearby schools. Each change has an effect on the overall distribution of data when
compared to history, and could introduce significant variance into the forecasting model.
Ord Terrace
Marshall
Manzanita
Crumpton
Fitch Middle
Cabrillo
Ord Terrace
Manzanita
La Mesa
Highland
Foothills
Del Rey Woods
King Middle
Marina Vista
Olson
Marina Del Mar
Crumpton
Los Arboles
Seaside High
Ord Terrace
Marshall
Manzanita
Crumpton
Fitch Middle
Del Monte
Larkin
Monte Vista
La Mesa
Highland
Foothill
Del Rey Woods
Bay View
Colton Middle
Cabrillo
Ord Terrace
Manzanita
La Mesa
Highland
Foothills
Del Rey Woods
King Middle
Monterey High
All High Schools
Central Coast
MPUSD
Figure 3.1. MPUSD Enrollment Feeder Matrix.

26
In addition, future adjustments to the existing feeder matrix will impact the accuracy of
any developed forecasting model by introducing additional variance. As a result,
forecasting future demand using a time series method will be adversely affected.
3. Data Extraction/Database Formulation
The initial data for analysis was provided by the MPUSD Business Office. A
working electronic database was created from the available sources of information. The
database was constructed using Microsoft Excel - the existing software package of the
district. Selecting an existing software package for model creation reduced cost and
optimized training opportunities. The database is a network of twenty-four separate
matrixes; one matrix for each of the 23 schools and one master matrix (see Appendix A).
The elementary school matrixes are 80 X 7 in size. The master matrix is 80 X 24 in size.
The matrixes columns represent the grade or school and the rows represent the school
month and year. The data is arranged as a times series to better facilitate the forecasting
model. In addition, two output reports are provided (see Appendices D and E) that detail
the enrollment projections for each school by grade and its associated staffing level for
the forecasted month of choice by a decision maker.
B. ANALYSIS OF DEMOGRAPHIC TRENDS
Demographic trends, when integrated into a mathematical projection method, can
help account for variations inherent in a community experiencing one or more changing
conditions. Four trends that might be considered are:
• Residential housing trends
• Birth trends
• Historical enrollment trends
• Kindergarten enrollment trends

27
C. SPECIAL OR UNIQUE SITUATIONS
Special conditions may need to be considered that are unique to individual
communities. Some examples are:
• Migrant students (including seasonal workers)
• Foster homes
• Refugees
• Social/economic movement
• Industry closures/layoffs/openings
• Private school attendance
• The aging of a district and its rejuvenation
• Military establishments (including base closures, i.e. BRAC)
• Multi- families (two or more families living in a single dwelling)
D. ANALYSIS PROCEDURE
1. Enrollment Projection Methods
Time series analysis predicts the future from the past. A time series is a set of
time-ordered observations on a variable during successive and usually equal time periods.
In time series analysis, historical data is analyzed and decomposed to identify the relevant
components that influence the variable being forecasted. Time series data may contain
up to four interacting components – levels trends, seasonal variations, cyclical variations,
and random variations (Tersine, 1994). If the historical components persist in the future,
a reliable forecast will be obtained (CASBO, 1998). The below briefly describes several
basic projection methods that could have been used for analysis purposes.
2. Grade-Level Progression Cohort Analysis
A grade- level progression for grades kindergarten through eighth grade would
project each grade a selected number of years forward (not more than 1-3 years are
suggested), and would assume incoming kindergarten at the same level as the current

28
year. This method should be used only if the enrollment environment is stable. Areas
with increasing or declining trends should not consider using this method alone for
analysis (CASBO, 1999). The MPUSD’s enrollment environment is not stable therefore
not suitable for cohort analysis.
3. Regression Analysis
Regression analysis establishes a temporal relationship for the forecast variable.
The variable to be predicted (number of students enrolled) is referred to as the dependent
variable, while the variable(s) used in predicting (past enrollment figures) is called the
independent variable(s). If two phenomena are observed to move in the same direction or
opposite directions consistently, they are correlated. This does not mean that one causes
the movement of the other, but only that they are statistically related. A cause-and-effect
relationship is often suspected (CASBO, 1999). The simplest type of relationship is a
linear regression. The regression line encompasses the trend effect, but not the seasonal
effect.
4. Exponential Weighted Moving Average (EWMA)
The exponentially weighted moving average, also referred to as exponential
smoothing, is a special type of moving average that does not require keeping long
historical records. Like most forecasting techniques, the EWMA uses historical data as its
prediction basis. The simple moving average gives equal weight to each piece of demand
history considered and gives zero weight to those observations farther than “n” units into
the forecast. The weights given to past data are not equal, but decrease geometrically
with increasing age of the data. Exponential smoothing “smoothes out” variations in a
times series by not giving a proper weighting to the last observation (Tersine, 1994). The

29
prediction in period “j” is then a simple weighted combination of the preceding
observation and the prior error:
predj = α obsj-1 + (1 - α) predj-1, (3.1)
predj is the prediction in period j, where obsj-1 and pred j-1 are the respective
observation and prediction in the preceding period j-1, and 0<α<1 is the smoothing
constant. More recent data are weighted more heavily than less recent ones depending on
the assigned value of alpha (α). Alpha (α) is a smoothing constant that satisfies 0 < α <
1. The major advantage of the EWMA is that the effect of all previous data is included in
the previous forecast figure, so only one number needs to be retained to represent the
demand history.
5. Time Series Analysis
Time series analysis predicts future values of an uncertain quantity based on past
values of the same quantity. Regardless of the technique used, forecasts are generally not
exact. It is important, therefore, not to ignore the estimates of errors also produced by
most types of forecasts. For the distribution displayed by the data for the MPUSD total
student enrollment, the Winter's method for seasonality was appropriate because the
series contained tend, level and seasonality. The Winter's method is used to forecast time
series when seasonality and possibly trend are present. In fact, in cases when the value of
α (same value used in EWMA) that minimizes the Mean Average Deviation (MAD)
exceeds 0.5, then trend, seasonality, or cyclical variation is probably present. As a result,
Winter’s Method of exponential smoothing with trend and seasonality is the better
forecasting method than simple EWMA. To give the reader an idea of how Winter’s
method works, a fictitious data set was created. In this example shown in Figure 3.2,

30
Alpha Technical Services (ATS) provides computer trouble call services on a monthly
basis. The times series graph exhibits an upward trend and seasonality.
0
50
100
150
200
250
0 10 20 30 40 50 60
Months
Nu
mb
er o
f Tro
ub
le C
alls
Figure 3.2. Time Series Graph of Trouble Calls.
Therefore, Winter's method was a logical candidate for forecasting these trouble call
service requirements. Table 3.1 shows the monthly numbers of trouble calls serviced by
ATS from 1997 to 2000.
1997 1998 1999 2000 4 9 13 36 3 6 7 21 10 18 23 47 14 27 32 81 25 48 58 112 26 50 60 139 38 75 90 230 40 77 93 201 28 52 63 122 17 33 39 84 16 31 37 74 13 24 29 62
Average 19.5 37.5 45.33333 100.75Sum 234 450 544 1209
Table 3.1. Number of Trouble Calls for Alpha Technical Services (ATS).

31
Time series methods for analyzing data in this thesis will use the following
models: the FEM model and the FORECAST.XLA add- in. Since the objective of the
thesis was to provide a low-cost, computational model using existing or inexpensive
COTS software, the two different models represent different alternatives for the MPUSD.
The FEM model was developed specifically to forecast enrollment for the two elementary
schools (Cabrillo and Del Monte) that were opened in 1998. In those cases, the requisite
36 minimum data points requirement for FORECAST.XLA was not achieved. FEM
accomplished that requirement. The FORECAST.XLA Excel add-in was designed for
times series forecasting but is limited to forecasting twelve periods not the future. Figure
3.3 compares the advantages and disadvantages of the two models.
Advantages Disadvantages Forecasting Enrollment Management (FEM) Model
§ no cost
§ forecast data with < 36 inputs
§ calculates/optimizes MAD and MSE
§ provides graphical display
§ provides unlimited forecast
§ requires prior knowledge of formulas
§ not robust
§ not totally user friendly
FORECAST.XLA § low cost: $75 range PC only
§ include with Excel site license
§ forecast large data set
§ calculates/optimizes MSE
§ generates seasonality factors
§ provides graphical display
§ provides 12 forecasts
§ user-friendly
§ large data sets only (>36)
§ process one data set at a time
§ provide exactly 12 forecasts
Figure 3.3. Advantages and Disadvantages of the Forecast Models.

32
a. Using Forecasting Enrollment Management (FEM) Model
Instructions on using the FEM model shown on the spreadsheet in figure
3.4 are contained in Appendix B, using the ATS troublecall service data from Table 3.1
as the input.
School Year Periods
Trouble Calls
Smoothed Level (Lj)
Smoothed Trend (Tj)
Smoothed Seasonal Factors (Sj) Forecast Error AbsError
1998-01 1 9 0.294694935 Alpha 0.4326291998-02 2 6 0.174282830 Beta 0.0005461998-03 3 18 0.484618061 Gamma 01998-04 4 27 0.743284192 MAD 5.5588661998-05 5 48 1.223691432 MSE 71.114481998-06 6 50 1.3455051171998-07 7 75 2.0893908431998-08 8 77 2.0332803811998-09 9 52 1.3290968881998-10 10 33 0.8580136721998-11 11 31 0.7924448171998-12 12 24 37.99290856 0 0.6316968331999-01 13 13 40.64081743 0.001445874 0.294694935 11.19632 1.803682 1.8036821999-02 14 7 40.43561193 0.001333033 0.17428283 7.083249 -0.083249 0.0832491999-03 15 23 43.47534647 0.002992132 0.484618061 19.59647 3.403526 3.4035261999-04 16 32 43.29396721 0.002891458 0.743284192 32.31676 -0.316762 0.3167621999-05 17 58 45.07094536 0.003860186 1.223691432 52.98199 5.018005 5.0180051999-06 18 60 44.86632721 0.003746348 1.345505117 60.64838 -0.648382 0.6483821999-07 19 90 44.09336689 0.003322232 2.089390843 93.75112 -3.751121 3.7511211999-08 20 93 44.80715553 0.003710178 2.033280381 89.66093 3.339067 3.3390671999-09 21 63 45.93126324 0.004321964 1.329096888 59.55798 3.442018 3.4420181999-10 22 39 45.72716009 0.004208155 0.858013672 39.41336 -0.41336 0.413361999-11 23 37 46.14651044 0.00443484 0.792444817 36.23959 0.760414 0.7604141999-12 24 29 46.04588243 0.004377471 0.631696833 29.15341 -0.153406 0.1534062000-01 25 36 78.97764156 0.022357255 0.294694935 13.57078 22.42922 22.429222000-02 26 21 96.95142105 0.032159514 0.17428283 13.76834 7.231657 7.2316572000-03 27 47 96.98358528 0.032159516 0.484618061 46.99999 5.27E-06 5.27E-062000-04 28 81 102.1900181 0.034984895 0.743284192 72.11027 8.889731 8.8897312000-05 29 112 97.5964514 0.032457504 1.223691432 125.0919 -13.09186 13.091862000-06 30 139 100.0853848 0.033798847 1.345505117 131.3602 7.639804 7.6398042000-07 31 230 104.4284922 0.036151917 2.089390843 209.1881 20.81189 20.811892000-08 32 201 102.0377636 0.034826735 2.033280381 212.4059 -11.40591 11.405912000-09 33 122 97.62475822 0.032398025 1.329096888 135.6644 -13.66436 13.664362000-10 34 84 97.76245021 0.03245552 0.858013672 83.79118 0.208825 0.2088252000-11 35 74 95.88570983 0.031413016 0.792444817 77.49707 -3.497066 3.4970662000-12 36 62 96.88241526 0.031940107 0.631696833 60.59054 1.409457 1.409457Forecast 1 37 29.50462Forecast 2 38 17.45495Forecast 3 39 48.55232Forecast 4 40 74.49237Forecast 5 41 122.6804Forecast 6 42 134.9383Forecast 7 43 209.6118Forecast 8 44 204.0514Forecast 9 45 133.4275
Alpha Technical Services Monthly Troublecall Data Using FEM Model
Figure 3.4. Forecasting Enrollment Management (FEM) Model.

33
The time series must be in one numeric column. The time series may not
include any missing values. If there are missing values, provide estimates of the missing
values must be provided.
• With seasonal data, estimate the missing values as the fitted values using a logical estimation procedure
• With non-seasonal data, estimate the missing values by the fitted values using a moving average procedure (Ragsdale, 1998)
To describe Winter’s method, we require two quantities. First, we need c,
the number of periods in the length of the seasonal pattern (c=4 for quarterly data, c=12
for monthly data and c=52 for weekly data). Second, for each period t, we need st, an
estimate of the seasonal factor for period t, obtained after observing yt. To illustrate the
seasonal factor, suppose that month 7 is July and s7=2. Then July’s number of trouble
calls tends to be twice as large as the number of trouble calls during an average month
(all other things being equal). Similarly, if period 12 is December and s12=0.4, then
December’s number of trouble calls tend to be 40% as large as the number of calls during
an average month.
An important concept with seasonal data is deseasonalizing, that is,
removing the seasonality. Again, assume that the seasonal factor for July is s7=2 and the
seasonal factor for December is s12=0.4. Also, assume the observations in months 7 and
12 are y7=200 and y12=45. Then we find the deseasonalized values by dividing the
observations by their seasonal factors. The deseasonalized value for July is
y7/s7=200/2=100, whereas the deseasonalized value for December is
y12/s12=45/0.4=112.5. This makes intuitive sense. July observations tend to be twice as
large as “typical” observations, so to put them on the same scale as typical observations,

34
we divide them by 2. Similarly, we divide December observations by a number less than
1 to make them as large as typical observations.
At each period, Lt, Tt (defined in equations 3.2 and 3.3) and st are updated
(in that order) by using Equations 3.2-3.4.
Lt = α yt + (1 – α) (Lt–1 + Tt–1) (3.2) st–c
Tt = β(Lt – Lt–1) + (1 – β) Tt–1 (3.3)
st = γ yt + (1 - γ)st-c, (3.4) Lt
where α (alpha), β (beta) and gamma (γ) are three smoothing constants each of which is between 0 and 1.
Equation 3.2 updates the estimate of the series level by taking a weighted
average of the following two quantities (Ragsdale, 1998):
• yt, the current observation
• Lt–1 + Tt–1 , an estimate of the period t level based on previous data. Similarly, Tt is a weighted average of the following two quantities:
Ø Lt – Lt–1, the change in the level from period t-1 to period t
Ø Tt–1, the previous estimate of the trend
• yt/st–c, the current observation after deseasonalizing by the most recent seasonal factor for that month (the one from a year ago)
Equation 3.3 is used to update trend in the method. Equation 3.4 updates
the estimate of month t’s seasonal factor by taking a weighted average of the following
two quantities (Ragsdale, 1998):
• st–c, the most recent estimate of the month’s t’s seasonal factor

35
• yt / Lt, an estimate of month’s t’s seasonal factor, obtained from the current month’s observation. Lt is essentially a deseasonalized value. Therefore, dividing yt by Lt yields an estimate of a seasonal factor.
The forecast Ft of yt made in period t–1 is
Ft = (Lt–1 + Tt–1) st–c (3.5)
That is, to forecast the value of yt, we multiply the estimate of the month t
level, Lt–1 + Tt–1, by the most recent estimate of the month t’s seasonal factor from May
1996 since no new seasonal factor for May 1997 is available in April 1997, when the
forecast is being made (Winston, 1997).
b. Using Insight XLA EXCEL Add-in Package
As with the FEM model, the time series must be in one numeric column.
The time series may not include any missing values. If there are missing values,
estimates of the missing values must be provided.
• With seasonal data, estimate the missing values as the fitted values using a logical estimation procedure
• With non-seasonal data, estimate the missing values as the fitted values using a moving average procedure (Ragsdale, 1998)
The proper operations of the Menu and Dialog box are contained in Figure
3.5.
• Run Forecast: Opens the forecasting dialog box.
• Save Results: Saves a current forecast’s results as a workbook named by the user.
• Live Simulation: Creates a live simulation of the forecast’s first period to be used with SIM.xla.
• Close: Closes FORECAST.xla and removes the Forecast menu.

36
Figure 3.5. FORECAST.xla Menu and Dialog Box.
The graphical user interface (GUI) to show the options to run a forecast
are contained in Figure 3.6.
• Data: Range containing time series.
• Untrended: Specify One Parameter Smoothing for series without a trend.
• Trended: Specify Two Parameter Smoothing for series with trend.
• Seasonal: Specify data displaying a 12-month seasonality.
Figure 3.6. RUN FORECAST Dialog Box.
One-parameter exponential smoothing does not accurately track time
series with a trend. For time series with either a constant or slowly varying trend, two-
parameter exponential smoothing is appropriate (Savage, 1998).
0 Miciosoft Excel - Book2 |
®] Fjle Edit View Insert Format Tools Data Window Help :orecast i !
V £ % e, «• ft * Run Forecast
Save Results
Live Simulation
Close
":■- *®i ■ ]
A B c D E H
1 1 : 1
! 1 j
M 1 1
! "J
=L=A
Forecasting ?|x
Data $C$3:$C$38
Series Type
f Un-trended
One Paramter Smoothing
C Trended
Two Paramter Smoothing
W Seasonal (12 Month)
OK Cancel

37
The resulting worksheets of a two-parameter smoothing model are
contained in Figure 3.7. Columns B, C, and D contain the original data, the fitted “warm-
up” series, and the future forecast respectively. The term “warm-up” will be explained
later in this section. Notice that the forecast column does not have meaning until the first
period into the future. For the current example, this is month 37, which is found in row
D40 of Figure 3.8.
The FORECAST.XLA model considers errors generated by times series
modeling. The control period in forecasting is the past. By using early periods of the
past data to predict later periods of the past data, an estimate of the method’s accuracy is
obtained. A period called the forecast period is set aside at the end of the historical data
as a surrogate for the future. The remaining period is known as the warm-up period as
shown in Figure 3.7. The parameters alpha and beta are set to values that provide
reasonable forecasts for most trended time series. The mean square error (MSE)
displayed in Figure 3.7 is the square root of the average of the squared differences
between the actual data and the fitted series. For any particular series, the mean square
error can generally be reduced further by adjusting α and β (Salvage, 1998).

38
Use Deseasoned
Data TRUE Warm-up Forecast Total Data
Data Points 48 0 48 Data Range B4:B51
Error Ranges G4:G51 G52:G51 MSE130.240 #N/A Slope 2.012
Y-Intercept 1.470 Alpha Beta 0.7728154 0
Figure 3.7. Forecast Graph Using Two-Parameter Smoothing.
The month number, original series, “fitted” data, and the forecast appear in
columns A through D of Figure 3.8 of the results sheet where applicable. (#NA denotes
not applicable)
iy File £* »ew Insert Format look ßata ÄWtow Help Forecast
D c* y d) Ä ß :? * <to fe ^ - <4 s /- £i 5i F5 zL
1 2
3J
B
250.000
Forecasting Report (Two Parameter)
Data Warm-up Forecast Deseasonlng 1 9.000 0.31593282 #N/A 2 6.000 4.73876904 #N/A 3 18.000 15.5455897 #N/A 4 27.000 28.8449304 #N/A 5 48000 43.6379427 #N/A 6 50.000 55.4750931 #N/A 7 75.000 82 7012183 #N/A 8 77.000 73.4902244 #N/A 9 52.000 50.1615237 #N/A
10 33.000 34 9058967 #N/A 11 31.000 31.0581044 #N/A 12 24.000 25.738729 #N/A 13 13.000 12.5447042 #N/A 14 7.000 7.76802254 #N/A 15 23.000 18.8790383 #N/A 16 32 000 36.4232881 #N/A 17 58.000 51.9933123 #N/A 18 60.000 66 630578 #N/A 19 90.000 98 8247495 #N/A 20 93.000 877285598 #N/A
,'oo ooo -■
150 000 -■
100 000 -■
50.000 -■
0.000
-> Active
»- in o) m
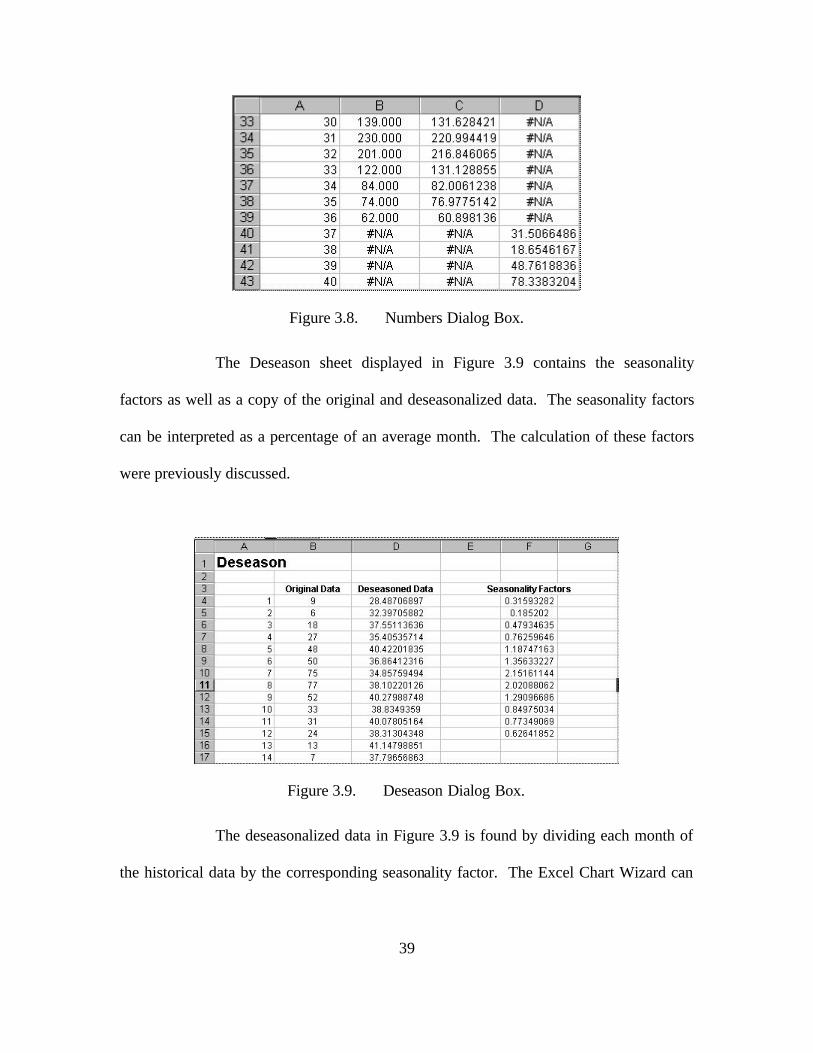
39
Figure 3.8. Numbers Dialog Box.
The Deseason sheet displayed in Figure 3.9 contains the seasonality
factors as well as a copy of the original and deseasonalized data. The seasonality factors
can be interpreted as a percentage of an average month. The calculation of these factors
were previously discussed.
Figure 3.9. Deseason Dialog Box.
The deseasonalized data in Figure 3.9 is found by dividing each month of
the historical data by the corresponding seasonality factor. The Excel Chart Wizard can
A B C D I 33 34 35
30 139.000 230.000 201.000 122.000 84.000 74.000 62.000 #N/A
131.628421 220.994419 216.846065 131.128855 82.0061238 76.9775142 60.898136
#N/A
#N/A #N/A #N/A #N/A #N/A #N/A #N/A
31 32
36 37 38
33 34 35
39 36 40 41
37 38
31.5066486! #N/A #N/A 18.6546167!
Al 39 #N/A #N/A
#N/A #N/A
48.7618836! 43 40 78.3383204;
1 2
A
Deseasc B D E F G
>n
Deseasoned Data 28.48706897
isotidlity Fact 0.31593282
Orujirwil Ddtd Se ors 4 1I 9 5 2 6 3
6 18
32.39705882 37 55113636
0.185202 n47Q34R35
4 27 35.40535714 0.76259646 5 48 40.42201835 1.18747163 & 50 36.86412316 1.35633227 7 75 34.85759494 2.15161144 S 77 38.10220126 2.02088062
1.29096686 0.84975034 0.77349069
9 52 40.27988748 10 33 38.8349359 11 31 40.07805164 12 24 38.31304348 0.62641852 13 13 41.14798851 14 7 37.79656863

40
graph the original and deseasonalized data side-by-side, allowing the extent to which
seasonality has been removed to be observed.
The smoothing sheet contains the formulas that calculate the non-seasonal
part of the forecast. These are discussed in more detail later. Figure 3.10 displays the
Warm-up and Forecast data points as viewed in the program.
Figure 3.10. Optimized Smoothing Data.
The warm-up data is used to calculate the forecast. It defaults to the entire
data set; the requested forecast is assumed to be for twelve months into the future. The
forecast data is set aside at the end of the historical data as a surrogate for the future.
As an example, type “12” into Forecast on column K of the smoothing
sheet. Warm-up in column J will now equal 24. This means that the forecast is now
based only on the first 24 months of the data. The forecast graph is shown in the Figure
1 J K L
1 II Use Deasonetl Data TRUE
Warm-up Forecast Total Data Data Points 36 36 Data Range 84:839
Error Ranges G4:G39 G40:G39 MSEJ171.198 #N/A
Slope 1.000 Y-lntercept 1.000
Alpha Beta 0.85811368 0

41
3.11. It clearly displays the trend, level and seasonal patterns that make Winter’s method
applicable.
0 . 0 0 0
5 0 . 0 0 0
1 0 0 . 0 0 0
1 5 0 . 0 0 0
2 0 0 . 0 0 0
2 5 0 . 0 0 0
3 0 0 . 0 0 0
1 6
11 16 21 26 31 36 41 46 51 56 61
Figure 3.11. Optimized Forecast Graph.
In two-parameter exponential smoothing, which is the basis of
FORECAST.XLA, a second parameter is added to smooth random fluctuations in the
trend of a series. The two parameters are referred to as α (alpha) and β (beta). The
approach used in FORECAST.XLA is modeled by the Winter’s method for Time Series
distributions.
The two-parameter smoothing routine in FORECAST.xla makes its initial
estimate of the trend by performing linear regression on the data, and then the smoothing
adapts the trend to fluctuations in the data. As with one-parameter smoothing, the data is
divided into warm-up and forecast periods.
Linear regression is performed on the warm-up period with the resulting
Y-intercept and slope used as the initial level and trend; α and β can be adjusted to
minimize the MSE over the designated period using the Excel solver. The model is much

42
more sensitive to changes in β than it is to changes in α because β has a significant effect
on slope. Default values for α and β are 0.1 and 0.01 respectively. (Savage, 1998)
The forecast for period t in a one-parameter exponential smoothing is
Ft= Ft–1 + αEt–1, (3.6)
where
Et–1 = Yt–1 – Ft–1. (3.7)
Equation 3.7 is the error of the forecast at time t–1.
Two-parameter exponential smoothing models Ft as the sum of two parts,
a level St, and a trend Tt. This is based on the following equations:
Ft = St–1 + Tt–1, (3.8)
where
St = Ft + αEt, (3.9)
Tt = Tt–1 + βEt, (3.10)
Et–1 = Yt–1 – Ft–1, (3.11)
and where α and β are smoothing parameters between 0 and 1.
To get the model started, linear regression is performed on the sample, whereupon
S0 and T0 are set to the Y-intercept and slope of the regression line respectively. With n
data points, the forecast for period n + 1 is
Fn+1 = Sn + Tn (3.12)

43
Because Yt is assumed to have either a constant or slowly changing trend,
we would expect the series to increase by the trend amount for each time period. Hence,
for all future periods the formula for the forecast is
Ft = Ft–1 + Tn, t > n+1. (3.13)
Note: Both a level and a derivative are being forecast, so the forecast should not be relied
upon many periods into the future. If α and β are both set to 0, then for each t, St = Ft and
Tt = T0. In this case, this model reduces to a linear regression of Y against t.
When a time series displays repeating seasonal fluctuations, the data
should be deseasonalized or seasonally adjusted before other forecasting techniques are
applied. A forecast based on the deseasonalized data can then be made using exponential
smoothing. Finally, this forecast is reseasonalized to get the desired result.
Deseasonalization is generally not performed unless there are at least three
full seasons of data (i.e., 36 data points). FORECAST.xla assumes that one full season is
12 months. MPUSD has a season of 10 that was modified by the addition of two points
linearly interpolating between the 10th month and the following 1st month.
Deseasonalizing and reseasonalizing are accomplished as follows:
• Calculate seasonality factors sj where j = 1, 2, …, 12 for each month, indicating that month’s percentage of the average monthly total for the series, a follows:
sj = (12/N) ∑=
N
iijY
1
/Ai , j = 1,2,…12 (3.14)
where N is the number of complete years worth of data, Yij is the value of the time series
Yt in month j of year i, and Ai is the annual total of the series in year i. Note: A perfectly
average month will have a seasonality factor of 1.0.

44
• Calculate the deseasonalized data by dividing the data in each month by its corresponding seasonality factor. Use the following:
Dij = Yij, i = 1, 2, …., N, j = 1, 2, …, 12. (3.15)
sj
Notice that if some month j of the time series data consistently had very
small or zero values, then the sj would be very small or zero and lead to instabilities in
this equation.
• A 12-month forecast, fj is made of the Dij’s, using one- or two-parameter exponential smoothing.
• Find the final forecast Fj by multiplying each month of the future forecast by its corresponding seasonality factor, as specified in the following equation:
Fj = Sj fj, j = 1, 2, …, 12. (3.16)
E. CONVERTING ENROLLMENT TO ADA
The resulting output from either model will be used to convert enrollment
projection to Average Daily Attendance (ADA) figures for budgeting purposes. The
accuracy of a district’s enrollment projection relates directly to its ability to accurately
project its major source of revenue, the total calculated ADA Revenue Limit. Each
student enrolled develops a unit of ADA that is the accumulated number of days the
student was in actual attendance or excused for defined reasons.
Each district should compare a selected statistical month or series of months for
the Period-1 and Period-2 ADA derived from those numbers of students attending.
Generally, kindergarten through eighth grade can expect a higher percentage relationship
between enrollment and ADA (usually in excess of 97-98%) than can high school

45
districts (mid-90’s). Each school district is unique, however, and should be analyzed on a
grade-by-grade, school-by-school basis.

46
THIS PAGE INTENTIONALLY LEFT BLANK

47
IV. RESULTS A. DESCRIPTIVE STATISTICS
1. Summary Enrollment Statistics
This thesis may help the MPUSD with recurring budget issues relating to
enrollment forecasting since the closure of Fort Ord and the loss of the corporate
knowledge base for enrollment management. The anticipated student enrollment is the
most significant revenue source for the district and establishes the monetary limits for
expenditure budgets and the costs of personnel. As a result, an accurate approximation of
enrollment is critical to the success of the district’s efforts to provide a high quality and
challenging education to its students and to maintain funding for enhanced education
programs (e.g., GATE, MAGNET). A well-developed model provides an overall fiscal
management tool that may assist in proper budgeting and forecasting from year to year.
Appendix E and F contain the decision support output from the model.
MPUSD operates on a 180 school-day schedule. That schedule is divided into ten
equal periods for planning and budgeting purposes. To improve the accuracy of the
forecasting models, the data sets were recorded in twelve-period increments rather than
ten-period increments. This adjustment was necessary to maximize the efficiency of the
FORECAST.XLA forecast model which was coded for a twelve-period seasonality
index.
The model used data from 1994, the year that Fort Ord was closed, to the year
2000 to forecast district-wide student enrollment for the 2000-2001 school year. The

48
series was consistent with the characteristics of a Time Series model. The student
enrollment errors recorded in Table 4.1 were as follows:
Period Actual Forecasted % Error # StudentsABS # Students
2001-01 12106 12106.4152 -0.000034 -0.42 0.422001-02 12090 12089.9989 0.000000 0.00 0.002001-03 12001 12000.2554 0.000062 0.74 0.742001-04 11919 11914.810 0.000352 4.19 4.192001-05 11859 11861.1342 -0.000180 -2.13 2.132001-06 11825 11826.0255 -0.000087 -1.03 1.032001-07 11758 11768.7097 -0.000911 -10.71 10.71
Ave % Error -0.000114Ave Student Error 2.75
Table 4.1. Forecast Model Output Enrollment Errors.
The model’s output resulted in a seven-month cumulative average forecast error
of 2.75 students. Approximated at 3 students out of a population of 12,000, the error was
negligible. In addition, the distribution of the data was conducive for a Multiplicative
Times Series distribution that made the Winter’s Method an ideal model. A graphical
display of the data reveals level, trend and seasonality components. Winters’ Method
smoothes data by exponential smoothing and provides short- to medium-range
forecasting. This procedure can be used when both trend and seasonality are present,
with the two components being either additive or multiplicative. Winters’ Method
calculates dynamic estimates for three components: level (α), trend (β) and seasonality
(γ). This level of accuracy could be helpful in the budgeting and staffing process.
2. Statistical Analysis
An analysis of Figure 4.1 shows that the overall differences in projected
enrollment within the MPUSD since school year 1992-1993. The (–) minus and (+) plus

49
conventions assigned to the percent variance is consistent with the system as reported at
the District Headquarters.
1992 - 1993 1993 - 1994 1994 - 1995 1995 - 1996 1996 - 1997 1997 - 1998 1998 - 1999 1999 - 2000 2000 - 2001Projection 14545 10496 11105 11018 11299 11531 11988 12363 12081Actual 14303 11689 11048 11046 11366 11693 12083 12103 11919Difference -242 1193 -57 28 67 162 95 -260 -162 824% Variance -1.69% 10.21% -0.52% 0.25% 0.59% 1.39% 0.79% -2.15% -1.36% 7.51%Revenue Limit per ADA 3,319.88$ 3,348.35$ 3,458.35$ 3,554.35$ 3,748.18$ 3,904.17$ 4,227.58$ 4,287.58$ unavailableEstimated Cost/Lost (803,410.96)$ 3,994,581.55$ (197,125.95)$ 99,521.80$ 251,128.06$ 632,475.54$ 401,620.10$ (1,114,770.80)$
Grand TotalLegend minus ( - ) over forecasted underbudgeted 3,264,019.34$
plus (+) under forecasted overbudgeted
MPUSD Enrollment Projections Vs. Actual 1992 - 2001Second School Month
Figure 4.1. MPUSD Enrollment Percentages.
In the case when a (–) difference is assigned, the projected forecast is greater than
the actual enrollment. This corresponds to an over-budgeted scenario. In the case when
a (+) difference is assigned, the projected forecast is less than the actual enrollment. This
corresponds to an under-budgeted scenario. In either case the outcome is somewhat
unfavorable to the overall fiscal operation of the school district. During the closure of
Fort Ord (second month school year 1993-1994), the district enrollment was under-
estimated by 1193 students; that corresponded to a 10.21% error. This was the largest
error of that decade and amounted to an estimated under-budgeting of $3.9 million for
that academic year. Prior to the beginning of the school year, several meetings were
conducted between the Fort Ord Reuse Authority, the MPUSD and Fort Ord military
transfer personnel. Unfortunately, the transfer of military families did not occur at the
pre-designated time and sequence as scheduled and therefore placed the fiscal burden on
the school district to provide temporary (one- to five-month) services to the remaining
families. MPUSD was not prepared for this surge in student population and as a result

50
additional staffing was necessary to accommodate the delay in transfers. MPUSD was
not financially compensated by the federal government for the temporary surge in
staffing to accommodate the remaining students.
As a result of the base closure, the revenue previously generated by the Federal
Impact Aid was reduced significantly from a high of $8.3 million during the 1991-1992
school year to a greatly reduced $774,137 during school year 1999-2000 as shown in
Figure 4.2.
School Year
8110 (Maint & Ops) PL874 ADA 8331 GATE
Revenue Limit/AD
A 1990-1991 $ 7,792,410.00 13,276.00 $ 93,723.00 $3,048.88 1991-1992 $ 8,316,896.00 13,282.00 $101,633.00 $3,194.88 1992-1993 $ 8,112,999.00 13,282.00 $100,006.00 $3,319.88
1993-1994 $ 8,029,604.00 13,254.00 $ 96,304.00 $3,348.35 1994-1995 $ 6,467,859.00 13,250.00 $ 76,587.00 $3,458.35 1996-1996 $ 5,874,558.00 12,835.00 $ 75,842.00 $3,554.35
1996-1997 $ 1,705,302.00 12,841.00 $ 86,200.00 $3,748.18 1997-1998 $ 131,340.00 12,306.00 $103,952.00 $3,904.17 1998-1999 $ 683,064.00 13,577.00 $111,834.00 $4,227.58
1999-2000 $ 774,137.00 12,230.00 $109,517.00 $4,287.58
Average $ 4,788,816.90 13013.3 $ 95,559.80 $3,609.22
Figure 4.2. MPUSD Audited Budget Section Values, Section J-201R.
This decrease in funding represented the vast decrease in federally connected
students attending public school within the MPUSD. In addition, it highlighted the need
for the necessary budget cuts of programs such as GATE, MAGNET and music
throughout the district. Since the federal funds were not intended solely for use by the
schools that serviced federally connected students, the reduced funding impacted all
district schools. Since La Mesa Elementary, located within the La Mesa Military

51
Housing Community, lost both the GATE and the district’s only MAGNET programs, the
impact of budget cuts appeared to affect its educational program base more than schools
without those enhanced programs.
One would assume that the number of births, as shown in Figure 4.3, in a
community would be a good indicator of the number of children starting kindergarten 5
years later.
YearSchool-Year
Total Births
Kindergarten Enrollment
District-wide Enrollment
1988 1988-1989 1673 136441989 1989-1990 2301 1669 140341990 1990-1991 2409 1534 144271991 1991-1992 2493 1654 147191992 1992-1993 2477 1569 145181993 1993-1994 2025 1209 119141994 1994-1995 1515 1104 112991995 1995-1996 1453 1118 112441996 1996-1997 1226 1157 115721997 1997-1998 1382 1204 119011998 1998-1999 1400 1219 122761999 1999-2000 1334 1147 122902000 2000-2001 1380 1140 12090
Total 21395 15724 152284Average 1783 1310 12690
Figure 4.3. MPUSD Birth (MCHD, 2001).
In the case of the MPUSD, birth rates did not highly correlate with the
kindergarten enrollment historical data nor did it correlate with the District-wide
enrollment. Data for actual births were obtained for the Monterey County Health
Department (MCHD) in Salinas, California by zip code to provide an accurate measure
for the MPUSD area of responsibility. Appendix F is a table of that actuarial
information. The health department maintained data only from 1988 and beyond in

52
calendar year order. A student will typically enroll in kindergarten at age 5. Therefore,
the 1989 births were manually adjusted five years forward and compared to the 1994
kindergarten enrollment. The remaining years were adjusted accordingly. The Pearson
Correlation and p-value between births adjusted five years and kindergarten enrollment
was –0.223 and .596, respectively. Because of the restrictions related to birth dates in
enrolling a child in school after December, an additional correlation model was
conducted with births adjusted for six years. The resultant Pearson correlation and p-
value were 0.063 and 0.893, respectively. The conclusion is that births were not a good
predictor for Kindergarten enrollment within the MPUSD. The results suggest that there
may exist another more-correlated variable not considered in this analysis.
The 2000 Census report for the Monterey Peninsula, as displayed in Figure 4.4,
highlighted that the population which comprises the MPUSD has declined in numbers by
10.85% since the 1990 census.
1990 2000 % Change
Monterey County Total: 355,660 401,762 12.962
Monterey Peninsula cities total 119,372 107,985 -9.539
Del Rey Oaks 1,661 1,650 -0.662
Marina 26,436 25,101 -5.050
Monterey 31,954 29,674 -7.135
Sand City 200 261 30.500
Seaside 38,893 31,696 -18.505
MPUSD Affected Total 99,144 88,382 -10.855
Figure 4.4. Monterey Peninsula Population by the Numbers: Census 2000 (Herrera,
2001).

53
Although the majority of the decline (nearly 5400) was due to the BRAC of Fort
Ord, some 5000 other residents vacated the area as well. Speculation would be that the
reason for the additional decline could be job-related moves in connection with the
BRAC of Fort Ord and possibly the high cost of living observed over the last seven years
due to increased tourism and fewer settlers on the peninsula. Tourism has increased
drastically since the BRAC of Fort Ord and although the economy has been bolstered by
gains from the increased exposure of visitors, it has done little for population growth.
The Monterey Peninsula population growth has also been constrained by the
unavailability of water for construction of new living facilities.
The most important factor in estimating the value or quality of the service that a
business can provide a customer can be measured externally and internally by goodwill
indicators. Externally, one may provide a market survey to the customer and based on
the analysis of the feedback make analytical assumptions about the level of quality
provided. Internally, one may look at define indicators with their developed processes to
search for trends to give an internal indication of the findings reported from an external
survey and what is actually occurring. MPUSD had a decrease in enrollment from
12,290 students in school year 2000-01 to 12,090 in school year 2001-02. This decrease
in enrollment came as a surprise to MPUSD’s enrollment officials because no
quantitative indicators had been available. An internal indicator was put in place by the
author in December 2000 in an attempt to record the transfer process and the results are
recorded in Figure 4.5.
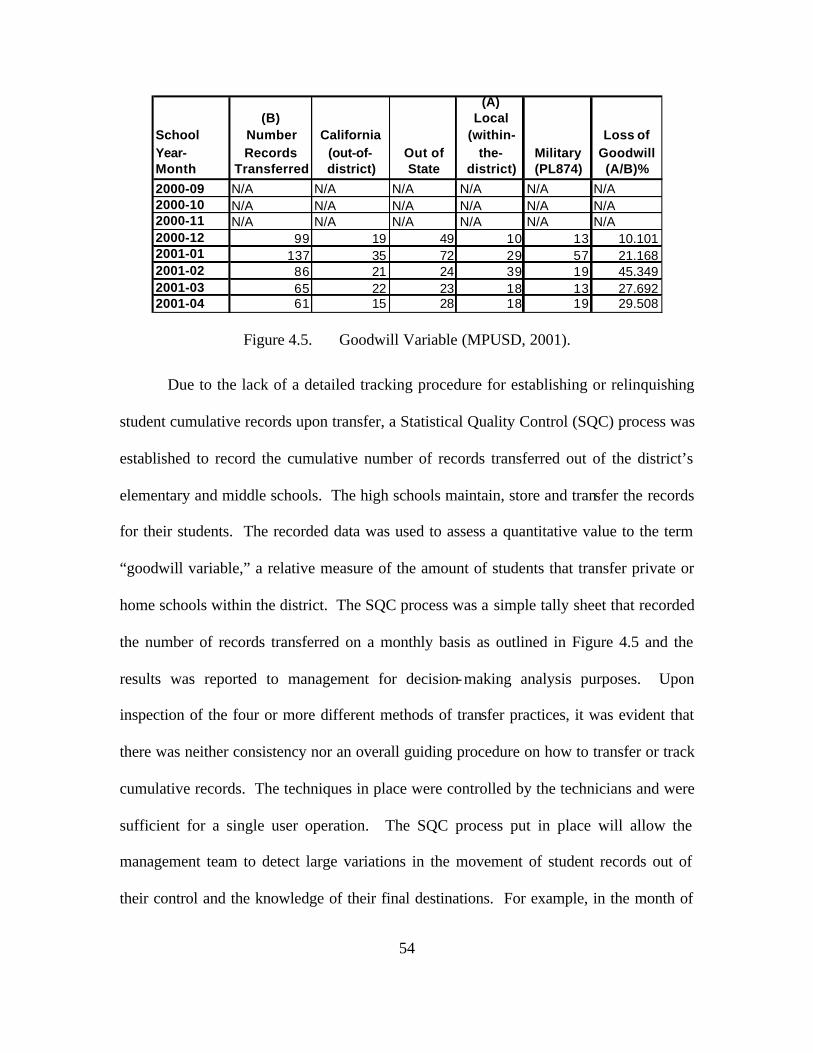
54
School Year-Month
(B) Number Records
Transferred
California (out-of-district)
Out of State
(A) Local
(within-the-
district)Military (PL874)
Loss of Goodwill (A/B)%
2000-09 N/A N/A N/A N/A N/A N/A2000-10 N/A N/A N/A N/A N/A N/A2000-11 N/A N/A N/A N/A N/A N/A2000-12 99 19 49 10 13 10.1012001-01 137 35 72 29 57 21.1682001-02 86 21 24 39 19 45.3492001-03 65 22 23 18 13 27.6922001-04 61 15 28 18 19 29.508
Figure 4.5. Goodwill Variable (MPUSD, 2001).
Due to the lack of a detailed tracking procedure for establishing or relinquishing
student cumulative records upon transfer, a Statistical Quality Control (SQC) process was
established to record the cumulative number of records transferred out of the district’s
elementary and middle schools. The high schools maintain, store and transfer the records
for their students. The recorded data was used to assess a quantitative value to the term
“goodwill variable,” a relative measure of the amount of students that transfer private or
home schools within the district. The SQC process was a simple tally sheet that recorded
the number of records transferred on a monthly basis as outlined in Figure 4.5 and the
results was reported to management for decision-making analysis purposes. Upon
inspection of the four or more different methods of transfer practices, it was evident that
there was neither consistency nor an overall guiding procedure on how to transfer or track
cumulative records. The techniques in place were controlled by the technicians and were
sufficient for a single user operation. The SQC process put in place will allow the
management team to detect large variations in the movement of student records out of
their control and the knowledge of their final destinations. For example, in the month of

55
February 2001, 45% of the 86 record transfer requests were for students that moved to
another non-MPUSD school within the district. In most cases, the student was
transferred to a private or home school program. What this means to the District
management team is that parents are opting to pay for private schooling rather than
choosing their public institution. In addition, nearly 20% of those transfers involve
military students, and as a result the associated ADA and supplemental PL874 funds were
lost for federally connected transferees. The use of a tracking mechanism would have
established the parameters that the management team could approve as an acceptable
tolerance level for transfers within the district to private or home schools. When
necessary the district could react accordingly. For example, a reaction was to send out
surveys to the parents of the transferred students to identify areas within the district in
need of management attention as a result of a loss.
In addition, the need to implement an advanced technological student
management system was identified. Current systems, SCHOOLWISE and CAST are
adequate, coded in COBOL and have unreliable databases. A new decision support
management system, such as SchoolMax (DMG MAXIMUS, 2001), would be a benefit
to the district. SchoolMax is discussed in chapter IV.

56
THIS PAGE INTENTIONALLY LEFT BLANK

57
V. RECOMMENDATIONS AND FOLLOW UP A. RECOMMENDATIONS
The MPUSD has been provided with two invaluable tools, the FEM model and
FORECAST.XLA model, to assist it in its need to achieve accuracy within their
Forecasting Enrollment Management process. FEM contains a working database, a
computational spreadsheet model, a FEM MPUSD Enrollment Output report, and a FEM
MPUSD Staffing Output report. These are services not available to MPUSD prior to this
thesis but similar in scope and presentation to the works of the late DepSup. The thesis
identifies the level of accuracy available from forecasting future enrollment with
historical enrollment data. The thesis was conducted at no cost to the District and
included recommendations that led to improved personnel communication, enhanced
developmental training, and cutting-edge decision support and management systems.
The FORECAST.XLA model provided an optimized usage of an existing software
package to achieve the forecasting goals of the District. FORECAST.XLA is scalable
within Microsoft Excel as an add- in feature and should become even more powerful in
future revisions. As a result of this thesis MPUSD is able to accomplish the following
tasks as requested:
• Project student enrollment for any grade at any school for at least one year (twelve periods) in the future
• Provide the necessary staffing assignments by school and grade
• Use existing hardware and software systems
• Provide a scalable and portable database management system with the following attributes:
Ø Low-cost or no-cost

58
Ø Easy to train existing personnel for use
Ø Developed, tested and operational before the 15th April deadline for submission of budget requests to the California Department of Education
Public school districts, in general, need to concentrate on the use of enrollment
management tools, including predictive modeling, outcomes-based research on retention,
programs, and activities, and evaluation of students’ satisfaction to meet the needs of
students, parents and society in general. Enrollment management changes the way school
districts approach the business of public education. With appropriate planning and
evaluation, district-wide participation, well-prepared professionals, and adequate fiscal
resources, enrollment management can help public school districts meet future challenges
posed to public school institutions. Excluding the significant loss of students during the
closure of Fort Ord, the MPUSD has been very fortunate over the last two decades not to
be burdened with unpredictable enrollments. In the past, MPUSD has received formal
recognition from county and state authorities for its accurate levels of enrollment
predictions. When compared to other Districts across the country, MPUSD programs and
management were considered top tier (Friedrich, 2001). MPUSD has shown no evidence
of an enrollment forecasting problem, but has shown substantial evidence of an
enrollment management problem. The difference is that the forecasting enrollment is a
merely a subset of the enrollment management process performed over the last two
decades. The loss of the past DepSup took away the entire corporate knowledge on the
subjects of attendance accounting, enrollment forecasting, personnel allocation, class size
reduction management and budgeting. The duties held by that one person were more
than enough for four full-time executive employees. The enrollment forecasting process
was inaccurately title as a forecasting enrollment management procedure.

59
The process of hiring a new capable and competent Chief Business Officer
fulfilled only one vacancy created by the loss of the DepSup; there were many more tasks
left unassigned. During the course of this research, the author was not convinced that the
new organizational management structure (since the departure of the DepSup) had
successfully completed the necessary task reassignments. The transition has been slow
and with great caution at a cost of not communicating clearly and concisely with the
lower-tier employees and the community. In order for the district to move forward,
management personnel must accept ownership of the situation left behind and the desire
to take responsibility for its repair. MPUSD is an organization with a multi-million
dollar budget and over 12,000 customers. It is unmistakably a large business and the
district management team must make the crucial transition to an organization in which
business acumen and management skills are required and expected in all decisions.
Especially with the advent of new technology (SchoolMax), business as usual will not
result in success of the ultimate goal. The current superintendent’s technology infusion
transition plan is propelling the leadership team into the information age. The proactive
approach to the rapid implementation of cutting-edge decision support and management
technology tools such as SchoolMax continuously to reiterates a commitment to quality
for the community and district employees.
The MPUSD is faced with an issue that all public institutions such as the Post
Office or the Public Library System must address at some point. The issue is how to
measure customer satisfaction so the district can minimize customer dissatisfaction. The
district’s level of customer satisfaction is directly related to the quality of services
provided to the community. A recommended method for the District to combat this issue

60
is to establish a Quality Assessment Group within its organizational structure. This group
would assist greatly in forging a district-wide service transformation from a reactive to a
proactive posture. The purpose of this group would be to perform quality assessment for
all targeted functional processes within the District’s operations, make recommendations
to the leadership team, and develop procedures to maintain the new-found level of quality
and performance. Figure 5.1 shows the proposed initial structure of the assessment group
and its major units.
Asst. Director of Quality Assessment/Community Service Officer
Seaside High RegistrarOnsite
Monterey High RegistrarOnsite
Central Coast RegistrarOnsite
Middle Schools RegistrarDistrict
Elementary Schools RegistrarDistrict
Lead Registrar
Attendance Accounting ClerkDistrict
LeadAttendance Accounting Technician
Data Entry & Validation Clerk
Computer Technician/Database Administrator
SchoolMax
Transfer Clerk
Record Maintaenance ClerkInter/Intra/Out of District Transfers
Director of Quality Assessments/Chief Public Relations Officer
Figure 5.1. Quality Assessment Group Structure.
The group function is not to be compared to an Internal Affairs Division within a
Police Department. Rather, its function is to focus on continuous improvement of
internal operational functions. The group would evolve from an expansion of the existing
Assessment Division but with greater depth and responsibilities. It is further
recommended that the current Assessment Division Head be advanced to the Director

61
level to accurately represent the level of responsibilities of the tasks assigned. The
Director would report administratively to the Chief Business Officer and to the
Superintendent for internal audit results. The Quality Assessment Group could be
formed at no additional cost to the District by realigning existing personnel to jobs that fit
their skill levels and expertise. Although the most crucial initial task for the group would
be to develop Standard Operating Procedures (SOP) for most critical district operations,
some of the basic responsibilities of the group would be as follows:
• Inter/Intra-District Transfers
• Zoning assignments
• Attendance reporting
• SchoolMax (see section C) implementation and continuous improvement training
• Cumulative record maintenance and transfers
• Total Enrollment processing visibility
• Ex-officio assignment to any established working groups
• Writing of Standard Operating Procedures (Internal)
• Internal Auditing and On-site Training
• Public Relations
• Centralized Registration
• Federal Impact Aid Reporting/Recording (PL 874)
• Class size reduction grants and penalties
This list is not all- inclusive. There are several other functions to the benefit of the
district that could be added to the operational functions of the group. The bottom line is
that the Director of Quality Assessment would be responsible for any process by which a
student may enter or exit the District and any technology that supports the addition or
subtraction of a student. Invariably, a centralized Internet-driven registration processing
and reporting system (i.e., SchoolMax IQ version) will be the eventual goal of

62
organizational structure change. It is reasonable to suppose that vast improvement will
be realized within the district’s total operations base and budgeting system by
implementing automated processes immediately.
Some current procedures are redundant, costly and inaccurate. The end result is a
dissatisfied student and/or parent – i.e., the customer. The extended organizational
structure could assist in improving the customers’ level of satisfaction at a reduced cost to
the District. For example, the Gap Model (Ziethaml and Smith, 1990) explains causes of
customer dissatisfaction. The model illustrates the path from customer expectation to
customer experience. The following is a brief discussion of the five gaps in the model
with reasons for each as described (Bergman, 1994):
• Gap 1: Between customers’ expectation and management’s perceptions of these expectations. Some reasons for this gap are:
• Lack of marketing research
Ø Inadequate upward communication
Ø Too many levels of management
• Gap 2: Between management’s perceptions of customers’ expectations and service quality specifications. Some reasons for this gap are:
Ø Inadequate management commitment to service quality
Ø Perception of infeasibility
Ø Inadequate task standardization
Ø Absence of goal setting
• Gap 3: Between service quality specifications and service delivery. Some reasons for this gap may be:
Ø Role ambiguity
Ø Role conflict
Ø Poor employee job fit
Ø Poor technology job fit
Ø Inappropriate supervisory control systems

63
Ø Lack of perceived control
Ø Lack of teamwork
• Gap 4: Between service delivery and external communications to customers about service delivery. Some reasons for this gap are:
Ø Inadequate horizontal communication among operations, human resources, instructions and business office
Ø Propensity to over-promise
• Gap 5: Between customers’ expectation and perceived service.
Ø Good service is one which matches or exceeds customer expectations
A desired goal would be to create a total quality management environment
capable of reaching the standards set by the Malcolm Baldridge National Quality
Awards, the Deming Prize, or a continuous improvement equivalent. The Quality
Assessment Group would be responsible for evaluating the level of customer/client
satisfaction and making unbiased recommendation for process improvements. Since the
audits are multi-purpose, to identify, correct and train on the problem, the District’s
overall readiness should improve immediately as a result of each audit.
1. Process Improvement
When looking for the causes of variation in a process, it is important to tackle the
problem systematically and accurately. For MPUSD, variation can be caused by factors
such as water shortages, building construction freezes, loss of goodwill with the
community, loss of federal impact aid, or loss of enrollment management forecasting
abilities and many more yet unclassified. There are often several problems or causes
present. The problem that is the most serious will normally be first to be attacked.
Figure 5.2 illustrates the improvement cycle: Plan - Do - Study - Act also know as the
PDSA cycle (Bergman, 1994) that is a recommended approach for the District’s Quality
Assessment Division. The stages in the cycle are described below. Another list with

64
roughly the same contents can be found in Figure 5.2 which outlines the methodology of
the improvement process.
• Plan. When problems are detected, the principal causes of the problem must be established. Large problems have to be broken down into small, manageable ones. The decision concerning changes must be based on facts and not emotions. That means that one would have to look at the problem systematically for different plausible causes using scientific tools, working groups or any method that promotes free thinking without criticism. Afterwards, the compilation of data in such a way that one could detect causes of error and variation would be helpful. It is vital not to “over-react” in such a way that the solution of a problem becomes a costly experience based on trial-and-error (Bergman, 1994).
• Do. When an important cause of a problem is found, an improvement team is given the task of carrying through the appropriate steps to recovery. It is of great importance to make everyone involved fully aware of the problem and of the improvement steps decided upon (Bergman, 1994).
• Study. When appropriate steps have been taken, the results should be investigated to see if the implementation of the improvement program was actually successful. To monitor the level of progress, scientific tools should be employed. When the team is convinced that the steps taken have had a positive effect and that the quality level has been raised, the new level must be retained (Bergman, 1994). In some cases a control chart will be an idea tool for tracking progress.
• Act. The steps involve learning and gaining experience from the improvement process in order to avoid the same problem the next time. If the steps taken were successful, the new and better quality level should be made permanent. If not, the cycle is started again. It is also very important to analyze the entire cycle of problem solving once again in order to learn and to improve the improvement process itself (Bergman, 1994).

65
Start the process over
Make permanent the improved quality level
Take steps for improvements
Evaluate the results
Look for causes of the problem
Problem analysis
Appoint improvement team
Identify project
Figure 5.2. Improvement Cycle Methodology.
In addition, it is imperative that the District form a working relationship with the
constituents of the servicing community. First, the District must understand and correctly
interpret the needs of the community. Second, the community must understand and
correctly interpret the needs of the District. The requirements of each run hand-to-hand
and their public policies should reflect that relationship. The District could gain
substantial benefits by properly educating the community on the need and the process
involved with seeking modernization the existing public schools. In addition, the District
must effectively communicate to the community its increased need for volunteers at all
levels within the District system and how success in that one area can improve the quality
of educational services provided to the students. Conversely, the community leadership
must step forward and assist in outreach initiatives sponsored by the District that benefit

66
the students and their quality of education. That includes encouraging citizens to
volunteer at all levels in the system and educating the general populace on the value of
their contribution.
B. SUPPLEMENTAL RECOMMENDATIONS
The following recommendations were generated while conducting research for
the Forecasting Enrollment Management (FEM) Model from October 2000 to January
2001. Implementation of these recommendations is required in order for the model to
accurately forecast enrollment and for management decisions to be properly supported.
The recommendations (not listed in priority order) are as follows:
• Modify the enrollment identification codes within CASTS and SCHOOLWISE to capture PL874 candidate data
• Modify the existing drop codes within CASTS and SCHOOLWISE to capture data related to transfers
Ø within CA but outside the District (e.g., Salinas, Pacific Grove, Carmel)
Ø to home school
Ø as a result of military/federal transfers (PL874)
Ø to Mexico
Ø out of the United States but not Mexico
Ø within the district (i.e., private school)
• Organize a working group among registrars, attendance clerks and secretaries to develop a Standard Operating Procedure (SOP) for on-site attendance accounting
• Record and report monthly the final destinations and count of cumulative academic records transferred out of the district by the registrars
• Create an internal audit unit centered on the CASBO audit checklist for attendance accounting inspections and report monthly until officially inspected by the state
• Establish a Perfect Attendance Award Recognition Program with a certificate to the student and a form letter to the parents signed by a District Headquarters employee

67
• Pursue any endeavor that would lead to an enhanced community perception and increased goodwill for the District (e.g., community appearances)
• Empower and gain the trust of the employees at all levels within the District to be Ambassadors to the District within the community
• Develop a unified standard for dis-enrolling absent students (e.g., 15 days, 30 days, etc.)
• Develop a unified standard for student transfers to Central Coast High School
• Institute a training development plan for TIES/SchoolMax implementation that includes formal off-site training coupled with a self-paced on-site training module
• Include input from representative(s) of the Business Office-Enrollment on the facilities remodernization project to include the optimization of state mandated class sizes and the minimization of class size penalties for violations during maintenance periods
• Include input from representative(s) of the Business Office-Enrollment on the facilities remodernization project to include the necessary adjustments and the resultant impact from feeder assignment changes
• Establish a single or multiple (one per zip code) registration site(s) for student enrollment
• Solicit volunteer or professional consulting support on issues related to the Bond Election initiative (see section C) and resultant data analysis
• Establish a Child and Parent Together Program, and Early Enrichment and Kindergarten (EEK) programs at Fort Ord and La Mesa Military Communities. The goal is to encourage parent participation at the early stages and to expose parents to other services offered by MPUSD that are otherwise unnoticed. Federally connected students generate more revenue for the District per child than other community students.
• Once the school year has begun, the actual attendance and resulting estimated ADA should be reviewed periodically. The first review should take place after the information for the first statistical month is received. Income projections should be adjusted accordingly, and staffing adjustments should be made, if possible. To maximize staffing resources, class size should be monitored on a monthly basis. Class sizes exceeding state required levels (generally 20 for kindergarten, 28 for grades one to three, and etc.) would result in a reduction in revenue limit ADA. (CASBO, 1998)

68
C. FOLLOW-UP
At the time of publication, the MPUSD had implemented several of the suggested
recommendation into their operational business plan. In particular the following were
implemented or considered:
• MPUSD solicited professional consultants from a private consultant firm for their Bond Initiative to remodernize the public schools. The Bond Initiative seeks to provide necessary funding through a municipality bond to facilitate the cost of facilities in need of repairs.
• The Parent Teacher Student Association (PTSA) throughout the district has become more active in volunteer participation within the schools. Parents and teachers have begun a crusade of grant writing initiatives that has produced several thousands of dollars for school enhancement programs.
• MPUSD modified its existing drop codes within their decision support system to provide more relevant management information by creating a database more reflective of actual district operations
• The District adjusted its SchoolMax implementation schedule to train end users first. In addition, the contractor developed an internal self-paced training module to facilitate additional training and qualification standards. Now the District can develop an internal training program unique to MPUSD.
• MPUSD registrars, attendance clerks and secretaries had their first ever all-hands training. It was pledged at the meeting that a working group would be formed to create a Standard Operating Procedure (SOP) for District attendance accounting. The event was supported and attended by upper management and was well received.
• The Business Office implemented an internal audit process for attendance accounting practices that was based on the inspection checklist from the California Association of School Business Officer (CASBO) regulations. The on-site audit identified, corrected and upgraded of all defective units to state standards. MPUSD has been advised that they would be audited within the next 18 months.
• The Records Office began a Statistical Process Control (SQC) tracking method for transferred cumulative records. This action gave the District management visibility into the number of students leaving their schools (i.e., to private school) but not the District. This was considered a useful variable to assist in measuring the District’s loss of goodwill.

69
• The Facilities Department competed a contract for Request for Qualification (RFQ) to determine who, when and what will be remodernized if the Bond Initiative is passed.
• The Automated Data Processing Division researched and adopted SchoolMax, a student information system that gives the user on- line access to a single district-wide database with up-to-the-minute student, family and school information for the current year, as well as historical data from prior years. The user can access the database from any location throughout the district. SchoolMax is scalable and can maintain up to 1,000,000 records. With the addition of IQ, an Internet-server based add-on module available in June 2001, centralized registration could be realized within the District (DMG Maximus, 2001).
• Introduced two additional thesis research topics from the Naval Postgraduate School, (1) a contrast and comparison of detailed budgeting vice categorical budgeting and (2) the development and installation of a T1 backbone and fiber optic cabling for a computer center at Fitch Middle school that can be used for video conferencing and training by staff and students.
• Made a diligent effort to increase public exposure to the community on all issues relevant to the District’s Operations. This included the formation of community action committees to advise management on matters related to District remodernization.
• Restructured the existing District leadership team to clarify areas of responsibilities.

70
THIS PAGE INTENTIONALLY LEFT BLANK

71
APPENDIX A. MPUSD MASTER DATABASE
Year Value Bayview Cabrillo Crumpton Del Monte
Del Rey Woods Foothill Highland Le Mesa Larkin Manzanita
Marina Del Mar
Marina Vista Marshall
Monte Vista Olson
Ord Terrace Colton Fitch King
Los Arboles
Monterey High
Seaside High
Central Coast High Totals
1995-01 1 349 0 551 0 616 590 529 613 0 404 430 0 655 440 406 664 725 389 699 604 1354 1126 205 113491995-02 2 351 0 534 0 625 595 529 575 0 404 444 0 655 436 406 664 712 389 699 595 1324 1111 224 11272
1995-03 3 353 0 519 0 620 595 518 567 0 398 440 0 629 440 402 660 706 387 702 589 1292 1100 235 111521995-04 4 353 0 520 0 619 583 518 559 0 394 430 0 624 439 400 653 702 392 687 585 1256 1071 233 11018
1995-05 5 347 0 519 0 617 580 506 543 0 387 437 0 619 444 399 646 700 384 683 583 1239 1053 227 109131995-06 6 343 0 515 0 618 580 506 536 0 383 440 0 607 435 400 654 700 386 680 578 1233 1035 224 10853
1995-07 7 344 0 515 0 621 586 510 520 0 385 433 0 598 435 401 653 694 379 676 574 1209 1008 235 107761995-08 8 345 0 509 0 614 587 506 509 0 385 436 0 580 435 392 652 692 364 684 574 1195 982 229 10670
1995-09 9 345 0 508 0 614 584 503 493 0 380 443 0 548 437 388 651 683 362 681 573 1181 960 227 105611995-10 10 335 0 506 0 614 585 506 489 0 379 437 0 521 438 386 652 682 356 681 573 1180 955 220 10495
1995-11 11 336.65 0 519.2 0 617.3 577.74 509.96 500.88 0 379.33 447.89 0 549.05 436.02 396.9 654.31 694.87 377 682 590.49 1250.62 1012.75 211.75 107441995-12 12 338.3 0 532.4 0 620.6 570.48 513.92 512.76 0 379.66 458.78 0 577.1 434.04 407.8 656.62 707.74 398 683 607.98 1321.24 1070.5 203.5 110791996-01 13 340 0 546 0 624 563 518 525 0 380 470 0 606 432 419 659 721 419 684 626 1394 1130 195 11251
1996-02 14 341 0 537 0 620 568 532 507 0 386 471 0 629 433 425 670 708 427 690 622 1356 1124 198 112441996-03 15 346 0 536 0 624 568 521 507 0 379 475 0 618 438 420 663 708 448 682 619 1318 1094 212 11176
1996-04 16 342 0 534 0 624 568 517 504 0 376 479 0 612 441 414 669 702 418 682 619 1291 1125 212 111291996-05 17 341 0 544 0 627 562 507 498 0 382 470 0 585 446 416 662 709 413 689 656 1296 1061 203 11067
1996-06 18 337 0 547 0 632 559 511 503 0 386 469 0 594 442 411 674 702 416 691 657 1287 1060 213 110911996-07 19 345 0 549 0 634 562 508 493 0 384 474 0 599 443 411 672 694 416 688 610 1266 1038 235 11021
1996-08 20 348 0 554 0 633 560 500 471 0 393 478 0 585 444 408 673 680 414 686 605 1239 1013 235 109191996-09 21 343 0 549 0 632 557 499 460 0 393 472 0 571 446 409 668 678 407 674 600 1234 985 227 10804
1996-10 22 337 0 549 0 635 560 492 455 0 393 467 0 547 443 395 665 678 404 672 597 1229 979 225 107221996-11 23 334.69 0 551.31 0 636.32 573.86 495.96 485.69 0 398.94 472.61 0 570.76 439.04 399.3 615.83 696.15 420 676 614.82 1301.27 1060.51 214.44 11036
1996-12 24 332.38 0 553.62 0 637.64 587.72 499.92 516.38 0 404.88 478.22 0 594.52 435.08 403.6 566.66 714.3 436 681 632.64 1373.54 1142.02 203.88 113491997-01 25 330 235 556 0 639 602 504 548 0 411 484 0 619 431 408 516 733 453 685 651 1448 1226 193 11672
1997-02 26 330 235 564 0 640 602 504 540 0 398 485 0 613 435 411 517 728 454 671 643 1417 1178 207 115721997-03 27 337 244 574 0 642 606 509 526 0 395 464 0 600 432 411 505 713 450 673 635 1393 1143 224 11476
1997-04 28 337 236 572 0 646 599 502 528 0 396 464 0 595 433 409 499 716 447 667 633 1365 1137 225 114061997-05 29 335 236 574 0 646 601 498 514 0 393 448 0 590 427 415 500 720 448 661 632 1361 1147 202 11348
1997-06 30 339 239 590 0 655 595 496 518 0 397 458 0 584 427 420 499 716 448 664 632 1348 1130 214 113691997-07 31 340 243 594 0 654 591 499 513 0 396 458 0 579 429 417 494 713 445 657 630 1333 1117 223 11325
1997-08 32 341 238 600 0 657 586 496 494 0 406 452 0 570 438 415 496 715 448 654 631 1314 1132 222 113051997-09 33 341 234 604 0 651 583 498 487 0 400 442 0 557 438 418 498 713 439 653 632 1301 1117 216 11222
1997-10 34 340 229 601 0 643 584 497 471 0 398 445 0 541 435 415 498 713 432 652 632 1298 1115 205 111441997-11 35 342.64 238.9 544.57 0 653.89 568.82 505.58 500.04 0 395.03 411.67 0 575.32 433.68 405.1 505.59 719.27 453 640 631.67 1385.45 1169.45 202.36 113971997-12 36 345.28 248.8 488.14 0 664.78 553.64 514.16 529.08 0 392.06 378.34 0 609.64 432.36 395.2 513.18 725.54 474 628 631.34 1472.9 1223.9 199.72 11650
1998-01 37 348 259 430 0 676 538 523 559 0 389 344 349 645 431 385 521 732 495 616 631 1563 1280 197 119111998-02 38 349 257 431 0 670 544 532 559 0 392 346 350 639 427 391 540 727 493 620 630 1539 1257 208 11901
1998-03 39 339 257 429 0 661 551 527 525 0 392 356 349 637 424 387 533 721 490 609 654 1506 1215 220 117821998-04 40 343 259 437 0 647 552 524 528 0 393 346 349 630 422 384 522 714 489 595 655 1498 1175 234 11696
1998-05 41 349 259 439 0 661 548 518 512 0 391 346 365 635 411 386 523 710 516 582 653 1500 1165 234 117031998-06 42 349 259 435 0 664 552 524 514 0 392 349 365 638 415 385 521 710 478 589 653 1487 1163 240 11682
1998-07 43 349 259 429 0 665 556 518 518 0 393 365 364 622 416 383 528 715 477 583 640 1464 1138 240 116221998-08 44 349 253 434 0 663 554 523 491 0 388 366 361 621 417 388 521 715 483 581 639 1447 1113 254 11561
1998-09 45 346 256 431 0 652 556 527 484 0 382 366 361 600 413 386 517 714 483 578 631 1434 1103 239 114591998-10 46 336 256 428 0 647 556 525 483 0 381 362 362 585 409 385 516 714 474 578 631 1427 1095 236 11386
1998-11 47 321.15 273.49 446.81 0 597.5 527.95 503.88 480.36 0 393.87 354.08 372.89 613.71 387.88 384 527.55 717.3 499 586 644.53 1513.46 1153.74 216.86 116641998-12 48 306.3 290.98 465.62 0 548 499.9 482.76 477.72 0 406.74 346.16 383.78 642.42 366.76 383 539.1 720.6 524 594 658.06 1599.92 1212.48 197.72 11942
1999-01 49 291 309 485 249 497 471 461 475 200 420 338 395 672 345 382 551 724 550 602 672 1689 1273 178 122291999-02 50 292 322 483 249 497 473 466 481 198 426 337 402 670 347 377 558 725 552 603 675 1683 1267 193 12276
1999-03 51 295 320 483 247 500 468 462 450 197 429 340 399 662 349 373 568 720 556 587 676 1664 1242 205 121921999-04 52 295 314 482 244 495 464 460 452 190 426 335 403 660 349 372 559 712 562 584 676 1648 1217 207 12106
1999-05 53 293 301 487 246 496 464 459 434 189 428 338 403 629 355 376 564 716 551 572 670 1632 1202 196 120011999-06 54 294 311 479 247 500 469 446 434 187 421 337 401 632 362 379 564 716 552 555 670 1605 1182 206 11949
1999-07 55 298 310 479 246 500 472 452 428 185 423 339 399 630 356 382 569 714 558 554 679 1581 1157 223 119341999-08 56 293 312 478 249 496 468 449 426 185 423 333 406 627 352 381 577 713 554 546 682 1559 1134 228 11871
1999-09 57 293 317 469 244 496 467 453 425 190 416 330 407 604 351 384 579 711 555 545 683 1553 1124 244 118401999-10 58 291 317 468 244 496 467 453 425 190 415 330 405 566 348 379 577 710 550 546 682 1550 1119 236 117641999-11 59 282.42 322.28 471.63 257.2 498.97 459.41 449.37 439.85 194.6 411.04 323.07 401.04 600.98 345.69 395.2 572.71 717.59 552 572 683.32 1576.4 1204.8 216.53 11948
1999-12 60 273.84 327.56 475.26 270.4 501.94 451.82 445.74 454.7 199.2 407.08 316.14 397.08 635.96 343.38 411.3 568.42 725.18 554 598 684.64 1602.8 1290.6 197.06 121322000-01 61 265 333 479 284 505 444 442 470 204 403 309 393 672 341 428 564 733 556 625 686 1630 1379 177 12322
2000-02 62 266 334 472 284 506 442 449 456 206 402 309 395 667 340 422 558 739 558 626 681 1616 1375 187 122902000-03 63 271 330 469 285 499 441 446 438 212 400 310 394 644 342 417 544 741 543 631 681 1598 1349 186 12171
2000-04 64 274 329 466 287 497 441 448 446 211 397 313 393 630 345 413 539 741 542 619 679 1569 1326 188 120932000-05 65 275 315 469 289 498 437 449 419 210 396 319 392 627 346 410 541 750 538 615 676 1553 1322 189 12035
2000-06 66 273 323 472 287 499 436 451 423 205 392 312 395 621 348 411 539 751 542 608 667 1535 1307 196 119932000-07 67 273 325 473 287 500 436 448 411 202 398 316 395 616 347 411 536 745 536 607 665 1520 1292 194 11933
2000-08 68 277 325 468 277 498 440 444 399 207 391 315 398 603 347 411 538 737 527 603 663 1490 1310 189 118572000-09 69 276 330 462 278 500 438 445 398 206 383 315 397 587 348 406 538 728 520 602 660 1470 1249 208 11744
2000-10 70 275 328 461 278 496 437 446 396 207 383 313 397 570 347 406 535 727 514 600 658 1463 1247 202 116862000-11 71 271.7 326.68 461.66 285.59 496 437.66 441.05 409.2 214.3 389.93 310.36 398.65 581.88 339.41 402.7 537.97 725.02 532 596 662.62 1499.63 1313.33 191.11 11825
2000-12 72 268.4 325.36 462.32 293.18 496 438.32 436.1 422.4 221.5 396.86 307.72 400.3 593.76 331.82 399.4 540.94 723.04 551 591 667.24 1536.26 1379.66 180.22 119632001-01 73 265 324 463 301 496 439 431 436 229 404 305 402 606 324 396 544 721 570 587 672 1574 1448 169 12106
2001-02 74 261 336 467 303 498 437 428 427 229 396 301 408 612 327 404 541 716 573 589 661 1554 1451 171 120902001-03 75 252 332 472 302 497 441 437 413 230 390 297 408 595 327 408 542 716 560 581 657 1525 1439 180 12001
2001-04 76 255 324 471 300 501 437 433 405 226 386 297 407 579 325 413 543 716 559 570 650 1505 1420 197 119192001-05 77 259 331 468 298 497 437 432 392 226 392 300 398 573 328 409 547 709 557 569 656 1503 1395 183 11859
2001-06 78 262 320 476 297 493 440 430 394 229 385 300 402 572 329 415 542 708 550 573 658 1493 1370 187 118252001-07 79 262 330 459 291 495 437 425 392 227 392 304 409 554 328 415 537 707 544 579 654 1465 1357 195 11758

72
THIS PAGE INTENTIONALLY LEFT BLANK

73
APPENDIX B. FEM METHOD ON A SPREADSHEET
The spreadsheet implementation of Winter’s method contains an extra column for
the seasonal factors. Also, a space must be provided for 12 periods of seasonal factors, s-
11 through s0. The following steps outline the procedure for the data set for ATS for years
1997 to 2000. The data set contains 48 points. FEM was specifically designed for data
set distribution with less than 36 periods and for its ability to generate optimal values for
α, β , and γ using Microsoft Excel Solver.
• Initialization. Starting from the original FEM2DATSET.xls file, copy the trouble call data from years 1998 to 2000 values in the range B3:B38. To make room for the starting values Lo, To, and the initial seasonal factors, insert 11 blank rows below row C3:C14. These rows will refer to months “-11” through “0.” Then enter the vales for Lo, To, and s-11 through s0 in cells B14, C14, and the range D3:D62. (See Figure 3.1.)
• Smoothing constants. Enter values of the smoothing constants α, β , and γ, such as 0.50, 0.40, and 0.60, in cells I3:I5. The smoothing constants shown in Figure 3.1 are “optimal,” as will be explained shortly.)
• Levels (αα ). To implement Equation 3.1, enter the formula
=$I$2*A15/I3 + (1-$M$15)*(G14 + H14)
in cell G15 and copy it to the range G16:G62.
• Trends (ββ ). To implement Equation 3.2, enter the formula
= $M$17*(G15 – G14)*(1 - $M$17)*H14
in cell H15 and copy to range H16:H62.
• Seasonal factors (γγ ). To implement Equation 3.3, enter the formula
=$M$19*F15/G15 + (1 - $M$19)*I3
in cell I15 and copy it to the range I16:I38.
• Forecasts. The one-month ahead forecast can now be calculated in column J. In cell J15, enter the formula.

74
=(G14 + H14)*I3
and copy it to the range J16:J39. Note the forecast in cell J39 is for month 25,
made in month 24. Forecasts for months 26 and beyond can be made in month
24 by entering the formula
= (G38 + 2*H38)*I28
in cell J40. These forecasts are really composed of two parts. The part inside the
parenthesis is the forecast of the deseasonalized value: the level plus a multiple
of the trend. Then this deseasonalized is multiplied by the appropriate seasonal
factor to “reseasonalize” the forecast.
• Forecast errors. Calculate the errors, the absolute errors, and the MAD in columns K, L and I.
• Graph. Use columns A, F, and J (along with the labels in row 2) to draw a line graph of the forecasts against the actual District Enrollment values as shown in Figure 3.11. Although the agreement is far from perfect, the seasonality is captured quite well. The agreement between predicted and actual enrollment is least good during months 15 and 17. During these months the forecasts are much too high. Perhaps some type anomaly occurred during those months and requires further investigation by the enrollment manager.
• Optimize MAD. To optimize the MAD, the Solver function of Excel can be used to find the “best” smoothing constants of α, β , and γ. Invoke the Solver function with the following settings:
Ø The cell to minimize is L39 (MAD)
Ø The changing cells are M15, M17, and M19
Ø The constraints are that α, β , and γ must be between values 0 and 1.
Note: Although the values of α and β that minimizes the MAD should not exceed
0.5 (as in the Holt method), it is not uncommon for the best value of γ to exceed 0.5.
This is because for monthly data, each monthly seasonal factor is updated during only
1/12 of all periods. Since the seasonal factors are updated so infrequently, there is a need

75
to sometimes give more weight to each observation so that γ > 0.5 is not out of the
question.
Key Cell Formulas
Cell Formula Copied to F3 =((C3/AVERAGE($C$3:$C$14))) F4:F14 D14 =C14/F14 -------- D15 =$K$3*C15/F3 + (1-$K$3)*(D14+E14) D16:D38 E14 =0 -------- E15 =$K$4*(D15-D14)+(1-$K$4)*E14 E16:E38 F15 =$K$5*(C15/D15) + (1-$K$5)*F3 F16:F38 G15 =SUM(D14:E14)*F3 G16:G38 H15 =C15-G15 H16:H38 I15 =ABS(H15) I16:I38 K6 =AVERAGE(I15:I38) -------- K7 =SUMXMY2(G15:G38,C15:C38)/COUNT(G15:G38) -------- G39 =($D$38+C3*$E$38)*F27 G40:G50
Note: for increased accuracy make the following substitution:
Cell Formula Copied to F3 =((C3/AVERAGE($C$3:$C$14)) F4:F14
+(C15/AVERAGE($C$15:$C$26)) +(C27/AVERAGE($C$27:$C$38))) / (COUNT($C$3:$C$38)/12)

76
THIS PAGE INTENTIONALLY LEFT BLANK

77
APPENDIX C. FORECAST.XLA ON A SPREADSHEET
Once FORECAST.xla is loaded, the Forecast menu containing the following
items will appear:
• Choose Forecast u Run Forecast.
• Select data file or column from Excel spreadsheet.
• In Data, enter the column containing the time series.
• In Series Type, select Trended Two Parameter Smoothing and Seasonal (12 Month).
• Then click OK.

78
THIS PAGE INTENTIONALLY LEFT BLANK

79
APPENDIX D. FEM MPUSD ENROLLMENT OUTPUT
Total TotalSchool Site K 1 2 3 4 5 6 7 8 9 10 11 12 Site-Calc Site-Fore
Bay View 35 28 40 57 45 41 247 247
Cabrillo 48 66 70 60 60 43 348 347
Crumpton 78 78 77 71 71 77 451 460
Del Monte 37 70 64 38 48 47 304 312
Del Rey Woods 91 89 71 76 68 70 465 465
Foothill 73 53 63 64 99 70 422 410
Highland 72 63 85 67 60 68 415 415
La Mesa 66 69 63 57 53 65 372 372
Larkin 53 38 37 36 36 51 251 250
Manzanita 68 59 71 68 66 54 387 387
Marina Del Mar 39 43 39 48 53 46 269 269
Marina Vista 74 70 78 76 66 51 416 416
Marshall 129 116 97 87 73 73 575 576
Monte Vista 45 43 50 55 56 58 307 307
Olsen 66 73 82 80 57 56 415 414
Ord Terrace 98 98 88 93 102 67 546 522
Total Elementary 1074 1057 1074 1034 1015 936 6191 6171
Colton 220 244 248 712 713
Fitch 204 196 183 583 583
King 163 163 228 553 552
Los Arboles 236 210 227 672 672
Total Middle 823 812 886 2521 2520
Monterey 417 362 375 317 1471 1474
Seaside 446 398 300 282 1427 1425
Central Coast 4 57 88 29 179 182
Total High 867 818 763 628 3076 3080
11788
11771
Grand Total - Actual
Monterey Peninsula Unified School District
2001-2002 Projected 6th Month Enrollment
Grand Total - CalcGrand Total - Forecast

80
THIS PAGE INTENTIONALLY LEFT BLANK

81
APPENDIX E. FEM MPUSD STAFFING OUTPUT
TotalSchool Site K 1 2 3 4 5 6 7 8 9 10 11 12 Site-Calc
Bay View 2 2 3 3 2 2 14Cabrillo 3 4 4 4 3 2 20Crumpton 4 4 4 4 3 3 22Del Monte 2 4 4 2 2 2 16Del Rey Woods 5 5 4 4 3 3 24Foothill 4 3 4 4 4 3 22Highland 4 4 5 4 3 3 23La Mesa 4 4 4 3 2 3 20Larkin 3 2 2 2 2 2 13Manzanita 4 3 4 4 3 2 20Marina Del Mar 2 3 2 3 2 2 14Marina Vista 4 4 4 4 3 2 21Marshall 7 6 5 5 3 3 29Monte Vista 3 3 3 3 2 3 17Olsen 4 4 5 5 2 2 22Ord Terrace 5 5 5 5 4 3 27
Total Elementary 60 60 62 59 43 40 324
Colton 8 9 9 26Fitch 8 7 7 22King 6 6 8 20Los Arboles 9 8 8 25
Total Middle 31 30 32 93
Monterey 14 13 13 11 51Seaside 15 14 10 10 49Central Coast 1 3 5 2 11
Total High 30 30 28 23 111Grand Total 528
Monterey Peninsula Unified School District2001-2002 Projected 6th Month Staffing

82
THIS PAGE INTENTIONALLY LEFT BLANK

83
APPENDIX F. ACTUAL BIRTHS MPUSD BY ZIP CODE
Actual Birth Second Month
Number YEAR SCHOOL YEAR
Monterey 93940
Fort Ord 93941
NPS/DLI 93942/3/4
Marina 93933
Seaside 93955
Total Birth
Kindergarten Enrollment
District-wide Enrollment
19881988-1989 1673 13644
1 19891989-1990 558 841 15 387 500 2301 1669 14034
2 19901990-1991 536 944 14 376 539 2409 1534 14427
3 19911991-1992 559 939 14 380 601 2493 1654 14719
4 19921992-1993 534 938 14 404 587 2477 1569 14518
5 19931993-1994 541 608 10 318 548 2025 1209 11914
6 19941994-1995 439 191 6 305 574 1515 1104 11299
7 19951995-1996 386 3 11 293 760 1453 1118 11244
8 19961996-1997 259 0 3 259 705 1226 1157 11572
9 19971997-1998 383 0 3 291 705 1382 1204 11901
10 19981998-1999 357 0 2 286 755 1400 1219 12276
11 19991999-2000 320 0 3 291 720 1334 1147 12290
12 20002000-2001 343 0 4 306 727 1380 1140 12090
Forecast 13 20012001-2002
Forecast 14 20022002-2003
Totals 5215 4464 99 3896 7721 21395 15724 152284
Average 434.5833 372 8.25 324.6667 643.41671782.9
17 1310.333333 12690.33333
Source: Monterey County Health Department, March 28, 2001.

84
THIS PAGE INTENTIONALLY LEFT BLANK

85
LIST OF REFERENCES Bergman, B. and Klefsjo, B. Quality from the Customer Needs to Customer Satisfaction. McGraw-Hill Book Company. 1994. California Association of School Business Officials (CASBO). The World of Attendance Accounting (1998 Edition), July 1998. Dardia, M. (1996). The Efforts of Military Base Closures on Local Communities: A Short-Term Perspective. RAND. 1996. Dixon, R.R., ed. (1995). Making Enrollment Management Work. New Directions for Student Services No. 71 San Francisco: Jossey-Bass.DMG-Maximus (2001). SchoolMax: Student Information System. Duman, J. (2000). MPUSD Making Do With Fewer Dollars This Year. Monterey County The Herald. Knight Ridder. August 07, 2000. Section A1& A6. Friedrich, A. (2000). How the Deficit Ballooned. Monterey County The Herald. Knight Ridder. August 14, 2000. Section A1 & A10. Friedrich, A. (2000). MPUSD: Missed Opportunities. Monterey County The Herald. Knight Ridder. August 15, 2000. Section A1 & A10. Friedrich, A. (2000). What Went Wrong at MPUSD. Monterey County The Herald. Knight Ridder. August 13, 2000. Section A1 & A10. Hamilton, L.C.(1992). Regression with Graphics: A Second Course in Applied Statistics. Duxbury Press. Herrera, J. (2001). Monterey Peninsula Population by the Numbers: Census 2000. Monterey County The Herald. Knight Ridder. August 13, 2000. Section A1 & A10. Hossler, D., J.P. Bean, and Associates, eds. (1990). The Strategic Management of College Enrollments. San Francisco: Jossey-Bass. L.(1998). Insight.xla: Business Analysis Software for Microsoft Excel. Duxbury Press. MCHD (2001). MPUSD Birth Rates. Monterey County Health Department. March 28, 2001 (update). Microsoft Corporation, Microsoft Excel 2000, Redmond, WA, 2000.

86
Moore, S. (2000). Surprise Just One Element of Census: Cities Estimates Come up Short. Monterey County The Herald. Knight Ridder. March 31, 2001. Section A1 & A16. MPUSD (2000). Audited Budgets Section J-201R (Revenue Details). MPUSD (2001), Cumulative Records Division: Elementary and Middle School Only. April 2001. MPWMD (2000). Monterey Peninsula Water Management District. 1999 Annual report. NMISA. (2001). Champions for Children Seminar. National Military Impacted Schools Association. February 9, 2001. Noel-Levitz National Center for Enrollment management. (1996). Fall 1995 National Enrollment Management Survey. Executive Summary of Findings: Four-Year Colleges and Universities. Littleton, Colo.: Penn. Office of Economic Adjustment (1993). Civilian Reuse of Former Military Bases: A Summary of Completed Military Base Adjustment Projects. Washington, DC. U.S. Department of Defense. September 1993. Penn, G.(1999). Enrollment Management for the 21st Century: Institutional Goals, Accountability, and Fiscal Responsibility. ASHE-ERIC Higher Education Report Volume 26, No. 7. Washington, D.C.: The George Washington University, Graduate School of Education and Human Development. Ragsdale, C.T.(1998). Spreadsheet Modeling and Decision Analysis: A Practical Introduction to Management Science. Second Edition. South-Western College. Savage, S. RKG Associates, Inc. Economic Impact Analysis of the Downsizing of Fort Ord on Monterey County. Durham, N.H.: RKG Associates., June 1992. Schmitt, Eric (1993). “A Mission Accomplished.” New York Times. June 29, 1993. p. A10. Tersine, R.J.(1994). Principles of Inventory and Materials Management. Fourth Edition. PTR Prentice-Hall Publishing. Zeithaml, V.A., Parasuraman, A. and Berry, L.L. (1990). Delivering Quality Service. The Free Press, New York.

87
INITIAL DISTRIBUTION LIST 1. Defense Technical Information Center....................................................................2
8725 John J. Kingman Rd., STE 0944 Fort Belvoir, Virginia 22060-6218
2. Dudley Knox Library...............................................................................................2 Naval Postgraduate School 411 Dyer Rd. Monterey, California 93943-5101
3. Dr. Samuel Buttrey ..................................................................................................2
Operations Research Department (Code OR/SB) Naval Postgraduate School 1411 Cunningham Road Monterey, California 93943
4. Lyn R. Whitaker.......................................................................................................2 Operations Research Department (Code OR/LW) Naval Postgraduate School 1411 Cunningham Road Monterey, California 93943
5. LCDR Stan Dobbs ...................................................................................................2 C/O Nancy D. Miles PO Box 434 Johnston, SC 29832
6. Alpha Phi Alpha, Fraternity.....................................................................................1 Kappa Alpha Lambda Chapter PO Box 1128 Seaside, CA 93955
7. Monterey Peninsula Unified School District (MPUSD)………………………….2 C/O Dr. Bob Infelise, Superintendent 700 Pacific Street, Monterey Monterey, CA 93940
8. University of Memphis ............................................................................................1 C/O Library 3807 Norriswood Drive Memphis, TN 38118

88
9. Edgefield County Department of Education............................................................1 C/O Superintendent 98 Calhoun Street Johnston, SC 29832