![Bach Cantatas, Vol. 5 - N. Harnoncourt & G. Leonhardt ...Teldec-2CD].pdf · JOHANN SEBASTIAN BACH (1685-1750) Das Kantatenwerk vol. 5 CA)mplete Cantatas les Cantates KANTATE 17 „](https://static.fdocuments.net/doc/165x107/5b9f3d0309d3f2e02c8cd0e7/bach-cantatas-vol-5-n-harnoncourt-g-leonhardt-teldec-2cdpdf-johann.jpg)
THESIS - Defense Technical Information · PDF fileshe was instrumental in getting me organized...
95
MONTEREY, CALIFORNIA THESIS Approved for public release; distribution is unlimited. THE IMPACT OF THE SUMMER SEMINAR PROGRAM ON MIDSHIPMAN PERFORMANCE: DOES SUMMER SEMINAR PARTICIPATION INFLUENCE SUCCESS AT THE NAVAL ACADEMY? by Michael A. Norton June 2004 Thesis Co-Advisors: Armando Estrada Linda Mallory
Transcript of THESIS - Defense Technical Information · PDF fileshe was instrumental in getting me organized...

MONTEREY, CALIFORNIA
THESIS
Approved for public release; distribution is unlimited.
THE IMPACT OF THE SUMMER SEMINAR PROGRAM ON MIDSHIPMAN PERFORMANCE: DOES SUMMER
SEMINAR PARTICIPATION INFLUENCE SUCCESS AT THE NAVAL ACADEMY?
by
Michael A. Norton
June 2004
Thesis Co-Advisors: Armando Estrada Linda Mallory

THIS PAGE INTENTIONALLY LEFT BLANK
i
REPORT DOCUMENTATION PAGE Form Approved OMB No. 0704-0188 Public reporting burden for this collection of information is estimated to average 1 hour per response, including the time for reviewing instruction, searching existing data sources, gathering and maintaining the data needed, and completing and reviewing the collection of information. Send comments regarding this burden estimate or any other aspect of this collection of information, including suggestions for reducing this burden, to Washington headquarters Services, Directorate for Information Operations and Reports, 1215 Jefferson Davis Highway, Suite 1204, Arlington, VA 22202-4302, and to the Office of Management and Budget, Paperwork Reduction Project (0704-0188) Washington DC 20503. 1. AGENCY USE ONLY (Leave blank)
2. REPORT DATE June 2004
3. REPORT TYPE AND DATES COVERED Master’s Thesis
4. TITLE AND SUBTITLE: Title (Mix case letters) The Impact of the Summer Seminar Program on Midshipman Performance: Does Summer Seminar Participation Influence Success at the Naval Academy?
6. AUTHOR(S) Michael A. Norton
5. FUNDING NUMBERS
7. PERFORMING ORGANIZATION NAME(S) AND ADDRESS(ES) Naval Postgraduate School Monterey, CA 93943-5000
8. PERFORMING ORGANIZATION REPORT NUMBER
9. SPONSORING /MONITORING AGENCY NAME(S) AND ADDRESS(ES) N/A
10. SPONSORING/MONITORING AGENCY REPORT NUMBER
11. SUPPLEMENTARY NOTES The views expressed in this thesis are those of the author and do not reflect the official policy or position of the Department of Defense or the U.S. Government.
12a. DISTRIBUTION / AVAILABILITY STATEMENT Approved for public release; distribution is unlimited.
12b. DISTRIBUTION CODE
13. ABSTRACT (maximum 200 words) It is unknown if the Summer Seminar program, which gives rising high school seniors a six-day look at Naval
Academy life, has resulted in a more successful midshipman. While not previously discussed in literature, there are an abundance of studies on civilian recruiting and orientation programs, as well as realistic job previews and expectation-lowering procedures. Based on this literature, it is theorized that Summer Seminar program participation will be positively correlated to increased graduation rates and increased academic cumulative quality point ratings, as well as increased military and physical performance. This hypothesis was tested using multiple hierarchical regressions on population data obtained from the Classes of 1997 through 2003. Success is defined using seven dependent variables organized by academic, military, and physical performance. The key independent variable is participation in the Summer Seminar program, while eleven other independent variables control for demographics, selection criteria, and proven indicators of success. Participation in the Summer Seminar program had a significant relation to increased graduation rates, increased academic cumulative quality point ratings, increased military cumulative quality point ratings, and increased physical readiness test scores. This study concludes that the Summer Seminar program makes a unique contribution to midshipman success at the Naval Academy.
15. NUMBER OF PAGES
95
14. SUBJECT TERMS Summer Seminar Program, College Recruiting, College Orientation, Realistic Job Preview, Expectation-Lowering Procedure, Performance, Academic Performance, Military Performance, Physical Performance, United States Naval Academy, USNA, Midshipman, Midshipmen, College Admissions 16. PRICE CODE
17. SECURITY CLASSIFICATION OF REPORT
Unclassified
18. SECURITY CLASSIFICATION OF THIS PAGE
Unclassified
19. SECURITY CLASSIFICATION OF ABSTRACT
Unclassified
20. LIMITATION OF ABSTRACT
UL
NSN 7540-01-280-5500 Standard Form 298 (Rev. 2-89) Prescribed by ANSI Std. 239-18

ii
THIS PAGE INTENTIONALLY LEFT BLANK

iii
Approved for public release; distribution is unlimited.
THE IMPACT OF THE SUMMER SEMINAR PROGRAM ON MIDSHIPMAN PERFORMANCE: DOES SUMMER SEMINAR PARTICIPATION INFLUENCE
SUCCESS AT THE NAVAL ACADEMY?
Michael A. Norton Lieutenant, United States Navy
B.S., United States Naval Academy, 1997
Submitted in partial fulfillment of the requirements for the degree of
MASTER OF SCIENCE IN LEADERSHIP AND HUMAN RESOURCE DEVELOPMENT
from the
NAVAL POSTGRADUATE SCHOOL June 2004
Author: Michael A. Norton
Approved by:
Dr. Armando Estrada Thesis Co-Advisor
Dr. Linda Mallory Thesis Co-Advisor
Dr. Douglas A. Brook Dean, Graduate School of Business and Public Policy

iv
THIS PAGE INTENTIONALLY LEFT BLANK

v
ABSTRACT It is unknown if the Summer Seminar program, which gives rising high school
seniors a six-day look at Naval Academy life, has resulted in a more successful
midshipman. While not previously discussed in literature, there are an abundance of
studies on civilian recruiting and orientation programs, as well as realistic job previews
and expectation-lowering procedures. Based on this literature, it is theorized that
Summer Seminar program participation will be positively correlated to increased
graduation rates and increased academic cumulative quality point ratings, as well as
increased military and physical performance. This hypothesis was tested using multiple
hierarchical regressions on population data obtained from the Classes of 1997 through
2003. Success is defined using seven dependent variables organized by academic,
military, and physical performance. The key independent variable is participation in the
Summer Seminar program, while eleven other independent variables control for
demographics, selection criteria, and proven indicators of success. Participation in the
Summer Seminar program had a significant relation to increased graduation rates,
increased academic cumulative quality point ratings, increased military cumulative
quality point ratings, and increased physical readiness test scores. This study concludes
that the Summer Seminar program makes a unique contribution to midshipman success at
the Naval Academy.

vi
THIS PAGE INTENTIONALLY LEFT BLANK
vii
TABLE OF CONTENTS
I. INTRODUCTION........................................................................................................1 A. BACKGROUND ..............................................................................................1 B. PURPOSE.........................................................................................................2 C. SCOPE AND METHODOLOGY ..................................................................2
1. Scope......................................................................................................2 2. Methodology .........................................................................................3
D. ORGANIZATION OF STUDY ......................................................................3
II. LITERATURE REVIEW ...........................................................................................5 A. INTRODUCTION............................................................................................5 B. RECRUITING AND ORIENTATION PROGRAMS..................................5
1. Job Recruiting ......................................................................................5 2. College Recruiting and Orientation ...................................................6 3. Effects Beyond the Naval Academy....................................................8 4. Realistic Job Previews and Expectation-Lowering Procedures ......8
C. THE SUMMER SEMINAR PROGRAM....................................................10 1. The Summer Seminar Program Defined .........................................10 2. Summer Seminar Program Participants .........................................12
D. SUCCESS AT THE NAVAL ACADEMY ..................................................13 1. What to Measure................................................................................13 2. Measures of Success...........................................................................15 3. Past Studies of Success.......................................................................20 4. Gaining Admission.............................................................................21
E. SUMMARY ....................................................................................................21
III. RESEARCH METHODOLOGY .............................................................................23 A. INTRODUCTION..........................................................................................23 B. DATA DESCRIPTION AND VARIABLES ...............................................23
1. Data Description.................................................................................23 2. Independent Variables.......................................................................24 3. Dependent Variables..........................................................................28 4. Descriptive Statistics..........................................................................32
C. REGRESSION THEORY.............................................................................35 1. Logistic Regression ............................................................................35 2. Linear Regression ..............................................................................37
D. MODELS OF REGRESSIONS ....................................................................38 1. Logistic Regression ............................................................................38 2. Linear Regression ..............................................................................40
E. SUMMARY ....................................................................................................41
IV. DATA ANALYSIS.....................................................................................................43 A. INTRODUCTION..........................................................................................43 B. CORRELATIONAL ANALYSES ...............................................................43
viii
C. REGRESSION ANALYSES OF SUMMER SEMINAR PARTICIPATION ON ACADEMIC PERFORMANCE VARIABLES..47 1. Graduation Rate.................................................................................47 2. Academic Cumulative Quality Point Rating ...................................49 3. Major Selection ..................................................................................51
D. REGRESSION ANALYSES OF SUMMER SEMINAR PARTICIPATION ON MILITARY PERFORMANCE VARIABLES ...53 1. Military Cumulative Quality Point Rating......................................53 2. Striper Selection.................................................................................55 3. Honor and Major Conduct Offenses................................................57
E. REGRESSION ANALYSIS OF SUMMER SEMINAR PARTICIPATION ON PHYSICAL READINESS TEST SCORES ........59
F. SUMMARY ....................................................................................................61
V. CONCLUSIONS AND RECOMMENDATIONS...................................................63 A. INTRODUCTION..........................................................................................63 B. CONCLUSIONS ON ANALYSES OF ACADEMIC
PERFORMANCE VARIABLES..................................................................64 1. Graduation Rate.................................................................................64 2. Academic Cumulative Quality Point Rating ...................................65 3. Major Selection ..................................................................................65
C. CONCLUSIONS ON ANALYSES OF MILITARY PERFORMANCE VARIABLES ..................................................................................................66 1. Military Cumulative Quality Point Rating......................................66 2. Striper Selection.................................................................................66 3. Honor and Major Conduct Offenses................................................67
D. CONCLUSIONS ON ANALYSIS OF PHYSICAL READINESS TEST SCORES ..............................................................................................68
E. SUMMARY AND RECOMMENDATIONS...............................................68
APPENDIX A.........................................................................................................................73
LIST OF REFERENCES......................................................................................................75
INITIAL DISTRIBUTION LIST .........................................................................................81

ix
LIST OF TABLES
Table 1. Summer Seminar Participation by Class Year.................................................11 Table 2. Scores on Independent Variables for the Classes of 1997 through 2003 ........13 Table 3. Components of Order of Merit ........................................................................17 Table 4. Components of Military Cumulative Quality Point Rating .............................18 Table 5. Candidate Multiple Variable Weights for the Class of 2003...........................21 Table 6. Independent Variables .....................................................................................24 Table 7. Dependent Variables........................................................................................28 Table 8. Academic Major Codes....................................................................................29 Table 9. Discrete Independent Variable Frequencies ....................................................33 Table 10. Discrete Dependent Variable Frequencies.......................................................34 Table 11. Descriptives for Continuous Variables ............................................................35 Table 12. Order of Independent Variable Entry for Regressions ....................................39 Table 13. Correlation Matrix ...........................................................................................44 Table 14. Regression Results for Graduation Rate ..........................................................48 Table 15. Regression Results for Academic Cumulative Quality Point Rating ..............50 Table 16. Regression Results for Major Selection...........................................................52 Table 17. Regression Results for Military Cumulative Quality Point Rating .................54 Table 18. Regression Results for Striper Selection..........................................................56 Table 19. Regression Results for Honor and Major Conduct Offenses...........................58 Table 20. Regression Results for Physical Readiness Test Scores ..................................60 Table 21. Summary of Significant Independent Variables ..............................................62

x
THIS PAGE INTENTIONALLY LEFT BLANK

xi
ACKNOWLEDGMENTS I am grateful to the Navy and the Naval Academy for allowing me to dedicate a
year of my career to getting a Master’s degree. In particular, I would like to thank my
two advisors, Armando and Linda. In an orientation presentation during the first week of
the LEAD program, Armando inspired me to complete my thesis well ahead of schedule.
As my advisor during the next ten months, he continually challenged me to stay ahead of
my timeline and provided invaluable assistance in the analysis of my data. Linda
provided me the direction I needed in choosing a topic for my thesis. She took me from
“I have no clue what I want to do” to a well-defined thesis topic in short order. As well,
she was instrumental in getting me organized to start my thesis and in getting me the data
I needed to complete it. Most importantly, I would like to thank my wife, Becky, and our
baby that, as I type this acknowledgement, is due to be born any day. You both provided
me with the real motivation that I needed to finish this thesis early, as well as the means
to keep things in perspective over the past ten months. I am truly grateful for this.

xii
THIS PAGE INTENTIONALLY LEFT BLANK
1
I. INTRODUCTION
A. BACKGROUND
This research explores whether participation in the Summer Seminar program at
the United States Naval Academy (USNA) influences midshipman performance. The
Summer Seminar program is an admissions program that gives high school seniors a six-
day look at life at the Naval Academy before their last year of high school. The goal of
the program is to screen potential applicants to the Naval Academy to ensure that future
classes will be comprised of the best midshipmen possible. As well, it gives potential
applicants an idea of the environment at the Naval Academy, allowing them to make a
more informed decision as to whether or not they should apply for admission.
Although the Office of Admissions at the Naval Academy is aware of the type of
person they choose for participation in the Summer Seminar program and the number of
candidates chosen for a given class at the Naval Academy who attended Summer
Seminar, they do not know if the Summer Seminar program has resulted in a more
successful midshipman (Latta, personal communication, June 2003).
Despite the fact that the Summer Seminar program has not been discussed in
prior literature, there are an abundance of studies on recruiting and orientation programs
in the civilian sector, as well as realistic job previews and expectation-lowering
procedures. There is also previous research that exists on the performance of
midshipmen at the Naval Academy. While not dealing specifically with the Summer
Seminar program, these studies provide a starting point for defining successful
performance at the Naval Academy and for predicting Summer Seminar’s impact on this
performance. Part of the literature review will cover topics from these areas that can be
applied to the Summer Seminar program.
The shift from paper to computerized records has made a greater volume of data
available for this research than in past studies. The Office of Institutional Research,
Planning, and Assessment (IR) at the Naval Academy was able to provide nearly
complete data sets for the Classes of 1997 through 2003. Only two dependent variables
2
in this research were affected by the lack of data available, and these for only one or two
class years.
B. PURPOSE
The purpose of this research is to analyze whether Summer Seminar attendance
does give midshipmen a performance advantage during their years at the Naval
Academy. The problem is that it is unknown if participation in the Summer Seminar
program affects the performance of a midshipman at the Naval Academy.
This study will examine seven aspects of performance, including: (1) graduation
rate, (2) academic cumulative quality point rating, (3) major selection, (4) military
cumulative quality point rating, (5) striper selection, (6) honor and major conduct
offenses, and (7) physical readiness test scores. These seven aspects of performance will
be analyzed to determine which, if any, are affected by a midshipman’s participation in
the Summer Seminar program.
C. SCOPE AND METHODOLOGY
1. Scope
The scope of this thesis includes: (1) a review of the literature on recruiting and
orientation programs, as well as realistic job previews and expectation-lowering
procedures, (2) a review of the Summer Seminar program, and (3) a review of measures
of success at the Naval Academy. The data used for this thesis is from actual
midshipmen in the Classes of 1997 through 2003 who completed Plebe summer and at
least started their first academic semester. It is assumed that midshipmen in these classes
who attended the Summer Seminar program did so to orient themselves to life at the
Naval Academy in hopes of bettering their chances of admission.
The measures of success used in this thesis are not the only ways in which the
performance of a midshipman is measured. Although they are based on the major
performance areas as stated in the mission of the Naval Academy, there are many aspects
of a successful midshipman that they do not capture.
It is not the intent of this thesis to judge the value of the Summer Seminar
program as a whole. The program’s effect on the performance of midshipmen, as defined
in this thesis, is the only aspect being reviewed. There are many other facets of the
3
Summer Seminar program, such as the leadership experience provided to the midshipmen
who administer it, that may contribute to its value.
2. Methodology
Logistic and linear regression models suitable to the type of dependent variable
will be used in analyzing the data. Of the seven dependent variables in this thesis, four
are comprised of discrete data and three of continuous data. A logistic regression model
will be used for the discrete dependent variables, and for the continuous dependent
variables a linear regression model will be used.
The key independent variable in this study is whether or not a midshipman has
participated in the Summer Seminar program. In addition, eleven other independent
variables are included to control for demographics, admissions criteria, and proven
indicators of success at the Naval Academy. These twelve independent variables will be
entered into the regression model in four steps, the last of which will be participation in
the Summer Seminar program. This will allow for the examination of the unique effect
of the Summer Seminar program on midshipman performance.
D. ORGANIZATION OF STUDY This thesis is organized into five chapters. Chapter II provides a review of the
literature on recruiting and orientation programs, as well as realistic job previews and
expectation-lowering procedures, to give some insight into what the data may yield in
this study. It also provides an overview of the Summer Seminar program and its
participants. Additionally, relevant literature and Naval Academy instructions are
referenced in order to place some parameters on success at the Naval Academy. To
conclude the chapter, hypotheses for this study are advanced.
Chapter III describes the methodology of the study. A description of the data set
is presented, followed by an overview of the independent and dependent variables that
will be used in this thesis. The chapter concludes by exploring the theory for the data
analysis used in this thesis and by reviewing the data analysis techniques to be used.
Chapter IV presents the results of the study. This chapter is broken into sections
that focus on the three types of outcome variables examined, including academic,

4
military, and physical performance. Chapter V provides conclusions on the effect of the
Summer Seminar program on midshipman performance.

5
II. LITERATURE REVIEW
A. INTRODUCTION
This chapter is divided into three major sections. The first section reviews the
literature on recruiting and orientation programs at businesses and civilian colleges, as
well as the literature on realistic job previews and expectation-lowering procedures, to
draw empirical support for the hypotheses advanced in this thesis. The next section
provides a review of the Summer Seminar program and describes the participants of the
program. It also provides a comparison of the characteristics of program participants
with midshipmen who have not participated in this program. The third section reviews
research on midshipman performance and describes pertinent findings related to the
performance measures used in this study. To conclude the chapter, hypotheses are
advanced based on the research previously presented.
B. RECRUITING AND ORIENTATION PROGRAMS
Although academic literature on the Summer Seminar program at the Naval
Academy is non-existent, there is no shortage of literature on recruiting and orientation
programs in the civilian sector. Various job fields recruit at both the secondary and post-
secondary levels of education to attract desirable individuals to meet the needs of that
particular field. In academia, civilian colleges wish to recruit the best and brightest high
school students to attend their institutions. They accomplish this with a variety of
recruiting and orientation programs. Parallels can be drawn between these civilian
recruiting methods and the Summer Seminar program.
1. Job Recruiting
Many sectors of the private work force have targeted students as early as the
primary grades of school to expose them to particular lines of work (Bronzini, Mason,
Tarris, & Zaki, 2001; Reinstein & Garr, 1995; Rogers, 2001). This is done in hopes of
attracting these students to areas where more workers are needed.
One example of this is the civil engineering field. Since the early 1980’s, there
has been a decreasing number of students expressing interest in civil engineering. Market
research from group discussions indicated that the best way to learn what civil engineers
do is to expose people to their job. More summer jobs and workshops in civil

6
engineering were identified as methods to improve the recruitment of high school
students (Bronzini et al., 2001).
Accounting is another field that has participated in student recruiting. Facing
dwindling interest in their accounting major, the accounting department at Wayne State
University (WSU) in Detroit, Michigan began an intensive campaign to bolster interest.
This effort was centered on reaching out to students who had not yet enrolled at WSU,
and targeted mainly community colleges. Their efforts, which included open houses and
career days that exposed the community college students to accounting, resulted in a 20%
increase in accounting majors during the first year of the program (Reinstein & Garr,
1995).
The high demand for nurses has necessitated that the health care field compete for
the interest of high school students, as well. A week-long summer program was
instituted for high school freshmen and sophomores, geared toward recruiting interest in
a career in health care career (Rogers, 2001).
These work-place efforts indicate that students who are exposed to a situation
beforehand are likely to assimilate more easily into the situation. This knowledge can be
correlated to the Summer Seminar program, which offers pre-exposure to the Naval
Academy.
2. College Recruiting and Orientation
The labor market is not the only place interested in recruiting high school
students. Colleges and universities wish to lure today’s talented high school graduates, as
well. Exposure to college while still in high school has been shown to be an effective
recruiting method. A study of recruitment of students of color by two-year colleges links
dual-enrollment programs to recruiting success (Opp, 2001). The study found that
college attendance while still in high school was the fourth most significant factor in
predicting the success of a two-year college’s recruitment of students of color. While the
generalization of this data to the Naval Academy is not straight forward, the data in this
study suggests that pre-exposure to a college will lead to more successful recruitment. At
the Naval Academy, this pre-exposure takes place for some future midshipmen at the
Summer Seminar program.

7
Virginia Military Institute (VMI) offers pre-exposure to students via a freshmen
orientation program. After realizing that students with certain Myers-Briggs Type
Indicator (MBTI) scores were more likely to drop out, VMI extended their freshman
orientation program to give incoming students a better idea of what the first year at VMI
would entail. As a result of this change, attrition is down. Also, grade point averages are
up and there are fewer failures in classes among freshmen (Banta & Kuh, 1998).
Some colleges rely solely on a pre-class student orientation programs to prepare
new students for college life. These brief orientation programs are often unable to
provide realistic preparation for college life. Other civilian colleges have come to realize
the value of a more in-depth orientation, and many have begun to offer a freshman
seminar class dedicated to making the transition to college a smooth one. Participation in
such seminars has led to a greater knowledge of the services available to students as well
as increased preparedness and better study skills (Howard & Jones, 2000). For Summer
Seminar participants, this could translate into increased academic success at the Naval
Academy, among other things.
The University of Notre Dame is an example of a school with successful classes
geared towards freshmen orientation. Administrators realized that attrition of first-year
students was a problem in colleges and universities nation wide, averaging approximately
25%. In 1962, Notre Dame established a program called First Year of Students. Under
this program, students take seminar classes with assigned essays that focus on making the
students more familiar with the resources available at Notre Dame. This program is, in
part, responsible for 97% of all freshmen returning for a second year. Even after all other
factors are taken into consideration, such as the quality of the incoming students, Notre
Dame still returns 13% more freshmen than the statistical norm (Schaeffer, 1999).
This literature reviews the recruiting and orientation programs that civilian
education institutions have in place to increase the chances of success for their students.
These programs, similar to the Summer Seminar program, have been shown to lead to an
increased graduation rate and an improved academic performance.
8
3. Effects Beyond the Naval Academy
There is also evidence that pre-college orientation can be beneficial in the long
term. Participants in a first-year student wilderness orientation program conducted
during the summer of 1984 at the University of New Hampshire (UNH) were evaluated at
various points in the future to assess the effectiveness of the orientation program. The
effectiveness of the program was to be measured by reduced attrition and increased
academic performance, among other things (Galloway, 2000). In fact, analysis at the
one-year and three-and-a-half-year points confirmed the program’s effectiveness. One
year later, students who had participated in the wilderness orientation program showed
significant improvement when compared to non-participants in areas of attrition and
academic performance (Gass, 1987). Although not statistically significant at the three
and a half year point, analysis of longitudinal design showed that orientation program
attendees attrited between 12% and 20% less than non-attendees (Gass, 1990). This part
of the study confirmed previous research in the area of orientation programs on students
while at college.
In a follow-up study, half of the participants were contacted at the seventeen-year
point to ascertain the effects that the orientation program had on them later in life. This
follow-up study found that the program’s benefits extended well beyond the college
years. Using guiding questions in interviews ranging from forty-five to sixty minutes, the
author of the original study was able to extract three major themes from the participants.
The positive effect of the orientation program on the participant’s personal and
professional lives, as well as on their undergraduate experience, was one of these themes.
Specific benefits sited include direction in their careers and personal lives, as well as the
development of personal skills (Gass, Garvey, & Sugerman, 2003).
This research provides evidence that college orientation programs can have some
benefit to participants in their careers after college. Since the Naval Academy seeks to
prepare midshipmen for a career of naval service, this aspect of orientation programs
could surely add to the merits of the Summer Seminar program.
4. Realistic Job Previews and Expectation-Lowering Procedures
Another group of literature with relevance to the Summer Seminar program
includes research on realistic job previews (RJPs) and expectation-lowering procedures
9
(ELPs). Realistic job previews are methods that give job applicants a balanced
presentation of the job that they are applying for. This presentation includes both
favorable and unfavorable information about the job, rather than just the positive
information included in a typical job preview. A realistic job preview is usually
presented via personal presentation, video, or written pamphlet (Roth & Roth, 1995).
Realistic job previews differ from orientation programs in that they are always presented
to the potential employee before the job is taken, they make the potential employee think
hard about applying for the job rather than trying to convince them to apply, and they are
more narrow in scope than an orientation program (Wanous & Reichers, 2000).
Realistic job previews have been shown to have positive outcomes. In a meta-
analysis of 40 studies, 26 of which were published, realistic job previews were found to
be related to increased performance, lower attrition from the recruitment process, lower
initial expectations, lower voluntary turnover, and lower overall turnover (Phillips, 1998).
There are, however, some studies that isolate the effects of realistic job previews. A true
field experiment on the service commitment of soldiers in the Israeli Defense Force (IDF)
(Ganzach, Pazy, Ohayun, & Braynin, 2000) revealed that the effects of realistic job
previews in this setting faded over time. Realistic job previews were significantly related
to pre-entry commitment, but were not related to job commitment one year later. In
another field experiment with correctional officers (Meglino, Denisi, & Ravlin, 1993),
realistic job previews were found to be significant only after the correctional officers
remained on the job past the probationary period.
To further understand these varying results, it is important to understand how a
realistic job preview acts on the potential employee. By allowing an applicant to make a
more informed choice about a job, potential employees are believed to be self-selected
out of a job that would have been a poor match for them. Realistic job previews also
claim to foster in the applicant a sense of trust for the institution, as well as a feeling of
being cared for, due to the frankness of the information presented. Finally, they are
believed to reduce role ambiguity and strengthen an applicants commitment to the
organization, as well are reduce overly positive expectations concerning the job (Meglino
et al., 1993). A study of 82 newly hired nurses (Hom, Griffeth, Palich, & Bracker, 1998)
found that met expectations were the main reason that realistic job previews provided
10
favorable outcomes. After some scrutiny, these conclusions were retracted and replaced
with results proposing that coping strategies and perceived employer concern are the key
enablers of realistic job previews (Hom, Griffeth, Palich, & Bracker, 1999).
Due to the ambiguity in the observed outcomes of realistic job previews, some
studies have looked at other variables in concert with realistic job previews in an attempt
to explain the varied success. One of the other areas studied has been expectation-
lowering procedures. As explained above, realistic job previews are believed to lower a
potential employee’s expectations for a job due to the realistic information provided.
ELPs differ from RJPs in that they do not focus on a specific job procedure. Rather, they
provide a more general, realistic overview of a potential employee’s situation (Buckley,
Mobbs, Mendoza, Novicevic, Carraher, & Beu, 2002). Buckley et al. (2002) found that
both realistic job previews and expectation-lowering procedures were significant in
reducing an employee’s expectations. However, only expectation-lowering procedures
were significantly related to retention.
The research on realistic job previews and expectation-lowering procedures
suggests that both of these techniques may influence retention. In addition, research
shows that realistic job previews have been related to increased employee performance.
As explained in the next section, the Summer Seminar program clearly provides potential
applicants to the Naval Academy with a realistic preview of what life as a midshipman is
like. It is likely that the literature on realistic job previews and expectation-lowering
procedures can be generalized to the Summer Seminar program.
C. THE SUMMER SEMINAR PROGRAM
1. The Summer Seminar Program Defined
Past research indicates that civilian college recruiting and orientation programs
have provided a more academically successful student. Research also shows that realistic
job previews and expectation-lowering procedures can lead to increased performance and
retention. The Naval Academy Summer Seminar program is similar to these programs
and thus may yield similar effects on midshipman performance. The Summer Seminar
program is a six-day program that is designed to give rising high school seniors an
introduction to life at the Naval Academy. For three consecutive weeks in June, 600
young men and women per week experience an insider’s look at the Naval Academy.
11
The program is administered mainly by First and Third Class Midshipmen, and it is these
136 midshipmen who are charged with leading the high school seniors through their
experience.
Mr. Don Nelson, Assistant Direction of Admissions and the director of the
Summer Seminar program, states that the mission of the program (Nelson, 2003) is
to introduce high school students to the total Naval Academy experience, and specifically, the opportunities that a Naval Academy education can provide. (p. 12)
Although the program has been around for over twenty years under the Office of
Admissions, Mr. Nelson is credited with expanding the program significantly over the
past decade (Nelson, 2003).
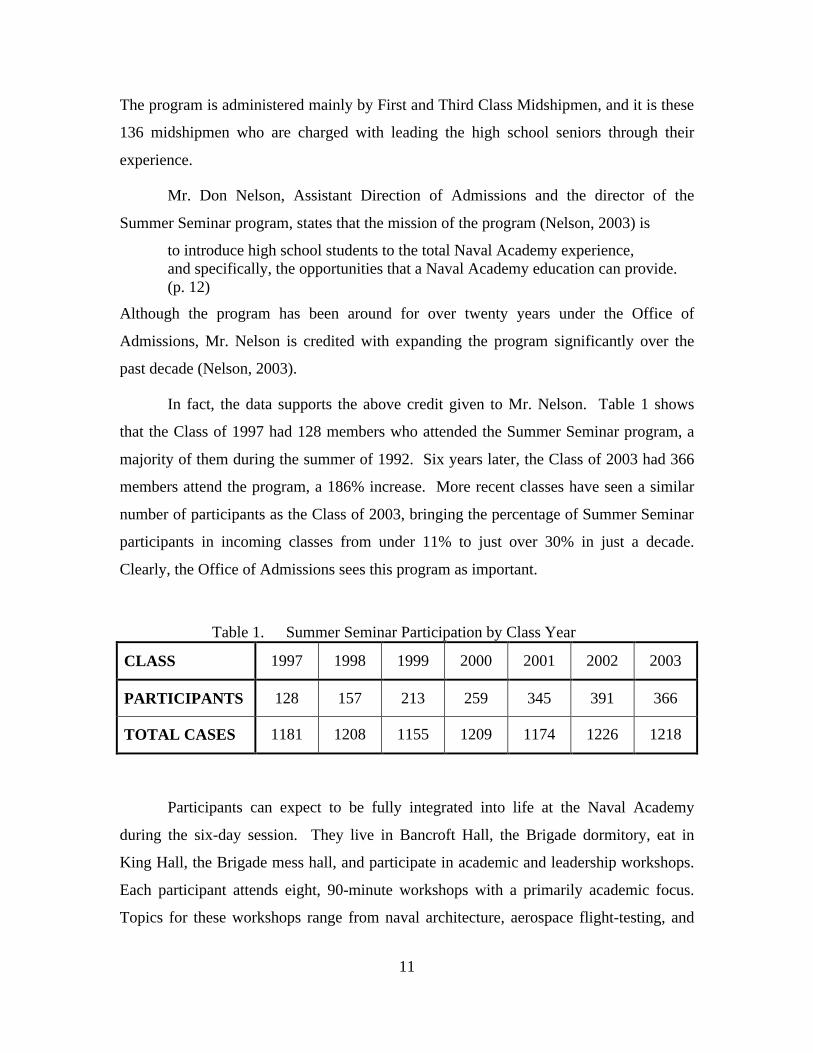
In fact, the data supports the above credit given to Mr. Nelson. Table 1 shows
that the Class of 1997 had 128 members who attended the Summer Seminar program, a
majority of them during the summer of 1992. Six years later, the Class of 2003 had 366
members attend the program, a 186% increase. More recent classes have seen a similar
number of participants as the Class of 2003, bringing the percentage of Summer Seminar
participants in incoming classes from under 11% to just over 30% in just a decade.
Clearly, the Office of Admissions sees this program as important.
Table 1. Summer Seminar Participation by Class Year
CLASS 1997 1998 1999 2000 2001 2002 2003
PARTICIPANTS 128 157 213 259 345 391 366
TOTAL CASES 1181 1208 1155 1209 1174 1226 1218
Participants can expect to be fully integrated into life at the Naval Academy
during the six-day session. They live in Bancroft Hall, the Brigade dormitory, eat in
King Hall, the Brigade mess hall, and participate in academic and leadership workshops.
Each participant attends eight, 90-minute workshops with a primarily academic focus.
Topics for these workshops range from naval architecture, aerospace flight-testing, and

12
ocean engineering to literature, economics, and sailing (United States Naval Academy,
2003a).
Each day of the Summer Seminar program begins at 0545 with physical training
that lasts 45 minutes. After breakfast, participants take part in workshops, followed by
lunch and more workshops. At 1600, they are given an introduction to military drill or
intramurals at the Naval Academy. After evening meal, special events such as the United
States Marine Corps Sunset Parade or career presentations by Navy and Marine Corps
officers occur. Participants are even given a brief, mock Plebe indoctrination session.
Finally, there is taps at 2300 (United States Naval Academy, 2003b).
2. Summer Seminar Program Participants
The Summer Seminar Program is highly competitive because of the limited
number of spots available each summer. In order to apply, applicants must be United
States Citizens who will have completed their junior year of high school just before the
summer they wish to attend Summer Seminar. They must not be married, pregnant, nor
have any legal obligation to support a child or other person. Superior high school
performance is a must, with a GPA above 3.5, a rank in the top 20% of their high school
class, and/or strong PSAT/SAT/ACT results. Participation in athletics and extra-
curricular activities is also considered, as is good physical fitness, including vision
correctable to 20/20 (United States Naval Academy, 2003c).
All applicants to the Summer Seminar program will automatically be processed as
applicants to the Naval Academy the following year. Due to the small number of
available Summer Seminar spots each summer, students who are not accepted to the
Summer Seminar program are highly encouraged to continue pursuing admission to the
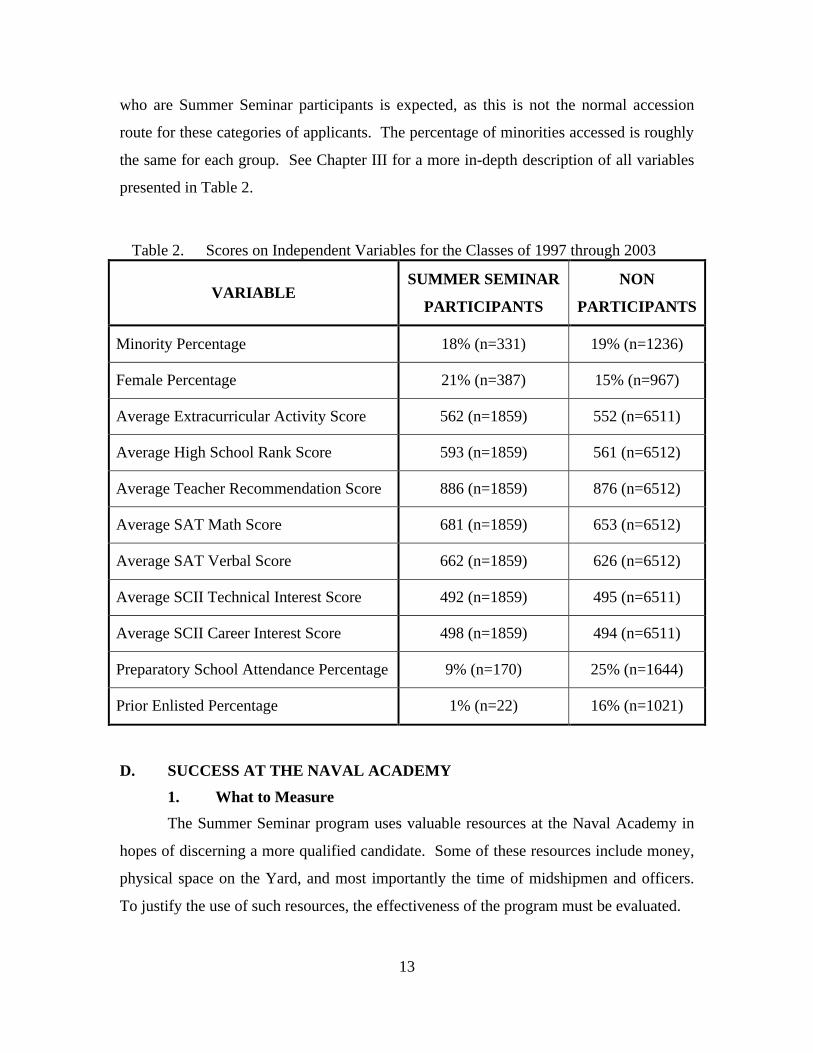
Naval Academy (United States Naval Academy, 2003d). Table 2 presents the
demographic characteristics of program participants and non-participants for the Classes
of 1997 through 2003. Of note, a larger relative percentage of females access via the
Summer Seminar program. As well, Summer Seminar program participants have, on
average, higher scores on all admissions criteria, with the exception of the Strong
Campbell Interest Inventory (SCII) Technical Interest Score (TIS) and SCII Career
Interest Score (CIS). Both groups have close to the same average for TIS and CIS scores.
The relatively low percentage of preparatory school attendees and prior-enlisted members
13
who are Summer Seminar participants is expected, as this is not the normal accession
route for these categories of applicants. The percentage of minorities accessed is roughly
the same for each group. See Chapter III for a more in-depth description of all variables
presented in Table 2.
Table 2. Scores on Independent Variables for the Classes of 1997 through 2003
VARIABLE SUMMER SEMINAR
PARTICIPANTS
NON
PARTICIPANTS
Minority Percentage 18% (n=331) 19% (n=1236)
Female Percentage 21% (n=387) 15% (n=967)
Average Extracurricular Activity Score 562 (n=1859) 552 (n=6511)
Average High School Rank Score 593 (n=1859) 561 (n=6512)
Average Teacher Recommendation Score 886 (n=1859) 876 (n=6512)
Average SAT Math Score 681 (n=1859) 653 (n=6512)
Average SAT Verbal Score 662 (n=1859) 626 (n=6512)
Average SCII Technical Interest Score 492 (n=1859) 495 (n=6511)
Average SCII Career Interest Score 498 (n=1859) 494 (n=6511)
Preparatory School Attendance Percentage 9% (n=170) 25% (n=1644)
Prior Enlisted Percentage 1% (n=22) 16% (n=1021)
D. SUCCESS AT THE NAVAL ACADEMY
1. What to Measure
The Summer Seminar program uses valuable resources at the Naval Academy in
hopes of discerning a more qualified candidate. Some of these resources include money,
physical space on the Yard, and most importantly the time of midshipmen and officers.
To justify the use of such resources, the effectiveness of the program must be evaluated.
14
The research on measuring the effectiveness of military training is plentiful
(Kirkpatrick, 1983; Salas, Milham, & Bowers, 2003; Simpson & Oser, 2003). One study
on training evaluations in the military points out that evaluations are rarely done (Salas et
al., 2003). Numerous reasons are sited, the first being that it is impossible in the military
environment given that a purposely un-trained control group is a rarity. The check-in-
the-box mentality of military training is also considered, where training is measured
using pass or fail standards rather than levels of effectiveness. Third, evaluations are
often not needed in the minds of military trainers on the grounds that training is known to
be effective and that technology has produced real-life simulators on which to train. The
problem is that these trainers provide practice but rarely measure performance (Salas et
al., 2003).
The authors argue that training evaluation is necessary, and state that the “right
things” must be measured. A list of five outcomes that can be measured to quantify
training effectiveness is proposed. They are reaction outcomes, learning outcomes,
cognitive outcomes, behavioral outcomes, and organizational outcomes. Reaction
outcomes are reported by trainees and measure how well the training was liked. Learning
outcomes are a measure of how well information was captured by the trainees. Cognitive
outcomes deal with the amount of knowledge gained and the relationship between
individual pieces of knowledge. Behavioral outcomes deal with how well the trainee can
perform a task in the training environment, as well as how that performance transfers to
an organizational setting. Organizational outcomes measure changes in an organization
that are attributed to training receive by its members (Salas et al., 2003).
An earlier study on the measures of training effectiveness proposed a four-stage
system of measures (Kirkpatrick, 1983). This study served as a basis for the outcome-
centered approach mentioned above, and it also provided specific ways of measuring
each stage.
The four stages are reaction, learning, behavior, and results. Trainee reactions can
be measured by soliciting written comments on a pre-designed form. Learning, in this
study not only the knowledge learned but also any changed attitudes, can be measured
using pre-post tests or surveys. With regards to measuring the behavior change in
15
trainees, the true test would come from on-the-job observations from supervisors, peers,
and subordinates. Results would be the hardest to measure, since there are so many
factors affecting the performance of a trainee that it would be nearly impossible to
attribute any positive results directly to the training program (Kirkpatrick, 1983).
Simpson & Oser (2003) suggest that
measures are not all of equal importance. Reaction data are useful but less important that learning, which is less important that results in the simulator. None of these are as important as performance in the real world, which means that post-training measures are the most important of all. (p. 33)
This study makes it clear that, although performance in training may be measured, it is
performance in the real world that counts (Simpson & Oser, 2003).
When considering the effectiveness of the Summer Seminar program, measures
that deal only with performance of attendees at the program itself could be considered.
However, this would produce a limited view of success that would only be of use to the
Summer Seminar program. In reality, the program is there to help the Office of
Admissions identify the highest quality candidates so they may be admitted to the Naval
Academy. In this view, the Naval Academy is the “real world,” and it is at the Naval
Academy where success must be measured.
2. Measures of Success
The mission of the Naval Academy (United States Naval Academy, 2002) is
to develop midshipmen morally, mentally, and physically, and to imbue them with the highest ideals of duty, honor, and loyalty, in order to provide graduates who are dedicated to a career of naval service and have potential for future development in mind and character to assume the highest responsibilities of command, citizenship, and government. (p. 14)
Since the mission of the Naval Academy is to develop midshipmen “morally, mentally,
and physically,” there is no one single variable that captures a midshipman’s
performance.
The Naval Academy’s strategic plan also contains some guidance on the ideal
graduate. The overview for the strategic plan lists nine statements about what a graduate
should be. Three of them are: 1) role models of ethical behavior and moral conduct, 2)
exemplars of academic, technical and tactical competence, and 3) individuals with a
passion and commitment to lifelong learning and physical fitness (United States Naval
16
Academy, 2003e). These goals reinforce and expand upon the mission of the Naval
Academy.
Another source of guidance for the desired performance of midshipmen is from
Naval Academy and Commandant of Midshipmen instructions. Minimum standards for
graduation are promulgated, including a minimum academic cumulative quality point
rating of 2.0, as well as meeting the standards in military, honor, conduct, and physical
performance (United States Naval Academy, 1994). Guidance is also given in an
instruction on aptitude for commissioning. In order to graduate, midshipmen must
receive a satisfactory grade in aptitude. Two of the items listed to consider when grading
a midshipman in aptitude for commissioning are: 1) the collateral effect of physical
readiness test scores and conduct grades, and 2) striper/leadership roles in the company
(Allen, 2003).
The mission of the Naval Academy, the strategic plan, and the guidance given in
instructions all point to three general areas of performance for midshipmen at the Naval
Academy. The first is academic, the second is military, and the third is physical.
Performance in these three general areas will be analyzed to determine a midshipman’s
success at the Naval Academy.
A study of prior enlisted performance at the Naval Academy (Mishoe, 2000) used
dependant variables that defined academic and military success at the Naval Academy,
including graduation rate and selection as a striper, respectively. These two variables are
used in this study, although the definition of a striper is changed slightly. Striper is the
nickname for leadership positions given to midshipmen in their first-class, and sometimes
second-class, year to enhance leadership opportunities. There are two different sets of
stripers each year in an attempt to give as many midshipmen as possible leadership
opportunities (Bogle, 1996).
That same study of prior enlisted performance also focused on the overall order of
merit (OOM), academic OOM (AOOM), and military OOM (MOOM) as measures of
overall, academic, and military success, respectively. The OOM summarizes all
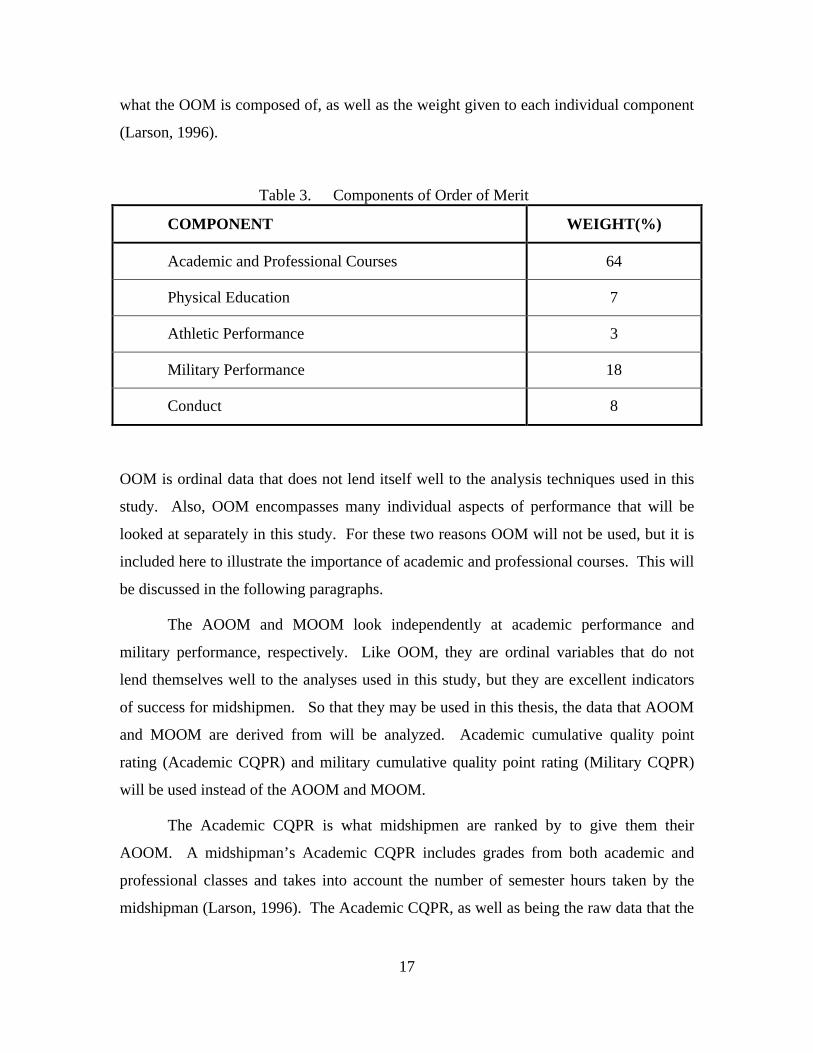
performance at the Naval Academy, and is used to determine class standing. Table 3 lists
17
what the OOM is composed of, as well as the weight given to each individual component
(Larson, 1996).
Table 3. Components of Order of Merit
COMPONENT WEIGHT(%)
Academic and Professional Courses 64
Physical Education 7
Athletic Performance 3
Military Performance 18
Conduct 8
OOM is ordinal data that does not lend itself well to the analysis techniques used in this
study. Also, OOM encompasses many individual aspects of performance that will be
looked at separately in this study. For these two reasons OOM will not be used, but it is
included here to illustrate the importance of academic and professional courses. This will
be discussed in the following paragraphs.
The AOOM and MOOM look independently at academic performance and
military performance, respectively. Like OOM, they are ordinal variables that do not
lend themselves well to the analyses used in this study, but they are excellent indicators
of success for midshipmen. So that they may be used in this thesis, the data that AOOM
and MOOM are derived from will be analyzed. Academic cumulative quality point
rating (Academic CQPR) and military cumulative quality point rating (Military CQPR)
will be used instead of the AOOM and MOOM.
The Academic CQPR is what midshipmen are ranked by to give them their
AOOM. A midshipman’s Academic CQPR includes grades from both academic and
professional classes and takes into account the number of semester hours taken by the
midshipman (Larson, 1996). The Academic CQPR, as well as being the raw data that the

18
AOOM is based upon, is also a ratio variable. For both of these reasons, the Academic
CQPR will be used as a measure of academic success.
Similarly, the Military CQPR is what midshipmen are ranked by to give them
their MOOM. The Military CQPR covers all of the other measures of performance used
in calculating the OOM that were not covered by the Academic CQPR. The components
of the Military CQPR, as well as their weights, are listed in Table 4 (Larson, 1996). For
reasons similar to the Academic CQPR, the Military CQPR will be used as a measure of
military success.
Table 4. Components of Military Cumulative Quality Point Rating
COMPONENT WEIGHT(%)
Physical Education 17
Athletic Performance 8
Military Performance 45
Conduct 20
Professional Courses 10
Two other dependent variables are needed to encompass the moral and physical
aspects of the Naval Academy’s mission. Morally, a midshipman’s honor and conduct
performance can be considered. The honor concept was developed by midshipmen in
1951 to enable self-regulation of high ethical standards. This honor concept applies to
midshipmen at all times, including while on liberty or leave. Their statements and
actions must always represent the complete truth. Options available to a midshipman
who witnesses an act in violation of the honor concept include personally confronting
and, if necessary, counseling the individual or turning in the individual to the honor board
for formal consideration (Ryan, 2001).
The conduct system at the Naval Academy holds midshipmen to a high standard
of personal behavior, both on and off duty. Violation of the conduct system results in

19
demerits, as well as various forms of punishment including restriction, loss of leave and
privileges, and marching tours. Conduct offenses are broken up into two categories,
minor and major. Minor offenses may be used as a tool to train the First Class
Midshipmen in how to administer a non-judicial punishment system. Officers always
adjudicate major offenses, as a midshipman may be separated for committing a major
offense. A particular act may not be charged under both the conduct and the honor
system (Locklear, 2000a).
A study of the success of varsity athletes at the Naval Academy attempted to use
honor violations and conduct grades as two variables to measure moral success (Harvey,
2003). The lack of variance in these two variables prevented them from being successful
predictors. In this study, these two variables will be combined into one in an attempt to
gain a useful measure of the moral success of midshipmen. However, instead of using
conduct grades, whether or not a midshipman committed a major conduct offense will be
used to determine good conduct.
Physical performance is the third area considered. The physical education
curriculum at the Naval Academy is designed to provide graduates with a solid
foundation of physical readiness to include water survival, physical development,
personal conditioning, and recreational sports. Specific classes to accomplish these goals
include personal conditioning, swimming, boxing, wrestling, judo, and a variety of
recreational sports that may be taken as electives (Locklear, 2001). The physical
readiness test (PRT) is a comprehensive measure of a midshipman’s physical readiness.
Height and weight measurements are used to assess body composition. As well, cardio
fitness, endurance, muscular strength, and flexibility are measured using a run or swim,
sit-ups, push-ups, and a sit-and-reach, respectively. Midshipmen are charged with
maintaining a personal physical fitness program to keep them prepared for the PRT,
which is graded twice a year while at the Naval Academy (Locklear, 2000b).
A midshipman’s physical success will be measured using data just recently
available from IR at the Naval Academy. Physical performance will be judged by the
average of their spring PRT scores while at the Naval Academy.

20
A final dependent variable, looking at the academic major selected by each
midshipman, will be examined. Although the selection of a specific academic major is
not usually considered in defining success at the Naval Academy, it has been linked to
retention in the fleet (Gottschalk, personal communication, July 2003). Since part of the
Naval Academy’s mission is to provide graduates dedicated to a career of naval service,
this seventh measure of success will be included.
3. Past Studies of Success
There are some factors that have been shown to influence success at the Naval
Academy. Prior-enlisted military service is one of these, and it has been shown to
positively affect success (Mishoe, 2000). This study focused on midshipmen in the
Classes of 1990 through 1999 who had previously served in fleet units before attending
the Naval Academy. Despite the small percentage of prior-enlisted midshipmen as
defined by the study, linear and LOGIT regression models demonstrated prior-enlisted
military service to be positively correlated with striper selection, overall order of merit,
academic order of merit, military order of merit, and graduation rate.
Attendance at a preparatory school has also been looked at as a predictor of
success at the Naval Academy (FitzPatrick, 2001). In this study of the Classes of 1990
through 2000, the Naval Academy Preparatory School (NAPS), the Broadened
Opportunities for Officer Selection and Training (BOOST) program, and the Naval
Academy Foundation Scholarship (Foundation) were all examined for their roles in the
success of midshipmen. Although few significant differences were discovered, OLS
regression analysis and LOGIT regression models showed that preparatory school
students performed as well, and in some cases better, than midshipmen who accessed
straight from high school in the areas of academic cumulative quality point rating,
military cumulative quality point rating, and graduation rate. Preparatory school
attendance was negatively correlated to overall order of merit.
Prior-enlisted military service and preparatory school attendance have been
shown to affect various facets of success at the Naval Academy, both positively and
negatively. These factors will be controlled for in the analyses in this research.

21
4. Gaining Admission
Before a midshipman can succeed at the Naval Academy, they must be offered
and accept an appointment to the Naval Academy. Although approximately 40% of all
Summer Seminar participants ultimately attend the Naval Academy (Nelson, 2003), it is
not a prerequisite. The Office of Admissions primarily uses seven variables when
comparing candidates for admissions purposes (Goss, Watson, Culler, & Zettler, 1999).
These variables, and their associated weights for the Class of 2003, are depicted in Table
5.
Table 5. Candidate Multiple Variable Weights for the Class of 2003
VARIABLE WEIGHT(%)
High School Class Rank 19
Teacher Recommendations 8
Extracurricular Activities 10
SAT(or ACT) Math 34
SAT(or ACT) Verbal 11
SCII Technical Interest Score 9
SCII Career Interest Score 9
These admissions variables will be controlled for because midshipmen are admitted
based on their success in these variables. The higher the weight of the admissions
variable, the more positively it should be correlated with favorable scores on the
measures of success. Also, because only 18.7% of the midshipmen admitted to the
classes in this study are minorities and only 16.2% are female, this research will control
for both ethnicity and gender.
E. SUMMARY
This literature review provided a summary of the literature on recruiting and
orientation programs in the civilian sector, as well as realistic job previews and

22
expectation-lowering procedures. It also provided an overview of the Summer Seminar
program and its participants. Finally, it established measures for successful performance
by midshipmen.
Clearly, there is competition for high school talent in the work place as well as in
academia. A common strategy used is the pre-exposure of young students to a particular
career or institution in hopes of increased success or future interest in that institution or
career. Given the proven success of this strategy in some cases, it is theorized that the
Summer Seminar program will be positively correlated to success as a midshipman at the
Naval Academy.
Specifically, more favorable graduation rates and increased academic cumulative
quality point ratings for Summer Seminar participants are expected. No direct relation
can be drawn between the literature and military or physical success. However, based on
the overall positive effect of realistic job previews on performance in some cases, an
increase in military and physical success for Summer Seminar participants is expected, as
well. It is unknown what effect, if any, Summer Seminar participation will have on
major selection.

23
III. RESEARCH METHODOLOGY
A. INTRODUCTION
This chapter introduces the data set used in this study. As well, it covers in depth
the independent and dependent variables. The theory behind the regressions used is then
reviewed. Finally, this chapter will introduce the regression models used for analysis in
Chapter IV.
The cases for this study will be all of the midshipmen in the IR data warehouse
from the Classes of 1997 through 2003 (n=8371) who at least began the first academic
semester their Plebe year. This excludes all midshipmen who left during Plebe summer,
before their first academic year started. With very few exceptions, this data was
complete and valid. Data in the IR data warehouse is missing for some of the dependent
variables for the Classes of 1997 and 1998, so cases with missing data will be excluded
when analyzing these variables.
B. DATA DESCRIPTION AND VARIABLES
1. Data Description
All data for this study was obtained from the data warehouse maintained by IR at
the Naval Academy (Summer Seminar Data File, 2003). IR received scores on all
independent variables from the Office of Admissions, where they were recorded as each
individual midshipman applied and was accepted to the Naval Academy. The
independent variables are summarized in Table 6. All continuously scored independent
variables, with the exception of Scholastic Aptitude Test (SAT) scores, were computed
by the Office of Admissions based on information received in the candidates’ admissions
packages. The College Board reported SAT scores to the Naval Academy for each
midshipman.
IR obtained scores on all dependent variables from departments responsible for
the academic, military, and physical development of midshipmen. Members of these
departments entered raw data on the midshipmen into multiple databases, which are
organized by IR. Scores on all continuous dependent variables were calculated based on
the raw data of the individual midshipman’s performance in that area, taking into
24
consideration the weights presented in Chapter II. The dependent variables are
summarized in Table 7.
2. Independent Variables
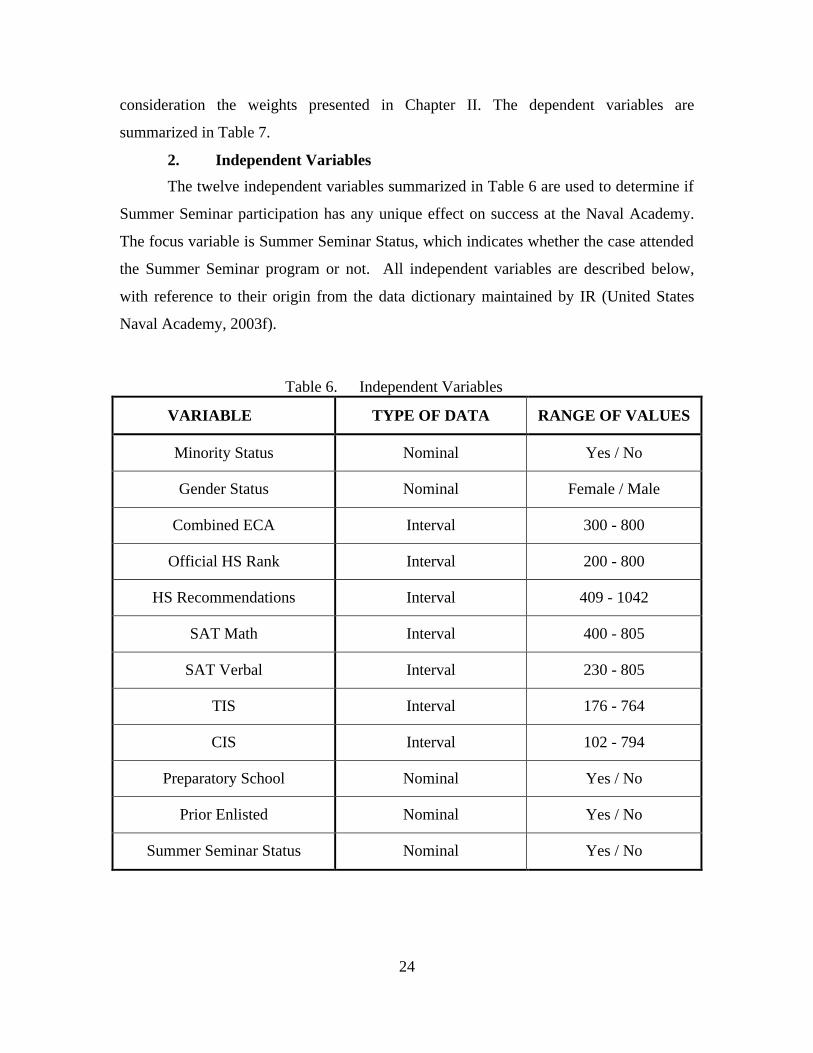
The twelve independent variables summarized in Table 6 are used to determine if
Summer Seminar participation has any unique effect on success at the Naval Academy.
The focus variable is Summer Seminar Status, which indicates whether the case attended
the Summer Seminar program or not. All independent variables are described below,
with reference to their origin from the data dictionary maintained by IR (United States
Naval Academy, 2003f).
Table 6. Independent Variables
VARIABLE TYPE OF DATA RANGE OF VALUES
Minority Status Nominal Yes / No
Gender Status Nominal Female / Male
Combined ECA Interval 300 - 800
Official HS Rank Interval 200 - 800
HS Recommendations Interval 409 - 1042
SAT Math Interval 400 - 805
SAT Verbal Interval 230 - 805
TIS Interval 176 - 764
CIS Interval 102 - 794
Preparatory School Nominal Yes / No
Prior Enlisted Nominal Yes / No
Summer Seminar Status Nominal Yes / No
25
Minority Status identifies whether or not the case is a minority, where minority is
defined as any ethnicity but Caucasian. It is derived from the data dictionary variable
ethnic_code, which describes the AIS ethnic codes used by the Office of Admissions.
Originally, the two-character string values were CA, AF, NA, HI, AS, PU, FI, NH, and
OT. All values except CA were recoded to a numeric value of 1. The value of CA,
which represents Caucasian, was recoded to a numeric value of 0. This was done to
allow for some variance due to the relatively low number of certain ethnic groups that
apply and are accepted to the Naval Academy. All individuals (n=8371) had a valid entry
for this variable. A very slight error is introduced due to the fact that all midshipmen
from other countries had their ethnic_code entered as CA, and not all of these
midshipmen are Caucasian. However, the number of these international midshipmen is
less than 1 percent, so the error was left uncorrected (United States Naval Academy,
2003f, p. 3).
Gender Status identifies whether or not the case is a female or a male. It is
derived from the data dictionary variable gender_code, which describes the gender of a
midshipman. Originally, the one-character string values were F and M. F was recoded to
a numeric value of 1, and M was recoded to a numeric value of 0. All cases (n=8371)
had a valid entry for this variable (United States Naval Academy, 2003f, p. 28).
Combined ECA is taken directly from the data dictionary variable combined_eca,
which is a normalized score developed by the Office of Admissions. It accounts for the
high school athletic and non-athletic extra curricular activities (ECAs) that the applicant
participated in. It is a numeric value that ranges from 300 to 800, with a higher score
being more favorable. All cases except one (n=8370) had a valid entry for this variable.
For one case, the data was missing (United States Naval Academy, 2003f, p. 80).
Official HS Rank is taken directly from the data dictionary variable
hs_official_st_class_rank, which is a normalized score developed by the Office of
Admissions that indicates high school class rank, taking into account factors such as high
school class size. It is a numeric value that ranges from 200 to 800, with a higher score
being more favorable. All cases (n=8371) had a valid entry for this variable (United
States Naval Academy, 2003f, p. 82).

26
The variable HS Recommendations is taken directly from the data dictionary
variable recommendations, which is a normalized score developed by the Office of
Admissions that combines recommendation scores from the applicant’s high school math
and English teachers. It is a numeric value that ranges from 409 to 1042, with a higher
score being more favorable. All cases (n=8371) had a valid entry for this variable
(United States Naval Academy, 2003f, p. 86).
SAT Math is taken directly from the data dictionary variable satm_hi, which is the
re-centered value of the applicant’s highest SAT math score. When the SAT test was
changed, scores from the new version were inflated when compared to the old version.
To allow comparison between the old and new test, a re-centering of the old scores is
required. This re-centering was done by IR at the SAT website. SAT Math is a numeric
value that ranges from 400 to 805, with a higher score indicating greater mathematical
abilities. It is noted that a score of 805, which is above the maximum allowed value of
800, is valid due to the re-centering. All cases (n=8371) had a valid entry for this
variable (United States Naval Academy, 2003f, p. 86).
SAT Verbal is taken directly from the data dictionary variable satv_hi, which is
the re-centered value of the applicant’s highest SAT verbal score. As in the SAT Math
variable, the re-centering for SAT Verbal was done by IR at the SAT website. It is a
numeric value that ranges from 230 to 805, with a higher score indicating greater verbal
abilities. It is noted that a score of 805, which is above the maximum allowed value of
800, is valid due to the re-centering. All cases (n=8371) had a valid entry for this
variable (United States Naval Academy, 2003f, p. 87).
TIS is taken directly from the data dictionary variable tis_std, which is a score
indicating technical interest that is derived from the applicant’s answers to certain
questions on the Strong Campbell Interest Inventory. It is a measure of the technical
aptitude of the applicant. It is a numeric value that ranges from 176 to 764, with a higher
score indicating greater technical aptitude. All cases except one (n=8370) had a valid
entry for this variable. For one case, the data was missing (United States Naval
Academy, 2003f, p. 87).

27
CIS is taken directly from the data dictionary variable cis_std, which is a score
indicating career interest that is derived from the applicant’s answers to certain questions
on the Strong Campbell Interest Inventory. It is a measure of the career interest of the
applicant. It is a numeric value that ranges from 102 to 794, with a higher score
indicating greater interests in a particular skill. All cases except one (n=8370) had a valid
entry for this variable. For one case, the data was missing (United States Naval
Academy, 2003f, p. 80).
Preparatory School identifies whether or not the case attended preparatory school.
It is derived from the data dictionary variable feeder_code, which describes the source
from which the midshipman came to attend the Naval Academy. Originally, the one-
character string values were B, F, K, N, and X. F and N are short-hand for the
Foundation and NAPS sources, respectively, which are the two possible preparatory
school feeder sources. F and N were recoded to a numeric value of 1, and all other values
were recoded to a numeric value of 0. All cases (n=8371) had a valid entry for this
variable (United States Naval Academy, 2003f, p. 81).
Prior Enlisted identifies whether or not the case is prior-enlisted. It is derived
from the IR variable priors, which is calculated using the data dictionary variable
mil_stat_mid. mil_stat_mid indicates the military status of the applicant coming from the
fleet when applying to the Naval Academy. If the applicant had prior-enlisted service as
indicated by mil_stat_mid, the variable priors was Y. Otherwise, it was N. Y was
recoded to a numeric value of 1, and N was recoded to a numeric value of 0. All cases
(n=8371) had a valid entry for this variable (United States Naval Academy, 2003f, p. 84).
Summer Seminar Status, the focus variable, identifies whether or not the case
attended the Summer Seminar program. It is derived from the data dictionary variable
summer_seminar, which indicates if the midshipman attended the Summer Seminar
program. Originally, the one-character string values were Y and N. Y was recoded to a
numeric value of 1, and N was recoded to a numeric value of 0. All cases (n=8371) had a
valid entry for this variable (United States Naval Academy, 2003f, p. 87).
28
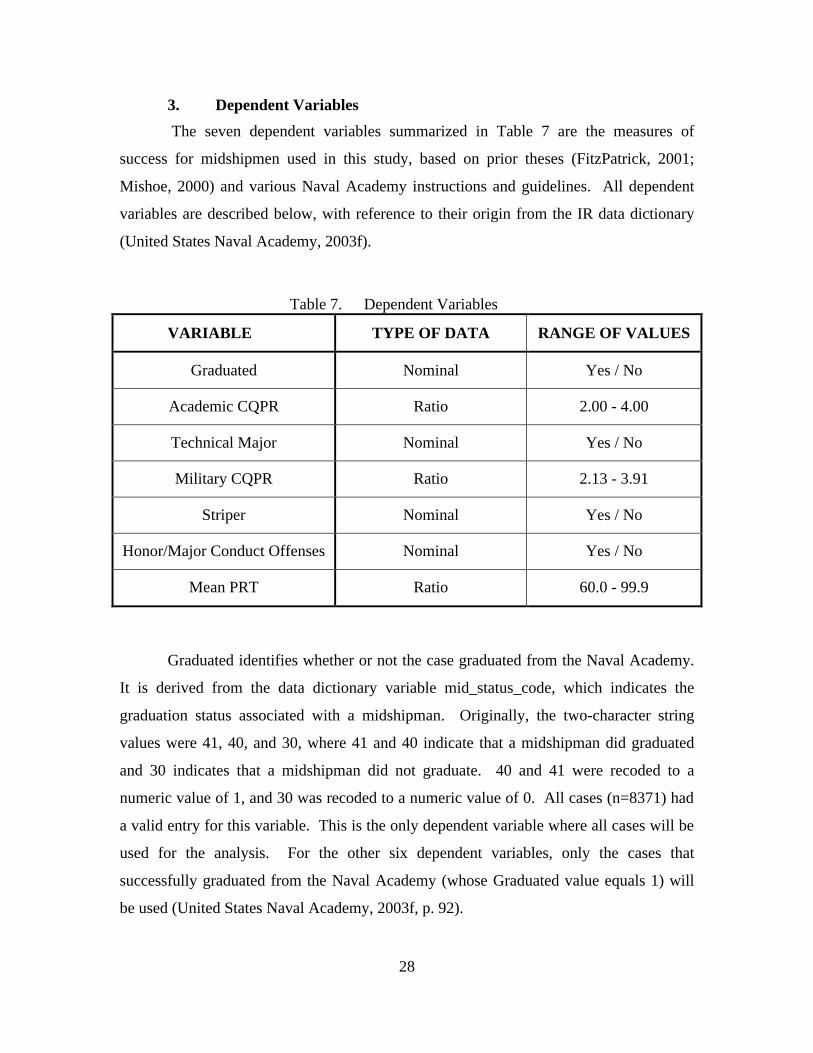
3. Dependent Variables
The seven dependent variables summarized in Table 7 are the measures of
success for midshipmen used in this study, based on prior theses (FitzPatrick, 2001;
Mishoe, 2000) and various Naval Academy instructions and guidelines. All dependent
variables are described below, with reference to their origin from the IR data dictionary
(United States Naval Academy, 2003f).
Table 7. Dependent Variables
VARIABLE TYPE OF DATA RANGE OF VALUES
Graduated Nominal Yes / No
Academic CQPR Ratio 2.00 - 4.00
Technical Major Nominal Yes / No
Military CQPR Ratio 2.13 - 3.91
Striper Nominal Yes / No
Honor/Major Conduct Offenses Nominal Yes / No
Mean PRT Ratio 60.0 - 99.9
Graduated identifies whether or not the case graduated from the Naval Academy.
It is derived from the data dictionary variable mid_status_code, which indicates the
graduation status associated with a midshipman. Originally, the two-character string
values were 41, 40, and 30, where 41 and 40 indicate that a midshipman did graduated
and 30 indicates that a midshipman did not graduate. 40 and 41 were recoded to a
numeric value of 1, and 30 was recoded to a numeric value of 0. All cases (n=8371) had
a valid entry for this variable. This is the only dependent variable where all cases will be
used for the analysis. For the other six dependent variables, only the cases that
successfully graduated from the Naval Academy (whose Graduated value equals 1) will
be used (United States Naval Academy, 2003f, p. 92).
29
Academic CQPR is taken directly from the data dictionary variable cum_aqpr,
which is the academic cumulative quality point rating for a midshipman. It is a numeric
value that ranges from 2.00 to 4.00, with a higher score being more favorable. The only
cases used for this dependent variable are those that graduated (n=6579), and all had
valid entries (United States Naval Academy, 2003f, p. 71).
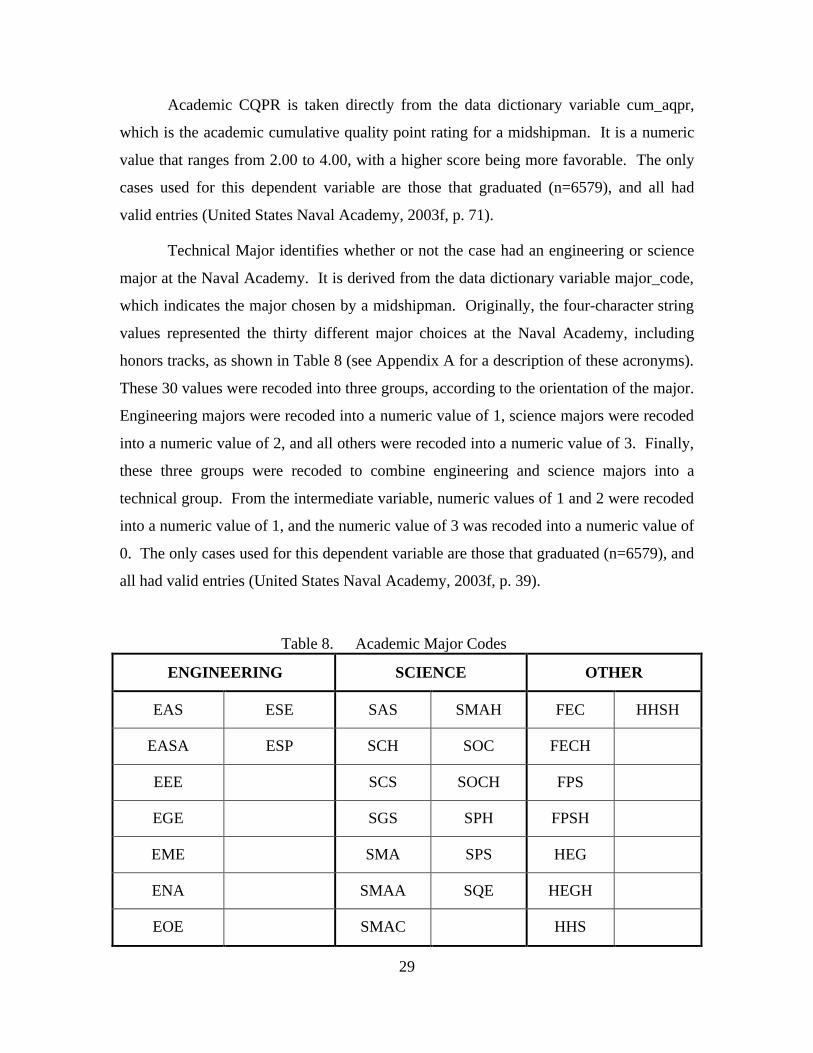
Technical Major identifies whether or not the case had an engineering or science
major at the Naval Academy. It is derived from the data dictionary variable major_code,
which indicates the major chosen by a midshipman. Originally, the four-character string
values represented the thirty different major choices at the Naval Academy, including
honors tracks, as shown in Table 8 (see Appendix A for a description of these acronyms).
These 30 values were recoded into three groups, according to the orientation of the major.
Engineering majors were recoded into a numeric value of 1, science majors were recoded
into a numeric value of 2, and all others were recoded into a numeric value of 3. Finally,
these three groups were recoded to combine engineering and science majors into a
technical group. From the intermediate variable, numeric values of 1 and 2 were recoded
into a numeric value of 1, and the numeric value of 3 was recoded into a numeric value of
0. The only cases used for this dependent variable are those that graduated (n=6579), and
all had valid entries (United States Naval Academy, 2003f, p. 39).
Table 8. Academic Major Codes
ENGINEERING SCIENCE OTHER
EAS ESE SAS SMAH FEC HHSH
EASA ESP SCH SOC FECH
EEE SCS SOCH FPS
EGE SGS SPH FPSH
EME SMA SPS HEG
ENA SMAA SQE HEGH
EOE SMAC HHS

30
Military CQPR is taken directly from the data dictionary variable cum_mqpr,
which is the military cumulative quality point rating for a midshipman. It is a numeric
value that ranges from 2.13 to 3.91, with a higher score being more favorable. The only
cases used for this dependent variable are those that graduated (n=6579), and all had
valid entries (United States Naval Academy, 2003f, p. 71).
Striper identifies whether or not the case held a striper position at the Naval
Academy. The definition of a striper in this study includes midshipmen in the rank of
Midshipman Lieutenant and above for First Class Midshipmen, Midshipman Sergeant
Major or Midshipman First Sergeant for Second Class Midshipmen, and varsity and
junior varsity team captains. It is derived from two variables in the data dictionary. The
first variable is rank, which indicates the rank of a striper billet held by a midshipman.
The four-character string values were LT, LCDR, CDR, CAPT, 1SGT, SMAJ for the
billets of interest. The data obtained from IR had one of these values in the rank variable
if the midshipman had held a striper position of interest, some other value if they had
held a lesser striper position, and a null value if they had not held any striper position. If
any of the six mentioned string values were present, they were recoded in an intermediate
variable as a numeric value of 1. The null value, along with any ranks other than the
above mentioned six, were recoded in the same intermediate variable as a numeric value
of 0 (United States Naval Academy, 2003f, p. 95).
The second variable from the data dictionary that Striper is derived from is
position, which indicates a midshipman’s position on a varsity or junior varsity sports
team. The ten-character string value was CAPTAIN for the position of interest. The data
obtained from IR had CAPTAIN as a value in the position variable if the midshipman
had been a varsity or junior varsity team captain, and a null value if they had only been a
team member or not been on a varsity or junior varsity team at all. If the string value of
CAPTAIN was present, it was recoded in a second intermediate variable as a numeric
value of 1. The null value was recoded in the second intermediate variable as a numeric
value of 0 (United States Naval Academy, 2003f, p. 108).
The variable Striper was created by looking at the two intermediate variables.
Two intermediate variables were needed because the Naval Academy places equal

31
importance on military and athletic leadership positions, although in most cases they are
mutually exclusive. Striper was given a numeric value of 1 if either the first or the
second intermediate variable, or both intermediate variables, were 1. It was given a
numeric value of 0 if both intermediate variables were 0. This resulted in the variable
Striper representing all stripers, as defined above, and all varsity and junior varsity team
captains. The only cases used for this dependent variable are those that graduated
(n=6579), and all had valid entries.
Honor/Major Conduct Offenses identifies whether or not the case committed an
honor or major conduct offense at the Naval Academy. It is derived from the
offense_description variable in the data dictionary, which is a thirty-character string
containing a description of the honor or conduct offense violated. The data obtained
from IR was only for honor and major conduct violators, and had some value in the
offense_description variable describing the offense if the midshipman had committed an
honor or major conduct violation. The offense_description variable had a null value if
they had not. If any string value besides null was present, it was recoded to a numeric
value of 1. The null value was recoded to a numeric value of 0. The only cases used for
this dependent variable are those that graduated (n=6579). As well, no data was available
for the members of the Class of 1997 who graduated (n=952), leaving only 5627 cases to
be analyzed for this dependent variable (United States Naval Academy, 2003f, p. 13).
Mean PRT is an average of a midshipman’s PRT scores taken during the spring
semester in each of their four years at the Naval Academy. Values range from 60.0 to
99.9, with a higher value being more favorable. The individual semester scores were
obtained from IR, but have no counterpart in the data dictionary. Mean PRT was created
by taking a midshipman’s four individual semester scores and mathematically averaging
them. Six individual semester scores were greater than the maximum allowed value of
100.0, so they were not included when creating the average PRT score for their respective
cases. The only cases used for this dependent variable are those that graduated (n=6579).
As well, scores for the PRT were not available prior to the spring of 1999. For this
reason, no data was available for the members of the Classes of 1997 and 1998 who
graduated (n=1875). Also, there was missing data for 97 members of the Classes of 1999

32
through 2003 who graduated. This left 4607 cases to be analyzed for this dependent
variable.
Another consideration, given the fact that PRT data was not available prior to the
spring of 1999, is that the average PRT scores for the members of the Classes of 1999
through 2001 will be affected. For the Class of 1999, there is only one individual score
to average. For these cases, that one score is the average score. Likewise, the average
PRT score for members of the Classes of 2000 and 2001 includes only two and three
individual scores, respectively.
4. Descriptive Statistics
Table 9 presents frequencies for all discrete independent variables and Table 10
presents frequencies for all discrete dependent variables. All cases that are missing
values for certain discrete dependent variables have been previously explained. Table 11
presents descriptives for all continuous variables, both independent and dependent. This
data indicates a normal distribution of data for all of these variables, making them ideal
for linear regression. As with the discrete variables, all cases that are missing values for
specific continuous independent and dependent variables have been previously explained.

33
Table 9. Discrete Independent Variable Frequencies
Minority Status
Frequency Percent Valid Percent
Cumulative Percent
No 6804 81.3 81.3 81.3 Yes 1567 18.7 18.7 100.0
Valid
Total 8371 100.0 100.0
Gender Status
Frequency Percent Valid Percent
Cumulative Percent
Men 7017 83.8 83.8 83.8 Women 1354 16.2 16.2 100.0
Valid
Total 8371 100.0 100.0
Preparatory School
Frequency Percent Valid Percent
Cumulative Percent
No 6557 78.3 78.3 78.3 Yes 1814 21.7 21.7 100.0
Valid
Total 8371 100.0 100.0
Prior Enlisted
Frequency Percent Valid Percent
Cumulative Percent
No 7328 87.5 87.5 87.5 Yes 1043 12.5 12.5 100.0
Valid
Total 8371 100.0 100.0
Summer Seminar Status
Frequency Percent Valid Percent
Cumulative Percent
No 6512 77.8 77.8 77.8 Yes 1859 22.2 22.2 100.0
Valid
Total 8371 100.0 100.0
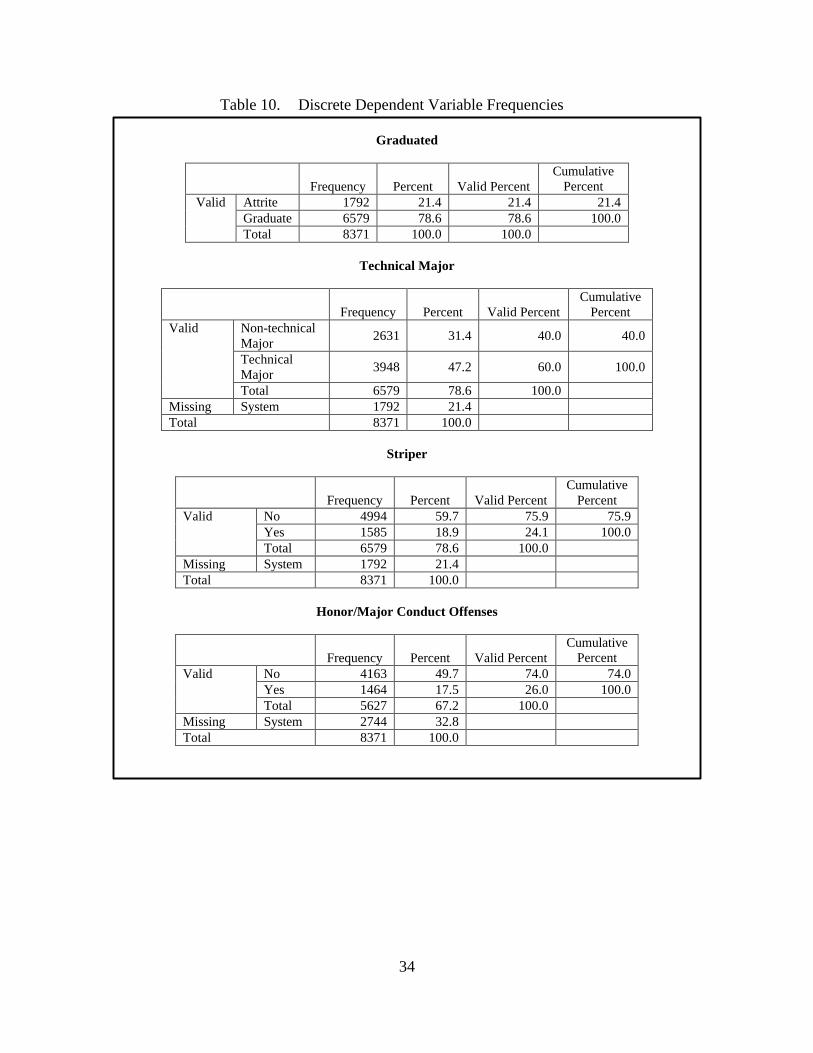
34
Table 10. Discrete Dependent Variable Frequencies
Graduated
Frequency Percent Valid Percent
Cumulative Percent
Attrite 1792 21.4 21.4 21.4 Graduate 6579 78.6 78.6 100.0
Valid
Total 8371 100.0 100.0
Technical Major
Frequency Percent Valid Percent Cumulative
Percent Non-technical Major
2631 31.4 40.0 40.0
Technical Major
3948 47.2 60.0 100.0
Valid
Total 6579 78.6 100.0 Missing System 1792 21.4 Total 8371 100.0
Striper
Frequency Percent Valid Percent Cumulative
Percent No 4994 59.7 75.9 75.9 Yes 1585 18.9 24.1 100.0
Valid
Total 6579 78.6 100.0 Missing System 1792 21.4 Total 8371 100.0
Honor/Major Conduct Offenses
Frequency Percent Valid Percent Cumulative
Percent No 4163 49.7 74.0 74.0 Yes 1464 17.5 26.0 100.0
Valid
Total 5627 67.2 100.0 Missing System 2744 32.8 Total 8371 100.0
35
Table 11. Descriptives for Continuous Variables
Variable N Range Min Max Mean Std. Variance Skewness Std.
Error Kurtosis Std.
Error Combined ECA 8370 500 300 800 554.30 70.30 4941.82 .107 .027 .426 .054 Official HS Rank 8371 600 200 800 568.20 106.47 11335.50 .211 .027 -.410 .054 HS Recommendations 8371 633 409 1042 877.96 91.22 8320.38 -.618 .027 .407 .054 SAT Math 8371 405 400 805 659.44 61.47 3778.30 .009 .027 .101 .054 SAT Verbal 8371 575 230 805 633.77 67.16 4510.50 -.118 .027 .566 .054 TIS 8370 588 176 764 494.03 95.13 9048.87 -.098 .027 -.452 .054 CIS 8370 692 102 794 495.29 97.92 9587.95 -.226 .027 -.103 .054 Academic CQPR 6579 2.00 2.00 4.00 2.95 0.47 0.23 .222 .030 -.824 .060 Military CQPR 6579 1.78 2.13 3.91 3.14 0.32 0.10 -.212 .030 -.515 .060 Mean PRT 4607 39.90 60.00 99.90 83.68 8.68 75.31 -.313 .036 -.663 .072
C. REGRESSION THEORY
1. Logistic Regression
A logistic regression is used to predict discrete dependent variables from a group
of independent variables that may be discrete, continuous, or a mix of both. The goal of
analysis using a logistic regression is to correctly predict the outcome category for each
case. Many research questions can be answered, including prediction of group
membership and the importance of independent variables (Tabachnick & Fidell, 2001).
Because a logistic regression is a nonlinear model, the equations used to describe
the regression are complex. The dependent variable, Y, is the probability of having one
outcome or another based on the best linear combination of independent variables, with
two outcomes:
Yi = eu / (1+eu)
where YI is the estimated probability that the ith case (I = 1,…,n) is in one of the
categories and u is the usual linear regression equation:
u = A + B1X1 + B2X2 + … + BkXk
with constant A, coefficients Bj, and independent variables Xj for k independent variables
(j = 1, 2, …, k). This linear regression equation creates the logit, or log of the odds:
ln (Y / (1 – Y)) = A + ∑BjXij

36
or more simply the natural log (loge) of the probability of being in one group divided by
the probability of being in the other group. Coefficients are estimated by converging on
values that maximize the likelihood of obtaining observed frequencies (Tabachnick &
Fidell, 2001).
The goodness of fit for a logistic regression is determined by the chi-squared
statistic (χ2). χ2 is normally used in judging the independence of two variables. In this
context, it is limited by the sample size and the extent of the departure from
independence. Also, it reveals nothing on how the two variables are related, just the
extent to which they are or not. In order to use χ2 to determine goodness of fit, it must be
modified to avoid these limitations (Norušis, 2002). To accomplish this, χ2 is calculated
on the difference in the log-likelihoods between the model including independent
variables and the model including only the constant (A) (Tabachnick & Fidell, 2001).
There are many types of logistic regressions, including direct, hierarchical, and
stepwise. In a direct logistic regression, all independent variables are entered into the
regression at the same time. This method is useful if no hypothesis exists for the
outcome of the regression, and takes into account the unique contribution of each
independent variable. A hierarchical logistic regression allows the user to specify the
order of entry of independent variables into the regression, and is useful for controlling
for factors that prior research has shown will affect the dependent variable. This method
takes into account the unique contribution of each independent variable, as well as the
overlapping contribution of independent variables, in each step. When a hierarchical
logistic regression is used, it is important to enter the independent variable of concern in
the last step of the regression. In a stepwise logistic regression, inclusion and exclusion
of independent variables are based on statistical tests. The user has no input as to which
independent variables are included, and in what order they are included (Tabachnick &
Fidell, 2001).
While the major limitation of a logistic regression is that the dependent variable
has to be discrete, there are other things to take into consideration. It is important to have
enough cases in relation to the number of independent variables. There is an assumption
of linearity between continuous independent variables and the logit transformation of the

37
dependent variable, but not the dependent variable itself. There must be an absence of
multicollinearity and outliers, as well as independence of errors. Finally, it is important
to remember that significantly relating a dependent variable to some independent
variables does not imply that the dependent variable is caused by the independent
variable (Tabachnick & Fidell, 2001).
2. Linear Regression
A linear regression is used to assess the relationship of one continuous dependent
variable to multiple continuous independent variables. The goal of analysis using a linear
regression is to correctly predict the value of the dependent variable, given values for the
independent variables. Research questions that can be answered include the degree of
relationship of the variables, the relative importance of the independent variables, and
prediction of dependent variable values (Tabachnick & Fidell, 2001).
Being linear in nature, the equation for a linear regression is far simpler than for a
logistic regression. It takes the form:
Y = A + B1X1 + B2X2 + … + BkXk
where Y is the predicted value of the dependent variable, A is the Y intercept, the Xs are
the independent variables (n = k), and the Bs are the coefficients of the independent
variables in the regression equation. To obtain the regression equation, the sum of the
squared difference between actual and predicted Y values for k cases will be minimized
(Tabachnick & Fidell, 2001).
To ascertain how well the linear combination of independent variables predicts
the dependent variable, a multiple correlation (R) is calculated. R is a Pearson product-
moment correlation coefficient between the predicted dependent variable scores and the
actual scores. R ranges from 0 to 1. In order to interpret R, it is squared. This R2 term
indicates the percent of variance in the dependent variable accounted for by the
independent variables (Green, Salkind, & Akey, 2000).
Like logistic regressions, linear regressions can be direct, hierarchical, or
stepwise, with the same benefits and drawbacks for each. However, there are a few
different limitations for linear regressions. The major one is that both the dependent and
independent variables must be continuous, and a linear relationship is assumed between

38
dependent and independent variables. Too many or too few cases can confound a linear
regression, and in addition to the absence of multicollinearity and outliers, the absence of
singularity is assumed. Finally, normality, homoscedasticity, and independence of errors
are assumed. Again, it is important to remember that significantly relating a dependent
variable to some independent variable does not imply causality (Tabachnick & Fidell,
2001).
D. MODELS OF REGRESSIONS
1. Logistic Regression
Of the dependent variables previously introduced, four are comprised of discrete
data. These variables are Graduated, Technical Major, Striper, and Honor/Major
Conduct Offenses. As the literature on research theory states (Norušis, 2002; Tabachnick
& Fidell, 2001), a logistic regression must be used when the dependent variable is
discrete.
The independent variables will be entered into the regression hierarchically, in
four different steps. This will allow for a determination of the unique effect by each
group of independent variables on the variance in the dependent variable, taking into
consideration the variance accounted for by the previously entered groups of independent
variables. The final result will also include the shared variance between the groups of
independent variables.
The order in which the independent variables will be input into the regression is
depicted in Table 12. For each step, the new variables entered are displayed in bold.
Step 1 begins with the two demographic variables. Step 2 adds the seven variables
primarily considered by the Office of Admissions when screening applicants. Step 3
includes factors that have been shown to significantly affect aspects of performance at the
Naval Academy (FitzPatrick, 2001; Mishoe, 2000). Finally, step 4 inputs whether or not
the midshipman participated in the Summer Seminar program. By adding this variable
last, in its own step, it is possible to determine the unique variance in the dependent
variable accounted for by participation in the Summer Seminar program, while first
taking into account the variance accounted for by the other independent variables.

39
Table 12. Order of Independent Variable Entry for Regressions
STEP 1 STEP 2 STEP 3 STEP 4
Minority Status Minority Status Minority Status Minority Status
Gender Status Gender Status Gender Status Gender Status
Combined ECA Combined ECA Combined ECA
Official HS Rank Official HS Rank Official HS Rank
HS Recommendations HS Recommendations HS Recommendations
SAT Math SAT Math SAT Math
SAT Verbal SAT Verbal SAT Verbal
TIS TIS TIS
CIS CIS CIS
Preparatory School Preparatory School
Prior Enlisted Prior Enlisted
Summer Seminar
Status
The results of each logistic regression will be looked at overall and then by
individual variable. Overall, the significance (p) will be checked first to see if the
variables entered were significant. Next, the chi-squared value (χ2) and the Nagelkerke
R2 value will be examined to determine goodness-of-fit. For individual variables, the
significance (p) will be checked first to see if the individual variable was significant
within the step. Wald statistics (z) and odds ratios will then be compared to determine
the weight of the variable.
The statistical package used to perform the logistic regressions in this study is
SPSS version 11.5. The specific regression used from SPSS is binary logistic, which can

40
be found under the analyze->regression menu. A binary logistic regression is used
because all four of the discrete dependent variables have only two possible values.
2. Linear Regression
Of the dependent variables previously discussed, three are comprised of
continuous data. These variables are Academic CQPR, Military CQPR, and Mean PRT.
As the literature on research theory states (Green et al., 2000; Tabachnick & Fidell,
2001), a linear regression may be used when the dependent variable is continuous. This
research also states that the independent variables used must be continuous. As depicted
in Table 6, five of the independent variables used in this study are comprised of discrete,
not continuous, data. However, all of these variables are dichotomous, with the only two
acceptable values being either 1 or 0. 1 indicates the case possesses the quality being
measured by the variable, and 0 indicates the case lacks the quality. For example, in the
variable Summer Seminar Status, a 1 indicates attendance at the Summer Seminar
program and a 0 indicates the lack of attendance. For this reason, these five independent
variables will be treated as continuous variables for the purpose of linear regressions,
with a theoretical range of values for each variable between 1 and 0.
The independent variables will be entered into the regression hierarchically, in
four different steps. This will allow for a determination of the unique effect by each
group of independent variables on the variance in the dependent variable, taking into
consideration the variance accounted for by the previously entered groups of independent
variables. The final result will also include the shared variance between the groups of
independent variables. The order in which the independent variables will be input into
the regression is the same as for the logistic regression, and can be reviewed in Table 12.
The results of each linear regression will be looked at overall and then by
individual variable. Overall, the significance (p) will be checked first to see if the
variables entered were significant. Next, the f value and the Adjusted R2 value will be
examined to determine the variance accounted for by the independent variables. For
individual variables, the significance (p) will be checked first to see if the individual
variable was significant within the step. Standardized regression coefficients (beta) will
then be compared to determine the weight of the variable.
41
The statistical package used to perform the linear regressions in this study is SPSS
version 11.5. The specific regression used from SPSS is linear, which can be found
under the analyze->regression menu.
E. SUMMARY
In this chapter, the data set used in this study was introduced and the independent
and dependent variables were discussed in depth. As well, the theory for the regressions
to be used was reviewed. Finally, an overview of how these regressions will be used in
this study has been provided. Chapter IV uses these regressions to analyze each of the
seven dependent variables in order to determine the unique effect on each of participation
in the Summer Seminar program.

42
THIS PAGE INTENTIONALLY LEFT BLANK
43
IV. DATA ANALYSIS
A. INTRODUCTION
This chapter presents the results of correlation and regression analyses of the data.
First-order, bivariate correlational analyses are presented in the first section. Regression
analyses of academic, military, and physical performance are presented in the following
three sections. The final section provides a summary of significant findings.
B. CORRELATIONAL ANALYSES
Pearson correlation coefficients were computed among variables in the study.
Table 13 presents the means, standard deviations, and first-order, bivariate correlation
coefficients for eighteen of the nineteen variables included in the study. Examination of
the correlation matrix shows that 123 of the 153 correlations computed were statistically
significant at the 0.05 level. Means and standard deviations for Minority Status, Gender
Status, Preparatory School, Prior Enlisted, Summer Seminar Status, Technical Major,
Striper, and Honor/Major Conduct Offenses were not computed because these variables
were dichotomously scored. In addition, the mean, standard deviation, and correlation
coefficients were not computed for Graduated because the data file only contained scores
for successful graduates, making Graduated a constant when correlated listwise with the
other variables.

Table 13. Correlation Matrix
Mean Std. 1 2 3 4 5 6 7 8 9 10 11 12 13 14 15 16 17 18
Minority Status (1) 1
Gender Status (2) .03 ns
1
Combined ECA (3) 555.30 70.50 -.10 .05 1
Official HS Rank (4) 568.40 105.62 -.11 .12 .14 1
HS Recommendations (5)
882.59 94.32 -.06 .07 .14 .30 1
SAT Math (6) 662.32 62.03 -.23 -.09 -.05 .33 .08 1
SAT Verbal (7) 634.14 65.66 -.20 .05 -.04 .28 .10 .45 1
TIS (8) 494.26 94.59 -.01 ns
-.21 -.17 .02 ns
-.07 .14 -.16 1
CIS (9) 495.77 97.45 -.05 -.09 .03 ns
.06 .02 ns
.11 -.03 .21 1
Preparatory School (10)
.16 -.04 -.06 -.42 -.12 -.44 -.35 -.06 -.06 1
Prior Enlisted (11) .10 -.06 -.15 -.24 .03 -.18 -.15 -.05 .01 ns
.33 1
Summer Seminar Status (12)
-.02 ns
.07 .07 .15 .04 .17 .23 -.02 ns
.02 ns
-.17 -.16 1
Academic CQPR (13) 2.97 0.47 -.19 .00 ns
.02 ns
.48 .18 .45 .35 -.00 ns
.09 -.31 -.10 .14 1
Technical Major (14) -.02 ns
-.05 -.07 .15 .04 .26 -.00 ns
.39 .17 -.12 .02 ns
.02 ns
.15 1
Military CQPR (15) 3.13 0.32 -.20 .02 ns
.13 .37 .21 .26 .22 .01 ns
.08 -.21 -.08 .13 .71 .15 1
Striper (16) -.07 .04 .15 .12 .11 .07 .05 -.08 .00 ns
-.05 -.02 ns
.05 .26 .03 .46 1
Honor/Major Conduct Offenses (17)
.04 -.02 ns
-.01 ns
-.13 -.08 -.05 -.07 -.02 ns
-.06 .06 .04 -.02 ns
-.18 -.05 -.33 -.10 1
Mean PRT (18) 83.69 8.68 -.05 -.02 ns
.12 .09 .04 .01 ns
-.04 -.01 ns
-.06 -.03 ns
-.08 .05 .25 .00 ns
.45 .20 -.01 ns
1
Note: All correlations are significant at p < 0.05 (2-tailed) unless otherwise noted.
45
As shown in Table 13, Summer Seminar Status was positively correlated with
Gender Status, Combined ECA, Official HS Rank, HS Recommendations, SAT Math,
SAT Verbal, Academic CQPR, Military CQPR, Striper, and Mean PRT. These results
indicate that midshipmen who attended the Summer Seminar program were more likely
to be female, have participated in more high school extracurricular activities, have a
higher high school class rank and teacher recommendation scores, and have higher scores
on both the math and verbal section of the SAT when compared with midshipmen who
did not attend the program. In addition, Summer Seminar midshipmen were more likely
to have a higher academic cumulative quality point rating and military cumulative quality
point rating, have been stripers, and have scored higher on their physical readiness test
than their non-Summer Seminar counterparts. Summer Seminar Status was also
negatively correlated with Preparatory School and Prior Enlisted, indicating that Summer
Seminar participants were less likely to have attended preparatory school or have prior-
enlisted service than midshipmen who did not attend Summer Seminar.
Other correlations of interest include those having to do with demographic
variables and proven indicators of success. Minority Status was positively correlated
with Honor/Major Conduct Offenses, indicating that minorities were more likely to have
honor or major conduct offense in their records than non-minorities. Minority Status was
also negatively correlated with Combined ECA, Official HS Rank, HS
Recommendations, SAT Math, SAT Verbal, CIS, Academic CQPR, Military CQPR,
Striper, and Mean PRT. These results indicate that minorities were likely to have
participated in fewer high school extracurricular activities, have a lower high school class
rank and teacher recommendation scores, have lower math and verbal SAT scores, have a
lower career interest score on the modified SCII, have a lower academic cumulative
quality point rating and military cumulative quality point rating, have less of a chance of
being a striper, and scored lower on their physical readiness test than non-minorities.
Gender Status was positively correlated with Combined ECA, Official HS Rank,
HS Recommendations, SAT Verbal, and Striper, indicating that females were more likely
to have participated in more high school extracurricular activities, have a higher high
school class rank and teacher recommendation scores, have a higher verbal SAT score,

46
and have a greater chance of becoming a striper than males at the Naval Academy.
Gender Status was also negatively correlated with SAT Math, TIS, CIS, and Technical
Major. These results indicate that females were more likely to have lower math SAT
scores, have a lower technical and career interest score on the modified SCII, and be non-
technical majors than males at the Naval Academy.
Preparatory School was positively correlated with Minority Status, Prior Enlisted,
and Honor/Major Conduct Offenses, indicating that midshipmen who attended
preparatory school were more likely to be minorities, have prior-enlisted service, and
have an honor or major conduct offense in their records than midshipmen who did not
attend preparatory school. Preparatory School was also negatively correlated with
Gender Status, Combined ECA, Official HS Rank, HS Recommendations, SAT Math,
SAT Verbal, TIS, CIS, Academic CQPR, Technical Major, Military CQPR, and Striper.
These results indicate that preparatory school attendees were more likely to be male, have
participated in fewer high school extracurricular activities, have a lower high school class
rank and teacher recommendation scores, have lower math and verbal SAT scores, have a
lower technical and career interest score on the modified SCII, have a lower academic
cumulative quality point rating and military cumulative quality point rating, have a non-
technical major, and have less a chance of being a striper than midshipmen who did not
attend preparatory school.
Prior Enlisted was positively correlated with Minority Status, HS
Recommendations, and Honor/Major Conduct Offenses, indicating that prior-enlisted
midshipmen were more likely to be minorities, have better high school teacher
recommendation scores, and have an honor or major conduct offense in their records than
midshipmen without prior-enlisted service. Prior Enlisted was also negatively correlated
with Gender Status, Combined ECA, Official HS Rank, SAT Math, SAT Verbal, TIS,
Academic CQPR, Military CQPR, and Mean PRT. These results indicate that prior-
enlisted midshipmen were more likely to be male, have participated in fewer high school
extra-curricular activities, have a lower high school class rank, have lower math and
verbal SAT scores, have a lower technical interest score on the modified SCII, have a
lower academic cumulative quality point rating and military cumulative quality point

47
rating, and have scored lower on their physical readiness test than midshipmen who are
not prior-enlisted.
C. REGRESSION ANALYSES OF SUMMER SEMINAR PARTICIPATION ON ACADEMIC PERFORMANCE VARIABLES
1. Graduation Rate
Table 14 presents the results of the hierarchical logistic regression analysis of
Summer Seminar participation on graduation rates. This analysis incorporates several
types of control variables to examine the unique effect of Summer Seminar participation
on graduation rates. Table 14 displays statistics for each of the independent variables
entered on each of the four steps included in the model. Beta weights with standard error,
Wald coefficients, the degrees of freedom, the significance, and odds ratios associated
with each variable in the model are also displayed. Variables entered on each step are
depicted in bold on the respective step.
Results of the hierarchical logistic regression analysis were significant
χ2(12)=167.323 (p<0.001), indicating that Summer Seminar participation was predictive
of higher graduation rates. It is worth noting that the impact of the Summer Seminar
program on graduation rates was significant even after controlling for demographic and
admissions variables, as well as proven indicators of success. The model accounted for
3.1% of the variance in graduation rate (Nagelkerke R2=.031). Summer Seminar
participants were 1.26 times more likely to graduate when compared to non-participants.
Additionally, Minority Status, Gender Status, Combined ECA, Official HS Rank,
HS Recommendations, SAT Math, and Preparatory School significantly predicted
graduation rates. These results indicate that midshipmen were more likely to graduate
from the Naval Academy if they participated in more high school extracurricular
activities, had a higher high school class rank or teacher recommendation scores, had a
higher math SAT score, or attended preparatory school. They were less likely to graduate
from the Naval Academy if they were a minority or a female.

48
Table 14. Regression Results for Graduation Rate
Step Independent Variable B Std.
Error Wald df Sig. Exp(B)
1 (Constant) 1.466 .033 1961.519 1 .000 4.331 Minority Status -.360 .065 30.905 1 .000 .697 Gender Status -.509 .033 57.767 1 .000 .601
2 (Constant) -1.022 .517 3.901 1 .048 .360 Minority Status -.282 .068 17.036 1 .000 .755 Gender Status -.528 .071 55.899 1 .000 .590 Combined ECA .001 .000 5.909 1 .015 1.001 Official HS Rank .001 .000 10.377 1 .001 1.001
HS Recommendations .001 .000 9.465 1 .002 1.001
SAT Math .001 .001 6.137 1 .013 1.001 SAT Verbal -.001 .000 3.425 1 .064 .999 TIS .000 .000 .435 1 .509 1.000 CIS .000 .000 1.656 1 .198 1.000
3 (Constant) -1.664 .559 8.864 1 .003 .189 Minority Status -.286 .068 17.520 1 .000 .751 Gender Status -.524 .071 54.612 1 .000 .592 Combined ECA .001 .000 5.598 1 .018 1.001 Official HS Rank .001 .000 14.684 1 .000 1.001
HS Recommendations .001 .000 10.508 1 .001 1.001
SAT Math .002 .001 10.025 1 .002 1.002 SAT Verbal -.001 .000 2.068 1 .150 .999 TIS .000 .000 .539 1 .463 1.000 CIS .000 .000 2.038 1 .153 1.000 Preparatory School .325 .083 15.290 1 .000 1.384 Prior Enlisted -.190 .092 4.210 1 .040 .827
4 (Constant) -1.396 .565 6.113 1 .013 .248 Minority Status -.303 .069 19.526 1 .000 .739 Gender Status -.539 .071 57.340 1 .000 .583 Combined ECA .001 .000 4.660 1 .031 1.001 Official HS Rank .001 .000 14.712 1 .000 1.001 HS Recommendations .001 .000 10.143 1 .001 1.001
SAT Math .002 .001 8.355 1 .004 1.002 SAT Verbal -.001 .000 3.596 1 .058 .999 TIS .000 .000 .464 1 .496 1.000 CIS .000 .000 1.898 1 .168 1.000 Preparatory School .327 .083 15.569 1 .000 1.387 Prior Enlisted -.158 .093 2.890 1 .089 .854 Summer Seminar Status .230 .070 10.709 1 .001 1.259
Note: Nagelkerke R2 for step 1 = .016, for step 2 = .026, for step 3 =.029, and for step 4 = .031

49
2. Academic Cumulative Quality Point Rating
Table 15 presents the results of the hierarchical linear regression analysis of
Summer Seminar participation on academic cumulative quality point ratings. This
analysis incorporates several types of control variables to examine the unique effect of
Summer Seminar participation on academic cumulative quality point ratings. Table 15
displays statistics for each of the independent variables entered on each of the four steps
included in the model. Beta weights with standard error, standardized betas, t statistics,
and the significance associated with each variable in the model are also displayed.
Variables entered on each step are depicted in bold on the respective step.
Results of the hierarchical linear regression analysis were significant
f(12,6578)=286.120 (p<0.001), indicating that Summer Seminar participation was
predictive of higher academic cumulative quality point ratings. Although the magnitude
of this effect was small (beta=.033), it is worth noting that the impact of the Summer
Seminar program on academic cumulative quality point ratings was significant even after
controlling for demographic and admissions variables, as well as proven indicators of
success. The model accounted for 34.2% of the variance in cumulative academic quality
point ratings (Adjusted R2=.342).
Additionally, Minority Status, Gender Status, Combined ECA, Official HS Rank,
HS Recommendations, SAT Math, SAT Verbal, TIS, CIS, Preparatory School, and Prior
Enlisted significantly predicted academic cumulative quality point ratings. These results
indicate that midshipmen were more likely to have a higher cumulative academic quality
point rating if they had a higher high school class rank or teacher recommendation scores,
had a higher math or verbal SAT score, had a higher career interest score on the modified
SCII, or were prior-enlisted. They were more likely to have a lower academic cumulative
quality point rating if they were a minority or a female, participated in more high school
extracurricular activities, had a higher technical interest score on the modified SCII, or
attended preparatory school.
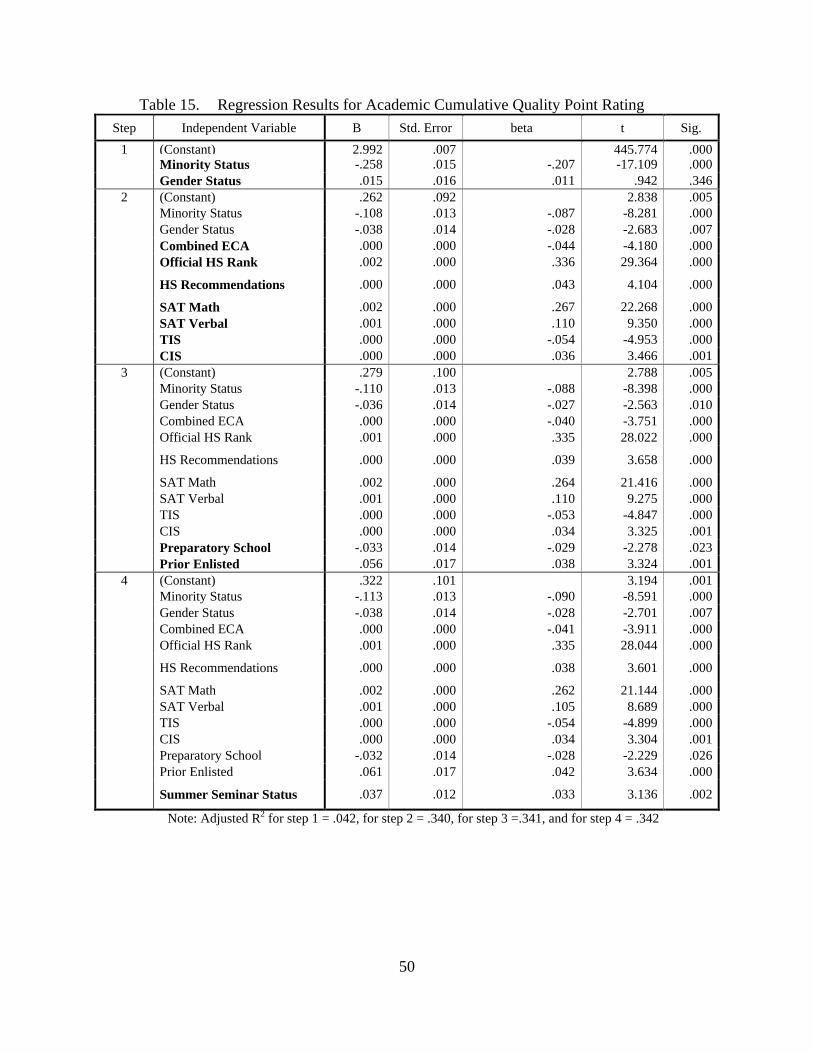
50
Table 15. Regression Results for Academic Cumulative Quality Point Rating
Step Independent Variable B Std. Error beta t Sig.
1 (Constant) 2.992 .007 445.774 .000 Minority Status -.258 .015 -.207 -17.109 .000 Gender Status .015 .016 .011 .942 .346
2 (Constant) .262 .092 2.838 .005 Minority Status -.108 .013 -.087 -8.281 .000 Gender Status -.038 .014 -.028 -2.683 .007 Combined ECA .000 .000 -.044 -4.180 .000 Official HS Rank .002 .000 .336 29.364 .000
HS Recommendations .000 .000 .043 4.104 .000
SAT Math .002 .000 .267 22.268 .000 SAT Verbal .001 .000 .110 9.350 .000 TIS .000 .000 -.054 -4.953 .000 CIS .000 .000 .036 3.466 .001
3 (Constant) .279 .100 2.788 .005 Minority Status -.110 .013 -.088 -8.398 .000 Gender Status -.036 .014 -.027 -2.563 .010 Combined ECA .000 .000 -.040 -3.751 .000 Official HS Rank .001 .000 .335 28.022 .000
HS Recommendations .000 .000 .039 3.658 .000
SAT Math .002 .000 .264 21.416 .000 SAT Verbal .001 .000 .110 9.275 .000 TIS .000 .000 -.053 -4.847 .000 CIS .000 .000 .034 3.325 .001 Preparatory School -.033 .014 -.029 -2.278 .023 Prior Enlisted .056 .017 .038 3.324 .001
4 (Constant) .322 .101 3.194 .001 Minority Status -.113 .013 -.090 -8.591 .000 Gender Status -.038 .014 -.028 -2.701 .007 Combined ECA .000 .000 -.041 -3.911 .000 Official HS Rank .001 .000 .335 28.044 .000 HS Recommendations .000 .000 .038 3.601 .000
SAT Math .002 .000 .262 21.144 .000 SAT Verbal .001 .000 .105 8.689 .000 TIS .000 .000 -.054 -4.899 .000 CIS .000 .000 .034 3.304 .001 Preparatory School -.032 .014 -.028 -2.229 .026 Prior Enlisted .061 .017 .042 3.634 .000 Summer Seminar Status .037 .012 .033 3.136 .002
Note: Adjusted R2 for step 1 = .042, for step 2 = .340, for step 3 =.341, and for step 4 = .342
51
3. Major Selection
Table 16 presents the results of the hierarchical logistic regression analysis of
Summer Seminar participation on major selection. This analysis incorporates several
types of control variables to examine the unique effect of Summer Seminar participation
on major selection. Table 16 displays statistics for each of the independent variables
entered on each of the four steps included in the model. Beta weights with standard error,
Wald coefficients, the degrees of freedom, the significance, and odds ratios associated
with each variable in the model are also displayed. Variables entered on each step are
depicted in bold on the respective step.
Results of the hierarchical logistic regression analysis were significant
χ2 (12)=1631.333 (p<0.001). However, examination of the beta weight coefficient
suggests that Summer Seminar participation did not predict unique variance beyond that
associated with previously included variables. Thus, Summer Seminar participation did
not influence major selection.
Overall, the model accounted for 29.7% of the variance in major selection
(Nagelkerke R2=.297). Individual variables that significantly predicted major selection
include Minority Status, Gender Status, Official HS Rank, SAT Math, SAT Verbal, TIS,
CIS, Preparatory School, and Prior Enlisted. These results indicate that midshipmen
were more likely to choose a technical major if they were a minority, a female, had a
higher high school class rank, had a higher math SAT score, had a higher technical or
career interest score on the modified SCII, or were prior-enlisted. They were less likely
to choose a technical major if they had a higher verbal SAT score or attended preparatory
school.

52
Table 16. Regression Results for Major Selection
Step Independent Variable B Std.
Error Wald df Sig. Exp(B)
1 (Constant) .464 .030 245.340 1 .000 1.591 Minority Status -.125 .066 3.572 1 .059 .883 Gender Status -.249 .071 12.473 1 .000 .780
2 (Constant) -10.843 .586 342.329 1 .000 .000 Minority Status .210 .078 7.266 1 .007 1.233 Gender Status .322 .083 15.179 1 .000 1.380 Combined ECA -.001 .000 8.288 1 .004 .999 Official HS Rank .002 .000 40.182 1 .000 1.002
HS Recommendations .001 .000 7.193 1 .007 1.001
SAT Math .009 .001 249.319 1 .000 1.009 SAT Verbal -.003 .001 27.873 1 .000 .997 TIS .009 .000 646.290 1 .000 1.009 CIS .002 .000 43.970 1 .000 1.002
3 (Constant) -11.486 .638 324.228 1 .000 .000 Minority Status .180 .078 5.301 1 .021 1.197 Gender Status .362 .083 18.938 1 .000 1.437 Combined ECA -.001 .000 3.345 1 .067 .999 Official HS Rank .002 .000 47.045 1 .000 1.002
HS Recommendations .001 .000 2.861 1 .091 1.001
SAT Math .010 .001 248.903 1 .000 1.010 SAT Verbal -.002 .001 22.838 1 .000 .998 TIS .009 .000 660.663 1 .000 1.009 CIS .002 .000 41.548 1 .000 1.002 Preparatory School -.175 .085 4.202 1 .040 .840 Prior Enlisted .765 .101 56.741 1 .000 2.148
4 (Constant) -11.514 .644 319.860 1 .000 .000 Minority Status .182 .078 5.380 1 .020 1.200 Gender Status .364 .083 19.037 1 .000 1.439 Combined ECA -.001 .000 3.284 1 .070 .999 Official HS Rank .002 .000 47.055 1 .000 1.002 HS Recommendations .001 .000 2.882 1 .090 1.001
SAT Math .010 .001 248.279 1 .000 1.010 SAT Verbal -.002 .001 21.867 1 .000 .998 TIS .009 .000 660.634 1 .000 1.009 CIS .002 .000 41.603 1 .000 1.002 Preparatory School -.175 .085 4.224 1 .040 .839 Prior Enlisted .761 .102 55.678 1 .000 2.141 Summer Seminar Status -.023 .072 .107 1 .743 .977
Note: Nagelkerke R2 for step 1 = .003, for step 2 = .287, for step 3 =.297, and for step 4 = .297

53
D. REGRESSION ANALYSES OF SUMMER SEMINAR PARTICIPATION ON MILITARY PERFORMANCE VARIABLES
1. Military Cumulative Quality Point Rating
Table 17 presents the results of the hierarchical linear regression analysis of
Summer Seminar participation on military cumulative quality point ratings. This analysis
incorporates several types of control variables to examine the unique effect of Summer
Seminar participation on military cumulative quality point ratings. Table 17 displays
statistics for each of the independent variables entered on each of the four steps included
in the model. Beta weights with standard error, standardized betas, t statistics, and the
significance associated with each variable in the model are also displayed. Variables
entered on each step are depicted in bold on the respective step.
Results of the hierarchical linear regression analysis were significant
f(12,6578)=130.534 (p<0.001), indicating that Summer Seminar participation was
predictive of higher military cumulative quality point ratings. Although the magnitude of
this effect was small (beta=.029), it is worth noting that the impact of the Summer
Seminar program on military cumulative quality point ratings was significant even after
controlling for demographic and admissions variables, as well as proven indicators of
success. The model accounted for 19.1% of the variance in military cumulative quality
point ratings (Adjusted R2=.191).
Additionally, Minority Status, Combined ECA, Official HS Rank, HS
Recommendations, SAT Math, SAT Verbal, CIS, and Prior Enlisted significantly
predicted military cumulative quality point ratings. These results indicate that
midshipmen were more likely to have a higher military cumulative quality point rating if
they participated in more high school extracurricular activities, had a higher high school
class rank or teacher recommendation scores, had a higher math or verbal SAT score, had
a higher career interest score on the modified SCII, or were prior-enlisted. They were
more likely to have a lower military cumulative quality point rating if they were a
minority.

54
Table 17. Regression Results for Military Cumulative Quality Point Rating
Step Independent Variable B Std. Error beta t Sig.
1 (Constant) 3.169 .004 707.768 .000 Minority Status -.178 .010 -.213 -17.667 .000 Gender Status .019 .011 .021 1.778 .076
2 (Constant) 1.626 .068 23.829 .000 Minority Status -.110 .010 -.132 -11.384 .000 Gender Status -.014 .010 -.015 -1.315 .189 Combined ECA .000 .000 .061 5.278 .000 Official HS Rank .001 .000 .250 19.738 .000
HS Recommendations .000 .000 .091 7.803 .000
SAT Math .001 .000 .111 8.344 .000 SAT Verbal .000 .000 .077 5.927 .000 TIS -.000 .000 -.001 -.065 .948 CIS .000 .000 .039 3.385 .001
3 (Constant) 1.596 .074 21.541 .000 Minority Status -.112 .010 -.134 -11.516 .000 Gender Status -.012 .010 -.013 -1.163 .245 Combined ECA .000 .000 .065 5.579 .000 Official HS Rank .001 .000 .255 19.222 .000
HS Recommendations .000 .000 .087 7.434 .000
SAT Math .001 .000 .114 8.304 .000 SAT Verbal .000 .000 .080 6.067 .000 TIS .000 .000 .001 .075 .940 CIS .000 .000 .038 3.314 .001 Preparatory School -.004 .011 -.005 -.363 .716 Prior Enlisted .031 .012 .032 2.467 .014
4 (Constant) 1.621 .075 21.687 .000 Minority Status -.113 .010 -.136 -11.659 .000 Gender Status -.013 .010 -.015 -1.273 .203 Combined ECA .000 .000 .064 5.444 .000 Official HS Rank .001 .000 .255 19.232 .000 HS Recommendations .000 .000 .087 7.389 .000
SAT Math .001 .000 .111 8.103 .000 SAT Verbal .000 .000 .075 5.614 .000 TIS .000 .000 .000 .036 .971 CIS .000 .000 .038 3.296 .001 Preparatory School -.003 .011 -.005 -.324 .746 Prior Enlisted .034 .013 .035 2.713 .007 Summer Seminar Status .022 .009 .029 2.490 .013
Note: Adjusted R2 for step 1 = .042, for step 2 = .190, for step 3 =.191, and for step 4 = .191
55
2. Striper Selection
Table 18 presents the results of the hierarchical logistic regression analysis of
Summer Seminar participation on striper selection. This analysis incorporates several
types of control variables to examine the unique effect of Summer Seminar participation
on striper selection. Table 18 displays statistics for each of the independent variables
entered on each of the four steps included in the model. Beta weights with standard error,
Wald coefficients, the degrees of freedom, the significance, and odds ratios associated
with each variable in the model are also displayed. Variables entered on each step are
depicted in bold on the respective step.
Results of the hierarchical logistic regression analysis were significant
χ2(12)=221.548 (p<0.001). However, examination of the beta weight coefficient
suggests that Summer Seminar participation did not predict unique variance beyond that
associated with previously included variables. Thus, Summer Seminar participation did
not influence striper selection.
Overall, the model accounted for 5.0% of the variance in striper selection
(Nagelkerke R2=.050). Individual variables that significantly predicted striper selection
include Minority Status, Combined ECA, Official HS Rank, HS Recommendations, SAT
Math and TIS. These results indicate that midshipmen were more likely to be a striper if
they participated in more high school extracurricular activities, had a higher high school
class rank or teacher recommendation scores, or had a higher math SAT score. They
were less likely to be a striper if they were a minority or had a higher technical interest
score on the modified SCII.

56
Table 18. Regression Results for Striper Selection
Step Independent Variable B Std.
Error Wald df Sig. Exp(B)
1 (Constant) -1.118 .034 1109.759 1 .000 .327 Minority Status -.366 .082 20.182 1 .000 .693 Gender Status .194 .079 5.953 1 .015 1.214
2 (Constant) -5.766 .585 97.100 1 .000 .003 Minority Status -.202 .086 5.585 1 .018 .817 Gender Status .018 .084 .046 1 .830 1.018 Combined ECA .003 .000 54.435 1 .000 1.003 Official HS Rank .001 .000 16.241 1 .000 1.001
HS Recommendations .002 .000 28.058 1 .000 1.002
SAT Math .002 .001 7.114 1 .008 1.002 SAT Verbal .000 .001 .031 1 .861 1.000 TIS -.001 .000 16.909 1 .000 .999 CIS .000 .000 .073 1 .787 1.000
3 (Constant) -5.825 .635 84.154 1 .000 .003 Minority Status -.207 .086 5.791 1 .016 .813 Gender Status .022 .084 .067 1 .796 1.022 Combined ECA .003 .000 55.057 1 .000 1.003 Official HS Rank .001 .000 15.537 1 .000 1.001
HS Recommendations .002 .000 26.826 1 .000 1.002
SAT Math .002 .001 6.928 1 .008 1.002 SAT Verbal .000 .001 .050 1 .822 1.000 TIS -.001 .000 16.513 1 .000 .999 CIS .000 .000 .060 1 .806 1.000 Preparatory School -.025 .094 .070 1 .791 .976 Prior Enlisted .092 .109 .707 1 .400 1.096
4 (Constant) -5.694 .641 78.933 1 .000 .003 Minority Status -.214 .086 6.217 1 .013 .807 Gender Status .015 .084 .032 1 .858 1.015 Combined ECA .003 .000 53.834 1 .000 1.003 Official HS Rank .001 .000 15.618 1 .000 1.001 HS Recommendations .002 .000 26.445 1 .000 1.002
SAT Math .002 .001 6.327 1 .012 1.002 SAT Verbal .000 .001 .000 1 .989 1.000 TIS -.001 .000 16.692 1 .000 .999 CIS .000 .000 .052 1 .820 1.000 Preparatory School -.022 .094 .056 1 .813 .978 Prior Enlisted .109 .110 .984 1 .321 1.115 Summer Seminar Status .108 .071 2.338 1 .126 1.114
Note: Nagelkerke R2 for step 1 = .006, for step 2 = .049, for step 3 =.049, and for step 4 = .050
57
3. Honor and Major Conduct Offenses
Table 19 presents the results of the hierarchical logistic regression analysis of
Summer Seminar participation on honor and major conduct offenses. This analysis
incorporates several types of control variables to examine the unique effect of Summer
Seminar participation on honor and major conduct offenses. Table 19 displays statistics
for each of the independent variables entered on each of the four steps included in the
model. Beta weights with standard error, Wald coefficients, the degrees of freedom, the
significance, and odds ratios associated with each variable in the model are also
displayed. Variables entered on each step are depicted in bold on the respective step.
Results of the hierarchical logistic regression analysis were significant
χ2(12)=120.497 (p<0.001). However, examination of the beta weight coefficient
suggests that Summer Seminar participation did not predict unique variance beyond that
associated with previously included variables. Thus, Summer Seminar participation did
not influence honor and major conduct offenses.
Overall, the model accounted for 3.1% of the variance in honor and major
conduct offenses (Nagelkerke R2=.031). Individual variables that significantly predicted
honor and major conduct offenses include Official HS Rank, HS Recommendations, SAT
Verbal, and CIS. These results indicate that midshipmen were less likely to have an
honor or major conduct offense in their record if they had a higher high school class rank
or teacher recommendation scores, had a higher verbal SAT score, or had a higher career
interest score on the modified SCII.

58
Table 19. Regression Results for Honor and Major Conduct Offenses
Step Independent Variable B Std.
Error Wald df Sig. Exp(B)
1 (Constant) -1.063 .036 876.074 1 .000 .345 Minority Status .212 .077 7.572 1 .006 1.237 Gender Status -.147 .087 2.822 1 .093 .863
2 (Constant) 1.909 .588 10.545 1 .001 6.747 Minority Status .119 .081 2.140 1 .144 1.126 Gender Status -.078 .092 .716 1 .397 .925 Combined ECA .000 .000 1.004 1 .316 1.000 Official HS Rank -.002 .000 46.078 1 .000 .998
HS Recommendations -.001 .000 10.361 1 .001 .999
SAT Math .001 .001 1.422 1 .233 1.001 SAT Verbal -.001 .001 3.009 1 .083 .999 TIS .000 .000 1.920 1 .166 1.000 CIS -.001 .000 12.927 1 .000 .999
3 (Constant) 2.105 .640 10.808 1 .001 8.204 Minority Status .125 .081 2.371 1 .124 1.134 Gender Status -.085 .092 .858 1 .354 .918 Combined ECA .000 .000 .688 1 .407 1.000 Official HS Rank -.002 .000 45.609 1 .000 .998
HS Recommendations -.001 .000 9.153 1 .002 .999
SAT Math .001 .001 .929 1 .335 1.001 SAT Verbal -.001 .001 3.414 1 .065 .999 TIS -.001 .000 2.140 1 .144 .999 CIS -.001 .000 12.661 1 .000 .999 Preparatory School -.021 .090 .053 1 .817 .979 Prior Enlisted -.122 .111 1.217 1 .270 .885
4 (Constant) 2.216 .647 11.741 1 .001 9.168 Minority Status .119 .082 2.121 1 .145 1.126 Gender Status -.090 .092 .962 1 .327 .914 Combined ECA .000 .000 .574 1 .449 1.000 Official HS Rank -.002 .000 45.826 1 .000 .998 HS Recommendations -.001 .000 9.235 1 .002 .999
SAT Math .001 .001 .770 1 .380 1.001 SAT Verbal -.001 .001 4.066 1 .044 .999 TIS -.001 .000 2.197 1 .138 .999 CIS -.001 .000 12.808 1 .000 .999 Preparatory School -.018 .090 .042 1 .838 .982 Prior Enlisted -.108 .111 .942 1 .332 .898 Summer Seminar Status .094 .074 1.582 1 .208 1.098
Note: Nagelkerke R2 for step 1 = .003, for step 2 = .030, for step 3 =.031, and for step 4 = .031
59
E. REGRESSION ANALYSIS OF SUMMER SEMINAR PARTICIPATION ON PHYSICAL READINESS TEST SCORES
Table 20 presents the results of the hierarchical linear regression analysis of
Summer Seminar participation on physical readiness test scores. This analysis
incorporates several types of control variables to examine the unique effect of Summer
Seminar participation on physical readiness test scores. Table 20 displays statistics for
each of the independent variables entered on each of the four steps included in the model.
Beta weights with standard error, standardized betas, t statistics, and the significance
associated with each variable in the model are also displayed. Variables entered on each
step are depicted in bold on the respective step.
Results of the hierarchical linear regression analysis were significant
f(12,4606)=13.456 (p<0.001), indicating that Summer Seminar participation was
predictive of higher physical readiness test scores. Although the magnitude of this effect
was small (beta=.048), it is worth noting that the impact of the Summer Seminar program
on physical readiness test scores was significant even after controlling for demographic
and admissions variables, as well as proven indicators of success. The model accounted
for 3.1% of the variance in a midshipman’s physical readiness test scores (Adjusted
R2=.031).
Additionally, Minority Status, Gender Status, Combined ECA, Official HS Rank,
SAT Verbal, CIS, and Prior Enlisted significantly predicted physical readiness test
scores. These results indicate that midshipmen were more likely to score higher on their
physical readiness test if they participated in more high school extracurricular activities
or had a higher high school class rank. They were likely to score lower on their physical
readiness test if they were a minority, a female, had a higher verbal SAT score, had a
higher career interest score on the modified SCII, or were prior-enlisted.

60
Table 20. Regression Results for Physical Readiness Test Scores
Step Independent Variable B Std. Error beta t Sig.
1 (Constant) 83.928 .150 559.570 .000 Minority Status -1.011 .336 -.044 -3.014 .003 Gender Status -.431 .359 -.018 -1.201 .230
2 (Constant) 80.738 2.403 33.596 .000 Minority Status -.872 .345 -.038 -2.526 .012 Gender Status -.896 .368 -.037 -2.436 .015 Combined ECA .012 .002 .101 6.631 .000 Official HS Rank .008 .001 .092 5.536 .000
HS Recommendations .000 .001 .003 .193 .847
SAT Math .002 .002 .013 .748 .454 SAT Verbal -.010 .002 -.072 -4.193 .000 TIS .000 .001 -.004 -.281 .778 CIS -.006 .001 -.072 -4.795 .000
3 (Constant) 81.645 2.628 31.073 .000 Minority Status -.833 .345 -.037 -2.411 .016 Gender Status -.969 .368 -.040 -2.632 .009 Combined ECA .011 .002 .092 6.000 .000 Official HS Rank .007 .001 .084 4.854 .000
HS Recommendations .001 .001 .010 .657 .511
SAT Math .002 .003 .011 .602 .547 SAT Verbal -.010 .002 -.074 -4.268 .000 TIS -.001 .001 -.008 -.528 .597 CIS -.006 .001 -.069 -4.618 .000 Preparatory School .251 .380 .012 .662 .508 Prior Enlisted -1.806 .501 -.057 -3.607 .000
4 (Constant) 82.735 2.648 31.246 .000 Minority Status -.892 .345 -.039 -2.581 .010 Gender Status -1.032 .369 -.042 -2.799 .005 Combined ECA .011 .002 .089 5.796 .000 Official HS Rank .007 .001 .083 4.789 .000 HS Recommendations .001 .001 .010 .652 .514
SAT Math .001 .003 .007 .409 .682 SAT Verbal -.011 .002 -.082 -4.694 .000 TIS -.001 .001 -.009 -.554 .580 CIS -.006 .001 -.070 -4.685 .000 Preparatory School .283 .379 .013 .747 .455 Prior Enlisted -1.657 .503 -.052 -3.296 .001 Summer Seminar Status .922 .294 .048 3.138 .002
Note: Adjusted R2 for step 1 = .002, for step 2 = .027, for step 3 =.030, and for step 4 = .031

61
F. SUMMARY
This chapter covered the results from the correlation and regression analyses
performed in this study. First, a correlation matrix showed the first-order, bivariate
correlations between eighteen of the nineteen variables, both independent and dependent.
Then, the results of the seven regressions performed in this study were presented.
Conclusions from these results will be drawn in Chapter V.
A summary of significant independent variables from the regressions is presented
in Table 21. The dependent variables are listed on the left, along with the total
percentage of variance predicted by the model for each. This percentage is derived from
either the Nagelkerke R2 or the Adjusted R2, depending on the type of regression
performed. The independent variables, both with positive and negative correlation, are
listed on the right in order by the magnitude of their correlation. Either the Wald or beta
statistic follows each independent variable, depending on the type of regression
performed.

62
Table 21. Summary of Significant Independent Variables
DEPENDENT VARIABLE
INDEPENDENT VARIABLES WITH POSITIVE CORRELATION
INDEPENDENT VARIABLES WITH NEGATIVE CORRELATION
Graduated 3.1%
Preparatory School (z=15.569) Official HS Rank (z=14.712) Summer Seminar Status (z=10.709) HS Recommendations (z=10.143) SAT Math (z=8.355) Combined ECA (z=4.660)*
Gender Status (z=57.340) Minority Status (z=19.526)
Academic CQPR 34.2%
Official HS Rank (beta=.335) SAT Math (beta=.262) SAT Verbal (beta=.105) Prior Enlisted (beta=.042) HS Recommendations (beta=.038) CIS (beta=.034) Summer Seminar Status (beta=.033)
Minority Status (beta=-.090) TIS (beta=-.054) Combined ECA (beta=-.041) Gender Status (beta=-.028) Preparatory School (beta=-.028)*
Technical Major 29.7%
TIS (z=660.634) SAT Math (z=248.279) Prior Enlisted (z=55.678) Official HS Rank (z=47.055) CIS (z=41.603) Gender Status (z=19.037) Minority Status (z=5.380)*
SAT Verbal (z=21.867) Preparatory School (z=4.224)*
Military CQPR 19.1%
Official HS Rank (beta=.255) SAT Math (beta=.111) HS Recommendations (beta=.087) SAT Verbal (beta=.075) Combined ECA (beta=.064) CIS (beta=.038) Prior Enlisted (beta=.035) Summer Seminar Status (beta=.029)*
Minority Status (beta=-.136)
Striper 5.0%
Combined ECA (z=53.834) HS Recommendations (z=26.445) Official HS Rank (z=15.618) SAT Math (z=6.327)*
TIS (z=16.692) Minority Status (z=6.217)*
Honor/Major Conduct Offenses
3.1%
Official HS Rank (z=45.826) CIS (z=12.808) HS Recommendations (z=9.235) SAT Verbal (z=4.066)*
Mean PRT 3.1%
Combined ECA (beta=.089) Official HS Rank (beta=.083) Summer Seminar Status (beta=.048)
SAT Verbal (beta=-.082) CIS (beta=-.070) Prior Enlisted (beta=-.052) Gender Status (beta=-.042) Minority Status (beta=-.039)
*Denotes p‹0.05 for these independent variables. p‹0.01 for all others.

63
V. CONCLUSIONS AND RECOMMENDATIONS
A. INTRODUCTION
This chapter will use the analyses of Chapter IV and draw conclusions based the
previous literature reviewed in Chapter II. As a review, it was hypothesized that Summer
Seminar attendance would lead to increased graduation rates and academic cumulative
quality point ratings, as well as increased military and physical performance. To begin
with, the results from the correlation and regression analyses will be interpreted in light
of previous literature. Finally, a summary of conclusions and recommendations for
further study will be presented.
When examining the dependent variables, a review of the significant results from
the correlation matrix in Table 13 reveals that Summer Seminar participants were likely
to have higher academic cumulative quality point ratings, higher military cumulative
quality point ratings, a greater chance of being a striper, and higher scores on the physical
readiness test. While these are only first-order correlations between two variables, they
are a starting point for further conclusions. The fact that orientation programs such as the
Summer Seminar program yield increased academic performance is well established in
the literature (Banta & Kuh, 1998; Galloway, 2000; Gass, 1987). This is reflected in the
positive correlation between Summer Seminar participation and academic cumulative
quality point ratings. Also, the positive correlations between Summer Seminar
participation and military cumulative quality point ratings, being a striper, and physical
readiness test scores may be indicative of the increase in the performance of participants
of a realistic job preview such as the Summer Seminar program (Phillips, 1998). Further
conclusions, based on hierarchical regression analyses, will be drawn later in this chapter.
While not directly related to the hypotheses in this study, it is interesting to note
the correlation of Summer Seminar participation with the other independent variables.
Summer Seminar participation is correlated negatively with preparatory school
attendance and prior-enlisted service. A review of the data indicates that only 9% of
Summer Seminar participants later attended preparatory school and only 1% later went
on to enlisted service (Table 2), as compared to the overall averages of 21.7% and 12.5%,

64
respectively (Table 9). The admissions path to the Naval Academy does not normally
lead people who have attended the Summer Seminar program down either of these paths,
so it is logical that they are under-represented when looking at Summer Seminar program
participants.
Also of note is the positive correlation between Summer Seminar participation
and being a female. When looking at this data set, the fact stands out that 21% of
Summer Seminar participants were female (Table 2), a high percentage when compared
to the overall average of 16.2% (Table 9). There is no mechanism in place to accept a
greater percentage of females than normal to the Summer Seminar program, but it
appears to be occurring none-the-less.
Finally, the positive correlation between Summer Seminar participation and more
high school extracurricular activities, better high school class ranks and teacher
recommendation scores, and higher math and verbal SAT scores is indicative of the fact
that Summer Seminar participants were above average on all of these scores (Table 2 &
Table 11). This may result from the fact that the participants in the Summer Seminar
program are highly screened before they are allowed to participate (United States Naval
Academy, 2003c).
B. CONCLUSIONS ON ANALYSES OF ACADEMIC PERFORMANCE VARIABLES
1. Graduation Rate
It was hypothesized that graduation rates would be positively affected by Summer
Seminar attendance. The studies on orientation programs (Banta & Kuh, 1998;
Galloway, 2000; Gass, 1987, 1990; Schaeffer, 1999), as well as realistic job previews and
expectation-lowering procedures (Buckley et al., 2002; Phillips, 1998), all indicated that
a program such as Summer Seminar should have a positive effect on graduation rates.
The hypothesis was confirmed by the analysis done in this study. The results of the
hierarchical logistic regression analysis indicated that program participants were 1.26
times more likely to graduate than non-participants, and these results were significant at
the 0.01 level (Table 14). This may indicate that Summer Seminar participants, when
compared to non-participants, apply to the Naval Academy with a better understanding of
what Naval Academy life entails. This information may make them more likely to

65
complete the four years necessary to graduate. Also, the pre-exposure may deter some
Summer Seminar participants from applying for admission as they realize that the Naval
Academy is not for them, an opportunity that non-participants miss since they do not
receive the same pre-exposure. Candidates without this pre-exposure may be at a greater
risk to attrite early in their Naval Academy career as they come to realize that they are
unhappy with their choice of colleges.
2. Academic Cumulative Quality Point Rating
It was hypothesized that academic cumulative quality point ratings would be
positively affected by Summer Seminar attendance. Previous research on orientation
programs (Banta & Kuh, 1998; Galloway, 2000; Gass, 1987) indicated that programs
similar to Summer Seminar yielded increased academic performance, and the first-order,
bivariate correlation between Summer Seminar participation and academic cumulative
quality point ratings indicated a positive relationship. The hypothesis was confirmed by
the analysis done in this study. The results of the hierarchical linear regression analysis
indicated that Summer Seminar program participation was indicative of higher academic
cumulative quality point ratings, and these results were significant at the 0.01 level
(Table 15). This increased academic success may result from the fact that Summer
Seminar participants arrive at the Naval Academy better oriented than non-participants,
making them more ready to perform academically. Also, the fact that Summer Seminar
participants are highly screened (United States Naval Academy, 2003c) may predispose
them to a better academic performance than non-participants, although Summer Seminar
participation was significantly indicative of higher academic cumulative quality point
ratings even after controlling for the admissions variables used to screen Summer
Seminar applicants.
3. Major Selection
The hypothesis for this study stated that it was unknown what effect, if any, that
Summer Seminar attendance would have on major selection. There was no existing
literature in this area, and the initial first-order, bivariate correlation did not yield any
significant results. The results of the hierarchical logistic regression analysis indicated
that Summer Seminar program participation was not a significant indicator that a
midshipman would choose a technical major. During the Summer Seminar curriculum,
66
participants are exposed to a variety of Naval Academy majors, both technical and non-
technical (United States Naval Academy, 2003a). Since the Summer Seminar program
does not have a bias towards presenting information on only technical majors, it follows
that Summer Seminar participation would not be indicative of a midshipman selecting a
technical major.
C. CONCLUSIONS ON ANALYSES OF MILITARY PERFORMANCE VARIABLES
1. Military Cumulative Quality Point Rating
It was hypothesized that military cumulative quality point ratings would be
positively affected by Summer Seminar attendance. Previous literature on realistic job
previews (Phillips, 1998) indicated that programs similar to Summer Seminar yielded
increased performance, and the first-order, bivariate correlation between Summer
Seminar participation and military cumulative quality point ratings indicated a positive
relationship. The hypothesis was confirmed by the analysis done in this study. The
results of the hierarchical linear regression analysis indicated that Summer Seminar
program participation was indicative of higher military cumulative quality point ratings,
and these results were significant at the 0.05 level (Table 17). This increased military
success may result from the fact that Summer Seminar participants have a better
understanding of the military lifestyle that four years at the Naval Academy entails
(United States Naval Academy, 2003b). They are able to decide before applying to the
Naval Academy if this lifestyle would suit them. Those that do apply and are accepted
have already committed themselves to a military existence, and this mindset may account
for their increased military performance over midshipmen who did not attend the
Summer Seminar program and whose military performance may be suffering because
they are not militarily inclined.
2. Striper Selection
It was hypothesized that striper selection would be positively affected by Summer
Seminar attendance. Previous literature on realistic job previews (Phillips, 1998)
indicated that programs similar to Summer Seminar yielded increased performance, and
the first-order, bivariate correlation between Summer Seminar participation and striper
selection indicated a positive relationship. However, the hypothesis was not confirmed
by the analysis done in this study. The results of the hierarchical logistic regression
67
analysis indicated that Summer Seminar program participation was not a significant
indicator of increased striper selection. This is inconsistent with the literature, and may
be explained in one of two ways. Either a midshipman’s selection as a striper is not a
good indicator of performance at the Naval Academy or the dependent variable needs to
be structured differently. The first possibility seems unlikely, as the selection to a striper
position is a large part of the military development of midshipmen (Bogle, 1996). This
indicates that the structure of the dependent variable Striper may be flawed. In this study
it was coded dichotomously, indicating that a midshipman either held a striper position or
they did not. A restructuring of the dependent variable to distinguish between the
different ranks of striper billets and the number of striper billets held by an individual
may yield results that are more in line with the literature.
3. Honor and Major Conduct Offenses
It was hypothesized that Summer Seminar attendance would be positively
associated with a lack of honor and major conduct offenses. Previous literature on
realistic job previews (Phillips, 1998) indicated that programs similar to Summer Seminar
yielded increased performance. However, the hypothesis was not confirmed by the
analysis done in this study. The results of the hierarchical logistic regression analysis
indicated that Summer Seminar program participation was not a significant indicator of a
lack of honor and major conduct offenses. While this is inconsistent with the general
performance literature, there is no reason to doubt the results of the analysis. Committing
an honor or major conduct offense is clearly a sign of negative performance at the Naval
Academy (Locklear, 2000a; Ryan, 2001). There is not prior research that specifically ties
honor and conduct behavior to a realistic job preview similar to the Summer Seminar
program. It is concluded that there are factors other than Summer Seminar attendance
that may be significantly related to committing an honor or major conduct offense. It is
interesting to note that the model used in this study did not contain a single positive
significant indicator of committing an honor or major conduct offense, although it did
have four negative significant indicators. Apparently it is easier to identify who will not
commit an honor or major conduct violation than it is to identify who will.
68
D. CONCLUSIONS ON ANALYSIS OF PHYSICAL READINESS TEST SCORES
It was hypothesized that Summer Seminar attendance would be related to higher
physical readiness test scores. Previous literature on realistic job previews (Phillips,
1998) indicated that programs similar to Summer Seminar yielded increased
performance, and the first-order, bivariate correlation between Summer Seminar
participation and physical readiness test scores indicated a positive relationship. The
hypothesis was confirmed by the analysis done in this study. The results of the
hierarchical linear regression analysis indicated that Summer Seminar program
participation was indicative of higher physical readiness test scores, and these results
were significant at the 0.01 level (Table 20). This increased physical success may result
from the fact that Summer Seminar participants have a better understanding of the
physical hardships that await them at the Naval Academy. The Summer Seminar
program includes physical training sessions (United States Naval Academy, 2003b), and
in recent years participants have been administered the same physical readiness test that
midshipmen are subject to (Nelson, personal communication, January 2004). Summer
Seminar participants may use the year following their pre-exposure to increase their
physical performance before attending the Naval Academy. Also, some attendees may
realize that they do not posses the necessary physical skills, or the desire to develop them,
and not apply for admission to the Naval Academy. These are both options that are lost
to midshipmen whom did not attend the Summer Seminar program.
E. SUMMARY AND RECOMMENDATIONS
In summary, this study looked at the impact of Summer Seminar participation on
the success of midshipmen at the Naval Academy. The body of literature on recruiting
and orientation programs, as well as realistic job previews and expectation-lowering
procedures, was reviewed. Indicators of midshipman success at the Naval Academy were
defined by reviewing appropriate instructions and past studies of midshipman success.
Finally, these success indicators were analyzed using hierarchical regression analyses to
determine which were affected by Summer Seminar participation.
A midshipman’s academic, military, and physical performance were all positively
affected by Summer Seminar attendance. Academically, midshipmen who participated in

69
the Summer Seminar program had better graduation rates and higher academic
cumulative quality point ratings than non-participants. Militarily, the Summer Seminar
midshipmen had higher military cumulative quality point ratings than their counterparts
who did not attend the Summer Seminar program. Physically, Summer Seminar
attendees had higher physical readiness test scores than non-attendees.
The results of this study are important in that they confirm previous findings on
the impact of recruiting and orientation programs, realistic job previews, and expectation-
lowering procedures on academic performance and retention (Banta & Kuh, 1998;
Buckley et al., 2002; Galloway, 2000; Gass, 1987, 1990; Phillips, 1998; Schaeffer, 1999).
This study is unique in that it expands on previous research by demonstrating the positive
relationship between the Summer Seminar program and both military and physical
indicators of midshipman success. Previous studies (Phillips, 1998) alluded to the
positive impact of realistic job previews on performance in general, but no previous
literature had specifically looked at the military and physical aspects of performance that
were included in this study. It is important to note that the results on academic, military,
and physical performance in this study were observed after controlling for demographic
and admissions variables, as well as proven indicators of midshipman success.
This study has important implications for the Naval Academy and the Navy, as
well as for the other service academies. For the Naval Academy to host a large program
such as Summer Seminar utilizes a vast amount of resources. These resources range
from the physical space in Bancroft Hall and the time of the midshipmen who run the
program to the money spent to administer the program, and have no doubt increased as
the program has significantly increased in size over the past decade (Nelson, 2003). It
appears as if the resources have been put to good use, especially in light of the fact that
Summer Seminar participants in this study showed significantly better academic,
military, and physical performance than non-participants.
For the Navy, the fact that Summer Seminar participants are 1.26 times more
likely to graduate than non-participants is of interest. The throughput of the Naval
Academy is based on the personnel needs of the Navy. Every time a midshipman fails to
graduate, the Navy must compensate by training another body to fill the hole. The Navy

70
thus loses the initial time and dollar investment made in the non-graduate. Depending on
how far along the failing midshipman was, this investment can be upwards of four years
and hundreds of thousands of dollars. Clearly, any program that can minimize this loss is
of benefit to the Navy.
For the other service academies, this research may serve as a beginning point for
research into their own similar summer programs. The United States Military Academy
(USMA), the United States Air Force Academy (USAFA), and the United States Coast
Guard Academy (USCGA) all have programs like Summer Seminar. For USMA it is the
Invitational Academic Workshop, for USAFA it is also called Summer Seminar, and for
USCGA it is the Academy Introduction Mission. All three of these programs are similar
in scope to the Naval Academy’s Summer Seminar, but they currently accommodate less
than half the number of participants that the Naval Academy’s Summer Seminar program
does. It may be worthwhile to the other service academies to evaluate their programs,
possibly using a similar method as this study, and determine if they could benefit from
increasing the size of their summer programs.
As stated in Chapter I, it was not the intent of this study to judge the Summer
Seminar program as a whole. Rather, this review of the Summer Seminar program was
based only on the seven aspects of midshipman performance defined in Chapter III. It is
recognized that these seven variables are by no means the official definition of
midshipman performance. The possibility is also recognized that the Summer Seminar
program has value to individuals other than the participants.
Based on these realizations, this study proposes three recommendations for
further research. One recommendation is to determine different variables that better
define success at the Naval Academy. While the seven variables used in this study are a
starting point, there are many aspects of a midshipman’s performance that they do not
capture. Using these seven variables as the basis for future expansion in the definition of
a midshipman’s performance can only lead to a more complete model of success that
better captures a midshipman’s academic, military, and physical potential.
The variable Striper, as defined in this study, should be broken from a
dichotomous variable into one with different categories to recognize the difference in

71
rank of the various striper billets. As well, the number of striper billets held should be
taken into consideration. These two changes would make this variable a more useful one.
Another recommendation for further study is to look at different ways that the
Summer Seminar program is of value to the Naval Academy. As shown in this study, it
clearly has a value to the attendees. In addition, it may be hypothesized that the program
is of equal or greater value to the midshipmen who administer it. The position of
Summer Seminar detailer provides an outstanding leadership opportunity for Third and
First Class Midshipmen. It is not unusual for a midshipman who is slated to be in a
leadership role during the coming fall academic semester to gain some experience and
practice by being a Summer Seminar detailer the summer before (Nelson, personal
communication, January 2004). The benefit to these midshipmen is surely worthy of
study.
A final recommendation for further study is to consider more proximal goals
when determining which success factors to consider. Almost exclusively, this study used
variables that measured success at the end of a midshipman’s four years at the Naval
Academy. It would be interesting to consider a midshipman’s performance during Plebe
year, or even during Plebe summer, and see if there was any relationship to Summer
Seminar attendance. Conversely, it would be useful to look at the relationship between
Summer Seminar attendance and long-term fleet retention. The literature does point to
the long-term benefits of orientation programs such as Summer Seminar (Gass et al.,
2003). Taking a more short-term or long-term view of performance measures may yield
new, unique benefits of the Summer Seminar program.
Based on the results obtained in this study, it is concluded that the Summer
Seminar program makes a unique, positive contribution to the success of a midshipman at
the Naval Academy. It is hoped that this study will serve as a starting point for future
evaluation of the Summer Seminar program and other programs like it, as well as pioneer
the way for future literature on the impact of programs such as Summer Seminar on
military and physical performance.

72
THIS PAGE INTENTIONALLY LEFT BLANK

73
APPENDIX A
EAS – Aerospace Engineering
EASA – Aerospace Engineering Astronautics
EEE – Electrical Engineering
EGE – General Engineering
EME – Mechanical Engineering
ENA – Naval Architecture
EOE – Ocean Engineering
ESE – Systems Engineering
ESP – Marine Engineering
SAS – Applied Science
SCH – Chemistry
SCS – Computer Science
SGS – General Science
SMA – Mathematics
SMAA – Mathematics Specialty
SMAC – Mathematics Specialty 2
SMAH – Mathematics Honors
SOC – Oceanography
SOCH – Oceanography Honors
SPH – Physics
SPS – Physical Science
SQE – Quantitative Economics
FEC – Economics

74
FECH – Economics Honors
FPS – Political Science
FPSH – Political Science Honors
HEG – English
HEGH – English Honors
HHS – History
HHSH – History Honors

75
LIST OF REFERENCES
Allen, J. R. (2003). Commandant of midshipmen instruction 1600.2B: Midshipmen
aptitude for commission system. Annapolis, MD: United States Naval Academy.
Banta, T. W. & Kuh, G. D. (1998). A missing link in assessment. Change, 30(2), 40-46.
Bogle, W. T. R. (1996). Commandant of midshipmen instruction 1601.12: Brigade
striper organization and selection procedures. Annapolis, MD: United States
Naval Academy.
Bronzini, M. S., Mason, J. M., Jr., Tarris, J. P., & Zaki, E. (1995). Choosing a civil
engineering career: Some market research findings. Journal of Professional Issues
in Engineering Education and Practice, July 1995, 170-176.
Buckley, M. R., Mobbs, T. A., Mendoza, J. L., Novicevic, M. M., Carraher, S. M. & Beu,
D. S. (2002). Implementing realistic job previews and expectation-lowering
procedures: A field experiment. Journal of Vocational Behavior, 61(2), 263-278.
FitzPatrick, B. S. (2001). The performance of preparatory school candidates at the
united states naval academy. Unpublished master’s thesis, Naval Postgraduate
School, Monterey, California.
Galloway, S. (2000). Assessment in wilderness orientation programs: Efforts to improve
college student retention. The Journal of Experiential Education, 23(2), 75-84.
Ganzach, Y., Pazy, A., Ohayun, Y. & Braynin, E. (2000). Realistic job preview, social
exchange and organizational commitment. Academy of Management Proceedings,
2000, 1-6.
Gass, M. A. (1987). The effects of a wilderness orientation program on college students.
The Journal of Experiential Education, 10(2), 30-33.
76
Gass, M. A. (1990). The longitudinal effects of an adventure orientation program. The
Journal of College Student Development, 31(1), 33-38.
Gass, M. A., Garvey, D. E., & Sugerman, D. A. (2003). The long-term effects of a first-
year student wilderness orientation program. The Journal of Experiential
Education, 26(1), 34-40.
Green, S. B., Salkind, N. J., & Akey, T. M. (2000). Using SPSS for windows: Analyzing
and understanding data (2nd ed.). Upper Saddle River, NJ: Prentice Hall.
Goss, W.B., Watson, A.W., Culler, K., & Zettler, G. (1999). [Review of USNA
Admissions Multiple]. Unpublished Raw Data.
Harvey, M. C. (2003). The influence of varsity athletics on midshipman performance.
Unpublished master’s thesis, Naval Postgraduate School, Monterey, California.
Hom, P. W., Griffeth, R. W., Palich, L. E., & Bracker, J. S. (1998). An explanatory
investigation into theoretical mechanisms underlying realistic job previews.
Personnel psychology, 51(2), 421-451.
Hom, P. W., Griffeth, R. W., Palich, L. E., & Bracker, J. S. (1999). Revisiting met
expectations as a reason why realistic job previews work. Personnel Psychology,
52(1), 97-112.
Howard, H. E. & Jones, W. P. (2000). Effectiveness of a freshman seminar in an urban
university: Measurement of selected indicators. College Student Journal, 34(4),
509-515.
Kirkpatrick, D. L. (1983). How to get the information you need to make training
decisions. Personal Administrator, November 1983, 19-25.
Larson, C. R. (1996). United states naval academy instruction 1531.51A: Class standings
and merit lists. Annapolis, MD: United States Naval Academy.
77
Locklear, S. J. (2000a). Commandant of midshipmen instruction 1610.2B: Administrative
conduct system manual. Annapolis, MD: United States Naval Academy.
Locklear, S. J. (2000b). Commandant of midshipmen instruction 6110.2B: Midshipmen
physical readiness test (PRT) procedures.. Annapolis, MD: United States Naval
Academy.
Locklear, S. J. (2001). Commandant of midshipmen instruction 6100.3: Physical
education curriculum requirements. Annapolis, MD: United States Naval
Academy.
Meglino, B. M., Denisi, A. S. & Ravlin, E. C. (1993). Effects of previous job exposure
and subsequent job status on the functioning of a realistic job preview. Personnel
Psychology, 46(4), 803-822.
Mishoe, K. B. (2000). An analysis of the effects of prior enlisted service on midshipman
performance, graduation, and fleet retention at the U.S. naval academy.
Unpublished master’s thesis, Naval Postgraduate School, Monterey, California.
Nelson, D. (2003). Naval academy summer seminar. Shipmate, July-August 2003, 12.
Norušis, M. J. (2002). SPSS 11.0 guide to data analysis. Upper Saddle River, NJ:
Prentice Hall.
Opp, R. D. (2001). Enhancing recruitment success for two-year college students of color.
Community College Journal of Research and Practice, 25, 71-86.
Phillips, J. M. (1998). Effects of realistic job previews on multiple organizational
outcomes: A meta-analysis. Academy of Management Journal, 41(6), 673-690.
Reinstein, A. & Garr, S. (1995). New approaches to recruiting and retention in
accounting programs. Journal of Education for Business, 70(6), 332-337.
Rogers, S. (2001). Remember summer camp? Nursing Management, 32(7), 39-40.

78
Roth, P. G. & Roth, P. L. (1995). Reduce turnover with realistic job previews. CPA
Journal, 65(9), 68-89.
Ryan, J. R. (2001). United states naval academy instruction 1610.3F CH-2: Honor
concept of the brigade of midshipmen. Annapolis, MD: United States Naval
Academy.
Salas, E., Milham, L. M., & Bowers, C. A. (2003). Training evaluation in the military:
Misconceptions, opportunities, and challenges. Military Psychology, 15(1), 3-16.
Schaeffer, P. (1999). Freshman Orientation. National Catholic Reporter, 35(41), 11-12.
Simpson, H. & Oser, R. L. (2003). Evaluating large-scale training simulations. Military
Psychology, 15(1), 25-40.
Summer Seminar Data File (2003) [Data file]. Annapolis, MD: The Office of
Institutional Research, Planning, and Assessment.
Tabachnick, B. G. & Fidell, L. S. (2001). Using multivariate statistics (4th ed.). Boston,
MA: Allyn and Bacon.
United States Naval Academy. (1994). United states naval academy instruction 1531.49:
Graduation and degree requirements. Annapolis, MD: United States Naval
Academy.
United States Naval Academy. (2002). Reef points. Annapolis, MD: United States Naval
Academy.
United States Naval Academy. (2003a). Program activities. In Summer Seminar.
Retrieved October 16, 2003, from http://www.usna.edu/Admissions/activities.htm
United States Naval Academy. (2003b). Typical daily schedule. In Summer Seminar.
Retrieved October 16, 2003, from http://www.usna.edu/Admissions/schedule.htm
79
United States Naval Academy. (2003c). Basic eligibility. In Summer Seminar.
Retrieved October 16, 2003, http://www.usna.edu/Admissions/eligibility.htm
United States Naval Academy. (2003d). Student selection. In Summer Seminar.
Retrieved October 16, 2003, from http://www.usna.edu/Admissions/selection.htm
United States Naval Academy. (2003e). Overview. In Strategic Plan 2003. Retrieved
October 16, 2003, from http://www.usna.edu/StrategicPlan/docs/strategicplan.pdf
United States Naval Academy. (2003f). Data dictionary. In The Office of Institutional
Research, Planning, and Assessment. Retrieved October 17, 2003,
http://www.usna.edu/IR/restricted/usna_data/entattdf_ir_ver2.pdf
Wanous, J. P. & Reichers, A. E. (2000). New employee orientation programs. Human
Resource Management Review, 10(4), 435-451.

80
THIS PAGE INTENTIONALLY LEFT BLANK

81
INITIAL DISTRIBUTION LIST
1. Defense Technical Information Center Ft. Belvoir, Virginia
2. Dudley Knox Library Naval Postgraduate School Monterey, California
3. Nimitz Library United States Naval Academy Annapolis, Maryland
4. Office of Admissions United States Naval Academy Annapolis, Maryland
5. Office of Institutional Research, Planning, and Assessment United States Naval Academy Annapolis, Maryland
6. LEAD Program
United States Naval Academy Annapolis, Maryland
7. Dr. Armando Estrada National Defense University Washington, DC
8. LT Michael Norton United States Naval Academy Annapolis, Maryland


![Skaffold - storage.googleapis.com · [getting-started getting-started] Hello world! [getting-started getting-started] Hello world! [getting-started getting-started] Hello world! 5.](https://static.fdocuments.net/doc/165x107/5ec939f2a76a033f091c5ac7/skaffold-getting-started-getting-started-hello-world-getting-started-getting-started.jpg)


