Thesis - 1ste tussentijdse presentatie
34
Thesis Change your state of mind Dieter Naten (r0255990) Begeleider: Sven Charleer
-
Upload
dieter-naten -
Category
Engineering
-
view
56 -
download
3
Transcript of Thesis - 1ste tussentijdse presentatie
Thesis Change your state of mind
Dieter Naten (r0255990)
Begeleider: Sven Charleer
Overview
• Subject Description
• Literature
• First idea + test
• Infographics
• What’s next?
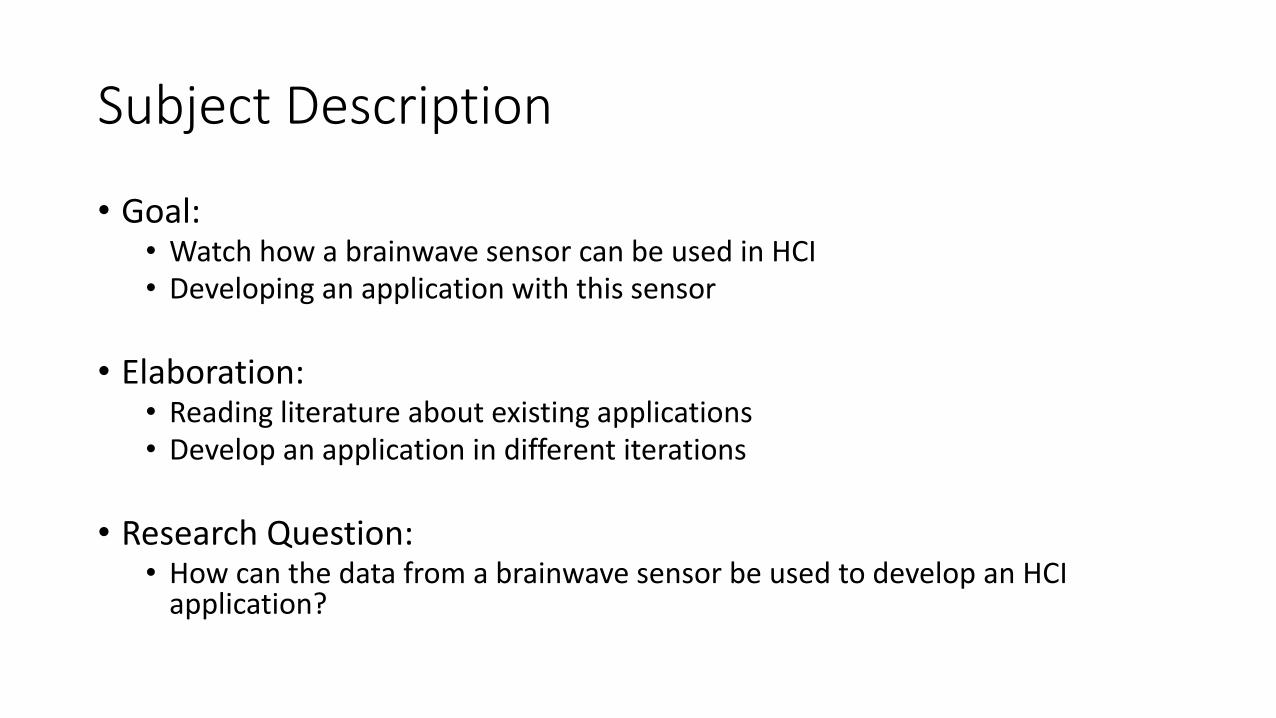
Subject Description
• Goal:• Watch how a brainwave sensor can be used in HCI• Developing an application with this sensor
• Elaboration:• Reading literature about existing applications• Develop an application in different iterations
• Research Question:• How can the data from a brainwave sensor be used to develop an HCI
application?
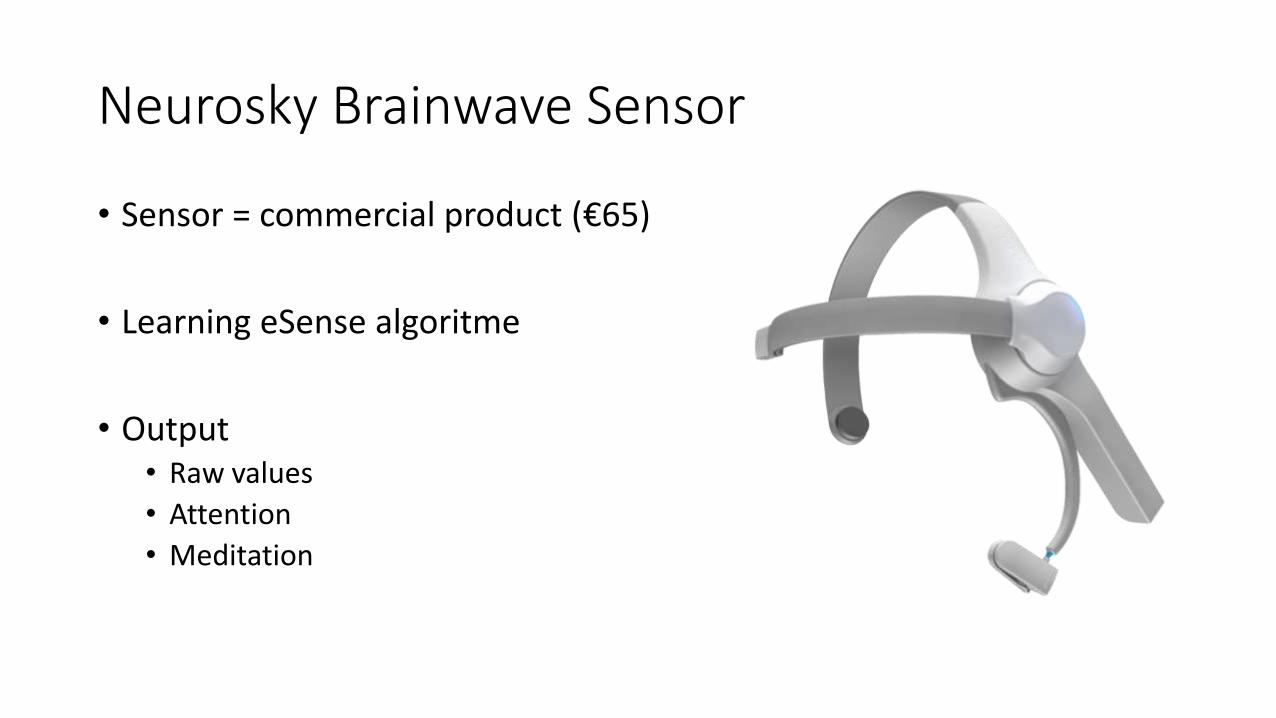
Neurosky Brainwave Sensor
• Sensor = commercial product (€65)
• Learning eSense algoritme
• Output• Raw values
• Attention
• Meditation
Literature
1. Overview of HCI applications using a brainwave sensor
2. Application using Neurosky Mindwave attention/meditation values
3. Application using Neurosky Mindwave raw values
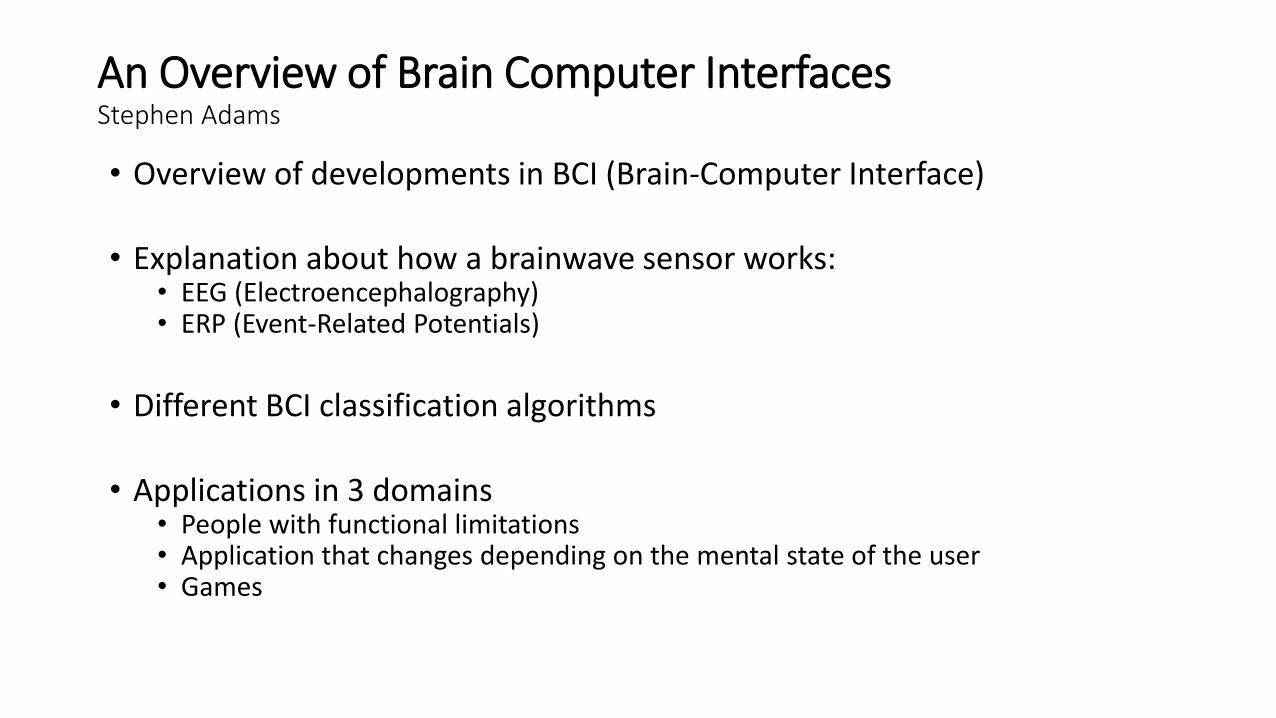
An Overview of Brain Computer Interfaces Stephen Adams
• Overview of developments in BCI (Brain-Computer Interface)
• Explanation about how a brainwave sensor works:• EEG (Electroencephalography) • ERP (Event-Related Potentials)
• Different BCI classification algorithms
• Applications in 3 domains• People with functional limitations• Application that changes depending on the mental state of the user• Games
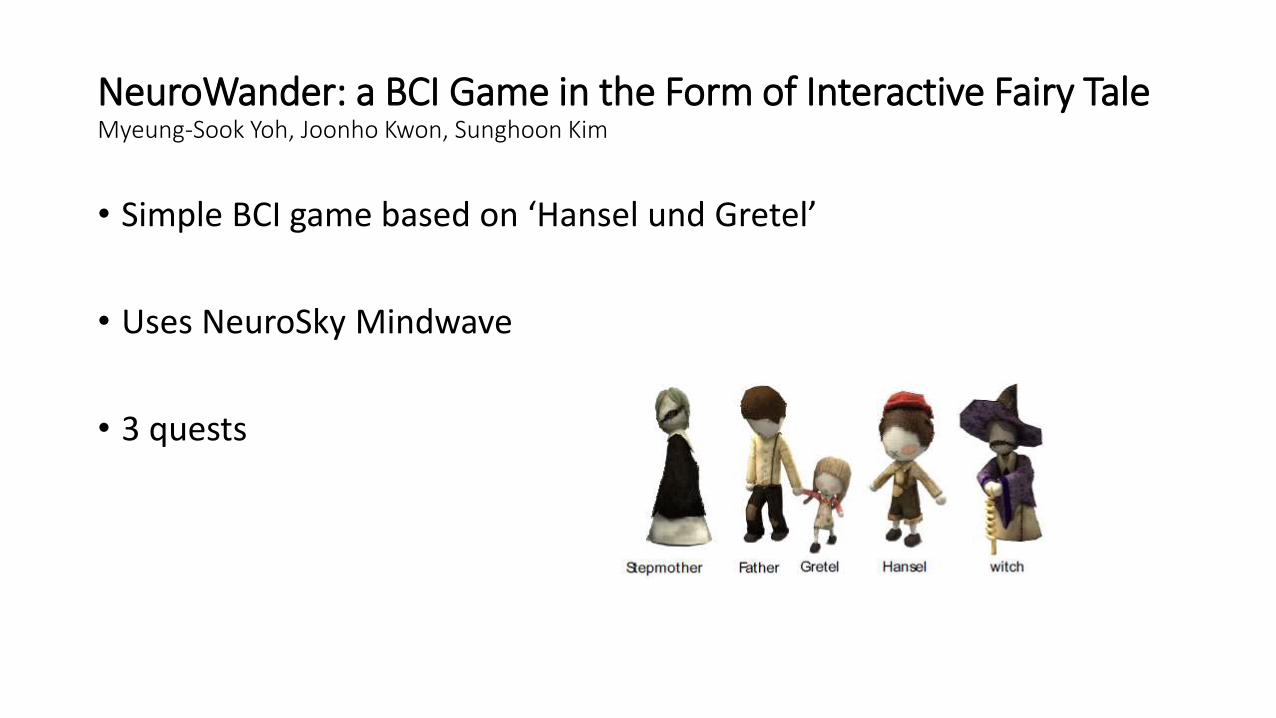
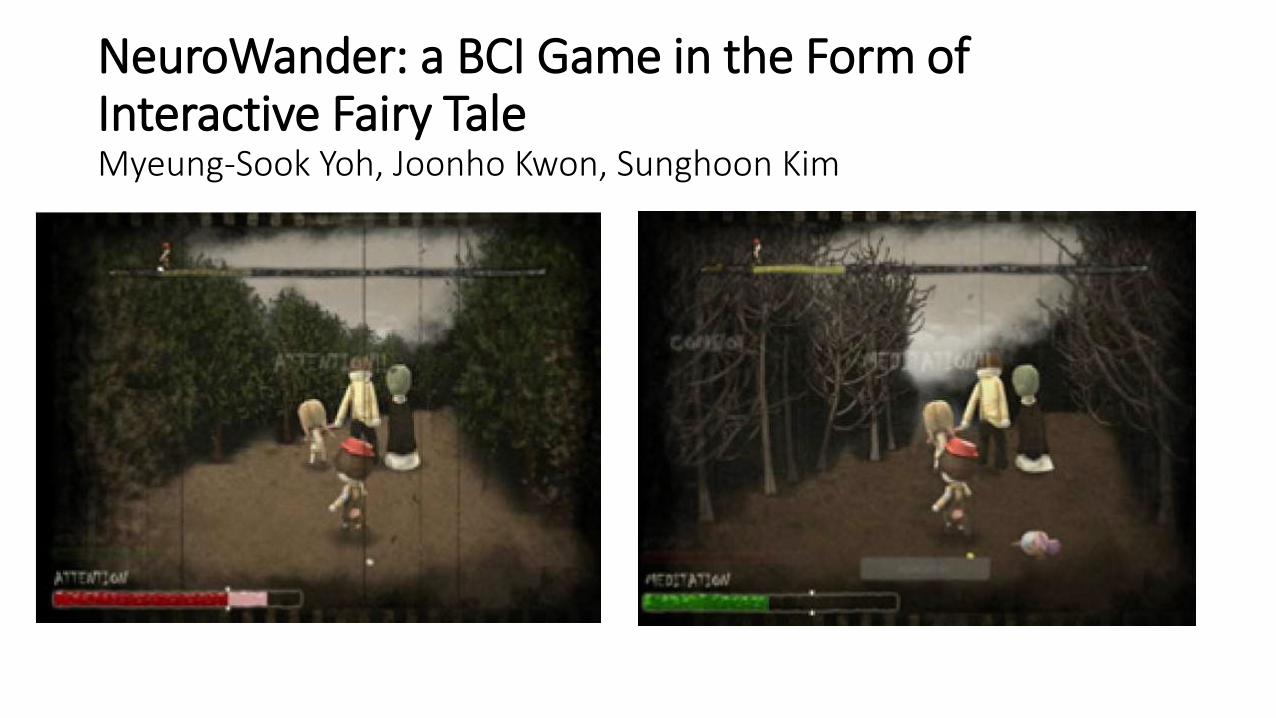
NeuroWander: a BCI Game in the Form of Interactive Fairy TaleMyeung-Sook Yoh, Joonho Kwon, Sunghoon Kim
• Simple BCI game based on ‘Hansel und Gretel’
• Uses NeuroSky Mindwave
• 3 quests
NeuroWander: a BCI Game in the Form of Interactive Fairy TaleMyeung-Sook Yoh, Joonho Kwon, Sunghoon Kim
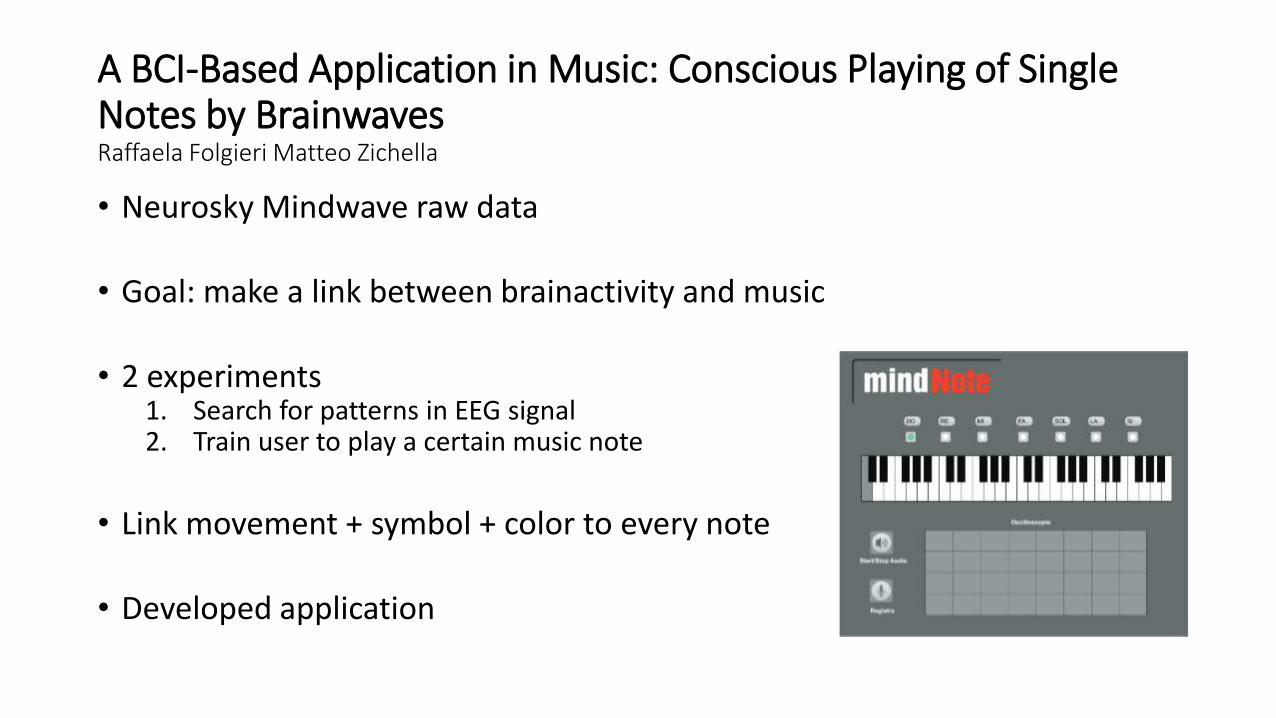
A BCI-Based Application in Music: Conscious Playing of Single Notes by BrainwavesRaffaela Folgieri Matteo Zichella
• Neurosky Mindwave raw data
• Goal: make a link between brainactivity and music
• 2 experiments1. Search for patterns in EEG signal2. Train user to play a certain music note
• Link movement + symbol + color to every note
• Developed application
First application idea + test
• Idea:• People read a text while their concentration is monitored• Warning when concentration gets to low• Adaptive interface• HCI + psychology
• Test• Link output sensor <-> understanding text <-> idea of user about his/her
concentration• Read 2 texts + answer questions• Observation output while reading• 7 subjects
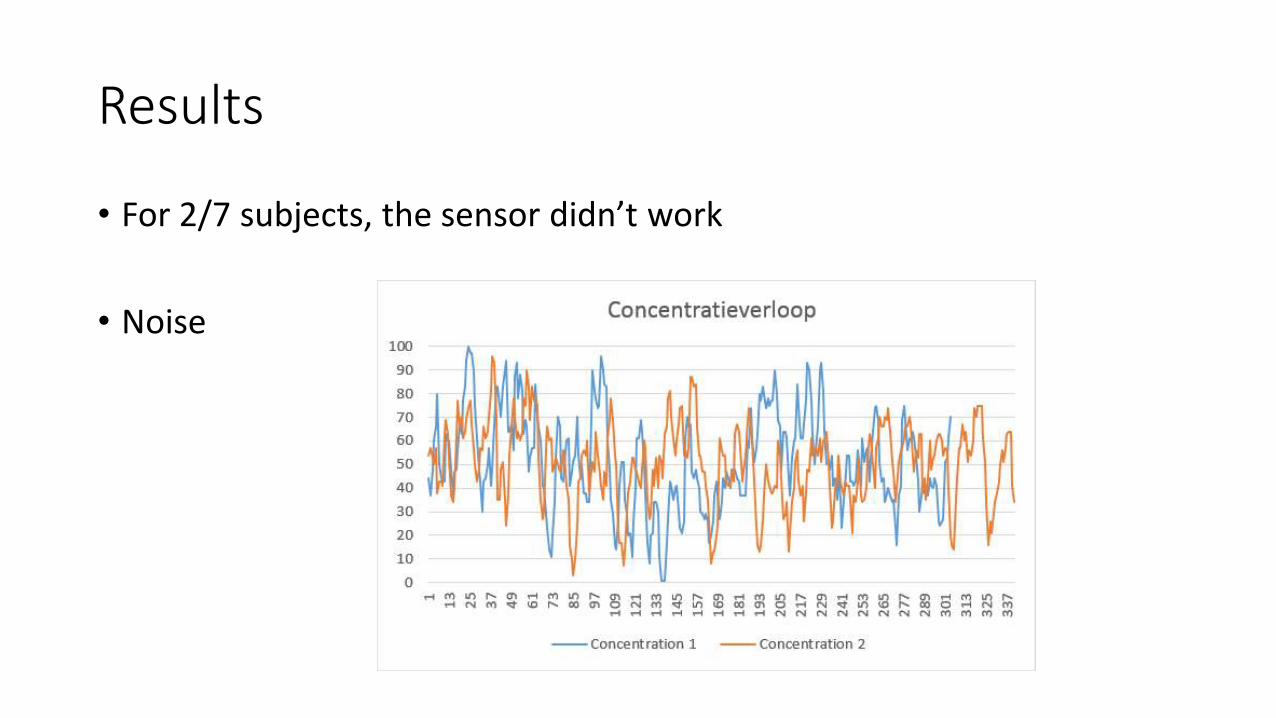
Results
• For 2/7 subjects, the sensor didn’t work
• Noise
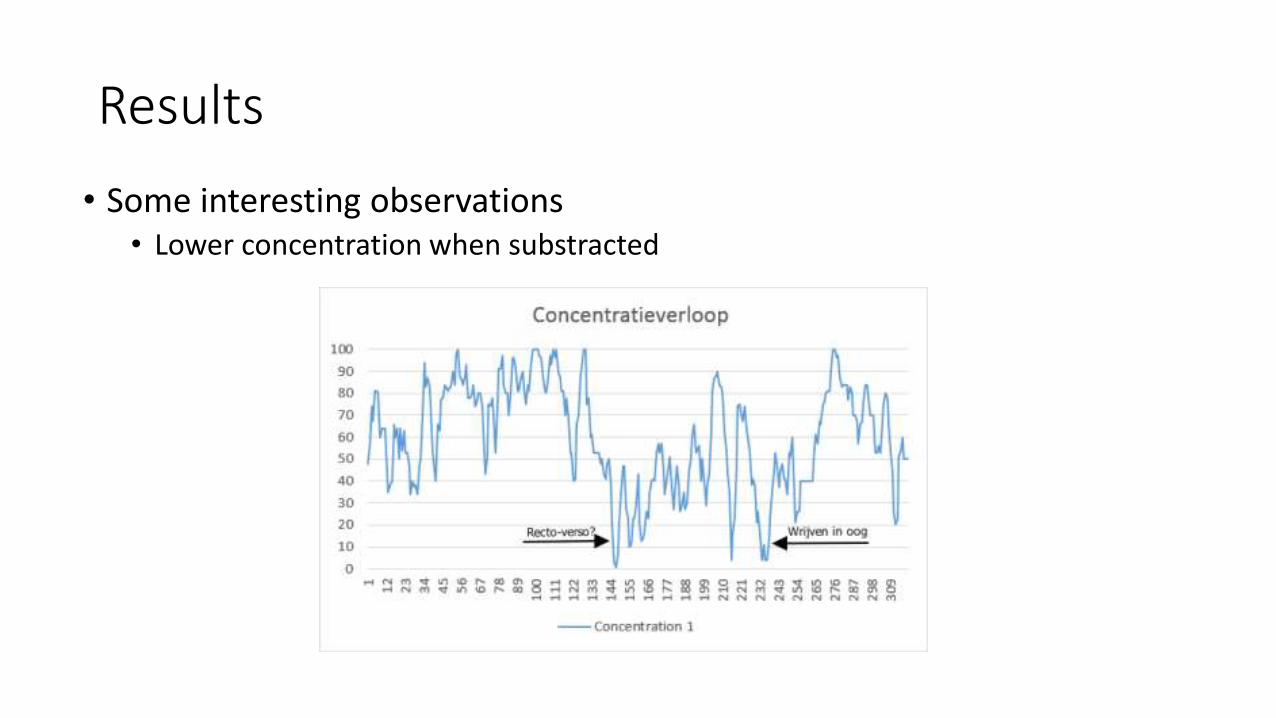
Results
• Some interesting observations• Lower concentration when substracted
Results
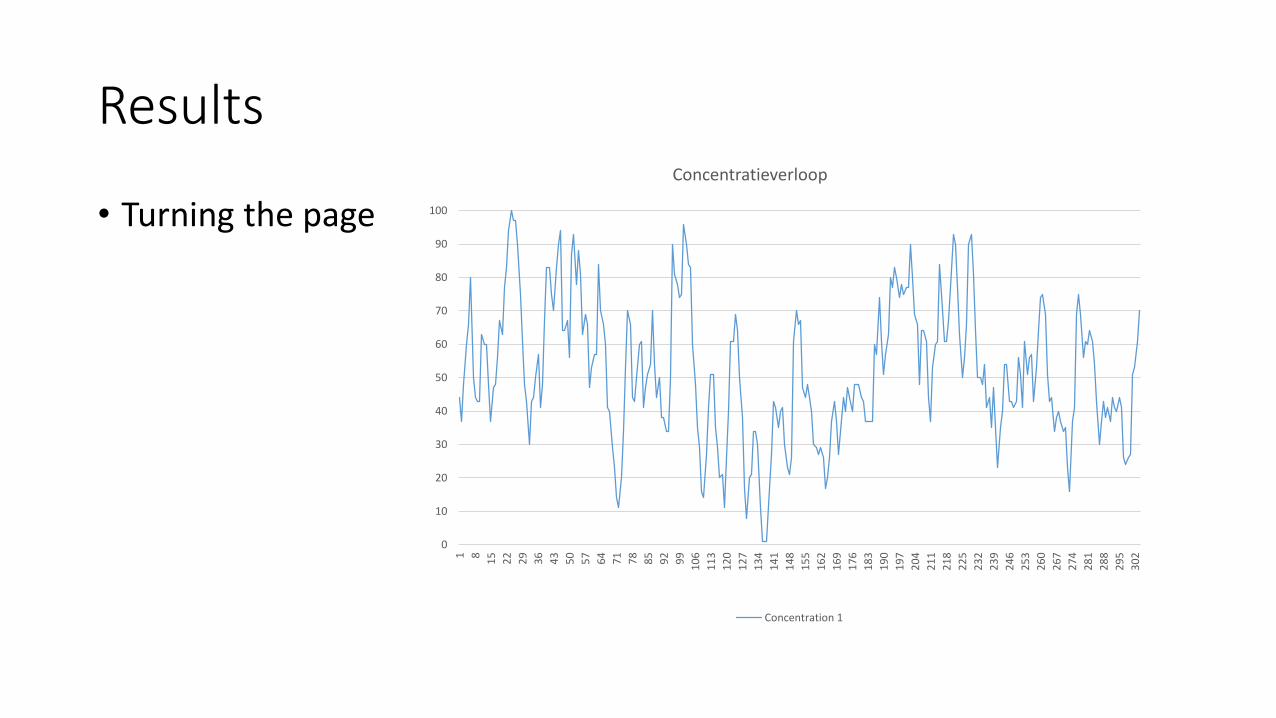
• Turning the page
0
10
20
30
40
50
60
70
80
90
100
1 8
15
22
29
36
43
50
57
64
71
78
85
92
99
10
6
11
3
12
0
12
7
13
4
14
1
14
8
15
5
16
2
16
9
17
6
18
3
19
0
19
7
20
4
21
1
21
8
22
5
23
2
23
9
24
6
25
3
26
0
26
7
27
4
28
1
28
8
29
5
30
2
Concentratieverloop
Concentration 1
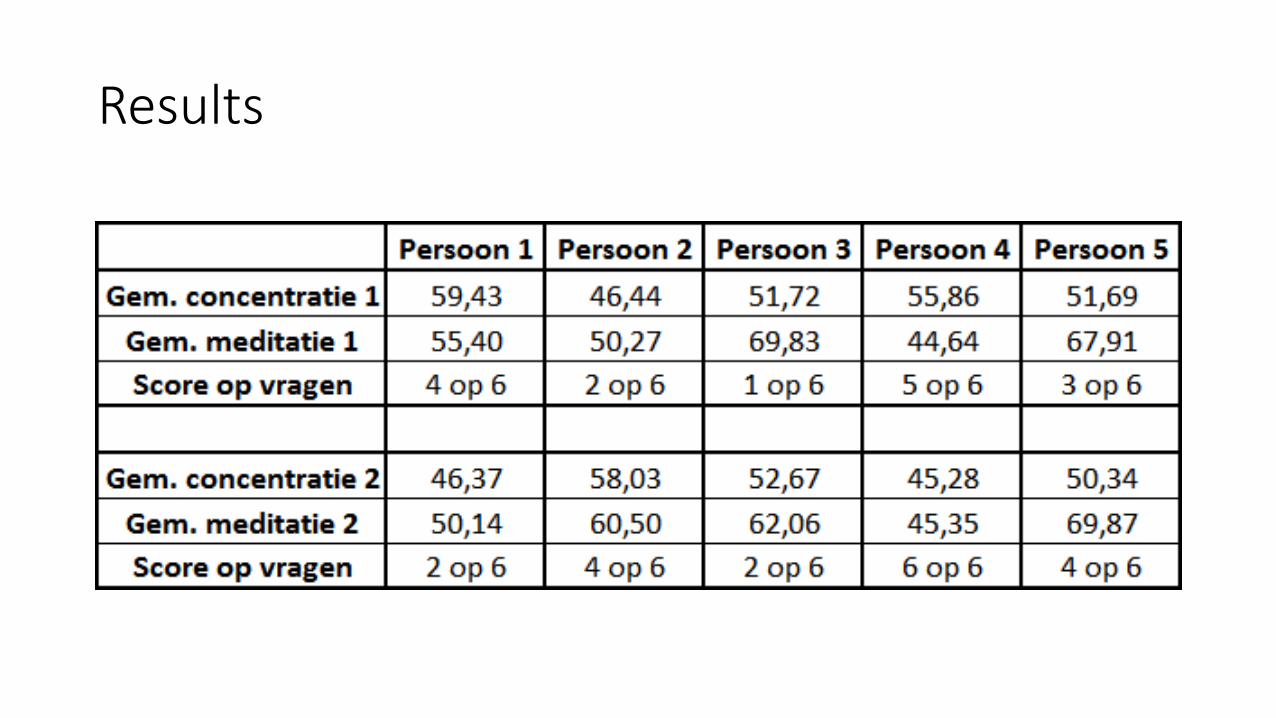
Results
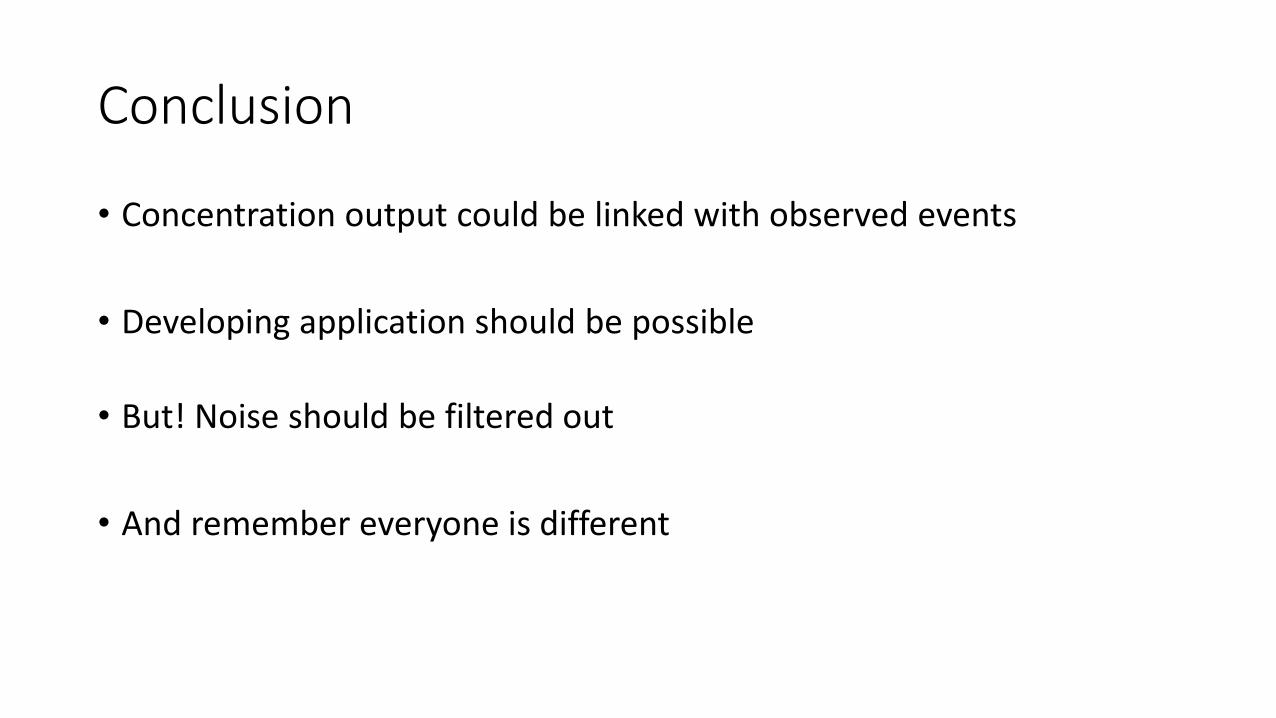
Conclusion
• Concentration output could be linked with observed events
• Developing application should be possible
• But! Noise should be filtered out
• And remember everyone is different
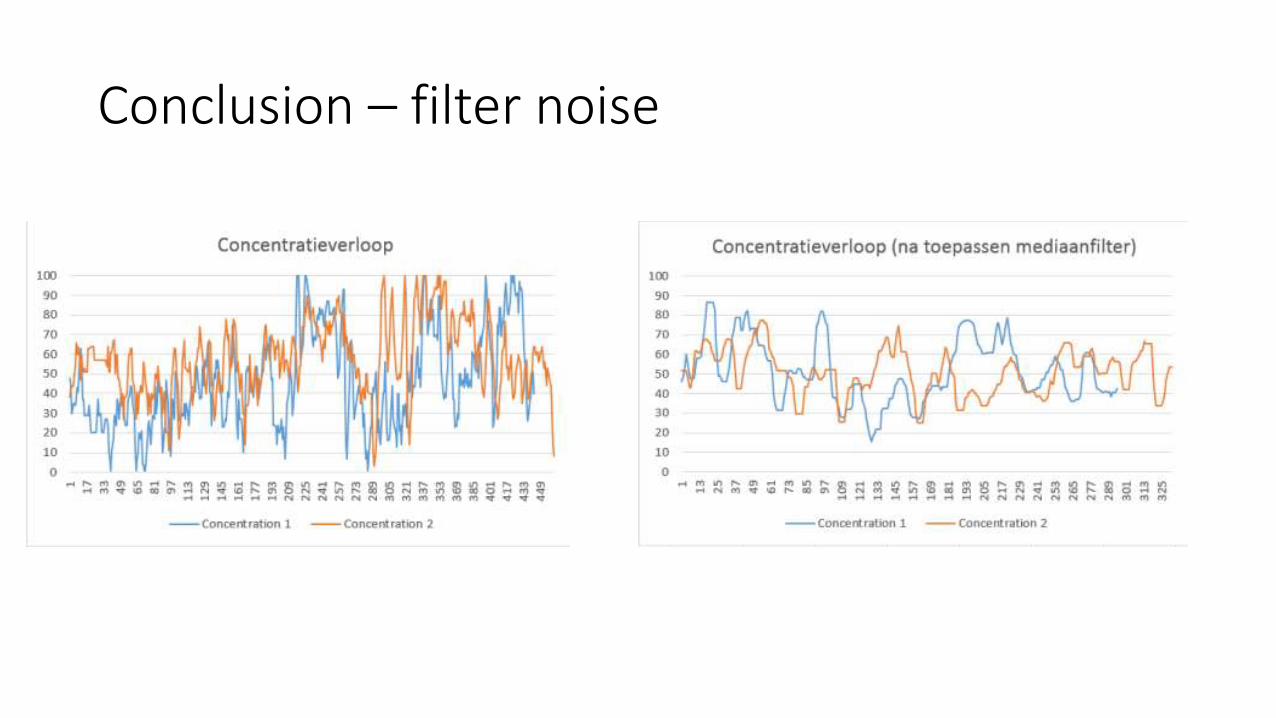
Conclusion – filter noise
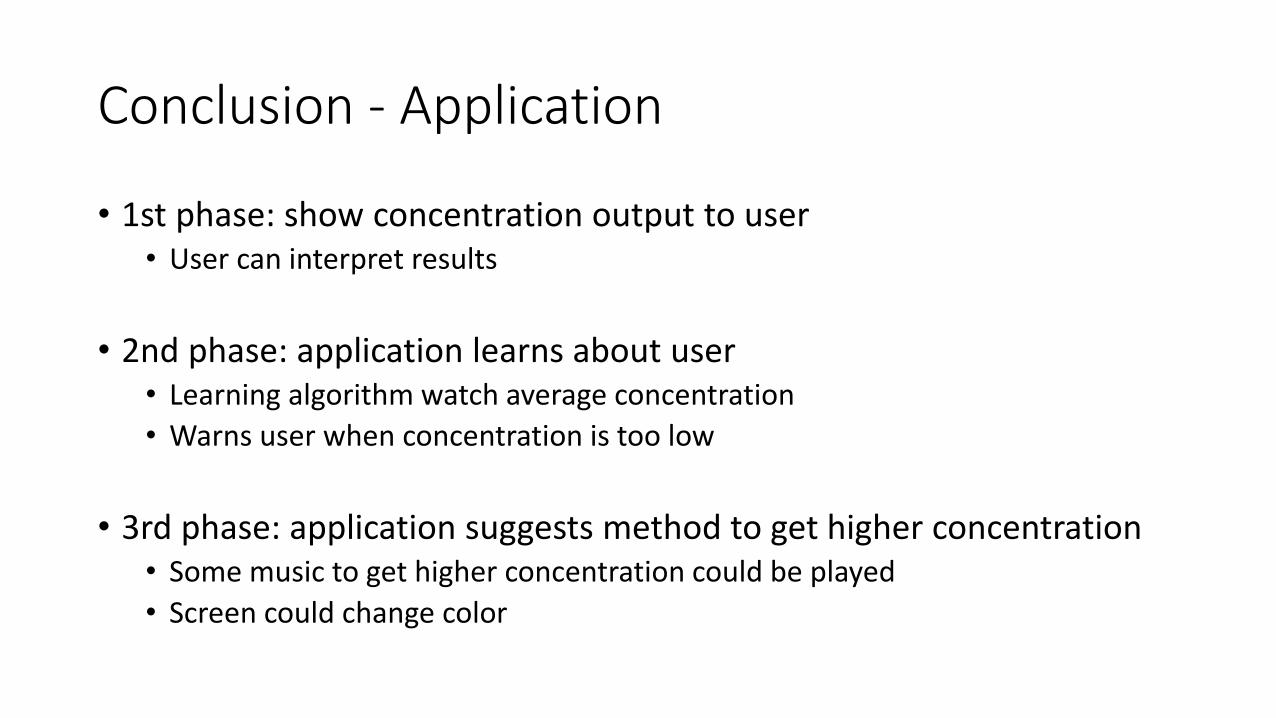
Conclusion - Application
• 1st phase: show concentration output to user• User can interpret results
• 2nd phase: application learns about user• Learning algorithm watch average concentration
• Warns user when concentration is too low
• 3rd phase: application suggests method to get higher concentration• Some music to get higher concentration could be played
• Screen could change color
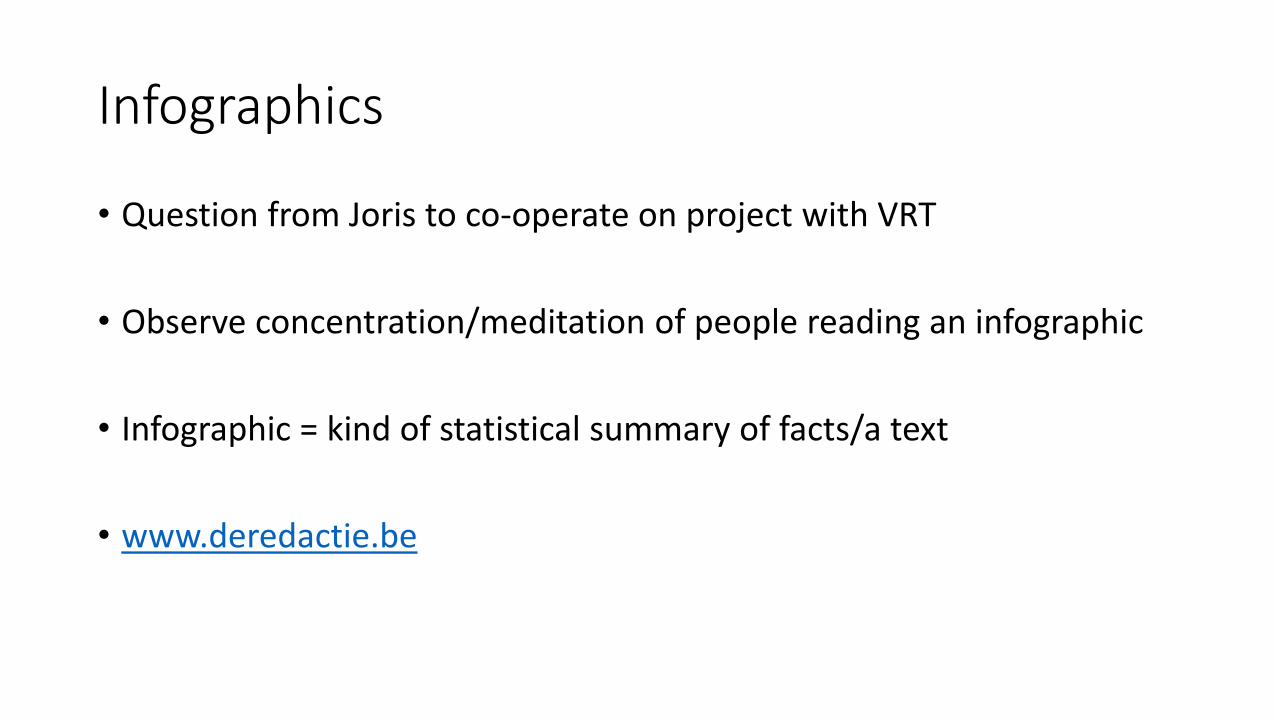
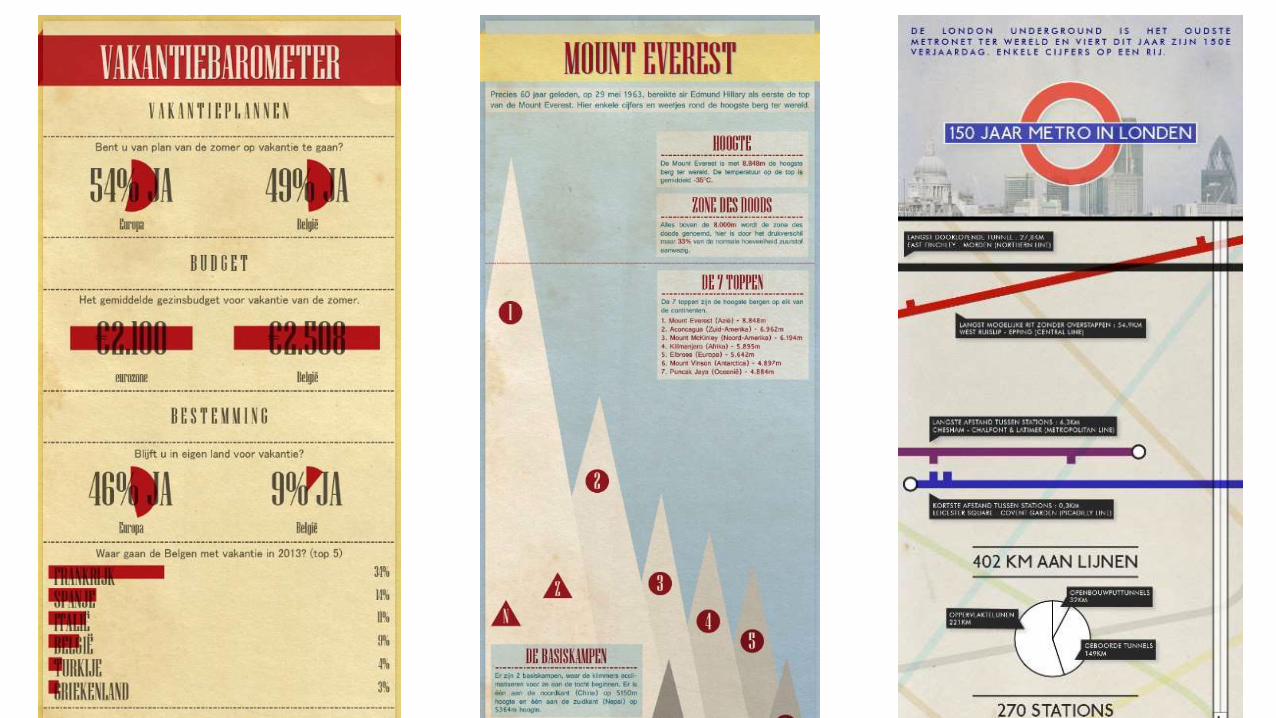
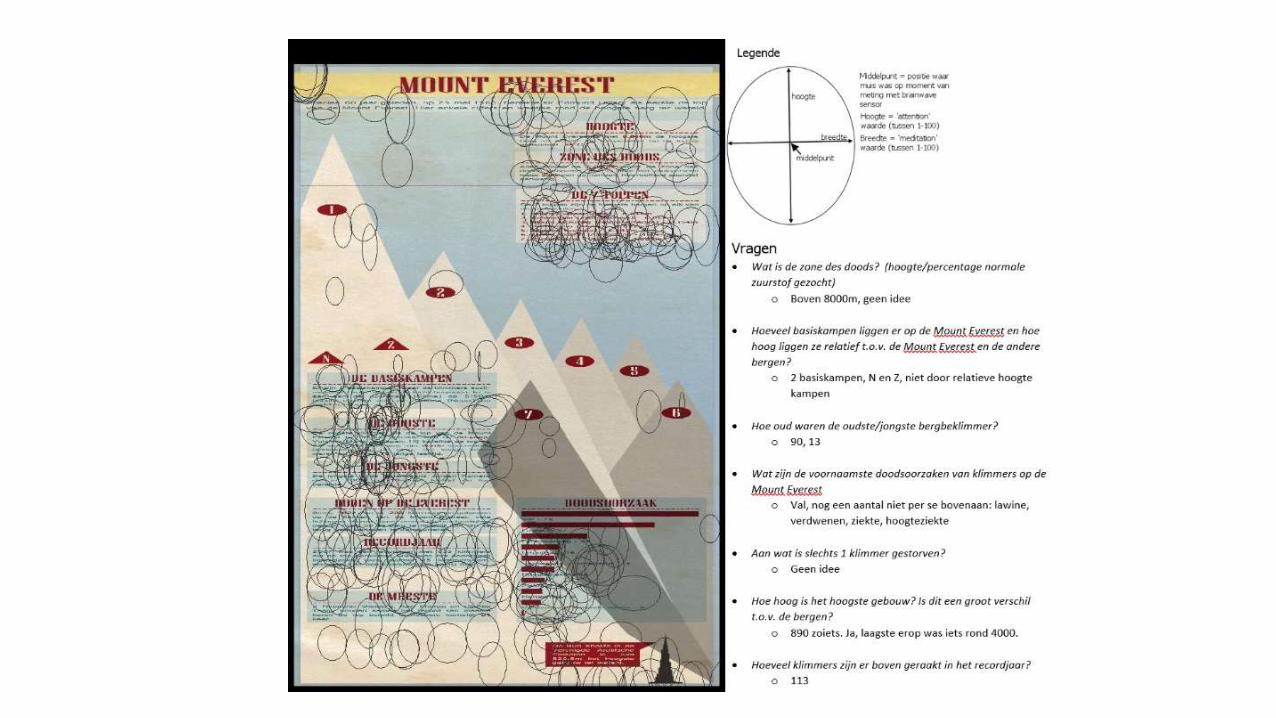
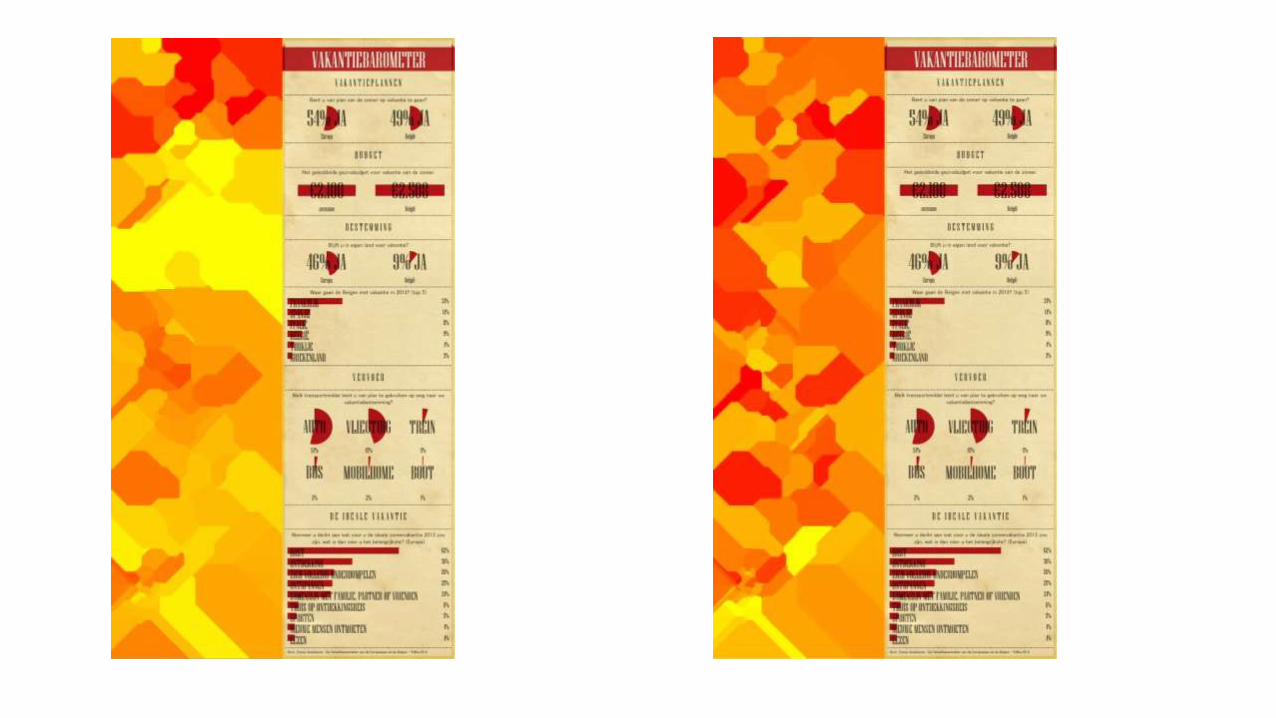
Infographics
• Question from Joris to co-operate on project with VRT
• Observe concentration/meditation of people reading an infographic
• Infographic = kind of statistical summary of facts/a text
• www.deredactie.be
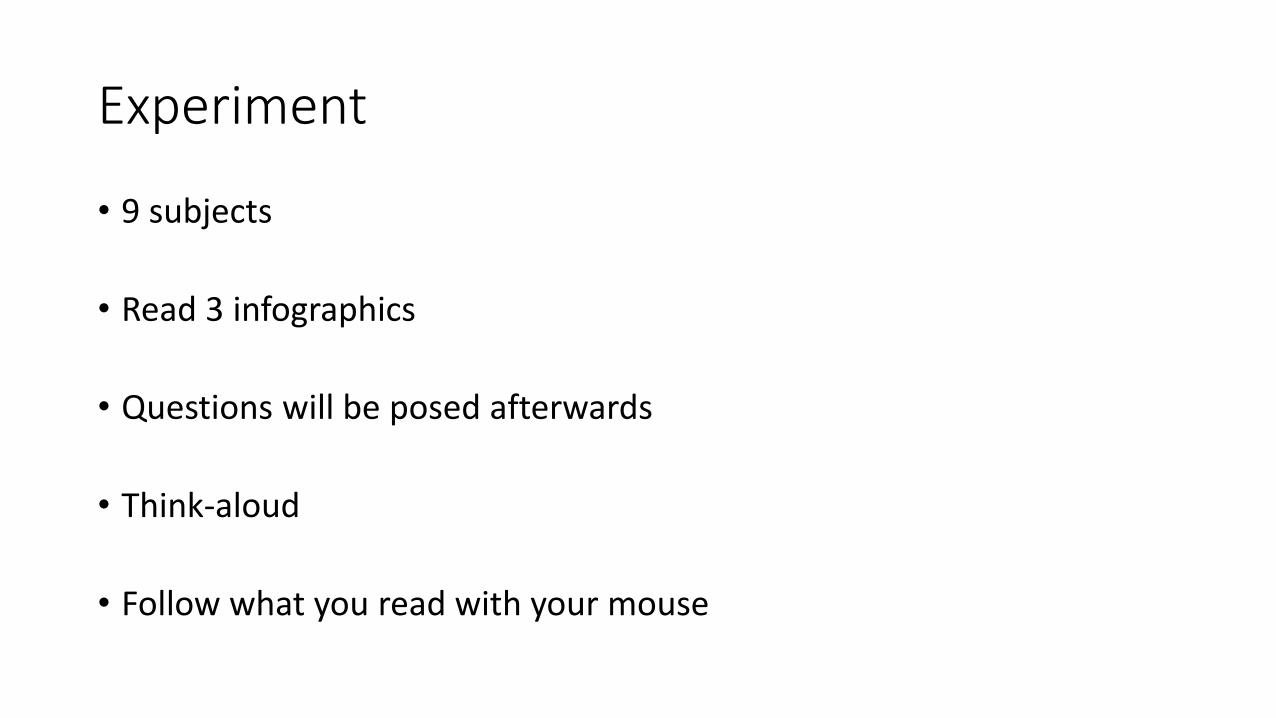
Experiment
• 9 subjects
• Read 3 infographics
• Questions will be posed afterwards
• Think-aloud
• Follow what you read with your mouse
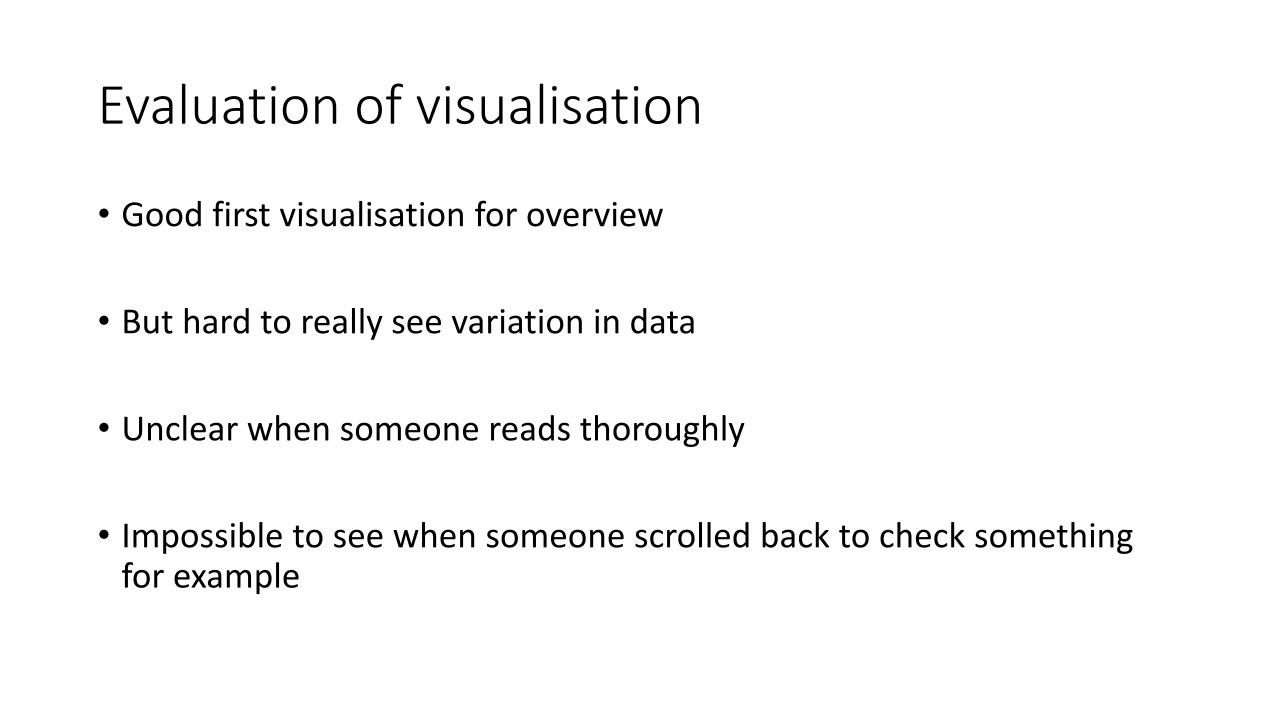
Evaluation of visualisation
• Good first visualisation for overview
• But hard to really see variation in data
• Unclear when someone reads thoroughly
• Impossible to see when someone scrolled back to check somethingfor example
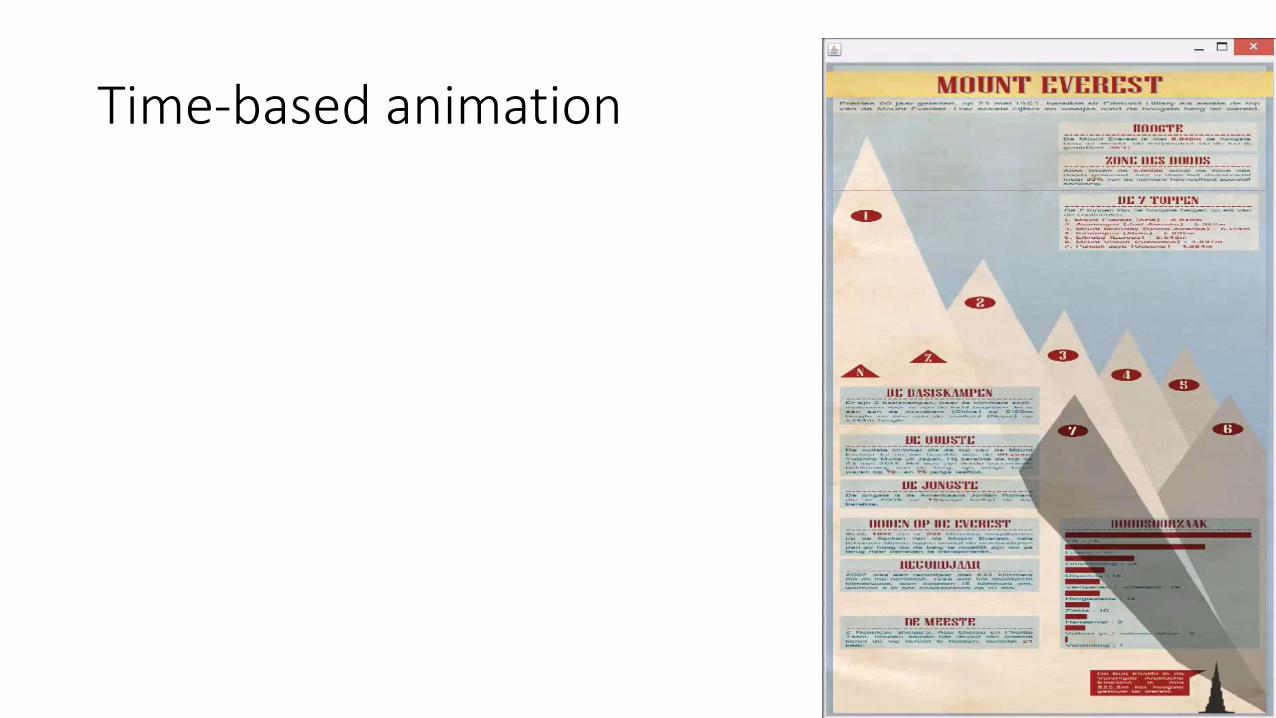
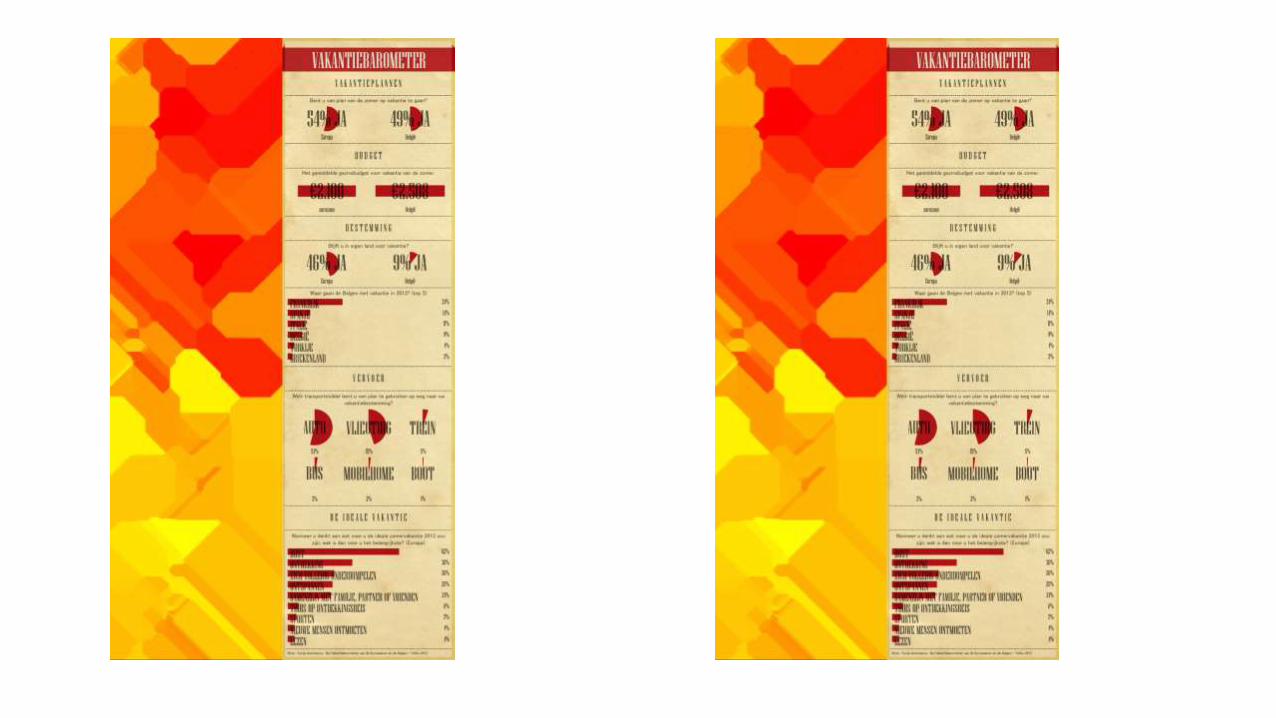
Time-based animation
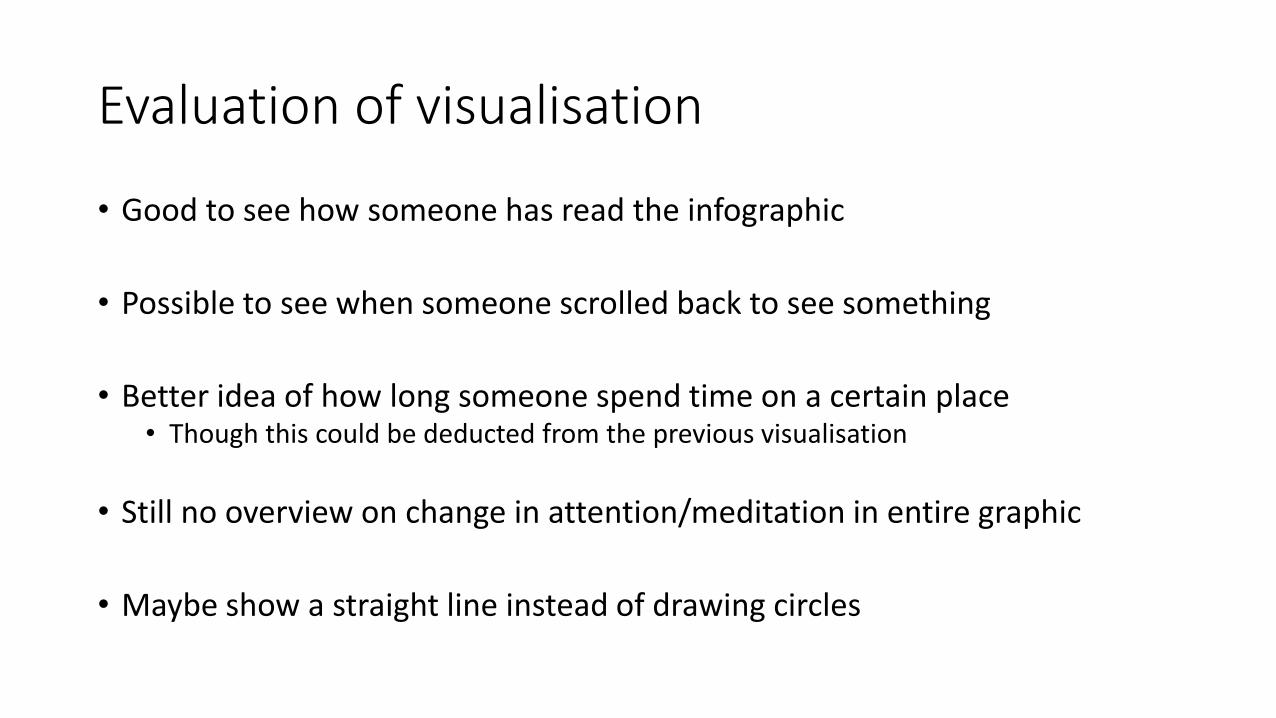
Evaluation of visualisation
• Good to see how someone has read the infographic
• Possible to see when someone scrolled back to see something
• Better idea of how long someone spend time on a certain place• Though this could be deducted from the previous visualisation
• Still no overview on change in attention/meditation in entire graphic
• Maybe show a straight line instead of drawing circles
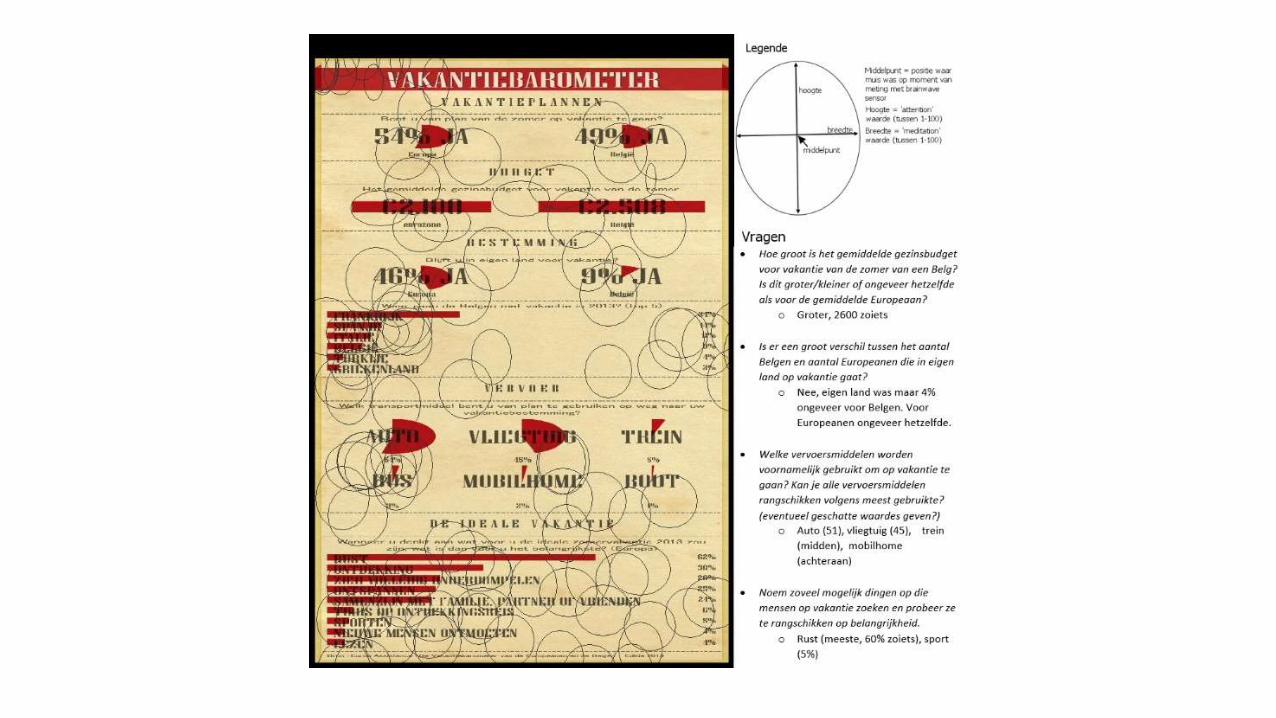
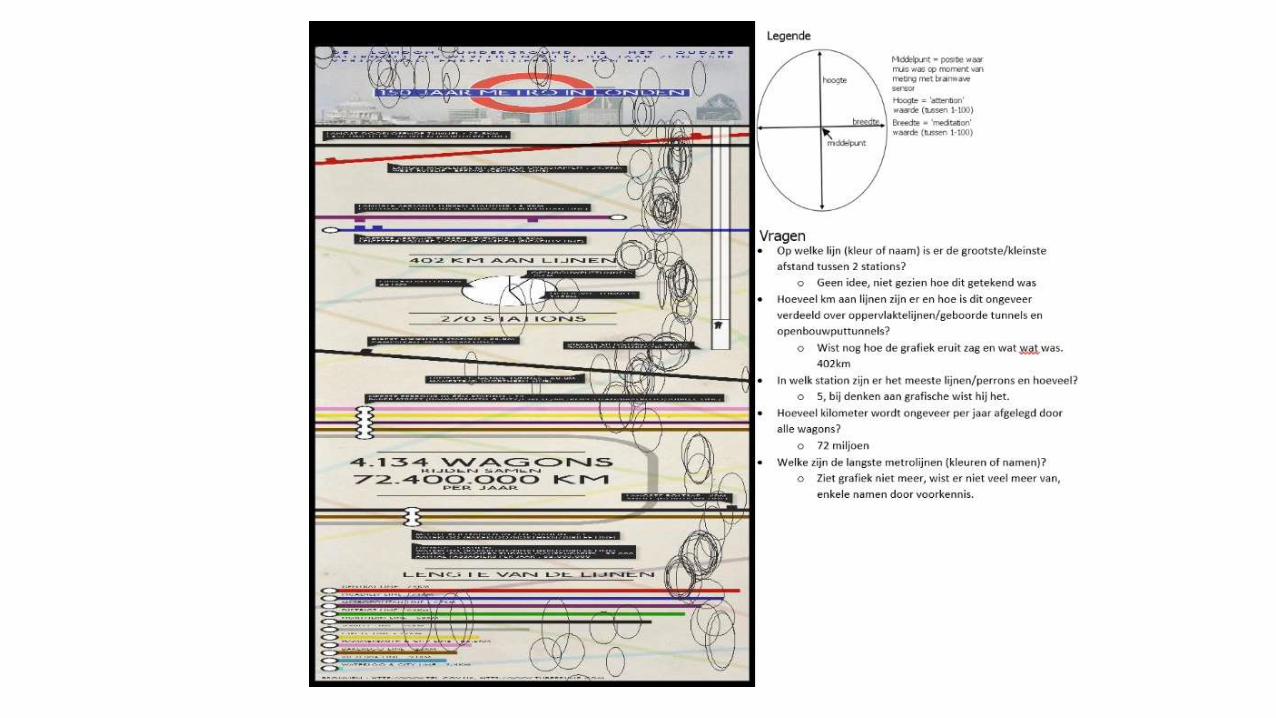
Evaluation of visualisation
• Good to see change in attention/meditation
• Presentation seems more clear when taking closest measured value
• Easier to link concentration/meditation to the infographic and to the questions
• An overlay might even be more useful
What’s next?
• Normally a paper prototype and digital prototype would bedeveloped after the first test
• My planning changed because of the tests with the infographic• No digital prototype for now
• Partially new application idea• This will be developed/evaluated in the next weeks
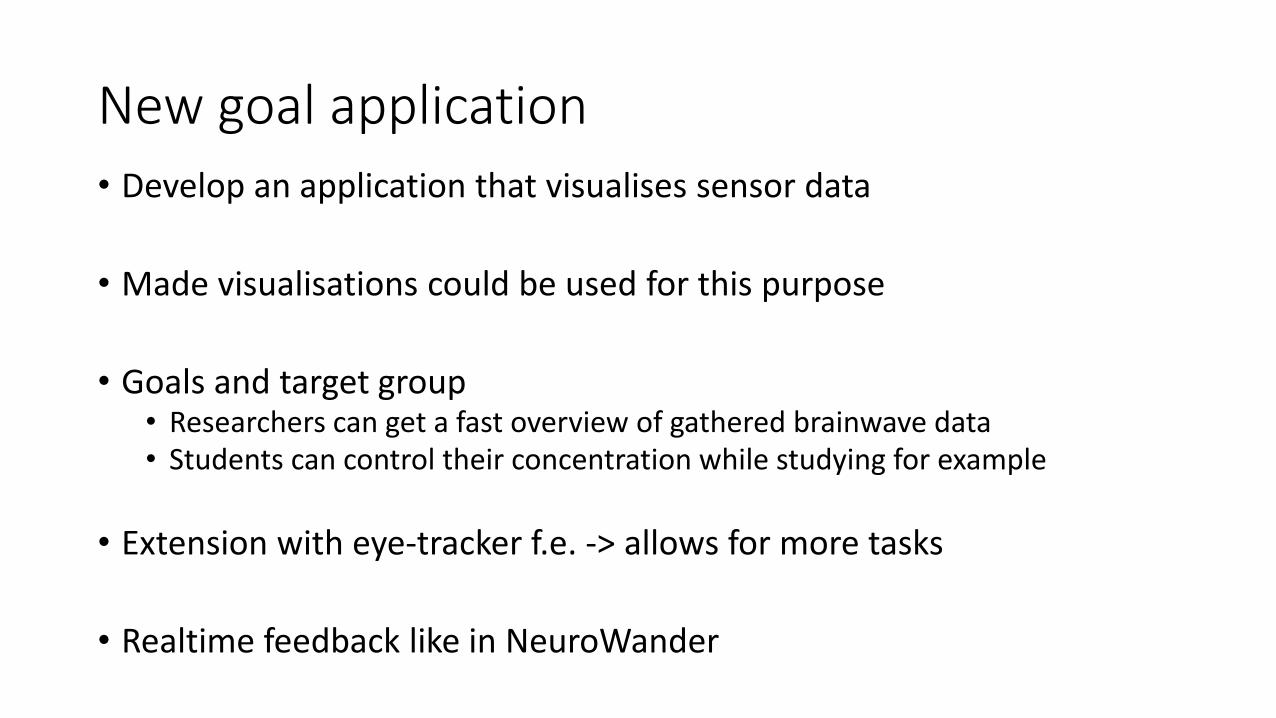
New goal application
• Develop an application that visualises sensor data
• Made visualisations could be used for this purpose
• Goals and target group• Researchers can get a fast overview of gathered brainwave data• Students can control their concentration while studying for example
• Extension with eye-tracker f.e. -> allows for more tasks
• Realtime feedback like in NeuroWander
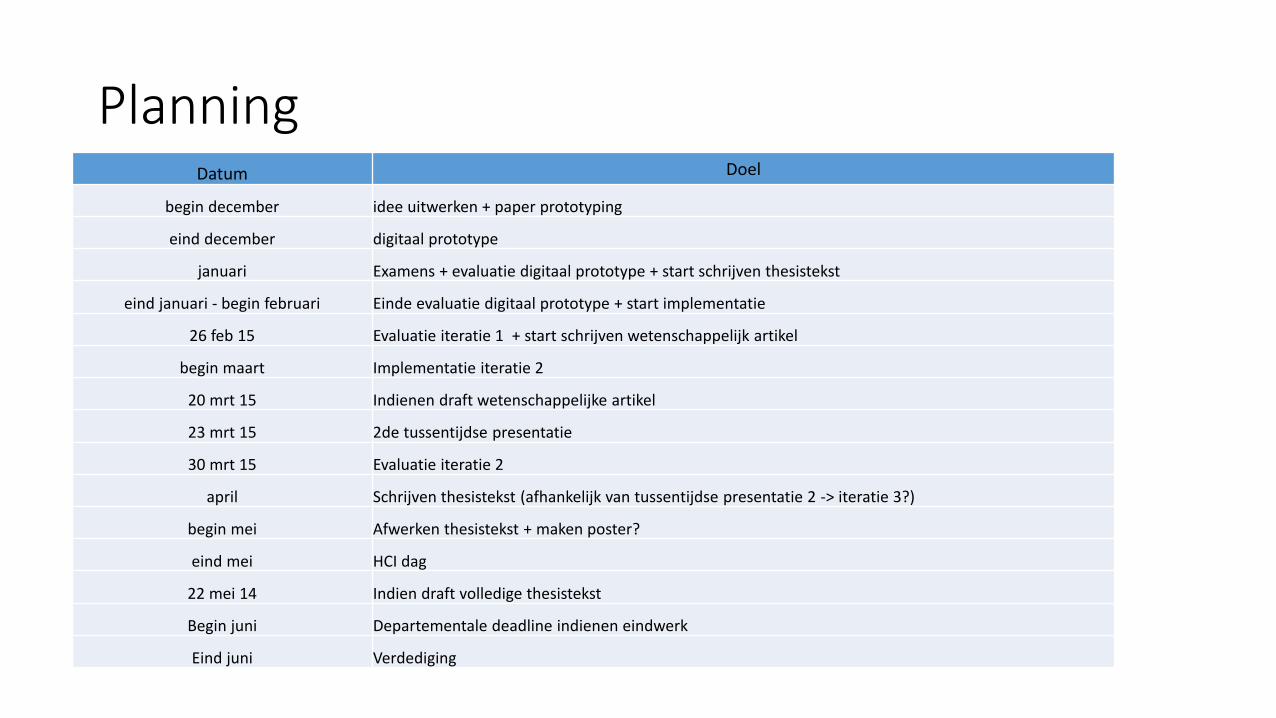
PlanningDatum Doel
begin december idee uitwerken + paper prototyping
eind december digitaal prototype
januari Examens + evaluatie digitaal prototype + start schrijven thesistekst
eind januari - begin februari Einde evaluatie digitaal prototype + start implementatie
26 feb 15 Evaluatie iteratie 1 + start schrijven wetenschappelijk artikel
begin maart Implementatie iteratie 2
20 mrt 15 Indienen draft wetenschappelijke artikel
23 mrt 15 2de tussentijdse presentatie
30 mrt 15 Evaluatie iteratie 2
april Schrijven thesistekst (afhankelijk van tussentijdse presentatie 2 -> iteratie 3?)
begin mei Afwerken thesistekst + maken poster?
eind mei HCI dag
22 mei 14 Indien draft volledige thesistekst
Begin juni Departementale deadline indienen eindwerk
Eind juni Verdediging
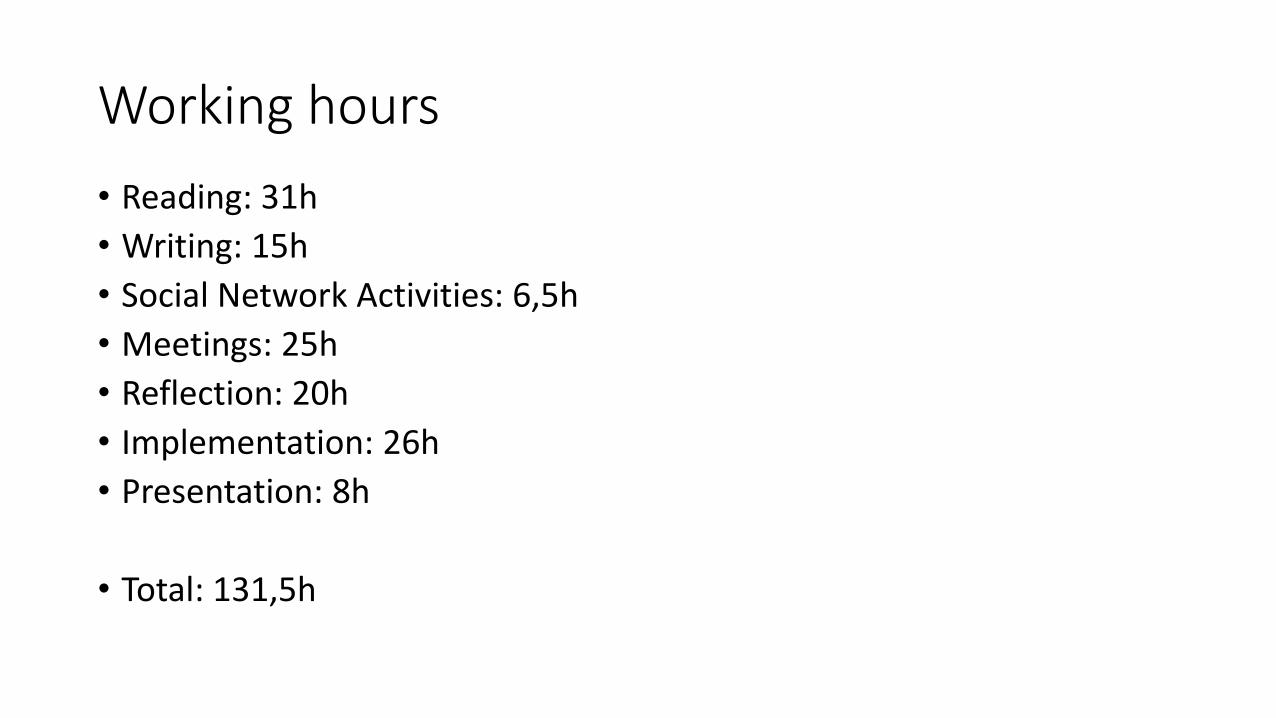
Working hours
• Reading: 31h
• Writing: 15h
• Social Network Activities: 6,5h
• Meetings: 25h
• Reflection: 20h
• Implementation: 26h
• Presentation: 8h
• Total: 131,5h
Questions?