Census Tracts Geographic Products Branch U.S. Census Bureau.

U.S.Department of Housing and Urban DevelopmentOffice of Policy Development and Research
U.S.Department of CommerceEconomics and Statistics Administration
U.S. CENSUS BUREAU
These Old Houses: 2001 Issued February 2004
H121/04−1
CurrentHousingReports
byBarbara T. Williams
U S C E N S U S B U R E A UHelping You Make Informed Decisions

2 U.S. Census Bureau
INTRODUCTION
Although the United States is morethan 200 years old, its housinginventory is young. In 2001, just8.3 percent of all American hous−ing was built before 1920.1 Thisreport examines housing unitsbuilt 82 years or more ago (whichare referred to as old units), andcompares their characteristics withthose of units built after 1989(which are referred to as newunits). The data are from the 2001American Housing Survey (AHS),National Sample.2
Old housing is important for sever−al reasons. Despite its small pro−portion of the total housing stock,old homes account for about 10 million housing units and werethe primary residence of 8.6 mil−lion households. Because of theirage, these units may present par−ticular problems in housing qualityand safety, but they may also haveunique characteristics (aside fromany historical significance) thatcould make them desirable homes.Finally, given that the median priceof new single−family homes sold in2001 was $175,200, these oldhouses may provide more afford−able opportunities for homeowner−ship.3
This report is organized in threesections. The first introduces thebasic statistics on the age of thenation’s housing stock. The
second section compares the char−acteristics of old units with thoseof recently constructed homes,helps identify what is uniqueabout old housing, and showssome information about the occu−pants of both old and new units.The third section deals with lossesof old units from the housing
inventory, and examines the rea−sons for and rates of losses of resi−dences built before 1920. In addi−tion, detailed tables with the char−acteristics of total, old, and newunits can be found at www.census.gov/prod/2004pubs/h121−04−1.pdf.
1The estimates in this report are based onresponses from a sample of the population. Aswith all surveys, estimates may vary from theactual values because of sampling variation orother factors. All comparisons made in thisreport have undergone statistical testing andare significant at the 90−percent confidencelevel unless otherwise noted.
2The population represented (the populationuniverse) is the occupied and vacant noninstitu−tional housing stock of the United States. Unitsthat are in noninstitutional group quarters (suchas college dormitories) are also excluded.
3U.S. Census Bureau, “Median and AverageSales Prices of Houses Sold in United States,”New Residential Sales, October 25, 2002,www.census.gov/const/www/newressalesindex.html (May 14, 2003).
Figure 1.
Year Built for All Housing Units by Region: 2001
Details may not sum to totals because of rounding.Source: U.S. Census Bureau, 2001 American Housing Survey, National sample.
1.7
4.0
9.0
4.4
2.0
2.7
7.9
4.0
2.9
5.0
9.8
5.82.8 3.7 5.8
3.6
3.03.5
4.3
3.0
1.9
2.0
2.7
1.7
1.8
1.8
1.8
1.2
2.01.7
1.00.8
4.3 3.4
1.4 0.8
WestSouthMidwestNortheast
(In millions) 1990-2001
1970s
1960s
1950s
1940s
1930s
1920s
Before 1920
1980s
43.6
25.5
27.7
22.3

U.S. Census Bureau 3
SETTING THE STAGE
The Northeast had the smallestsupply of housing in 2001—18.8 percent of the nation’s total.Within the Northeast, 19.1 percentof housing was old, while 7.8 per−cent was built in 1990 or later.The Midwest ranked second intotal housing—23.3 percent. Italso contained a relatively highproportion of old units in its stock(12.1 percent) and a low propor−tion of new (14.5 percent). Thelargest region was the South (36.6 percent). There, just 3.2 per−cent of housing was old, and 20.7 percent was new. For theWest, the figures were 21.4 per−cent of the nation’s supply, with3.2 percent of that being old and17.5 percent new.
In 2001, the Northeast was hometo 43.4 percent of the nation’sstock of about 10 million oldhomes. The Midwest accountedfor about one−third of the total(34.2 percent), and the South (14.2 percent) and West (8.3 per−cent) trailed with the remainder.The Northeast’s preeminence prob−ably reflects its earlier period ofsettlement.
The large majority (78.1 percent)of American housing was insidemetropolitan areas.4 However, asFigure 2 reveals, homes builtbefore 1920 were more likely to beoutside metropolitan areas thanmore recently constructed homes.Starting in the 1960s, half or moreof American residences were builtin the suburbs. Just 30.8 percentof the old units are in suburbanareas.
CHARACTERISTICS OF OLDAND OF NEW HOUSING
This section compares the charac−teristics of housing units builtbefore 1920 (old units) with thoseof units built 1990 or later (newunits).5 Units built in the yearsbetween 1920 and 1989 areexcluded from this analysis, so aclearer picture of the differencesthat now exist between old andnew units may emerge.
Structure TypeMost old and new housing unitsare “1, detached” units, that is,site−built, modular or prefabricatedfreestanding houses (Figure 3).This sort of construction is morecommon among old units (63.0 per−cent) than new (57.9 percent).However, new homes are moreoften single−family residences(83.2 percent) than old homes
(69.9 percent). Besides the 1,detached structures, single−familyresidences include 1, attachedunits (townhouses) and manufac−tured housing units (mobile homes).This large proportion of newlybuilt single−family homes is partlydue to the introduction of manu−factured housing as a type ofhome construction after 1920.6
Manufactured homes, which arealmost entirely single−family units,
4 See www.census.gov/hhes/www/ahs.htmlthe definition of metropolitan areas as well asfor other terms used in this report.
5“Survivor” bias affects the current distribu−tion of the characteristics of old units. Oldbuildings that are still in existence may havebeen retained because they were better insome way−−size, location, quality−− than theircontemporaries. Thus, the distribution of char−acteristics of old homes in 2001 is likely to bedifferent from what it would have been at thetime the units were originally built.
Structure types include:
• 1, detached units (site−built, modular, or prefabricat−ed houses)
• 1, attached units (town−houses or rowhouses)
• Manufactured housing(mobile homes)
• Units in multiunit struc−tures (apartments)
Details may not sum to totals because of rounding.Source: U.S. Census Bureau, 2001 American Housing Survey, National sample.
Figure 2.
Metropolitan Status for All Housing Units by Year Built: 2001
Before 1920
1920-1929
1930-1939
1940-1949
1950-1959
1960-1969
1970-1979
1980-1989
1990-2001
(Percent)
39.8
44.3
50.8
38.4
22.1
18.9
24.4
18.4
18.1
21.3
24.9
20.1
30.9
60.2
59.5
50.8
51.0
48.4
38.9
30.8
29.1
30.8
17.7
21.6
24.8
30.7
33.4
Central city
Suburb
Outside metropolitan area
6Manufactured homes with bathrooms werefirst built in the 1940s. Earlier models date tothe 1920s, but were intended to be vacationunits. Manufactured Housing Association ofOklahoma, “History,” Welcome to MHAO, n.d.,www.mhao.org/history.asp (May 21, 2003).

4 U.S. Census Bureau
make up 1 in 6 (16.6 percent) ofthe residences built in 1990 orlater. When manufactured housingis subtracted from new units, theproportion that are single−familyresidences falls to 79.8 percent,still larger than the 69.9 percentamong old units.
Apartment buildings with fewerthan five units are an importantcomponent of old housing. Whilethese units constitute 17.2 percentof old units, they account for only3.6 percent of new construction.The AHS does not reveal whetherthese older structures were builtwith four or fewer apartments,were originally single−family residences that were subsequentlysubdivided, or were rooming houses that had more than fourresidences that were consolidatedover time.
Comparing structure type withgeographic variables shows threemain concentrations of old resi−dential units:
• 1, detached houses outside met−ropolitan areas in the Midwest(about 12 percent of all oldunits)
• Units in multiunit buildings inmetropolitan central cities in the
Northeast (also about 12 per−cent)7
• 1, detached houses in theNortheast suburbs (10.6 percentof the total)
Each of these categories accountsfor at least 1 million units (Table1). The remaining combinationsare variations of region, structuretype, and metropolitan status, withnone making up as much as 10 percent of the total stock of oldunits.
For new units, 1, detached housesin the suburbs of the South is thelargest category with 17.3 percent(3.3 million units) built in 1990 orlater; no other grouping accountsfor at least 10 percent of the newhomes.
Unit SizeGenerally, old houses are some−what smaller than new houses, butold houses do tend to be largerthan new, manufactured homes(Table 2). Attached units andapartments in multiunit structuresalso are more likely to be smallerin old structures than new.However, the square footage fig−ures do not tell the whole story.
The number of rooms offers moreinformation on the space availablein old and new homes.8
About 77 percent of all single−family, detached units (old, newconventional, and new manufac−tured housing) in 2001 have fiveto eight rooms. While 22.2 per−cent of new manufactured houseshave four or fewer rooms, only11.2 percent of old units and just5.5 percent of new conventional,detached units fall into this sizecategory. Larger homes with nineor more rooms account for 16.7 percent of new detachedunits and 11.4 percent of olddetached homes; only 2.1 percentof new manufactured housing areof this size.
Apartments in old and in newmultiunit buildings tend to containthree to five rooms (76.3 percentof the old and 87.9 percent of thenew). But 10.2 percent of oldunits have two or fewer rooms,compared with 2.5 percent of thenew. About 13.5 percent of theold units have six or more rooms,compared with 9.7 percent of thenew. Although apartments in oldbuildings make up only 10.4 per−cent of the country’s entire supplyof multiunit residences, theyaccount for about 20.2 percent ofall one or two room apartments.
Structural Characteristics Old homes have many distinguish−ing structural traits, and theseoften vary by region. Figure 4shows structural features in oldand new single−family, detachedhomes, by region. (Only detachedunits appear in these charts becauseof the small number of other struc−ture types in some regions.)
An immediately noticeable trait ofold houses is their height. In allregions, residences built before
7There is no difference between the percentin this group and in the previous category.
Details may not sum to totals because of rounding.Source: U.S. Census Bureau, 2001 American Housing Survey, National sample.
Figure 3.
Structure Type for Old and New Housing Units: 2001
Built 1990 or later
Built before 1920
1, detached
1, attached
2 to 4
5 or more
Manufactured home
(Percent)
57.9
12.9
16.6
17.2
13.2
3.6
8.7
7.063.0
8The count of rooms excludes bathrooms,laundry or utility rooms, pantries, and unfin−ished rooms.

U.S. Census Bureau 5
Table 1.Old and New Housing Units by Structure Type, Region, and Metropolitan Status: 2001(In thousands. Data based on sample. For information on confidentiality protection, sampling error, nonsampling error, and definitions, seewww.census.gov/hhes/www/ahs.html)
Characteristic
Built before 1920 Built 1990 or later
Total1,
detached1,
attached
Unit inmulitunitstructure Total
1,detached
1,attached
Unit inmultiunitstructure
Manufac−tured
housing
Total . . . . . . . . . . . . . . . . . . . . . 9,827 6,190 683 2,954 19,204 11,118 1,667 3,232 3,187
Northeast . . . . . . . . . . . . . . . . . . . . . 4,264 1,931 470 1,863 1,746 1,083 235 252 176Inside metropolitan statisticalareas . . . . . . . . . . . . . . . . . . . . . . 3,595 1,453 438 1,705 1,495 926 233 228 108In central cities . . . . . . . . . . . . 1,922 407 322 1,193 253 87 57 102 7Suburbs . . . . . . . . . . . . . . . . . . . 1,673 1,046 116 511 1,242 839 176 126 101
Outside metropolitan areas . . . . 669 478 33 158 251 157 2 24 68
Midwest . . . . . . . . . . . . . . . . . . . . . . 3,356 2,591 67 698 4,018 2,391 378 695 553Inside metropolitan statisticalareas . . . . . . . . . . . . . . . . . . . . . . 1,880 1,298 52 531 2,931 1,818 326 520 267In central cities . . . . . . . . . . . . 1,089 595 35 459 675 330 79 220 46Suburbs . . . . . . . . . . . . . . . . . . . 791 702 17 72 2,257 1,488 247 301 221
Outside metropolitan areas . . . . 1,475 1,293 15 167 1,086 573 52 175 286
South . . . . . . . . . . . . . . . . . . . . . . . . 1,396 1,076 119 201 8,997 4,980 636 1,371 2,011Inside metropolitan statisticalareas . . . . . . . . . . . . . . . . . . . . . . 806 519 109 178 6,849 4,027 547 1,230 1,045In central cities . . . . . . . . . . . . 438 215 83 140 1,282 707 109 395 71Suburbs . . . . . . . . . . . . . . . . . . . 368 304 26 38 5,567 3,320 438 835 974
Outside metropolitan areas . . . . 589 557 9 23 2,148 953 89 140 966
West . . . . . . . . . . . . . . . . . . . . . . . . . 811 592 26 193 4,443 2,663 419 914 446Inside metropolitan statisticalareas . . . . . . . . . . . . . . . . . . . . . . 512 327 21 164 3,681 2,254 362 850 215In central cities . . . . . . . . . . . . 321 181 10 130 1,194 640 138 335 81Suburbs . . . . . . . . . . . . . . . . . . . 191 146 11 34 2,487 1,614 224 515 134
Outside metropolitan areas . . . . 298 265 6 28 762 409 57 65 231
Characteristic as Percentof Region
Northeast . . . . . . . . . . .(percent)... 100.0 100.0 100.0 100.0 100.0 100.0 100.0 100.0 100.0Inside metropolitan statisticalareas . . . . . . . . . . . . . . . . . . . . . . 84.3 75.3 93.2 91.5 85.6 85.5 99.2 90.5 61.4In central cities . . . . . . . . . . . . 45.1 21.1 68.5 64.0 14.5 8.0 24.3 40.5 4.0Suburbs . . . . . . . . . . . . . . . . . . . 39.2 54.2 24.7 27.4 71.1 77.5 74.9 50.0 57.4
Outside metropolitan areas . . . . 16.4 24.8 7.0 8.5 14.4 14.5 0.9 9.5 38.6
Midwest. . . . . . . . . . . . .(percent)... 100.0 100.0 100.0 100.0 100.0 100.0 100.0 10.0 100.0Inside metropolitan statisticalareas . . . . . . . . . . . . . . . . . . . . . . 56.0 50.1 77.6 76.1 73.0 76.0 86.2 74.8 48.3In central cities . . . . . . . . . . . . 32.5 23.0 52.2 65.8 16.8 13.8 20.9 31.7 8.3Suburbs . . . . . . . . . . . . . . . . . . . 23.6 27.1 25.4 10.3 56.2 62.2 65.3 43.3 40.0
Outside metropolitan areas . . . . 44.0 49.9 22.4 23.9 27.0 24.0 13.8 25.2 51.7
South . . . . . . . . . . . . . . .(percent)... 100.0 100.0 100.0 100.0 100.0 100.0 100.0 100.0 100.0Inside metropolitan statisticalareas . . . . . . . . . . . . . . . . . . . . . . 57.7 48.2 91.6 88.6 76.1 80.9 86.0 89.7 52.0In central cities . . . . . . . . . . . . 31.4 20.0 69.8 69.7 14.3 14.2 17.1 28.8 3.5Suburbs . . . . . . . . . . . . . . . . . . . 26.4 28.3 21.9 18.9 61.9 66.7 68.9 60.9 48.4
Outside metropolitan areas . . . . 42.2 51.8 7.6 11.4 23.9 19.1 14.0 10.2 48.0
West . . . . . . . . . . . . . . . .(percent)... 100.0 100.0 100.0 100.0 100.0 100.0 100.0 100.0 100.0Inside metropolitan statisticalareas . . . . . . . . . . . . . . . . . . . . . . 63.1 55.2 80.8 85.0 82.9 84.6 86.4 93.0 48.2In central cities . . . . . . . . . . . . 39.6 30.6 38.5 67.4 26.9 24.0 32.9 36.7 18.2Suburbs . . . . . . . . . . . . . . . . . . . 23.6 24.7 42.3 17.6 56.0 60.6 53.5 56.4 30.0
Outside metropolitan areas . . . . 36.7 44.8 23.1 14.5 17.2 15.4 13.6 7.1 51.8
Note: Details may not sum to totals because of rounding.
Source: U.S. Census Bureau, 2001 American Housing Survey, National sample.

6 U.S. Census Bureau
1920 are more likely than newhouses to contain more than twofloors, and in both the Northeastand Midwest, the majority of oldhouses have three or more stories.(This holds true for new houses inthe Northeast.) While a consider−ably smaller fraction of Southernand Western houses have morethan two stories, old homes arestill much more apt to have morestories than those recently constructed.
Garages and carports are other dis−tinguishing traits. Before 1920, private automobiles were theexception, not the rule, so manyold homes had no need of a
shelter for a car when they wereoriginally built.9 By 2001, how−ever, more than half of all oldhomes (except in the South) had agarage or carport. New homesincorporate this feature on a rou−tine basis, ranging from 77.5 per−cent in the Northeast to 90 percentor more in the Midwest and West.
Within all regions, basements(either full or partial) are moreoften found in old houses thanthose built in the 1990s or later.There is also a marked regionalvariation in the presence of base−ments. Homes in the Northeastand Midwest are much more likelythan homes in the South and Westto have basements.
Multiple bathrooms are anotherrecent characteristic. Nationwide,only 28.3 percent of old houseshave two or more full baths, whilein new homes, a minimum of twocomplete baths is common—87.7 percent (Table 3). Nearly half
Table 2.Structure Type by Old and New Housing Units and Unit Size: 2001(Data based on sample. For information on confidentiality protection, sampling error, nonsampling error, and definitions, seewww.census.gov/hhes/www/ahs.html)
Characteristic
1, detached 1, attached Unit in multiunit structure Manufacturedhousing—Built 1990
or laterBuilt before
1920Built 1990
or laterBuilt before
1920Built 1990
or laterBuilt before
1920Built 1990
or later
Total housing units(thousands) . . . . . . . . . . . . 6,190 11,118 683 1,667 2,954 3,232 3,187
Number of Rooms
Percentage distribution . . . . . . . . 100.0 100.0 100.0 100.0 100.0 100.0 100.0
1 . . . . . . . . . . . . . . . . . . . . . . . . . . . 0.1 0.1 0.6 0.2 5.0 0.8 0.12 . . . . . . . . . . . . . . . . . . . . . . . . . . . 0.2 0.1 1.0 0.1 5.2 1.7 0.53 . . . . . . . . . . . . . . . . . . . . . . . . . . . 1.6 0.8 8.8 8.8 28.2 21.6 2.34 . . . . . . . . . . . . . . . . . . . . . . . . . . . 9.4 4.6 19.5 25.5 29.5 41.9 19.35 . . . . . . . . . . . . . . . . . . . . . . . . . . . 19.8 19.2 20.8 31.6 18.6 24.4 42.56 . . . . . . . . . . . . . . . . . . . . . . . . . . . 26.2 24.4 27.5 19.5 10.1 8.6 21.17 . . . . . . . . . . . . . . . . . . . . . . . . . . . 20.1 18.6 11.0 7.7 2.2 0.9 9.58 . . . . . . . . . . . . . . . . . . . . . . . . . . . 11.2 15.5 3.6 3.6 0.5 0.0 2.79 . . . . . . . . . . . . . . . . . . . . . . . . . . . 5.6 8.8 2.3 0.6 0.2 0.0 0.710 or more . . . . . . . . . . . . . . . . . . . 5.8 8.0 4.9 2.3 0.5 0.1 1.4
Square Feet
Units reporting square footage(thousands) . . . . . . . . . . . . . . . . . 5,594 10,486 398 1,456 1,795 2,768 2,884
Percentage distribution1 . . . . . . . . 100.0 100.0 100.0 100.0 100.0 100.0 100.0
Less than 500 . . . . . . . . . . . . . . . . 1.2 0.3 16.1 2.4 21.9 3.9 3.9500 to 749 . . . . . . . . . . . . . . . . . . . 3.2 0.8 12.4 6.5 27.9 14.9 4.0750 to 999 . . . . . . . . . . . . . . . . . . . 5.8 1.6 16.8 13.2 17.1 30.6 18.51000 to 1499 . . . . . . . . . . . . . . . . . 22.9 15.2 16.8 35.9 18.5 39.3 42.01500 to 1999 . . . . . . . . . . . . . . . . . 23.4 25.2 16.3 22.7 8.3 7.2 22.82000 to 2499 . . . . . . . . . . . . . . . . . 17.7 21.4 8.6 9.9 2.2 2.5 5.22500 to 2999 . . . . . . . . . . . . . . . . . 9.5 13.8 4.4 3.7 1.3 0.7 1.23000 to 3999 . . . . . . . . . . . . . . . . . 9.5 13.6 2.5 3.5 1.2 0.3 0.74000 or more . . . . . . . . . . . . . . . . 6.7 8.1 6.1 2.2 1.5 0.6 1.7Median . . . . . . . . . . . . . . . . . . . . . . 1,862 2,161 1,138 1,389 752 1,007 1,281
1Only units reporting square footage included in calculations.
Note: Details may not sum to totals because of rounding.
Source: U.S. Census Bureau, 2001 American Housing Survey, National sample.
9There were 8.1 million automobiles regis−tered in the United States in 1920, U.S.Department of Transportation, “State MotorVehicle Registrations, by Years, 1900−1995,”Highway Statistics Summary To 1995, February19, 2003, www.fhwa.dot.gov/ohim/summary95/mv200.xlw (May, 15, 2003); there were 24.4million families, U.S. Census Bureau, FourteenthCensus of the United States Taken in the Year1920, Vol. 2, Population: General Report andAnalytical Tables, U.S. Government PrintingOffice, Washington, DC, 1922, p. 1267.

U.S. Census Bureau 7
(46.2 percent) of detached unitsbuilt before 1920 contain just onefull bathroom and no half baths;the comparable figure for newunits is 6.3 percent.
Vacant UnitsThe great majority of housingunits are occupied, but old struc−tures are slightly more likely thannewer ones to be vacant (10.8 per−cent compared with 9.1 percent).10
Only in the Northeast is the differ−ence in vacancy rates between theold and new stock not statisticallysignificant (Table 4).
Vacant units built before 1920 arenot as likely as new units to bepart of the active housing market;43.0 percent of old vacant unitsare active as compared with 55.0 percent for new units. Newvacant units are also more likelythan the old to be intended forsporadic or seasonal use — 31.9 percent versus 23.5 percent.
Among old vacant units, 33.5 per−cent are sitting idle with no
current plans to market or other−wise occupy the property. Thiscompares with 13.1 percent of thevacant units built in 1990 or later.This discrepancy is particularlymarked among units in multiunitstructures, with 26.2 percent ofold vacant units, compared with2.8 percent new vacant apartmentssitting idle (Table 5).
Old units also tend to remainvacant longer than new homes.The units in old structures consis−tently are more likely than those innew buildings to have been emptyfor 2 years or more, regardless ofthe reason for vacancy (Figure 5).
Source: U.S. Census Bureau, 2001 American Housing Survey, National sample.
Figure 4.
Structural Characteristics by Region for Old and New 1, Detached Housing Units: 2001(Percent)
Built before 1920
3 or More Stories in Structure Full or Partial Basement
Built 1990 or later
58.8
41.2
10.7 11.4
80.2
63.0
17.527.3
WestSouthMidwestNortheast
84.978.2
17.3 17.7
92.884.6
25.9
55.8
WestSouthMidwestNortheast
Garage or Carport Available 2 or More Full Bathrooms
77.5
91.684.5
94.4
53.0
71.3
44.0
59.6
WestSouthMidwestNortheast
77.3 79.5
91.0 93.0
30.223.5
30.838.0
WestSouthMidwestNortheast
10In this discussion of vacant units, “UsualResidence Elsewhere” cases−−which are ordinari−ly tallied as vacant units−−are excluded since thesurvey does not collect all relevant informationfor these units. These account for 18.3 percentof new vacant units and 12.4 percent of old.

8 U.S. Census Bureau
Likewise, the proportion of oldunits that report only short vacan−cy intervals (less than 6 months) issmaller for each vacancy type thanthe corresponding figure for newhousing units.
Heating and CoolingWarm−air furnaces are the mostcommonly used heating equipment
in both vintages of residentialunits (Figure 6). Differences inavailable technology when thebuildings were originally built mayhave helped create the distinct pat−terns in the equipment and fuels inuse for old and new structures.Specifically, new structures relymore heavily on more modern cen−tral systems, particularly heatpumps and built−in electric units,while the steam or hot water sys−tems found in older homes are lessprevalent.
As with the presence of base−ments, regional differences in heat−ing systems are evident: 71.0 per−cent of U.S. homes of all ages withsteam or hot water heating sys−tems are in the Northeast, with46.1 percent of homes that areheated in that region using thistype of heating equipment.Because the Northeast also has thelargest number of homes builtbefore 1920, this could explain thedisproportionate use of steamheating in old residences. But,
Vacant units include:
• Active units, those forsale, for rent, for sale orrent, or sold or rented, butnot yet occupied
• Sporadic or seasonalunits, those intended onlyfor seasonal use, or heldfor occasional use through−out the year
• Idle units, those used forstorage of personal effects,held for the occupancy of ajanitor or caretaker, vacantwhile being remodeled,held during probate or liti−gation, or other units heldoff the market by theowner
Table 4.Region by Old and New Housing Units and OccupancyStatus: 2001(In thousands. Data based on sample. For information on confidentiality protection, sam−pling error, nonsampling error, and definitions, see www.census.gov/hhes/www/ahs.html)
Characteristic Total Northeast Midwest South West
Built before 1920 . . . . . . . . . . . 9,827 4,264 3,356 1,396 811
Occupied units . . . . . . . . . . . . . . . . . . 8,630 3,837 2,955 1,154 684Vacant units . . . . . . . . . . . . . . . . . . . . . 1,049 343 377 219 109Usual residence elsewhere units . . 148 85 23 23 18Percent vacant1 . . . . . . . . . . . . . . . . . . 10.8 8.2 11.3 16.0 13.8
Built 1990 or later . . . . . . . . . . 19,204 1,746 4,018 8,997 4,443
Occupied units . . . . . . . . . . . . . . . . . . 17,115 1,587 3,582 7,954 3,991Vacant units . . . . . . . . . . . . . . . . . . . . . 1,707 107 333 865 402Usual residence elsewhere units . . 382 52 103 178 50Percent vacant1 . . . . . . . . . . . . . . . . . . 9.1 6.3 8.5 9.8 9.2
1UREs excluded from calculation.
Note: Details may not sum to totals because of rounding.
Source: U.S. Census Bureau, 2001 American Housing Survey, National sample.
Table 3.Old and New 1, Detached Housing Units by Number of Partial and Full Bathrooms: 2001(Data based on sample. For information on confidentiality protection, sampling error, nonsampling error, and definitions, seewww.census.gov/hhes/www/ahs.html)
Characteristic
Half bathrooms
Built before 1920 Built 1990 or later
Total None 1 2 or more Total None 1 2 or more
Full Bathrooms (thousands)
Total . . . . . . . . . . . . . . . . . . . . . . . . 6,190 4,167 1,849 174 11,118 6,236 4,580 301
None . . . . . . . . . . . . . . . . . . . . . . . . . . . . 235 42 170 22 74 34 33 71 . . . . . . . . . . . . . . . . . . . . . . . . . . . . . . . . 4,207 2,860 1,254 93 1,298 705 520 742 or more . . . . . . . . . . . . . . . . . . . . . . . . 1,749 1,265 425 58 9,745 5,498 4,028 220
Percentage distribution . . . . . . . 100.0 100.0 100.0 100.0 100.0 100.0 100.0 100.0
None . . . . . . . . . . . . . . . . . . . . . . . . . . . . 3.8 1.0 9.2 12.6 0.7 0.6 0.7 2.31 . . . . . . . . . . . . . . . . . . . . . . . . . . . . . . . . 68.0 68.6 67.8 53.5 11.7 11.3 11.4 24.62 or more . . . . . . . . . . . . . . . . . . . . . . . . 28.3 30.4 23.0 33.3 87.7 88.2 88.0 73.1
Note: Details may not sum to totals because of rounding.
Source: U.S. Census Bureau, 2001 American Housing Survey, National sample.

U.S. Census Bureau 9
even within the Northeast, housingage plays a part in the choice ofheating equipment type, with oldunits about twice as likely as newones to employ steam or hot waterheating (54.7 versus 27.5 percent)(Table 6).
The type of heating equipmentalso may dictate the type of heat−ing fuel used. New homes heatwith electricity at about five timesthe rate of old homes (44.9 per−cent, compared with 9.0 percent),
Table 5.Old and New Housing Units by Vacancy and Structure Type: 2001(Data for vacant units excluding Usual Residence Elsewhere households. Data based on sample. For information on confidentialityprotection, sampling error, nonsampling error, and definitions, see www.census.gov/hhes/www/ahs.html)
Structure typeTotal Active Sporadic or seasonal Idle
Thousands Percent Thousands Percent Thousands Percent Thousands Percent
Built Before 1920
Total. . . . . . . . . . . . . . . . . . 1,049 100.0 451 100.0 246 100.0 351 100.0
1, detached. . . . . . . . . . . . . . . . 600 57.2 193 42.8 192 78.1 214 61.01, attached . . . . . . . . . . . . . . . . 84 8.0 32 7.1 11 4.5 41 11.7Unit in multiunit structure . . . . 365 34.8 226 50.1 43 17.5 96 27.4Manufactured housing . . . . . . (NA) (NA) (NA) (NA) (NA) (NA) (NA) (NA)
Built 1990 or Later
Total. . . . . . . . . . . . . . . . . . 1,707 100.0 939 100.0 544 100.0 224 100.0
1, detached. . . . . . . . . . . . . . . . 667 39.1 297 31.6 275 50.6 96 42.91, attached . . . . . . . . . . . . . . . . 220 12.9 131 14.0 54 9.9 35 15.6Unit in multiunit structure . . . . 548 32.1 398 42.4 134 24.6 15 6.7Manufactured housing . . . . . . 272 15.9 113 12.0 81 14.9 78 34.8
(NA) Not applicable.
Note: Details may not sum to totals because of rounding.
Source: U.S. Census Bureau, 2001 American Housing Survey, National sample.
Details may not sum to totals because of rounding.Source: U.S. Census Bureau, 2001 American Housing Survey, National sample.
Figure 5.
Number of Months Vacant by Vacancy Category for Old and New Housing Units: 2001
14.2 11.2
28.1 24.9
11.9
26.6
46.9
71.4
17.0
55.2
13.2
38.5
23.7
13.4
11.5
10.9
21.6
19.7
15.2
4.0
43.4
9.0
53.2
15.3
Built 1990 or later
Built before 1920
Built 1990 or later
Built before 1920
Built 1990 or later
Built before 1920
(Percent) Don't know
6 to 23
24 or more
Less than 6
Idle Occasional Use On Market
Types of heating equipmentinclude:
• Central, these deliver heatto all or most rooms in theunit and include warm−airfurnaces, heat pumps,steam or hot water systemsand built−in electric units.
• Other (or noncentral),these heat only one or tworooms and include portableheaters, room heaters, fire−places, stoves, and the like.

10 U.S. Census Bureau
partly because of the more fre−quent use of heat pumps and built−in electric units in the new struc−tures. In addition, the two equip−ment types used to heat 80.8 per−cent of old homes—warm−air fur−naces and steam or hot water sys−tems—seldom use electricity as a
fuel: just 5.3 percent of the warm−air furnaces and 2.2 percent of thehot water systems in old struc−tures heat with electricity (Table 7).Of homes built in 1990 or later,72.2 percent use either warm−airfurnaces or hot water systems;28.7 percent of these warm−air
furnaces heat with electricity as do7.5 percent of the hot water sys−tems.
Because residential air conditioningequipment was not marketed untilthe 1920s, nearly all old homeswere built without this feature.11
By 2001, 20.2 percent of old resi−dential units had central air condi−tioning installed, while 80.6 per−cent of new homes were built withcentral air or had it installed afteroriginal construction. Reliance onroom or window units for coolingis much more common in old con−struction than in new. Old homesare about five times as likely asnew to use only room units forcooling rather than a central sys−tem (43.8 percent and 8.3 percent,respectively) (Table 8).
Details may not sum to totals because of rounding.Source: U.S. Census Bureau, 2001 American Housing Survey, National sample.
Figure 6.
Main Heating Equipment for Old and New Housing Units: 2001
Built 1990 or later
Built before 1920
Warm-air furnace
Steam or hot water system
Heat pump or built-in electric units
Other
(Percent)
68.6
13.9
4.1
4.4
23.4
3.9
30.950.9
Table 6.Old and New Housing Units by Region and Main Heating Equipment: 2001(Data based on sample. For information on confidentiality protection, sampling error, nonsampling error, and definitions, seewww.census.gov/hhes/www/ahs.html)
Main heating equipmentNortheast Midwest South West
Thousands Percent Thousands Percent Thousands Percent Thousands Percent
All Housing Units
Total with heating equipment. . 22,218 (NA) 27,624 (NA) 43,219 (NA) 25,039 (NA)
Warm−air furnace. . . . . . . . . . . . . . . . . . 8,853 39.3 21,872 79.9 25,009 57.9 16,071 64.2Steam/hot water system . . . . . . . . . . . . 10,235 46.1 2,423 8.8 827 1.9 936 3.7Heat pump/built−in electric units . . . . .
Heat pump/built−in electric units . . . . .
Heat pump/built−in electric units . . . . .
1,809 8.1 1,918 6.9 11,460 26.5 3,435 13.7Other. . . . . . . . . . . . . . . . . . . . . . . . . . . . . 1,322 6.0 1,411 5.1 5,924 13.7 4,596 18.4
Built Before 1920
Total with heating equipment 4,236 (NA) 3,319 (NA) 1,374 (NA) 784 (NA)
Warm−air furnace. . . . . . . . . . . . . . . . . . 1,468 34.7 2,481 74.8 565 41.1 429 54.7Steam/hot water system . . . . . . . . . . . . 2,318 54.7 491 14.8 111 8.1 75 9.6
155 3.7 71 2.1 146 10.6 56 7.1Other. . . . . . . . . . . . . . . . . . . . . . . . . . . . . 295 7.0 275 8.3 551 40.1 223 28.4
Built 1990 or Later
Total with heating equipment. . 1,746 (NA) 3,994 (NA) 8,984 (NA) 4,416 (NA)
Warm−air furnace. . . . . . . . . . . . . . . . . . 1,005 57.6 3,444 86.2 5,357 59.6 3,316 75.1Steam/hot water system . . . . . . . . . . . . 480 27.5 105 2.6 35 0.4 129 2.9
171 9.8 319 8.0 3,283 36.5 708 2.9Other. . . . . . . . . . . . . . . . . . . . . . . . . . . . . 91 5.2 126 3.2 309 3.4 262 5.9
NA Not applicable.
Note: Details may not sum to totals because of rounding.
Source: U.S. Census Bureau, 2001 American Housing Survey, National sample.
11Mary Bellis, “The Father of Cool: WillisHaviland Carrier,” What You Need to KnowAbout Inventors, August 17, 1997, www.inventors.about.com/library/weekly/aa081797.htm (May 13, 2003).

U.S. Census Bureau 11
Home ValueHomeowners living in old struc−tures tend to have less expensivehomes. In fact, the medians in thedetailed tables of this report($98,793 for old and $154,233 forthe newer units) understate thisdifference, because units built in1990 or later include manufac−tured homes, whose median value($40,007) was considerably belowthe value for other units built in
1990 or later. Figure 7 provides amore accurate comparison of val−ues by examining the distributionof values for both vintages of single−family, detached units. Themedian values for detached,owner−occupied units were$98,794 for old homes and$183,502 for new houses.12 While
50.9 percent of old houses havean estimated value of less than$100,000, only 14.1 percent ofnew houses are valued below thatpoint.
Table 9 expands on these data bycomparing the median value ofsingle−family, detached homesacross the four census regions. Ineach region, the median value ofnew homes is considerably higherthan the old.
Table 7.Old and New Housing Units by Main Heating Equipment and Heating Fuel: 2001(Data based on sample. For information on confidentiality protection, sampling error, nonsampling error, and definitions, seewww.census.gov/hhes/www/ahs.html)
Main heating fuelWarm−air furnace Steam/hot water system Heat pump/built−in
electric units Other
Thousands Percent Thousands Percent Thousands Percent Thousands Percent
Built Before 1920
Total. . . . . . . . . . . . . . . 4,943 100.0 2,996 100.0 429 100.0 1,345 100.0
Gas. . . . . . . . . . . . . . . . . . . . 3,804 77.0 1,585 52.9 (NA) (NA) 833 61.9Electricity. . . . . . . . . . . . . . . 261 5.3 67 2.2 429 100.0 120 8.9Fuel oil. . . . . . . . . . . . . . . . . 752 15.2 1,303 43.5 (NA) (NA) 78 5.8Other . . . . . . . . . . . . . . . . . . 121 2.5 41 1.4 (NA) (NA) 311 23.1None . . . . . . . . . . . . . . . . . . 4 0.1 (NA) (NA) (NA) (NA) 2 0.2
Built 1990 or Later
Total. . . . . . . . . . . . . . . 13,122 100.0 749 100.0 4,481 100.0 787 100.0
Gas. . . . . . . . . . . . . . . . . . . . 9,063 69.1 369 49.3 (NA) (NA) 335 42.6Electricity. . . . . . . . . . . . . . . 3,760 28.7 56 7.5 4,481 100.0 298 37.9Fuel oil. . . . . . . . . . . . . . . . . 187 1.4 303 40.5 (NA) (NA) 11 1.3Other . . . . . . . . . . . . . . . . . . 112 0.9 21 2.8 (NA) (NA) 144 18.3None . . . . . . . . . . . . . . . . . . (NA) (NA) (NA) (NA) (NA) (NA) (NA) (NA)
NA Not applicable.
Note: Details may not sum to totals because of rounding.
Source: U.S. Census Bureau, 2001 American Housing Survey, National sample.
Table 8.Old and New Housing Units by Room Air Conditioners and Central Air Conditioning: 2001(Data based on sample. For information on confidentiality protection, sampling error, nonsampling error, and definitions, seewww.census.gov/hhes/www/ahs.html)
Characteristic
Room air conditioners
Built before 1920 Built 1990 or later
Total None 1 or more units Total None 1 or more units
Thou−sands Percent
Thou−sands Percent
Thou−sands Percent
Thou−sands Percent
Thou−sands Percent
Thou−sands Percent
Total . . . . . . . . . . . . . . . . 9,827 100.0 5,251 100.0 4,575 100.0 19,204 100.0 17,290 100.0 1,914 100.0
Central air conditioning . . . 1,983 20.2 1,707 32.5 275 6.0 15,479 80.6 15,160 87.7 319 16.7No central air conditioning 7,844 79.8 3,544 67.5 4,300 94.0 3,726 19.4 2,131 12.3 1,595 83.3
Note: Details may not sum to totals because of rounding.
Source: U.S. Census Bureau, 2001 American Housing Survey, National sample.
12The median value of all old owner−occupied units was not significantly differentfrom the median for old, 1, detached owner−occupied units.

12 U.S. Census Bureau
Upkeep and HousingConditionIn some ways, old homes are inworse condition than new struc−tures. Table 10 summarizes thedata for single−family (attachedand detached) units and for unitsin multiunit buildings for severaltypes of housing problems.(Manufactured housing units areexcluded because these units mayhave different types and quantitiesof problems than conventionalconstruction, and are not part ofthe old unit housing stock.)
In 2001, survey respondentsreported more of most of the types
of physical problems in old hous−ing rather than new. Units in oldand new multiunit buildings didnot differ in terms of problemswith hallway lights or railings incommon stairways. About 1 in 4old apartments (23.0 percent) arein buildings with boarded−up, bro−ken, or barred windows some−where in the structure.
Other data in the table show thatold units lack complete plumbingor kitchen facilities more oftenthan new units, and that old single−family and multiunit residences are more likely thantheir new counterparts to containone or more rooms that have noworking electrical outlet. The pro−portions of units with exposedwiring are not different within thesame structure types.
Old homes generally have propor−tionally more problems. Waterleaks from outside sources pose aparticular problem for single−familyhomes (either detached orattached) built before 1920.Although old units account foronly 8.4 percent of all single−fami−ly structures, they account for 13.7 percent of leaky roofs and18.3 percent of wet basementsthat were reported in such homes.Only two types of equipmentbreakdowns occur at the same ratein old and new units: water sup−ply breakdowns (for single−family
Details may not sum to totals because of rounding.Source: U.S. Census Bureau, 2001 American Housing Survey, National sample.
Figure 7.
Value of Old and New Owner-Occupied 1, detached Units: 2001(Percent)
Built before 1920
Thousands of Dollars(2001 Dollars)
Built 1990 or later
500 or more
450 to 499
400 to 449
350 to 399
300 to 349
250 to 299
200 to 249
150 to 199
100 to 149
50 to 99
Less than 50 14.91.9
36.112.1
17.722.2
11.920.6
5.614.0
3.79.7
2.85.6
1.63.6
1.03.0
1.01.7
3.75.6
Table 9.Old and New Owner-Occupied, 1, Detached Housing Unitsby Median Value and Region: 2001(Data based on sample. For information on confidentiality protection, sampling error, non−sampling error, and definitions, see www.census.gov/hhes/www/ahs.html)
RegionAge of structure Percent difference
in median value(new versus old)Built before 1920 Built 1990 or later
Total . . . . . . . . . . . . . . $98,794 $183,502 85.7
Northeast . . . . . . . . . . . . . . $128,475 $206,416 60.7Midwest . . . . . . . . . . . . . . . $86,954 $184,289 111.9South . . . . . . . . . . . . . . . . . $94,504 $162,815 72.3West . . . . . . . . . . . . . . . . . . $170,897 $217,368 27.2
Source: U.S. Census Bureau, 2001 American Housing Survey, National sample.

U.S. Census Bureau 13
homes) and flush toilet break−downs (for multiunit buildings).
Lead−based paint is one housingproblem unique to older struc−tures. The Consumer ProductSafety Commission estimates thatabout two−thirds of the homesbuilt before 1940 may have con−tained lead paint (lead was elimi−nated from house paint in 1978).13
While this hazard is not measureddirectly in the AHS, peeling paintor broken plaster in old buildingsmay imply exposure to surfacescoated with lead−based paint.
Home Repairs,Improvements, andRemodelingAfter enduring at least 80 years ofwear and tear and lacking theamenities of new housing styles,old structures offer many opportu−nities for home repairs, improve−ments, and remodeling.
Table 10.Structure Type by Old and New Housing Units and Selected Housing Problems: 2001(Data exclude manufactured housing units. Data based on sample. For information on confidentiality protection, sampling error, nonsamplingerror, and definitions, see www.census.gov/hhes/www/ahs.html)
Characteristic1−unit,attached or detached Unit in multiunit structure
Built before 1920 Built 1990 or later Built before 1920 Built 1990 or later
Occupied, URE, and vacant units, excludingmanufactured housing1 . . . . . . . . . . . .(thousands)... 6,873 12,785 2,954 3,232
Percent of Units With Selected Problems2
Physical problems:Holes in floors . . . . . . . . . . . . . . . . . . . . . . . . . . . . . . . . . . . . . . 3.1 0.5 3.9 0.6Open cracks or holes (interior) . . . . . . . . . . . . . . . . . . . . . . . 11.0 2.7 12.2 3.4Broken plaster or peeling paint (interior) . . . . . . . . . . . . . . . 6.4 0.7 7.2 1.5Roofing problems (sagging, with holes, or missingmaterials) . . . . . . . . . . . . . . . . . . . . . . . . . . . . . . . . . . . . . . . . . 12.3 2.2 10.3 3.4
Siding problems (missing materials or sloping walls) . . . . 10.5 1.1 8.2 1.6Window problems (broken, boarded up, or barred) . . . . . . 12.8 2.0 23.0 2.9Foundation problems (crumbling, with holes, or cracks) . 9.3 1.1 4.0 0.8Light fixtures in public halls of multiunit buildings(missing or not working) . . . . . . . . . . . . . . . . . . . . . . . . . . . . (NA) (NA) 9.9 11.4
Problems in common stairways of multiunit buildings:Loose, broken, or missing steps . . . . . . . . . . . . . . . . . . . . . . (NA) (NA) 13.9 10.4Loose or missing railings . . . . . . . . . . . . . . . . . . . . . . . . . . . . (NA) (NA) 18.2 16.8
Other deficiencies:Lacking complete plumbing . . . . . . . . . . . . . . . . . . . . . . . . . . 3.5 0.6 4.7 0.9Lacking kitchen facilities . . . . . . . . . . . . . . . . . . . . . . . . . . . . . 6.1 2.4 14.3 4.6Exposed wiring in unit . . . . . . . . . . . . . . . . . . . . . . . . . . . . . . . 0.7 0.5 0.4 0.4Rooms without working electrical outlets . . . . . . . . . . . . . . . 2.9 1.0 1.6 0.8
Occupied units, excluding manufactured housing(thousands) . . . . . . . . . . . . . . . . . . . . . . . . . . . . . . . . . . . . 6,073 11,728 2,557 2,567
Percent of Units With Selected Problems2
Equipment breakdowns in occupied units:Water leaks from inside structure in last 12 months . . . . . 9.2 6.2 14.3 7.6Water leaks from outside structure in last 12 months . . . . 21.6 8.2 12.3 5.8Water supply stoppage in last 3 months (units with hotand cold piped water) . . . . . . . . . . . . . . . . . . . . . . . . . . . . . . 2.5 2.9 4.4 2.8
Flush toilet breakdown in last 3 months (units with 1 ormore flush toilets) . . . . . . . . . . . . . . . . . . . . . . . . . . . . . . . . . 2.2 1.3 5.0 3.7
Sewage disposal breakdown in last 3 months (units withpublic sewer, septic tank, or cesspool) . . . . . . . . . . . . . . . 1.8 0.8 1.6 0.7
Heating equipment breakdown last winter (unit cold for24 hours or more) . . . . . . . . . . . . . . . . . . . . . . . . . . . . . . . . . 2.8 1.8 7.5 2.1
Fuses or breakers blown in last 3 months (units withelectrical wiring) . . . . . . . . . . . . . . . . . . . . . . . . . . . . . . . . . . . 14.6 9.6 13.7 6.2
NA Not applicable.1URE Usual residence elsewhere.2Units for which the data are not reported are excluded from the base of the percentage, therefore the base for each statistic may differ.
Source: U.S. Census Bureau, 2001 American Housing Survey, National sample.
13U.S. Consumer Product SafetyCommission, “CPSC Warns About Hazards of“Do It Yourself” Removal of Lead Based Paint:Safety Alert,” CPSC Document #5055, n.d.,www.cpsc.gov/cpscpub/pubs/5055.html (July17, 2003).

14 U.S. Census Bureau
Only 17.7 percent of homeownersin old homes report paying outnothing in an average year onmaintenance; the figure for newhomes is 36.6 percent. Amonghomeowners who estimate spend−ing anything, on average, for main−tenance, those in old structurestend to spend somewhat more:the medians are $509 annually inbuildings built before 1920 and$338 for the homes built in 1990or later.
Major replacements, improve−ments, or remodeling are uncom−mon events, regardless of the ageof the structure. Table 11 com−pares the frequency with whichselected jobs are undertaken in thelast 2 years for both old and newone−family, detached owner− occu−pied units. For most of these par−ticular jobs, the old houses aresomewhat more likely to haveundergone the work than the new.The exception is air conditioning.Perhaps because so many newhomes are in the South, new andold homes did not differ in the
rates of adding or replacing centralair conditioning.
OccupantsNew homes tend to have youngerhomeowners. New homes aremore likely to have owners underthe age of 25, 25 to 34, and 35 to44 than are old homes (Figure 8).In contrast, old homes have pro−portionally more owners 55 to 64,65 to 74, and 75 and over than donew homes. Owners 45 to 54years old account for a similar pro−portion of owners in old and newunits.
The picture for renters is morecomplex. For three age groups (25to 34, 35 to 44, and 65 to 74years), there is no differencebetween those in old and newunits. Households in old unitshave a lower proportion of boththe youngest and oldest rentersand are more likely to containhouseholders aged 45 to 64 yearsthan those in newly built structures.
Households living in propertiesbuilt before 1920 are no larger
generally than those in new build−ings. In fact, among homeowners,the median household size issmaller—2.3 occupants in old unitsand 2.6 in new. For renters, themedian household size is 1.9 forboth structure age categories.
One−person households occupy alarger share of some types of oldunits than they do of the new(Table 12). Homeowners in single−family, detached houses andrenters in multi−apartment build−ings are more likely to live alone inold buildings than in new. Forhouse owners, the proportions are23.6 percent and 10.5 percent,respectively. For renters, 47.7 per−cent live alone in old apartmentsas compared with 41.7 percent innew units.
People in new homes moved inmore recently than those in oldbuildings.14 The median length ofresidence is 3 years for owners of
Table 11.Home Improvements, Remodeling, and Replacements for Old and New 1, Detached,Owner-Occupied Units by Cost and Type of Work: 20011
(Data based on sample. For information on confidentiality protection, sampling error, nonsampling error, and definitions, seewww.census.gov/hhes/www/ahs.html)
Characteristic
Percent of unitswith work2
Median job cost3
(2001 dollars)Average job cost3
(2001 dollars)
Built before1920
Built 1990or later
Built before1920
Built 1990or later
Built before1920
Built 1990or later
Owner−occupied,1, detached units . . . .(thousands).. 4,523 9,888 (NA) (NA) (NA) (NA)
Doors or windows added or replaced . . . . . . . . . . . . . . . . 16.5 5.7 $600 $400 $2,117 $899Roofing added or replaced . . . . . . . . . . . . . . . . . . . . . . . . . . 13.3 3.4 $2,000 $1,900 $3,306 $3,102Plumbing fixtures added or replaced . . . . . . . . . . . . . . . . . 12.6 4.6 $200 $200 $622 $477Water heater added or replaced . . . . . . . . . . . . . . . . . . . . . 9.5 3.5 $268 $350 $375 $410Wiring added or replaced . . . . . . . . . . . . . . . . . . . . . . . . . . . 9.3 3.4 $300 $150 $1,397 $624Bathroom remodeled . . . . . . . . . . . . . . . . . . . . . . . . . . . . . . . 8.4 2.2 $1,600 $1,000 $3,647 $4,202Water pipes added or replaced . . . . . . . . . . . . . . . . . . . . . . 7.7 1.9 $200 $200 $968 $952Heating equipment added or replaced . . . . . . . . . . . . . . . . 6.1 2.1 $2,000 $1,450 $3,339 $1,479Kitchen remodeled . . . . . . . . . . . . . . . . . . . . . . . . . . . . . . . . . 5.9 2.2 $2,500 $2,500 $7,198 $5,001Siding added or replaced . . . . . . . . . . . . . . . . . . . . . . . . . . . 5.8 2.2 $2,000 $1,500 $4,401 $3,634Central air conditioning added or replaced . . . . . . . . . . . . 3.8 3.3 $1,800 $2,100 $3,414 $2,778
NA Not applicable.1Jobs completed within the 2 years prior to the date of interview.2Units for which the data are not reported are excluded from the base of the percentage, therefore the base for each statistic may differ.3For jobs completed within the 2 years prior to the date of interview where work priced separately from other jobs done.
Source: U.S. Census Bureau, 2001 American Housing Survey, National sample.
14This observation is partly because occu−pants of new homes could only have movedduring the last 11 years.

U.S. Census Bureau 15
new homes and 14 years for own−ers of old structures. For renters,the figures are 1 year for newunits and 3 years for old.
Figure 9 provides more detail onthe topic. It is noteworthy thatabout 1 in 4 (23.7 percent) of theowner−occupied buildings con−structed before 1920 have anowner who has lived there at least32 years.
Income and HouseholdFinancesHouseholds in old units generallyhave lower incomes than those innew units. Table 13 shows medianincome for homeowners and
renters by three age categories. Ineach of the categories, homeown−ers in units built before 1920report a lower median income thanowners in new buildings. Forrenters, however, the medianincome of the elderly (65 andolder) is about the same for thosein new and in old homes. Theremaining two renter age cate−gories show lower income levelsfor households in old buildings.15
Old buildings offer two majorfinancial attractions for householdswith lower incomes. First, thelower median home value for oldhomes allows more opportunitiesfor lower−income households to
become homeowners. Second,older properties are often lessexpensive on a day−to−day basis,based on the figures for monthlyhousing costs.
Figure 10 shows the medianmonthly housing costs paid byowners and renters in the threehouseholder age categories usedin Table 13. As with income, themedian monthly housing costs forhomeowners is smaller in each agecategory for households in struc−tures built before 1920. The samerelationship is true for renters.Thus living in old buildings canhelp households lower their hous−ing costs.
Housing burden is a measure thatcompares income and housingcosts. Generally, households thatpay 30 percent or more of theirincome for housing are consideredto have a high housing burden.Based on this standard, none ofthe three age groups of homeown−ers in either old or new structureshas a high median housing burden(Table 14). The median monthlyhousing burden for owners isabout 21 percent, except for the35−to−64−year−olds who, in oldunits, have the lowest median bur−den (18 percent) of all age, tenure,and structure age combinations.Owners in the same age rangewho live in new homes have thesecond lowest burden (19 per−cent).16
Renters devote a larger share oftheir income to paying for shelterthan homeowners. For rentersunder the age of 35, the median is31 percent, while for those 35 to
Details may not sum to totals because of rounding.Source: U.S. Census Bureau, 2001 American Housing Survey, National sample.
Figure 8.
Householder Age by Tenure for Old and New Units: 2001(Percent)
Built before 1920
Years of age
Homeowners
Built 1990 or later
2.5
19.8
31.4
21.9
12.3
7.8
4.21.5
11.5
20.323.2
14.712.2
16.7
75 or more65-7455-6445-5435-4425-34Under 25
Built before 1920
Years of age
Renters
Built 1990 or later
19.5
30.7
20.7
110.7
6.0 4.87.5
13.0
28.1
23.4
15.2
9.05.7 5.7
75 or more65-7455-6445-5435-4425-34Under 25
15There is no difference in the medianincome for the group of renters under 35 com−pared with renters 35 to 64 in old homes. Thesame is true for these age groups of renters innew homes.
16The housing burden of owners 65 andolder in new buildings is not significantly differ−ent from that for owners 35 to 64 in newhomes.

16 U.S. Census Bureau
64 years old, the median drops toabout 25 percent. For elderlyrenters (those 65 and older), how−ever, the median soars to around45 percent. The three age groupsof renters show no difference in
housing burden based on the ageof the building they occupy.
Generally, owner households inpre−1920 vintage buildings are lesslikely to have a mortgage (Table15).17 Only the youngest
homeowners show no significantdifference in the proportion with amortgage between the two agegroups of homes. The same
Table 12.Old and New Housing Units by Structure Type, Number of Occupants, and Tenure: 2001(Data based on sample. For information on confidentiality protection, sampling error, nonsampling error, and definitions, seewww.census.gov/hhes/www/ahs.html)
Characteristic
Built before 1920 Built 1990 or later
Total1,
detached1,
attached
Unit inmultiunitbuilding Total
1,detached
1,attached
Unit inmultiunitbuilding
Manufac−tured
housing
Number of Occupants
All households . . . . . . . 8,630 5,487 586 2,556 17,115 10,301 1,427 2,566 2,820
1−person. . . . . .(thousands)... 2,641 1,322 146 1,173 3,247 1,118 530 1,065 534(percent)... 30.6 24.1 24.9 45.9 19.0 10.9 37.1 41.5 18.9
2 or more . . . . .(thousands)... 5,989 4,165 440 1,383 13,868 9,184 897 1,501 2,286(percent)... 69.4 75.9 75.1 54.1 81.0 89.2 62.9 58.5 81.1
Owners 5,195 4,523 313 359 13,665 9,888 869 368 2,541
1−person. . . . . .(thousands)... 1,265 1,067 74 124 1,970 1,037 316 149 470(percent)... 24.4 23.6 23.5 34.5 14.4 10.5 36.4 40.5 18.5
2 or more . . . . .(thousands)... 3,931 3,456 240 235 11,695 8,851 553 219 2,072(percent)... 75.7 76.4 76.5 65.5 85.6 89.5 63.6 59.5 81.5
Renters . . . . . . . . . . . . . . . . . .
. . . . . . . . . . . . . . . . . .
3,435 964 273 2,197 3,450 414 558 2,199 279
1−person. . . . . .(thousands)... 1,377 255 73 1,049 1,277 81 215 917 65(percent)... 40.1 26.5 26.7 47.7 37.0 19.6 38.4 41.7 23.1
2 or more . . . . .(thousands)... 2,058 709 200 1,148 2,173 333 344 1,282 215(percent)... 59.9 73.6 73.4 52.3 63.0 80.4 61.6 58.3 76.9
Note: Details may not sum to totals because of rounding.
Source: U.S. Census Bureau, 2001 American Housing Survey, National sample.
Table 13.Old and New Housing Units by Household Income, Tenure, and Householder Age: 2001(Data based on sample. For information on confidentiality protection, sampling error, nonsampling error, and definitions, seewww.census.gov/hhes/www/ahs.html)
Characteristic
Built before 1920 Built 1990 or later
Number(thousands)
Medianincome
(2001 dollars)
Averageincome
(2001 dollars)Number
(thousands)
Medianincome
(2001 dollars)
Averageincome
(2001 dollars)
Homeowners . . . . . . . . . . . . . . . . . . . . 5,195 $42,784 $60,653 13,665 $62,588 $84,157
Householder less than 35 years old . . . 674 $49,718 $63,398 3,052 $61,709 $72,645Householder 35 to 64 years old . . . . . . 3,024 $55,243 $73,336 8,968 $70,129 $95,346Householder 65 or more years old . . . . 1,498 $17,950 $33,814 1,646 $27,959 $44,534
Renters . . . . . . . . . . . . . . . . . . . . . . . . . 3,435 $25,588 $34,068 3,450 $31,425 $41,692
Householder less than 35 years old . . . 1,410 $29,242 $34,636 1,733 $32,673 $40,644Householder 35 to 64 years old . . . . . . 1,633 $27,026 $37,208 1,291 $35,778 $49,361Householder 65 or more years old . . . . 391 $11,871 $18,933 426 $13,227 $22,702
Note: Details may not sum to totals because of rounding.
Source: U.S. Census Bureau, 2001 American Housing Survey, National sample.
17In this discussion, the term mortgagerefers to both regular mortgages and homeequity lump sum loans.

U.S. Census Bureau 17
relationship exists when compar−ing old homes with only conven−tionally built new homes, that is,all new units except manufacturedhousing. New manufacturedhomes less frequently carry amortgage than new conventionalunits for the two younger agegroups, but there is no statisticallysignificant difference for owners65 years old and older. For home−owners under 35 years old, eventhose in old units (84.1 percent)are more likely to have a mortgagethan the similar age group in newmanufactured housing (69.6 percent).
LOSSES IN OLD RESIDEN−TIAL BUILDINGS
Reasons for LossesThe first Census of Housing in1940 recorded 20.6 million hous−ing units as built before 1920.18 Alittle more than 60 years later, thecount was down to 9.8 million (in2001). Many factors contributedto the loss of old units—demoli−tions (including urban renewal),fires, floods, storms, generaldecay, the merging of smaller unitsto create larger homes, and
Details may not sum to totals because of rounding.Source: U.S. Census Bureau, 2001 American Housing Survey, National sample.
Figure 9.
Householder's Length of Residence by Tenure for Old and New Units: 2001
23.7
3.5
32.5
22.3 11.6
5.2
13.8
52.5
11.631.4
21.9
25.3
35.9
63.4
8.1
37.4
Built 1990 or later: renters
Built before 1920: renters
Built 1990 or later: owners
Built before 1920: owners
(Percent)
32 or more
7 to 11
2 to 6
Less than 2
12 to 31
Number of Years
Table 14.Old and New Housing Units by Tenure, Median Monthly Housing Cost as Percent ofCurrent Income, and Householder Age: 2001(In percent. Data based on sample. For information on confidentiality protection, sampling error, nonsampling error, and definitions, seewww.census.gov/hhes/www/ahs.html)
CharacteristicBuilt before 1920 Built 1990 or later
Total Owners Renters Total Owners Renters
Median Monthly Housing Cost as Percentof Current Income
Total . . . . . . . . . . . . . . . . . . . . . . . . . . . . . . . . 22.6 19.2 29.7 21.3 19.6 29.1
Householder less than 35 years old . . . . . . . . . 27.3 22.3 30.6 23.5 20.8 30.9Householder 35 to 64 years old . . . . . . . . . . . . 20.1 17.6 26.3 19.8 19.1 25.2Householder 65 or more years old . . . . . . . . . . 23.8 21.2 46.3 24.2 20.4 44.1
Source: U.S. Census Bureau, 2001 American Housing Survey, National sample.
18U.S. Census Bureau, Sixteenth Census ofthe United States: 1940, Vol. II, Housing,General Characteristics, U.S. GovernmentPrinting Office, Washington, DC, 1943, p. 12.

18 U.S. Census Bureau
conversions of housing units tovarious nonresidential uses.
Censuses of Housing do not meas−ure why these losses occurredbetween 1940 and 2001, but theAHS can provide a look at why oldunits fell out of the inventorybetween 1997 and 2001.19
Data on losses were developedfrom a comparison of the status ofthe same addresses and units asreported in 1997 and 2001. A unitis considered a loss if it was usedas housing in 1997, but not in2001. Because this method
Source: U.S. Census Bureau, 2001 American Housing Survey, National sample.
Figure 10.
Median Monthly Housing Costs by Tenure and Householder Age for Old and New Units: 2001(2001 dollars)
Built before 1920
Owners Renters
Built 1990 or later991
1,060
426
752 746
624
775711
320
611 588498
65 or older35 to 64Under 3565 or older35 to 64Under 35
Table 15.Old and New Housing Units by Structure Type, Presence of Mortgage, and Age ofHouseholder: 2001(Data based on sample. For information on confidentiality protection, sampling error, nonsampling error, and definitions, seewww.census.gov/hhes/www/ahs.html)
CharacteristicBuilt before
1920—
Total
Built 1990 or later
Total
1, detached,1, attached,and units in
multiunitstructures
Manufacturedhousing
Total homeowners . . . . . . . . . . . . . . . . . .(thousands)... 5,195 13,665 11,124 2,541
Householder less than 35 years old . . . . . . . . . . . . . . . . . . . . . 674 3,052 2,424 628Householder 35 to 64 years old . . . . . . . . . . . . . . . . . . . . . . . . 3,024 8,968 7,437 1,531Householder 65 or more years old . . . . . . . . . . . . . . . . . . . . . . 1,498 1,646 1,263 383
Homeowners with a mortgage . . . . . . . . . . .(thousands)... 2,826 10,092 8,533 1,559
Householder less than 35 years old . . . . . . . . . . . . . . . . . . . . . 566 2,537 2,100 437Householder 35 to 64 years old . . . . . . . . . . . . . . . . . . . . . . . . 2,018 6,988 5,981 1,008Householder 65 or more years old . . . . . . . . . . . . . . . . . . . . . . 242 566 452 114
Homeowners with a mortgage . . . . . . . . . . . . . .(percent)... 54.4 73.9 76.7 61.4
Householder less than 35 years old . . . . . . . . . . . . . . . . . . . . . 84.1 83.1 86.6 69.6Householder 35 to 64 years old . . . . . . . . . . . . . . . . . . . . . . . . . 66.7 77.9 80.4 65.9Householder 65 or more years old . . . . . . . . . . . . . . . . . . . . . . 16.2 34.4 35.8 29.7
Homeowners with a home equity lineof credit loan . . . . . . . . . . . . . . . . . . . . . . . . . .(thousands)... 471 1,178 1,140 38
Householder less than 35 years old . . . . . . . . . . . . . . . . . . . . . 46 217 205 12Householder 35 to 64 years old . . . . . . . . . . . . . . . . . . . . . . . . 354 892 875 17Householder 65 or more years old . . . . . . . . . . . . . . . . . . . . . . 72 68 60 9
Homeowners with a home equity lineof credit loan1 . . . . . . . . . . . . . . . . . . . . . . . . . . . .(percent)... 9.7 9.2 11.0 1.6
Householder less than 35 years old . . . . . . . . . . . . . . . . . . . . . 7.2 7.6 9.0 2.0Householder 35 to 64 years old . . . . . . . . . . . . . . . . . . . . . . . . . 12.6 10.6 12.6 1.2Householder 65 or more years old . . . . . . . . . . . . . . . . . . . . . . 5.0 4.4 5.0 2.3
1Units with a nonresponse to the question on home equity loans are omitted from the base for these calculations. All owner households provided or wereimputed a response to the questions on regular mortgages.
Source: U.S. Census Bureau, 2001 American Housing Survey, National sample.
19These causes may have had differentimportance at different points in time, so thecurrent loss data cannot be applied uniformlyover long periods of time.
U.S. Census Bureau 19
produces only a gross number oflosses, this number cannot be sub−tracted from the 1997 estimate ofold units to provide the 2001 esti−mate of existing old units. Thissimple comparison is not possible,partly because some units in struc−tures built before 1920 were alsoadded to the housing inventorybetween 1997 and 2001 throughseveral processes.
Although it may seem impossibleto create more old units, theycould increase between 1997 and2001 through the rehabilitation of,or conversion to residential use ofold structures, or the splitting ofexisting units in old buildings intomore housing units. In addition,the weighting of the sample mayhave changed between 1997 and2001 for individual units based ontheir characteristics and the overallsurvey results for the year.Reporting error in the year−builtdata also confuses attempts totrack units over time. Since the
reasons for adding units were generally less fully explored in theAHS than the reasons units werelost from the inventory, this reportexamines the losses and does notattempt to derive a completeaccounting of the disposition ofold units between 1997 and 2001.
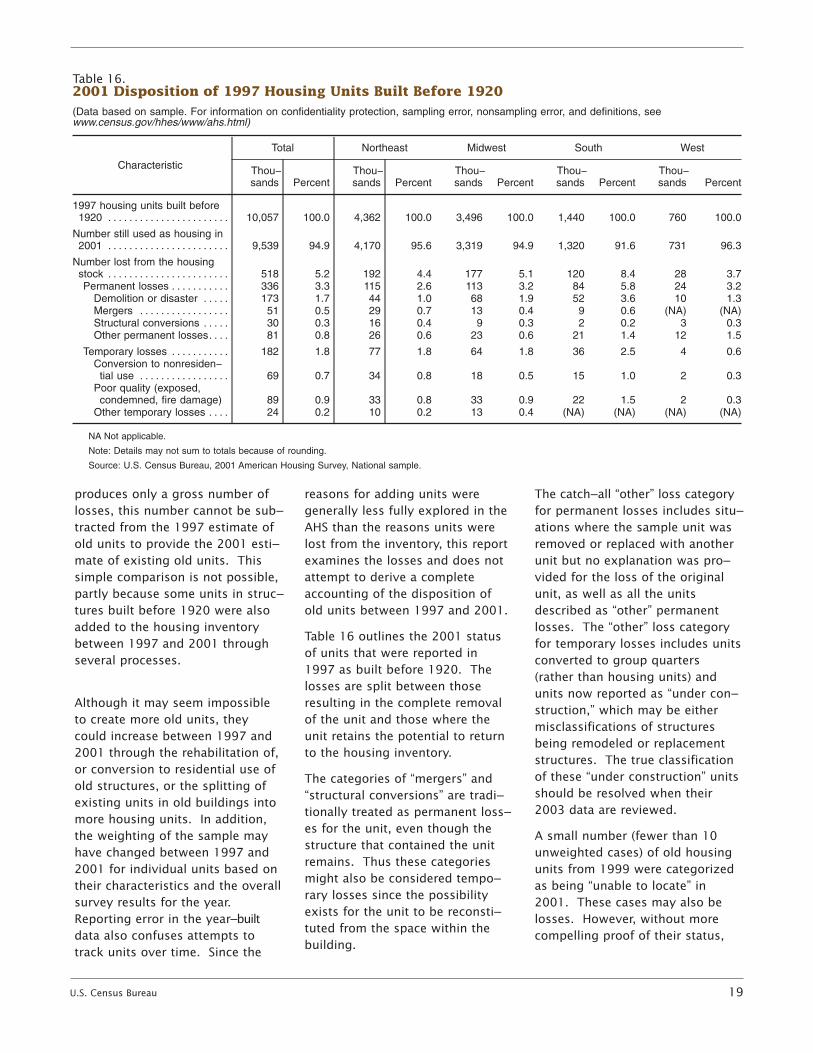
Table 16 outlines the 2001 statusof units that were reported in1997 as built before 1920. Thelosses are split between thoseresulting in the complete removalof the unit and those where theunit retains the potential to returnto the housing inventory.
The categories of “mergers” and“structural conversions” are tradi−tionally treated as permanent loss−es for the unit, even though thestructure that contained the unitremains. Thus these categoriesmight also be considered tempo−rary losses since the possibilityexists for the unit to be reconsti−tuted from the space within thebuilding.
The catch−all “other” loss categoryfor permanent losses includes situ−ations where the sample unit wasremoved or replaced with anotherunit but no explanation was pro−vided for the loss of the originalunit, as well as all the unitsdescribed as “other” permanentlosses. The “other” loss categoryfor temporary losses includes unitsconverted to group quarters(rather than housing units) andunits now reported as “under con−struction,” which may be eithermisclassifications of structuresbeing remodeled or replacementstructures. The true classificationof these “under construction” unitsshould be resolved when their2003 data are reviewed.
A small number (fewer than 10unweighted cases) of old housingunits from 1999 were categorizedas being “unable to locate” in2001. These cases may also belosses. However, without morecompelling proof of their status,
Table 16.2001 Disposition of 1997 Housing Units Built Before 1920(Data based on sample. For information on confidentiality protection, sampling error, nonsampling error, and definitions, seewww.census.gov/hhes/www/ahs.html)
Characteristic
Total Northeast Midwest South West
Thou−sands Percent
Thou−sands Percent
Thou−sands Percent
Thou−sands Percent
Thou−sands Percent
1997 housing units built before1920 . . . . . . . . . . . . . . . . . . . . . . . 10,057 100.0 4,362 100.0 3,496 100.0 1,440 100.0 760 100.0
Number still used as housing in2001 . . . . . . . . . . . . . . . . . . . . . . . 9,539 94.9 4,170 95.6 3,319 94.9 1,320 91.6 731 96.3
Number lost from the housingstock . . . . . . . . . . . . . . . . . . . . . . . 518 5.2 192 4.4 177 5.1 120 8.4 28 3.7Permanent losses . . . . . . . . . . . 336 3.3 115 2.6 113 3.2 84 5.8 24 3.2
Demolition or disaster . . . . . 173 1.7 44 1.0 68 1.9 52 3.6 10 1.3Mergers . . . . . . . . . . . . . . . . . 51 0.5 29 0.7 13 0.4 9 0.6 (NA) (NA)Structural conversions . . . . . 30 0.3 16 0.4 9 0.3 2 0.2 3 0.3Other permanent losses. . . . 81 0.8 26 0.6 23 0.6 21 1.4 12 1.5
Temporary losses . . . . . . . . . . . 182 1.8 77 1.8 64 1.8 36 2.5 4 0.6Conversion to nonresiden−tial use . . . . . . . . . . . . . . . . . 69 0.7 34 0.8 18 0.5 15 1.0 2 0.3
Poor quality (exposed,condemned, fire damage) 89 0.9 33 0.8 33 0.9 22 1.5 2 0.3
Other temporary losses . . . . 24 0.2 10 0.2 13 0.4 (NA) (NA) (NA) (NA)
NA Not applicable.
Note: Details may not sum to totals because of rounding.
Source: U.S. Census Bureau, 2001 American Housing Survey, National sample.

20 U.S. Census Bureau
these cases are not tallied with thelosses.
For old homes, permanent lossesoutnumber temporary losses (Table16). The demolition and disastercategory is the leading reason forthe loss of old housing stock.About one−third of all losses (33.4 percent), and half of perma−nent losses (51.5 percent) fall intothis category. Structural conver−sions and “other” temporary lossesare the least common causes forlosses.20 Statistically significantrankings for the remaining reasonsare not possible due to the smallnumber of cases involved.
Characteristics of LostHousing
Do old structures that continue toserve as housing differ from thosethat are destroyed or converted toother uses? Figure 11 comparesselected 1997 characteristics ofhousing units built before 1920 bywhether the unit remains in resi−dential use in 2001.21 These datashow that the poorer quality unitsare more likely to fall out of the
housing inventory than those inbetter condition or with moreamenities.
Also, units that were occupied in1997 stood a much greater chanceof remaining in the inventory in2001 than those that were vacant:only 3.5 percent of the old unitsthat were occupied in 1997 werelost by 2001, with 2.1 percent ofthe owner−occupied and 5.4 per−cent of the renter−occupied homeslost by that time (Table 17). Of theold vacant units in 1997, 16.5 per−cent dropped out of the housingstock, either permanently or temporarily, by 2001. However,losses among the occupied unitswere more often permanent
Source: U.S. Census Bureau, 2001 American Housing Survey, National sample.
Figure 11.
Indicators of Housing and Neighborhood Quality by Whether Old Units Remain in the Housing Inventory: 1997 to 2001(Percent)
Losses by 2001
Still housing in 2001
Nearby vandalized/abandoned buildings
Nearby commercial establishments
Nearby industrial structures
Nearby trash, litter, or junk
No full bathroom
3 or fewer rooms
Rooms lacking working outlets
Central air conditioning
Holes in roof
Sloping walls
Peeling paint/broken plaster
Cracks in walls
Holes in floors
Exposed wiring 5.01.1
8.82.2
23.210.4
18.57.0
10.73.4
13.93.9
6.615.7
24.3
11.12.4
15.323.7
49.643.5
12.48.9
22.39.3
8.73.8
14.9
20The count of structural conversions is notdifferent from that for mergers. The number of“other” temporary losses is smaller than thecount of mergers, but not different from thecount of structural conversions.
21All comparisons are significant, exceptthose for nearby commercial establishmentsand nearby industrial structures.

U.S. Census Bureau 21
losses–demolitions and thelike–than were the losses amongvacant units (71.2 percent com−pared with 55.9 percent).
Structure type did not play a majorrole in whether a unit was a loss.Apartments in small (2 to 4 units)multiunit buildings (7.0 percent)were somewhat more likely than 1−unit, detached structures (4.4 percent) to become a lossbetween 1997 and 2001. Theremaining comparisons amongstructure types do not show differ−ences.
As home to the largest concentra−tion of residential structures builtbefore 1920, the Northeast mightalso be expected to show the high−est number of losses. However,the numbers of losses between1997 and 2001 are not significantly
different for the Northeast and theMidwest. Both the South and theWest trailed in the number of oldunits that dropped out of use dur−ing that period.
The South experienced the highestproportional loss of old unitsbetween 1997 and 2001. Duringthat time, 8.4 percent of the oldresidential units changed to otheruses or were otherwise lost fromthe housing stock. The figures forthe other three regions are not sig−nificantly different from eachother—about 4 percent for each.Demolitions or disaster lossesaccounted for approximately thesame number of losses in theSouth as in the Northeast eventhough the Northeast had aboutthree times as many old homes in1997 as did the South.
CONCLUSION
Although the 1940 and 2001counts show that the number ofresidences built before 1920 in thehousing inventory has shrunk,these unique structures are still“home” to many households acrossthe country. An advantage ofthese units is that they are rela−tively affordable for both home−owners and renters. Lower−incomehome buyers may find old struc−tures a reasonable alternative toboth smaller, less expensive manu−factured housing units and tolarger, but more costly, new con−ventional units.
The drawbacks to this vintage ofhomes include the lack of contem−porary amenities and larger main−tenance requirements. Since oldunits are found chiefly in theNortheast and Midwest, units built
Table 17.1997 Characteristics of Housing Units Built Before 1920 by Their 2001 Status(Data based on sample. For information on confidentiality protection, sampling error, nonsampling error, and definitions, seewww.census.gov/hhes/www/ahs.html)
Characteristic
Total Remain as housingin 2001
Lost from inventory by 2001
Total Temporary losses Permanent losses
Thou−sands Percent
Thou−sands Percent
Thou−sands Percent
Thou−sands Percent
Thou−sands Percent
Total . . . . . . . . . . . . . . . . . . . 10,057 100.0 9,539 100.0 518 100.0 182 100.0 336 100.0
Occupied units . . . . . . . . . . . . . . 8,767 87.2 8,462 88.7 305 58.8 88 48.2 217 64.5Owner occupied . . . . . . . . . . . 5,106 50.8 5,000 52.4 106 20.5 31 16.9 75 22.4Renter occupied . . . . . . . . . . . 3,660 36.4 3,462 36.3 199 38.3 57 31.3 141 42.1
Vacant units . . . . . . . . . . . . . . . . . 1,290 12.8 1,077 11.3 213 41.2 94 51.8 119 35.5Active . . . . . . . . . . . . . . . . . . . . 570 5.7 495 5.2 75 14.5 29 16.1 46 13.6Seasonal or sporadic . . . . . . . 339 3.4 277 2.9 62 11.9 36 19.5 26 7.8Idle . . . . . . . . . . . . . . . . . . . . . . 381 3.8 304 3.2 77 14.8 29 16.1 47 14.1
Metropolitan/Nonmetropolitan
Inside metropolitan statisticalareas . . . . . . . . . . . . . . . . . . . . . 6,940 69.0 6,576 68.9 364 70.3 130 71.1 234 69.8In central cities . . . . . . . . . . . . 3,842 38.2 3,653 38.3 190 36.6 85 46.6 105 31.2Suburbs . . . . . . . . . . . . . . . . . . 3,098 30.8 2,923 30.7 174 33.7 45 24.5 130 38.6
Outside metropolitan statisticalareas . . . . . . . . . . . . . . . . . . . . . 3,117 31.0 2,963 31.1 154 29.7 53 28.9 101 30.2
Units in Structure
1, detached . . . . . . . . . . . . . . . . . 5,993 59.6 5,730 60.1 263 50.8 94 51.7 169 50.41, attached . . . . . . . . . . . . . . . . . . 574 5.7 545 5.7 30 5.7 12 6.4 18 5.32 to 4 . . . . . . . . . . . . . . . . . . . . . . 2,061 20.5 1,916 20.1 145 28.1 52 28.3 94 27.95 or more . . . . . . . . . . . . . . . . . . . 1,428 14.2 1,348 14.1 80 15.4 25 13.6 55 16.4
Note: Because of rounding, numbers may not add to total.
Source: U.S. Census Bureau, 2001 American Housing Survey, National sample.

22 U.S. Census Bureau
before 1920 are not available formany households seeking a home.
The long−term erosion in the inven−tory of old homes is basically irre−versible. Demolitions and disasterlosses are the current major reasonold residential units fall out of theinventory, and there is no recoveryfrom these processes. The num−ber of old units is likely to contin−ue to dwindle through decay andthrough outright elimination inorder to reuse the property.However, these old houses havealready weathered numerousstorms in their lifetime, and manyhave the utility, substance, andunique character to continue ashousing for many more years.
Additional detailed tables are avail−able at www.census.gov/prod/2004pubs/h121−04−1.pdf.
SOURCE OF DATA
The data in these tables are basedon the American Housing Survey(AHS). The population represented(the population universe) in the2001 AHS include the occupiedand vacant housing units in theUnited States. Housing in institu−tions (such as correctional facilitiesor nursing homes) or in groupquarters (primarily student or
military dormitories) are not inscope. The AHS is a longitudinalsurvey conducted at 2−year inter−vals. The data in this report werecollected from August throughNovember of 2001 and representthe ninth interview at the originalsample addresses. The data inthese tables contain sampling errorand nonsampling error. Data userswho create their own estimatesusing data from Census Bureautables should cite the CensusBureau as the source of the origi−nal data only. For the full technicaldocumentation, definitions of sub−ject characteristics and geographicdefinitions see www.census.gov/hhes/www/ahs.html.
ACCURACY OF THE ESTIMATES
Statistics from surveys are subjectto sampling and nonsamplingerror. All comparisons presented inthis report have taken samplingerror into account and meet theU.S. Census Bureau’s standards forstatistical significance.
Nonsampling errors in surveysmay be attributed to a variety ofsources, such as how the surveywas designed, how respondentsinterpret questions, how able and
willing respondents are to providecorrect answers, and how accu−rately the answers are coded andclassified. The Census Bureauemploys quality control proceduresthroughout the productionprocess, including the overalldesign of surveys, the wording ofquestions, review of the work ofinterviewers and coders, and sta−tistical review of reports.
The American Housing Surveyemploys ratio estimation, wherebysample estimates are adjusted toindependent estimates of thenational population by age, race,sex, and Hispanic origin. Thisweighting partially corrects forbias due to undercoverage, buthow it affects different variables inthe survey is not precisely known.Moreover, biases may also be pres−ent when people who are missedin the survey differ from thoseinterviewed in ways other than thecategories used in weighting (age,race, sex, and Hispanic origin). Allof these considerations affect com−parisons across different surveysor data sources.
For further information on statisti−cal standards and the computationand use of standard errors, seewww.census.gov/hhes/www/ahs.html.

U.S. Census Bureau 23
Table A1.Characteristics of Occupied and Vacant Housing Units byYear Built: 2001(In thousands. Data based on sample. For information on confidentiality protection, sam−pling error, nonsampling error, and definitions, see www.census.gov/hhes/www/ahs.html)
Characteristic All housingunits
Built before1920
Built 1990or later
STATUS
Total housing units . . . . . . . . . . . . . . . . . . 119,117 9,827 19,204Seasonal units . . . . . . . . . . . . . . . . . . . . . . . . . . . 3,078 204 443Year round units . . . . . . . . . . . . . . . . . . . . . . . . . . 116,038 9,622 18,761
Occupied . . . . . . . . . . . . . . . . . . . . . . . . . . . . . . 106,261 8,630 17,115Vacant . . . . . . . . . . . . . . . . . . . . . . . . . . . . . . . . 9,777 992 1,646
For rent . . . . . . . . . . . . . . . . . . . . . . . . . . . . . 2,916 276 471For sale only . . . . . . . . . . . . . . . . . . . . . . . . . 1,243 108 299Rented or sold . . . . . . . . . . . . . . . . . . . . . . . 731 67 169Occasional use\URE . . . . . . . . . . . . . . . . . . 2,594 190 483Other vacant . . . . . . . . . . . . . . . . . . . . . . . . . 2,293 351 224
DURATION OF VACANCY
Seasonal and year round vacantunits1 . . . . . . . . . . . . . . . . . . . . . . . . . . . . . . 11,014 1,049 1,707
Less than 1 month vacant . . . . . . . . . . . . . . . . . 2,051 94 4251 month up to 2 months . . . . . . . . . . . . . . . . . . 784 49 1052 months up to 6 months . . . . . . . . . . . . . . . . . . 2,078 157 3636 months up to 1 year. . . . . . . . . . . . . . . . . . . . . 937 113 1201 year up to 2 years . . . . . . . . . . . . . . . . . . . . . . 715 98 722 years or more . . . . . . . . . . . . . . . . . . . . . . . . . . 1,847 356 66Never occupied . . . . . . . . . . . . . . . . . . . . . . . . . . 489 6 256Don’t know . . . . . . . . . . . . . . . . . . . . . . . . . . . . . . 2,114 175 300
REGIONS
Northeast . . . . . . . . . . . . . . . . . . . . . . . . . . . . . . . . 22,347 4,264 1,746Midwest . . . . . . . . . . . . . . . . . . . . . . . . . . . . . . . . . 27,748 3,356 4,018South . . . . . . . . . . . . . . . . . . . . . . . . . . . . . . . . . . . 43,571 1,396 8,997West . . . . . . . . . . . . . . . . . . . . . . . . . . . . . . . . . . . . 25,450 811 4,443
METROPOLITAN/NONMETROPOLITANAREAS
Inside metropolitan statistical areas . . . . . . . . . 93,058 6,794 14,957In central cities of MSAs. . . . . . . . . . . . . . . . . 35,076 3,771 3,403Suburbs . . . . . . . . . . . . . . . . . . . . . . . . . . . . . . . 57,983 3,024 11,554
Outside metropolitan statistical areas . . . . . . . 26,058 3,032 4,247
URBAN/RURAL STATUS
Urban . . . . . . . . . . . . . . . . . . . . . . . . . . . . . . . . . . . 86,657 6,774 11,491Rural. . . . . . . . . . . . . . . . . . . . . . . . . . . . . . . . . . . . 32,460 3,052 7,713
UNITS IN STRUCTURE
1, detached . . . . . . . . . . . . . . . . . . . . . . . . . . . . . . 73,427 6,190 11,1181, attached . . . . . . . . . . . . . . . . . . . . . . . . . . . . . . 8,428 683 1,6672 to 4 . . . . . . . . . . . . . . . . . . . . . . . . . . . . . . . . . . . 9,354 1,687 6965 to 9 . . . . . . . . . . . . . . . . . . . . . . . . . . . . . . . . . . . 5,682 518 62910 to 19 . . . . . . . . . . . . . . . . . . . . . . . . . . . . . . . . . 5,367 263 93820 to 49 . . . . . . . . . . . . . . . . . . . . . . . . . . . . . . . . . 3,898 329 57450 or more. . . . . . . . . . . . . . . . . . . . . . . . . . . . . . . 4,084 157 396Manufactured/mobile home . . . . . . . . . . . . . . . . 8,876 – 3,187
See footnotes at end of table.
APPENDIXES

24 U.S. Census Bureau
Table A1.Characteristics of Occupied and Vacant Housing Units byYear Built: 2001 — Con. (In thousands. Data based on sample. For information on confidentiality protection, sam−pling error, nonsampling error, and definitions, see www.census.gov/hhes/www/ahs.html)
Characteristic All housingunits
Built before1920
Built 1990or later
YEAR BUILT
2000 to 2001. . . . . . . . . . . . . . . . . . . . . . . . . . . . . 3,119 – 3,1191990 to 1999. . . . . . . . . . . . . . . . . . . . . . . . . . . . . 16,086 – 16,0861980 to 1989. . . . . . . . . . . . . . . . . . . . . . . . . . . . . 16,542 – –1970 to 1979. . . . . . . . . . . . . . . . . . . . . . . . . . . . . 23,529 – –1960 to 1969. . . . . . . . . . . . . . . . . . . . . . . . . . . . . 15,894 – –1950 to 1959. . . . . . . . . . . . . . . . . . . . . . . . . . . . . 13,779 – –1940 to 1949. . . . . . . . . . . . . . . . . . . . . . . . . . . . . 8,284 – –1930 to 1939. . . . . . . . . . . . . . . . . . . . . . . . . . . . . 6,593 – –1920 to 1929. . . . . . . . . . . . . . . . . . . . . . . . . . . . . 5,465 – –1919 or earlier . . . . . . . . . . . . . . . . . . . . . . . . . . . 9,827 9,827 –
PLUMBING
With all plumbing facilities . . . . . . . . . . . . . . . . . 116,589 9,447 19,055Lacking some or all plumbing facilities2. . . . . . 2,527 380 149
No hot piped water . . . . . . . . . . . . . . . . . . . . . 1,297 231 99No bathtub and no shower. . . . . . . . . . . . . . . 1,022 205 62No flush toilet . . . . . . . . . . . . . . . . . . . . . . . . . . 976 187 66No exclusive use . . . . . . . . . . . . . . . . . . . . . . . 1,090 112 43
MAIN HEATING EQUIPMENT
Warm−air furnace. . . . . . . . . . . . . . . . . . . . . . . . . 71,804 4,943 13,122Steam or hot water system . . . . . . . . . . . . . . . . 14,420 2,996 749Electric heat pump. . . . . . . . . . . . . . . . . . . . . . . . 12,693 128 3,947Built−in electric units. . . . . . . . . . . . . . . . . . . . . . 5,929 300 534Floor, wall, or other built−in hot−air unitswithout ducts. . . . . . . . . . . . . . . . . . . . . . . . . . . . 6,133 462 410
Room heaters with flue. . . . . . . . . . . . . . . . . . . . 1,856 322 113Room heaters without flue . . . . . . . . . . . . . . . . . 1,916 180 37Portable electric heaters. . . . . . . . . . . . . . . . . . . 893 58 49Stoves . . . . . . . . . . . . . . . . . . . . . . . . . . . . . . . . . . 1,501 232 107Fireplaces with inserts . . . . . . . . . . . . . . . . . . . . 175 14 21Fireplaces without inserts. . . . . . . . . . . . . . . . . . 99 9 4Other . . . . . . . . . . . . . . . . . . . . . . . . . . . . . . . . . . . 467 45 30Cooking stove. . . . . . . . . . . . . . . . . . . . . . . . . . . . 213 23 17None. . . . . . . . . . . . . . . . . . . . . . . . . . . . . . . . . . . . 1,017 114 65
PRIMARY SOURCE OF WATER
Public system or private company . . . . . . . . . . 102,924 8,125 16,084Well serving 1 to 5 units . . . . . . . . . . . . . . . . . . . 15,337 1,575 3,001
Drilled . . . . . . . . . . . . . . . . . . . . . . . . . . . . . . . . . 13,315 1,256 2,766Dug . . . . . . . . . . . . . . . . . . . . . . . . . . . . . . . . . . . 1,184 198 149Not reported . . . . . . . . . . . . . . . . . . . . . . . . . . . 838 121 87
Other . . . . . . . . . . . . . . . . . . . . . . . . . . . . . . . . . . . 855 127 119
– Not applicable.
1Excludes Usual Residence Elsewhere units.2Figure may not add to total, because more than one category may apply to unit.
Source: U.S. Census Bureau, 2001 American Housing Survey, National sample.

U.S. Census Bureau 25
Table A2.Characteristics of Occupied Units by Year Built: 2001(In thousands. Data for occupied housing units. Data based on sample. For information on confidentiality protection, sampling error,nonsampling error, and definitions, see www.census.gov/hhes/www/ahs.html)
Characteristic
Occupied housing units Built before 1920 Built 1990 or later
TotalOwner
occupiedRenter
occupied TotalOwner
occupiedRenter
occupied TotalOwner
occupiedRenter
occupied
Total. . . . . . . . . . . . . . . . . . . . . . . . 106,261 72,265 33,996 8,630 5,195 3,435 17,115 13,665 3,450
METROPOLITAN/NONMETROPOLITAN AREAS
Inside metropolitan statistical areas. 85,304 56,290 29,014 6,058 3,336 2,721 13,605 10,763 2,842In central cities. . . . . . . . . . . . . . . . . 31,731 16,870 14,861 3,297 1,461 1,835 2,999 1,962 1,038Suburbs . . . . . . . . . . . . . . . . . . . . . . . 53,574 39,420 14,153 2,761 1,875 886 10,606 8,801 1,805
Outside metropolitan areas . . . . . . . . 20,957 15,975 4,982 2,572 1,859 713 3,510 2,902 608
REGIONS
Northeast. . . . . . . . . . . . . . . . . . . . . . . . 20,321 12,987 7,334 3,837 2,010 1,827 1,587 1,327 260Midwest . . . . . . . . . . . . . . . . . . . . . . . . . 24,758 18,049 6,709 2,955 2,019 936 3,582 2,928 654South . . . . . . . . . . . . . . . . . . . . . . . . . . 38,068 26,715 11,353 1,154 760 394 7,954 6,398 1,557West. . . . . . . . . . . . . . . . . . . . . . . . . . . . 23,115 14,514 8,600 684 406 277 3,991 3,012 979
TENURE
Owner occupied. . . . . . . . . . . . . . . . . . 72,265 72,265 – 5,195 5,195 – 13,665 13,665 –Percent of all occupied. . . . . . . . . . 68.0 100.0 – 60.2 100.0 – 79.8 100.0 –
Renter occupied. . . . . . . . . . . . . . . . . . 33,996 – 33,996 3,435 – 3,435 3,450 – 3,450
FIRST TIME OWNERS
First home ever owned. . . . . . . . . . . . 31,239 31,239 – 2,992 2,992 – 3,958 3,958 –Not first home. . . . . . . . . . . . . . . . . . . . 39,702 39,702 – 2,128 2,128 – 9,400 9,400 –Not reported . . . . . . . . . . . . . . . . . . . . . 1,324 1,324 – 75 75 – 307 307 –
COOPERATIVES ANDCONDOMINIUMS
Cooperatives . . . . . . . . . . . . . . . . . . . . 571 396 175 54 46 7 32 21 11Condominiums . . . . . . . . . . . . . . . . . . . 4,745 3,407 1,338 77 38 40 966 812 153
UNITS IN STRUCTURE
1, detached. . . . . . . . . . . . . . . . . . . . . . 67,129 59,239 7,890 5,487 4,523 964 10,301 9,888 4141, attached . . . . . . . . . . . . . . . . . . . . . . 7,305 3,722 3,583 586 313 273 1,427 869 5582 to 4 . . . . . . . . . . . . . . . . . . . . . . . . . . . 8,200 1,291 6,909 1,441 276 1,165 595 81 5145 to 9 . . . . . . . . . . . . . . . . . . . . . . . . . . . 4,994 503 4,490 444 28 416 530 97 43310 to 19 . . . . . . . . . . . . . . . . . . . . . . . . . 4,620 502 4,118 240 20 220 755 119 63620 to 49 . . . . . . . . . . . . . . . . . . . . . . . . . 3,253 391 2,862 300 22 278 407 38 36950 or more . . . . . . . . . . . . . . . . . . . . . . 3,543 615 2,927 131 14 118 279 33 246Manufactured/mobile home . . . . . . . . 7,219 6,001 1,218 – – – 2,820 2,541 279
YEAR STRUCTURE BUILT
2000 to 2001 . . . . . . . . . . . . . . . . . . . . 2,573 2,094 479 – – – 2,573 2,094 4791990 to 1999 . . . . . . . . . . . . . . . . . . . . 14,542 11,571 2,971 – – – 14,542 11,571 2,9711980 to 1989 . . . . . . . . . . . . . . . . . . . . 14,833 9,700 5,133 – – – – – –1970 to 1979 . . . . . . . . . . . . . . . . . . . . 20,917 13,868 7,048 – – – – – –1960 to 1969 . . . . . . . . . . . . . . . . . . . . 14,396 9,741 4,655 – – – – – –1950 to 1959 . . . . . . . . . . . . . . . . . . . . 12,501 9,068 3,433 – – – – – –1940 to 1949 . . . . . . . . . . . . . . . . . . . . 7,278 4,775 2,504 – – – – – –1930 to 1939 . . . . . . . . . . . . . . . . . . . . 5,728 3,403 2,325 – – – – – –1920 to 1929 . . . . . . . . . . . . . . . . . . . . 4,863 2,850 2,014 – – – – – –1919 or earlier . . . . . . . . . . . . . . . . . . . 8,630 5,195 3,434 8,630 5,195 3,434 – – –
STORIES IN STRUCTURE1
1 . . . . . . . . . . . . . . . . . . . . . . . . . . . . . . . 34,145 25,665 8,480 934 608 326 4,860 4,080 7802 . . . . . . . . . . . . . . . . . . . . . . . . . . . . . . . 34,824 22,418 12,406 2,116 1,272 845 5,436 4,260 1,1753 . . . . . . . . . . . . . . . . . . . . . . . . . . . . . . . 22,942 15,403 7,539 3,987 2,643 1,345 3,587 2,584 1,0034 to 6 . . . . . . . . . . . . . . . . . . . . . . . . . . . 5,208 2,312 2,896 1,498 650 849 318 171 1477 or more . . . . . . . . . . . . . . . . . . . . . . . 1,925 466 1,458 94 24 70 94 29 65
See footnotes at end of table.

26 U.S. Census Bureau
Characteristics of Occupied Units by Year Built: 2001 — Con.(In thousands. Data for occupied housing units. Data based on sample. For information on confidentiality protection, sampling error,nonsampling error, and definitions, see www.census.gov/hhes/www/ahs.html)
Characteristic
Occupied housing units Built before 1920 Built 1990 or later
TotalOwner
occupiedRenter
occupied TotalOwner
occupiedRenter
occupied TotalOwner
occupiedRenter
occupied
FOUNDATION
1−unit building, excludingmanufactured/mobilehomes. . . . . . . . . . . . . . . . . . . . . 74,434 62,961 11,473 6,073 4,836 1,237 11,728 10,756 972
With basement under all ofbuilding . . . . . . . . . . . . . . . . . . . . . . . . 24,586 21,917 2,668 2,938 2,336 603 3,510 3,383 127
With basement under part ofbuilding . . . . . . . . . . . . . . . . . . . . . . . . 8,507 7,639 868 1,772 1,479 293 751 725 27
With crawl space . . . . . . . . . . . . . . . . . 18,840 15,574 3,266 1,126 884 241 2,182 2,031 151On concrete slab . . . . . . . . . . . . . . . . . 21,947 17,434 4,513 178 101 77 5,189 4,543 647Other . . . . . . . . . . . . . . . . . . . . . . . . . . . 554 396 158 59 36 23 95 75 20
ROOMS
1 room . . . . . . . . . . . . . . . . . . . . . . . . . . 394 16 378 117 ... 117 12 2 102 rooms . . . . . . . . . . . . . . . . . . . . . . . . . 993 87 906 133 7 126 52 9 433 rooms . . . . . . . . . . . . . . . . . . . . . . . . . 8,800 1,029 7,771 831 81 750 801 100 7004 rooms . . . . . . . . . . . . . . . . . . . . . . . . . 19,003 7,169 11,834 1,296 422 874 2,301 1,013 1,2885 rooms . . . . . . . . . . . . . . . . . . . . . . . . . 24,798 17,180 7,618 1,643 918 725 4,226 3,307 9206 rooms . . . . . . . . . . . . . . . . . . . . . . . . . 22,768 19,205 3,563 1,912 1,427 485 3,637 3,304 3337 rooms . . . . . . . . . . . . . . . . . . . . . . . . . 14,032 12,841 1,190 1,297 1,086 211 2,414 2,323 918 rooms . . . . . . . . . . . . . . . . . . . . . . . . . 8,137 7,736 401 680 614 66 1,781 1,744 379 rooms . . . . . . . . . . . . . . . . . . . . . . . . . 3,765 3,613 152 345 316 29 970 957 1310 rooms or more . . . . . . . . . . . . . . . . 3,571 3,388 183 377 324 52 921 907 13
BEDROOMS
None . . . . . . . . . . . . . . . . . . . . . . . . . . . 820 45 775 172 3 169 18 4 141 . . . . . . . . . . . . . . . . . . . . . . . . . . . . . . . 11,984 1,801 10,183 1,202 184 1,018 1,065 152 9132 . . . . . . . . . . . . . . . . . . . . . . . . . . . . . . . 29,281 14,717 14,564 2,294 1,105 1,189 3,513 1,923 1,5903 . . . . . . . . . . . . . . . . . . . . . . . . . . . . . . . 44,786 37,815 6,971 3,112 2,349 763 8,193 7,434 7594 or more . . . . . . . . . . . . . . . . . . . . . . . 19,391 17,887 1,504 1,851 1,556 295 4,326 4,152 174
COMPLETE BATHROOMS
None . . . . . . . . . . . . . . . . . . . . . . . . . . . 681 288 393 174 45 129 30 18 121 . . . . . . . . . . . . . . . . . . . . . . . . . . . . . . . 42,113 18,408 23,705 5,138 2,333 2,805 2,388 862 1,5261 and one−half . . . . . . . . . . . . . . . . . . . 16,548 13,062 3,486 1,460 1,270 191 1,227 901 3252 or more . . . . . . . . . . . . . . . . . . . . . . . 46,920 40,507 6,412 1,857 1,547 310 13,470 11,883 1,587
SQUARE FOOTAGE OF UNIT
Single detached andmanufactured/mobilehomes. . . . . . . . . . . . . . . . . . . . . 74,347 65,240 9,107 5,487 4,523 964 13,122 12,429 693
Less than 500 . . . . . . . . . . . . . . . . . . . 725 445 280 45 30 14 94 70 24500 to 749. . . . . . . . . . . . . . . . . . . . . . . 2,080 1,317 764 133 83 49 124 91 33750 to 999. . . . . . . . . . . . . . . . . . . . . . . 5,542 4,162 1,380 249 160 89 550 461 881,000 to 1,499 . . . . . . . . . . . . . . . . . . . 18,306 15,488 2,818 1,115 861 254 2,594 2,358 2361,500 to 1,999 . . . . . . . . . . . . . . . . . . . 17,492 15,799 1,693 1,186 989 197 3,115 2,991 1232,000 to 2,499 . . . . . . . . . . . . . . . . . . . 11,699 11,043 656 918 821 97 2,272 2,203 692,500 to 2,999 . . . . . . . . . . . . . . . . . . . 5,955 5,685 271 485 424 62 1,385 1,365 193,000 to 3,999 . . . . . . . . . . . . . . . . . . . 5,231 5,036 195 489 449 40 1,374 1,356 194,000 or more. . . . . . . . . . . . . . . . . . . . 2,854 2,708 146 354 314 40 846 832 14Not reported . . . . . . . . . . . . . . . . . . . . . 4,463 3,558 905 515 393 122 769 702 67Median. . . . . . . . . . . . . . . . . . . . . . . . . . 1,737 1,798 1,298 1,898 1,971 1,538 1,952 1,982 1,355
See footnotes at end of table.
Table A2.

U.S. Census Bureau 27
Table A2.Characteristics of Occupied Units by Year Built: 2001 — Con. (In thousands. Data for occupied housing units. Data based on sample. For information on confidentiality protection, sampling error,nonsampling error, and definitions, see www.census.gov/hhes/www/ahs.html)
Characteristic
Occupied housing units Built before 1920 Built 1990 or later
TotalOwner
occupiedRenter
occupied TotalOwner
occupiedRenter
occupied TotalOwner
occupiedRenter
occupied
LOT SIZE2
1−unit structures . . . . . . . . . . . . 79,647 67,362 12,285 6,060 4,828 1,232 13,972 12,787 1,186Less than one−eighth acre . . . . . . . . 10,942 8,282 2,660 1,098 794 304 1,537 1,332 204One−eighth up to one−quarteracre . . . . . . . . . . . . . . . . . . . . . . . . . . . 22,041 18,027 4,013 1,584 1,243 340 3,130 2,769 361
One−quarter up to one−half acre . . . 15,846 13,980 1,866 905 737 168 2,954 2,758 196One−half up to one acre . . . . . . . . . . 10,497 9,200 1,297 589 458 131 1,918 1,799 1191 up to 5 acres. . . . . . . . . . . . . . . . . . . 14,197 12,483 1,713 1,048 888 160 3,174 2,963 2115 up to 10 acres . . . . . . . . . . . . . . . . . 2,352 2,157 195 234 213 22 584 545 3810 acres or more . . . . . . . . . . . . . . . . . 3,772 3,233 539 601 495 106 676 620 56Median (acres) . . . . . . . . . . . . . . . . . . . 0.36 0.38 0.23 0.35 0.38 0.24 0.45 0.46 0.29
PERSONS PER ROOM
0.50 or less. . . . . . . . . . . . . . . . . . . . . . 74,006 52,964 21,041 6,039 3,943 2,096 11,799 9,531 2,2670.51 to 1.00 . . . . . . . . . . . . . . . . . . . . . 29,595 18,316 11,279 2,363 1,178 1,185 5,073 3,982 1,0901.01 to 1.50 . . . . . . . . . . . . . . . . . . . . . 2,151 844 1,307 174 69 106 201 115 861.51 or more. . . . . . . . . . . . . . . . . . . . . 509 140 369 53 6 47 43 36 7
PERSONS PER BEDROOM
0.50 or less. . . . . . . . . . . . . . . . . . . . . . 24,458 19,140 5,318 2,247 1,664 583 3,285 2,716 5690.51 to 1.00 . . . . . . . . . . . . . . . . . . . . . 51,896 35,949 15,947 3,825 2,283 1,542 9,321 7,479 1,8421.01 to 1.50 . . . . . . . . . . . . . . . . . . . . . 16,173 11,494 4,679 1,261 816 445 3,120 2,645 4751.51 or more. . . . . . . . . . . . . . . . . . . . . 12,914 5,637 7,277 1,125 430 695 1,371 821 550No bedrooms . . . . . . . . . . . . . . . . . . . . 820 45 775 172 3 169 18 4 14
SQUARE FEET PER PERSON
Single detached andmanufactured/mobilehomes. . . . . . . . . . . . . . . . . . . . . 74,347 65,240 9,107 5,487 4,523 964 13,122 12,429 693
Less than 200 . . . . . . . . . . . . . . . . . . . 1,744 1,144 601 115 73 41 212 176 36200 to 299. . . . . . . . . . . . . . . . . . . . . . . 4,365 3,271 1,094 245 183 62 542 460 82300 to 399. . . . . . . . . . . . . . . . . . . . . . . 6,432 5,307 1,126 393 295 99 1,019 942 77400 to 499. . . . . . . . . . . . . . . . . . . . . . . 7,386 6,333 1,053 417 333 84 1,348 1,230 118500 to 599. . . . . . . . . . . . . . . . . . . . . . . 6,968 6,182 786 521 429 92 1,220 1,161 59600 to 699. . . . . . . . . . . . . . . . . . . . . . . 6,897 6,157 740 464 384 80 1,366 1,304 62700 to 799. . . . . . . . . . . . . . . . . . . . . . . 5,704 5,206 497 284 234 51 1,100 1,069 31800 to 899. . . . . . . . . . . . . . . . . . . . . . . 4,485 4,142 344 293 247 46 1,055 1,031 24900 to 999. . . . . . . . . . . . . . . . . . . . . . . 4,142 3,748 395 284 234 51 756 729 271,000 to 1,499 . . . . . . . . . . . . . . . . . . . 12,137 11,199 938 853 733 119 2,182 2,113 691,500 or more. . . . . . . . . . . . . . . . . . . . 9,623 8,994 629 1,103 986 117 1,553 1,512 40Not reported . . . . . . . . . . . . . . . . . . . . . 4,463 3,558 905 515 393 122 769 702 67Median. . . . . . . . . . . . . . . . . . . . . . . . . . 720 747 529 816 855 654 743 755 500
EQUIPMENT3
Lacking complete kitchenfacilities . . . . . . . . . . . . . . . . . . . . . . . . 1,646 380 1,266 310 45 265 147 50 97
With complete kitchen (sink,refrigerator, and oven or burners) . 104,615 71,885 32,730 8,320 5,150 3,169 16,968 13,615 3,353
Kitchen sink . . . . . . . . . . . . . . . . . . . . . 105,929 72,176 33,753 8,526 5,183 3,343 17,083 13,648 3,435Refrigerator. . . . . . . . . . . . . . . . . . . . . . 105,859 72,091 33,768 8,551 5,175 3,376 17,080 13,640 3,441Cooking stove or range . . . . . . . . . . . 105,358 71,863 33,495 8,451 5,145 3,306 17,030 13,609 3,420Burners, no stove or range . . . . . . . . 169 73 96 32 14 18 6 6 ...Microwave oven only . . . . . . . . . . . . . 399 222 177 55 15 39 46 30 16Dishwasher . . . . . . . . . . . . . . . . . . . . . . 62,352 48,852 13,501 2,919 2,428 491 14,567 11,918 2,649Washing machine . . . . . . . . . . . . . . . . 85,562 68,950 16,612 6,497 4,880 1,617 15,883 13,442 2,441Clothes dryer . . . . . . . . . . . . . . . . . . . . 81,591 66,752 14,840 5,986 4,640 1,346 15,686 13,279 2,408Disposal in kitchen sink . . . . . . . . . . . 48,604 34,329 14,276 1,540 1,213 326 10,932 8,559 2,373Trash compactor . . . . . . . . . . . . . . . . . 4,010 3,305 706 163 142 21 865 735 129
See footnotes at end of table.

28 U.S. Census Bureau
Table A2.Characteristics of Occupied Units by Year Built: 2001 — Con.(In thousands. Data for occupied housing units. Data based on sample. For information on confidentiality protection, sampling error,nonsampling error, and definitions, see www.census.gov/hhes/www/ahs.html)
Characteristic
Occupied housing units Built before 1920 Built 1990 or later
TotalOwner
occupiedRenter
occupied TotalOwner
occupiedRenter
occupied TotalOwner
occupiedRenter
occupied
EQUIPMENT3—Con.
Air conditioning:Central . . . . . . . . . . . . . . . . . . . . . . . . 60,118 45,494 14,624 1,869 1,490 379 14,011 11,439 2,5721 room unit . . . . . . . . . . . . . . . . . . . . 15,431 7,888 7,542 2,193 1,058 1,135 929 628 3012 room units or more . . . . . . . . . . . 11,132 7,631 3,500 1,802 1,169 633 450 329 120
MAIN HEATING EQUIPMENT
Warm−air furnace . . . . . . . . . . . . . . . . 65,262 47,867 17,395 4,414 3,067 1,347 11,870 9,780 2,090Steam or hot water system . . . . . . . . 13,441 7,801 5,640 2,773 1,361 1,412 684 521 163Electric heat pump . . . . . . . . . . . . . . . 11,080 8,099 2,981 98 66 32 3,444 2,730 714Built−in electric units. . . . . . . . . . . . . . 5,063 2,385 2,678 254 103 151 433 179 254Floor, wall, or other built−in hot−airunits without ducts . . . . . . . . . . . . . . 5,343 2,365 2,978 374 205 169 348 197 150
Room heaters with flue . . . . . . . . . . . 1,542 866 676 277 122 155 89 60 29Room heaters without flue. . . . . . . . . 1,558 1,019 539 142 92 50 32 26 6Portable electric heaters . . . . . . . . . . 746 390 356 43 19 24 38 23 14Stoves . . . . . . . . . . . . . . . . . . . . . . . . . . 1,131 917 214 183 134 49 90 77 13Fireplaces with inserts . . . . . . . . . . . . 145 121 24 8 5 3 19 14 5Fireplaces without inserts . . . . . . . . . 64 49 15 9 5 4 4 4 ...Other . . . . . . . . . . . . . . . . . . . . . . . . . . . 292 163 128 25 9 16 23 23 ...Cooking stove . . . . . . . . . . . . . . . . . . . 193 74 118 22 7 15 15 11 4None . . . . . . . . . . . . . . . . . . . . . . . . . . . 401 146 255 8 ... 8 26 18 8
OTHER HEATING EQUIPMENT3
Warm−air furnace . . . . . . . . . . . . . . . . 1,098 837 261 91 79 12 159 133 26Steam or hot water system . . . . . . . . 381 186 195 69 37 33 13 10 2Electric heat pump . . . . . . . . . . . . . . . 586 529 58 25 23 2 143 140 4Built−in electric units. . . . . . . . . . . . . . 2,914 2,230 684 277 208 69 251 192 59Floor, wall, or other built−in hot−airunits without ducts . . . . . . . . . . . . . . 280 201 78 13 13 1 31 21 10
Room heaters with flue . . . . . . . . . . . 882 761 121 131 100 31 86 80 7Room heaters without flue. . . . . . . . . 1,894 1,545 349 220 167 53 241 229 12Portable electric heaters . . . . . . . . . . 8,373 6,318 2,055 896 621 274 811 721 90Stoves . . . . . . . . . . . . . . . . . . . . . . . . . . 4,834 4,385 449 494 428 66 450 423 26Fireplaces with inserts . . . . . . . . . . . . 4,937 4,423 514 215 188 27 1,124 1,051 73Fireplaces without inserts . . . . . . . . . 4,055 3,412 644 200 156 44 979 892 87Other . . . . . . . . . . . . . . . . . . . . . . . . . . . 674 574 100 64 60 5 78 67 12Cooking stove . . . . . . . . . . . . . . . . . . . 1,249 766 483 100 58 42 131 108 23None . . . . . . . . . . . . . . . . . . . . . . . . . . . 79,292 50,680 28,612 6,370 3,508 2,862 13,220 10,172 3,048
PLUMBING
With all plumbing facilities . . . . . . . . . 104,885 71,595 33,290 8,445 5,135 3,310 17,063 13,644 3,420Lacking some or all plumbingfacilities3 . . . . . . . . . . . . . . . . . . . . . . . 1,376 670 706 184 60 124 52 21 30No hot piped water . . . . . . . . . . . . . 292 135 157 64 11 53 12 9 3No bathtub and no shower . . . . . . 277 110 167 78 12 67 18 11 7No flush toilet . . . . . . . . . . . . . . . . . . 264 93 171 71 4 66 17 9 7No exclusive use . . . . . . . . . . . . . . . 1,022 526 497 97 44 53 33 10 23
PRIMARY SOURCE OF WATER
Public system or privatecompany . . . . . . . . . . . . . . . . . . . . . . . 92,576 60,126 32,451 7,201 4,018 3,184 14,299 11,001 3,298
Well serving 1 to 5 units . . . . . . . . . . 13,245 11,767 1,478 1,349 1,113 236 2,747 2,597 151Drilled. . . . . . . . . . . . . . . . . . . . . . . . . 11,698 10,520 1,178 1,091 913 178 2,542 2,403 139Dug. . . . . . . . . . . . . . . . . . . . . . . . . . . 1,035 892 142 163 149 15 149 145 4Not reported . . . . . . . . . . . . . . . . . . . 513 355 158 94 51 44 56 48 8
Other . . . . . . . . . . . . . . . . . . . . . . . . . . . 440 372 68 80 65 14 69 68 2
See footnotes at end of table.

U.S. Census Bureau 29
Table A2.Characteristics of Occupied Units by Year Built: 2001 — Con.(In thousands. Data for occupied housing units. Data based on sample. For information on confidentiality protection, sampling error,nonsampling error, and definitions, see www.census.gov/hhes/www/ahs.html)
Characteristic
Occupied housing units Built before 1920 Built 1990 or later
TotalOwner
occupiedRenter
occupied TotalOwner
occupiedRenter
occupied TotalOwner
occupiedRenter
occupied
SAFETY OF PRIMARY SOURCEOF WATER
Selected primary watersources4. . . . . . . . . . . . . . . . . . . 106,238 72,253 33,985 8,630 5,195 3,435 17,115 13,665 3,450
Safe to drink . . . . . . . . . . . . . . . . . . . . . 95,651 66,542 29,108 7,791 4,825 2,966 15,600 12,551 3,049Not safe to drink . . . . . . . . . . . . . . . . . 9,340 4,936 4,404 758 335 422 1,292 946 346Safety not reported . . . . . . . . . . . . . . . 1,247 775 472 81 36 46 223 168 55
MEANS OF SEWAGEDISPOSAL
Public sewer . . . . . . . . . . . . . . . . . . . . . 83,870 52,502 31,368 6,771 3,688 3,083 12,227 9,071 3,156Septic tank, cesspool, chemicaltoilet . . . . . . . . . . . . . . . . . . . . . . . . . . . 22,328 19,720 2,608 1,853 1,507 346 4,878 4,587 291
Other . . . . . . . . . . . . . . . . . . . . . . . . . . . 63 43 20 5 ... 5 10 6 3
MAIN HOUSE HEATING FUEL
Housing units with heatingfuel. . . . . . . . . . . . . . . . . . . . . . . . 105,860 72,118 33,742 8,622 5,195 3,426 17,089 13,647 3,442
Electricity. . . . . . . . . . . . . . . . . . . . . . . . 32,590 18,866 13,723 685 314 372 7,447 5,269 2,178Piped gas . . . . . . . . . . . . . . . . . . . . . . . 54,689 39,301 15,387 4,983 3,006 1,976 7,600 6,491 1,108Bottled gas . . . . . . . . . . . . . . . . . . . . . . 6,079 5,122 957 610 460 150 1,346 1,286 60Fuel oil. . . . . . . . . . . . . . . . . . . . . . . . . . 9,821 6,750 3,071 1,945 1,115 830 458 390 67Kerosene or other liquid fuel . . . . . . . 652 455 197 57 38 19 67 54 12Coal or coke . . . . . . . . . . . . . . . . . . . . . 128 113 15 40 38 2 6 6Wood . . . . . . . . . . . . . . . . . . . . . . . . . . . 1,688 1,404 284 286 221 65 147 131 16Solar energy . . . . . . . . . . . . . . . . . . . . . 21 17 5 ... ... ... 6 6 ...Other . . . . . . . . . . . . . . . . . . . . . . . . . . . 193 90 103 16 2 13 13 13 ...
OTHER HOUSE HEATINGFUELS3
With other heating fuel . . . . . . 25,991 20,984 5,007 2,187 1,642 545 3,787 3,406 382Electricity. . . . . . . . . . . . . . . . . . . . . . . . 11,903 8,953 2,950 1,168 818 350 1,235 1,051 183Piped gas . . . . . . . . . . . . . . . . . . . . . . . 4,420 3,653 767 328 242 87 1,099 1,017 82Bottled gas . . . . . . . . . . . . . . . . . . . . . . 1,347 1,239 108 148 132 17 332 321 11Fuel oil. . . . . . . . . . . . . . . . . . . . . . . . . . 721 474 247 85 58 27 68 48 20Kerosene or other liquid fuel . . . . . . . 1,087 894 193 142 107 35 144 144 ...Coal or coke . . . . . . . . . . . . . . . . . . . . . 122 109 13 20 20 ... 6 6 ...Wood . . . . . . . . . . . . . . . . . . . . . . . . . . . 9,870 8,606 1,265 693 583 110 1,277 1,167 110Solar energy . . . . . . . . . . . . . . . . . . . . . 33 33 ... 2 2 ... 2 2 ...Other . . . . . . . . . . . . . . . . . . . . . . . . . . . 474 413 61 10 10 ... 91 89 3
COOKING FUEL
With cooking fuel . . . . . . . . . . . 105,912 72,150 33,763 8,536 5,174 3,362 17,078 13,641 3,437Electricity. . . . . . . . . . . . . . . . . . . . . . . . 63,685 43,915 19,770 3,720 2,347 1,374 11,502 8,846 2,657Piped gas . . . . . . . . . . . . . . . . . . . . . . . 37,093 23,966 13,127 4,226 2,333 1,893 4,514 3,824 690Bottled gas . . . . . . . . . . . . . . . . . . . . . . 5,068 4,215 853 579 484 95 1,049 961 88Kerosene or other liquid fuel . . . . . . . 10 7 2 3 3 ... 5 5 ...Coal or coke . . . . . . . . . . . . . . . . . . . . . 3 3 ... ... ... ... ... ... ...Wood . . . . . . . . . . . . . . . . . . . . . . . . . . . 28 25 4 2 2 ... 6 4 2Other . . . . . . . . . . . . . . . . . . . . . . . . . . . 25 18 7 6 6 ... 2 2 ...
WATER HEATING FUELWith hot piped water . . . . . . . . 105,970 72,130 33,840 8,566 5,185 3,382 17,103 13,656 3,447
Electricity. . . . . . . . . . . . . . . . . . . . . . . . 41,573 27,306 14,267 2,147 1,395 752 8,202 6,123 2,079Piped gas . . . . . . . . . . . . . . . . . . . . . . . 54,573 37,922 16,650 4,918 2,921 1,997 7,664 6,404 1,260Bottled gas . . . . . . . . . . . . . . . . . . . . . . 3,949 3,267 682 478 384 94 894 848 46Fuel oil. . . . . . . . . . . . . . . . . . . . . . . . . . 5,528 3,421 2,107 987 464 522 307 254 54Kerosene or other liquid fuel . . . . . . . 22 7 15 2 ... 2 ... ... ...Coal or coke . . . . . . . . . . . . . . . . . . . . . 27 23 4 11 11 ... ... ... ...Wood . . . . . . . . . . . . . . . . . . . . . . . . . . . 37 28 9 5 2 2 6 6 ...Solar energy . . . . . . . . . . . . . . . . . . . . . 144 126 18 2 2 ... 11 11 ...Other . . . . . . . . . . . . . . . . . . . . . . . . . . . 116 30 86 17 5 12 19 11 8
See footnotes at end of table.
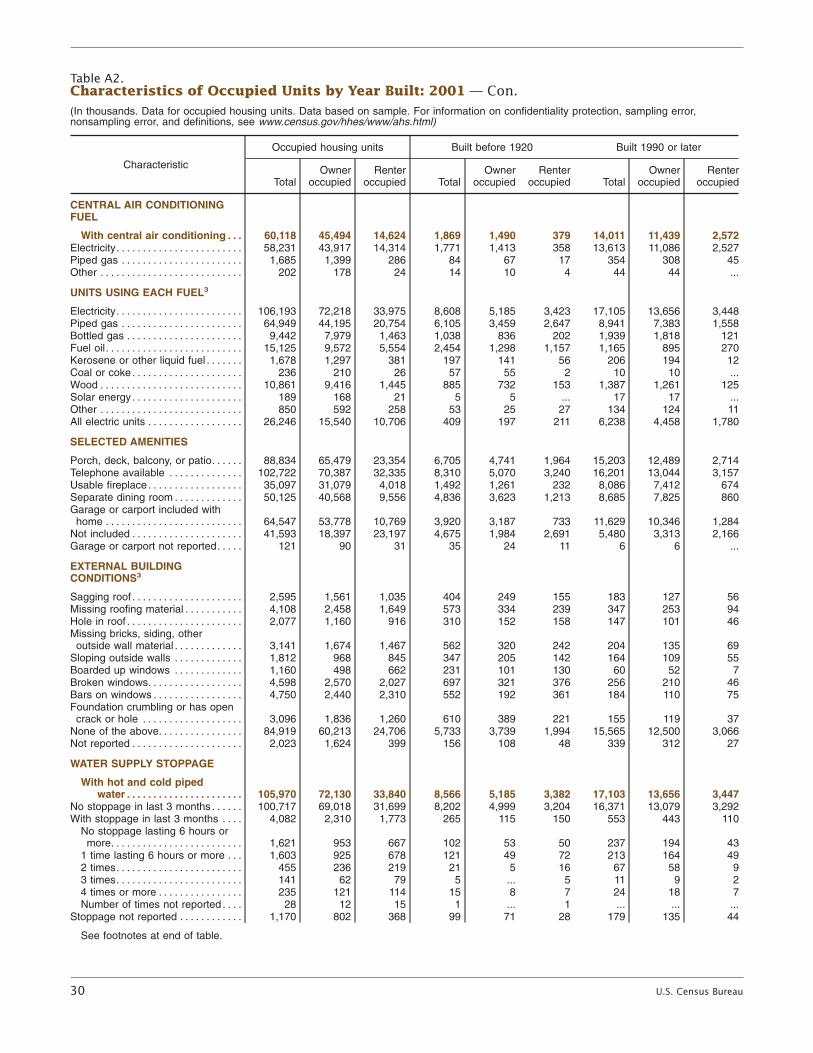
30 U.S. Census Bureau
Table A2.Characteristics of Occupied Units by Year Built: 2001 — Con.(In thousands. Data for occupied housing units. Data based on sample. For information on confidentiality protection, sampling error,nonsampling error, and definitions, see www.census.gov/hhes/www/ahs.html)
Characteristic
Occupied housing units Built before 1920 Built 1990 or later
TotalOwner
occupiedRenter
occupied TotalOwner
occupiedRenter
occupied TotalOwner
occupiedRenter
occupied
CENTRAL AIR CONDITIONINGFUEL
With central air conditioning . . . 60,118 45,494 14,624 1,869 1,490 379 14,011 11,439 2,572Electricity. . . . . . . . . . . . . . . . . . . . . . . . 58,231 43,917 14,314 1,771 1,413 358 13,613 11,086 2,527Piped gas . . . . . . . . . . . . . . . . . . . . . . . 1,685 1,399 286 84 67 17 354 308 45Other . . . . . . . . . . . . . . . . . . . . . . . . . . . 202 178 24 14 10 4 44 44 ...
UNITS USING EACH FUEL3
Electricity. . . . . . . . . . . . . . . . . . . . . . . . 106,193 72,218 33,975 8,608 5,185 3,423 17,105 13,656 3,448Piped gas . . . . . . . . . . . . . . . . . . . . . . . 64,949 44,195 20,754 6,105 3,459 2,647 8,941 7,383 1,558Bottled gas . . . . . . . . . . . . . . . . . . . . . . 9,442 7,979 1,463 1,038 836 202 1,939 1,818 121Fuel oil. . . . . . . . . . . . . . . . . . . . . . . . . . 15,125 9,572 5,554 2,454 1,298 1,157 1,165 895 270Kerosene or other liquid fuel . . . . . . . 1,678 1,297 381 197 141 56 206 194 12Coal or coke . . . . . . . . . . . . . . . . . . . . . 236 210 26 57 55 2 10 10 ...Wood . . . . . . . . . . . . . . . . . . . . . . . . . . . 10,861 9,416 1,445 885 732 153 1,387 1,261 125Solar energy . . . . . . . . . . . . . . . . . . . . . 189 168 21 5 5 ... 17 17 ...Other . . . . . . . . . . . . . . . . . . . . . . . . . . . 850 592 258 53 25 27 134 124 11All electric units . . . . . . . . . . . . . . . . . . 26,246 15,540 10,706 409 197 211 6,238 4,458 1,780
SELECTED AMENITIES
Porch, deck, balcony, or patio. . . . . . 88,834 65,479 23,354 6,705 4,741 1,964 15,203 12,489 2,714Telephone available . . . . . . . . . . . . . . 102,722 70,387 32,335 8,310 5,070 3,240 16,201 13,044 3,157Usable fireplace . . . . . . . . . . . . . . . . . . 35,097 31,079 4,018 1,492 1,261 232 8,086 7,412 674Separate dining room . . . . . . . . . . . . . 50,125 40,568 9,556 4,836 3,623 1,213 8,685 7,825 860Garage or carport included withhome . . . . . . . . . . . . . . . . . . . . . . . . . . 64,547 53,778 10,769 3,920 3,187 733 11,629 10,346 1,284
Not included . . . . . . . . . . . . . . . . . . . . . 41,593 18,397 23,197 4,675 1,984 2,691 5,480 3,313 2,166Garage or carport not reported. . . . . 121 90 31 35 24 11 6 6 ...
EXTERNAL BUILDINGCONDITIONS3
Sagging roof . . . . . . . . . . . . . . . . . . . . . 2,595 1,561 1,035 404 249 155 183 127 56Missing roofing material . . . . . . . . . . . 4,108 2,458 1,649 573 334 239 347 253 94Hole in roof . . . . . . . . . . . . . . . . . . . . . . 2,077 1,160 916 310 152 158 147 101 46Missing bricks, siding, otheroutside wall material . . . . . . . . . . . . . 3,141 1,674 1,467 562 320 242 204 135 69
Sloping outside walls . . . . . . . . . . . . . 1,812 968 845 347 205 142 164 109 55Boarded up windows . . . . . . . . . . . . . 1,160 498 662 231 101 130 60 52 7Broken windows. . . . . . . . . . . . . . . . . . 4,598 2,570 2,027 697 321 376 256 210 46Bars on windows . . . . . . . . . . . . . . . . . 4,750 2,440 2,310 552 192 361 184 110 75Foundation crumbling or has opencrack or hole . . . . . . . . . . . . . . . . . . . 3,096 1,836 1,260 610 389 221 155 119 37
None of the above. . . . . . . . . . . . . . . . 84,919 60,213 24,706 5,733 3,739 1,994 15,565 12,500 3,066Not reported . . . . . . . . . . . . . . . . . . . . . 2,023 1,624 399 156 108 48 339 312 27
WATER SUPPLY STOPPAGE
With hot and cold pipedwater . . . . . . . . . . . . . . . . . . . . . . 105,970 72,130 33,840 8,566 5,185 3,382 17,103 13,656 3,447
No stoppage in last 3 months . . . . . . 100,717 69,018 31,699 8,202 4,999 3,204 16,371 13,079 3,292With stoppage in last 3 months . . . . 4,082 2,310 1,773 265 115 150 553 443 110
No stoppage lasting 6 hours ormore. . . . . . . . . . . . . . . . . . . . . . . . . 1,621 953 667 102 53 50 237 194 43
1 time lasting 6 hours or more . . . 1,603 925 678 121 49 72 213 164 492 times. . . . . . . . . . . . . . . . . . . . . . . . 455 236 219 21 5 16 67 58 93 times. . . . . . . . . . . . . . . . . . . . . . . . 141 62 79 5 ... 5 11 9 24 times or more . . . . . . . . . . . . . . . . 235 121 114 15 8 7 24 18 7Number of times not reported . . . . 28 12 15 1 ... 1 ... ... ...
Stoppage not reported . . . . . . . . . . . . 1,170 802 368 99 71 28 179 135 44
See footnotes at end of table.

U.S. Census Bureau 31
Table A2.Characteristics of Occupied Units by Year Built: 2001 — Con.(In thousands. Data for occupied housing units. Data based on sample. For information on confidentiality protection, sampling error,nonsampling error, and definitions, see www.census.gov/hhes/www/ahs.html)
Characteristic
Occupied housing units Built before 1920 Built 1990 or later
TotalOwner
occupiedRenter
occupied TotalOwner
occupiedRenter
occupied TotalOwner
occupiedRenter
occupied
FLUSH TOILET BREAKDOWNS
With one or more flushtoilets . . . . . . . . . . . . . . . . . . . . . 105,998 72,172 33,826 8,559 5,191 3,368 17,098 13,656 3,443
With at least one working toilet atall times in last 3 months. . . . . . . . . 101,582 70,025 31,557 8,158 4,990 3,168 16,629 13,369 3,259
None working some time in last3 months . . . . . . . . . . . . . . . . . . . . . . . 3,000 1,210 1,790 257 110 147 280 145 135No breakdowns lasting 6 hoursor more . . . . . . . . . . . . . . . . . . . . . . 1,353 523 829 101 49 52 150 82 69
1 time lasting 6 hours or more . . . 1,089 508 581 106 46 59 95 45 502 times. . . . . . . . . . . . . . . . . . . . . . . . 249 76 174 16 5 11 16 9 83 times. . . . . . . . . . . . . . . . . . . . . . . . 128 40 88 11 2 9 7 5 24 times or more . . . . . . . . . . . . . . . . 170 61 109 24 8 16 12 5 7Number of times not reported . . . . 10 2 9 ... ... ... ... ... ...
Breakdowns not reported. . . . . . . . . . 1,416 937 479 145 91 54 189 141 48
SEWAGE DISPOSALBREAKDOWNS
With public sewer . . . . . . . . . . . 83,870 52,502 31,368 6,771 3,688 3,083 12,227 9,071 3,156No breakdowns in last 3 months . . . 82,405 51,724 30,680 6,649 3,630 3,019 12,152 9,018 3,134With breakdowns in last 3 months . . 1,466 778 688 123 58 64 75 53 22
No breakdowns lasting 6 hoursor more . . . . . . . . . . . . . . . . . . . . . . 546 302 244 57 35 22 30 20 10
1 time lasting 6 hours or more . . . 645 362 283 43 14 28 33 25 82 times. . . . . . . . . . . . . . . . . . . . . . . . 102 40 61 7 5 3 4 ... 43 times. . . . . . . . . . . . . . . . . . . . . . . . 68 25 43 6 ... 6 2 2 ...4 times or more . . . . . . . . . . . . . . . . 105 49 57 10 5 6 6 6 ...
With septic tank or cesspool. 22,323 19,717 2,606 1,853 1,507 346 4,878 4,587 291No breakdowns in last 3 months . . . 21,933 19,443 2,550 1,827 1,481 346 4,822 4,538 284With breakdowns in last 3 months . . 330 274 56 26 26 ... 56 50 7
No breakdowns lasting 6 hoursor more . . . . . . . . . . . . . . . . . . . . . . 123 103 20 5 5 ... 15 15 ...
1 time lasting 6 hours or more . . . 155 134 21 17 17 ... 22 22 ...2 times. . . . . . . . . . . . . . . . . . . . . . . . 14 12 2 2 2 ... 7 7 ...3 times. . . . . . . . . . . . . . . . . . . . . . . . 3 3 ... ... ... ... 3 3 ...4 times or more . . . . . . . . . . . . . . . . 36 23 14 2 2 ... 9 3 7
HEATING PROBLEMS
With heating equipmentand occupied last winter . . . 94,045 68,482 25,563 7,721 5,011 2,710 14,511 12,331 2,181
Not uncomfortably cold for 24 hoursor more last winter . . . . . . . . . . . . . . 85,592 63,549 22,043 6,700 4,510 2,190 13,504 11,517 1,987
Uncomfortably cold for 24 hours ormore last winter5 . . . . . . . . . . . . . . . . 7,072 4,071 3,001 894 433 461 795 668 127Equipment breakdowns . . . . . . . . . 2,391 1,289 1,103 312 125 188 236 187 49
No breakdowns lasting 6 hoursor more . . . . . . . . . . . . . . . . . . . . 140 89 51 14 11 3 7 5 2
1 time lasting 6 hours or more . 1,231 788 443 151 76 75 150 116 342 times. . . . . . . . . . . . . . . . . . . . . . 388 186 201 57 18 39 30 23 73 times. . . . . . . . . . . . . . . . . . . . . . 187 92 96 23 5 19 19 19 ...4 times or more . . . . . . . . . . . . . . 426 129 298 62 15 48 30 24 5Number of times not reported . . 18 5 14 5 ... 5 ... ... ...
See footnotes at end of table.

32 U.S. Census Bureau
Table A2.Characteristics of Occupied Units by Year Built: 2001 — Con.(In thousands. Data for occupied housing units. Data based on sample. For information on confidentiality protection, sampling error,nonsampling error, and definitions, see www.census.gov/hhes/www/ahs.html)
Characteristic
Occupied housing units Built before 1920 Built 1990 or later
TotalOwner
occupiedRenter
occupied TotalOwner
occupiedRenter
occupied TotalOwner
occupiedRenter
occupied
HEATING PROBLEMS—Con.
Other causes . . . . . . . . . . . . . . . . . . 4,900 2,889 2,011 633 315 318 576 498 78Utility interruption. . . . . . . . . . . . . 1,350 1,047 303 89 54 35 236 224 12Inadequate heating capacity . . . 1,063 443 621 184 73 111 60 44 16Inadequate insulation . . . . . . . . . 957 409 548 160 74 87 47 24 23Cost of heating. . . . . . . . . . . . . . . 991 613 378 141 79 62 111 91 19Other . . . . . . . . . . . . . . . . . . . . . . . 1,166 636 530 179 81 97 149 128 22Not reported . . . . . . . . . . . . . . . . . 67 37 30 8 5 3 8 8 ...
Reason for discomfort notreported. . . . . . . . . . . . . . . . . . . . . . 41 2 39 6 ... 6 ... ... ...
Discomfort not reported . . . . . . . . . . . 1,381 862 519 126 67 58 212 145 66
ELECTRIC FUSES ANDCIRCUIT BREAKERS
With electrical wiring . . . . . . . . 106,189 72,200 33,989 8,610 5,175 3,435 17,104 13,656 3,448No fuses or breakers blown in last3 months . . . . . . . . . . . . . . . . . . . . . . . 92,516 62,843 29,673 7,187 4,323 2,864 15,305 12,173 3,131
With fuses or breakers blown inlast 3 months . . . . . . . . . . . . . . . . . . . 11,390 7,876 3,514 1,234 747 487 1,477 1,241 2361 time. . . . . . . . . . . . . . . . . . . . . . . . . 6,038 4,369 1,669 585 383 202 923 770 1522 times. . . . . . . . . . . . . . . . . . . . . . . . 2,482 1,767 715 325 212 112 306 266 403 times. . . . . . . . . . . . . . . . . . . . . . . . 1,000 654 347 77 40 38 113 91 214 times or more . . . . . . . . . . . . . . . . 1,845 1,074 771 246 112 134 136 113 23Number of times not reported . . . . 25 13 13 ... ... ... ... ... ...
Problem not reported or don’tknow . . . . . . . . . . . . . . . . . . . . . . . . . . 2,283 1,481 802 189 105 84 323 242 81
SELECTED DEFICIENCIES3
Signs of rats in last 3 months . . . . . . 1,021 482 539 117 40 77 83 77 5Signs of mice in last 3 months . . . . . 7,086 4,379 2,707 1,130 599 532 739 607 131Signs of rodents, not sure whichkind in last 3 months . . . . . . . . . . . . 379 194 185 43 26 17 60 56 4
Holes in floors . . . . . . . . . . . . . . . . . . . 1,148 550 598 242 106 136 74 53 21Open cracks or holes (interior) . . . . . 5,697 2,896 2,801 877 413 465 514 391 123Broken plaster or peeling paint(interior). . . . . . . . . . . . . . . . . . . . . . . . 2,707 1,274 1,433 533 266 267 116 64 51
No electrical wiring . . . . . . . . . . . . . . . 72 65 7 20 20 ... 11 9 2Exposed wiring. . . . . . . . . . . . . . . . . . . 535 300 235 40 18 22 104 63 41Rooms without electric outlets . . . . . 1,308 706 602 180 81 100 167 117 50
WATER LEAKAGE DURINGLAST 12 MONTHS
No leakage from inside structure . . . 94,920 65,675 29,244 7,582 4,688 2,894 15,784 12,634 3,150With leakage from inside structure3. 9,985 5,649 4,336 921 422 500 1,146 892 254
Fixtures backed up or over−flowed . . . . . . . . . . . . . . . . . . . . . . . 3,057 1,757 1,300 307 164 143 305 252 53
Pipes leaked. . . . . . . . . . . . . . . . . . . 4,440 2,291 2,149 444 185 259 460 337 123Broken water heater . . . . . . . . . . . . 1,045 679 365 53 28 25 137 120 17Other or unknown (includes notreported) . . . . . . . . . . . . . . . . . . . . . 2,334 1,379 954 185 77 109 316 240 76
Interior leakage not reported . . . . . . . 1,357 940 416 126 86 41 185 139 46No leakage from outside structure . . 92,373 62,241 30,131 6,881 4,061 2,820 15,604 12,405 3,199With leakage from outsidestructure3 . . . . . . . . . . . . . . . . . . . . . . 12,536 9,086 3,450 1,625 1,054 571 1,323 1,119 204Roof . . . . . . . . . . . . . . . . . . . . . . . . . . 6,430 4,628 1,802 828 511 317 624 536 88Basement . . . . . . . . . . . . . . . . . . . . . 3,861 3,257 604 708 554 154 273 253 20Walls, closed windows, or doors . 2,552 1,530 1,022 240 122 117 372 297 75Other or unknown (includes notreported) . . . . . . . . . . . . . . . . . . . . . 1,319 847 472 104 43 60 192 165 27
Exterior leakage not reported . . . . . . 1,352 937 415 124 81 43 188 141 47
See footnotes at end of table.

U.S. Census Bureau 33
Table A2.Characteristics of Occupied Units by Year Built: 2001 — Con.(In thousands. Data for occupied housing units. Data based on sample. For information on confidentiality protection, sampling error,nonsampling error, and definitions, see www.census.gov/hhes/www/ahs.html)
Characteristic
Occupied housing units Built before 1920 Built 1990 or later
TotalOwner
occupiedRenter
occupied TotalOwner
occupiedRenter
occupied TotalOwner
occupiedRenter
occupied
OVERALL OPINION OFSTRUCTURE
1 (worst) . . . . . . . . . . . . . . . . . . . . . . . . 542 143 399 71 17 54 40 34 62 . . . . . . . . . . . . . . . . . . . . . . . . . . . . . . . 324 109 215 18 2 16 25 22 33 . . . . . . . . . . . . . . . . . . . . . . . . . . . . . . . 785 249 536 87 27 59 51 30 204 . . . . . . . . . . . . . . . . . . . . . . . . . . . . . . . 1,237 423 814 185 67 118 57 36 215 . . . . . . . . . . . . . . . . . . . . . . . . . . . . . . . 6,099 2,710 3,389 748 311 436 378 220 1586 . . . . . . . . . . . . . . . . . . . . . . . . . . . . . . . 5,606 2,857 2,750 632 301 331 491 348 1437 . . . . . . . . . . . . . . . . . . . . . . . . . . . . . . . 14,704 8,533 6,171 1,367 741 626 1,692 1,144 5488 . . . . . . . . . . . . . . . . . . . . . . . . . . . . . . . 29,082 20,204 8,879 2,305 1,500 806 4,200 3,130 1,0719 . . . . . . . . . . . . . . . . . . . . . . . . . . . . . . . 15,619 11,861 3,758 1,000 679 321 3,385 2,776 60910 (best) . . . . . . . . . . . . . . . . . . . . . . . . 28,421 22,420 6,000 1,906 1,343 563 6,146 5,354 792Not reported . . . . . . . . . . . . . . . . . . . . . 3,842 2,757 1,084 310 206 104 649 571 78
SELECTED PHYSICALPROBLEMS
Severe physical problems3 . . . . . . . . 2,126 948 1,178 325 106 219 110 75 36Plumbing . . . . . . . . . . . . . . . . . . . . . . 1,376 670 706 184 60 124 52 21 30Heating . . . . . . . . . . . . . . . . . . . . . . . 614 221 393 86 20 66 49 44 5Electric. . . . . . . . . . . . . . . . . . . . . . . . 79 57 22 27 15 12 13 12 2Upkeep . . . . . . . . . . . . . . . . . . . . . . . 111 29 82 39 13 26 6 6 ...Hallways . . . . . . . . . . . . . . . . . . . . . . 7 ... 7 ... ... ... ... ... ...
Moderate physical problems3 . . . . . . 4,537 2,009 2,528 656 244 412 272 132 139Plumbing . . . . . . . . . . . . . . . . . . . . . . 261 96 166 31 7 23 18 10 8Heating . . . . . . . . . . . . . . . . . . . . . . . 1,513 987 526 138 89 48 29 23 6Upkeep . . . . . . . . . . . . . . . . . . . . . . . 1,454 684 769 288 124 164 91 59 31Hallways . . . . . . . . . . . . . . . . . . . . . . 98 6 93 15 ... 15 6 ... 6Kitchen. . . . . . . . . . . . . . . . . . . . . . . . 1,443 326 1,116 242 42 199 132 42 90
OVERALL OPINION OFNEIGHBORHOOD
1 (worst) . . . . . . . . . . . . . . . . . . . . . . . . 801 320 481 96 37 59 79 51 282 . . . . . . . . . . . . . . . . . . . . . . . . . . . . . . . 695 310 384 89 44 46 42 32 103 . . . . . . . . . . . . . . . . . . . . . . . . . . . . . . . 1,213 548 665 136 67 69 121 79 434 . . . . . . . . . . . . . . . . . . . . . . . . . . . . . . . 1,801 871 930 201 97 104 160 98 635 . . . . . . . . . . . . . . . . . . . . . . . . . . . . . . . 7,013 3,693 3,320 772 382 390 651 435 2176 . . . . . . . . . . . . . . . . . . . . . . . . . . . . . . . 5,999 3,372 2,627 593 301 292 694 455 2397 . . . . . . . . . . . . . . . . . . . . . . . . . . . . . . . 14,439 8,969 5,470 1,267 699 568 1,951 1,451 5008 . . . . . . . . . . . . . . . . . . . . . . . . . . . . . . . 27,900 19,725 8,175 2,213 1,394 819 4,322 3,437 8859 . . . . . . . . . . . . . . . . . . . . . . . . . . . . . . . 16,008 11,844 4,164 1,093 733 360 3,124 2,591 53310 (best) . . . . . . . . . . . . . . . . . . . . . . . . 26,137 19,623 6,514 1,801 1,200 601 5,259 4,434 826No neighborhood . . . . . . . . . . . . . . . . . 321 221 100 54 39 14 48 43 4Not reported . . . . . . . . . . . . . . . . . . . . . 3,934 2,767 1,166 316 203 113 663 560 103
STREET NOISE OR TRAFFIC
Street noise or traffic present . . . . . . 29,889 17,572 12,318 3,755 2,071 1,684 2,951 2,077 873Condition not bothersome . . . . . . . 18,064 10,571 7,493 2,376 1,340 1,037 1,751 1,172 579Condition bothersome. . . . . . . . . . . 11,757 6,981 4,776 1,369 729 640 1,196 903 292
So bothered they want tomove . . . . . . . . . . . . . . . . . . . . . . 4,457 2,235 2,222 521 244 277 431 299 132
Not reported . . . . . . . . . . . . . . . . . 15 8 7 2 ... 2 ... ... ...Bothersome not reported . . . . . . . . 69 21 48 10 2 7 4 2 2
Not reported . . . . . . . . . . . . . . . . . . . . . 1,269 924 345 108 79 28 178 137 42
See footnotes at end of table.

34 U.S. Census Bureau
Table A2.Characteristics of Occupied Units by Year Built: 2001 — Con. (In thousands. Data for occupied housing units. Data based on sample. For information on confidentiality protection, sampling error,nonsampling error, and definitions, see www.census.gov/hhes/www/ahs.html)
Characteristic
Occupied housing units Built before 1920 Built 1990 or later
TotalOwner
occupiedRenter
occupied TotalOwner
occupiedRenter
occupied TotalOwner
occupiedRenter
occupied
NEIGHBORHOOD CRIME
Neighborhood crime present . . . . . . . 15,948 8,657 7,291 1,799 943 857 1,440 984 456Condition not bothersome . . . . . . . 6,675 3,746 2,928 728 368 360 638 437 201Condition bothersome. . . . . . . . . . . 9,215 4,888 4,327 1,067 572 494 796 547 249
So bothered they want tomove . . . . . . . . . . . . . . . . . . . . . . 3,934 1,538 2,397 460 201 259 264 147 117
Not reported . . . . . . . . . . . . . . . . . 25 12 13 ... ... ... ... ... –Bothersome not reported . . . . . . . . 59 22 36 5 2 3 6 ... 6
Not reported . . . . . . . . . . . . . . . . . . . . . 2,082 1,256 825 186 97 89 263 190 73
ODORS
Odors present . . . . . . . . . . . . . . . . . . . 6,462 3,771 2,691 780 434 346 737 565 172Condition not bothersome . . . . . . . 2,314 1,385 929 314 171 143 243 181 62Condition bothersome. . . . . . . . . . . 4,139 2,386 1,754 466 264 203 493 384 110
So bothered they want tomove . . . . . . . . . . . . . . . . . . . . . . 1,635 723 912 166 79 87 140 101 39
Not reported . . . . . . . . . . . . . . . . . 15 6...
10 ... ... ... ... ... ...Bothersome not reported . . . . . . . . 9
Not reported . . . . . . . . . . . . . . . . . . . . . 1,305 945 361 115 80 36 183 149 34
OTHER BOTHERSOMENEIGHBORHOOD CONDITIONS
No other problems. . . . . . . . . . . . . . . . 89,679 61,184 28,496 7,114 4,262 2,851 14,660 11,708 2,953With other problems3 . . . . . . . . . . . . . 14,971 9,975 4,996 1,368 840 527 2,203 1,761 443
Noise . . . . . . . . . . . . . . . . . . . . . . . . . 2,652 1,554 1,098 276 154 122 279 189 89Litter or housing deterioration . . . . 1,980 1,324 656 258 183 75 144 116 28Poor city or county services . . . . . 929 605 323 108 79 29 119 93 26Undesirable commercial,institutional, industrial . . . . . . . . . . 826 552 274 123 78 45 99 80 19
People . . . . . . . . . . . . . . . . . . . . . . . . 4,075 2,410 1,665 437 235 202 436 317 119Other . . . . . . . . . . . . . . . . . . . . . . . . . 8,193 5,628 2,565 679 414 264 1,421 1,181 240No problem. . . . . . . . . . . . . . . . . . . . 155 95 59 11 6 4 29 19 10Type of problem not reported . . . . 342 233 108 33 20 13 41 37 4
Other problems not reported . . . . . . . 1,611 1,106 505 148 93 56 251 197 55
PUBLIC ELEMENTARY SCHOOL3
Households with childrenaged 5−15 . . . . . . . . . . . . . . . . . 27,641 19,350 8,291 2,069 1,269 800 5,571 4,805 766
Attend public school (K−12). . . . . . . . 23,704 16,265 7,440 1,754 1,041 713 4,783 4,101 682Attend private school (K−12). . . . . . . 3,112 2,567 545 232 189 42 623 559 64Attend ungraded school, preschool,etc . . . . . . . . . . . . . . . . . . . . . . . . . . . . 287 170 117 21 9 12 77 58 19
Home schooled . . . . . . . . . . . . . . . . . . 366 292 74 48 31 17 79 79 ...
......
Not in school . . . . . . . . . . . . . . . . . . . . 479 265 213 52 18 34 101 77 23Not reported . . . . . . . . . . . . . . . . . . . . . 657 486 170 49 33 15 138 125 13
Households with anychildren aged 0−13 . . . . . . . . . 31,381 21,003 10,379 2,346 1,329 1,017 6,515 5,536 979
Satisfactory public elementaryschool . . . . . . . . . . . . . . . . . . . . . . . . . 24,482 16,889 7,593 1,799 1,037 762 5,191 4,483 708
Unsatisfactory public elementaryschool . . . . . . . . . . . . . . . . . . . . . . . . . 2,130 1,481 649 200 129 71 387 327 60So bothered they want to move . . 893 510 384 84 45 38 132 91 42Not reported . . . . . . . . . . . . . . . . . . . 15 7 8 3 3 2 2
Not reported or don’t know . . . . . . . . 4,769 2,633 2,137 347 162 184 938 727 211Public elementary school less than1 mile. . . . . . . . . . . . . . . . . . . . . . . . . . 17,830 11,112 6,719 1,508 792 716 2,609 2,132 477
Public elementary school 1 mile ormore. . . . . . . . . . . . . . . . . . . . . . . . . . . 12,450 9,280 3,170 780 501 279 3,702 3,243 459
Not reported . . . . . . . . . . . . . . . . . . . . . 1,100 611 489 57 35 22 205 161 43
See footnotes at end of table.
9 ... ... ... ... ... ...

U.S. Census Bureau 35
Table A2.Characteristics of Occupied Units by Year Built: 2001 — Con.(In thousands. Data for occupied housing units. Data based on sample. For information on confidentiality protection, sampling error,nonsampling error, and definitions, see www.census.gov/hhes/www/ahs.html)
Characteristic
Occupied housing units Built before 1920 Built 1990 or later
TotalOwner
occupiedRenter
occupied TotalOwner
occupiedRenter
occupied TotalOwner
occupiedRenter
occupied
BUILDING NEIGHBOR NOISE6
Neighbor noise present . . . . . . . . . . . 18,409 3,119 15,290 1,834 316 1,518 2,233 479 1,754Loudness bothersome . . . . . . . . . . 5,382 606 4,775 509 54 455 544 72 472Loudness not bothersome . . . . . . . 13,001 2,510 10,491 1,314 262 1,053 1,688 407 1,280Loudness bothersome notreported. . . . . . . . . . . . . . . . . . . . . . 26 2 24 10 ... 10 2 ... 2
Time of noise bothersome . . . . . . . 5,507 629 4,878 524 60 464 584 82 502Time of noise not bothersome . . . 12,876 2,490 10,386 1,300 256 1,044 1,645 397 1,248Time bothersome not reported . . . 26 ... 26 10 ... 10 4 ... 4
Neighbor noise not present . . . . . . . . 12,865 3,758 9,108 1,248 337 911 1,706 748 958Not reported . . . . . . . . . . . . . . . . . . . . . 640 148 492 61 20 41 55 9 45
PUBLIC TRANSPORTATION
With public transportation . . . . . . . . . 58,642 34,434 24,208 5,257 2,656 2,601 6,199 4,275 1,925Household uses it at least
weekly . . . . . . . . . . . . . . . . . . . . . . . 11,609 4,291 7,317 1,672 573 1,098 684 356 328Satisfactory public trans−portation . . . . . . . . . . . . . . . . . . . 10,817 3,956 6,860 1,596 537 1,060 629 328 301
Unsatisfactory public trans−portation . . . . . . . . . . . . . . . . . . . 639 234 405 66 28 38 36 9 27
Not reported . . . . . . . . . . . . . . . . . 153 101 52 9 9 ... 20 20 ...Household uses it less thanweekly . . . . . . . . . . . . . . . . . . . . . . . 9,366 5,485 3,880 907 473 434 822 541 281Satisfactory public trans−portation . . . . . . . . . . . . . . . . . . . 8,189 4,707 3,482 805 416 389 668 442 227
Unsatisfactory public trans−portation . . . . . . . . . . . . . . . . . . . 634 419 215 56 29 27 91 58 33
Not reported . . . . . . . . . . . . . . . . . 543 360 183 46 28 18 63 42 21Household does not use . . . . . . . . 36,699 24,167 12,532 2,576 1,567 1,009 4,588 3,319 1,269Not reported . . . . . . . . . . . . . . . . . . . 969 490 478 103 43 60 105 57 48
No public transportation . . . . . . . . . . . 44,409 35,683 8,726 3,178 2,420 758 10,179 8,843 1,336Not reported . . . . . . . . . . . . . . . . . . . . . 3,210 2,148 1,062 194 119 76 737 547 189
NEIGHBORHOOD SHOPPING
Satisfactory neighborhoodshopping . . . . . . . . . . . . . . . . . . . . . . . 87,388 57,899 29,489 6,780 3,892 2,888 13,554 10,551 3,003Less than 1 mile . . . . . . . . . . . . . . . 66,423 40,628 25,795 5,599 3,011 2,587 8,382 5,870 2,5131 mile or more . . . . . . . . . . . . . . . . . 20,802 17,174 3,628 1,169 870 299 5,147 4,663 484Not reported . . . . . . . . . . . . . . . . . . . 163 97 66 12 10 2 24 18 6
Unsatisfactory neighborhoodshopping . . . . . . . . . . . . . . . . . . . . . . . 17,090 13,114 3,976 1,657 1,177 480 3,274 2,884 390
Not reported or don’t know . . . . . . . . 1,783 1,252 531 193 126 66 287 231 57
POLICE PROTECTION
Satisfactory police protection . . . . . . 95,179 64,906 30,273 7,646 4,582 3,064 15,228 12,162 3,067Unsatisfactory police protection . . . . 7,594 5,146 2,448 693 435 258 1,267 1,036 231Not reported . . . . . . . . . . . . . . . . . . . . . 3,488 2,213 1,275 291 178 113 620 468 153
See footnotes at end of table.

36 U.S. Census Bureau
Table A2.Characteristics of Occupied Units by Year Built: 2001 — Con.(In thousands. Data for occupied housing units. Data based on sample. For information on confidentiality protection, sampling error,nonsampling error, and definitions, see www.census.gov/hhes/www/ahs.html)
Characteristic
Occupied housing units Built before 1920 Built 1990 or later
TotalOwner
occupiedRenter
occupied TotalOwner
occupiedRenter
occupied TotalOwner
occupiedRenter
occupied
DESCRIPTION OF AREAWITHIN 300 FEET3
Single−family detached houses . . . . 83,966 61,052 22,914 6,695 4,236 2,459 13,160 11,167 1,993Single−family attached. . . . . . . . . . . . 13,297 6,604 6,693 1,175 533 642 2,043 1,246 7971−to 3−story multiunit . . . . . . . . . . . . . 25,204 7,630 17,574 2,813 1,137 1,677 2,685 695 1,9904−to 6−story multiunit . . . . . . . . . . . . . 5,725 1,456 4,269 1,070 226 844 324 102 2227−or−more story multiunit . . . . . . . . . 2,845 692 2,153 356 67 289 201 62 139Manufactured/mobile homes . . . . . . . 12,525 9,784 2,741 640 497 143 2,935 2,516 418Commercial or institutional . . . . . . . . 27,415 12,126 15,290 3,560 1,608 1,952 2,707 1,365 1,342Industrial or factories . . . . . . . . . . . . . 3,752 1,713 2,038 617 317 300 342 196 146Open space, park, woods, farm,
or ranch. . . . . . . . . . . . . . . . . . . . . . . . . 38,267 27,745 10,523 3,093 2,059 1,034 8,007 6,730 1,2774−or−more lane highway, railroad
or airport . . . . . . . . . . . . . . . . . . . . . . . 13,239 6,703 6,536 1,218 627 591 1,709 950 758Not reported . . . . . . . . . . . . . . . . . . . . . 2,004 1,637 368 150 112 38 359 330 30
AGE OF OTHER RESIDENTIALBUILDINGS WITHIN 300 FEET
Older . . . . . . . . . . . . . . . . . . . . . . . . . . . 12,448 7,340 5,108 2,409 1,517 892 631 447 184About the same . . . . . . . . . . . . . . . . . . 68,250 46,863 21,386 4,510 2,558 1,952 9,576 7,659 1,917Newer . . . . . . . . . . . . . . . . . . . . . . . . . . 9,333 6,699 2,634 150 92 58 4,345 3,379 966Very mixed . . . . . . . . . . . . . . . . . . . . . . 6,481 4,267 2,214 478 278 199 842 695 147No other residential buildings . . . . . . 6,848 5,151 1,697 848 617 230 1,324 1,136 188Not reported . . . . . . . . . . . . . . . . . . . . . 2,901 1,945 956 236 134 103 397 348 49
OTHER BUILDINGS VANDALIZEDOR WITH INTERIOR EXPOSEDWITHIN 300 FEET
None . . . . . . . . . . . . . . . . . . . . . . . . . . . 92,438 62,871 29,567 6,818 4,024 2,795 15,106 11,951 3,1551 building. . . . . . . . . . . . . . . . . . . . . . . . 2,641 1,551 1,090 392 220 172 234 171 63More than 1 building . . . . . . . . . . . . . . 2,370 1,026 1,344 451 238 214 129 87 42No buildings . . . . . . . . . . . . . . . . . . . . . 6,076 4,901 1,176 736 582 155 1,241 1,111 130Not reported . . . . . . . . . . . . . . . . . . . . . 2,736 1,915 821 231 132 99 404 345 59
BARS ON WINDOWS OF BUILD−INGS WITHIN 300 FEET
No bars on windows . . . . . . . . . . . . . . 87,918 60,706 27,212 6,538 4,024 2,515 14,863 11,837 3,0261 building with bars . . . . . . . . . . . . . . . 1,844 1,203 641 178 101 77 204 144 602 or more buildings with bars . . . . . . 6,123 2,843 3,280 783 294 489 290 175 115No buildings . . . . . . . . . . . . . . . . . . . . . 6,076 4,901 1,176 736 582 155 1,241 1,111 130Not reported . . . . . . . . . . . . . . . . . . . . . 4,300 2,612 1,688 394 195 199 517 398 119
CONDITION OF STREETSWITHIN 300 FEET
No repairs needed. . . . . . . . . . . . . . . . 65,940 46,119 19,820 4,865 3,087 1,778 11,683 9,297 2,386Minor repairs needed . . . . . . . . . . . . . 30,513 19,289 11,223 2,876 1,561 1,314 3,850 3,034 816Major repairs needed . . . . . . . . . . . . . 5,991 3,914 2,077 575 334 241 838 660 178No streets . . . . . . . . . . . . . . . . . . . . . . . 1,180 957 223 108 83 25 310 282 28Not reported . . . . . . . . . . . . . . . . . . . . . 2,638 1,986 652 205 130 76 434 392 42
TRASH, LITTER, OR JUNKON STREETS OR ANY PROPER−TIES WITHIN 300 FEET
None . . . . . . . . . . . . . . . . . . . . . . . . . . . 94,194 65,592 28,602 7,204 4,493 2,711 15,823 12,653 3,170Minor accumulation . . . . . . . . . . . . . . . 6,931 3,422 3,509 894 414 480 662 474 188Major accumulation . . . . . . . . . . . . . . . 2,815 1,470 1,345 345 164 181 252 200 52Not reported . . . . . . . . . . . . . . . . . . . . . 2,321 1,781 540 187 124 62 378 338 40
See footnotes at end of table.

U.S. Census Bureau 37
Table A2.Characteristics of Occupied Units by Year Built: 2001 — Con.(In thousands. Data for occupied housing units. Data based on sample. For information on confidentiality protection, sampling error,nonsampling error, and definitions, see www.census.gov/hhes/www/ahs.html)
Characteristic
Occupied housing units Built before 1920 Built 1990 or later
TotalOwner
occupiedRenter
occupied TotalOwner
occupiedRenter
occupied TotalOwner
occupiedRenter
occupied
RACE
White . . . . . . . . . . . . . . . . . . . . . . . . . . . . 85,292 62,465 22,826 7,066 4,642 2,424 14,336 11,742 2,593Non−Hispanic. . . . . . . . . . . . . . . . . . . 78,784 58,907 19,877 6,710 4,503 2,208 13,568 11,204 2,364Hispanic . . . . . . . . . . . . . . . . . . . . . . . 6,508 3,559 2,949 356 139 217 768 538 230
Black . . . . . . . . . . . . . . . . . . . . . . . . . . . . 13,292 6,318 6,974 1,042 428 614 1,583 1,095 488American Indian, Eskimo, andAleut . . . . . . . . . . . . . . . . . . . . . . . . . . . 618 301 318 32 12 21 48 36 11
Asian and Pacific Islander. . . . . . . . . . 3,331 1,810 1,521 160 45 114 674 497 177Other . . . . . . . . . . . . . . . . . . . . . . . . . . . . 3,728 1,371 2,357 330 69 261 474 295 179Total Hispanic7. . . . . . . . . . . . . . . . . . . . 9,814 4,731 5,083 642 196 446 1,143 760 383
PERSONS
1 person . . . . . . . . . . . . . . . . . . . . . . . . . 28,149 15,398 12,751 2,641 1,265 1,377 3,247 1,970 1,2772 persons . . . . . . . . . . . . . . . . . . . . . . . . 34,653 25,448 9,204 2,623 1,765 857 5,627 4,610 1,0173 persons . . . . . . . . . . . . . . . . . . . . . . . . 17,178 11,971 5,207 1,371 875 496 3,112 2,559 5534 persons . . . . . . . . . . . . . . . . . . . . . . . . 15,619 11,762 3,856 1,142 770 372 3,186 2,828 3585 persons . . . . . . . . . . . . . . . . . . . . . . . . 6,846 5,058 1,788 475 290 185 1,342 1,170 1726 persons or more . . . . . . . . . . . . . . . . 3,816 2,627 1,189 378 231 148 600 527 73
NUMBER OF SINGLECHILDREN UNDER 18 YEARS
None . . . . . . . . . . . . . . . . . . . . . . . . . . . . 67,579 45,994 21,585 5,690 3,466 2,224 9,362 7,089 2,2731 . . . . . . . . . . . . . . . . . . . . . . . . . . . . . . . . 16,535 11,019 5,515 1,257 745 513 3,135 2,617 5182 . . . . . . . . . . . . . . . . . . . . . . . . . . . . . . . . 14,284 10,159 4,125 1,017 621 396 3,075 2,674 4013 . . . . . . . . . . . . . . . . . . . . . . . . . . . . . . . . 5,440 3,664 1,776 420 253 167 1,135 928 2084 . . . . . . . . . . . . . . . . . . . . . . . . . . . . . . . . 1,636 960 676 173 77 96 277 250 275 . . . . . . . . . . . . . . . . . . . . . . . . . . . . . . . . 484 271 212 38 18 20 77 53 246 or more . . . . . . . . . . . . . . . . . . . . . . . . 303 197 107 34 15 19 54 54 ...
PERSONS 65 YEARS OLDAND OVER
None . . . . . . . . . . . . . . . . . . . . . . . . . . . . 82,031 52,745 29,285 6,552 3,547 3,005 14,580 11,606 2,9741 person . . . . . . . . . . . . . . . . . . . . . . . . . 16,383 12,382 4,002 1,470 1,109 361 1,657 1,279 3782 persons or more . . . . . . . . . . . . . . . . 7,847 7,138 709 607 540 68 878 780 98
AGE OF HOUSEHOLDER
Under 25 years . . . . . . . . . . . . . . . . . . . 6,206 1,320 4,886 525 79 446 1,018 344 67325 to 34 . . . . . . . . . . . . . . . . . . . . . . . . . 18,597 8,967 9,630 1,559 595 964 3,766 2,707 1,05935 to 44 . . . . . . . . . . . . . . . . . . . . . . . . . 23,882 16,359 7,524 1,856 1,054 802 5,001 4,288 71345 to 54 . . . . . . . . . . . . . . . . . . . . . . . . . 21,646 16,650 4,996 1,729 1,206 523 3,365 2,994 37055 to 64 . . . . . . . . . . . . . . . . . . . . . . . . . 14,117 11,456 2,661 1,072 764 308 1,893 1,685 20865 to 74 . . . . . . . . . . . . . . . . . . . . . . . . . 10,755 8,856 1,898 827 632 196 1,234 1,068 16775 years and over. . . . . . . . . . . . . . . . . 11,057 8,657 2,401 1,062 866 196 837 578 259Median . . . . . . . . . . . . . . . . . . . . . . . . . . 47 51 38 47 52 39 43 44 35
See footnotes at end of table.

38 U.S. Census Bureau
Table A2.Characteristics of Occupied Units by Year Built: 2001 — Con.(In thousands. Data for occupied housing units. Data based on sample. For information on confidentiality protection, sampling error,nonsampling error, and definitions, see www.census.gov/hhes/www/ahs.html)
Characteristic
Occupied housing units Built before 1920 Built 1990 or later
TotalOwner
occupiedRenter
occupied TotalOwner
occupiedRenter
occupied TotalOwner
occupiedRenter
occupied
HOUSEHOLD COMPOSITION BYAGE OF HOUSEHOLDER
2−or−more−personhouseholds . . . . . . . . . . . . . . . . 78,113 56,867 21,246 5,989 3,931 2,058 13,868 11,695 2,173
Married−couple families, nononrelatives . . . . . . . . . . . . . . . . . . . . 53,710 44,618 9,092 3,775 2,919 856 10,718 9,658 1,060Under 25 years . . . . . . . . . . . . . . . . 1,297 490 807 84 22 62 281 159 12225 to 29 years . . . . . . . . . . . . . . . . . 3,378 2,039 1,338 233 109 124 793 638 15530 to 34 years . . . . . . . . . . . . . . . . . 5,413 3,744 1,668 407 245 162 1,525 1,308 21735 to 44 years . . . . . . . . . . . . . . . . . 13,575 11,182 2,392 903 673 230 3,497 3,233 26345 to 64 years . . . . . . . . . . . . . . . . . 20,867 18,681 2,186 1,474 1,260 214 3,531 3,337 19365 years and over . . . . . . . . . . . . . . 9,182 8,482 700 674 610 64 1,092 982 110
Other male householder. . . . . . . . . . . 8,581 4,419 4,161 786 405 381 1,118 710 408Under 45 years . . . . . . . . . . . . . . . . 5,772 2,377 3,395 527 214 313 850 467 38345 to 64 years . . . . . . . . . . . . . . . . . 2,116 1,505 611 186 130 55 228 205 2365 years and over . . . . . . . . . . . . . . 692 537 155 73 61 13 40 38 2
Other female householder . . . . . . . . . 15,821 7,829 7,992 1,428 607 821 2,032 1,327 704Under 45 years . . . . . . . . . . . . . . . . 9,421 3,290 6,131 839 232 608 1,384 785 59945 to 64 years . . . . . . . . . . . . . . . . . 4,400 2,927 1,473 409 245 164 482 394 8965 years and over . . . . . . . . . . . . . . 2,000 1,612 388 180 129 50 165 148 17
1−person households . . . . . . . 28,149 15,398 12,751 2,641 1,264 1,377 3,247 1,970 1,277Male householder . . . . . . . . . . . . . . . . 12,146 5,950 6,195 1,207 470 737 1,380 818 562
Under 45 years . . . . . . . . . . . . . . . . 5,903 2,228 3,676 599 169 430 798 428 37045 to 64 years . . . . . . . . . . . . . . . . . 3,809 2,103 1,707 364 146 218 418 288 13065 years and over . . . . . . . . . . . . . . 2,433 1,620 813 244 155 89 163 102 61
Female householder . . . . . . . . . . . . . . 16,003 9,448 6,555 1,434 795 639 1,868 1,152 715Under 45 years . . . . . . . . . . . . . . . . 3,928 1,295 2,632 348 64 284 657 321 33645 to 64 years . . . . . . . . . . . . . . . . . 4,570 2,890 1,680 368 188 180 598 456 14365 years and over . . . . . . . . . . . . . . 7,505 5,262 2,243 718 542 176 612 376 236
ADULTS AND SINGLE CHILDRENUNDER 18 YEARS OLD
Total households withchildren . . . . . . . . . . . . . . . . . . . 38,682 26,271 12,411 2,940 1,729 1,210 7,753 6,576 1,177
Married couples . . . . . . . . . . . . . . . . . . 26,036 20,609 5,428 1,802 1,293 509 6,031 5,466 565One child under 6 only . . . . . . . . . . 3,608 2,516 1,092 238 139 99 917 788 129One under 6, one or more6 to 17 . . . . . . . . . . . . . . . . . . . . . . . 4,493 3,467 1,026 342 239 103 1,121 1,025 96
Two or more under 6 only . . . . . . . 2,422 1,749 673 164 101 62 616 558 58Two or more under 6, one ormore 6 to 17. . . . . . . . . . . . . . . . . . 1,245 867 378 81 47 34 313 276 37
One or more 6 to 17 only . . . . . . . 14,269 12,010 2,259 978 767 211 3,063 2,817 246Other households with two or moreadults . . . . . . . . . . . . . . . . . . . . . . . . . . 5,416 2,821 2,596 539 236 302 665 489 176One child under 6 only . . . . . . . . . . 929 393 536 86 37 49 105 71 34One under 6, one or more6 to 17 . . . . . . . . . . . . . . . . . . . . . . . 779 366 413 64 16 48 92 62 30
Two or more under 6 only . . . . . . . 348 141 207 34 10 24 23 13 10Two or more under 6, one ormore 6 to 17. . . . . . . . . . . . . . . . . . 265 121 144 22 12 10 27 15 12
One or more 6 to 17 only . . . . . . . 3,094 1,800 1,294 333 162 171 418 328 90Households with one adult or none . 7,230 2,842 4,388 599 200 399 1,057 622 435
One child under 6 only . . . . . . . . . . 844 226 618 72 13 59 105 50 55One under 6, one or more6 to 17 . . . . . . . . . . . . . . . . . . . . . . . 889 241 648 67 18 50 129 52 76
Two or more under 6 only . . . . . . . 342 58 284 28 4 24 56 13 43Two or more under 6, one ormore 6 to 17. . . . . . . . . . . . . . . . . . 225 50 176 20 7 13 27 9 18
One or more 6 to 17 only . . . . . . . 4,929 2,266 2,663 412 158 254 740 498 243
See footnotes at end of table.

U.S. Census Bureau 39
Table A2.Characteristics of Occupied Units by Year Built: 2001 — Con.(In thousands. Data for occupied housing units. Data based on sample. For information on confidentiality protection, sampling error,nonsampling error, and definitions, see www.census.gov/hhes/www/ahs.html)
Characteristic
Occupied housing units Built before 1920 Built 1990 or later
TotalOwner
occupiedRenter
occupied TotalOwner
occupiedRenter
occupied TotalOwner
occupiedRenter
occupied
ADULTS AND SINGLE CHILDRENUNDER 18 YEARS OLD—Con.
Total households with nochildren . . . . . . . . . . . . . . . . . . . 67,579 45,994 21,585 5,690 3,466 2,224 9,362 7,089 2,273
Married couples . . . . . . . . . . . . . . . . . . 28,484 24,588 3,896 2,045 1,680 364 4,832 4,320 512Other households with two or moreadults . . . . . . . . . . . . . . . . . . . . . . . . . . 11,355 6,159 5,196 1,041 531 509 1,364 837 528
Households with one adult . . . . . . . . 27,739 15,246 12,493 2,605 1,254 1,350 3,166 1,932 1,234
EDUCATIONAL ATTAINMENT OFTHE HOUSEHOLDER
Less than 9th grade . . . . . . . . . . . . . . 6,540 3,864 2,675 589 313 277 569 367 2029th to 12th grade, no diploma. . . . . . 13,185 7,696 5,489 1,331 733 598 1,517 1,118 400High school graduate (includesequivalency) . . . . . . . . . . . . . . . . . . . . 33,049 22,969 10,080 3,029 1,930 1,099 4,726 3,803 923Additional vocational training. . . . . 3,399 2,457 943 284 189 95 557 474 83
Some college, no degree. . . . . . . . . . 19,078 12,355 6,723 1,286 759 528 3,342 2,520 822Associate degree. . . . . . . . . . . . . . . . . 6,996 4,963 2,033 476 274 202 1,287 1,061 226Bachelor’s degree . . . . . . . . . . . . . . . . 17,719 12,827 4,892 1,163 687 477 3,829 3,207 622Graduate or professional degree . . . 9,695 7,590 2,105 755 501 253 1,845 1,589 256Percent high school graduate orhigher. . . . . . . . . . . . . . . . . . . . . . . . . . 81.4 84.0 76.0 77.7 79.9 74.5 87.8 89.1 82.6
Percent bachelor’s degree orhigher. . . . . . . . . . . . . . . . . . . . . . . . . . 25.8 28.3 20.6 22.2 22.9 21.2 33.1 35.1 25.5
CITIZENSHIP OF HOUSEHOLDER
Citizen of the United States. . . . . . . . 100,628 70,244 30,384 8,169 5,100 3,069 16,475 13,275 3,200Naturalized citizen of the UnitedStates . . . . . . . . . . . . . . . . . . . . . . . 5,574 3,687 1,887 318 170 148 845 691 154
YEAR HOUSEHOLDERMOVED INTO UNIT
2000 to 2001 . . . . . . . . . . . . . . . . . . . . 24,496 9,100 15,396 1,702 419 1,283 5,643 3,456 2,1871995 to 1999 . . . . . . . . . . . . . . . . . . . . 33,150 20,975 12,175 2,371 1,139 1,232 8,251 7,167 1,0841990 to 1994 . . . . . . . . . . . . . . . . . . . . 14,930 11,824 3,105 1,118 719 399 3,221 3,042 1791980 to 1989 . . . . . . . . . . . . . . . . . . . . 14,723 12,664 2,057 1,265 977 288 – – –1970 to 1979 . . . . . . . . . . . . . . . . . . . . 9,801 9,070 733 825 713 112 – – –1960 to 1969 . . . . . . . . . . . . . . . . . . . . 5,050 4,728 322 517 460 56 – – –1950 to 1959 . . . . . . . . . . . . . . . . . . . . 2,904 2,791 112 401 385 16 – – –1940 to 1949 . . . . . . . . . . . . . . . . . . . . 893 830 63 296 263 34 – – –1939 or earlier . . . . . . . . . . . . . . . . . . . 314 282 32 135 121 14 – – –Median. . . . . . . . . . . . . . . . . . . . . . . . . . 1996 1992 1999 1994 1987 1998 1998 1998 2000
HOUSEHOLD INCOME
Less than $5,000. . . . . . . . . . . . . . . . . 6,095 3,130 2,965 556 295 261 770 537 233$5,000 to $9,999 . . . . . . . . . . . . . . . . . 6,252 2,754 3,498 726 298 428 552 281 271$10,000 to $14,999 . . . . . . . . . . . . . . . 7,054 3,695 3,359 678 320 358 648 354 293$15,000 to $19,999 . . . . . . . . . . . . . . . 6,786 3,731 3,055 641 335 306 694 432 262$20,000 to $24,999 . . . . . . . . . . . . . . . 7,017 3,917 3,100 690 356 335 844 543 300$25,000 to $29,999 . . . . . . . . . . . . . . . 6,969 4,206 2,762 568 316 251 928 643 286$30,000 to $34,999 . . . . . . . . . . . . . . . 7,028 4,265 2,763 578 300 278 1,028 749 279$35,000 to $39,999 . . . . . . . . . . . . . . . 5,629 3,486 2,143 437 235 202 803 586 217$40,000 to $49,999 . . . . . . . . . . . . . . . 9,853 6,634 3,219 808 510 298 1,571 1,176 395$50,000 to $59,999 . . . . . . . . . . . . . . . 8,378 6,197 2,180 655 450 205 1,506 1,248 258$60,000 to $79,999 . . . . . . . . . . . . . . . 13,004 10,343 2,661 935 674 261 2,480 2,187 292$80,000 to $99,999 . . . . . . . . . . . . . . . 8,004 7,003 1,001 510 408 102 1,774 1,653 121$100,000 to $119,999. . . . . . . . . . . . . 4,815 4,317 498 294 229 64 1,087 1,004 82$120,000 or more . . . . . . . . . . . . . . . . 9,378 8,586 792 553 468 86 2,432 2,271 160Median. . . . . . . . . . . . . . . . . . . . . . . . . . 40,305 50,505 26,848 33,940 42,784 25,588 54,784 62,588 31,425
See footnotes at end of table.
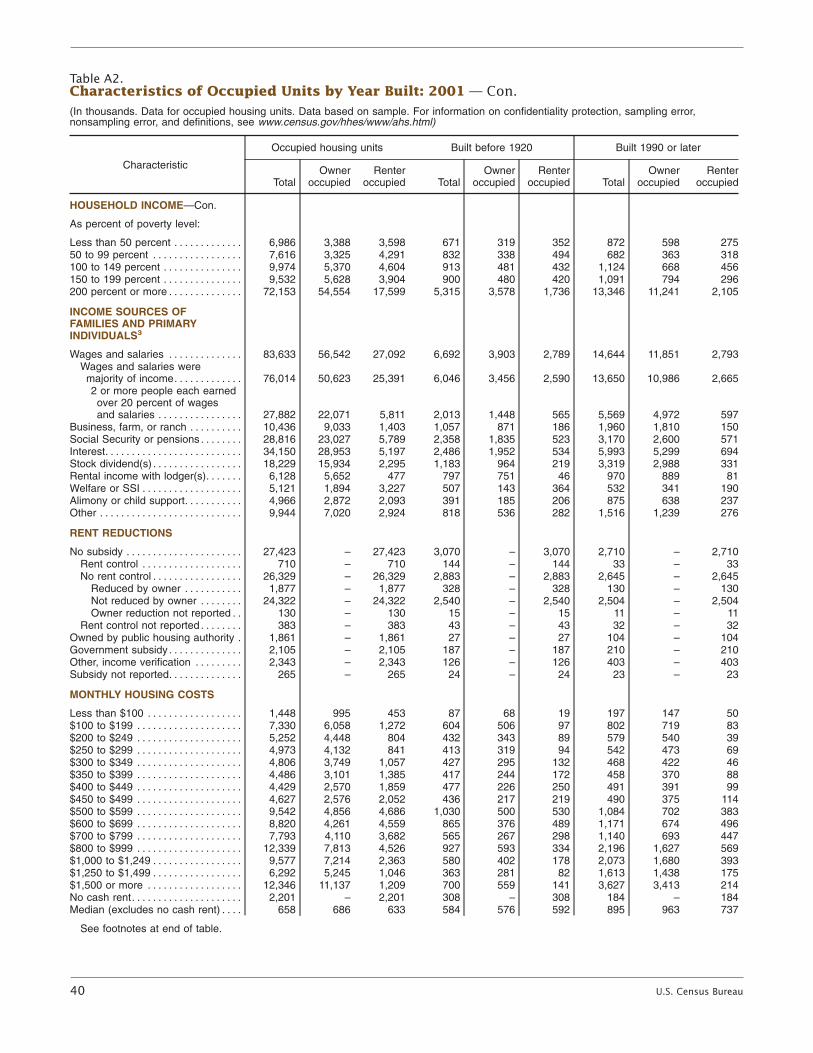
40 U.S. Census Bureau
Table A2.Characteristics of Occupied Units by Year Built: 2001 — Con.(In thousands. Data for occupied housing units. Data based on sample. For information on confidentiality protection, sampling error,nonsampling error, and definitions, see www.census.gov/hhes/www/ahs.html)
Characteristic
Occupied housing units Built before 1920 Built 1990 or later
TotalOwner
occupiedRenter
occupied TotalOwner
occupiedRenter
occupied TotalOwner
occupiedRenter
occupied
HOUSEHOLD INCOME—Con.
As percent of poverty level:
Less than 50 percent . . . . . . . . . . . . . 6,986 3,388 3,598 671 319 352 872 598 27550 to 99 percent . . . . . . . . . . . . . . . . . 7,616 3,325 4,291 832 338 494 682 363 318100 to 149 percent . . . . . . . . . . . . . . . 9,974 5,370 4,604 913 481 432 1,124 668 456150 to 199 percent . . . . . . . . . . . . . . . 9,532 5,628 3,904 900 480 420 1,091 794 296200 percent or more . . . . . . . . . . . . . . 72,153 54,554 17,599 5,315 3,578 1,736 13,346 11,241 2,105
INCOME SOURCES OFFAMILIES AND PRIMARYINDIVIDUALS3
Wages and salaries . . . . . . . . . . . . . . 83,633 56,542 27,092 6,692 3,903 2,789 14,644 11,851 2,793Wages and salaries weremajority of income. . . . . . . . . . . . . 76,014 50,623 25,391 6,046 3,456 2,590 13,650 10,986 2,6652 or more people each earnedover 20 percent of wagesand salaries . . . . . . . . . . . . . . . . 27,882 22,071 5,811 2,013 1,448 565 5,569 4,972 597
Business, farm, or ranch . . . . . . . . . . 10,436 9,033 1,403 1,057 871 186 1,960 1,810 150Social Security or pensions . . . . . . . . 28,816 23,027 5,789 2,358 1,835 523 3,170 2,600 571Interest. . . . . . . . . . . . . . . . . . . . . . . . . . 34,150 28,953 5,197 2,486 1,952 534 5,993 5,299 694Stock dividend(s) . . . . . . . . . . . . . . . . . 18,229 15,934 2,295 1,183 964 219 3,319 2,988 331Rental income with lodger(s). . . . . . . 6,128 5,652 477 797 751 46 970 889 81Welfare or SSI . . . . . . . . . . . . . . . . . . . 5,121 1,894 3,227 507 143 364 532 341 190Alimony or child support. . . . . . . . . . . 4,966 2,872 2,093 391 185 206 875 638 237Other . . . . . . . . . . . . . . . . . . . . . . . . . . . 9,944 7,020 2,924 818 536 282 1,516 1,239 276
RENT REDUCTIONS
No subsidy . . . . . . . . . . . . . . . . . . . . . . 27,423 – 27,423 3,070 – 3,070 2,710 – 2,710Rent control . . . . . . . . . . . . . . . . . . . 710 – 710 144 – 144 33 – 33No rent control . . . . . . . . . . . . . . . . . 26,329 – 26,329 2,883 – 2,883 2,645 – 2,645
Reduced by owner . . . . . . . . . . . 1,877 – 1,877 328 – 328 130 – 130Not reduced by owner . . . . . . . . 24,322 – 24,322 2,540 – 2,540 2,504 – 2,504Owner reduction not reported . . 130 – 130 15 – 15 11 – 11
Rent control not reported . . . . . . . . 383 – 383 43 – 43 32 – 32Owned by public housing authority . 1,861 – 1,861 27 – 27 104 – 104Government subsidy . . . . . . . . . . . . . . 2,105 – 2,105 187 – 187 210 – 210Other, income verification . . . . . . . . . 2,343 – 2,343 126 – 126 403 – 403Subsidy not reported. . . . . . . . . . . . . . 265 – 265 24 – 24 23 – 23
MONTHLY HOUSING COSTS
Less than $100 . . . . . . . . . . . . . . . . . . 1,448 995 453 87 68 19 197 147 50$100 to $199 . . . . . . . . . . . . . . . . . . . . 7,330 6,058 1,272 604 506 97 802 719 83$200 to $249 . . . . . . . . . . . . . . . . . . . . 5,252 4,448 804 432 343 89 579 540 39$250 to $299 . . . . . . . . . . . . . . . . . . . . 4,973 4,132 841 413 319 94 542 473 69$300 to $349 . . . . . . . . . . . . . . . . . . . . 4,806 3,749 1,057 427 295 132 468 422 46$350 to $399 . . . . . . . . . . . . . . . . . . . . 4,486 3,101 1,385 417 244 172 458 370 88$400 to $449 . . . . . . . . . . . . . . . . . . . . 4,429 2,570 1,859 477 226 250 491 391 99$450 to $499 . . . . . . . . . . . . . . . . . . . . 4,627 2,576 2,052 436 217 219 490 375 114$500 to $599 . . . . . . . . . . . . . . . . . . . . 9,542 4,856 4,686 1,030 500 530 1,084 702 383$600 to $699 . . . . . . . . . . . . . . . . . . . . 8,820 4,261 4,559 865 376 489 1,171 674 496$700 to $799 . . . . . . . . . . . . . . . . . . . . 7,793 4,110 3,682 565 267 298 1,140 693 447$800 to $999 . . . . . . . . . . . . . . . . . . . . 12,339 7,813 4,526 927 593 334 2,196 1,627 569$1,000 to $1,249 . . . . . . . . . . . . . . . . . 9,577 7,214 2,363 580 402 178 2,073 1,680 393$1,250 to $1,499 . . . . . . . . . . . . . . . . . 6,292 5,245 1,046 363 281 82 1,613 1,438 175$1,500 or more . . . . . . . . . . . . . . . . . . 12,346 11,137 1,209 700 559 141 3,627 3,413 214No cash rent. . . . . . . . . . . . . . . . . . . . . 2,201 – 2,201 308 – 308 184 – 184Median (excludes no cash rent) . . . . 658 686 633 584 576 592 895 963 737
See footnotes at end of table.

U.S. Census Bureau 41
Table A2.Characteristics of Occupied Units by Year Built: 2001 — Con.(In thousands. Data for occupied housing units. Data based on sample. For information on confidentiality protection, sampling error,nonsampling error, and definitions, see www.census.gov/hhes/www/ahs.html)
Characteristic
Occupied housing units Built before 1920 Built 1990 or later
TotalOwner
occupiedRenter
occupied TotalOwner
occupiedRenter
occupied TotalOwner
occupiedRenter
occupied
MONTHLY HOUSING COSTSAS PERCENT OF CURRENTINCOME
Less than 5 percent . . . . . . . . . . . . . . 5,217 4,906 311 380 348 31 894 855 395 to 9 percent. . . . . . . . . . . . . . . . . . . . 12,267 11,131 1,136 946 797 150 1,791 1,673 11810 to 14 percent . . . . . . . . . . . . . . . . . 15,166 12,316 2,850 1,059 768 291 2,396 2,119 27715 to 19 percent . . . . . . . . . . . . . . . . . 14,879 10,913 3,966 1,146 733 413 2,592 2,196 39520 to 24 percent . . . . . . . . . . . . . . . . . 12,616 8,544 4,072 971 622 348 2,287 1,864 42325 to 29 percent . . . . . . . . . . . . . . . . . 9,555 5,932 3,623 736 453 283 1,664 1,281 38330 to 34 percent . . . . . . . . . . . . . . . . . 6,840 4,181 2,659 524 273 251 1,270 908 36235 to 39 percent . . . . . . . . . . . . . . . . . 4,758 2,728 2,030 383 194 189 844 613 23240 to 49 percent . . . . . . . . . . . . . . . . . 5,882 3,160 2,722 548 271 276 915 670 24550 to 59 percent . . . . . . . . . . . . . . . . . 3,595 1,864 1,731 308 145 163 510 332 17860 to 69 percent . . . . . . . . . . . . . . . . . 2,228 1,057 1,171 234 84 150 298 204 9570 to 99 percent . . . . . . . . . . . . . . . . . 3,098 1,443 1,655 316 135 182 383 260 123100 percent or more8 . . . . . . . . . . . . . 5,068 2,533 2,536 511 235 276 662 400 261Zero or negative income . . . . . . . . . . 2,889 1,555 1,334 261 137 123 424 290 134No cash rent. . . . . . . . . . . . . . . . . . . . . 2,201 – 2,201 308 – 308 184 – 184Median (excludes 2 previous lines) . 21 18 29 23 19 30 21 20 29
MONTHLY COST PAID FORELECTRICITY
Electricity used . . . . . . . . . . . . . 106,193 72,218 33,975 8,608 5,185 3,423 17,105 13,656 3,448Less than $25 . . . . . . . . . . . . . . . . . . . 10,982 4,690 6,292 1,235 476 758 1,264 633 632$25 to $49. . . . . . . . . . . . . . . . . . . . . . . 29,610 19,290 10,320 2,920 1,816 1,104 4,203 3,190 1,013$50 to $74. . . . . . . . . . . . . . . . . . . . . . . 24,191 18,431 5,761 1,788 1,319 469 4,122 3,364 758$75 to $99. . . . . . . . . . . . . . . . . . . . . . . 13,713 10,887 2,825 842 636 206 2,647 2,334 313$100 to $149 . . . . . . . . . . . . . . . . . . . . 13,030 10,891 2,139 693 577 116 2,816 2,555 261$150 to $199 . . . . . . . . . . . . . . . . . . . . 4,021 3,413 609 147 115 32 799 744 55$200 or more . . . . . . . . . . . . . . . . . . . . 3,027 2,608 420 142 118 25 561 516 45Median. . . . . . . . . . . . . . . . . . . . . . . . . . 59 65 44 48 54 39 67 71 47Included in rent, other fee, orobtained free . . . . . . . . . . . . . . . . . . . 7,618 2,008 5,610 841 129 712 692 321 371
MONTHLY COST PAID FORPIPED GAS
Piped gas used . . . . . . . . . . . . . 64,949 44,195 20,754 6,106 3,459 2,647 8,941 7,384 1,558Less than $25 . . . . . . . . . . . . . . . . . . . 8,500 4,344 4,156 605 232 373 1,262 841 421$25 to $49. . . . . . . . . . . . . . . . . . . . . . . 16,201 11,715 4,486 1,004 548 456 2,546 2,118 428$50 to $74. . . . . . . . . . . . . . . . . . . . . . . 12,068 9,926 2,142 936 644 293 1,909 1,728 181$75 to $99. . . . . . . . . . . . . . . . . . . . . . . 7,889 6,823 1,066 867 652 215 1,089 1,028 60$100 to $149 . . . . . . . . . . . . . . . . . . . . 5,676 4,862 813 791 597 195 777 736 41$150 to $199 . . . . . . . . . . . . . . . . . . . . 2,211 1,860 351 378 294 84 251 239 12$200 or more . . . . . . . . . . . . . . . . . . . . 2,092 1,685 408 347 283 64 281 257 24Median. . . . . . . . . . . . . . . . . . . . . . . . . . 55 61 39 73 83 51 53 57 34Included in rent, other fee, orobtained free . . . . . . . . . . . . . . . . . . . 10,313 2,980 7,332 1,177 209 968 827 436 391
See footnotes at end of table.

42 U.S. Census Bureau
Table A2.Characteristics of Occupied Units by Year Built: 2001 — Con.(In thousands. Data for occupied housing units. Data based on sample. For information on confidentiality protection, sampling error,nonsampling error, and definitions, see www.census.gov/hhes/www/ahs.html)
Characteristic
Occupied housing units Built before 1920 Built 1990 or later
TotalOwner
occupiedRenter
occupied TotalOwner
occupiedRenter
occupied TotalOwner
occupiedRenter
occupied
AVERAGE MONTHLY COST PAIDFOR FUEL OIL
Fuel oil used. . . . . . . . . . . . . . . . 15,125 9,572 5,554 2,454 1,298 1,157 1,165 895 270Less than $25 . . . . . . . . . . . . . . . . . . . 679 512 167 104 66 38 54 44 10$25 to $49. . . . . . . . . . . . . . . . . . . . . . . 1,506 1,248 258 208 150 58 98 88 9$50 to $74. . . . . . . . . . . . . . . . . . . . . . . 2,059 1,770 289 314 220 94 127 114 14$75 to $99. . . . . . . . . . . . . . . . . . . . . . . 1,511 1,368 143 239 207 32 128 123 5$100 to $149 . . . . . . . . . . . . . . . . . . . . 1,820 1,683 137 386 345 41 100 90 10$150 to $199 . . . . . . . . . . . . . . . . . . . . 564 518 47 108 99 9 54 52 2$200 or more . . . . . . . . . . . . . . . . . . . . 385 350 34 96 76 19 14 14 ...Median. . . . . . . . . . . . . . . . . . . . . . . . . . 75 79 60 86 93 63 77 78 61Included in rent, other fee, orobtained free . . . . . . . . . . . . . . . . . . . 6,602 2,123 4,479 1,000 135 865 589 369 221
MONTHLY COST PAID FORSELECTED UTILITIES ANDFUELS
Water paid separately. . . . . . . . . . . . . 57,609 49,909 7,700 4,081 3,457 623 10,319 9,220 1,098Median. . . . . . . . . . . . . . . . . . . . . . . . 30 31 23 30 31 23 32 33 20
Trash paid separately . . . . . . . . . . . . . 42,719 38,043 4,677 3,029 2,569 460 8,102 7,549 553Median. . . . . . . . . . . . . . . . . . . . . . . . 17 17 15 16 16 14 17 17 15
Bottled gas paid separately . . . . . . . . 8,849 7,734 1,115 967 819 149 1,864 1,767 96Median. . . . . . . . . . . . . . . . . . . . . . . . 68 69 57 74 74 75 70 72 45
Other fuel paid separately . . . . . . . . . 7,412 6,390 1,022 676 551 125 982 915 66Median. . . . . . . . . . . . . . . . . . . . . . . . 15 15 15 21 20 35 10 10 11
MONTHLY PAYMENT FORPRINCIPAL AND INTEREST
One or more regularmortgages . . . . . . . . . . . . . . . . . – 43,378 – – 2,826 – – 10,090 –
Less than $100 . . . . . . . . . . . . . . . . . . – 954 – – 88 – – 191 –$100 to $199 . . . . . . . . . . . . . . . . . . . . – 1,602 – – 114 – – 190 –$200 to $249 . . . . . . . . . . . . . . . . . . . . – 1,416 – – 148 – – 240 –$250 to $299 . . . . . . . . . . . . . . . . . . . . – 1,679 – – 181 – – 252 –$300 to $349 . . . . . . . . . . . . . . . . . . . . – 1,986 – – 223 – – 274 –$350 to $399 . . . . . . . . . . . . . . . . . . . . – 2,091 – – 184 – – 420 –$400 to $449 . . . . . . . . . . . . . . . . . . . . – 2,194 – – 188 – – 306 –$450 to $499 . . . . . . . . . . . . . . . . . . . . – 2,065 – – 152 – – 345 –$500 to $599 . . . . . . . . . . . . . . . . . . . . – 4,583 – – 292 – – 793 –$600 to $699 . . . . . . . . . . . . . . . . . . . . – 4,119 – – 244 – – 977 –$700 to $799 . . . . . . . . . . . . . . . . . . . . – 3,397 – – 164 – – 828 –$800 to $999 . . . . . . . . . . . . . . . . . . . . – 5,349 – – 283 – – 1,514 –$1,000 to $1,249 . . . . . . . . . . . . . . . . . – 4,792 – – 224 – – 1,434 –$1,250 to $1,499 . . . . . . . . . . . . . . . . . – 2,702 – – 118 – – 852 –$1,500 or more . . . . . . . . . . . . . . . . . . – 4,449 – – 222 – – 1,475 –Median. . . . . . . . . . . . . . . . . . . . . . . . . . – 676 – – 546 – – 830 –
AVERAGE MONTHLY COST PAIDFOR REAL ESTATE TAXES
Less than $25 . . . . . . . . . . . . . . . . . . . – 10,458 – – 655 – – 2,059 –$25 to $49. . . . . . . . . . . . . . . . . . . . . . . – 9,308 – – 788 – – 1,404 –$50 to $74. . . . . . . . . . . . . . . . . . . . . . . – 9,327 – – 805 – – 1,546 –$75 to $99. . . . . . . . . . . . . . . . . . . . . . . – 7,113 – – 589 – – 1,163 –$100 to $149 . . . . . . . . . . . . . . . . . . . . – 12,054 – – 743 – – 2,129 –$150 to $199 . . . . . . . . . . . . . . . . . . . . – 7,960 – – 552 – – 1,623 –$200 or more . . . . . . . . . . . . . . . . . . . . – 16,046 – – 1,064 – – 3,740 –Median. . . . . . . . . . . . . . . . . . . . . . . . . . – 100 – – 90 – – 116 –
See footnotes at end of table.

U.S. Census Bureau 43
Table A2.Characteristics of Occupied Units by Year Built: 2001 — Con.(In thousands. Data for occupied housing units. Data based on sample. For information on confidentiality protection, sampling error,nonsampling error, and definitions, see www.census.gov/hhes/www/ahs.html)
Characteristic
Occupied housing units Built before 1920 Built 1990 or later
TotalOwner
occupiedRenter
occupied TotalOwner
occupiedRenter
occupied TotalOwner
occupiedRenter
occupied
ANNUAL TAXES PAID PER$1,000 VALUE
Less than $5. . . . . . . . . . . . . . . . . . . . . – 13,820 – – 861 – – 2,675 –$5 to $9 . . . . . . . . . . . . . . . . . . . . . . . . . – 22,087 – – 1,468 – – 4,389 –$10 to $14. . . . . . . . . . . . . . . . . . . . . . . – 16,754 – – 1,221 – – 3,333 –$15 to $19. . . . . . . . . . . . . . . . . . . . . . . – 8,755 – – 640 – – 1,457 –$20 to $24. . . . . . . . . . . . . . . . . . . . . . . – 4,570 – – 403 – – 731 –$25 or more . . . . . . . . . . . . . . . . . . . . . – 6,278 – – 603 – – 1,081 –Median. . . . . . . . . . . . . . . . . . . . . . . . . . – 10 – – 11 – – 10 –
ROUTINE MAINTENANCE INLAST YEAR
$0 . . . . . . . . . . . . . . . . . . . . . . . . . . . . . – 14,061 – – 795 – – 4,504 –$1 to $24 per month . . . . . . . . . . . . . . – 19,120 – – 1,338 – – 3,547 –$25 to $49. . . . . . . . . . . . . . . . . . . . . . . – 15,735 – – 1,049 – – 2,377 –$50 to $74. . . . . . . . . . . . . . . . . . . . . . . – 2,418 – – 163 – – 345 –$75 to $99. . . . . . . . . . . . . . . . . . . . . . . – 5,693 – – 486 – – 667 –$100 to $149 . . . . . . . . . . . . . . . . . . . . – 1,771 – – 134 – – 193 –$150 to $199 . . . . . . . . . . . . . . . . . . . . – 2,216 – – 189 – – 302 –$200 or more per month . . . . . . . . . . – 2,513 – – 305 – – 302 –Not reported . . . . . . . . . . . . . . . . . . . . . – 8,738 – – 736 – – 1,427 –Median. . . . . . . . . . . . . . . . . . . . . . . . . . – –25 – – 27 – – –25 –
VALUE
Less than $10,000. . . . . . . . . . . . . . . . – 1,613 – – 56 – – 269 –$10,000 to $19,999 . . . . . . . . . . . . . . . – 1,502 – – 63 – – 438 –$20,000 to $29,999 . . . . . . . . . . . . . . . – 1,721 – – 173 – – 381 –$30,000 to $39,999 . . . . . . . . . . . . . . . – 1,821 – – 245 – – 322 –$40,000 to $49,999 . . . . . . . . . . . . . . . – 2,355 – – 288 – – 312 –$50,000 to $59,999 . . . . . . . . . . . . . . . – 2,886 – – 330 – – 319 –$60,000 to $69,999. . . . . . . . . . . . . . . – 3,762 – – 346 – – 413 –$70,000 to $79,999 . . . . . . . . . . . . . . . – 4,282 – – 388 – – 444 –$80,000 to $99,999 . . . . . . . . . . . . . . . – 8,501 – – 754 – – 980 –$100,000 to $119,999. . . . . . . . . . . . . – 6,511 – – 381 – – 1,016 –$120,000 to $149,999. . . . . . . . . . . . . – 9,104 – – 511 – – 1,742 –$150,000 to $199,999. . . . . . . . . . . . . – 10,169 – – 611 – – 2,380 –$200,000 to $249,999. . . . . . . . . . . . . – 5,743 – – 315 – – 1,541 –$250,000 to $299,999. . . . . . . . . . . . . – 3,749 – – 192 – – 1,041 –$300,000 or more . . . . . . . . . . . . . . . . – 8,546 – – 542 – – 2,067 –Median. . . . . . . . . . . . . . . . . . . . . . . . . . – 123,887 – – 98,793 – – 154,233 –
RATIO OF VALUE TO CURRENTINCOME
Less than 1.5 . . . . . . . . . . . . . . . . . . . . – 18,499 – – 1,374 – – 3,316 –1.5 to 1.9. . . . . . . . . . . . . . . . . . . . . . . . – 9,848 – – 686 – – 2,136 –2.0 to 2.4. . . . . . . . . . . . . . . . . . . . . . . . – 8,096 – – 531 – – 1,721 –2.5 to 2.9. . . . . . . . . . . . . . . . . . . . . . . . – 6,502 – – 391 – – 1,437 –3.0 to 3.9. . . . . . . . . . . . . . . . . . . . . . . . – 8,564 – – 542 – – 1,760 –4.0 to 4.9. . . . . . . . . . . . . . . . . . . . . . . . – 4,810 – – 363 – – 890 –5.0 or more . . . . . . . . . . . . . . . . . . . . . . – 14,392 – – 1,172 – – 2,114 –Zero or negative income . . . . . . . . . . – 1,555 – – 137 – – 290 –Median. . . . . . . . . . . . . . . . . . . . . . . . . . – 2.4 – – 2.4 – – 2.4 –
See footnotes at end of table.

44 U.S. Census Bureau
Table A2.Characteristics of Occupied Units by Year Built: 2001 — Con.(In thousands. Data for occupied housing units. Data based on sample. For information on confidentiality protection, sampling error,nonsampling error, and definitions, see www.census.gov/hhes/www/ahs.html)
Characteristic
Occupied housing units Built before 1920 Built 1990 or later
TotalOwner
occupiedRenter
occupied TotalOwner
occupiedRenter
occupied TotalOwner
occupiedRenter
occupied
MORTGAGES CURRENTLYON PROPERTY9
None, owned free and clear . . . . . . . – 25,675 – – 2,099 – – 3,092 –Reverse mortgage. . . . . . . . . . . . . . . . – 37 – – – – – 2 –Regular and home equitymortgage3 . . . . . . . . . . . . . . . . . . . . . . – 44,970 – – 2,987 – – 10,275 –
Regular mortgage . . . . . . . . . . . . . . . . – 41,717 – – 2,681 – – 9,844 –Home−equity lump−sum mortgage. . – 4,752 – – 364 – – 902 –Home−equity line of credit . . . . . . . . . – 6,481 – – 471 – – 1,178 –Line of credit not reported, noregular or lump sum . . . . . . . . . . . . . – 1,583 – – 109 – – 296 –
NUMBER OF REGULARMORTGAGES AND HOMEEQUITY MORTGAGES9
1 mortgage . . . . . . . . . . . . . . . . . . . . . . – 32,721 – – 2,173 – – 7,687 –2 mortgages . . . . . . . . . . . . . . . . . . . . . – 8,470 – – 536 – – 1,848 –3 mortgages or more . . . . . . . . . . . . . – 1,008 – – 62 – – 194 –Number not reported. . . . . . . . . . . . . . – 4,355 – – 325 – – 843 –
TYPE OF PRIMARYMORTGAGE
FHA . . . . . . . . . . . . . . . . . . . . . . . . . . . . – 6,110 – – 255 – – 1,280 –VA. . . . . . . . . . . . . . . . . . . . . . . . . . . . . . – 2,177 – – 85 – – 531 –RHS/RD. . . . . . . . . . . . . . . . . . . . . . . . . – 318 – – 32 – – 82 –Other types . . . . . . . . . . . . . . . . . . . . . . – 31,796 – – 2,237 – – 7,601 –Don’t know . . . . . . . . . . . . . . . . . . . . . . – 140 – – 10 – – 32 –Not reported . . . . . . . . . . . . . . . . . . . . . – 2,837 – – 208 – – 565 –
CURRENT TOTAL LOAN ASPERCENT OF VALUE
Less than 20 percent . . . . . . . . . . . . . – 6,960 – – 599 – – 576 –20 to 39 . . . . . . . . . . . . . . . . . . . . . . . . . – 6,785 – – 493 – – 1,051 –40 to 59 . . . . . . . . . . . . . . . . . . . . . . . . . – 9,669 – – 648 – – 2,237 –60 to 79 . . . . . . . . . . . . . . . . . . . . . . . . . – 10,974 – – 593 – – 3,290 –80 to 89 . . . . . . . . . . . . . . . . . . . . . . . . . – 4,264 – – 218 – – 1,387 –90 to 99 . . . . . . . . . . . . . . . . . . . . . . . . . – 2,920 – – 121 – – 990 –100 percent or more . . . . . . . . . . . . . . – 1,806 – – 154 – – 559 –Median. . . . . . . . . . . . . . . . . . . . . . . . . . – 56.4 – – 49.9 – – 67.2 –
REMAINING YEARSMORTGAGED
Less than 8 year . . . . . . . . . . . . . . . . . – 6,894 – – 574 – – 656 –8 to 12 . . . . . . . . . . . . . . . . . . . . . . . . . . – 4,719 – – 323 – – 800 –13 to 17 . . . . . . . . . . . . . . . . . . . . . . . . . – 5,278 – – 404 – – 911 –18 to 22 . . . . . . . . . . . . . . . . . . . . . . . . . – 4,728 – – 313 – – 987 –23 to 27 . . . . . . . . . . . . . . . . . . . . . . . . . – 9,579 – – 541 – – 2,823 –28 to 32 . . . . . . . . . . . . . . . . . . . . . . . . . – 10,957 – – 572 – – 3,681 –33 years or more . . . . . . . . . . . . . . . . . – 56 – – 3 – – 14 –Variable . . . . . . . . . . . . . . . . . . . . . . . . . – 1,168 – – 97 – – 218 –Median. . . . . . . . . . . . . . . . . . . . . . . . . . – 22 – – 19 – – 26 –
See footnotes at end of table.

U.S. Census Bureau 45
Table A2.Characteristics of Occupied Units by Year Built: 2001 — Con.(In thousands. Data for occupied housing units. Data based on sample. For information on confidentiality protection, sampling error,nonsampling error, and definitions, see www.census.gov/hhes/www/ahs.html)
Characteristic
Occupied housing units Built before 1920 Built 1990 or later
TotalOwner
occupiedRenter
occupied TotalOwner
occupiedRenter
occupied TotalOwner
occupiedRenter
occupied
MAJOR SOURCE OF DOWNPAYMENT
Home purchased or built . . . . – 68,664 – – 4,628 – – 13,194 –Sale of previous home . . . . . . . . . . . . – 21,331 – – 930 – – 5,333 –Savings or cash on hand . . . . . . . . . . – 32,862 – – 2,421 – – 5,248 –Sale of other investment . . . . . . . . . . – 655 – – 55 – – 105 –Borrowing, other than mortgage onthis property . . . . . . . . . . . . . . . . . . . . – 2,437 – – 259 – – 376 –
Inheritance or gift. . . . . . . . . . . . . . . . . – 1,677 – – 232 – – 225 –Land where building built used forfinancing . . . . . . . . . . . . . . . . . . . . . . . – 511 – – 5 – – 212 –
Other . . . . . . . . . . . . . . . . . . . . . . . . . . . – 2,761 – – 188 – – 566 –No down payment . . . . . . . . . . . . . . . . – 4,785 – – 433 – – 793 –Not reported . . . . . . . . . . . . . . . . . . . . . – 1,646 – – 106 – – 335 –
– Not applicable.... Zero or rounds to zero.
1Figures exclude manufactured/mobile homes.2Does not include cooperatives or condominiums.3Figure may not add to total, because more than one category may apply to a unit.4Excludes units where primary source of water is commercial bottled water.5Other causes and equipment breakdowns may not add to total, as both may be reported.6Limited to single attached and multiunits.7Because Hispanics may be of any race, data can overlap slightly with other groups. Most Hispanics report themselves as White, but some report them−
selves as Black or in other categories.8May reflect a temporary situation, living off savings, or response error.9Regular mortgages include all mortgages not classified as home equity or reverse.
Source: U.S. Census Bureau, 2001 American Housing Survey, National sample.

46 U.S. Census Bureau
Table A3.Characteristics of Housing Units by Structure Type and Year Built: 2001(In thousands. Data based on sample. For information on confidentiality protection, sampling error, nonsampling error, and definitions, seewww.census.gov/hhes/www/ahs.html)
Characteristic
1−unit detached 1−unit attached Unit in multiunit building Manufacturedhousing
Allhousing
units
Builtbefore
1920
Built1990 or
later
Allhousing
units
Builtbefore
1920
Built1990 or
later
Allhousing
units
Builtbefore
1920
Built1990 or
later
Allhousing
units
Built1990 or
later
STATUS
Total housing units. . . . . . . 73,427 6,190 11,118 8,428 683 1,667 28,386 2,954 3,232 8,876 3,187Seasonal units . . . . . . . . . . . . . . . . 1,900 184 215 167 8 31 385 12 85 626 112Year round units . . . . . . . . . . . . . . 71,527 6,006 10,903 8,261 675 1,636 28,001 2,942 3,147 8,249 3,075
Occupied . . . . . . . . . . . . . . . . . . . 67,129 5,487 10,301 7,305 586 1,427 24,609 2,556 2,567 7,219 2,820Vacant . . . . . . . . . . . . . . . . . . . . . 4,399 519 602 956 88 209 3,392 385 580 1,030 254
For rent . . . . . . . . . . . . . . . . . . 526 68 41 334 17 74 1,892 192 338 165 18For sale only. . . . . . . . . . . . . . 858 94 164 78 4 31 142 10 42 165 61Rented or sold . . . . . . . . . . . . 364 32 92 72 11 25 225 24 19 71 34Occasional use\URE. . . . . . . 1,268 111 209 250 15 44 731 66 167 345 63Other vacant. . . . . . . . . . . . . . 1,384 214 96 222 41 35 402 96 15 285 78
DURATION OF VACANCY
Seasonal and yearround vacant units1 . . . . . 5,250 600 667 1,007 84 220 3,333 365 548 1,424 272
Less than 1 month vacant . . . . . . 763 37 125 192 6 48 879 51 176 217 751 month up to 2 months . . . . . . . 358 28 58 50 3 11 309 18 35 67 ...2 months up to 6 months. . . . . . . 797 74 113 180 2 51 800 81 130 301 696 months up to 1 year . . . . . . . . . 450 57 48 85 13 14 223 43 37 178 201 year up to 2 years . . . . . . . . . . . 385 48 29 75 21 10 150 29 11 104 222 years or more . . . . . . . . . . . . . . . 1,132 237 26 141 26 12 316 92 14 258 14Never occupied . . . . . . . . . . . . . . . 315 4 136 59 ... 52 89 2 68 25 ...Don’t know . . . . . . . . . . . . . . . . . . . 1,049 113 131 225 13 21 567 49 76 273 71
METROPOLITAN/NONMETRO−POLITAN AREAS
Inside metropolitan statisticalareas . . . . . . . . . . . . . . . . . . . . . . . 55,079 3,597 9,025 7,722 619 1,468 25,471 2,578 2,828 4,786 1,636In central cities of MSAs . . . . . 17,070 1,399 1,763 3,464 449 383 13,868 1,923 1,052 674 205Suburbs . . . . . . . . . . . . . . . . . . . . 38,010 2,198 7,261 4,258 170 1,085 11,603 656 1,776 4,112 1,431
Outside metropolitan statisticalareas . . . . . . . . . . . . . . . . . . . . . . . 18,348 2,593 2,093 706 63 199 2,915 376 404 4,090 1,551
REGIONS
Northeast. . . . . . . . . . . . . . . . . . . . . 12,202 1,931 1,083 2,129 470 235 7,327 1,863 252 690 176Midwest . . . . . . . . . . . . . . . . . . . . . . 18,915 2,591 2,391 1,355 67 378 5,931 698 695 1,546 553South . . . . . . . . . . . . . . . . . . . . . . . 27,011 1,076 4,980 3,074 119 636 8,492 201 1,371 4,994 2,011West. . . . . . . . . . . . . . . . . . . . . . . . . 15,300 592 2,663 1,869 26 419 6,636 193 914 1,645 446
ROOMS
1 room . . . . . . . . . . . . . . . . . . . . . . . 55 4 6 34 4 3 522 149 26 11 32 rooms . . . . . . . . . . . . . . . . . . . . . . 230 11 14 131 7 2 972 153 54 72 163 rooms . . . . . . . . . . . . . . . . . . . . . . 1,334 98 89 961 60 146 7,982 833 699 421 724 rooms . . . . . . . . . . . . . . . . . . . . . . 6,692 580 506 2,217 133 424 11,088 871 1,353 3,084 6165 rooms . . . . . . . . . . . . . . . . . . . . . . 16,894 1,226 2,135 2,214 142 527 5,557 549 788 3,231 1,3546 rooms . . . . . . . . . . . . . . . . . . . . . . 19,726 1,623 2,711 1,815 187 326 1,777 300 279 1,319 6727 rooms . . . . . . . . . . . . . . . . . . . . . . 13,205 1,246 2,073 646 75 129 348 66 30 512 3038 rooms . . . . . . . . . . . . . . . . . . . . . . 8,061 694 1,726 201 24 61 52 14 ... 135 849 rooms . . . . . . . . . . . . . . . . . . . . . . 3,780 349 974 67 16 11 24 5 ... 28 2410 rooms or more . . . . . . . . . . . . . 3,450 359 885 142 33 38 62 15 4 63 43
COMPLETE BATHROOMS
None . . . . . . . . . . . . . . . . . . . . . . . . 1,333 235 74 122 28 9 458 163 11 313 551 . . . . . . . . . . . . . . . . . . . . . . . . . . . . 21,867 2,860 705 3,349 406 334 20,189 2,544 1,390 3,060 5231 and one−half . . . . . . . . . . . . . . . . 12,699 1,347 594 1,659 144 251 2,532 85 302 867 2262 or more . . . . . . . . . . . . . . . . . . . . 37,529 1,748 9,745 3,299 105 1,073 5,207 162 1,528 4,635 2,383
See footnotes at end of table.

U.S. Census Bureau 47
Table A3.Characteristics of Housing Units by Structure Type and Year Built: 2001 — Con. (In thousands. Data based on sample. For information on confidentiality protection, sampling error, nonsampling error, and definitions, seewww.census.gov/hhes/www/ahs.html)
Characteristic
1−unit detached 1−unit attached Unit in multiunit building Manufacturedhousing
Allhousing
units
Builtbefore
1920
Built1990 or
later
Allhousing
units
Builtbefore
1920
Built1990 or
later
Allhousing
units
Builtbefore
1920
Built1990 or
later
Allhousing
units
Built1990 or
later
MAIN HEATINGEQUIPMENT
Warm−air furnace . . . . . . . . . . . . . 46,869 3,654 7,723 5,037 319 1,169 13,199 970 1,789 6,699 2,441Steam or hot water system . . . . . 7,271 1,254 514 983 265 57 6,138 1,477 171 29 7Electric heat pump or built−inelectric units . . . . . . . . . . . . . . . . . 10,063 236 2,404 1,579 25 359 5,747 168 1,089 1,232 629
Other . . . . . . . . . . . . . . . . . . . . . . . . 8,688 957 446 723 66 69 3,051 322 176 791 96None . . . . . . . . . . . . . . . . . . . . . . . . 536 90 32 107 8 12 250 16 7 124 13
PLUMBING
With all plumbing facilities . . . . . . 72,023 5,967 11,052 8,304 664 1,660 27,677 2,815 3,204 8,585 3,139Lacking some or all plumbingfacilities2 . . . . . . . . . . . . . . . . . . . . 1,404 223 66 124 18 7 709 138 28 291 48No hot piped water . . . . . . . . . . 792 156 18 43 6 6 224 69 23 239 3No bathtub and no shower . . . 629 111 25 39 6 6 227 88 19 126 37No flush toilet . . . . . . . . . . . . . . . 587 92 21 32 3 6 233 91 19 124 37No exclusive use . . . . . . . . . . . . 534 59 14 75 10 6 427 43 19 54 3
MAIN HOUSE HEATING FUEL
Housing units withheating fuel . . . . . . . . . . . . . 72,843 6,097 11,086 8,316 672 1,655 28,135 2,938 3,225 8,736 3,174
Electricity. . . . . . . . . . . . . . . . . . . . . 17,418 458 3,806 3,337 77 738 12,829 342 2,120 4,031 1,931Gas. . . . . . . . . . . . . . . . . . . . . . . . . . 46,004 4,043 6,717 4,387 400 893 12,192 1,779 1,035 3,876 1,123Fuel oil. . . . . . . . . . . . . . . . . . . . . . . 6,786 1,162 386 552 185 24 2,904 786 55 290 36Other . . . . . . . . . . . . . . . . . . . . . . . . 2,636 433 178 40 10 ... 210 30 16 538 84
TENURE
Occupied units. . . . . . . . . . . 67,129 5,487 10,301 7,305 586 1,427 24,609 2,556 2,567 7,219 2,820Owner occupied. . . . . . . . . . . . . . . 59,239 4,523 9,888 3,722 313 869 3,303 359 368 6,001 2,541
Percent of all occupied. . . . . . . 88.2 82.4 96.0 51.0 53.4 60.9 13.4 14.0 14.3 83.1 90.1Renter occupied. . . . . . . . . . . . . . . 7,890 964 414 3,583 273 558 21,306 2,197 2,199 1,218 279
WATER LEAKAGE DURINGLAST 12 MONTHS
Occupied units. . . . . . . . . . . 67,129 5,487 10,301 7,305 586 1,427 24,609 2,556 2,567 7,219 2,820No leakage from insidestructure . . . . . . . . . . . . . . . . . . . . 60,892 4,912 9,526 6,521 509 1,331 21,166 2,162 2,344 6,341 2,584
With leakage from insidestructure2 . . . . . . . . . . . . . . . . . . . 5,378 483 656 693 73 76 3,116 366 195 798 219Fixtures backed up oroverflowed . . . . . . . . . . . . . . . . 1,781 187 199 213 33 24 860 87 39 204 42
Pipes leaked. . . . . . . . . . . . . . . . 2,128 218 257 342 34 28 1,576 192 95 394 79Broken water heater . . . . . . . . . 590 32 64 75 8 14 234 13 7 146 52Other or unknown(includes not reported) . . . . . . 1,277 83 172 148 6 20 747 97 60 163 64
Interior leakage not reported . . . . 859 92 120 91 5 20 327 29 28 80 17No leakage from outsidestructure . . . . . . . . . . . . . . . . . . . . 57,475 4,216 9,303 6,434 455 1,325 22,141 2,210 2,386 6,323 2,590
With leakage from outsidestructure2 . . . . . . . . . . . . . . . . . . . 8,794 1,183 876 780 127 84 2,143 315 149 818 213Roof . . . . . . . . . . . . . . . . . . . . . . . 4,321 571 396 408 76 38 1,120 181 59 581 130Basement . . . . . . . . . . . . . . . . . . 3,505 635 248 197 42 17 154 30 8 5 ...Walls, closed windows, ordoors . . . . . . . . . . . . . . . . . . . . . 1,371 121 214 183 26 29 793 93 68 204 61
Other or unknown (includesnot reported). . . . . . . . . . . . . . . 758 58 125 86 4 6 351 42 20 123 41
Exterior leakage not reported . . . 860 88 122 90 5 18 325 32 31 78 17
See footnotes at end of table.
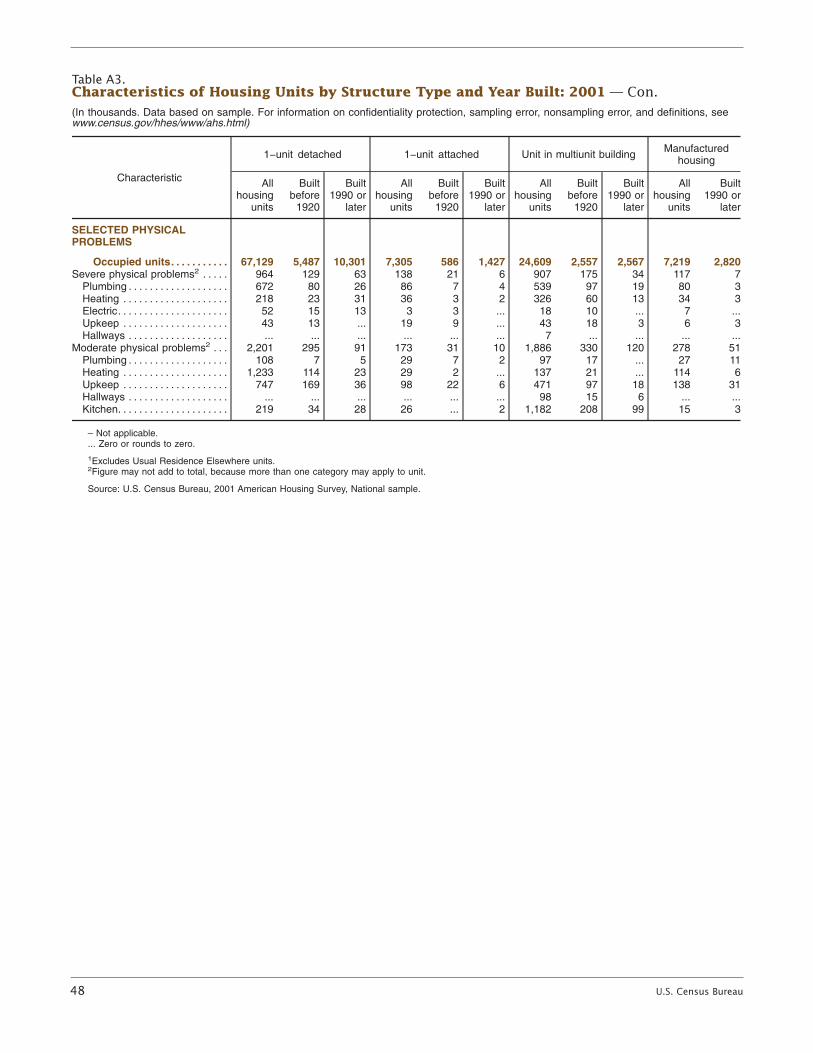
48 U.S. Census Bureau
Table A3.Characteristics of Housing Units by Structure Type and Year Built: 2001 — Con.(In thousands. Data based on sample. For information on confidentiality protection, sampling error, nonsampling error, and definitions, seewww.census.gov/hhes/www/ahs.html)
Characteristic
1−unit detached 1−unit attached Unit in multiunit building Manufacturedhousing
Allhousing
units
Builtbefore
1920
Built1990 or
later
Allhousing
units
Builtbefore
1920
Built1990 or
later
Allhousing
units
Builtbefore
1920
Built1990 or
later
Allhousing
units
Built1990 or
later
SELECTED PHYSICALPROBLEMS
Occupied units. . . . . . . . . . . 67,129 5,487 10,301 7,305 586 1,427 24,609 2,557 2,567 7,219 2,820Severe physical problems2 . . . . . 964 129 63 138 21 6 907 175 34 117 7
Plumbing . . . . . . . . . . . . . . . . . . . 672 80 26 86 7 4 539 97 19 80 3Heating . . . . . . . . . . . . . . . . . . . . 218 23 31 36 3 2 326 60 13 34 3Electric. . . . . . . . . . . . . . . . . . . . . 52 15 13 3 3 ... 18 10 ... 7 ...Upkeep . . . . . . . . . . . . . . . . . . . . 43 13 ... 19 9 ... 43 18 3 6 3Hallways . . . . . . . . . . . . . . . . . . . ... ... ... ... ... ... 7 ... ... ... ...
Moderate physical problems2 . . . 2,201 295 91 173 31 10 1,886 330 120 278 51Plumbing . . . . . . . . . . . . . . . . . . . 108 7 5 29 7 2 97 17 ... 27 11Heating . . . . . . . . . . . . . . . . . . . . 1,233 114 23 29 2 ... 137 21 ... 114 6Upkeep . . . . . . . . . . . . . . . . . . . . 747 169 36 98 22 6 471 97 18 138 31Hallways . . . . . . . . . . . . . . . . . . . ... ... ... ... ... ... 98 15 6 ... ...Kitchen. . . . . . . . . . . . . . . . . . . . . 219 34 28 26 ... 2 1,182 208 99 15 3
– Not applicable.... Zero or rounds to zero.
1Excludes Usual Residence Elsewhere units.2Figure may not add to total, because more than one category may apply to unit.
Source: U.S. Census Bureau, 2001 American Housing Survey, National sample.

U.S. Department of CommerceEconomics and Statistics AdministrationU.S. CENSUS BUREAU
Washington, DC 20233
OFFICIAL BUSINESS
Penalty for Private Use $300
FIRST−CLASS MAILPOSTAGE & FEES PAIDU.S. Census Bureau
Permit No. G−58