Thermophysical Properties of Ethane - Standard Reference Data · New correlations for the...
74
Journal of Physical and Chemical Reference Data 20, 275 (1991); https://doi.org/10.1063/1.555881 20, 275 © 1991 American Institute of Physics for the National Institute of Standards and Technology. Thermophysical Properties of Ethane Cite as: Journal of Physical and Chemical Reference Data 20, 275 (1991); https://doi.org/10.1063/1.555881 Submitted: 28 November 1989 . Published Online: 15 October 2009 Daniel G. Friend, Hepburn Ingham, and James F. Fly ARTICLES YOU MAY BE INTERESTED IN Thermophysical Properties of Fluids. II. Methane, Ethane, Propane, Isobutane, and Normal Butane Journal of Physical and Chemical Reference Data 16, 577 (1987); https:// doi.org/10.1063/1.555785 A Reference Equation of State for the Thermodynamic Properties of Ethane for Temperatures from the Melting Line to 675 K and Pressures up to 900 MPa Journal of Physical and Chemical Reference Data 35, 205 (2006); https:// doi.org/10.1063/1.1859286 Ideal Gas Thermodynamic Properties of Ethane and Propane Journal of Physical and Chemical Reference Data 2, 427 (1973); https:// doi.org/10.1063/1.3253123
Transcript of Thermophysical Properties of Ethane - Standard Reference Data · New correlations for the...
Journal of Physical and Chemical Reference Data 20, 275 (1991); https://doi.org/10.1063/1.555881 20, 275
© 1991 American Institute of Physics for the National Institute of Standards and Technology.
Thermophysical Properties of EthaneCite as: Journal of Physical and Chemical Reference Data 20, 275 (1991); https://doi.org/10.1063/1.555881Submitted: 28 November 1989 . Published Online: 15 October 2009
Daniel G. Friend, Hepburn Ingham, and James F. Fly
ARTICLES YOU MAY BE INTERESTED IN
Thermophysical Properties of Fluids. II. Methane, Ethane, Propane, Isobutane, and NormalButaneJournal of Physical and Chemical Reference Data 16, 577 (1987); https://doi.org/10.1063/1.555785
A Reference Equation of State for the Thermodynamic Properties of Ethane for Temperaturesfrom the Melting Line to 675 K and Pressures up to 900 MPaJournal of Physical and Chemical Reference Data 35, 205 (2006); https://doi.org/10.1063/1.1859286
Ideal Gas Thermodynamic Properties of Ethane and PropaneJournal of Physical and Chemical Reference Data 2, 427 (1973); https://doi.org/10.1063/1.3253123
Thermophysical Properties of Ethane
Daniel G. Friend, Hepburn Ingham, and James F. Ely
Thermophysics Division, National Institute of Standards and Technology, Boulder, CO 80303
Received November 28, 1989; revised manuscript received July 18, 1990
New correlations for the thermophysical properties of fluid ethane are presented. The correlations are based on a critical evaluation of the available experimental data and have been developed to represent these data over a broad range of the state variables. Estimates for the accuracy of the equations and comparisons with measured properties are given. The reasons for this new study of ethane include significant new and accurate data and improvements in the correlating functions which allow increased accuracy of the correlations - especially in the extended critical region. Short tables of the thermophysical properties of ethane are included. This study complements an earlier study of methane and uses the same correlating equations and format.
For the thermodynamic properties, a classical equation for the molar Helmholtz energy, which contains terms multiplied by the exponential of the quadratic and quartic powers of the system density, is used. The resulting equation of state is accurate from about 90 K to 625 K for pressures less than 70 MPa and was developed by considering PIT, second virial coefficient, heat capacity, and sound speed data. Tables of coefficients and equations are presented to allow the calculation of these and other thermodynamic quantities. Ancillary equations for properties along the liquid-vapor phase boundary, which are consistent with the equation of state and lowest order scaling theory, are also given.
For the viscosity of ethane, a contribution based on a theoretical fit of low-density data is combined with an empirical representation of the excess contribution. The approximate range of the resulting correlation is 90 K to 500 K for pressures less than 60 MPa. The correlation for the thermal conductivity includes a theoretically based expression for the critical enhancement; the range for the resulting correlation is about 90 K to 600 K for pressures below 70 MPa.
Key words: correlation; density; equation of state; ethane; heat capacity; phase boundary; pressure; speed of sound; thermal conductivity; therrnophysical properties; transport properties; virial coefficients; viscosity.
Contents
1. Introduction. . . . . . . . . . . . . . . . . . . . . . . . . . . . . . . .. 278 1.1. Need for This Correlation ............... 278 1.2. Range of Correlations. . . . . . . . . . . . . . . . . .. ZI9
2. Correlating Equations ........................ 280 2.1. Equation of State . . . . . . . . . . . . . . . . . . . . . .. 280 2. 2. Ideal Gas Reference State Equation ..... 280 2. 3. Liquid-Vapor Saturation Boundary ....... 282 2.4. Derived Property Equations ............. 284 2.5. Transport Property Correlations ......... 286
2.5.1. Dilute Gas Correlation ............ 287 2.5.2. Excess Property Correlation. . . . . . .. 290 2.5.3. Critical Enhancement Correlation .. 290
©1991 by the U.S. Secretary of Commerce on behalf of the United States. This copyright is assigned to the American Institute of Physics and the American Chemical Society. Reprints available from ACS; see Reprints List at back of issue.
0047-2689/91/020275-73/$9.00 275
3. Development of the Correlations . . . . . . . . . . . .. 293 3.1. Fundamental Constants, Fixed Points, and
Ideal (jas Properties.. . . . . . . . . . . . . . . . . . .. 293 3.2. Ancillary Equations for the Two-Phase
Boundary. . . . . . . . . . . . . . . . . . . . . . . . . . . . . .. 294 3.3. Residual Helmholtz Energy. . . . . . . . . . . . .. 295 3.4. Transport Property Correlations ......... 298
3.4.1. Viscosity .......................... 298 3.4.2. Thermal Conductivity .............. 299
4. Comparisons of Derived and Experimental Properties. . . . . . . . . . . . . . . . . . . . . . . . . . . . . . . . . .. 299 4.1. Two-Phase Boundary .................... 300 4.2. Ideal Gas Properties ... .. . .. . . . . . . . . .. .. 304 4.3. Thermodynamic Properties from the
SWEOS ................................ 306 4.3.1. Second Viral Coefficient Data ..... 306 4.3.2. PIT Data ......................... 307 4.3.3. Heat Capacities ................... 314 4.3.4. Sound Speed ...................... 320
J. Phys. Chern. Ref. Data, Vol. 20, No.2, 1991
276 FRIEND, INGHAM, AND ELY
4.4. Transport Property Comparisons. . . .. 324 4.4.1. Viscosity .......................... 324 4.4.2. Thermal Conductivity. . . . . . . . . . . . .. 328
5. Conclusions. . . . . . . . . . . . . . . . . . . . . . . . . . . . . . . .. 333 6. Acknowledgments. . . . . . . . . . . . . . . . . . . . . . . . . .. 333 7. References. . . . . . . . . . . . . . . . . . . . . . . . . . . . . . . . .. 333 8. Appendix. . . . . . . . . . . . . . . . . . . . . . . . . . . . . . . . . .. 336
List of Tables
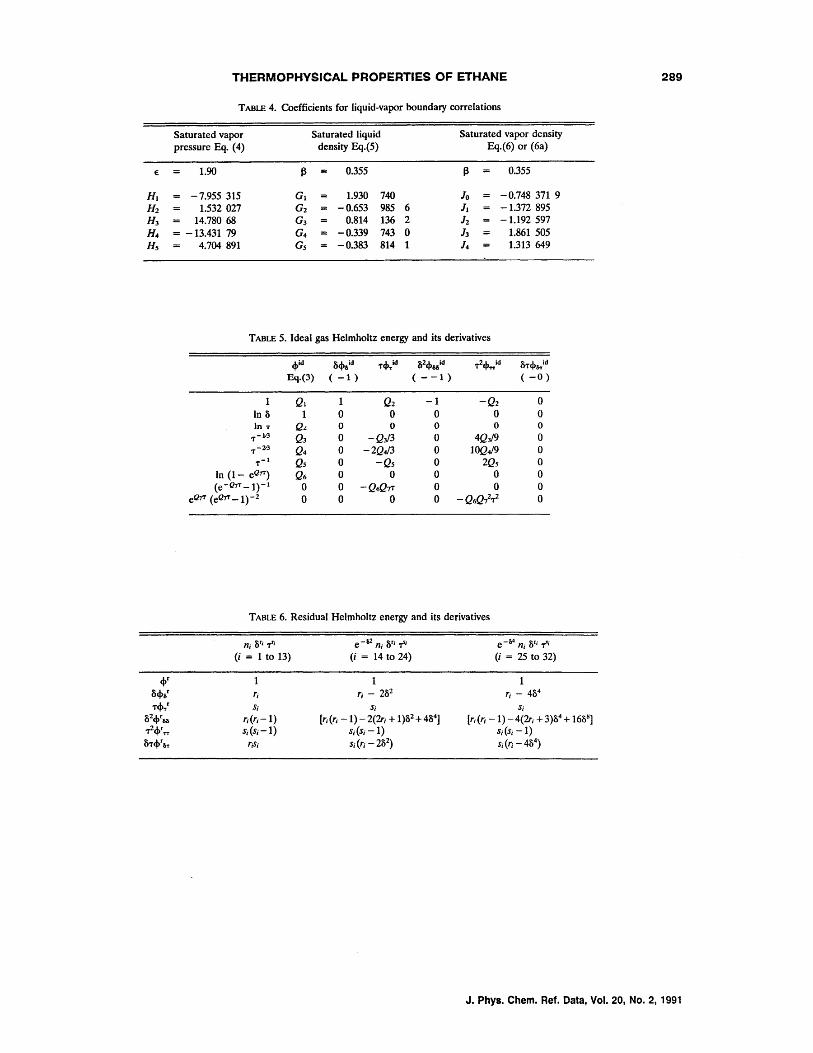
1. Fixed point constants and other parameters used in the correlations . . . . . . . . . . . . . . . . . . . .. 280
2. Exponents and coefficients for the residual Helmholtz energy <f>f, Eq. (2) . . . . . . . . . . . . . . .. 288
3. Coefficients for ideal gas Helmholtz energy, Eq. (3) ..................................... 288
4. Coefficients for liquid-vapor boundary correla-tions ....................................... 289
5. Ideal gas Helmholtz energy and its derivatives 6. Residual Helmholtz energy and its derivatives. 289 7. Thermodynamic property equations ........... 291 8. Coefficients for dilute gas transport properties. 291 9. Coefficients for excess transport properties .... 292 10. Constants for her, Eq. (18) [using Eqs. (19) and
(20)] ....................................... 292 11. Statistics for thermodynamic property data ver-
sus SWEOS correlation ..................... 302 12. Sources of PIT data.. . .. .. . .. . .. . .. . .. .. .... 307 13. Sources of heat capacity data ................ 319 14. Sources of sound speed data ........ '" .. " ., 322 15. Sources of viscosity data at elevated pressures. 325 16. Sources of thermal conductivity data at ele-
vated pressures ............................. 330 AI. Properties of ideal gas at O. 1 MPa and dilute
gas transport properties. . . . . . . . . . . . . . . . . . . .. 336 A2. Properties along saturation boundary. . . . . . . .. 337 A3. Properties of ethane in the single-phase
region ...................................... 339
List of Figures
1a. Pressure-density plot with 2-phase dome and labelled isotherms ........................... 281
lb. Pressure-temperature plot with saturation line and labelled isochores .................... , .. 282
Ie. Pressure-temperature data map for equation of state ....................................... 283
2a. Viscosity versus temperature and density. . . . .. 284 2b. Pressure-temperature data map for primary
viscosity data ............................... 285 3a. Thermal conductivity versus temperature and
density . . . . . . . . . . . . . . . . . . . . . . . . . . . . . . . . . . . .. 286 3b. Pressure-temperature data map for primary
thermal conductivity data .................... 287
J. Phys. Chern. Ref. Data, Vol. 20, No.2, 1991
4. Deviations of calculated saturation pressures versus temperature .......................... 301
5. Deviations of calculated saturated liquid densi-ties versus temperature. . . . . . . . . . . . . . . . . . . . .. 303
6. Deviations of calculated saturated vapor densi-ties versus temperature. . . . . . . . . . . . . . . . . . . . .. 304
7. Deviations of calculated ideal gas properties versus temperature .......................... 305
8. Deviations of calculated second virial coeffi-cients versus temperature ................... 306
9a. Deviations of calculated pressures versus pres-sure, 90-200 K - primary data. . . . . . . . . . . . .. 309
9b. Deviations of calculated densities versus den-sity, 90-200 K - primary data ............... 310
lOa. Deviations of calculated pressures versus pres-sure, 200-280 K - primary data ............. 311
lOb. Deviations of calculated densities versus den-sity, 200-280 K - primary data .............. 312
I1a. Deviations of calculated pressures versus pres-sure, 280-315 K - primary data ............. 313
lIb. Deviations of calculated densities versus den-sity, 280-315 K - primary data .............. 314
12a. Deviations of calculated pressures versus pres-sure, 315-625 K - primary data ............. 314
12b. Deviations of calculated densities versus den-sity, 315-625 K - primary data .............. 316
13. Deviations of calculated pressures versus pres-sure, secondary data . . . . . . . . . . . . . . . . . . . . . . .. 317
14. Deviations of calculated densities versus den-sity, secondary data ......................... 318
15. Deviations of calculated molar isochoric heat capacities versus density ..................... 319
16. Deviations of calculated molar isobaric heat ca-pacities versus pressure ..................... 320
17. Deviations of calculated molar heat capacity of the saturated liquid versus temperature. . . . .. 321
18. Deviations of calculated speeds of sound in single-phase region versus density . . . . . . . . . . . . .. 322
19. Deviations of calculated speeds of sound in sat-urated liquid versus temperature ............. 323
20. Deviations of calculated dilute gas viscosities versus temperature .......................... 325
21a. Deviations of calculated viscosities versus den-sity ......................................... 326
21b.Deviations of calculated viscosities versus den-sity-data from [24,96] ...................... 327
22. Deviations of calculated dilute gas thermal conductivities versus temperature. . . . . . . . . . .. 329
23. Critical enhancement of the thermal conductiv-ity versus density ............................ 330
24a. Deviations of calculated thermal conductivities versus density-primary data ................ 331
24b. Deviations of calculated thermal conductivities versus density-secondary data .............. 332
THERMOPHYSICAL PROPERTIES OF ETHANE 277
List of Symbols and Units
Symbol Description SI Units Reference (used in text)
A Molar Helmholtz energy J'mol-1 a Eq. (1) AAD Average absolute deviation Sec. 4 B Second virial coefficient dm3'mol-1 Table(7) BIAS Average deviation Sec. 4 BWR Benedict-Webb-Rubin EOS Ref. [10] C Expansion coefficient in Pay Eq. (6b) Ci Coefficients in .{1<2,2)* Eq. (12), Table(8) Cp Molar isobaric heat capacity J'mol-1'K-1 Table(7) Cv Molar isochoric heat capacity J'mol-1'K-1 Table(7) EOS Equation of state Sec. 1 F Crossover function in Acr Eqs. (18),(20) jint, ji Contribution from internal modes Eqs. (13),(14),
Table(8) G Molar Gibbs energy J'mol-1 TabJe(7) Gi Coefficients in Pa Eq. (5), Table( 4) gi Coefficients in 1'\ex Eq. (15), Table(9) H Molar enthalpy J'mol- l Tables(l ),(7) Hi Coefficients in Pa Eq. (4), Table(4) Ji Coefficients in paV Eq. (6), Table(4) ji Coefficients in Aex Eq. (17), Table(9) k Boltzmann constant J'K-1 Table(l) Mr Relative molecular mass Table(1) NA Avogadro constant mol-1 Table(l) ni Coefficients in <l>T Eq. (2), Table(2) P Pressure MPa Pa* Reduced saturation pressure, Pa/Pc Eq. (6a) Qi Coefficients in <l>id Eq. (3), Table(3) qo Wavenumber cutoff nm-1 Eq. (20), Table(10) R Gas constant J'mol-1'K-1 Table(l) RMS Root mean square deviation Sec. 4 r Intermolecular separation nm Eq. (11) ri Exponent of 0 Eqs. (2),(15),(17),
Tables(2),(9) S Molar entropy J·mol-1·K- 1 Eq. (24), Table(7) Sj Exponent of T Eqs. (2),(15),(17),
Tables(2),(9) 1 Reduced temperature, kT IE Eqs. (10),(12) T Temperature, IPTS--68 K T* Reduced temperature, (Te - T)/Te Eq. (4-6) U Molar internal energy J'mol- 1 Table(7) u Unified atomic mass unit Table(l) V Intermolecular potential J Eq. (11) w Speed of sound m's- l Table(7) Z Compressibility factor, P /RT p Eq. (6)
Greek ex Scaling exponent Ref. [15] J3 Scaling exponent in paL,pcrV Eqs. (5),(6), Table(4) fo Critical amplitude Eq. (19), Table(10) 'Y Potential parameter Ref. [13] 'Y Scaling exponent Eq. (19), Table(10) 0 Reduced density, pIPe
J. Phys. Chern. Ref. Data, Vol. 20, No.2, 1991
278 FRIEND, INGHAM, AND ELY
Symbol Description SI Units Reference (used in text)
e Scaling exponent in P fH 2 - a Eq. (4),Table(4) e Small temperature difference K Eq. (24) e Energy parameter in V(r) J See elk elk Energy parameter in V(r) K Eq. (11), Table(I) .•
" Shear viscosity J.LPa·s Eq. (8) A Coupling constant in Acr Eq. (18), Table(10) A Thermal conductivity mW'm-1'K-1 Eq. (9) v Scaling exponent Eq. (19), Table(10) ~ Correlation length nm Eqs. (18 - 20) ~o Correlation length amplitude nm Eq. (20), Table(10) p Molar density mol·dm-3
rr Distance parameter in V(r) nm EQs. (10),(11), Table(1) T Reduced inverse temperature,T JT <t> Reduced Helmholtz energy, A /RT Eq. (1) 0(2,2)* Reduced collision integral Eqs. (10),(12)
Superscripts id Ideal gas contribution Eq. (1), Table(1) r Residual contribution Eq. (1)
Subscripts c Value at critical point Table(1) cr Critical contribution Eqs. (9),(18) ex Excess contribution Eqs. (8),(9),(15),(17) exp Value from experiment Eq. (26) t Value at triple point Table(1) tL,tV Value at triple point in liquid,vapor Table(1) rr Value at saturation boundary Eq. (4) rrL,rrV Value in saturated liquid, vapor Eqs. (5),(6),(25) 8 Partial derivative with respect to 8 Tables(5),(6) T Partial derivative with respect to ,. Tables(5),(6) 0 Value at zero density Eqs. (8)-(10),(13)
3Throughout this paper, extensive physical quantities are given on a molar basis. The elementary entities are the ethane (C2H6) molecules.
1. Introduction
1.1. Need for This Correlation
Because ethane is both an industrially important fluid and the second member of the vitally interesting alkane series, we have felt it necessary to examine the newly available thermophysical property data and to re-evaluate the older data to produce more useful and accurate correlations. We have studied the primary homologue, methane, in previous publications;1,2 this work reports a parallel study for ethane, and the form of the correlations and presentation are essentially identical.
In this paper we present an empirical equation of state for ethane based on extensive mUltiproperty analysis, as well as correlations for ideal gas properties, the liquidvapor phase boundary, and for the viscosity and thermal conductivity of ethane. Tables of coefficients for these
J. Phys. Chern. Ref. Data, Vol. 20, No.2, 1991
correlating equations and graphical representations of the functions for easy accessibility of estimated values of certain properties are included. Discussions of the accuracy of these correlations and their applicable ranges, and explicit comparisons with experimental data are also given. In an Appendix, we have compiled very brief tables of thermophysical properties in the ideal or dilute gas limit, along the liquid-vapor phase boundary, and in the one-phase region. Extensive tables of properties and comparisons with experimental data will be published separately.3,3a
Although· there have been some experimental studies of ethane subsequent to the 1976 publication of the technical note by Goodwin et aZ.4 and the more recent correlation of Younglove and Ely,lO the primary reason for these correlations is to provide thermodynamic and transport property surfaces which are completely compatible with those developed for the methane fluid. 1,2 This com-
THERMOPHYSICAL PROPERTIES OF ETHANE 279
patibility will allow development and testing of mixture theories based on corresponding states models. The recently translated monograph by Sychev et al.s provides an extensive discussion of the available thermodynamic data through 1980 as well as an alternative wide-range correlation.
The present thermodynamic surface, based on the Schmidt-Wagner equation of state (SWEOS),6 exhibits a greater conformity to known scaling behavior in the general region of the critical point than many established classical equations of state. Thus, while retaining the simplicity of classical algebraic representations, our correlation allows more accuracy in calculating thermodynamic properties around the critical point. We have not reformulated the equation of state based on implementation of an algorithm such as the evolutionary optimization method (EOM) or its variants.6a Our optimization is based on linear least-squares determination of the coefficients of the SWEOS with emphasis placed on data evaluation, selection, and weighting; non-linear routines are used in our treatment of the data. For modelling and theoretical work on mixture thermodynamics, it is useful to use identical formulations of the pure fluid equations of state. This is an important reason for retaining the SWEOS for our work on ethane. Other choices for the equation of state, such as those generated by an EOM or those with additional coefficients or other degrees of freedom, and different data selection would generate different statistical agreement between experimental data and the correlation; our SWEOS provides an optimum description of the thermodynamic surface within the constraints which we have outlined and with the estimated uncertainties as described in Sec. 4.
Among the extensive multiproperty data used in the algorithms for computing the coefficients in the SWEOS, we have incorporated both PVT and Cv points generated from a scaled EOS. As for any classical equation of state, the asymptotically critical region is not strictly correct.
For the transport properties in the dilute gas, we use the Chapman-Enskog theory7 directly for viscosity and with an improved treatment of internal degrees of freedom for the thermal conductivity. The necessary collision integral, based on the 11-6-8, 'Y = 3 interparticle potential and tabulated in Ref. 8, was represented by a simple function. The excess functions are represented by polynomial or rational polynomial approximations and have been scaled by corresponding states arguments. Finally, the critical enhancement term, vitally important for the thermal conductivity correlation over a broad region of the phase diagram, is based on a very recent mode-coupling theory of Olchowy and Sengers.9 These transport property correlations differ from and supercede those recently published by Younglove and Ely.lo
1.2. Range of Correlations
For the equation of state correlation, we have examined PVI' data in the range 90 K < T < 623 K, 0.1 MPa < P < 69 MPa, and 0.03 mol·dm- 3 < p < 22 mol'dm-3
,
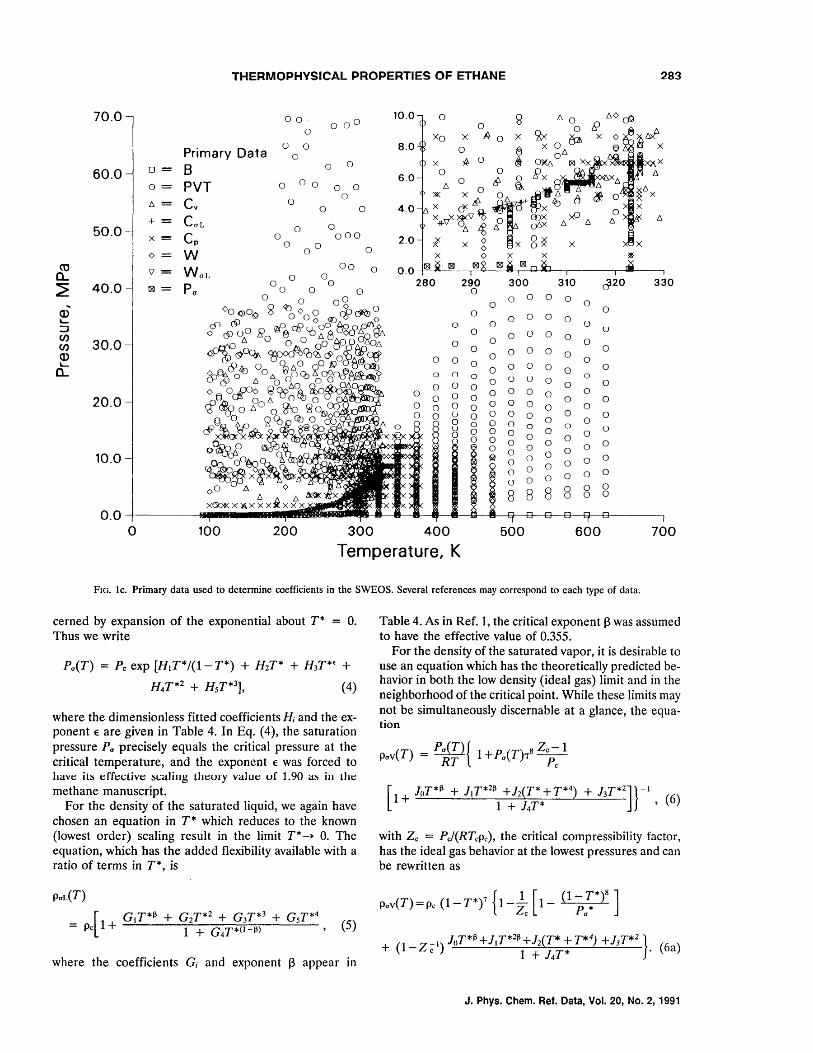
as well as virial coefficient, heat capacity, and sound speed data. For the broad range of the phase diagram with pressures less than 70 MPa, we estimate the accuracy of our correlation to be about 0.2% (standard deviation) when evaluating the density given the temperature and pressure, and 1 % when evaluating the pressure given the temperature and density. In the neighborhood of the critical point, the accuracy deteriorates to 0.5% for density calculations. Detailed comparisons with experimental data and estimates of the quality of the correlation in different regions of the phase diagram are given in Sec. 4. For the derived properties, the accuracy of the correlation is somewhat less, with details given in Sec. 4.3. In Figs. 1a and 1b, we give representations of the phase diagram for ethane, together with isochores and isotherms, from which the interested reader can determine a rough approximation to the scope of the PIT relation presented here. In Fig. lc, we present a map of the primary data used to establish the SWEOS. Within each category of data shown in Fig. 1c, there may be several primary references. Detailed discussion of the data selection is given in Sec. 3.3.
To produce an accurate correlation for the equation of state and derived properties of a fluid, especially one that is to be useful for corresponding states calculations, it is necessary to have accurate values for the critical and triple-point parameters and a good correlation or an accurate and dense set of data for the two-phase boundaries and ideal gas properties. The selected values of the critical and triple point parameters, with uncertainties, are given in Table 1. Details of the selection are given in Sec. 3.1. The equations determined for the saturation pressures and the saturated liquid and vapor densities agree with lowest order scaling theory and are given in Sec. 2.3; they are illustrated in Figs. 1a and lb. The estimated accuracies of these correlations are generally 0.1 % for the pressure, 0.3% for the liquid density, and 0.3% for the vapor density, but the accuracies deteriorate near the triple point and critical point temperatures. as discussed in Sec. 4.1. The equation for the ideal gas properties follows that given in Ref.1 and reproduces spectroscopically derived ideal gas entropies to within 0.1 % and isobaric heat capacities to within 0.2% in the temperature range 90-700 K.
The form of the SWEOS, together with values of certain reference point parameters (also given in Table 1) and the ideal gas properties, allows easy determination of many of the derived thermodynamic properties. In Table 7 below we have collected the explicit algebraic forms, in a manner quite similar to the original tables of Schmidt and Wagner/ which will allow one to evaluate several of these quantities. Comparisons with some experimental data and estimates of the accuracy of the derived property correlations are given in Sec. 4.3. The accuracy of the correlation decreases as the order of the derivatives increases and again, the accuracy generally is lower in the critical region than in other regions of the surface. One may use the SWEOS to determine any other thermodynamic properties, throughout the range of the
J. Phys. Chern. Ref. Data, Vol. 20, No.2, 1991
280 FRIEND, INGHAM, AND ELY
correlations, by using the usual relationships of thermodynamics; care must be taken in the critical region and when using higher order derivatives.
The available experimental data for the transport properties are not nearly as extensive as those for equilibrium properties. The temperature range for the viscosity is 95 to 500 K; the pressure range is 0.1 to 69 MPa; and the density range is 0.04 to 22 mol·dm- 3
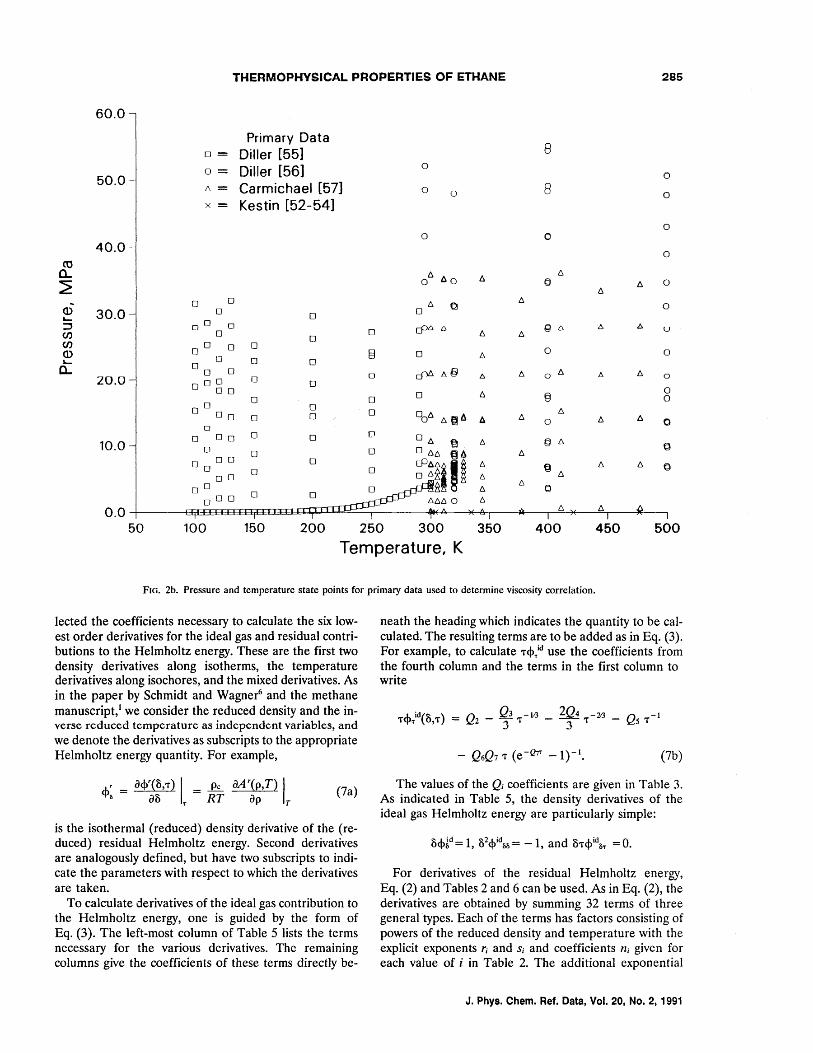
• In this region of the phase diagram, the extrema of the viscosity are 9 and 1100 ~Pa·s. The viscosity correlation given in Sec. 2.5 has an associated uncertainty of about 2%. Figure 2a depicts the relationships among viscosity, temperature, and density, and again enables the reader to obtain a crude value for this property without evaluation of the algebraic expression given in Sec. 2. Figure 2b illustrates the pressure-temperature state points for the primary data used to determine the viscosity correlation. A comprehensive discussion of these primary data is given in Sec. 3.4.1.
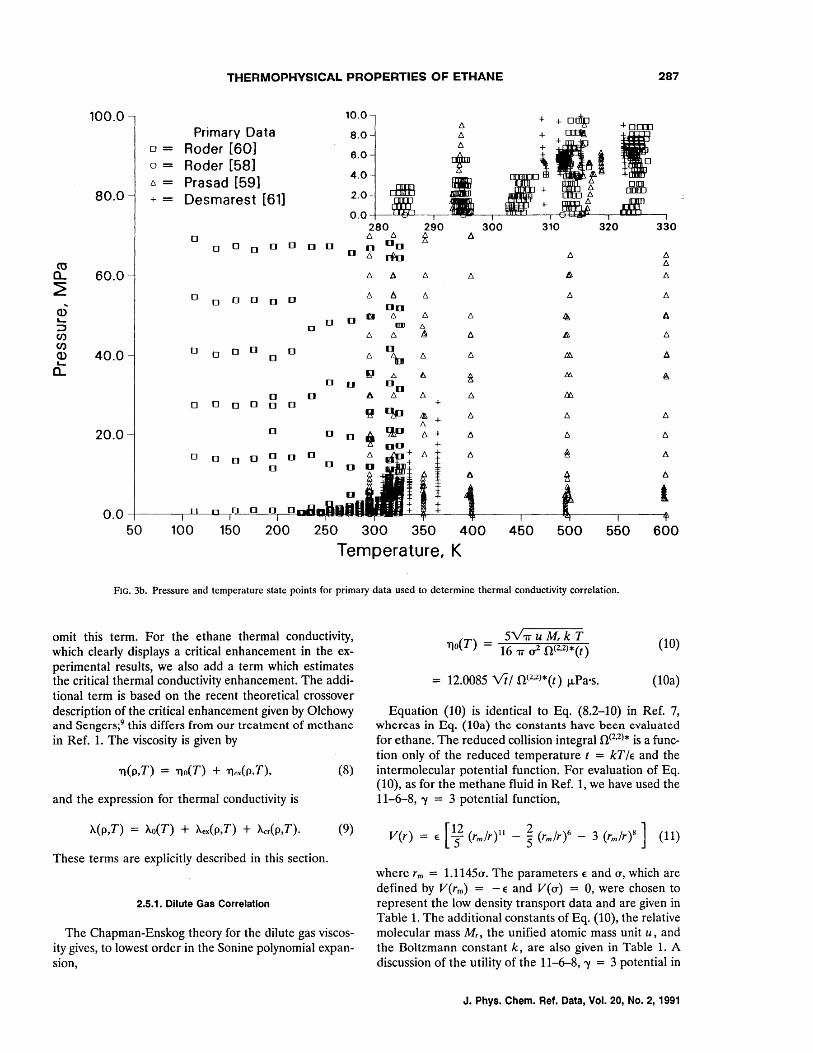
The useful experimental data for thermal conductivity are between 112 and 600 K, 0.1 and 100 MPa, and 0.03 and 22 mol·dm -3, with resulting range in }.. of 13 to 270 mW·m-1·K-l. The thermal conductivity correlation has an uncertainty of about 2% and is shown in Fig. 3a. The primary data are shown in a pressure-temperature map in Fig. 3b. These data are discussed in Sec. 3.4.2.
TABLE 1. Fixed point constants and other parameters used in the correlations
Triple point:a
Critical point:
Intermolecular
TI = 90.352 ± 0.005 K b Ref. [19] PI = 1.130 ± 0.005 Pa Eq. (4) PI = 21.667 ± 0.01 mol'dm -3 Eq. (5)
PIV = 1.504 ± 0.02 mol·dam- 3 Eq. (6)
Tc = 305.33 ± 0.04 K c
Pc = 4.8718 ± 0.005 MPa Pc = 6.87 ± 0.1 mol·dm-3
Zc = 0.279 34 ± 0.005
Ref. [22] Ref. [22] Ref. [22] Calculated
potential Elk = 245.0 K (1 = 0.436 82 nm Sec. 3.4.1 parameters:
Ideal Gas referent.:e puint values:
Miscellaneous: Relative
(at 298.15 K and 0.101 325 MPa) S;d = 229.12 J'K-1'mu\-1 Ref. [11] Hid = 11.874 kJ'mol- 1 Ref. [11]
molecular mass Mr = 30.070 Ref. [17]
Universal gas constant
Boltzmann constant
Avogadro constant
Unified atomic mass unit
Ref. [16]
k = 1.380658 x 10⁻²³ J·K-' Ref. [16]
NA = 6.022 1367 x 1023 mol-I Ref. [16]
u = 1.660 540 2 x 10-27 kg Ref. [16]
aUncertaintics presented in this table are discussed in Sec. 3 and do not always agree with those given in the source references.
hThis corresponds to 90.360 K on ITS-90 scale. 7his corresponds to 305.32 K on ITS-90 scale.
J. Phys. Chern. Ref. Data, Vol. 20, No.2, 1991
2. Correlating Equations
In this section, we describe all the equations used in our correlations of the thermodynamic surface and transport properties. The data selection for establishing the coefficients and parameters is discussed in Sec. 3, and explicit and extensive comparisons between the correlations and experimental data are given in Sec. 4.
2.1. Equation of State
As indicated above, we have used the form of the residual equation of state presented by Schmidt and Wagner in Ref. 6. This SWEOS was introduced as an improvement over the Benedict-Webb-Rubin (BWR)IO equation, especially to represent data in the extended critical region. The general form includes terms multiplied by exp[ - (p/Pc)4] in addition to terms with exp[ - (p/Pc)2] as occur in the BWR equation. The critical density pe and critical temperature Tc are used as reduction parameters; the specific polynomial in reduced temperature and density (and the exponential terms) was determined by Schmidt and Wagner.6 They used a selection algorithm with a set of 336 terms which were optimized to best fit the wide ranging data for oxygen. We have retained this choice of polynomial, because it seems also to improve the fit for methane in Ref. 1 and for ethane.
As in Ref. 6, we consider the molar Helmholtz energy A as the sum of ideal and residual terms and write
A (p,T) = Aid + Ar = RT<f> = RT(<f>id + <f>l (1)
With the definitions 0 = pipe and T = TJT, the dimensionless residual term becomes
13 24 32 <f{=In;o'iTsi + e-&2 In;OriTSi + e-&4 kn;OriTsi. (2)
;=1 ;=14 ;=25
The coefficients n;, determined by fitting the data, and the specific exponents rj and Sj arc givcn in Table 2. Equation (2) and Table 2 are essentially the same as Eq. (11) in the paper by Schmidt and Wagner6 and the corresponding Eq. (2) and Table 2 of Ref. 1.
2.2. Ideal Gas Reference State Equation
Thermodynamic functions may be derived for the ideal gas by using statistical mechanical models with spectroscopic data for ethane. Because these functions are usually more accurate than the corresponding values obtained by direct evaluation using thermodynamic experiments, at least for simple molecules, it is customary to consider the results obtained from the spectroscopic data at the standard pressure of 0.101 325 MPa (1 atm) as a reference state with which the wide ranging correlations must agree. We have fitted the spectroscopically derived data of Chao et ai., II and the corresponding values of the ideal gas entropy and enthalpy at standard conditions (298.15 K and 0.101325 MPa) are given in Table 1. These values exclude any contributions from nuclear spin, so all
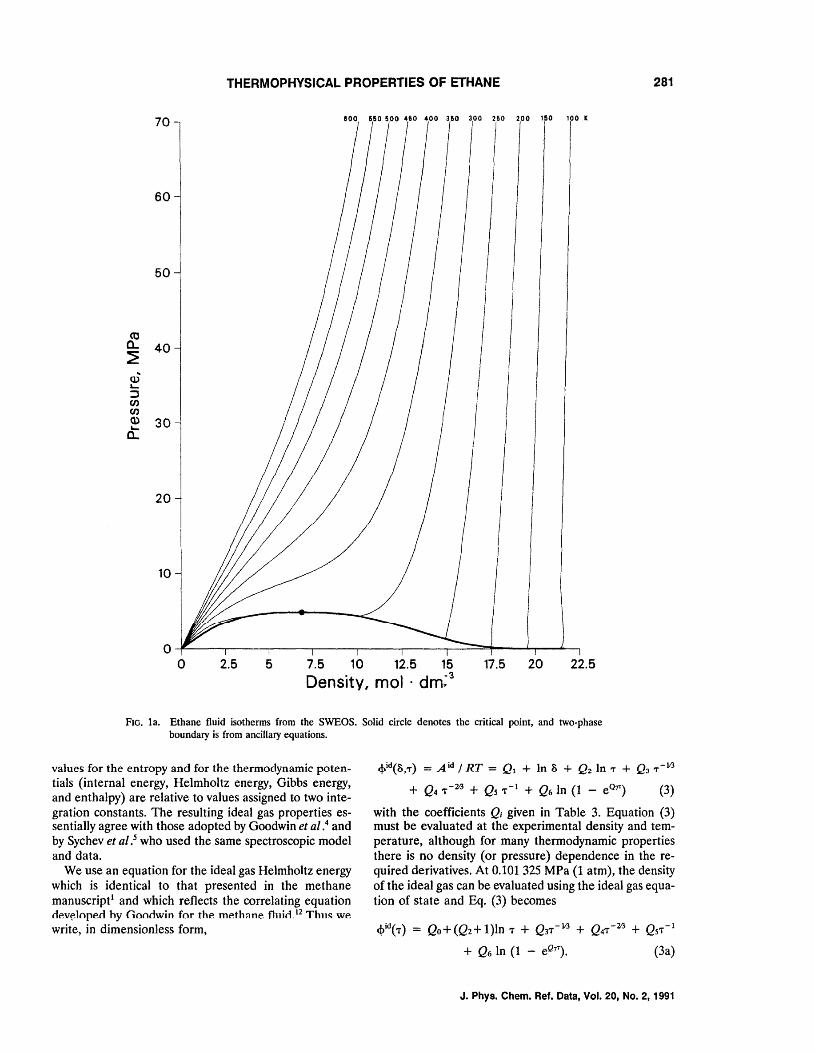
THERMOPHYSICAL PROPERTIES OF ETHANE 281
70 800 6110 500 460 400 350 300 250 200 1 0 100 K
60
50
co a.. 40 :2 cD .... :::s (J) en ~ 30 a..
20
10
o~----~--~----~----~----~----~~~----~--~
o 2.5 5 7.5 10 12.5 15 Density, mol· dm:3
17.5 20 22.5
FIG. la. Ethane fluid isotherms from the SWEOS. Solid circle denotes the critical point, and two-phase boundary is from ancillary equations.
values for the entropy and for the thermodynamic potentials (internal energy, Helmholtz energy, Gibbs energy, and enthalpy) are relative to values assigned to two integration constants. The resulting ideal gas properties essentially agree with those adopted by Goodwin et al.4 and by Sychev et al.s who used the same spectroscopic model and data.
We use an equation for the ideal gas Helmholtz energy which is identical to that presented in the methane manuscript l and which reflects the correlating equation dev~loped hy Goodwin fOT the meth:me fln10.12 Thl1~ we write, in dimensionless form,
q:.id(8;r) Aid / RT Ql + In 8 + Qz In 'T' + Q3 'T'-lI.3
+ Q4 7- 2t3 + Qs 7- 1 + Q6 In (1 - eQ.".) (3)
with the coefficients Qi given in Table 3. Equation (3) must be evaluated at the experimental density and temperature, although for many thermodynamic properties there is no density (or pressure) dependence in the required derivatives. At 0.101 325 MPa (1 atm), the density of the ideal gas can be evaluated using the ideal gas equation of state and Eq. (3) becomes
<t>id( 7) = Qo + (Q2 + 1 )In 7 + Q37 -lI.3 + Q47 - 2t3 + QST- 1
+ Q6 In (1 - eQ.".). (3a)
J. Phys. Chem. Ref. Data, Vol. 20, No.2, 1991
282 FRIEND, INGHAM, AND ELY
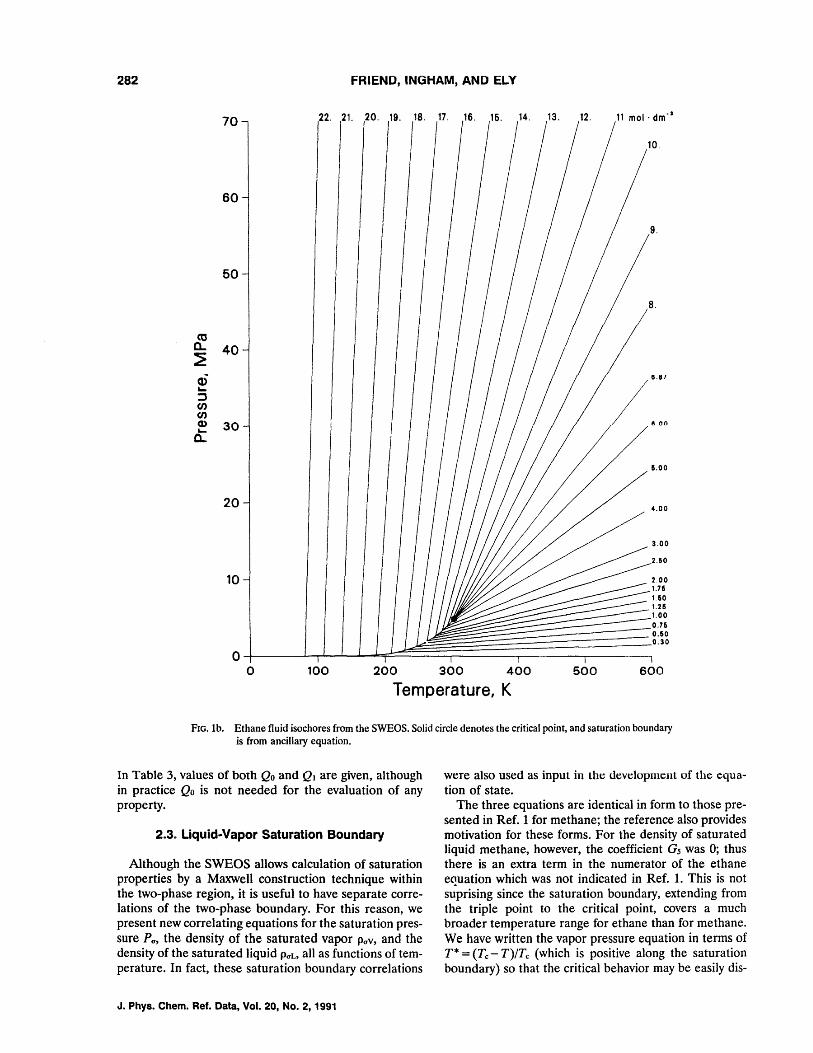
22. 21. 20. 19. 18. 17. 16. 16. 14. 13. 12. 11 mol· dm"
60
9.
50
8.
<tS a.. 40 ~ cD 11.117
.... / ... ::s CJ) CJ) (I.) 30 .... a..
11.00
20 4.00
3.00
2.50
10
o 100 200 300 400 600 600
Temperature, K
FIG. lb. Ethane fluid isochores from the SWEOS. Solid circle denotes the critical point, and saturation boundary is from ancillary equation.
In Table 3, values of both Qo and Ql are given, although in practice Qo is not needed for the evaluation of any property.
2.3. Liquid-Vapor Saturation Boundary
Although the SWEOS allows calculation of saturation properties by a Maxwell construction technique within the two-phase region, it is useful to have separate correlations of the two-phase boundary. For this reason, we present new correlating equations for the saturation pressure Pa , the density of the saturated vapor paV, and the density of the saturated liquid paL, all as functions of temperature. In fact, these saturation boundary correlations
J. Phys. Chem. Ref. Data, Vol. 20, No.2, 1991
were also used as input in the development of the equation of state.
The three equations are identical in form to those presented in Ref. 1 for methane; the reference also provides motivation for these forms. For the density of saturated liquid methane, however, the coefficient Gs was 0; thus there is an extra term in the numerator of the ethane eCluation which was not indicated in Ref. 1. This is not suprising since the saturation boundary, extending from the triple point to the critical point, covers a much broader temperature range for ethane than for methane. We have written the vapor pressure equation in terms of T* = (Tc - T)/Tc (which is positive along the saturation boundary) so that the critical behavior may be easily dis-
THERMOPHVSICAL PROPERTIES OF ETHANE 283
co a.. 2
70.0
60.0
50.0
40.0
30.0
20.0
10.0
Primary Data 0= B 0= PVT l'::, = Cv
+=
X=
0=
\1=
!2'l=
00 o
o 0 o
o 0 0
o
o o
o 0 o
o o
o o
o
00
o 000
o o
00
o
o
o
a20 330
o
o
888
o 100 200 300 400 500 600 700
Temperature, K
FIG. lc. Primary data used to determine coefficients in the SWEOS. Several references may correspond to each type of data.
cerned by expansion of the exponential about T* = O. Thus we write
where the dimensionless fitted coefficients Hi and the exponent E are given in Table 4. In Eq. (4), the saturation pressure P (J precisely equals the critical pressure at the critical temperature, and the exponent E was forced to have its effective scaling theury value uf 1.90 as in the methane manuscript.
For the density of the saturated liquid, we again have chosen an equation in T* which reduces to the known (lowest order) scaling result in the limit T*~ O. The equation, which has the added flexibility available with a ratio of terms in T*, is
(5)
where the coefficients Gi and exponent f3 appear in
Table 4. As in Ref. 1, the critical exponent f3 was assumed to have the effective value of 0.355.
For the density of the saturated vapor, it is desirable to use an equation which has the theoretically predicted behavior in both the low density (ideal gas) limit and in the neighborhood of the critical point. While these limits may not be simultaneously discernable at a glance, the equation
with Zc = P J(R TcPc), the critical compressibility factor, has the ideal gas behavior at the lowest pressures and can be rewritten as
Pav(T) = pc (1- T*? { 1-ic [1- (1; ~*t ]
J. Phys. Chem. Ref. Data, Vol. 20, No.2, 1991
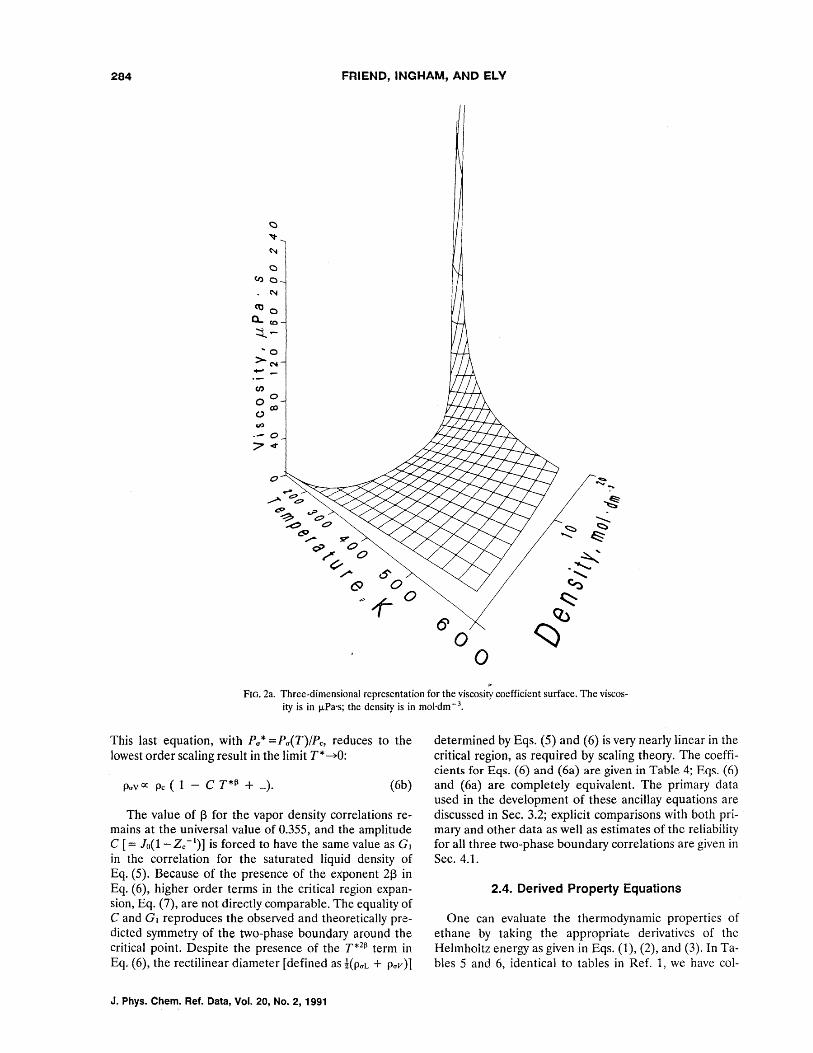
284 FRIEND, INGHAM, AND ELY
(J)
00 (X)
C)
(J)
.- 0 7~
o
6' o o
'" FIG. 2a. Three-dimensional representation for the viscosity coefficient surface. The viscos-ity is in J:1Pa·s; the density is in mol·dm- 3
•
This last equation, with p(,.* =Pa(T)/Pc, reduces to the lowest order scaling result in the limit T*~O:
paV ex pc ( 1 - C T*13 + ... ). (6b)
The value of f3 for the vapor density correlations remains at the universal value of 0.355, and the amplitude C [= Jo(l- ZC -I)] is forced to have the same value as G1 in the correlation for the saturated liquid density of Eq. (5). Because of the presence of the exponent 2f3 in Eq. (6), higher order terms in the critical region expansion, Eq. (7), are not directly comparable. The equality of C and G 1 reproduces the observed and theoretically predicted symmetry of the two-phase boundary around the critical point. Despite the presence of the T*213 term in Eq. (6), the rectilinear diameter [defined as !(puL + puv)]
J. Phys. Chern. Ref. Data, Vol. 20, No.2, 1991
determined by Eqs. (5) and (6) is very nearly linear in the critical region, as required by scaling theory. The coefficients for Eqs. (6) and (6a) are given in Table 4; Fer'. (n) and (6a) are completely equivalent. The primary data used in the development of these ancillay equations are discussed in Sec. 3.2; explicit comparisons with both primary and other data as well as estimates of the reliability for all three two-phase boundary correlations are given in Sec. 4.1.
2.4. Derived Property Equations
One can evaluate the thermodynamic properties of ethane by taking the appropriate derivatives of the Helmholtz energy as given in Eqs. (1), (2), and (3). In Tables 5 and 6, identical to tables in Ref. 1, we have col-
THERMOPHYSICAL PROPERTIES OF ETHANE 285
60.0
Primary Data 8 0= Diller [55]
0= Diller [56] 0
50.0 0
6= Carmichael [57] 0 0 8 0 x= Kestin [52-54]
0 0 0
40.0 0
co ~ 6. 6.
6.
~ 0 6.0 § 6. 0
6.
0 0 6 ~ 6.
0 Q) 30.0 0 0 Lo- 0 :::J 00 0 cP.6 .6 9 .6 6 6 U (I) 0 0 6. 6. 0 (I) 00 0 0
0 Q) § 0 6. 0 Lo- ° 0 0 ~ 0
0 Afj 6 0 0 cf1l::. I:. 6 0 6. 0 20.0 000 0 0 00 0 6 §
0 0 0 0
00 0 0 6.
00 0 0 00
6 6. ~A 6. t::.
0 6 0 0
0 00 0 0 [1
10.0 t::. § 6. ~ Ll 0 0 t::.
00 00 0 6. 6. ~ {)
0 0 6. 00 00
0 0 000
0.0 50 100 150 200 250 300 350 400 450 500
Temperature, K
FIG. 2b. Pressure and temperature state points for primary data used to determine viscosity correlation.
lected the coefficients necessary to calculate the six lowest order derivatives for the ideal gas and residual contributions to the Helmholtz energy. These are the first two density derivatives along isotherms, the temperature derivatives along isochores, and the mixed derivatives. As in the paper by Schmidt and Wagner6 and the methane manuscript,1 we consider the reduced density and the inverse reduced temperature as independent variables, and we denote the derivatives as subscripts to the appropriate Helmholtz energy quantity. For example,
<P' = a<f{(S,T) I = k aA r(p,T) I Ii as T RT ap T
(7a)
is the isothermal (reduced) density derivative of the (reduced) residual Helmholtz energy. Second derivatives are analogously defined, but have two subscripts to indicate the parameters with respect to which the derivatives are taken.
To calculate derivatives of the ideal gas contribution to the Helmholtz energy, one is guided by the form of Eq. (3). The left-most column of Table 5 lists the terms necessary for the various derivatives. The remaining columns give the coefficients of these terms directly be-
neath the heading which indicates the quantity to be calculated. The resulting terms are to be added as in Eq. (3). For example, to calculate TQ>/d use the coefficients from the fourth column and the terms in the first column to write
Q -1 5 T
(7b)
The values of the Qi coefficients are given in Table 3. As indicated in Table 5, the density derivatives of the ideal gas Helmholtz energy are particularly simple:
For derivatives of the residual Helmholtz energy, Eq. (2) and Tables 2 and 6 can be used. As in Eq. (2), the derivatives are obtained by summing 32 terms of three general types. Each of the terms has factors consisting of powers of the reduced density and temperature with the explicit exponents rj and Sj and coefficients nj given for each value of i in Table 2. The additional exponential
J. Phys. Chem. Ref. Data, Vol. 20, No.2, 1991
286 FRIEND, INGHAM, AND ELY
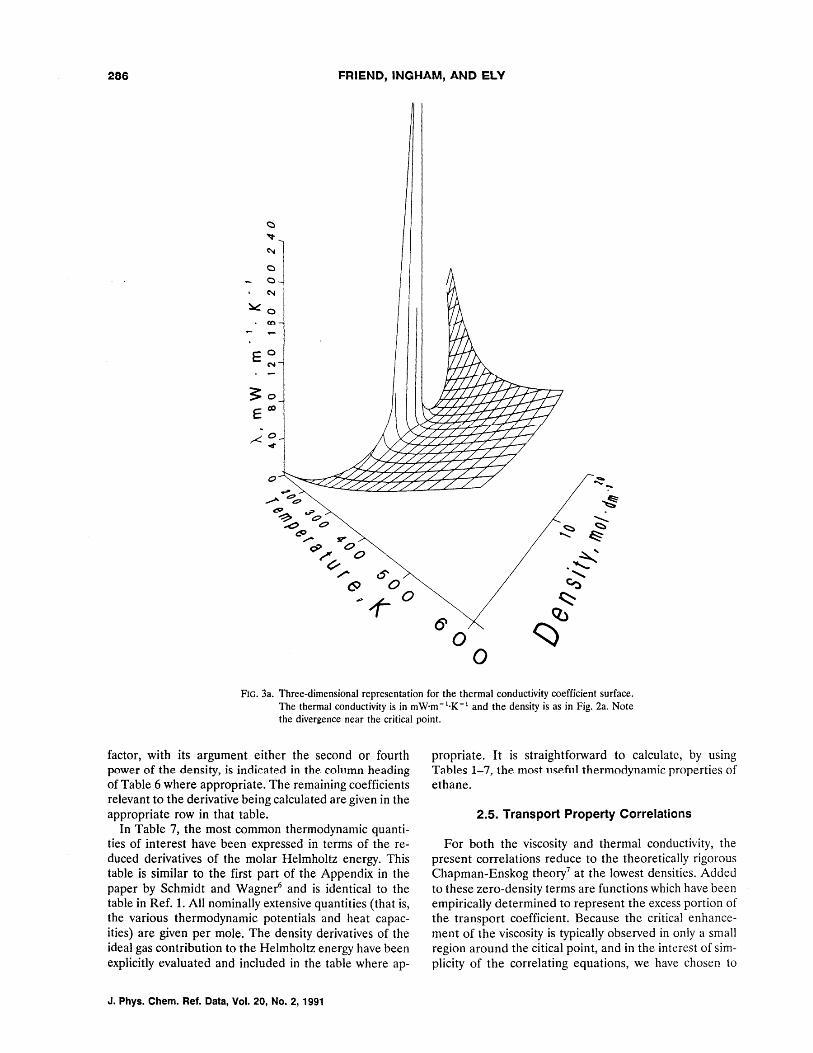
• co
EO N
o
(j
o o
FIG. 3a. Three-dimensional representation for the thermal conductivity coefficient surface. The thermal conductivity is in mW·m-I·K-I and the density is as in Fig. 2a. Note the divergence near the critical point.
factor, with its argument either the second or fourth power of the density, is indicated in the column heading of Table 6 where appropriate. The remaining coefficients relevant to the derivative being calculated are given in the appropriate row in that table.
In Table 7, the most common thermodynamic quantities of interest have been expressed in terms of the reduced derivatives of the molar Helmholtz energy. This table is similar to the first part of the Appendix in the paper by Schmidt and Wagner6 and is identical to the table in Ref. 1. All nominally extensive quantities (that is, the various thermodynamic potentials and heat capacities) are given per mole. The density derivatives of the ideal gas contribution to the Helmholtz energy have been explicitly evaluated and included in the table where ap-
J. Phys. Chern. Ref. Data, Vol. 20, No.2, 1991
propriate. It is straightforward to calculate, by using Tables 1-7, the most usefnl thermodynamic properties of ethane.
2.5. Transport Property Correlations
For both the viscosity and thermal conductivity, the present correlations reduce to the theoretically rigorous Chapman-Enskog theory7 at the lowest densities. Added to these zero-density terms are functions which have been empirically determined to represent the excess portion of the transport coefficient. Because the critical enhancement of the viscosity is typically observed in only a small region around the citical point, and in the interest of simplicity of the correlating equations, we have chosen to
THERMOPHVSICAL PROPERTIES OF ETHANE 287
100.0 10.0 + + Drop Primary Data + oITIJ
8.0 + IIIlA
I 0= Roder [60] 6.0
~'ft 0= Roder [58] Prasad [59]
4.0 6= OlD
80.0 Desmarest [61] 2.0 0I1lD += + 6
0.0 280 290 300 310 320 330
0 t:,. t:,. ~ fj,
0 0 0 0 0 [] [] 0 00 0 6 £In t:,. II
co II
a.. 60.0 t:,. tJ. 6 t:,. A 6
~ 0 t:,. f:.. 6. t:,. t:,. 0 0 u [] []
Q) 00 n 6 t:,. II ~ 11 L- 0 []
IIIJ ::J 0 6
(/) 6 II I!J fj, A II (/)
0 0 [] 0 0 Q) 40.0 0 0 I:::. b 6 6. /I;). fj, L-a.. ~ 6 t.. ~ l:t::. A
[] 0 00 [] [] A I:::. I:::. 6. &
0 0 0 0 0 0 +
~ qp + 6. 6 6.
20.0 0 [] [] 'ito II 6. 6.
0 0 D 0 [] [] II ~ tJ. 0
0 A ~ tJ.
1 t t 0.0 0 0 0
f I I I 50 100 150 200 250 300 350 400 450 500 550 600
Temperature, K
FIG. 3b. Pressure and temperature state points for primary data used to determine thermal conductivity correlation.
omit this term. For the ethane thermal conductivity, which clearly displays a critical enhancement in the experimental results, we also add a term which estimates the critical thermal conductivity enhancement. The additional term is based on the recent theoretical crossover description of the critical enhancement given by Olchowy and Scngers;9 this differs from our treatment of methane in Ref. 1. The viscosity is given by
TI(p,T) = Tln(T) + Tlt'y(p,T), (8)
and the expression for thermal conductivity is
A(p,T) = Ao(T) + Aex(p,T) + Acr(p,T). (9)
These terms are explicitly described in this section.
2.5.1. Dilute Gas Correlation
The Chapman-Enskog theory for the dilute gas viscosity gives, to lowest order in the Sonine polynomial expansion,
5v''iT U Mr k T 'T\o(T) = 16 'iT a2 0,(2.2)*(t) (10)
= 12.0085 Vii O,(Z,Z)*(t) J.LPa·s. (lOa)
Equation (10) is identical to Eq. (8.2-10) in Ref. 7, whereas in Eq. (lOa) the constants have been evaluated for ethane. The reduced collision integral 0,(2,2)* is a function only of the reduced temperature t = kT I€ and the intermolecular potential function. For evaluation of Eq. (10), as for the methane fluid in Ref. 1, we have used the 11-6-8, 'Y = 3 potential function,
where rm = 1.1145a. The parameters € and a, which are defined by V(rm) = -€ and V(a) = 0, were chosen to represent the low density transport data and are given in Table 1. The additional constants of Eq. (10), the relative molecular mass Mr , the unified atomic mass unit u, and the Boltzmann constant k, are also given in Table 1. A discussion of the utility of the 11-6-8, 'Y = 3 potential in
J. Phys. Chern. Ref. Data, Vol. 20, No.2, 1991
288 FRIEND, INGHAM, AND ELY
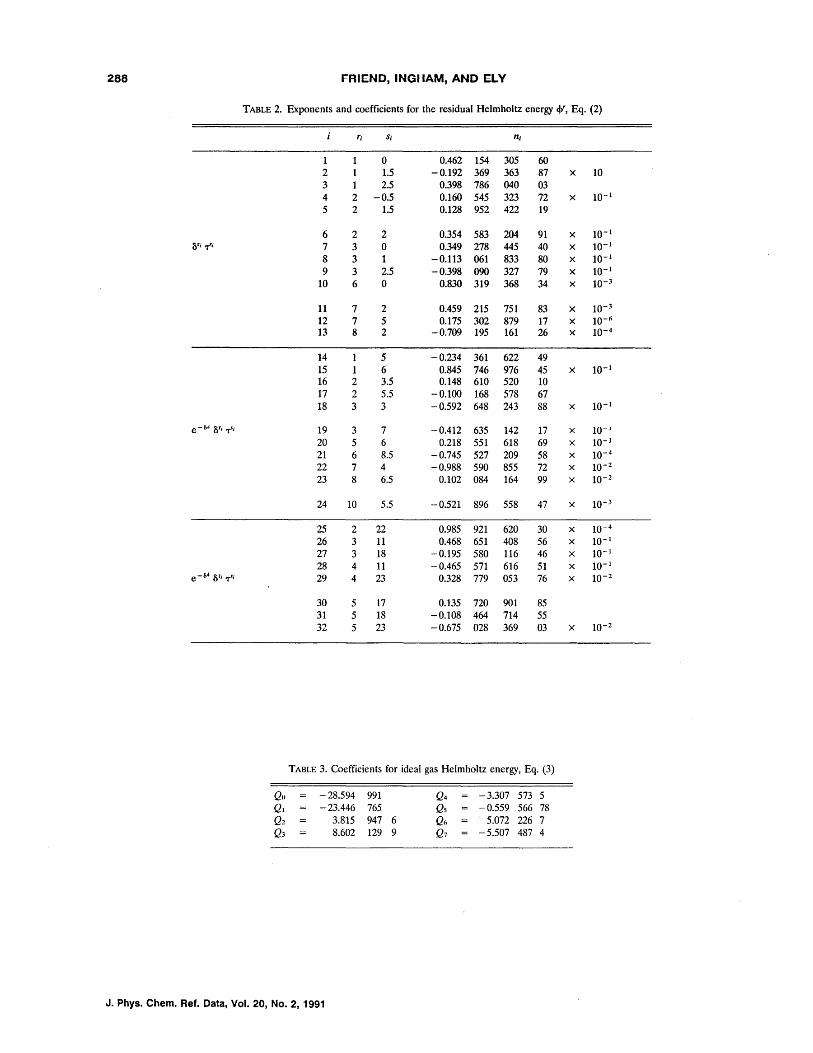
TABLE 2. Exponents and coefficients for the residual Helmholtz energy <\>" Eq. (2)
Tj Sj nj
1 1 0 0.462 154 305 60 2 1 1.5 -0.192 369 363 87 x 10 3 1 2.5 0.398 786 040 03 4 2 -0.5 0.160 545 323 72 x 10- 1
5 2 1.5 0.128 952 422 19
6 2 2 0.354 583 204 91 x 10- 1
8r; -rt; 7 3 0 0.349 278 445 40 x 10- 1
8 3 1 -0.113 061 833 80 x 10- 1
9 3 2.5 -0.398 090 327 79 x 10- 1
10 6 0 0.830 319 368 34 x 10-3
11 7 2 0.459 215 751 83 x 10-3
12 7 5 0.175 302 879 17 x 10-6
13 8 2 -0.709 195 161 26 x 10-4
14 1 5 -0.234 361 622 49 15 1 6 0.845 746 976 45 x 10- 1
16 2 3.5 0.148 610 520 10 17 2 5.5 -0.100 168 578 67 18 3 3 -0.592 648 243 88 x 10- 1
e-z;.: 8r; -rt; 19 3 7 -0.412 635 142 17 x 10- 1
20 5 6 0.218 551 618 69 x 10- 1
21 6 8.5 -0.745 527 209 58 x 10- 4
22 7 4 -0.988 590 855 72 x 10-2
23 8 6.5 0.102 084 164 99 x 10- 2
24 10 5.5 -0.521 896 558 47 x 10-3
25 2 22 0.985 921 620 30 x 10- 4
26 3 11 0.468 651 408 56 x 10-1
27 3 18 -0.195 580 116 46 x 10- 1
28 4 11 -0.465 571 616 51 x 10- 1
e-1\4 8r; -rt; 29 4 23 0.328 779 053 76 x 10- 2
30 5 17 0.135 720 901 85 31 5 18 -0.108 464 714 55 32 5 23 -0.675 028 369 03 x 10- 2
TABLE 3. Coefficients for ideal gas Helmholtz energy, Eq. (3)
Qo - 28.594 991 Q4 -3.307 573 5 Ql -23.446 765 Q5 -0.559 566 78 Q2 3.815 947 6 Q6 5.072 226 7 Q3 8.602 129 9 Q7 -5.507 487 4
J. Phys. Chern. Ref. Data, Vol. 20, No.2, 1991
£
HI Hz H3 H4 Hs
cj>r
8cj>r.r Tcj>,.r
82cj>rM rcj>rTT 8"cj>rST
THERMOPHVSICAL PROPERTIES OF ETHANE
TABLE 4. Coefficients for liquid-vapor boundary correlations
Saturated vapor Saturated liquid Saturated vapor density pressure Eq. (4) density Eq.(5) Eq.(6) or (6a)
1.90 ~ 0.355 ~ 0.355
-7.955 315 GI 1.930 740 10 -0.748 371 9 1.532 027 Gz -0.653 985 6 It -1.372 895
14.780 68 G3 0.814 136 2 12 -1.192 597 = -13.431 79 G4 -0.339 743 0 h 1.861 505
4.704 891 Gs -0.383 814 1 14 1.313 649
TABLE 5. Ideal gas Helmholtz energy and its derivatives
cj>id Scj>&id 1'cj>Tid 82cj>&&id rcj>TTid 81'cj>&rid
~.(3) ( -1 ) ( - -1) ( -0)
Ql 1 Q2 -1 -Q2 0 In 8 1 0 0 0 0 0 In T Q.l 0 0 0 0 0
1'-lI.J Q3 0 -Q3/3 0 4QJ9 0 T-~ Q4 0 -2QJ3 0 IOQJ9 0 ,.-1 Qs 0 -Qs 0 2Qs 0
In (1- eQrT) Q6 0 0 0 0 0 (e-QrT -1)-1 0 0 -Q6Q71' 0 0 0
earr (eQrT -1)-2 0 0 0 0 -Q6Qir 0
TABLE 6. Residual Helmholtz energy and its derivatives
n; sr; -rf ;
(i = 1 to 13)
r; Sj
r,(r,-I) s,(si-l)
riS,
e-&2 n; sr; r; (i = 14 to 24)
Sj
[r, (r, - 1) - 2(2r, + 1 )82 + 484]
S,(Si 1) si(r; -282)
e-r.4 n; 8r; -rf ;
(i = 25 to 32)
r, - 484
Sj
[r,(r; -1) -4(2r, + 3)84 + 16811]
SiCS; 1) si(r, -484
)
289
J. Phys. Chem. Ref. Data, Vol. 20, No.2, 1991
290 FRIEND, INGHAM, AND ELY
correlating transport property data has been given by Hanley and Klein. I3 This potential, with the present values of E and 0", has not been optimized for thermodynamic property evaluation. It represents an effective spherical approximation~ applicable to the transport properties, to the true two-body interaction.
Rather than directly evaluate the collision integral, we fitted the tabulated results of Klein et al.8 to the form
(12)
The coefficients C for Eq. (12) are listed in Table 8 and are identical to those published in Ref. 1. The fit agrees with the tabulated integration resulu 8 within about 0.1 % in the (reduced) temperature range 0.5 < t < 200.
For the thermal conductivity Ao of the dilute gas, a completely rigorous and calculable theory is not available for polyatomie molecules, due to the complexities of exchanging energy between internal and external (kinetic) degrees of freedom. As for methane, we have chosen a modified Eucken modeF4 of the form
(13)
0.276 505 llo(T)[ 3.75 - finl(T2<f>~~ + 1.5)]
(13a)
where C)d is the (temperature dependent) ideal gas contribution to the molar isobaric heat capacity and fint is a dimensionless function which describes the energy exchange mentioned above. When using Eq. (13a), the viscosity should be expressed in micropascal-seconds, as in Eq. (lOa). The heat capacity contribution, having been written in terms of a derivative of the ideal gas Helmholtz energy, can be evaluated using Tables 3 and 5. The form for pot is chosen empirical1y as
(14)
with the coefficients f fitted to experimental data and also given in Table 8.
2,5.2. Excess Property Correlation
For the excess viscosity, we use a rational polynomial in the reduced density 8 and inverse reduced temperature T; the viscosity is scaled by dimensional analysis and critical point variables. (Note that the parameter t = Tk/E, used above, is the temperature reduced by the interparticle potential energy scale, while T = T JT is the inverse temperature reduced by the critical temperature.) Thus, we write
Tjex(p,T)
p "13 (M '112 r 9 ." r ! l - - i c - r U)~ k g ({I 1"1 I' 1 + k g' ({i -ri I (Tc k)J;f, Li=i I .. L· :=!v! . J (15)
J, Phys, Chen;, Ref. Data, VoL 20, No.2, i 991
where the exponents Tj and Si and the dimensionless fitted coefficientsgj are given in Table 9. The excess viscosity of fluids increases dramatically as the triple-point density of the liquid is approached; for conformality with other fluids a density reduced by prL could be used in the denominator of Eq. (15). However, we have incorporated the appropriate constants into gw and gll in order to simplify the equation. All of the terms in Eq. (15) were statistically significant and contributed to the reduction of the residuals for the primary data. The form was chosen to be consistent with the equation for methane, l and the temperature dependence in the excess function reflects the theoretical understanding of its presence.14d
The excess thermal conductivity Aex has been correlated to a polynomial in 8 and T. As in Eq. (15), we include a prefactor with the appropriate dimensions and write
[
7 -,
= 4.417 86 .~ ji Of; 'is; J mW·m-1·K- 1•
1=1 (17)
The exponents and dimensionless coefficients for Eq. (17) are given in Table 9; the form and exponents in this correlation differ slightly from those used for methane in Ref. 1. In both excess functions, Eqs.(15) and (17), there are strong density dependences and weak temperature dependences.
2.5.3. Critical Enhancement Correlation
Both the viscosity and the thermal conductivity exhibit an increase near the liquid-vapor critical point, relative to values far from this singularity; theory indicates that the transport properties for pure fluids diverge to infinity at the critical point, although experimental difficulties limit the values found in the laboratory. The increase and theoretical divergence are presumably due to dynamic interactions among clusters formed because of large-scale density fluctuations. 15 Ii is only in the thermal conductivity that the divergence is strong and the enhancement is easily observed in a broad region around the critical point. For this reason, the present transport property correlations include an enhancement contribution only for the thermal conductivity,
Our treatment of the critical enhancement term is substantially different from that given in the methane manuscript;! the new mode coupling treatment of O!chowy and Sengers,i) referred to briefly in Ref. 1, seems to make the older approach of Ref. 15, used in ReI. 1, obsoiete. We have chosen to use a simplified version of the new theory, also presented by Olchowy and Sengers.lJ The simplified theory avoids the complications of implicitly defined functions and root-finding algorithms, and it
THERMOPHYSICAL PROPERTIES OF ETHANE
TABLE 7. Thermodynamic property equations
Pressure:
Internal Energy:
Enthalpy:
Gibbs free Energy:
Helmholtz Free Energy:
Entropy:
Isochoric Heat Capacity:
Isobaric Heat Capacity:
Saturated Liquid
Heat Capacity:
Speed of Sound:
Second Virial
Coefficient:
P(p,T) = pRT ( 1 + 84>0
U(p,T) = RT ( Tcf>i~ + Tcf>~ )
H(p,T) = RT ( 1 + T4>i~ + T4>~ + 84>& )
G(p,T) = RT ( 1 + 4>id + 4>' + 84>& )
A(p,T) = RT ( cf>id + 4>r)
S(p,T) = -R ( cf>id + cf>' - T4>i~ - T4>~ )
2( T) - -.!SL ~ (1 2~A..' ~2A.. r ) W p, - uN~r C,,(p,T) + u,+,o+u ,+,&&
B(T) = 1. lim cf>r Pc 8~0 f>
291
seems appropriate within the present context of correlating equations developed for ease of use as well as accuracy.
term. While this again avoids certain complications inherent in the revised and extended scaling description of the thermodynamic surface, it causes substantial deviations from the expected behavior in the asymptotically critical region. The available data for ethane are not sufficiently close to the critical point to exhibit these deviations. Further details and appropriate ranges and uncertainties in the correlation are given in Sec. 4.
Note added in final revision: We have recently presented expressions to evaluate the mode coupling integral in closed algebraic form.7l Thus the full theory of Ref. [9] is now nearly as easy to use as the simplified theory and is to be preferred in future work.
In addition, we retain the completely classical description, as given above, of all thermodynamic quantities which must be calculated for the critical enhancement
TABLE 8. Coefficients for dilute gas transport properl ies
0(2,2)*, Eq.(12) finh Eq. (14)
C1 -3.032 813 828 1 Cz 16.918 880 086 /1 1.710 414 7 C3 -37.189 364 917 C4 41.288 861 858 h -0.693 648 2 Cs -24.615 921 140
C6 8.948 843 095 9 C7 -1.873 924 504 2 CIl 0.209 661 013 90 C9 -9.657 043 707 4 x 10- 3
The expression for the enhancement from Ref. 9 is given by
( ) = A k T pCp ( ~cr p,T 6 'TT 1)(p,T) ~ F p,T) (18)
where the molar isobaric heat capacity is expressed in J'mol-1'K- 1, the correlation length, ~ defined by Eq. (19), is in nm, and the viscosity is expressed in J-LPa·s in Eq. (18a). The constant A has the value 1.01 and arises from dynamic mode-coupling theory, and the damping function F is also determined from theory and is defined in Eq. (20). The function Acr(p,T) of Eq. (18) is essentially identical to the expression in Ref. 1 in the asymptotically critical region; however, the function F differs significantly. When Cp in Eq. (18), as well as the viscosity and
J. Phys. Chern. Ref. Data, Vol. 20, No.2, 1991
292 FRIEND, INGHAM, AND ELY
TABLE 9. Coefficients for excess transport properties
Tlex, Eq. (15)
r; S; gi
1 1 0 0.471 770 03 2 1 1 - 0.239 503 11 3 2 0 0.398 083 01 4 2 1 - 0.273 433 35 5 2 1.5 0.351 922 60
6 3 0 - 0.211 013 08 7 3 2 - 0.004 785 79 8 4 0 0.073 781 29
9 4 - 0.030 425 255
to 1 0 - 0.304 352 86
11 0.001 215 675
derivatives in the definition uf ~ givt:n in Eq. (19), are evaluated from the analytical equation of state, the resultant Acr is not correct in the asymptotically critical region. In particular, the critical exponent describing Cp along the critical isochore has its classical value of 1 rather than the theoretical value near 1.24; considering all of the retained classical contributions, the critical exponent for Acr along the critical isochore is near 0.5 instead of having a value greater than 0.6 as is usually observed in the asymptotic region.
The correlation length used in Eq. (18) represents the quantity related to the critical region fluctuations; we subtract a background term and write
(1 + 2~<f>~(1I2)
(19a)
The critical amplitUdes and exponents, obtained from Ref. 9, have been evaluated for ethane in Eq. (19a) and are given in Table 10; the choice 2Te as the cutoff temperature is arbitrary, but the resultant correlation is not very sensitive to the choice. In Eq. (19a), the arguments of the derivatives of the residual Helmholtz energy are the usual reduced density and temperature in the first terms. The final term in Eq. (19a) is evaluated at the reduced density of the state point for which Ae is being evaluated and,. = 0.5 (as indicated) corresponding to a temperature of 2Te. When the term in square brackets becomes negative, very far from the critical point where the enhancement term is negligible, it should be set equal to O.
J. Phys. Chem. Ref. Data. Vol. 20. No.2. 1991
~,Eq. (17)
ri S; j;
1 0 0.960 843 22 2 0 2.750 023 5 3 0 -0.026 609 289 4 0 -0.078 146 729 5 0 0.218 813 39
1 1.5 2.384 956 3 3 1 -0.751 139 71
The damping function in Eq. (18) is given by
and qD -1 = 0.545 nm is the only fitted parameter iIi the theory. The quantity qD represents a cutoff wavenumber above which the contribution to the transport properties due to the coupling of hydrodynamic modes vanishes. Equivalently, qD -1 represents a second length scale; fluctuations over lengths shorter than this scale do not contribute to the dynamical critical phenomena. The correlation length ~ is from Eq. (19), the reduced density is given by 8 = piPe as usual, and the heat capacities can be evaluated from the equation of state correlation. Again, we note that to the extent that the heat capacities do not have the correct critical behavior, the damping function will not extrapolate well in the asymptotically critical region.
TABLE to. Constants for hert Eq. (18) [Using Eqs. (19) and (20)]
Fitted coefficient :
Critical exponents:
Universal constant:
Fluid dependent amplitudes from Ref. 9:
qD- 1 = 0.545 nm
'Y = 1.242 v = 0.63
A = 1.01
~ = 0.19 nm fo = 0.0563
THERMOPHVSICAL PROPERTIES OF ETHANE 293
3. Development of the Correlations
3.1. Fundamental Constants, Fixed Points, and Ideal Gas Properties
The fundamental constants which were used are given in Table 1 and agree with the values recommended by the Committee on Data for Science and Technology,16 CODATA in 1986. The relative molecular mass for ethane was derived from the atomic values of the recent IUP AC tablesl7 and agrees with the value used by Goodwin et al.4 The value 30.0694 adopted by Sychev et al. S is lower than ours by 0.002%, which is within the uncertainty of Mr computed from the uncertainties of the relative atomic masses given in Ref. [171; the value from Ref. [5] was t:vidtmtly ut:rived frum atomic masses promulgated by IUPAC18 in 1980 or earlier. Uncertainties associated with these quantities can be found in the original reference".
The values of the fixed point constants at the triple point of ethane were not needed for the present correlations. However, they determine the range of validity of many of the equations of Sec. 2 and may be of interest in their own right; therefore they are presented in Table 1. We have adopted the value ofPavese19 for the triple point temperature of ethane; however we have increased the uncertainty in T, as as implied in the more recent study by Bedford et al.20 The measurement in Ref. [20] was made by adiabatic calorimetry. Within uncertainties, our adopted value agrees with the derived result of Straty and Tsumura (90.348 ± 0.005 K)21 which was used in Refs. 4 and 5. Additional historical values for 1', are given in Refs. 5 and 19.
For the pressure at the triple point, we have calculated a value from our vapor pressure curve, Eq. (4), at the selected temperature. This extremely low pressure is difficult to measure experimentally. The uncertainty was established by estimating the accuracy of this equation, the uncertainty of the temperature, the value calculated using the Maxwell construction from the SWEOS at T" and comparisons with other determinations of P,. Our value of 1.130 ± 0.005 Pa agrees with that adopted by Sychev et al.'" (1.13 ± 0.01 Pa) within stated uncertainties and essentially with that given by Goodwin et al.4 (1.1308 Pa). The SWEOS gives 1.131 Pa, a difference of less than 0.1 % from our adopted value and well within our estimated uncertainty.
The fluid densities at the triple point were obtained from the ancillary Eqs. (5) and (6) using the stated value of 1',. Their uncertainties were estimated as above. The vapor density is identical to that obtained with the ideal gas equation of state at the given conditions. For comparison, we note that Goodwin et al.4 adopted 21.680 mol·dm -3 and 1.5154 mol·dam -3, without uncertainties, for the densities of the liquid and vapor, respectively. From the SWEOS, with the Maxwell construction, we obtai~ 21.665 mol·dm-3 and 1.505 mol·dam-3•
The state variables at the critical point of ethane enter directly into many of the equations of Sec. 2. During the
development of the present correlations, we attempted to improve the overall fit by allowing the critical parameters to vary. Since we did not find an alternative set of values which significantly improved the quality of the fits, we chose to use the critical values of Douslin and Harrison,22 which they obtained from careful analysis of their nearcritical PVI data. Our choices conform to those adopted by Sengers and his collaborators23 in their study of the asymptotically critical and crossover regions in the thermodynamic and transport properties of ethane. Sychev et al.s give an extensive table of various determinations of the critical point parameters.
Our selected critical temperature, 305.33 ± 0.04 K, agrees within uncertainties with the temperatures used by Goodwin et al.4 and by Sychev et al.s The value from Ref. 22, given without an estimate of the uncertainty, is lJased on the symmetry of the coexistence envelope in the temperature range 250 to 305.25 K. A visual determination of the critical point of ethane hy Strumpf et aZ.24 gave the value 305.368 ± 0.005 K; the uncertainty we present in Table 1 (0.04 K) is an estimate which does not rule out Strumpfs value. Burton and BalzarinF4a estimate the critical temperature as 305.229 ± 0.03 K, but, because they were mainly interested in temperature differences near the critical point, their thermometer was not calibrated according to IPTS-68. In a later fit of the coexistence data of Ref. 24a, based on a critical exponent ~ = 0.327 and two Wegner correction terms24b with A = 0.5, Pestak et al.24c obtained Tc = 305.2692 K. Although no uncertainty was given with this determination and the calibration problem was not explicitly addressed, reasonable error bars would imply agreement with our value.
For the critical pressure, our selected value, 4.8718 ± 0.005 MPa, is again from Douslin and Harrison,22 who interpolated in density and extrapolated in temperature from their critical region PVT measurements. Goodwin et et al.4 used 4.8714 MPa, 0.4 kPa below our value, based on their vapor pressure equation evaluated at the critical temperature. Sychev et al. S adopted the value from Ref. [4]. (Our vavor pressure equation, Eq. (4), is forced to the assigned critical pressure at the critical temperature.) Our assigned uncertainty, identical to that given in Ref. 5, is based on a :sluuy uf our ancillary c:quatiuns and the SWEOS when considering the uncertainty of the critical temperature; the value adopted in Refs. 4 and 5 falls within Ollr e~timated uncertainty.
Douslin and Harrison22 computed the value of the critical density' 6.87 mol·dm-3
, which we have adopted, by using the linearity of the rectilinear diameter established from their saturated liquid and vapor measurements. Goodwin et al.4 found 6.80 mol·dm -3 (1 % below our value) by computing rectilinear diameters from assorted experimental data; Ref. 5 used this value. Burton and Balzarini24a examined the behavior of the rectilinear diameter for their coexisting density data and obtained 6.857 ± 0.01 mol·dm -3. Their densities were from an index-of-refraction experiment calibrated with a direct determination of the Lorentz-Lorenz coefficient. We have examined fits to the saturated liquid data from various
J. Phys. Chern. Ref. Data, Vol. 20, No.2, 1991
294 FRIEND, INGHAM, AND ELY
sources (see Sec. 3.2) allowing the critical density to vary. In addition, we have used the liquid volume fraction method of Van Pool en et al.2S which extrapolates from saturation densities far from the critical point (from 220 to 270 K, in our calculation). We obtained values for pc between 6.870 and 6.893 mol·dm -3. Our selected value best fits the extensive critical region data of Ref. 22, and alternative values had little effect on the quality of the SWEOS. Our uncertainty of 0.1 mol·dm-3 corresponds to a shift in the critical temperature of about 0.5 mK in our ancillary equations and seems realistic when considering the dispersion among different determinations and the difficulty of measuring critical point properties.
The intermolecular potential parameters (J' and E in Table 1 were obtained by fitting low density transport dala as discusst::d in St::c. 3.4.1. OUf value for t: is 2% above that reported by Hanley et al.26 using earlier data, while that for C1 differs by only 0.3%. The correlations of Ref. 26 formed the ha~i~ of the newer correlations in Ref. 10; in the present work, we have examined additional data. The same potential function, Eq. (11), was used in these studies. A very recent determination of the scaling parameters by Boushehri et al./1 based on a corresponding states assumption, gives Elk = 241.9 K (1.3% below our value) and C1 = 0.4371 nm (0.1% above the present value). This discrepancy is not surprising since the parameters depend on the form of the model potential which is assumed and on the particular properties being fitted. We emphasize that the intermolecular potential parameters of Table 1 are for the 11-6-8, 'Y = 3 potential of Eq. (11) and are not appropriate when using the Lennard-Jones (12-6) potential; Mourits and Rummens28 obtained 227.9 K and 0.4407 nm for the Lennard-Jones parameters. Good results cannot be expected when calculating equilibrium thermodynamic properties (such as the second virial coefficient) using Eq. (11) with the given parameters.
The remaining entries in Table 1, those concerning the values of the entropy and enthalpy at standard conditions, were from Chao et al.;l1 our correlation of the ideal gas Helmhotz energy, Eq. (3), gives these values, and they were also adopted in Ref. [10]. As noted in Sec. 2.2, these and all quantities evaluated using either the ideal gas Helmholtz energy [Eq. (3)] itself or its first temperature derivative are relative values. Contributions from the nuclear spin system have been excluded; the value of the ideal gas enthalpy is zero at zero temperature. The values in Table 1 are essentially equivalent to those found using the correlations of Refs. 4 and 5. A comparison with Wagman et al.,29 based on a 1966 compilation, shows a discrepancy of 0.64% in the enthalpy and 0.16% in the entropy (adjusted to atmospheric pressure).
The development of the ideal gas correlations was discussed in Sec. 2.2. The tables of ideal gas properties of Chao et al., 11 based on a rigid-rotor harmonic-oscillator model with contributions from the energy levels of the hindered internal rotation, formed the basis of our correlation. The isobaric heat capacities of the ideal gasll between the temperatures of 50 and 700 K were equally
J. Phys. Chem. Ref. Data, Vol. 20, No.2, 1991
weighted in a linear least-squares algorithm to obtain the linear coefficients in T
2q,nid, related to Eq. (3). The coef
ficient Q7 was found from a nonlinear algorithm, and an iterative procedure was used to obtain best values of all parameters. The linear fitter was constrained to the fixed value of the enthalpy at 298.15 K reported in Table 1, and the integration constant, related to Qt, was established from Sid at 298.15 K in Table 1. The ideal gas heat capacity and other ideal gas properties reported in Ref. 11 are compared to the resulting correlation in Sec. 4.2. The spectroscopically derived tables of Pamidimukkala et al.30
use the same model as in the paper by Chao et al. ll and give essentially identical results in the region of overlapping temperatures; they were not used as primary data because fewer points are available in the region of interest and the scatter relative to our correlating equation was somewhat higher. Comparisons for these data, other data, and other ideal gas correlations, and an assesment of the uncertainty associated with our ideal gas correlation, are given in Sec. 4.2.
3.2. Ancillary Equations for the Two-Phase Boundary
In the ancillary equations, Eqs. (4-6), for the saturated vapor pressure and the densities of the coexisting liquid and vapor, the critical constants were considered fixed at the values given in Table 1. In addition, the exponents 13 and E were given their effective scaling law values, as in Ref. 1. The forms and exponents in these equations are identical to those motivated in Ref. 1; only the nonzero value of Gs in Eq. (5) for the density of the saturated liquid, as mentioned in Sec. 2, and the values of all coefficients as given in Table 4, distinguish between the correlations established for methane and the current correlations for ethane. Unlike our study of methane l however, in this study we have used several experimental sources to provide primary data in establishing the coefficients in Eqs. (4-6).
For the pressure of the saturated vapor, 127 data from Pal et al.,31 Pope,32 Ziegler et al.,33 Douslin and Harrison/1 and Straty and Tsumura34 in lht:: rangt:: 100 to 305 K were used. All points were equally weighted in the fitting routine; however 7 points from the experimental papers, at temperatures near 214, 300.4, and 221 K in Ref. 31; 210, 255, and 305.4 K (above our critical temperature) in Ref. 32; and 160 K in Ref. [34], exhibited large deviations from our preliminary fits and were omitted from the final fit. The input data were essentially identical to those used in the correlation of Goodwin et al.4 The monograph by Sychev et al.s lists additional (especially earlier) sources of data for the saturated vapor pressure, but uses the correlation of Ref. 4 to calculate vapor pressures. To obtain the coefficients Hi, Eq. (4) was linearized by taking the logarithm of both sides, and a linear least-squares fitting routine was used. Comparisons between the correlations and the experimental data are deferred to Sec. 4.1.
THERMOPHVSICAL PROPERTIES OF ETHANE 296
The correlation for the density of the liquid along the two-phase boundary, Eq. (5), was obtained in an analogous manner; 66 data from Douslin and Harrison,22 Sliwinski,35 Canfield and collaborators,36 Rodosevich and Miller,37 Haynes and Hiza,38 McClune,39 and Orrit and Laupretre40 were used to determine the final coefficients. Data from other sources were also examined and are compared with the correlation in Sec. 4.1. Additional references to experimental work on paL are given in Ref. 5. Points near 296 K and above 300 K in Ref. 35 and points from Ref. 40 not listed in the tables of Ref. 4 were exluded; from Ref. 22, only points near 302, 303, and 304 K were included in the determination of the coefficients listed in Table 4. These primary data, with temperatures ranging from 91 to 305 K, were equally weighted and a linear least-squares algorithm was used with a linearized form of Eq. (5).
Equation (6) for the density of the saturated vapor required expressions for both the vapor pressure and the density of the saturated liquid in order to ascertain values for the coefficients, I j • As mentioned above, the value of 10 was completely determined from the fit for Eq. (5). The value 8 for the exponent of 7' was chosen to optimize the fit in Ref. 1. The expression was then linearized and the coefficients determined by a least-squares routine. The input data consisted of 32 equally weighted points from Goodwin et al.,4 Douslin and Harrison,22 and Sliwinski.35
The points attributed to Ref. 4 comprised 18 points between 110 and 280 K obtained from the intersection of their vapor pressure and virial equations or other correlations; these are not experimental data but are needed to fill an important gap in the data. From Ref. 22, we used points below 290 K and near 303 and 304 K; from Ref. 35, data near 288 K and above 304 K were omitted. Other, especially earlier, sources of density data are cited in Ref. 5. All comparisons are deferred to Sec. 4.1.
3.3. Residual Helmholtz Energy
The coefficients associated with Eq. (2) were determined by multiproperty linear least-squares fitting, with the exponents used, r; and Si, identical to those determined by Schmidt and Wagner6 and to those used for the methane correlation of Ref. 1. The critical parameters of Table 1 were introduced into the fitting routine as constraints on the pressure and its first two isothermal density derivatives at the critical point. Thus we required
(21)
and
The resultant SWEOS gives the critical pressure exactly at the critical temperature and density; because of roundoff error, the first isothermal derivative is about 10- 11
MPa·dm3·mol- 1 and the second derivative is near 10- 12
MPa·dm6·mol-2. Because of this "accidental" deviation
from 0, the isobaric heat capacity, strongly divergent in the critical region according to theory and experimental evidence, remains finite (but very large) at the critical point.
The densities and pressures along the two-phase boundary; second virial coefficient data; PIT data; molar heat capacities at isochoric and isobaric conditions and along the saturated liquid boundary; and speed of sound in the single phase and along the liquid phase boundary were used in the determination of coefficients. The sources of primary data and the details concerning the use of different types of thermodynamic data in our fitting scheme are discussed in this section. Figure lc illustrates all the primary data in pressure-temperature coordinates. Comparisons between the data and the correlation, including figures and tables of statistical comparisons, are given in Sec 4.3.
The relative weights of data within the fitting routine were obtained from a determination of the type of thermodynamic data, the source of the experimental data, the region of the phase diagram, and the Gaussian error propagation formula. A complete discussion of the calculation of the weight for each of the approximately HmO points used is not feasible in this paper, but some indieation will be given in this section. The data and their weights, within the linear least-squares algorithm used to obtain the final values of the coefficients as given in Table 2, are tabulated in Ref. 3a.
The overall multiplier used to weight a particular property was determined by a nonlinear simplex algorithm.41 At vertices of the generated simplex, the linear leastsquares problem was solved. This optimization technique provides a rational procedure for determining parameters which are not linearly related to the objective function. We used the algorithm in determining relative weights among data sets and data types. The assignment of accuracies in both dependent and independent variables by experimentalists is often overly optimistic, and the data are too often inconsistent. The linear fitting technique cannot easily compensate for these inconsistencies. Even with the simplex method, there is a difficulty in choosing the objective function. The simplex algorithm did provide a consistent method tu ~xdud~ s~ts of data from the primary data set and to determine relative weights.
We sought to simultaneously obtain good agreement for all data types, with particular emphasis paid to reproducing the two-phase boundary defined by the ancillary equations. Relative weights ascribed to different data sources within a particular data type were also determined with a simplex nonlinear least-squares method.
It was impossible to fit all data within the stated experimental accuracy since data were frequently incompatible within the stated accuracies. Further it is sometimes impossible to fit certain highly accurate data to within experimental error even though they may be compatible with other data of lower accuracy. This is often the case when combining data such as speed of sound with other types of data. When data were incompatible in a partieu-
J. Phys. Chern. Ref. Data, Vol. 20, No.2, 1991
296 FRIEND, INGHAM, AND ELY
lar region of the phase diagram, determination of emphasis and de-emphasis, reflected in the relative weight given to the data, was made by considering the intrinsic merits of the experimental methods used, as well as by examining the agreement with additional data both within and outside the region of interest.
The Gaussian error formula was invoked to establish the relative weights of data from a particular source or within a particular type. We assumed fIxed relative or absolute accuracies for the various dependent and independent quantities involved in each type of data. Within each data source, the same accuracies were assumed throughout the range of the data. Thus, if z = z (x J') with absolute accuracies O'x,O'y, and O'z (or relative accuracies O'Jz, etc.) the relative weight is given by
[ ( azl)2 ( azl)2 ]-112 Wt ex a2z + O'x ax y + O'y ay x • (23)
In a few instances individual data were omitted from the final determination of the fitted coefficients. These data were excluded when the deviations from a preliminary version of the correlation were well beyond deviations for similar points or differed greatly from trends determined from similar points. These points are enumerated in Ref. 3a where the assigned weight of 0 is shown and are indicated in this section.
The fitting of the saturation boundary PIT data was exceptional in that data generated from the ancillary equations were input to the least-squares routine. Thus, values of Pu, puV, and puL at 43 temperatures evenly spaced between 91 and 301 K were evaluated from the ancillary equations, Eqs. (4-6) of Sec. 2.3. This was done to ensure that the saturation properties determined from the equation of state are as accurate as possible; the twophase boundary determined from the Helmholtz energy correlation is completely compatible with the ancillary equations. Three distinct minimization conditions [Pu(T) - P(puv, T), Pu(T) - P(paL,T), and the difference in the Gibbs energies of the two phases, A (Pav,T) + Pa/puv -A (PuL,T) - Pu/Pud associated with the saturation boundary were incorporated within the fitting routine. In these expressions, the ideal gas contrihutions to the pressure and thermodynamic potential were subtracted, since only the residual molar Helmholtz energy was determined from the fitting procedure. The functions of density and temperature were evaluated as indicated in Table 7. All three of these conditions received heavy weighting, with extra emphasis placed on the density of the saturated liquid in the critical region. Below 180 K, the weights of both the vapor density and equality of the Gibbs energies were made somewhat lower than the weights obtained from the Gaussian formula and the simplex algorithm which gave an overall multiplier for this type of data. Figures 4-6 of Sec. 4.1 compare saturation properties calculated from the ancillary equations with 'those calculated from the SWEOS.
The data for the second virial coefficient which were used in this correlation were from Michels et al.,42 Pope
J. Phys. Chem. Ref. Data, Vol. 20, No.2, 1991
et al.,43 Douslin and Harrison,22 and Mansoorian et al.44
The 35 data spanned the range 210-623 K. Points at lower temperatures, based on corresponding states arguments by McGlashan and Potter45 and adjusted by Goodwin et al.,4 were used as primary data in Ref. 4 but have been excluded from our fit. The zero- density limit indicated in the expression for the second vi rial coefficient in Table 7 implies that only the parameters ni with i = 1,2,3,14, and 15 are directly affected by the virial coefficient data. The weighting for the virial data tended to be high. The simplex nonlinear fitting routine indicated that we could establish the greatest consistency with other thermodynamic data by heavily weighting the data from Refs. 22 and 44 and placing less emphasis on the points from Ref. 43. Other data were also considered, as discussed in the comparison section. Sec. 4.3.1. Experimentally determined third virial coefficient data were not used in the present correlation. These data are difficult to obtain and consequently suffer from inaccuracies.
The largest body of thermodynamic data for ethane consists of PIT measurements. We used, as primary data, 803 points from Pal et al.,31 Straty and Tsumura,34 Douslin and Harrison,22 Michels ct a[ .,42 Parrish,46 and Sengers.23 From Ref. 31, only data at pressures greater than 35 MPa were weighted; these 45 data have a range of 36-69 MPa, 183-320 K, and 15-19 mol·dm- 3
• The 381 selected data from Ref. 34 span the range 96-320 K, 3-38 MPa, and 2-21.6 mol·dm-3
• Some low density data along the 1.2 and 4.3 mol·dm -3 isochores, near-critical data at densities near 6.5 mol·dm- 3
, and liquid data near the saturation boundary were not weighted in the correlation. Reference 22 provided 257 primary data with temperatures from 273 to 623 K, pressures from 1.4 to 40 MPa, and densities from 0.75 to 10.5 mol·dm -3; points outside this range and near the coexistence boundary and critical isotherm from Table 1 of Ref. 22 were not used to determine the final coefficients of Eq. (2). The primary data from Ref. 42 consisted of 81 points between 273 and 423 K, 1.6 and 10 MPa, and 0.85 and 3.6 mol·dm- 3
• The higher density uata from Michels el al.42 were not included in"'the fitting routine. The 9 PIT points from Ref. 46 were in the range 300-322 K, 5.5-9.7 MPa, and 4-12 mol·dm-3_
Finally, 30 single-phase PIT points in the critical region were generated from the (revised and extended) scaled equation of state provided by Sengers.23 This equation of state was based largely on the PIT data of Ref. 22. These 30 data serve to ensure that the classical SWEOS formulation conforms closely to the known nonanalytic behavior of the fluid in the critical region. The data were within the region bounded by 304 and 325 K, 4.7 and 8.1 MPa, and 4.9 and 9 mol·dm-3
• These and other data are compared with the SWEOS in Sec. 4.; Table 12 in Sec. 4.3.2 summarizes the data and statistical comparisons and Figs. 9-12 illustrate the deviations between the data and the SWEOS.
The determination of the relative weights of each source of PIT data was made using the simplex algorithm discussed above; other data sources, discussed in the
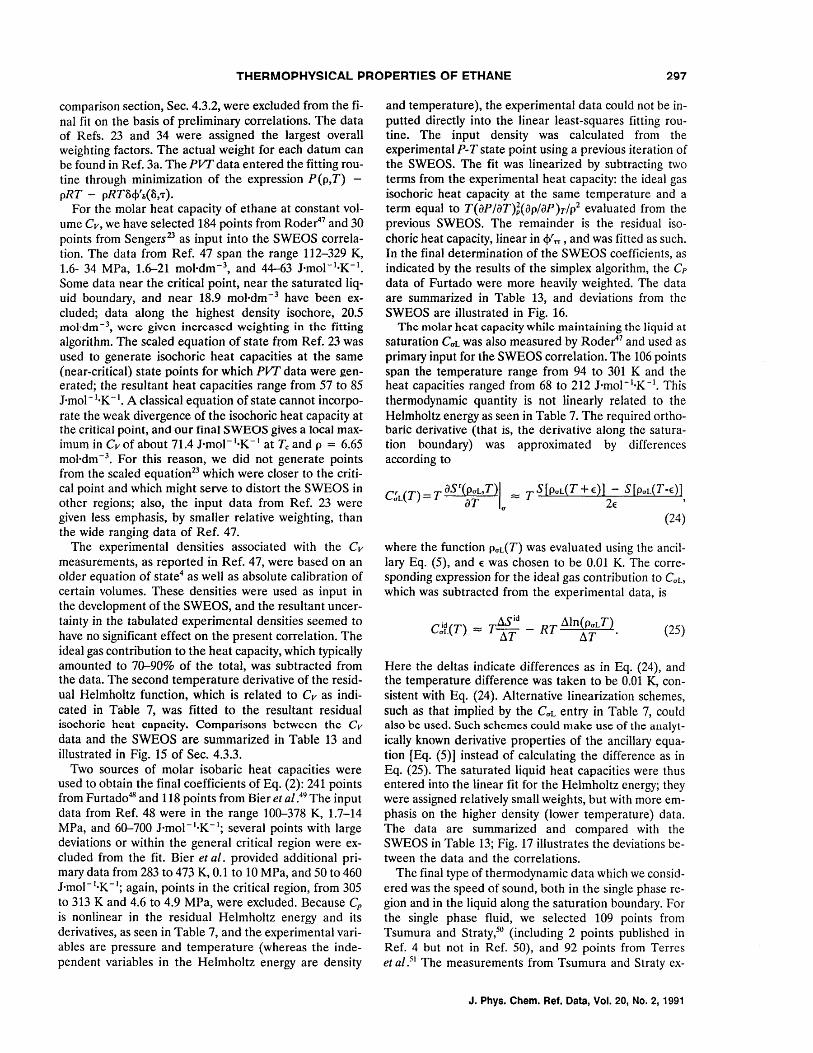
THERMOPHVSICAL PROPERTIES OF ETHANE 297
comparison section, Sec. 4.3.2, were excluded from the final fit on the basis of preliminary correlations. The data of Refs. 23 and 34 were assigned the largest overall weighting factors. The actual weight for each datum can be found in Ref. 3a. The PIT data entered the fitting routine through minimization of the expression P(p,T) -pRT - pRT8q{o(8,T).
For the molar heat capacity of ethane at constant volume Cv , we have selected 184 points from Roder47 and 30 points from Sengers23 as input into the SWEOS correlation. The data from Ref. 47 span the range 112-329 K, 1.6- 34 MPa, 1.6-21 mol'dm-3, and 44-63 j·mol-1·K-1. Some data near the critical point, near the saturated liquid boundary, and near 18.9 mol·dm -3 have been excluded; data along the highest density isochore, 20.5 mol-dm- 3, were given increased weighting in the fitting algorithm. The scaled equation of state from Ref. 23 was used to generate isochoric heat capacities at the same (near-critical) state points for which PIT data were generated; the resultant heat capacities range from 57 to 85 j·mol-1·K-1. A classical equation of state cannot incorporate the weak divergence of the isochoric heat capacity at the critical pOint, and our final SWEOS gives a local maximum in Cv of about 71.4 j·mol-1·K-1 at Tc and p = 6.65 mol·dm -3. For this reason, we did not generate points from the scaled equation23 which were closer to the critical point and which might serve to distort the SWEOS in other regions; also, the input data from Ref. 23 were given less emphasis, by smaller relative weighting, than the wide ranging data of Ref. 47.
The experimental densities associated with the Cv measurements, as reported in Ref. 47, were based on an older equation of state4 as well as absolute calibration of certain volumes. These densities were used as input in the development of the SWEOS, and the resultant uncertainty in the tabulated experimental densities seemed to have no significant effect on the present correlation. The ideal gas contribution to the heat capacity, which typically amounted to 70-90% of the total, was subtracted from the data. The second temperature derivative of the residual Helmholtz function, which is related to Cv as indicated in Table 7, was fitted to the resultant residual isoehoric heat capacity. Comparisons between the Cv data and the SWEOS are summarized in Table 13 and illustrated in Fig. 15 of Sec. 4.3.3.
Two sources of molar isobaric heat capacities were used to obtain the final coefficients of Eq. (2): 241 points from Furtado48 and 118 points from Bier et al.49 The input data from Ref. 48 were in the range 100-378 K, 1.7-14 MPa, and 60-700 j'mol-1'K- 1
; several points with large deviations or within the general critical region were excluded from the fit. Bier et al. provided additional primary data from 283 to 473 K, 0.1 to 10 MPa, and 50 to 460 j'mol- I'K- 1
; again, points in the critical region, from 305 to 313 K and 4.6 to 4.9 MPa, were excluded. Because Cp
is nonlinear in the residual Helmholtz energy and its derivatives, as seen in Table 7, and the experimental variables are pressure and temperature (whereas the independent variables in the Helmholtz energy are density
and temperature), the experimental data could not be inputted directly into the linear least-squares fitting routine. The input density was calculated from the experimental P-Tstate point using a previous iteration of the SWEOS. The fit was linearized by subtracting two terms from the experimental heat capacity: the ideal gas isochoric heat capacity at the same temperature and a term equal to T(ap/aT)~(ap/ap)T/p2 evaluated from the previous SWEOS. The remainder is the residual isochoric heat capacity, linear in <Vrr, and was fitted as such. In the final determination of the SWEOS coefficients, as indicated by the results of the simplex algorithm, the Cp
data of Furtado were more heavily weighted. The data are summarized in Table 13, and deviations from the SWEOS are illustrated in Fig. 16.
The molar heat capacity while maintaining the liquid at saturation Cal was also measured by Roder47 and used as primary input for the SWEOS correlation. The 106 points span the temperature range from 94 to 301 K and the heat capacities ranged from 68 to 212 j·mol-1·K- 1• This thermodynamic quantity is not linearly related to the Helmholtz energy as seen in Table 7. The required orthobaric derivative (that is, the derivative along the saturation boundary) was approximated by differences according to
C;L(T) = T asr(:;,T)la
= TS[Pat{T +e)] 2~ S[PaL(T-e)],
(24)
where the function Pat{T) was evaluated using the ancillary Eq. (5), and e was chosen to be 0.01 K. The corresponding expression for the ideal gas contribution to CaL, which was subtracted from the experimental data, is
Here the deltas indicate differences as in Eq. (24), and the temperature difference was taken to be 0.01 K, consistent with Eq. (24). Alternative linearization schemes, such as that implied by the CaL entry in Table 7, could also be used. Such schemes could make use of the analytically known derivative properties of the ancillary equation [Eq. (5)] instead of calculating the difference as in Eq. (25). The saturated liquid heat capacities were thus entered into the linear fit for the Helmholtz energy; they were assigned relatively small weights, but with more emphasis on the higher density (lower temperature) data. The data are summarized and compared with the SWEOS in Table 13; Fig. 17 illustrates the deviations between the data and the correlations.
The final type of thermodynamic data which we considered was the speed of sound, both in the single phase region and in the liquid along the saturation boundary. For the single phase fluid, we selected 109 points from Tsumura and Straty,50 (including 2 points published in Ref. 4 but not in Ref. 50), and 92 points from Terres et al.s1 The measurements from Tsumura and Straty ex-
J. Phys. Chem. Ref. Data, Vol. 20, No.2, 1991
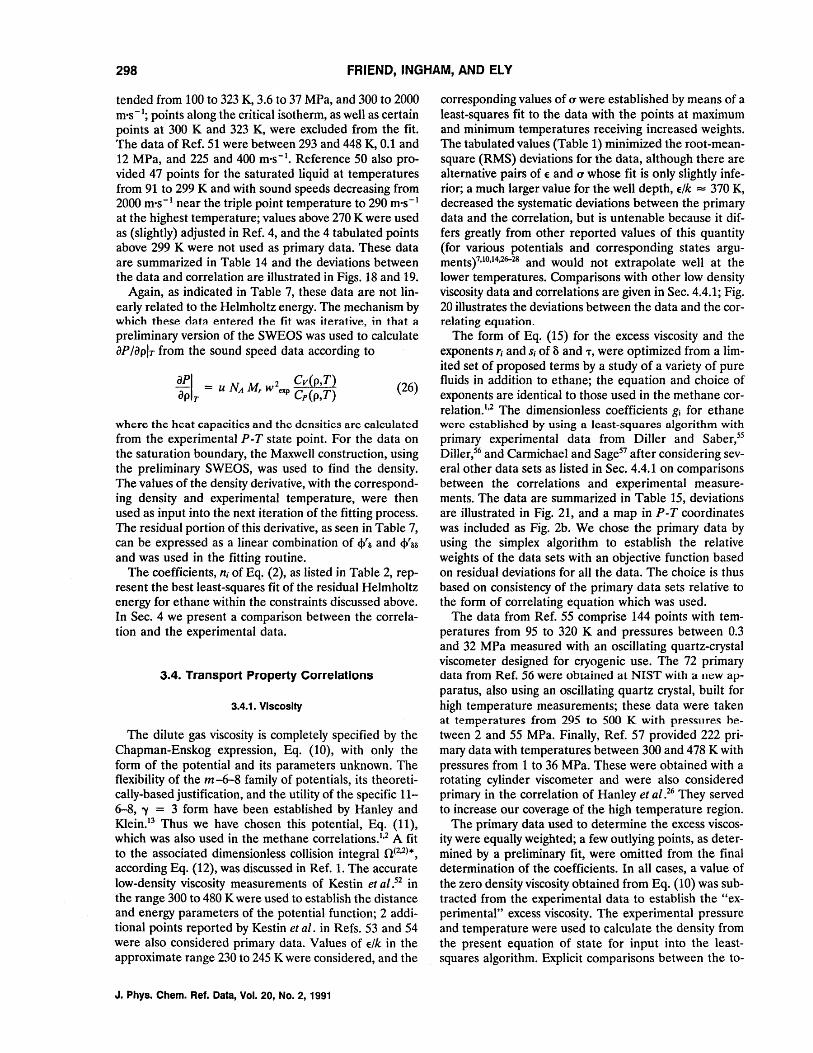
298 FRIEND, INGHAM, AND ELY
tended from 100 to 323 K, 3.6 to 37 MPa, and 300 to 2000 m's -I; points along the critical isotherm, as well as certain points at 300 K and 323 K, were excluded from the fit. The data of Ref. 51 were between 293 and 448 K, 0.1 and 12 MPa, and 225 and 400 m's -1. Reference 50 also provided 47 points for the saturated liquid at temperatures from 91 to 299 K and with sound speeds decreasing from 2000 m's- I near the triple point temperature to 290 m's-1
at the highest temperature; values above 270 K were used as (slightly) adjusted in Ref. 4, and the 4 tabulated points above 299 K were not used as primary data. These data are summarized in Table 14 and the deviations between the data and correlation are illustrated in Figs. 18 and 19.
Again, as indicated in Table 7, these data are not linearly related to the Helmholtz energy. The mechanism by which these c1~t~ entered the fit w~s iter~tive, in th~t ~ preliminary version of the SWEOS was used to calculate iJP /iJplT from the sound speed data according to
iJPI _ 2 Cv(p,T) iJp T - UNA M, W exp Cp(p,T) (26)
where the heat capacities and the densities are calculated from the experimental P -T state point. For the data on the saturation boundary, the Maxwell construction, using the preliminary SWEOS, was used to find the density. The values of the density derivative, with the corresponding density and experimental temperature, were then used as input into the next iteration of the fitting process. The residual portion of this derivative, as seen in Table 7, can be expressed as a linear combination of 4>'s and 4>'ss and was used in the fitting routine.
The coefficients, ni of Eq. (2), as listed in Table 2, represent the best least -squares fit of the residual Helmholtz energy for ethane within the constraints discussed above. In Sec. 4 we present a comparison between the correlation and the experimental data.
3.4. Transport Property Correlations
3.4.1. Viscosity
The dilute gas viscosity is completely specified by the Chapman-Enskog expression, Eq. (10), with only the form of the potential and its parameters unknown. The flexibility of the m-6-8 family of potentials, its theoretically-based justification, and the utility of the specific 11-6-8, 'Y = 3 form have been established by Hanley and KleinP Thus we have chosen this potential, Eq. (11), which was also used in the methane correlations.1,2 A fit to the associated dimensionless collision integral 0(2,2)*, according Eq. (12), was discussed in Ref. 1. The accurate low-density viscosity measurements of Kestin et aI.52 in the range 300 to 480 K were used to establish the distance and energy parameters of the potential function; 2 additional points reported by Kestin et al. in Refs. 53 and 54 were also considered primary data. Values of elk in the approximate range 230 to 245 K were considered, and the
J. Phys. Chern. Ref. Data, Vol. 20, No.2, 1991
corresponding values of (J' were established by means of a least-squares fit to the data with the points at maximum and minimum temperatures receiving increased weights. The tabulated values (Table 1) minimized the root-meansquare (RMS) deviations for the data, although there are alternative pairs of e and (J' whose fit is only slightly inferior; a much larger value for the well depth, elk = 370 K, decreased the systematic deviations between the primary data and the correlation, but is untenable because it differs greatly from other reported values of this quantity (for various potentials and corresponding states argumentsf,lo,14,2&-28 and would not extrapolate well at the lower temperatures. Comparisons with other low density viscosity data and correlations are given in Sec. 4.4.1; Fig. 20 illustrates the deviations between the data and the correlating equation.
The form of Eq. (15) for the excess viscosity and the exponents r; and S; of 8 and T, were optimized from a limited set of proposed terms by a study of a variety of pure fluids in addition to ethane; the equation and choice of exponents are identical to those used in the methane correlation.1,2 The dimensionless coefficients gi for ethane were established by using a least-squares algorithm with primary experimental data from Diller and Saber,55 Diller,56 and Carmichael and Sage57 after considering several other data sets as listed in Sec. 4.4.1 on comparisons between the correlations and experimental measurements. The data are summarized in Table 15, deviations are illustrated in Fig. 21, and a map in P-T coordinates was included as Fig. 2b. We chose the primary data by using the simplex algorithm to establish the relative weights of the data sets with an objective function based on residual deviations for all the data. The choice is thus based on consistency of the primary data sets relative to the form of correlating equation which was used.
The data from Ref. 55 comprise 144 points with temperatures from 95 to 320 K and pressures between 0.3 and 32 MPa measured with an oscillating quartz-crystal viscometer designed for cryogenic use. The 72 primary data from Ref. 56 were obtained at NIST with a new apparatus, also using an oscillating quartz crystal, built for high temperature measurements; these data were taken at temperatures from 295 to 500 K with pre~~l1re~ hetween 2 and 55 MPa. Finally, Ref. 57 provided 222 primary data with temperatures between 300 and 478 K with pressures from 1 to 36 MPa. These were obtained with a rotating cylinder viscometer and were also considered primary in the correlation of Hanley et aI.26 They served to increase our coverage of the high temperature region.
The primary data used to determine the excess viscosity were equally weighted; a few outlying points, as determined by a preliminary fit, were omitted from the final determination of the coefficients. In all cases, a value of the zero density viscosity obtained from Eq. (10) was subtracted from the experimental data to establish the "experimental" excess viscosity. The experimental pressure and temperature were used to calculate the density from the present equation of state for input into the leastsquares algorithm. Explicit comparisons between the to-
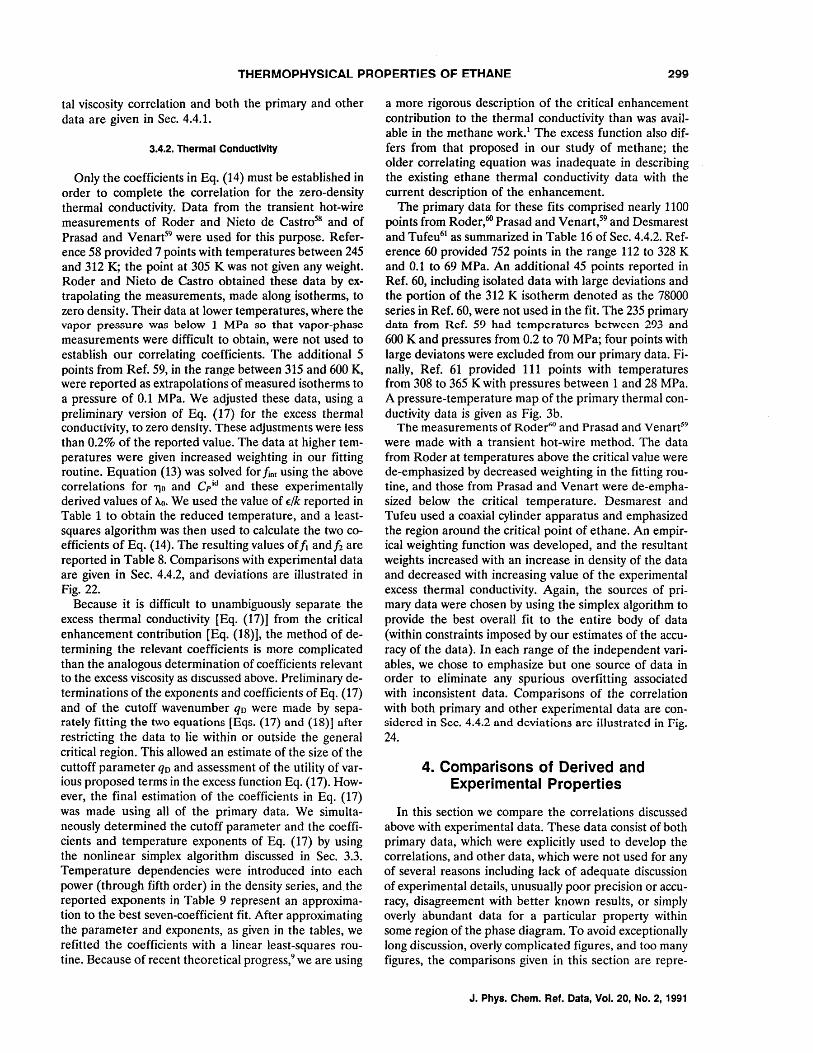
THERMOPHVSICAL PROPERTIES OF ETHANE 299
tal viscosity correlation and both the primary and other data are given in Sec. 4.4.1.
3.4.2. Thermal Conductivity
Only the coefficients in Eq. (14) must be established in order to complete the correlation for the zero-density thermal conductivity. Data from the transient hot-wire measurements of Roder and Nieto de Castr058 and of Prasad and Venart59 were used for this purpose. Reference 58 provided 7 points with temperatures between 245 and 312 K; the point at 305 K was not given any weight. Roder and Nieto de Castro obtained these data by extrapolating the measurements, made along isotherms, to zero density. Their data at lower temperatures, where the vapor pressure was below 1 MPa so that vapor-phase measurements were difficult to obtain, were not used to establish our correlating coefficients. The additional 5 points from Ref. 59, in the range between 315 and 600 K, were reported as extrapolations of measured isotherms to a pressure of 0.1 MPa. We adjusted these data, using a preliminary version of Eq. (17) for the excess thermal conductivity, to zero density. These adjustments were less than 0.2% of the reported value. The data at higher temperatures were given increased weighting in our fitting routine. Equation (13) was solved for lint using the above correlations for 110 and Cp
id and these experimentally derived values of Ao. We used the value of Elk reported in Table 1 to obtain the reduced temperature, and a leastsquares algorithm was then used to calculate the two coefficients of Eq. (14). The resulting values off I and/2 are reported in Table 8. Comparisons with experimental data are given in Sec. 4.4.2, and deviations are illustrated in Fig. 22.
Because it is difficult to unambiguously separate the excess thermal conductivity [Eq. (17)] from the critical enhancement contribution [Eq. (18)], the method of determining the relevant coefficients is more complicated than the analogous determination of coefficients relevant to the excess viscosity as discussed above. Preliminary determinations of the exponents and coefficients of Eq. (17) and of the cutoff wavenumber qD were made by separately fitting the two equations [Eqs. (17) and (18)] after restricting the data to lie within or outside the general critical region. This allowed an estimate of the size of the cuttoff parameter qD and assessment of the utility of various proposed terms in the excess function Eq. (17). However, the final estimation of the coefficients in Eq. (17) was made using all of the primary data. We simultaneously determined the cutoff parameter and the coefficients and temperature exponents of Eq. (17) by using the nonlinear simplex algorithm discussed in Sec. 3.3. Temperature dependencies were introduced into each power (through fifth order) in the density series, and the reported exponents in Table 9 represent an approximation to the best seven-coefficient fit. After approximating the parameter and exponents, as given in the tables, we refitted the coefficients with a linear least-squares routine. Because of recent theoretical progress,9 we are using
a more rigorous description of the critical enhancement contribution to the thermal conductivity than was available in the methane work. I The excess function also differs from that proposed in our study of methane; the older correlating equation was inadequate in describing the existing ethane thermal conductivity data with the current description of the enhancement.
The primary data for these fits comprised nearly 1100 points from Roder,60 Prasad and Venart,59 and Desmarest and Tufeu61 as summarized in Table 16 of Sec. 4.4.2. Reference 60 provided 752 points in the range 112 to 328 K and 0.1 to 69 MPa. An additional 45 points reported in Ref. 60, including isolated data with large deviations and the portion of the 312 K isotherm denoted as the 78000 series in Ref. 60, were not used in the fit. The 235 primary data from Ref. 59 had temperatures between 293 and 600 K and pressures from 0.2 to 70 MPa; four points with large deviatons were excluded from our primary data. Finally, Ref. 61 provided 111 points with temperatures from 308 to 365 K with pressures between 1 and 28 MPa. A pressure-temperature map of the primary thermal conductivity data is given as Fig. 3b.
The measurements of Roder60 and Prasad and Venart59
were made with a transient hot-wire method. The data from Roder at temperatures above the critical value were de-emphasized by decreased weighting in the fitting routine, and those from Prasad and Venart were de-emphasized below the critical temperature. Desmarest and Tufeu used a coaxial cylinder apparatus and emphasized the region around the critical point of ethane. An empirical weighting function was developed, and the resultant weights increased with an increase in density of the data and decreased with increasing value of the experimental excess thermal conductivity. Again, the sources of primary data were chosen by using the simplex algorithm to provide the best overall fit to the entire body of data (within constraints imposed by our estimates of the accuracy of the data). In each range of the independent variables, we chose to emphasize but one source of data in order to eliminate any spurious overfitting associated with inconsistent data. Comparisons of the correlation with both primary and other experimental data are con· sidered in See. 4.4.2 and deviations are illustrated in Pig. 24.
4. Comparisons of Derived and Experimental Properties
In this section we compare the correlations discussed above with experimental data. These data consist of both primary data, which were explicitly used to develop the correlations, and other data, which were not used for any of several reasons including lack of adequate discussion of experimental details, unusually poor precision or accuracy, disagreement with better known results, or simply overly abundant data for a particular property within some region of the phase diagram. To avoid exceptionally long discussion, overly complicated figures, and too many figures, the comparisons given in this section are repre-
J. Phys. Chem. Ref. Data, Vol. 20, No.2, 1991
300 FRIEND, INGHAM, AND ELY
sentative rather than exhaustive. References to other sources of experimental data can be found within the pa~ pers cited in our reference list.
In all the deviation plots, the zero line represents the appropriate correlation using the equations of Sec. 2 and the associated tables. The percentage deviations are com~ puted as 100( cor - exp )/exp where "exp" represents the experimental value of a property and "cor" is the value computed from the correlation and the experimental value(s) of the independent variable(s).
The precision of a quantity is often measured by its re~ producibility; for the correlations of this paper the preci~ . sion concerns the round-off error and is not of primary interest. The accuracy is a measure of the deviation of a quantity from its true value; the estimates of the accuracies of our correlations represent our best assesment of the maximum difference between a quantity computed from the correlation given the independent variable(s) and the tnJe physicaJ quantity at the same value(s) of the independent variable(s). The accuracies of the correla~ tions depend on the quantity to be calculated and the range of the independent variable(s) as discussed below. When an uncertainty band is quoted, we think that the true value lies within the band. Our error estimates represent the maximum deviation between a predicted value and the true value; these estimates are equivalent to the accuracy assessments. More than 99% of the primary data lie within our uncertainty estimates; thus, with conventional assumptions concerning the distribution of residuals, these are equivalent to 2.50' accuracy estimates where 0' is the standard deviation. Additional statistical quantities concerning the comparison of the correlations with experimental data are given below and in the tables.
4.1. Two-Phase Boundary
In Fig. 4, we show the deviation of experimental orthobaric pressure data from the correlation of Eq. (4). For the 127 primary data from Refs. 22 and 31-34, the average absolute percent deviation (AAD-%) is 0.04%. The consistency of these primary data, judged from the regions of overlap of the different experimental sources is also quite good, typically well within 0.1 %. The data from Refs. 22, 31, 32, and 34 were obtained as part of PVT studies of ethane; expansion methods were employed by Pope32 and Straty and Tsumura,34 and an isoehorie chamber technique and pycnometer were used in the work of Pal et al.31 and DousHn and Harrison.22 The excellent agreement with the lower temperature primary results of Ziegler et al.33 is somewhat misleading, as these data were adjusted by Goodwin4
•62 to conform to his newer sec
ond virial coefficient data. The unadjusted data are also illustrated in Fig. 4 and have deviations to about 2.5% near the triple point temperature. Carruth and and Kobayashi63 report experimental determinations of these very low vapor pressures based on a steady-state gas-saturation technique with a reported accuracy of about 3%. These data, as well as the low temperature results of Regnier64 and Djordjevich and Budenholzer,65 are also indi-
J. Phys. Chern. Ref. Data, Vol. 20, No.2, 1991
cated in Fig. 4. Data in the critical region, from Miniovich and Sorina,66 agree to within 0.06% with our correlation and are included in the figure.
For the 220 data illustrated in Fig. 4, the AAD-% is 0.64%, with the major contribution to the deviations coming from the very small vapor pressures and hence large percentage deviations in the secondary data at low temperatures. A few data, reported for temperatures above our value of Tc or below our value of T" have been omitted from the figure and from the statistics. The figure also illustrates two earlier correlations, by Goodwin et al.4 and by Younglove and Ely,lO which were based on substantially identical data. The difference between the ancillary correlation and vapor pressures computed from the SWEOS using the Maxwell construction technique is shown to be well under 0.1 % from the triple puint tu tht: critical temperature. The ancillary equations were used to generate 43 points at 5 K increments as input for the SWEOS correJation. Statistics concerning a comparison of the Maxwell construction and the ancillary equation are given in Table 11. In addition to the AAD-%, the BIAS (average deviation) and root-mean-square deviation (RMS) are given. All statistics in Table 11 are presented on both a percentage and dimensional basis.
A compilation of sources of experimental vapor pressure data, including very early measurements, appears in the monograph by Sychev et al.;5 that study adopted the correlation of Goodwin et al. 4 Additional discussions of the data are given by Goodwin.4
•62 Eubank.67 and the ex
perimental papers we have cited. Upon considering the uncertainties of both the triple point and critical point pressures (Table 1) and the quality of both primary and other experimental data, we make the subjective judgment that either the ancillary Eq. (4) or the SWEOS will provide values of the saturation pressures accurate within 0.1% above T - 165 K, within 1% between 130 and 165 K, and within 5% for temperatures from the triple point to 130 K where the vapor pressure is less than 0.003 MPa.
For the density of the saturated liquid, Fig. 5 illustrates the deviations between the correlation of Eq. (5) and experimental data and other correlations. The primary data, comprising 66 points from Refs. 22 and 35- 40, give an AAD-% of 0.03% with a maximum deviation of less than 0.1 %. These data were obtained by a variety of techniques. Buoyancy forces were measured by Haynes and Hiza38 using a magnetic suspension densimeter with a barium ferrite buoy and by McClune39 and Orrit et al.40
using silica buoys and mechanical suspensions. Calibrated pycnometer volumes were used by extrapolation of single-phase isotherms to the measured saturation pressure (or near the critical point, to a break in the observed isotherm) by Douslin and Harrison.22 Coexisting phases in a glass pycnometer were observed directly by SliwinskPs and by Canfield and collaborators,36 and an expansion technique was used by Rodosevich and Mi11er.37
Although the primary data were chosen to ensure consistency, Fig. 5 illustrates that there are more substantial differences among the other data. For instance, in the
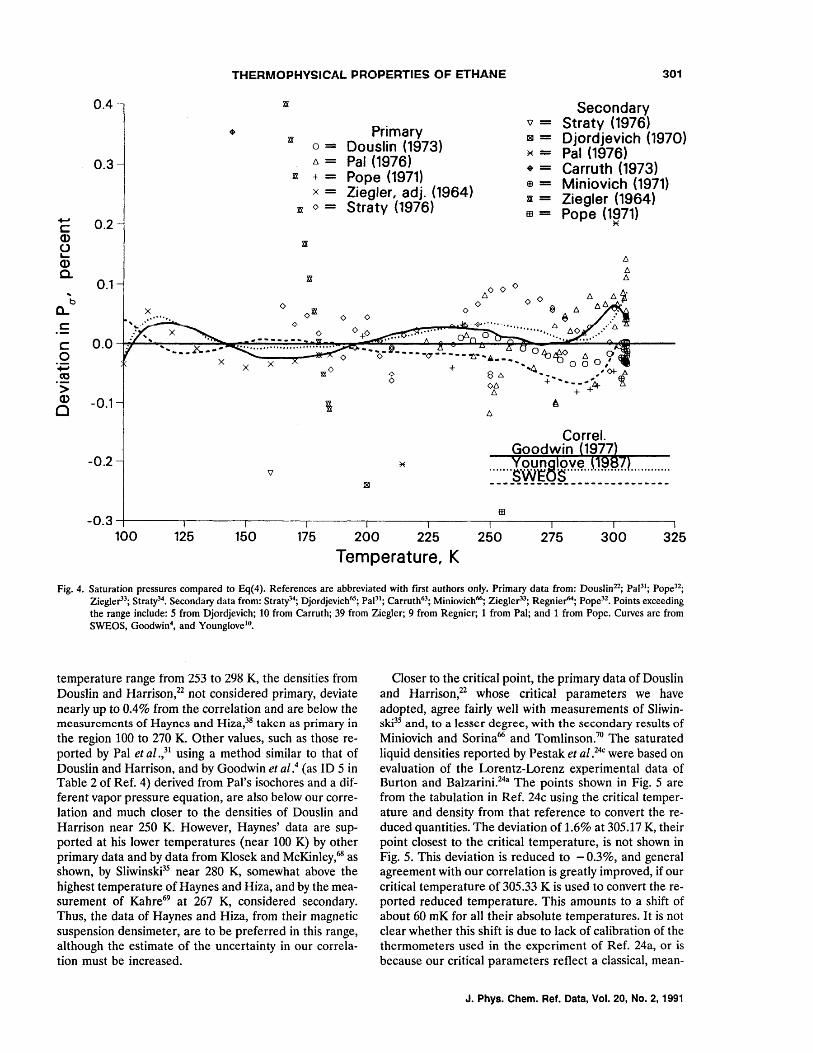
THERMOPHVSICAL PROPERTIES OF ETHANE 301
0.4
• Primary
Secondary \l = Straty (1976)
xx 0= Douslin (1973) t!i1 = Ojordjevich (1970)
~ = Pal (1976) 0.3 f::,,= Pal (1976)
• = Carruth (1973) xx += Pope (1971) EB = Miniovich (1971) xx = Ziegler (1964)
x= Ziegler, adj. (1964) xx 0= Straty (1976)
EB = Pope (1971) +J 0.2 c: ~
xx Q) (J ..... Q) a.
0.1 -.
o b a.. x ........ ,. C
c: 0.0 0
'+=i co .s; Q) -0.1 Cl
",.---- .... -x x
.... '0. • ..... -<:}' .. - .... - "t:J." ... 0 4J lAO f::" 0 •• --~ ~ 0 0 0 I + ... " I
¢ $ 6. ..... -... ..'<>+- ~ o Of::" + ........... '4 !
f::" + +
Correl.
-0.2 Goodwin (1977~
EB -0.34-------~----~~----~------~------~----~~----~------~----~
100 125 150 175 200 225 250 275 300 325
Temperature, K
Fig. 4. Saturation pressures compared to Eq(4). References are abbreviated with first authors only. Primary data from: Douslin22; PaP!; Pope32; Ziegle~3; Strao/4. Secondary data from: Strao/4; Djordjevich65; PaI3!; Carruth63; Miniovich66
; Ziegle~3; Regnier64; Pope32. Points exceeding
the range include: 5 from Djordjevich; 10 from Carruth; 39 from Ziegler; 9 from Regnier; 1 from Pal; and 1 from Pope. Curves are from SWEOS, Goodwin4, and Younglove lO
•
temperature range from 253 to 298 K, the densities from Douslin and Harrison,22 not considered primary, deviate nearly up to 0.4% from the correlation and are below the measurements of Haynes and Hiza,38 taken as primary in the region 100 to 270 K. Other values, such as those reported by Pal et al.,31 using a method similar to that of Douslin and Harrison. and by Goodwin et al.4 (as ID 5 in Table 2 of Ref. 4) derived from Pal's isochores and a different vapor pressure equation, are also below our correlation and much closer to the densities of Douslin and Harrison near 250 K. However, Haynes' data are supported at his lower temperatures (near 100 K) by other primary data and by data from Klosek and McKinley,68 as shown, by Sliwinskp5 near 280 K, somewhat above the highest temperature of Haynes and Hiza, and by the measurement of Kahre69 at 267 K, considered secondary. Thus, the data of Haynes and Hiza, from their magnetic suspension densimeter, are to be preferred in this range, although the estimate of the uncertainty in our correlation must be increased.
Closer to the critical point, the primary data of Douslin and Harrison,22 whose critical parameters we have adopted, agree fairly well with measurements of Sliwinski35 and, to a lesser degree, with the secondary results of Miniovich and Sorina66 and Tomlinson.7o The saturated liquid densities reported by Pestak et al.2'k were based on evaluation of the Lorentz-Lorenz experimental data of Burton and Balzarini.24a The points shown in Fig. 5 are from the tabulation in Ref. 24c using the critical temperature and density from that reference to convert the reduced quantities. The deviation of 1.6% at 305.17 K, their point closest to the critical temperature, is not shown in Fig. 5. This deviation is reduced to -0.3%, and general agreement with our correlation is greatly improved, if our critical temperature of 305.33 K is used to convert the reported reduced temperature. This amounts to a shift of about 60 mK for all their absolute temperatures. It is not clear whether this shift is due to lack of calibration of the thermometers used in the experiment of Ref. 24a, or is because our critical parameters reflect a classical, mean-
J. Phys. Chern. Ref. Data, Vol. 20, No.2, 1991
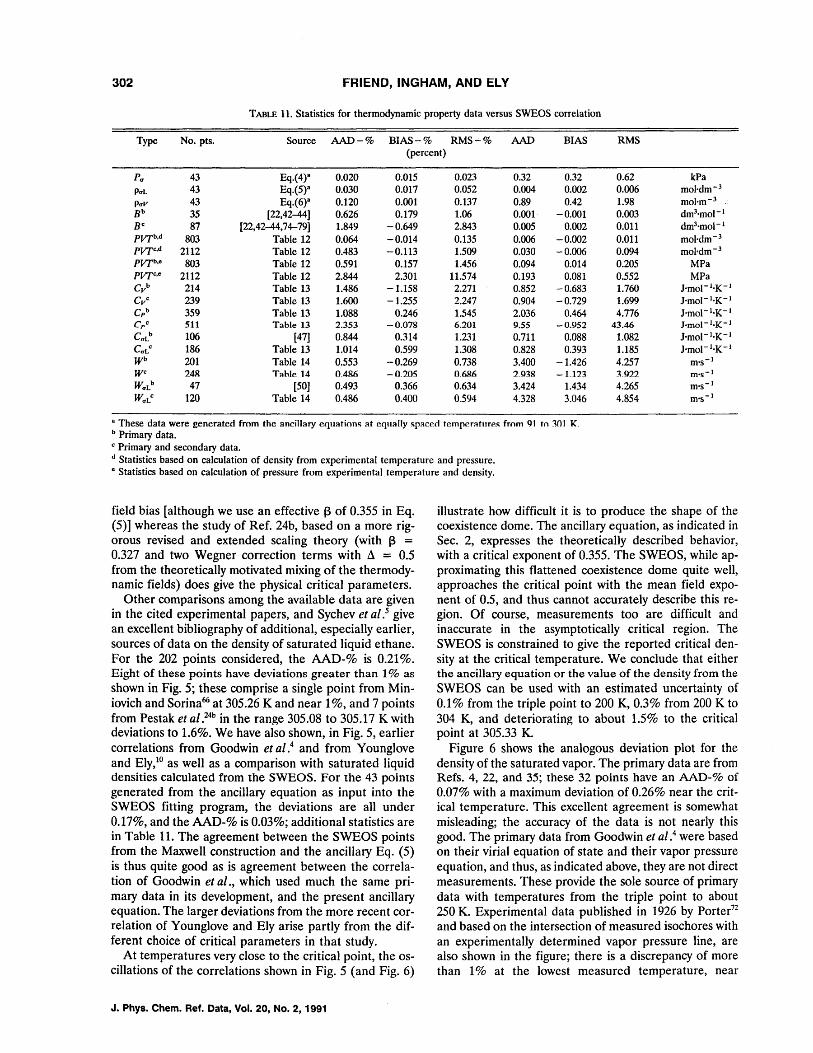
302 FRIEND, INGHAM, AND ELY
TABLE 11. Statistics for thermodynamic property data versus SWEOS correlation
Type No. pts. Source AAD-% BIAS-% RMS-'-% AAD BIAS RMS (percent)
Pa 43 Eq.(4)8 0.020 0.015 0.023 0.32 0.32 0.62 kPa
PaL 43 Eq.(5)a 0.030 0.017 0.052 0.004 0.002 0.006 mol·dm- 3
paV 43 Eq.(6)8 0.120 0.001 0.137 0.89 0.42 1.98 mol'm- 3
Bb 35 [22,42-44] 0.626 0.179 1.06 0.001 -0.001 0.003 dm3'mol- 1
BC 87 [22,42-44,74-79] 1.849 -0.649 2.843 0.005 0.002 0.011 dm3'mol- 1
PVTb•d 803 Table 12 0.064 -0.014 0.135 0.006 -0.002 0.011 mol·dm-3
PVTc.d 2112 Table 12 0.483 -0.113 1.509 0.030 -0.006 0.094 mol·dm- 3
PVTb.e 803 Table 12 0.591 0.157 1.456 0.094 0.014 0.205 MPa PVTc,e 2112 Table 12 2.844 2.301 11.574 0.193 0.081 0.552 MPa CV
b 214 Table 13 1.486 -1.158 2.271 0.852 -0.683 1.760 J·mol-1·K- 1
Cvc 239 Table 13 1.600 -1.255 2.247 0.904 -0.729 1.699 J·mol-1·K-l Cpb 359 Table 13 1.088 0.246 1.545 2.036 0.464 4.776 J·mol-1·K-l er c 511 Table 13 2.353 -0.078 6.201 9.55 -0.952 43.46 J·mol-1·K-l CaLb 106 [47] 0.844 0.314 1.231 0.711 0.088 1.082 J'mol-1'K-l CaLC 186 Table 13 1.014 0.599 1.308 0.828 0.393 1.185 J-mol-1·K- 1
Wb 201 Table 14 0.553 -0.269 0.738 3.400 -1.426 4.257 m's- 1
WC 248 Table 14 0.486 -0.205 0.686 2.938 -1.123 3.922 m's- 1
WaLb 47 [50] 0.493 0.366 0.634 3.424 1.434 4.265 m's- 1
WaLc 120 Table 14 0.486 0.400 0.594 4.328 3.046 4.854 rn's- 1
8 These data were generated from the ancillary eqllation~ at equally spaced tempeTatllTes from Ql to ~01 K. b Primary data. c Primary and secondary data. d Statistics based on calculation of density from experimental temperature and pressure. e Statistics based on calculation of pressure from experimental temperature and density.
field bias [although we use an effective 13 of 0.355 in Eq. (5)] whereas the study of Ref. 24b, based on a more rigorous revised and extended scaling theory (with 13 =
0.327 and two Wegner correction terms with d = 0.5 from the theoretically motivated mixing of the thermodynamic fields) does give the physical critical parameters.
Other comparisons among the available data are given in the cited experimental papers, and Sychev et al.s give an excellent bibliography of additional, especially earlier, sources of data on the density of saturated liquid ethane. For the 202 points considered, the AAD-% is 0.21%. Eight of these points have deviations greater than 1 % as shown in Fig. 5; these comprise a single point from Miniovich and Sorina66 at 305.26 K and near 1 %, and 7 points from Pestak et al.24b in the range 305.08 to 305.17 K with deviations to 1.6%. We have also shown, in Fig. 5, earlier correlations from Goodwin et ai.4 and from Younglove and Ely,IO as well as a comparison with saturated liquid densities calculated from the SWEOS. For the 43 points generated from the ancillary equation as input into the SWEOS fitting program, the deviations are all under 0.17%, and the AAD-% is 0.03%; additional statistics are in Table 11. The agreement between the SWEOS points from the Maxwell construction and the ancillary Eq. (5) is thus quite good as is agreement between the correlation of Goodwin et ai., which used much the same primary data in its development, and the present ancillary equation. The larger deviations from the more recent correlation of Younglove and Ely arise partly from the different choice of critical parameters in that study.
At temperatures very close to the critical point, the oscillations of the correlations shown in Fig. 5 (and Fig. 6)
J. Phys. Chem. Ref. Data, Vol. 20, No.2, 1991
illustrate how difficult it is to produce the shape of the coexistence dome. The ancillary equation, as indicated in Sec. 2, expresses the theoretically described behavior, with a critical exponent of 0.355. The SWEOS, while approximating this flattened coexistence dome quite well, approaches the critical point with the mean field exponent of 0.5, and thus cannot accurately describe this region. Of course, measurements too are difficult and inaccurate in the asymptotically critical region. The SWEOS is constrained to give the reported critical density at the critical temperature. We conclude that either the ancillary equation or the value of the density from the SWEOS can be used with an estimated uncertainty of 0.1 % from the triple point to 200 K, 0.3% from 200 K to 304 K, and deteriorating to about 1.5% to the critical point at 305.33 K.
Figure 6 shows the analogous deviation plot for the density of the saturated vapor. The primary data are from Refs. 4, 22, and 35; these 32 points have an AAD-% of 0.07% with a maximum deviation of 0.26% near the critical temperature. This excellent agreement is somewhat misleading; the accuracy of the data is not nearly this good. The primary data from Goodwin et al.4 were based on their virial equation of state and their vapor pressure equation, and thus, as indicated above, they are not direct measurements. These provide the sole source of primary data with temperatures from the triple point to about 250 K. Experimental data published in 1926 by Portern
and based on the intersection of measured isochores with an experimentally determined vapor pressure line, are also shown in the figure; there is a discrepancy of more than 1 % at the lowest measured temperature, near
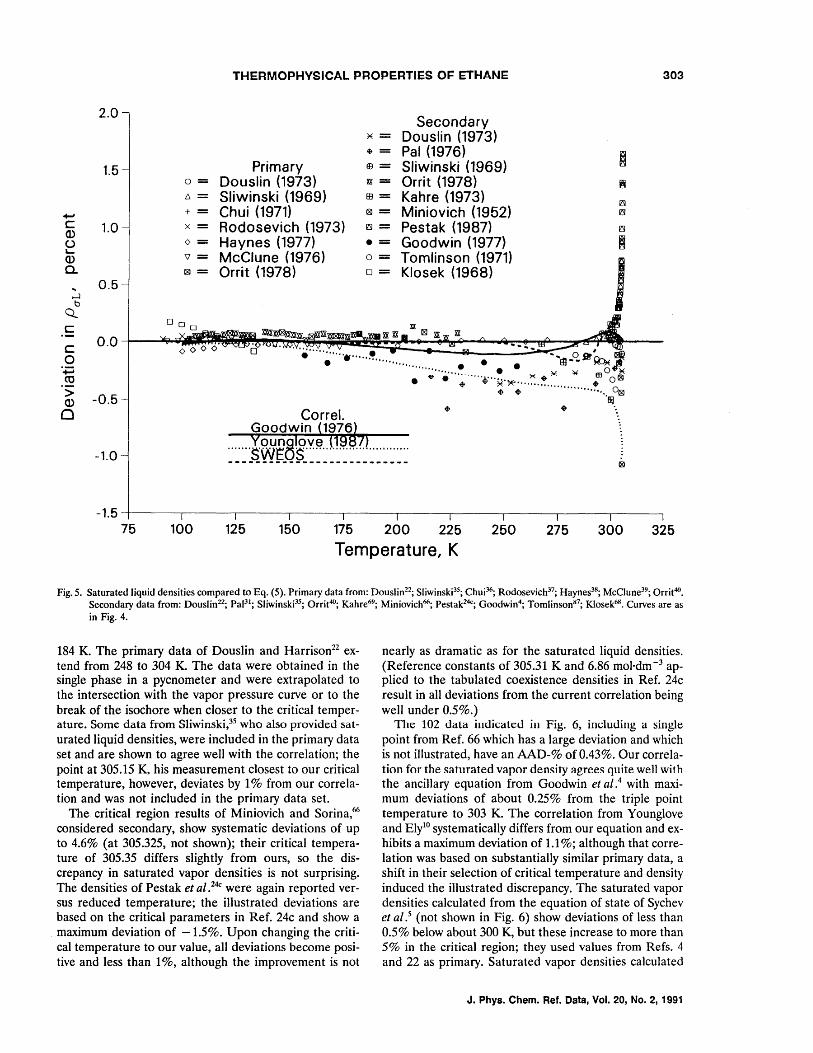
THERMOPHVSICAL PROPERTIES OF ETHANE 303
...., c a> u L-
a> a.
.....:l b
Q.
2.0
1.5
1.0
0.5
Primary 0= Douslin (1973) 6= Sliwinski (1969) + = Chui (1971) x= Rodosevich (1973) 0= Haynes (1977) v= McClune (1976) 181= Orrit (1978)
Secondary ?(= Douslin (1973) ~ = Pal (1976) EB= Sliwinski (1969) xx= Orrit (1978) 83= Kahre (1973) ®= Miniovich (1952) ~= Pestak (1987) • = Goodwin (1977) 0= Tomlinson (1971) 0= Klosek (1968)
c: =~xx Xl 181 xx xx o.o~--~~~<>~<>~<>~<>~.~~~;;,~~~~~~~~~~;:~~~~::-~_~_~~~~~~~-----c
o '+=i CO
o ........ ~ .......... ~ ................ ;; ....... ~ ... ~ ... ~ • :. :'EII-:Dr~~ . . ~ ~ ~.~ ...................... ~ .:;: Q)
o -0.5
-1.0
.. .. • ••••••• ~1lSl
.. '51 .•
®
-1.5~-----.-----.------,-----.-----~----~----~------~----.---~
75 100 125 150 175 200 225 250 275 300 325
Temperature, K
Fig.5. Saturated liquid densities compared to Eq. (5). Primary data from: Douslin22; Sliwinski35; Chui36; Rodosevich37; Haynes3H; McClune39; Orrit'~o.
Secondary data from: Douslin22; PaPl; Sliwinskp5; Orrit40; Kahre69
; Miniovich66; Pestak24c
; Goodwin4; Tomlinsons7; Kiosek6H. Curves are as in Fig. 4.
184 K. The primary data of Douslin and Harrison22 extend from 248 to 304 K. The data were obtained in the single phase in a pycnometer and were extrapolated to the intersection with the vapor pressure curve or to the break of the isochore when closer to the critical temperature. Some data from Sliwinski,3S who also provided saturated liquid densities, were included in the primary data set and are shown to agree well with the correlation; the point at 305.15 K. his measurement closest to our critical temperature, however, deviates by 1% from our correlation and was not included in the primary data set.
The critical region results of Miniovich and Sorina,66 considered secondary, show systematic deviations of up to 4.6% (at 305.325, not shown); their critical temperature of 305.35 differs slightly from ours, so the discrepancy in saturated vapor densities is not surprising. The densities of Pestak et al.24c were again reported versus reduced temperature; the illustrated deviations are based on the critical parameters in Ref. 24c and show a maximum deviation of -1.5%. Upon changing the critical temperature to our value, an deviations become positive and less than 1 %, although the improvement is not
nearly as dramatic as for the saturated liquid densities. (Reference constants of 305.31 K and 6.86 mol·dm -3 applied to the tabulated coexistence densities in Ref. 24c result in all deviations from the current correlation being well under 0.5%.)
The 102 data illdicateu in Fig. 6, including a single point from Ref. 66 which has a large deviation and which is not illustrated, have an AAD-% of 0.43%. Our correlation for the saturated vapor dem:ity agree!': qnite wen with the ancillary equation from Goodwin et al.4 with maximum deviations of about 0.25% from the triple point temperature to 303 K. The correlation from Younglove and ElylO systematically differs from our equation and exhibits a maximum deviation of 1.1 %; although that correlation was based on substantially similar primary data, a shift in their selection of critical temperature and density induced the illustrated discrepancy. The saturated vapor densities calculated from the equation of state of Sychev et al.s (not shown in Fig. 6) show deviations of less than 0.5% below about 300 K, but these increase to more than 5% in the critical region; they used values from Refs. 4 and 22 as primary. Saturated vapor densities calculated
J. Phys. Chem. Ref. Data, Vol. 20, No.2, 1991
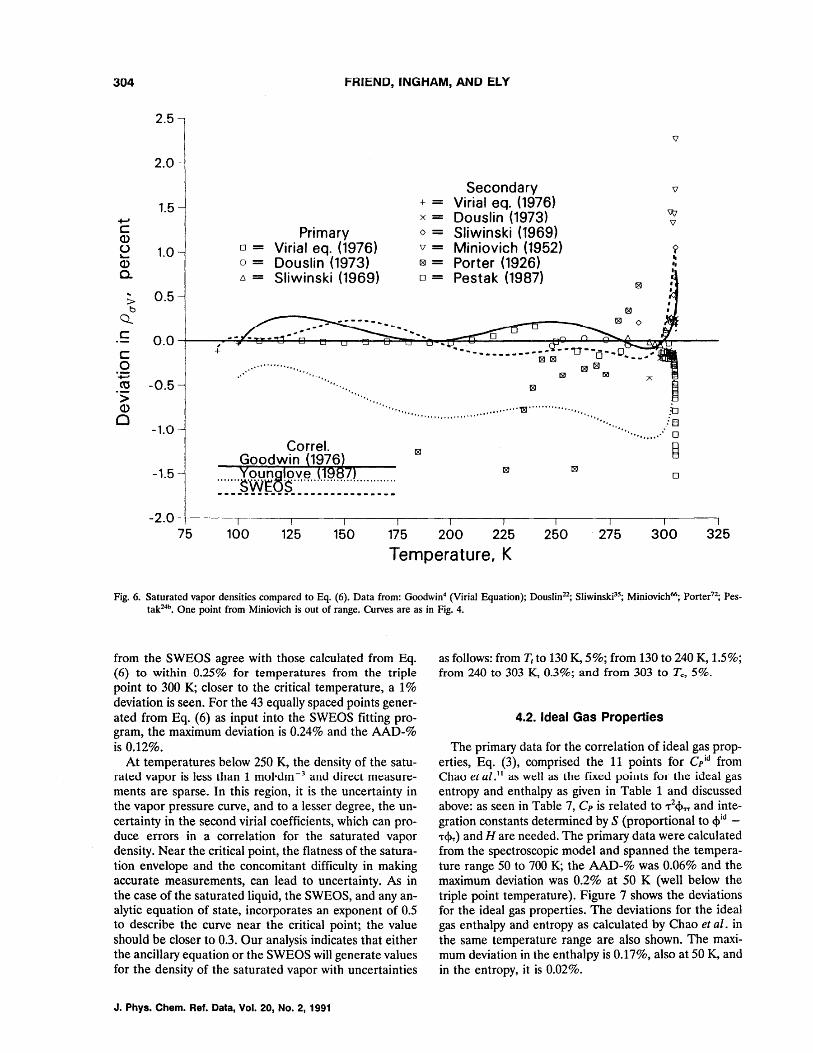
304 FRIEND, INGHAM, AND ELY
2,5
2.0
1.5 +-' c Q)
0= () 1.0 .... Q) 0=
0- 11=
> 0.5 b
Q.
+ = x=
Primary 0= Virial eq. (1976) \7=
Douslin (1973) 181= Sliwinski (1969) 0=
.------
Secondary Virial eq. (1976) Douslin (1973) Sliwinski (1969) Miniovich (1952) Porter (1926) Pestak (1987)
9 lit .. I
c 0.0 ..... -..... ..... ......
c: 0
'';:: <0 .s; -0.5
... , .. ', .... ...... _,.. f,. ",
'" '"
'" '" '"
'"'' Q)
Cl '" ··.f. lt ••••• , ••• , ••• ··,··
'" -1.0 '"
........... 0
§ -1.5 o
-2.0 75 100 125 150 175 200 225 250 275 300 325
Temperature, K
Fig. 6. Saturated vapor densities compared to Eq. (6), Data from: Goodwin4 (Virial Equation); Douslin22; SliwinskP5; Miniovich66
; Porter72; Pes
tak24b• One point from Miniovich is out of range. Curves are as in Fig. 4.
from the SWEOS agree with those calculated from Eq. (6) to within 0.25% for temperatures from the triple point to 300 K; closer to the critical temperature, a 1 % deviation is seen. For the 43 equally spaced points generated from Eq. (6) as input into the SWEOS fitting program, the maximum deviation is 0.24% and the AAD-% is 0.12%.
At temperatures below 250 K, the density of the saturated vapor is less than 1 mol'dm -3 and direct measurements are sparse. In this region, it is the uncertainty in the vapor pressure CUNe, and to a lesser degree, the uncertainty in the second virial coefficients, which can produce errors in a correlation for the saturated vapor density. Near the critical point, the flatness of the saturation envelope and the concomitant difficulty in making accurate measurements, can lead to uncertainty. As in the case of the saturated liquid, the SWEOS, and any analytic equation of state, incorporates an exponent of 0.5 to describe the CUNe near the critical point; the value should be closer to 0.3. Our analysis indicates that either the ancillary equation or the SWEOS will generate values for the density of the saturated vapor with uncertainties
J. Phys. Chern. Ref. Data, Vol. 20, No.2, 1991
as follows: from T, to 130 K, 5%; from 130 to 240 K, 1.5%; from 240 to 303 K, 0.3%; and from 303 to T", 5%.
4.2. Ideal Gas Properties
The primary data for the correlation of ideal gas properties, Eq. (3), comprised the 11 points for Cp
id from Chao er aZ. ll as well as the fixc;u points for the ideal gas entropy and enthalpy as given in Table 1 and discussed above: as seen in Table 7, Cp is related to -r2ct>TT and integration constants determined by S (proportional to q,id --r<PT) and H are needed. The primary data were calculated from the spectroscopic model and spanned the temperature range 50 to 700 K; the AAD-% was 0.06% and the maximum deviation was 0.2% at 50 K (well below the triple point temperature). Figure 7 shows the deviations for the ideal gas properties. The deviations for the ideal gas enthalpy and entropy as calculated by Chao et al. in the same temperature range are also shown. The maximum deviation in the enthalpy is 0.17%, also at 50 K, and in the entropy, it is 0.02%.
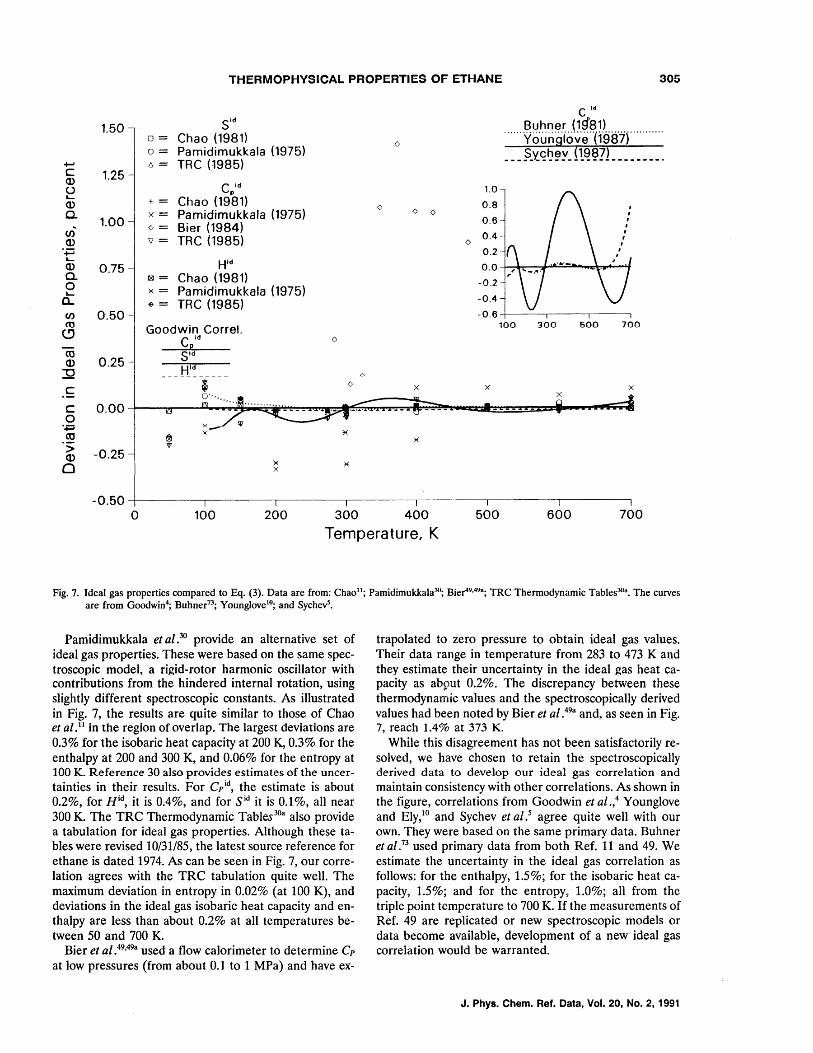
THERMOPHYSICAL PROPERTIES OF ETHANE 305
C Id
1.50
...... c 1.25 Q) u L-Q)
0. lOO (J) Q)
Sid
0= Chao (1981) 0
0= Pamidimukkala (1975) 6= TRC (1985)
C id P
+= Chao (1981) 0 x= Pamidimukkala (1975) 0= Bier (1984) '\J= TRC (1985)
Buhner (Hf81) ...... Y c;u ji'g i6 v'a"( 1'98'1)' ......... . ___ .?x~~~y_ n~~?l ________ ,
o 0
1.0
0.8
0.6
0.4 0
'+=i 0.2-L..
Q) 0.75 C. 0 L-
0..
Hid
181= Chao (1981) ~= Pamidimukkala (1975) ~= TRC (1985)
0.0
-0.2
-0.4
(J) 0.50 -0.6 (0
<!J Goodwin Correl. C id 0
Ii!
100 300 500 700
co 0.25 Q)
::g C
C 0.00
Sid
H'~ __ I 0
0·· ........ x x x
x
0 '.t:::I co '> -0.25 Q)
0
y
~ '" ~
'if ~
~ ~ x
-0.50 I I I I
0 100 200 300 400 500 600 700
Temperature, K
Fig. 7. Ideal gas properties compared to Eq. (3). Data are from: Chaoll ; Pamidimukkala30; Bier49.49a; TRC Thermodynamic TablesJ()a. The curves are from Goodwin4; Buhner73
; Younglove10; and SychevS.
Pamidimukkala et al,30 provide an alternative set of ideal gas properties. These were based on the same spectroscopic model, a rigid-rotor harmonic oscillator with contributions from the hindered internal rotation, using slightly different spectroscopic constants. As illustrated in Fig. 7, the results are quite similar to those of Chao et al. ll in the region of overlap. The largest deviations are 0.3% for the isobaric heat capacity at 200 K, 0.3% for the enthalpy at 200 and 300 K, and 0.06% for the entropy at 100 K. Reference 30 also provides estimates of the uncertainties in their results. For Cp
id, the estimate is about
0.2%, for Hid, it is 0.4%, and for Sid it is 0.1 %, all near 300 K. The TRC Thermodynamic Tables 30a also provide a tabulation for ideal gas properties. Although these tables were revised 10/31/85, the latest source reference for ethane is dated 1974. As can be seen in Fig. 7, our correlation agrees with the TRC tabulation quite well. The maximum deviation in entropy in 0.02% (at 100 K), and deviations in the ideal gas isobaric heat capacity and enthaJpy are less than about 0.2% at all temperatures between 50 and 700 K.
Bier et al.49,49a used a flow calorimeter to determine Cp
at low pressures (from about 0,1 to 1 MPa) and have ex-
trapolated to zero pressure to obtain ideal gas values, Their data range in temperature from 283 to 473 K and they estimate their uncertainty in the ideal gas heat capacity as ab~.mt 0.2%. The discrepancy between these thermodynamic values and the spectroscopically derived values had been noted by Bier et al.49a and, as seen in Fig. 7, reach 1.4% at 373 K.
While this disagreement has not been satisfactorily resolved, we have chosen to retain the spectroscopically derived data to develop our ideal gas correlation and maintain consistency with other correlations. As shown in the figure, correlations from Goodwin et al.,4 Younglove and Ely,1O and Sychev et al.s agree quite well with our own. They were based on the same primary data, Buhner et al.73 used primary data from both Ref. 11 and 49. We estimate the uncertainty in the ideal gas correlation as follows: for the enthalpy, 1.5%; for the isobaric heat capacity, 1.5%; and for the entropy, 1.0%; all from the triple point temperature to 700 K. If the measurements of Ref. 49 are replicated or new spectroscopic models or data become available, development of a new ideal gas correlation would be warranted.
J. Phys. Chern. Ref. Data, Vol. 20, No.2, 1991
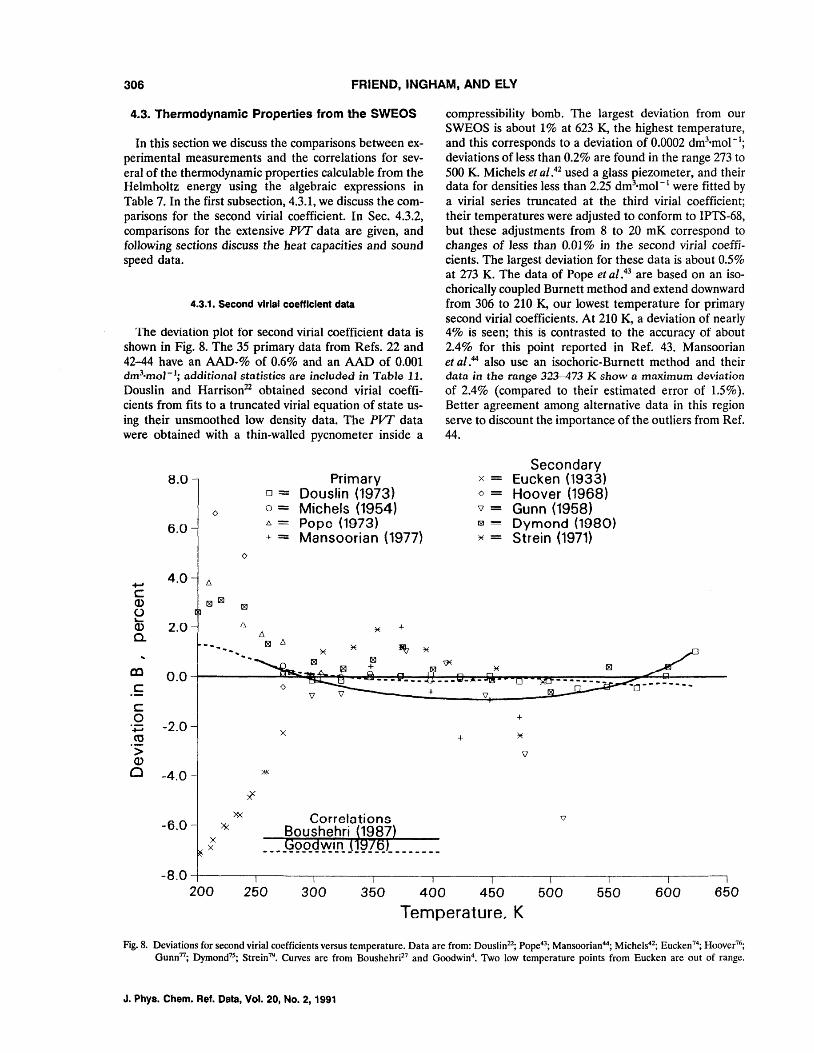
306 FRIEND, INGHAM, AND ELY
4.3. Thermodynamic Properties from the SWEOS
In this section we discuss the comparisons between experimental measurements and the correlations for several of the thermodynamic properties calculable from the Helmholtz energy using the algebraic expressions in Table 7. In the first subsection, 4.3.1, we discuss the comparisons for the second virial coefficient. In Sec. 4.3.2, comparisons for the extensive PIT data are given, and following sections discuss the heat capacities and sound speed data.
4.3.1. Second vlrla. coefficient data
The deviation plot for second virial coefficient data is shown in Fig. 8. The 35 primary data from Refs. 22 and 42-44 have an AAD·% of 0.6% and an AAD of 0.001 dm3·mol-1; additional statistics are included in Table 11. Douslin and Harrison22 obtained second virial coefficients from fits to a truncated virial equation of state using their unsmoothed low density data. The PVF data were obtained with a thin-walled pycnometer inside a
....., C (]) U "-(])
a.
8.0
6.0
4.0
2.0
0
0
t:,.
181181 181
6.
Primary 0= Douslin (1973) 0= Michels (1954) A = Pope (1973) + = Mansoorian (1977)
~ + t:,.
t:,. ~ .... 181 ~ ~ ...... ~
aJ C
C
0.0
o '';:; -2.0 co .s: (])
Cl -4.0
-6.0 x x
..... I5il
+
x
_. _ .G9.RC1Y\!Ul J. @IJit. ___ ...
compressibility bomb. The largest deviation from our SWEOS is about 1 % at 623 K, the highest temperature, and this corresponds to a deviation of 0.0002 dm3'mol- 1
;
deviations of less than 0.2% are found in the range 273 to 500 K. Michels et al.42 used a glass piezometer, and their data for densities less than 2.25 dm3'mol- 1 were fitted by a virial series truncated at the third virial coefficient; their temperatures were adjusted to conform to IPTS-68, but these adjustments from 8 to 20 mK correspond to changes of Jess than 0.01 % jn the second viria] coefficients. The largest deviation for these data is about 0.5% at 273 K. The data of Pope et al.43 are based on an isochorically coupled Burnett method and extend downward from 306 to 210 K, our lowest temperature for primary second viria} coefficients. At 210 K, a deviation of nearly 4% is seen; this is contrasted to the accuracy of about 2.4% for this point reported in Ref. 43. Mansoorian et al.44 also use an isochoric-Burnett method and their data in the range 323-473 K show a maximum deviation of 2.4% (compared to their estimated error of 1.5%). Better agreement among alternative data in this region serve to discount the importance of the outliers from Ref. 44.
~
+
Secondary x = Eucken (1933) o = Hoover (1968) \l = Gunn (1958) Gl ~ Dymond (1980) ~ = Strein (1971)
~
\)
+
-8.0~----~~----~------~----~------~----~------~------~----~
200 250 300 350 400 450 500
Temperature, K 550 600 650
Fig. 8. Deviations for second virial coefficients versus temperature. Data are from: Douslin22; Pope43; Mansoorian44; Michels42; Eucken 74; Hoover76;
Gunn77; Dymond7S; Strein79• Curves are from Boushehrj27 and Goodwin4• Two low temperature points from Eucken are out of range.
J. Phya. Chem. Ref. Data, Vol. 20, No.2, 1991
THERMOPHVSICAL PROPERTIES OF ETHANE 307
Among the secondary data, we have illustrated the 1933 results of Eucken and Parts,14 which, though often discredited,15 represent the most extensive set of low temperature measurements and include the point at the lowest reported temperature, 192 K with a deviation of 8%. The data from Hoover et al.76 extend down to 215 K and are seen to lie considerably above our correlation and the primary data of Pope et al.43 Data from Gunn,77 reported by Huff and Reed,'8 and from Strein et al.79 again indicate a spread in the measured values. Final1y, we have illustrated the values selected by Dymond and Smith 75 from their analysis of these and other experimental data as recorded in Ref. 75. The deviation of 2.6% for their lowest temperature can be compared to their estimate of 2.4% of the uncertainty in that point. References 75 and 5 pruviu(; auuitiollal citatiolls to experimental studies of the virial coefficients of ethane.
There are many ca1culations of the virial coefficients hased on either experimental measurements or direct calculation from a model intermolecular potential whose parameters may be based on experiment. We have illustrated the correlation of Goodwin et al.4 who used much of the same data as primary for an ancillary correlation of the second virial coefficient. At low temperatures, however, Goodwin et al. based their correlation on data attributed to McGlashan and Potter45 after an adjustment for better agreement at higher temperatures. Reference 45, in turn, had constructed an equation for the second virial coefficients of the alkanes based on two- parameter corresponding states and measurements above room temperature on the higher alkanes; the critical density used for ethane in the correlation differs by 2% from the value which we have selected. Thus, we do not consider the dif-
ference of more than 6% between our correlation and the actual data from Ref. 45 at 150 K (not shown) either surprising or disturbing. Further, at 150 K the vapor pressure is about 0.01 MPa and the density of the saturated vapor is only about 0.008 mol·dm -3: the ideal gas equation alone will give this density within about 0.4%. The correlation of Boushehri et al.,27 also shown in Fig. 8, is based on a corresponding states model including corrections and contributions from the nonsphericity of the ethane molecule; the minimum temperature considered in Ref. 27 is 250 K.
For the 87 data indicated in Fig. 8, the AAD-% is 1.85%. Additional quantification of the comparison is given in Table 11. Our assessment of the data and correlation leads to an estimate of the uncertainty in second vi.rial coefficients calculated from the SWEOS as follows. At temperatures from 150 to 200 K, there is an uncertainty of 10%; from 200 to 250 K, this decreases to 3%; from 250-500 K. 1 %; and from 500 to 600 K. the maximum temperature considered, the estimated uncertainty is 2%. The SWEOS correlation cannot be used to estimate values of the second virial coefficient at temperatures below 15U K.
4.3.2. PVT Data
For the PIT data, there are two types of evaluations which can be informative. One can calculate the pressure from the SWEOS directly from the experimental temperature and density, or one can use a root-finding technique to calculate the density using the experimental temperature and pressure. To implement the second type of comparison, we used a standard Newton-Raphson algorithm.
TABLE 12. Sources of PVI' data
Density Temperature Pressure range Pressure
First author Ref. No. pts. range, K range, MPa mol·dm- 3 AAD_%8
Beattie 82 96 298-523 1.1-20 0.5-5 0.43 Besserer 82a 68 311-394 0.7-10 0.2-12 0.67 DouslinC 22 257 273-623 1.4-40 1.-11 0.07 Douslin 22 449 243-623 0.1-41 1.-16 1.10 Golovskiy 83 111 90-270 1.2-60 16-22 8.88 Khazanova 85 86 299-318 0.5-7 0.2-11 2.23 Law 84 56 240-350 1.1-34 2-17 2.03 Michelsc 42 81 273-423 1.6-10 0.8-3.6 0.03 Michels 42 101 273-423 1.6-22 0.8-8.2 0.03 Miniovich 86 63 303-307 4.6-4.9 4.5-9.3 0.03 Palc 31 45 183-320 36-69 15-19 0.96 Pal 31 309 157-344 0.3-69 1-19 8.38 ParrishC 46 9 300-322 5.5-9.7 4-12 0.32 Reamer 86a 176 311-511 1.4-55 0.3-16 1.13 Sengersc,d 23 30 304-325 4.7-8.1 4.9-9 0.03 Stratt 34 381 96-320 3-38 1.9-22 1.07 Straty 34 477 93-320 0.2-38 1.2-22 2.73 Tomlinson 87 61 280-325 4.4-14 4-14 0.48 Wallace 88 20 248-348 0.1-0.2 0.03-0.09 0.06
8Average absolute percent deviation when pressure is calculated from experimental temperature and density. bAvcrage absolute percent deviation when density is calculated from experimental temperature and pressure. COnly primary data are included in these statistics. dThese data were obtained from a scaled equation of state; they are not experimental data.
Density AAD_%b
0.49 0.83 0.06 0.24 0.10 3.02 0.49 0.04 0.05 1.41 0.09 0.78 0.23 0.50 0.30 0.04 0.10 0.51 0.06
J. Phys. Chem. Ref. Data, Vol. 20, No.2, 1991
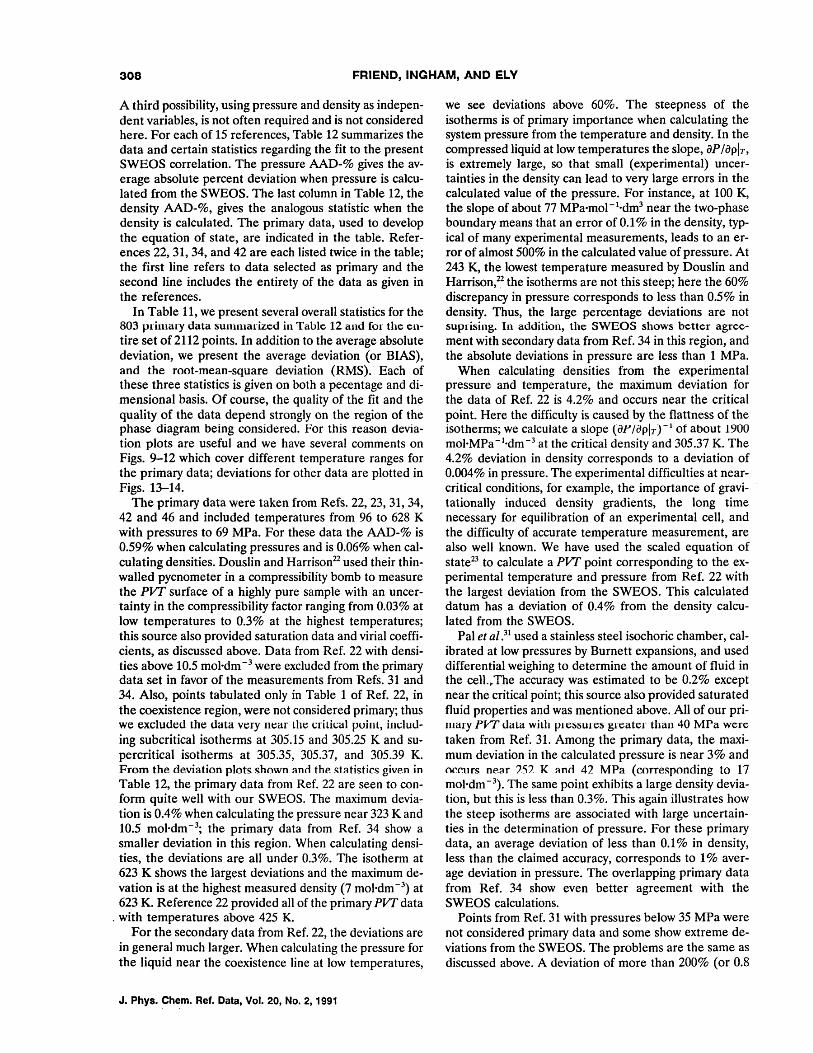
308 FRIEND, INGHAM, AND ELV
A third possibility, using pressure and density as independent variables, is not often required and is not considered here. For each of 15 references, Table 12 summarizes the data and certain statistics regarding the fit to the present SWEOS correlation. The pressure AAD-% gives the average absolute percent deviation when pressure is calculated from the SWEOS. The last column in Table 12, the density AAD-%, gives the analogous statistic when the density is calculated. The primary data, used to develop the equation of state, are indicated in the table. References 22, 31, 34, and 42 are each listed twice in the table; the first line refers to data selected as primary and the second line includes the entirety of the data as given in the references.
In Table 11, we present several overall statistics for the 803 primary data summarized in Table 12 and for the entire set of 2112 points. In addition to the average absolute deviation, we present the average deviation (or BIAS), and the root-mean-square deviation (RMS). Each of these three statistics is given on both a pecentage and dimensional basis. Of course, the quality of the fit and the quality of the data depend strongly on the region of the phase diagram being considered. For this reason deviation plots are useful and we have several comments on Figs. 9-12 which cover different temperature ranges for the primary data; deviations for other data are plotted in Figs. 13-14.
The primary data were taken from Refs. 22, 23, 31, 34, 42 and 46 and included temperatures from 96 to 628 K with pressures to 69 MPa. For these data the AAD-% is 0.59% when calculating pressures and is 0.06% when calculating densities. Douslin and Harrison22 used their thinwalled pycnometer in a compressibility bomb to measure the PIT surface of a highly pure sample with an uncertainty in the compressibility factor ranging from 0.03% at low temperatures to 0.3% at the highest temperatures; this source also provided saturation data and virial coefficients, as discussed above. Data from Ref. 22 with densities above 10.5 mol·dm -3 were excluded from the primary data set in favor of the measurements from Refs. 31 and 34. Also, points tabulated only in Table 1 of Ref. 22, in the coexistence region, were not considered primary; thus we excluded the data very near the criLk:al puint, induuing subcritical isotherms at 305.15 and 305.25 K and supercritical isotherms at 305.35, 305.37, and 305.39 K. From the deviation plots shown and the statistics given in Table 12, the primary data from Ref. 22 are seen to conform quite well with our SWEOS. The maximum deviation is 0.4% when calculating the pressure near 323 K and 10.5 mol·dm- 3
; the primary data from Ref. 34 show a smaller deviation in this region. When calculating densities, the deviations are all under 0.3%. The isotherm at 623 K shows the largest deviations and the maximum devation is at the highest measured density (7 mol-dm -3) at 623 K. Reference 22 provided all of the primary PIT data
. with temperatures above 425 K. For the secondary data from Ref. 22, the deviations are
in general much larger. When calculating the pressure for the liquid near the coexistence line at low temperatures,
J. Phys. Chem. Ref. Data, Vol. 20, No.2, 1991
we see deviations above 60%. The steepness of the isotherms is of primary importance when calculating the system pressure from the temperature and density. In the compressed liquid at low temperatures the slope, ap/apIT, is extremely large, so that small (experimental) uncertainties in the density can lead to very large errors in the calculated value of the pressure. For instance, at 100 K, the slope of about 77 MPa·mol- l ·dm3 near the two-phase boundary means that an error of 0.1 % in the density, typical of many experimental measurements, leads to an error of almost 500% in the calculated value of pressure. At 243 K, the lowest temperature measured by Douslin and Harrison,22 the isotherms are not this steep; here the 60% discrepancy in pressure corresponds to less than 0.5% in density. Thus, the large percentage deviations are not suprising. In addition, the SWEOS shows better agreement with secondary data from Ref. 34 in this region, and the absolute deviations in pressure are less than 1 MPa.
When calculating densities from the experimental pressure and temperature, the maximum deviation for the data of Ref. 22 is 4.2% and occurs near the critical point. Here the difficulty is caused by the flattness of the isotherms; we calculate a slope (aPlaplT}-l of about 1900 mol·MPa- 1·dm-3 at the critical density and 305.37 K. The 4.2% deviation in density corresponds to a deviation of 0.004% in pressure. The experimental difficulties at nearcritical conditions, for example, the importance of gravitationally induced density gradients, the long time necessary for equilibration of an experimental cell, and the difficulty of accurate temperature measurement, are also well known. We have used the scaled equation of state23 to calculate a PIT point corresponding to the experimental temperature and pressure from Ref. 22 with the largest deviation from the SWEOS. This calculated datum has a deviation of 0.4% from the density calculated from the SWEOS.
Pal et al.3l used a stainless steel isochoric chamber, calibrated at low pressures by Burnett expansions, and used differential weighing to determine the amount of fluid in the cell."The accuracy was estimated to be 0.2% except near the critical point; this source also provided saturated fluid properties and was mentioned above. All of our pri-1Ili:11-y PVT uata with pH;ssures greater than 40 MPa were taken from Ref. 31. Among the primary data, the maximum deviation in the calculated pressure is near 3% and occurs near 252 K and 42 MPa (corre5\ponrling to 17 mol·dm- 3
). The same point exhibits a large density deviation, but this is less than 0.3%. This again illustrates how the steep isotherms are associated with large uncertainties in the determination of pressure. For these primary data, an average deviation of less than 0.1% in density, less than the claimed accuracy, corresponds to 1 % average deviation in pressure. The overlapping primary data from Ref. 34 show even better agreement with the SWEOS calculations .
Points from Ref. 31 with pressures below 35 MPa were not considered primary data and some show extreme deviations from the SWEOS. The problems are the same as discussed above. A deviation of more than 200% (or 0.8
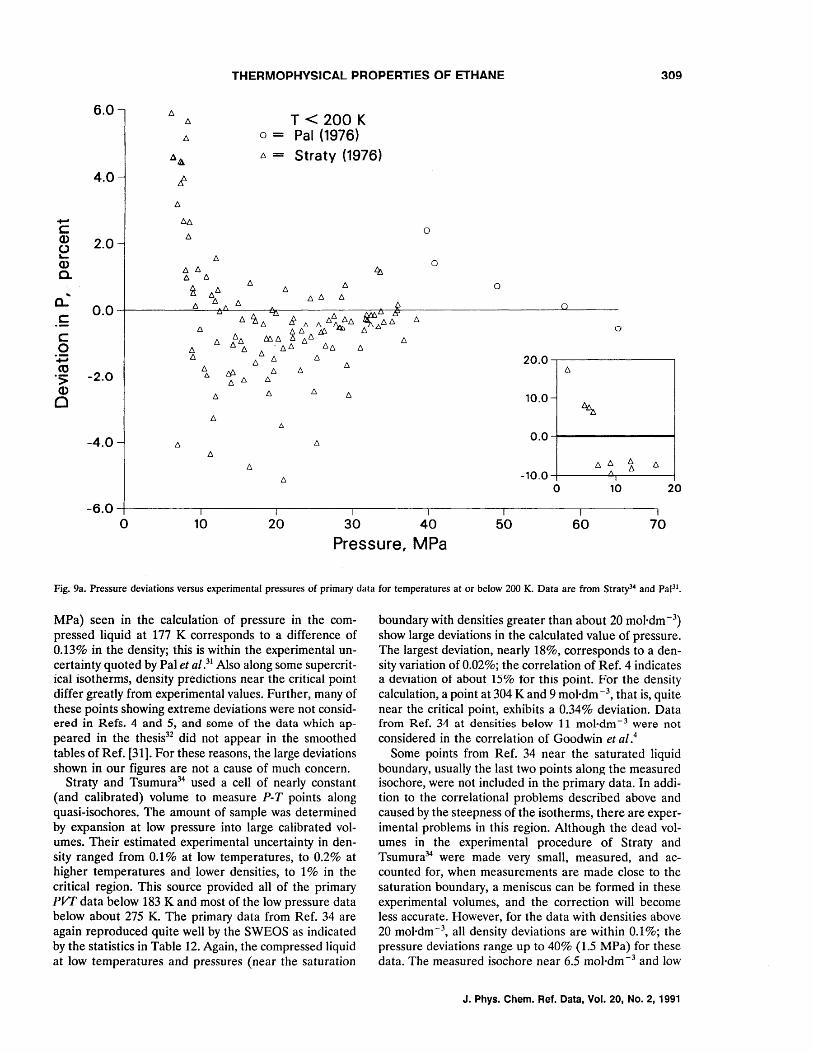
THERMOPHVSICAL PROPERTIES OF ETHANE 309
~
C Q) (J ~
Q)
a.
a.:-c c 0
'';:; co
'S: Q)
Cl
6.0- A A
A
~.a
4.0- l'
A
AA
2.0-A
A
0.0
-2.0
A
A
-4.0- A A
A
T < 200 K o = Pal (1976) A = Straty (1976)
A A A
!:>
A
A
o
o
0
0
0
20.0 A
10.0-~
0.0
A A A A -10.0 /\
A I
0 10
I I I I I I I -6.0~--------~------~--------~--------~------~--------~------~
o 10 20 30 40 50 60 70
20
Pressure, MPa
Fig. 9a. Pressure deviations versus experimental pressures of primary data for temperatures at or below 200 K. Data are from Straty34 and PaP!.
MPa) seen in the calculation of pressure in the compressed liquid at 177 K corresponds to a difference of 0.13% in the density; this is within the experimental uncertainty quoted by Pal et al.31 Also along some supercritical isotherms, density predictions near the critical point differ greatly from experimental values. Further, many of these points showing extreme deviations were not considered in Refs. 4 and 5, and some of the data which appeared in the thesis32 did not appear in the smoothed tables of Ref. [31]. For these reasons, the large deviations shown in our figures are not a cause of much concern.
Straty and Tsumura34 used a cell of nearly constant (and calibrated) volume to measure P-T points along quasi-isochores. The amount of sample was determined by expansion at low pressure into large calibrated volumes. Their estimated experimental uncertainty in density ranged from 0.1 % at low temperatures, to 0.2% at higher temperatures and lower densities, to 1 % in the critical region. This source provided all of the primary PVT data below 183 K and most of the low pressure data below about 275 K. The primary data from Ref. 34 are again reproduced quite well by the SWEOS as indicated by the statistics in Table 12. Again, the compressed liquid at low temperatures and pressures (near the saturation
boundary with densities greater than about 20 mol.dm -3) show large deviations in the calculated value of pressure. The largest deviation, nearly 18%, corresponds to a density variation of 0.02%; the correlation of Ref. 4 indicates a deviation ot about 15% tor this point. For the density calculation, a point at 304 K and 9 mol'dm-3
, that is, quite near the critical point, exhibits a 0.34% deviation. Data from Ref. 3-1 at densities below 11 mol-dm -3 were not considered in the correlation of Goodwin et al.4
Some points from Ref_ 34 near the saturated liquid boundary, usually the last two points along the measured isochore, were not included in the primary data. In addition to the correlational problems described above and caused by the steepness of the isotherms, there are experimental problems in this region. Although the dead volumes in the experimental procedure of Straty and Tsumura34 were made very small, measured, and accounted for, when measurements are made close to the saturation boundary, a meniscus can be formed in these experimental volumes, and the correction will become less accurate. However, for the data with densities above 20 mol'dm-3, all density deviations are within 0.1 %; the pressure deviations range up to 40% (1.5 MPa) for these data. The measured isochore near 6.5 mol·dm -3 and low
J. Phys. Chern. Ref. Data, Vol. 20, No.2, 1991
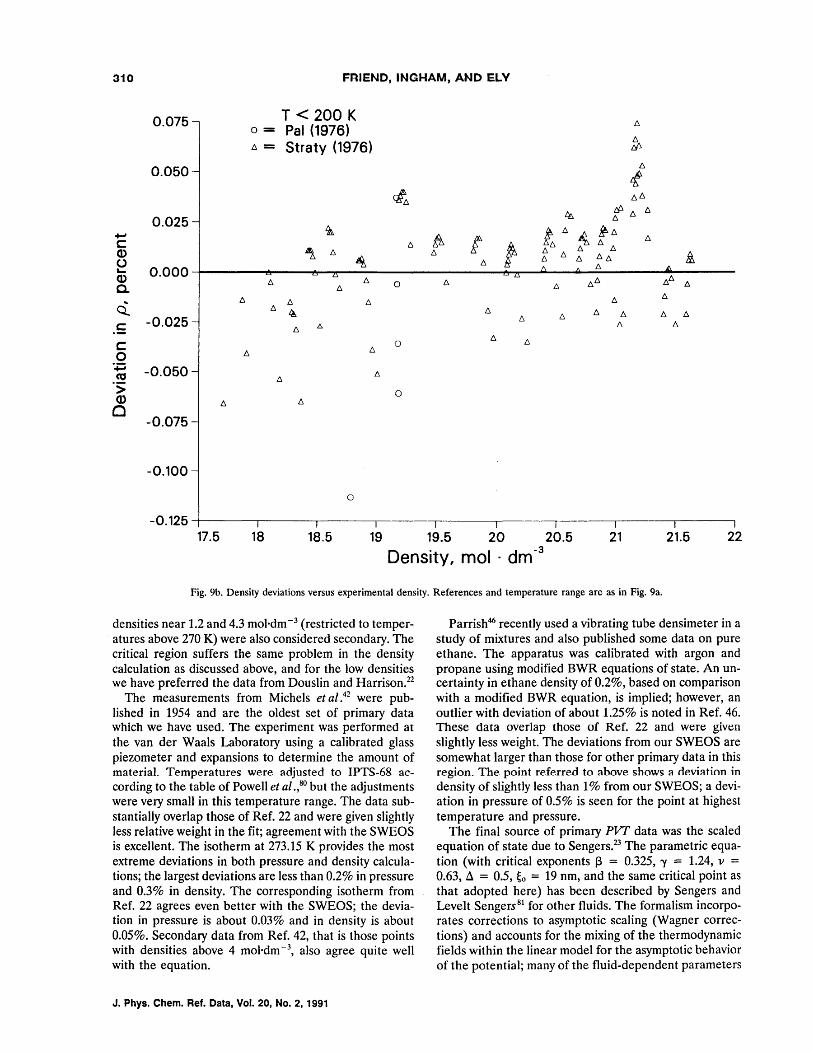
310 FRIEND, INGHAM, AND ELV
0.075 T < 200 K l:::,. 0= Pal (1976)
l:::,. = Straty (1976) ~
0.050 l:::,.
tf ~ l:::,.l:::,.
~ tP l:::,. l:::,.
0.025 l:::,.
+oJ ~ ft. t 6
~ ~l:::,.
l:::,. c: l:::,. t f l:::,. l:::,.
Q) ~ l:::,. l:::,. g l:::,. £ () ~ l:::,. l:::,. l:::,.l:::,.
L- 0.000 l:::,.
Q) l:::,. l:::,. 0 l:::,. l:::,.l:::,. l:::,.l:::,. l:::,.
Co 6 l:::,.
l:::,. l:::,. l:::,.
Q. l:::,. l:::,. l:::,.
~ l:::,. l:::,.
-0.025 6 6 l:::,. l:::,. l:::,.
.5 6 /\ /\ l:::,.
0 l:::,. l:::,. c:
0 l:::,. l:::,.
'';:; -0.050 l:::,. co l:::,.
'S; 0
Q) l:::,.
Cl -0.075
-0.100
0
-0.125 17.5 18 18.5 19 19.5 20 20.5 21 21.5 22
Density, mol . dm -3
Fig. 9b. Density deviations versus experimental density. References and temperature range are as in Fig. 9a.
densities near 1.2 and 4.3 mol'dm- 3 (restricted to temperatures above 270 K) were also considered secondary. The critical region suffers the same problem in the density calculation as discussed above, and for the low densities we have preferred the data from Douslin and Harrison.22
The measurements from Michels et ai.42 were published in 1954 and are the oldest set of primary data which we have used. The experiment was performed at the van der Waals Laboratory using a calibrated glass piezometer and expansions to determine the amount of material. Temperatures were adjusted to IPTS-68 according to the table of Powell et ai.,80 but the adjustments were very small in this temperature range. The data substantially overlap those of Ref. 22 and were given slightly less relative weight in the fit; agreement with the SWEOS is excellent. The isotherm at 273.15 K provides the most extreme deviations in both pressure and density calculations; the largest deviations are less than 0.2% in pressure and 0.3% in density. The corresponding isotherm from Ref. 22 agrees even better with the SWEOS; the deviation in pressure is about 0.03% and in density is about 0.05%. Secondary data from Ref. 42, that is those points with densities above 4 mol·dm -3, also agree quite well with the equation.
J. Phys. Chem. Ref. Data, Vol. 20, No.2, 1991
Parrish46 recently used a vibrating tube densimeter in a study of mixtures and also published some data on pure ethane. The apparatus was calibrated with argon and propane using modified BWR equations of state. An uncertainty in ethane density of 0.2%, based on comparison with a modified BWR equation, is implied; however, an outlier with deviation of about 1.25% is noted in Ref. 46. These data overlap those of Ref. 22 and were given slightly less weight. The deviations from our SWEOS are somewhat larger than those for other primary data in this region. The point referred to above shows a deviation in density of slightly less than 1 % from our SWEOS; a deviation in pressure of 0.5% is seen for the point at highest temperature and pressure.
The final source of primary PVT data was the scaled equation of state due to Sengers.23 The parametric equation (with critical exponents J3 = 0.325, 'Y = 1.24, v = 0.63, ~ = 0.5, ~o = 19 nm, and the same critical point as that adopted here) has been described by Sengers and Levelt Sengers81 for other fluids. The formalism incorporates corrections to asymptotic scaling (Wagner corrections) and accounts for the mixing of the thermodynamic fields within the linear model for the asymptotic behavior of the potential; many of the fluid-dependent parameters
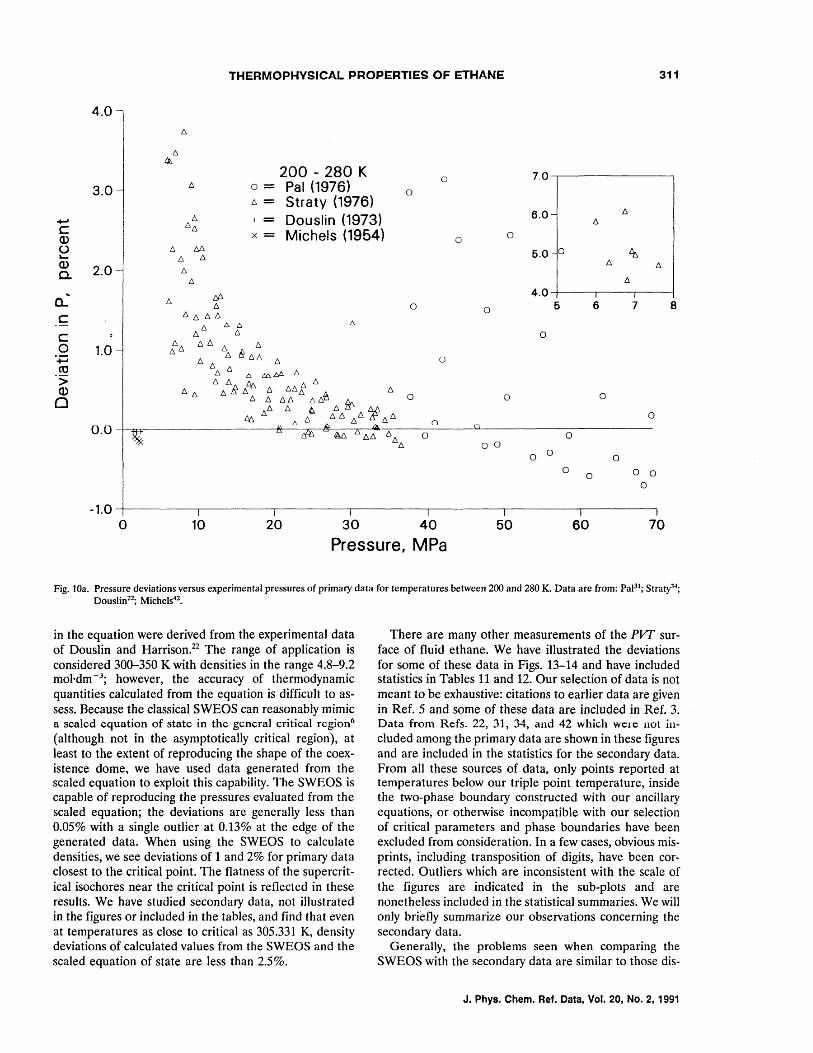
THERMOPHVSICAL PROPERTIES OF ETHANE 311
4.0 6.
6. q,
200 - 280 K 7.0 0
3.0 6. 0= Pal (1976) 0 6.= Straty (1976)
Douslin (1973) 6.0 6. 6. + = 6. ~
6.6. c (J.) x= Michels (1954) 0 0
() 6. !:;,.6. 5.0 0 'h L- 6. 6. (J.) 6. 6. 0- 2.0 6.
6. 6.
a: w 4.0 6. 6. 0 5 6 7 8 0
C 6.6.6.6. [:;, to. 6
C 6. 6. 0
0 1.0 ft-, t-, t-, t-, t-,
.~ 6. t-,
D. Ii t-, t-, t-, 0 co f'I. 6.
6 6:>~ t... .> t-, 6- t:n 6.6. 6. 6-(J.) f'I.f'I. it D. 6- 6-
0 6. 6- D. D. 6- 6. 6- 6-ft,
6- ~ t:# 0 0 0
6.6. 6- t<. 6.D.6-6- t-,D. 0 !::t::. 1\ 6- n
0.0 M 6-6. 6. 0 0 6.6. o 0
o 0 0 0
0 o 0
0
-1.0 0 10 20 30 40 50 60 70
Pressure, MPa
Fig. lOa. Pressure deviations versus experimental pressures of primary data for temperatures between 200 and 280 K. Data are from: PaPl; Straty34;
Douslin22; Michels42
•
in the equation were derived from the experimental data of Douslin and Harrison.22 The range of application is considered 300-350 K with densities in the range 4.8-9.2 mol·dm-3
; however, the accuracy of thermodynamic quantities calculated from the equation is difficult to assess. Because the classical SWEOS can reasonably mimic a scaled equation of state in the general critical region6
(although not in the asymptotically critical region), at least to the extent of reproducing the shape of the coexistence dome. we have used data generated from the scaled equation to exploit this capability. The SWEOS is capable of reproducing the pressures evaluated from the scaled equation; the deviations are generally less than 0.05% with a single outlier at 0.13% at the edge of the generated data. When using the SWEOS to calculate densities, we see deviations of 1 and 2% for primary data closest to the critical point. The flatness of the supercritical isochores near the critical point is reflected in these results. We have studied secondary data, not illustrated in the figures or included in the tables, and find that even at temperatures as close to critical as 305.331 K, density deviations of calculated values from the SWEOS and the scaled equation of state are less than 2.5%.
There are many other measurements of the PVT surface of fluid ethane. We have illustrated the deviations for some of these data in Figs. 13-14 and have included statistics in Tables 11 and 12. Our selection of data is not meant to be exhaustive: citations to earlier data are given in Ref. 5 and some of these data are included in Ref. 3. Data from Refs. 22, 31, 34, and 42 which were Hot iH
cluded among the primary data are shown in these figures and are included in the statistics for the secondary data. From all these sources of data, only points reported at temperatures below our triple point temperature, inside the two-phase boundary constructed with our ancillary equations, or otherwise incompatible with our selection of critical parameters and phase boundaries have been excluded from consideration. In a few cases, obvious misprints, including transposition of digits, have been corrected. Outliers which are inconsistent with the scale of the figures are indicated in the sub-plots and are nonetheless included in the statistical summaries. We wil1 only briefly summarize our observations concerning the secondary data.
Generally, the problems seen when comparing the SWEOS with the secondary data are similar to those dis-
J. Phys. Chem. Ref. Data, Vol. 20, No.2, 1991
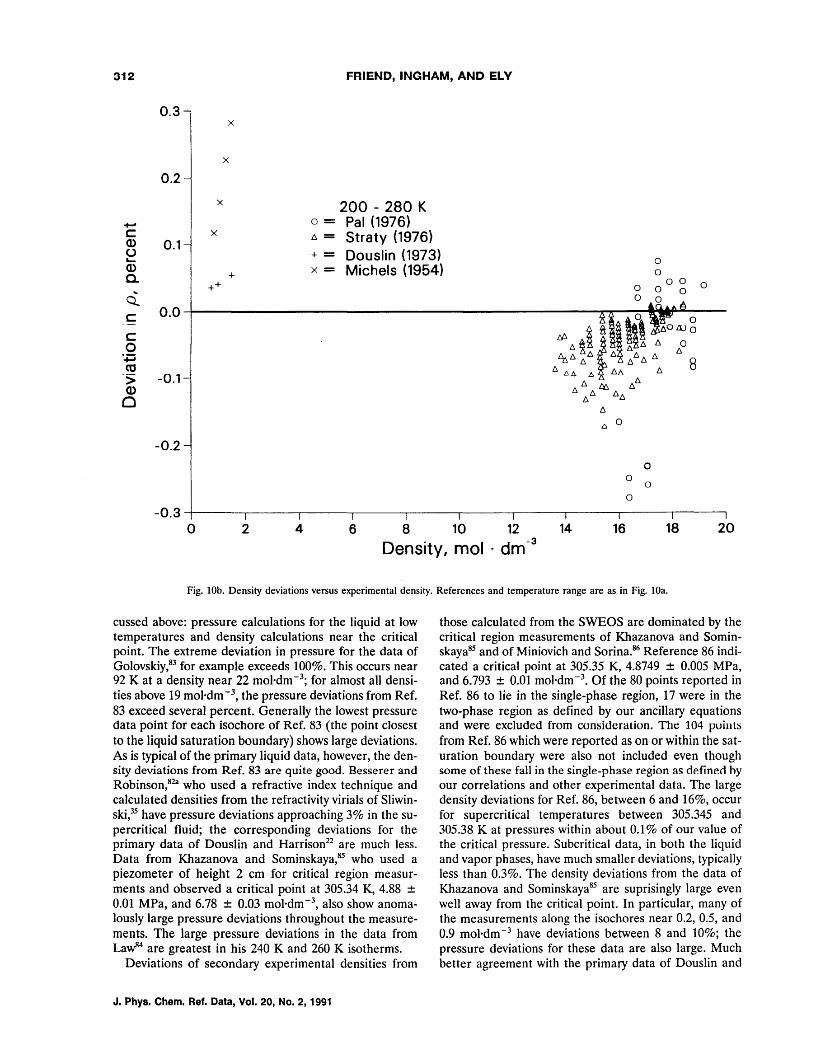
312 FRIEND, INGHAM, AND ELY
+J c:
0.3
0.2
x
x
x
x
200 - 280 K 0= Pal (1976) n= Straty (1976) Q)
(.) L-
0.1 + = Douslin (1973) 0
+ x= Michels (1954) Q) C. .. Q c c o
'';::; co
-S; Q)
o
++ 0 0 0
0.0
-0.1
D.
D. 0
-0.2 0
0 0 0
-0.3~----~----~----~----~------~----~----~----~----1I----~
o 2 4 6 8 10 12 14 16 18 20
Density, mol . dm -3
Fig. lOb. Density deviations versus experimental density. References and temperature range are as in Fig. lOa.
cussed above: pressure calculations for the liquid at low temperatures and density calculations near the critical point. The extreme deviation in pressure for the data of Golovskiy,83 for example exceeds 100%. This occurs near 92 K at a density near 22 mol-dm -3; for almost all densities above 19 mol'dm-3, the pressure deviations from Ref. 83 exceed several percent. Generally the lowest pressure data point for each isochore of Ref. 83 (the point closest to the liquid saturation boundary) shows large deviations. As is typical of the primary liquid data, however, the density deviations from Ref. 83 are quite good. Besserer and Robinson,82a who used a refractive index technique and calculated densities from the refractivity virials of Sliwinski,35 have pressure deviations approaching 3% in the supercritical fluid; the corresponding deviations for the primary data of Douslin and Harrison22 are much less. Data from Khazanova and Sominskaya,85 who used a piezometer of height 2 cm for critical region measurments and observed a critical point at 305.34 K, 4.88 ± 0.01 MPa, and 6.78 ± 0.03 mol'dm-3, also show anomalously large pressure deviations throughout the measurements. The large pressure deviations in the data from LawB4 are greatest in his 240 K and 260 K isotherms.
Deviations of secondary experimental densities from
J. Phys. Chem. Ref. Data, Vol. 20, No.2, 1991
those calculated from the SWEOS are dominated by the critical region measurements of Khazanova and Sominskaya85 and of Miniovich and Sorina.86 Reference 86 indicated a critical point at 305.35 K, 4.8749 ± 0.005 MPa, and 6.793 ± 0.01 mol·dm-3. Of the 80 points reported in Ref. 86 to lie in the single-phase region, 17 were in the two-phase region as defined by our ancillary equations and were excluded from consideration. The 104 POillt:s from Ref. 86 which were reported as on or within the saturation boundary were also not included even though some of these fall in the single-phase region as defineci hy our correlations and other experimental data. The large density deviations for Ref. 86, between 6 and 16%, occur for supercritical temperatures between 305.345 and 305.38 K at pressures within about 0.1 % of our value of the critical pressure. Subcritical data, in both the liquid and vapor phases, have much smaller deviations, typically less than 0.3%. The density deviations from the data of Khazanova and Sominskaya85 are suprisingly large even well away from the critical point. In particular, many of the measurements along the isochores near 0.2, 0.5, and 0.9 mol'dm-3 have deviations between 8 and 10%; the pressure deviations for these data are also large. Much better agreement with the primary data of Douslin and
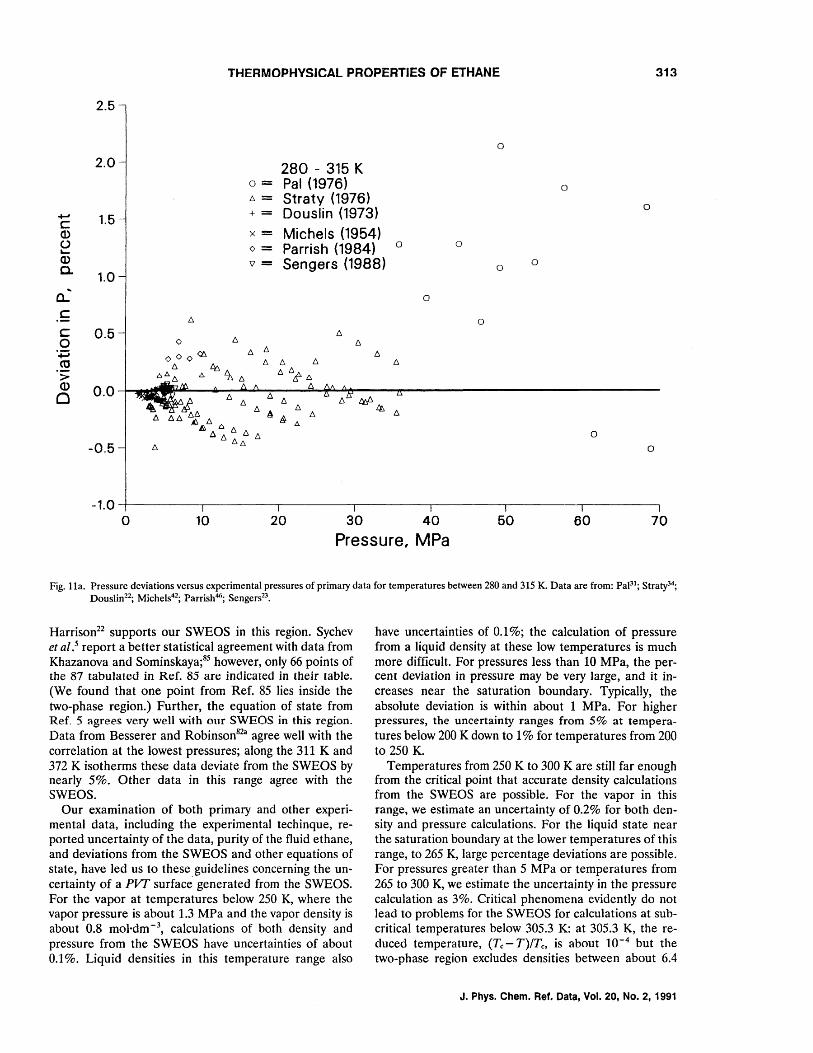
THERMOPHVSICAl PROPERTIES OF ETHANE 313
2.5
0
2.0 280 - 315 K 0= Pal (1976) 0 1:;.= Straty (1976)
0 +oJ 1.5 + = Douslin (1973) c Q) x= Michels (1954) u 0= Parrish (1984) 0 0 L-
ID \7= Sengers (1988) 0 a. 0
1.0 a.. 0
c I:;. 0
c 0.5 I:;.
0 0 I:;. 6 ',f:i 0 0 0 ~
I:;. /::, /::,
co t::. tr:, 6 t::. /::, I:;.
.:;: 6.6.1:;. ~ %1:;. /::, /::,if- D.
ID 0.0 /::,
0 t::. /::, 6 6 6 .ttP~ /::, A ~
6 I:;. t::.
1;.
0
-0.5 6 0
-1.0 --t------,--------r-----y------r------r------,--------,
o 10 20 30 40 50 60 70
Pressure, MPa
Fig.lla. Pressure deviations versus experimental pressures of primary data for temperatures between 280 and 315 K. Data are from: PaPl; Straty34; Douslin22; Michels42; Parrish46; Sengers23.
Harrison22 supports our SWEOS in this region. Sychev et al.s report a better statistical agreement with data from Khazanova and Sominskaya;85 however, only 66 points of the 87 tabulated in Ref. 85 are indicated in their table. (We found that one point from Ref. 85 lies inside the two-phase region.) Further, the equation of state from Ref. 5 agrees very well with our SWEOS in this region. Data from Besserer and Robinson82a agree well with the correlation at the lowest pressures; along the 311 K and 372 K isotherms these data deviate from the SWEOS by nearly 5%. Other data in this range agree with the SWEOS.
Our examination of both primary and other experimental data, including the experimental techinque, reported uncertainty of the data, purity of the fluid ethane, and deviations from the SWEOS and other equations of state, have led us to these. guidelines concerning the uncertainty of a PVT surface generated from the SWEOS. For the vapor at temperatures below 250 K, where the vapor pressure is about 1.3 MPa and the vapor density is about 0.8 mol'dm- 3
, calculations of both density and pressure from the SWEOS have uncertainties of about 0.1 %. Liquid densities in this temperature range also
have uncertainties of 0.1 %; the calculation of pressure from a liquid density at these low temperatures is much more difficult. For pressures less than 10 MPa, the percent deviation in pressure may be very large, and it increaseS near the saturation boundary. Typically, the absolute deviation is within about 1 MPa. For higher pressures, the uncertainty ranges from 5% at temperatures below 200 K down to 1 % for temperatures from 200 to 250 K.
Temperatures from 250 K to 300 K are still far enough from the critical point that accurate density calculations from the SWEOS are possible. For the vapor in this range, we estimate an uncertainty of 0.2% for both density and pressure calculations. For the liquid state near the saturation boundary at the lower temperatures of this range, to 265 K, large percentage deviations are possible. For pressures greater than 5 MPa or temperatures from 265 to 300 K, we estimate the uncertainty in the pressure calculation as 3%. Critical phenomena evidently do not lead to problems for the SWEOS for calculations at subcritical temperatures below 305.3 K: at 305.3 K, the reduced temperature, (Tc - T)/Tc, is about 10-4 but the two-phase region excludes densities between about 6.4
J. Phys. Chem. Ref. Data, Vol. 20, No.2, 1991
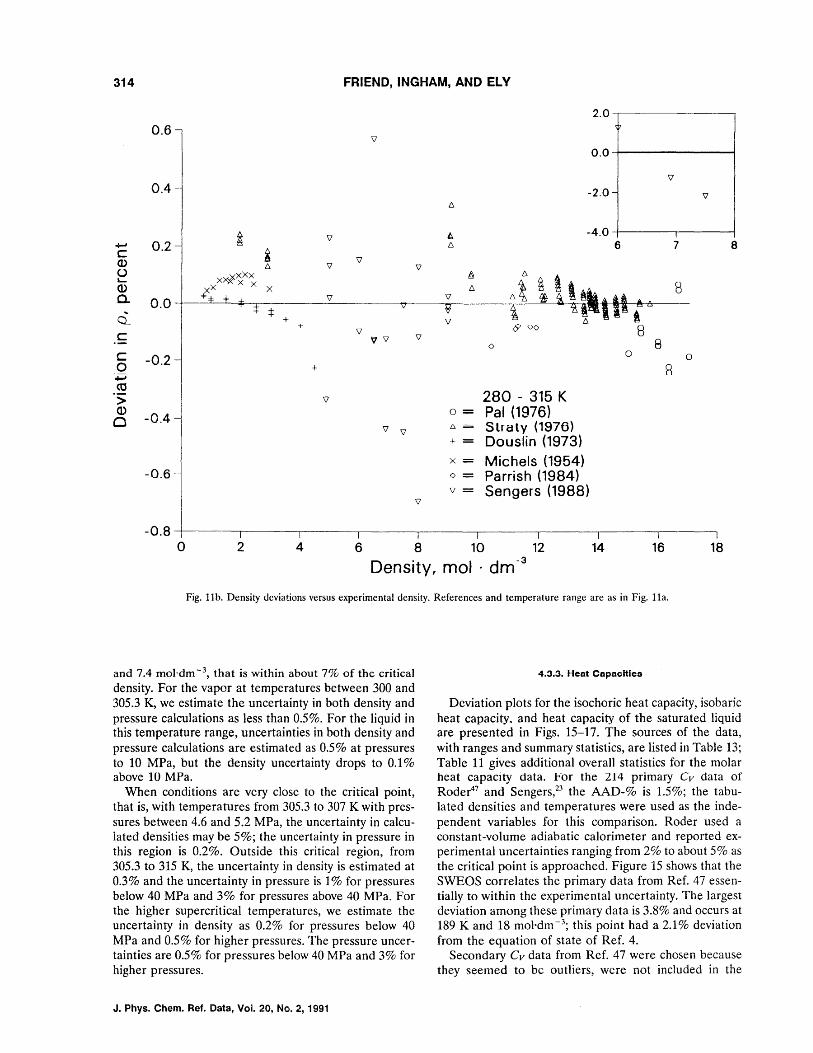
and 7.4 mol-dm -3, that is within about 7% of the critical density. For the vapor at temperatures between 300 and 305.3 K, we estimate the uncertainty in both density and pressure calculations as less than 0.5%. For the liquid in this temperature range, uncertainties in both density and pressure calculations are estimated as 0.5% at pressures to 10 MPa, but the density uncertainty drops to 0.1% above 10 MPa.
When conditions are very close to the critical point, that is, with temperatures from 305.3 to 307 K with pressures between 4.6 and 5.2 MPa, the uncertainty in calculated densities may be 5%; the uncertainty in pressure in this region is 0.2%. Outside this critical region, from 305.3 to 315 K, the uncertainty in density is estimated at 0.3% and the uncertainty in pressure is 1 % for pressures below 40 MPa and 3% for pressures above 40 MPa. For the higher supercritical temperatures, we estimate the uncertainty in density as 0.2% for pressures below 40 MPa and 0.5% for higher pressures. The pressure uncertainties are 0.5% for pressures below 40 MPa and 3% for higher pressures.
J. Phys. Chern. Ref. Data, Vol. 20, No.2, 1991
4.3.3. Heat Capac;ltlea
Deviation plots for the isochoric heat capacity, isobaric heat capacity. and heat capacity of the saturated liquid are presented in Figs. 15-17. The sources of the data, with ranges and summary statistics, are listed in Table 13; Table 11 gives additional overall statistics for the molar heat capacity data. For the 214 primary Cv data of Roder47 and Sengers,23 the AAD-% is 1.5%; the tabulated densities and temperatures were used as the independent variables for this comparison. Roder used a constant -volume adiabatic calorimeter and reported experimental uncertainties ranging from 2% to about 5% as the critical point is approached. Figure 15 shows that the SWEOS correlates the primary data from Ref. 47 essentially to within the experimental uncertainty. The largest deviation among these primary data is 3.8% and occurs at 189 K and 18 mol·dm -3; this point had a 2.1 % deviation from the equation of state of Ref. 4.
Secondary Cv data from Ref. 47 were chosen because they seemed to be outliers, were not included in the
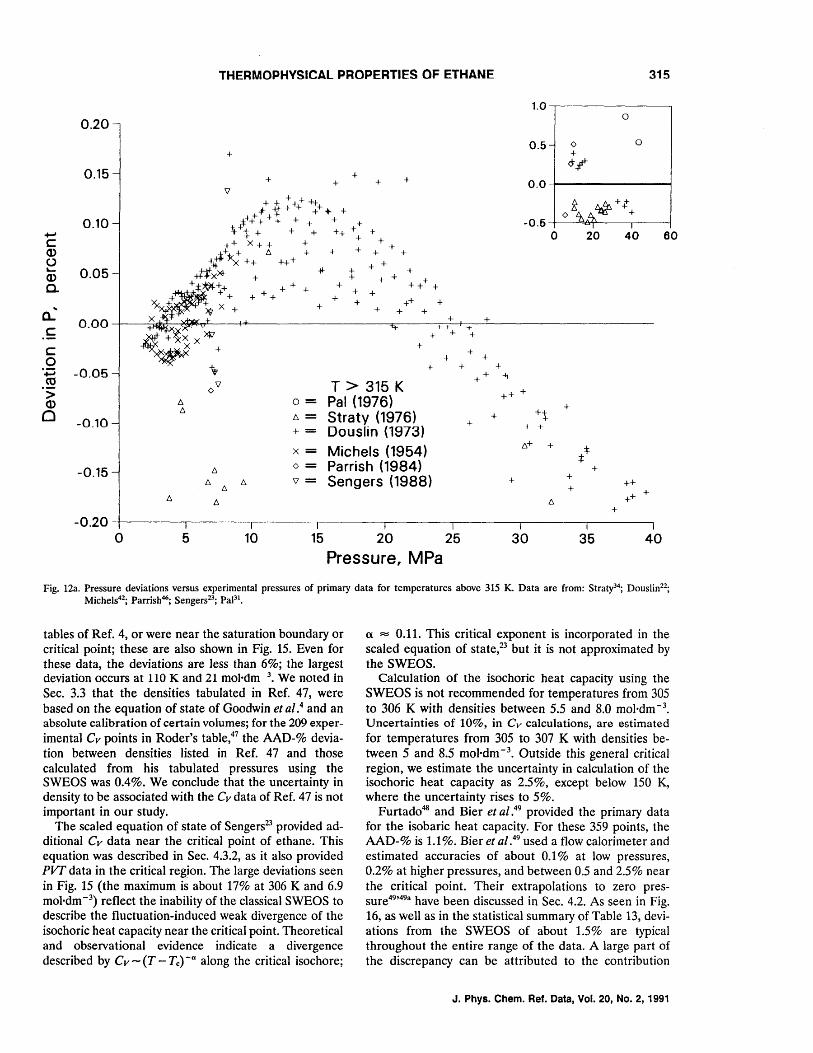
THERMOPHVSICAL PROPERTIES OF ETHANE 315
1.0
0.20 0
0.5 0 0
+ +
0.15 &/
+ + + + + 0.0 9
~ ~+:t
0.10 + -0.6 o ~ +
+-' ++ ++ + 0 20 40 60 C + + Q) + + + + + () +++ + + L. 0.05 *" + + Q) + + + + +++ + a. + + + +
+ + + + + + + ++ + 0.:- + + + +
0.00 + + C + + -t-
+ + +
C + + + 0 + + + + ',p -0.05 + 4t ,52 09 T > 315 K
+
> ++ + 0= Pal (1976) Q) 6 + 6 0 -0.10 6= Straty (1976) + +t
+ I + + = Douslin (1973)
Michels (1954) 6+ +
:j::* x=
-0.15 6 0= Parrish (1984) + Sengers (1988) + 6 6 9= + ++ 6 +
++ + 6 6
+ -0.20
0 5 10 15 20 25 30 35 40
Pressure, MPa
Fig. 12a. Pressure deviations versus experimental pressures of primary data for temperatures above 315 K. Data are from: Straty34; Douslin22;
Michels42; Parrish46; Sengers23; Pal3l
•
tables of Ref. 4, or were near the saturation boundary or critical point; these are also shown in Fig. 15. Even for these data, the deviations are less than 6%; the largest deviation occurs at 110 K and 21 mol-dm 3. We noted in Sec. 3.3 that the densities tabulated in Ref. 47, were based on the equation of state of Goodwin et al.4 and an absolute calibration of certain volumes; for the 209 experimental Cv points in Roder's table,47 the AAD-% deviation between densities listed in Ref. 47 and those calculated from his tabulated pressures using the SWEOS was 0.4%. We conclude that the uncertainty in density to be associated with the Cv data of Ref. 47 is not important in our study.
The scaled equation of state of Sengers23 provided additional Cv data near the critical point of ethane. This equation was described in Sec. 4.3.2, as it also provided PVF data in the critical region. The large deviations seen in Fig. 15 (the maximum is about 17% at 306 K and 6.9 mol-dm -3) reflect the inability of the classical SWEOS to describe the fluctuation-induced weak divergence of the isochoric heat capacity near the critical point. Theoretical and observational evidence indicate a divergence described by Cv - (T - Tc) -a along the critical isochore;
a = 0.11. This critical exponent is incorporated in the scaled equation of state,23 but it is not approximated by the SWEOS.
Calculation of the isochoric heat capacity using the SWEOS is not recommended for temperatures from 305 to 306 K with densities between 5.5 and 8.0 mol.dm -3.
Uncertainties of 10%, in Cv calculations, are estimated for temperatures from 305 to 307 K with densities between 5 and 8.5 mol-dm -3. Outside this general critical region, we estimate the uncertainty in calculation of the isochoric heat capacity as 2.5%, except below 150 K, where the uncertainty rises to 5%.
Furtado48 and Bier et al.49 provided the primary data for the isobaric heat capacity. For these 359 points, the AAD-% is 1.1 %. Bier et al.49 used a flow calorimeter and estimated accuracies of about 0.1% at low pressures, 0.2% at higher pressures, and between 0.5 and 2.5% near the critical point. Their extrapolations to zero pressure49
'49a have been discussed in Sec. 4.2. As seen in Fig. 16, as well as in the statistical summary of Table 13, deviations from the SWEOS of about 1.5% are typical throughout the entire range of the data. A large part of the discrepancy can be attributed to the contribution
J. Phys. Chern. Ref. Data, Vol. 20, No.2, 1991
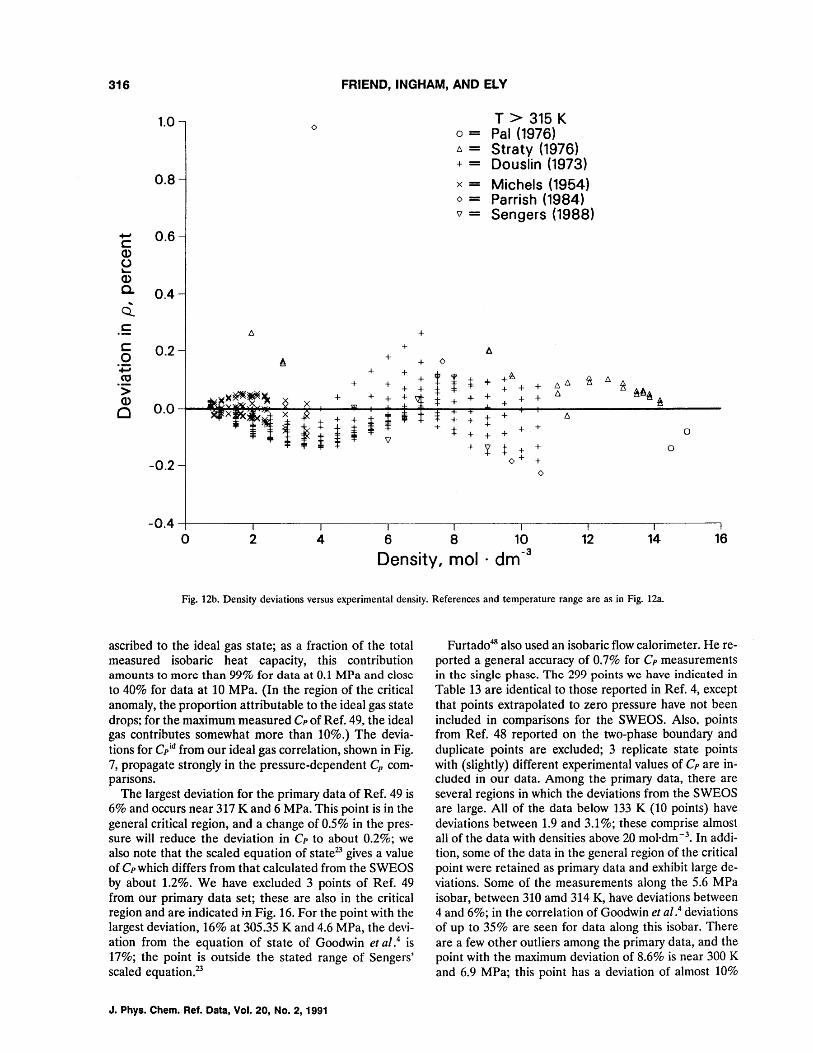
316 FRIEND, INGHAM, AND ELY
1.0 T > 315 K 0 Pal (1976) 0= l::,= Straty (1976) += Douslin (1973)
0.8 x= Michels (1954) 0= Parrish (1984) \7= Sengers (1988)
+-oJ 0.6 c a> (J L-
a> Co 0.4 Q.
.E l::, + c 0.2 + l:J. 0 A + + 0
'+=i + + +~ co + + t + l::,l::, f! l::, ~ ~A~ 'S: + + + + + l::,
a> + + + + + + + 0.0 + ~
Q + + + + l::,
+ ::f: + + + + + + 0
+ ~ :1= + + 0
-0.2 0+ + 0
-0.4~------~------~------~------~------~----~------~------~
o 2 4 6 8 10 12 14 16
Density, mol ' dm-3
Fig. 12b. Density deviations versus experimental density. References and temperature range are as in Fig. 12a.
ascribed to the ideal gas state; as a fraction of the total measured isobaric heat capacity, this contribution amounts to more than 99% for data at 0,1 MPa and close to 40% for data at 10 MPa. (In the region of the critical anomaly, the proportion attributable to the ideal gas state drops; for the maximum measured Cp of Ref. 49, the ideal gas contributes somewhat more than 10%.) The deviations for Cpid from our ideal gas correlation, shown in Fig. 7, propagate strongly in the pressure-dependent Cp comparisons.
The largest deviation for the primary data of Ref. 49 is 6% and occurs near 317 K and 6 MPa. This point is in the general critical region, and a change of 0.5% in the pressure will reduce the deviation in Cp to about 0.2%; we also note that the scaled equation of state23 gives a value of Cp which differs from that calculated from the SWEOS by about 1.2%. We have excluded 3 points of Ref. 49 from our primary data set; these are also in the critical region and are indicated jn Fig. 16. For the point with the largest deviation, 16% at 305.35 K and 4.6 MPa, the deviation from the equation of state of Goodwin et al.4 is 17%; the point is outside the stated range of Sengers' scaled equation.23
J. Phys. Chern. Ref. Data, Vol. 20, No.2, 1991
Furtado48 also used an isobaric flow calorimeter. He reported a general accuracy of 0.7% for Cp measurements in the single phase. The 299 points we have indicated in Table 13 are identical to those reported in Ref. 4, except that points extrapolated to zero pressure have not been included in comparisons for the SWEOS. Also. points from Ref. 48 reported on the two-phase boundary and duplicate points are excluded; 3 replicate state points with (slightly) different experimental values of Cp are included in our data. Among the primary data, there are several regions in which the deviations from the SWEOS are large. All of the data below 133 K (10 points) have deviations between 1.9 and 3.1 %; these comprise almost all of the data with densities above 20 mol·dm -3. In addition, some of the data in the general region of the critical point were retained as primary data and exhibit large deviations. Some of the measurements along the 5.6 MPa isobar, between 310 amd 314 K, have deviations between 4 and 6%; in the correlation of Goodwin et al.4 deviations of up to 35% are seen for data along this isobar. There are a few other outliers among the primary data, and the point with the maximum deviation of 8.6% is near 300 K and 6.9 MPa; this point has a deviation of almost 10%
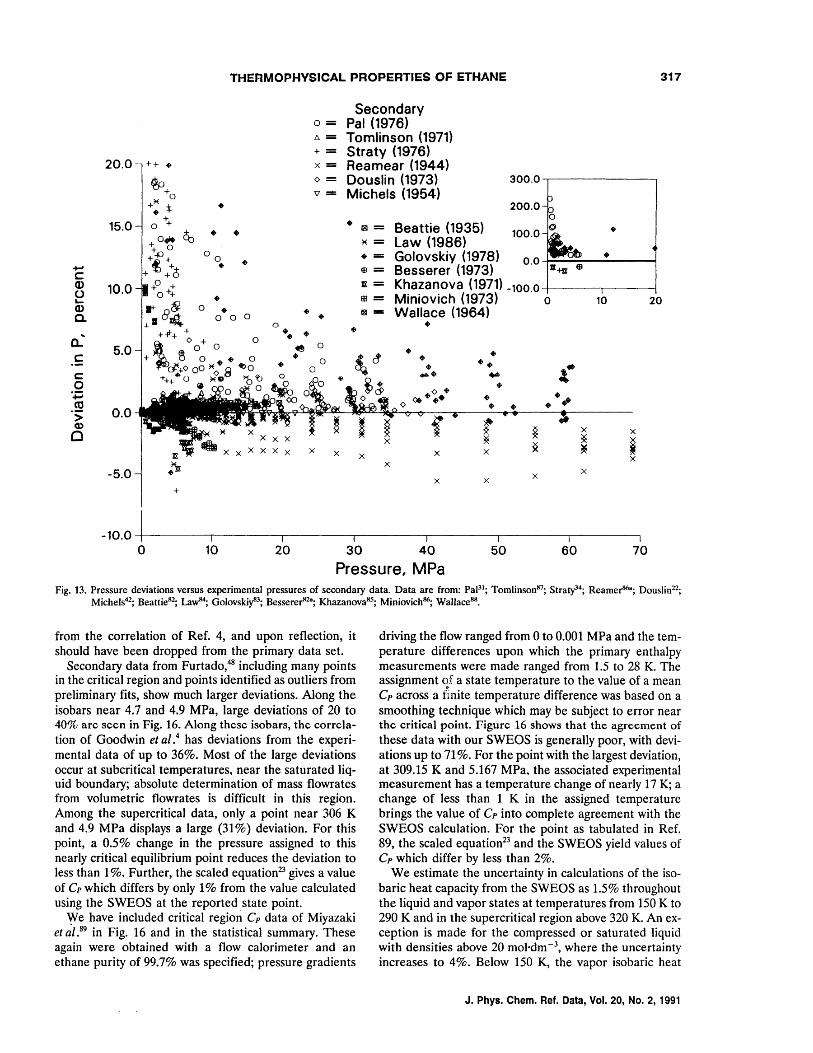
THERMOPHVSICAL PROPERTIES OF ETHANE 317
Secondary 0= Pal (1976) b.= Tomlinson (1971) + = Straty (1976)
20.0 ++. x= Reamear (1944) 0= Douslin (1973) 300.0 '\1= Michels (1954)
...... c Q) o L-
a> a.
0.. ..
. 5 c:: o
'+=i co .s: Q)
o
15.0
10.0
0
+ •
5.0 •
0.0
-5.0 +
• 18 -~ -• -e -IX -IE -
• • 18 -• +
~ 0 • 0
0
x
200.0
Beattie (1935) 100.0 • Law (1986) Golovskiy (1978) 0.0 • Besserer (1973) Khazanova (1971) -100.0 Miniovich (1973) 0 10 20 Wallace (1964)
• • • • + • + :,.* ..... +r>
o + + o ~ + •• + •
f r *
x x ~ * i x x ~ ~
x
x x x x
-10.0~1~~-----'1--------~1--------~--------~1--------~1--------~1 --------~I o 10 20 30 40 50 60 70
Pressure, MPa Fig. 13. Pressure deviations versus experimental pressures of secondary data. Data are from: PaPl; Tomlinsonll7
; Strao/4; ReamerK6H ; Douslin22;
Michels42; Beattiell2
; LawK"; Golovskiyll3; Bessererll2s; Khazanovall5
; Miniovichll6; Wallacellll
•
from the correlation of Ref. 4, and upon reflection, it should have been dropped from the primary data set.
Secondary data from Furtado,48 including many points in the critical region and points identified as outliers from preliminary fits, show much larger deviations. Along the isobars near 4.7 and 4.9 MPa, large deviations of 20 to 40% arc seen in Fig. 16. Along these isobars, the correlation of Goodwin et al.4 has deviations from the experimental data of up to 36%. Most of the large deviations occur at subcritical temperatures, near the saturated liquid boundary; absolute determination of mass flowrates from volumetric flowrates is difficult in this region. Among the supercritical data, only a point near 306 K and 4.9 MPa displays a large (31%) deviation. For this point, a 0.5% change in the pressure assigned to this nearly critical equilibrium point reduces the deviation to less than 1 %. Further, the scaled equation23 gives a value of Cp which differs by only 1 % from the value calculated using the SWEOS at the reported state point.
VIe have included critical region Cp data of Miyazaki et al.89 in Fig. 16 and in the statistical summary. These again were obtained with a flow calorimeter and an ethane purity of 99.7% was specified; pressure gradients
driving the flow ranged from 0 to 0.001 MPa and the temperature differences upon which the primary enthalpy measurements were made ranged from 1.5 to 28 K. The assignment of a state temperature to the value of a mean Cp across a f~nite temperature difference was based on a smoothing technique which may be subject to error near the critical point. Figure 16 shows that the agreement of these data with our SWEOS is generally poor, with deviations up to 71 %. For the point with the largest deviation, at 309.15 K and 5.167 MPa. the associated experimental measurement has a temperature change of nearly 17 K; a change of less than 1 K in the assigned temperature brings the value of Cp into complete agreement with the SWEOS calculation. For the point as tabulated in Ref. 89, the scaled equation23 and the SWEOS yield values of Cp which differ by less than 2%.
We estimate the uncertainty in calculations of the isobaric heat capacity from the SWEOS as 1.5% throughout the liquid and vapor states at temperatures from 150 K to 290 K and in the supercritical region above 320 K. An exception is made for the compressed or saturated liquid with densities above 20 mo}·dm- 3, where the uncertainty increases to 4%. Below 150 K, the vapor isobaric heat
J. Phys. Chern. Ref. Data, Vol. 20, No.2, 1991
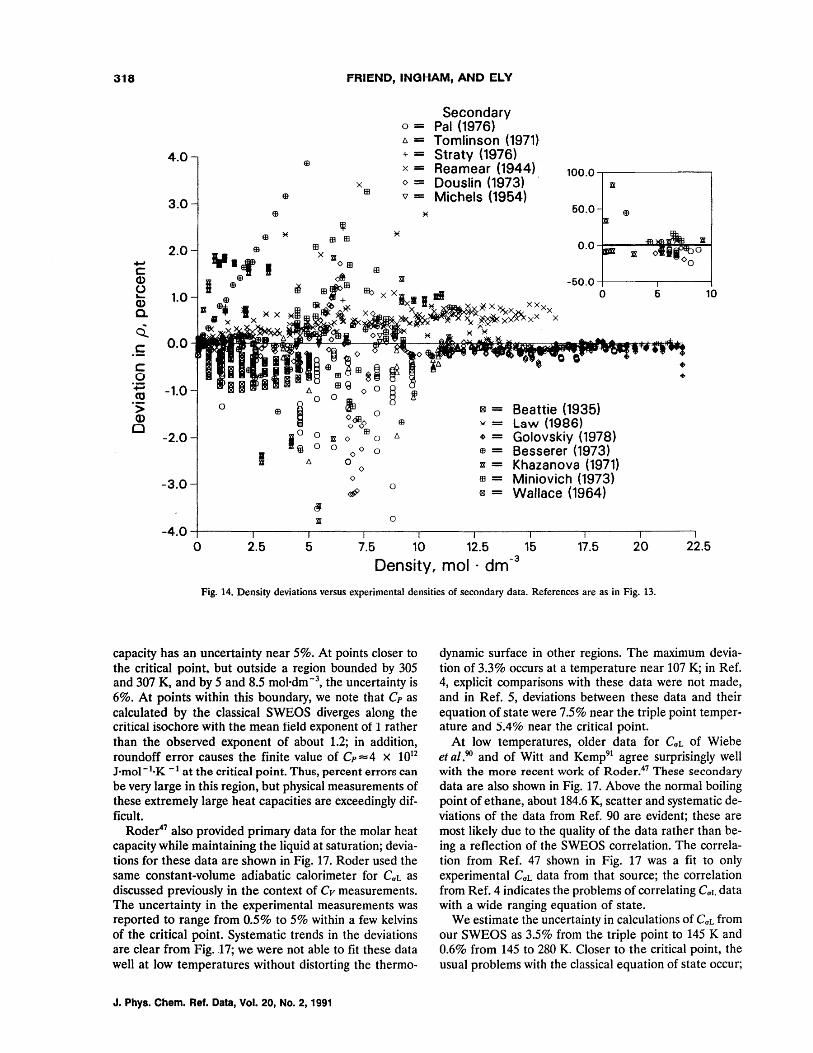
318 FRIEND, INGHAM, AND ELY
Secondary 0= Pal (1976) t::,= Tomlinson (1971)
4.0 += Straty (1976) ffi x= Reamear (1944) 100.0
x 0= Douslin (1973) xx ffi
III 'il= Michels (1954) 3.0 ffi ~
50.0 ffi
~ ~ ffi ~
III III
2.0 ffi 0.0
+oJ ¥.~ I c III Q) I ffiffi m -50.0 (.)
1.0 0 6 10 ~
Q) c. 0:.
.5 0.0
c 0 .~ -1.0 Sl co .s;: 0 ~= Beattie (1935) Q) ffi ""= Law (1986) 0
-2.0 xx 0 .= Golovskiy (1978) 0 0 00 0 m= Besserer (1973) • xx t::, 0 xx= Khazanova (1971) 0
-3.0 0 111= Miniovich (1973)
<df> 0
Wallace (1964) ~=
~ xx 0
-4.0 0 2.5 5 7.5 10 12.5 15 17.5 20 22.5
Density, mol . dm -3
Fig. 14. Density deviations versus experimental densities of secondary data. References are as in Fig. 13.
capacity has an uncertainty near 5%. At points closer to the critical point. but outside a region bounded by 305 and 307 K, and by 5 and 8.5 mol·dm -3, the uncertainty is 6%. At points within this boundary, we note that Cp as calculated by the classical SWEOS diverges along the critical isochore with the mean field exponent of 1 rather than the observed exponent of about 1.2; in addition, roundoff error causes the finite value of Cp =4 x 10¹²
J·mol- l ·K -1 at the critical point. Thus, percent errors can be very large in this region, but physical measurements of these extremely large heat capacities are exceedingly difficult.
Roder47 also provided primary data for the molar heat capacity while maintaining the liquid at saturation; deviations for these data are shown in Fig. 17. Roder used the same constant-volume adiabatic calorimeter for CaL as discussed previously in the context of Cv measurements. The uncertainty in the experimental measurements was reported to range from 0.5% to 5% within a few kelvins of the critical point. Systematic trends in the deviations are clear from Fig. 17; we were not able to fit these data well at low temperatures without distorting the thermo-
J. Phys. Chern. Ref. Data, Vol. 20, No.2, 1991
dynamic surface in other regions. The maximum deviation of 3.3% occurs at a temperature near 107 K; in Ref. 4, explicit comparisons with these data were not made, and in Ref. 5, deviations between these data and their equation of state were 7.5% near the triple point temperature and 5.4% near the critical point.
At low temperatures, older data for CaL of Wiebe et al.9IJ and of Witt and Kemp91 agree surprisingly well with the more recent work of Roder~47 These secondary data are also shown in Fig. 17. Above the normal boiling point of ethane, about 184.6 K, scatter and systematic deviations of the data from Ref. 90 are evident; these are most likely due to the quality of the data rather than being a reflection of the SWEOS correlation. The correlation from Ref. 47 shown in Fig. 17 was a fit to only experimental CaL data from that source; the correlation from Ref. 4 indicates the problems of correlating CaL data with a wide ranging equation of state.
We estimate the uncertainty in calculations of CaL from our SWEOS as 3.5% from the triple point to 145 K and 0.6% from 145 to 280 K. Closer to the critical point, the usual problems with the classical equation of state occur;
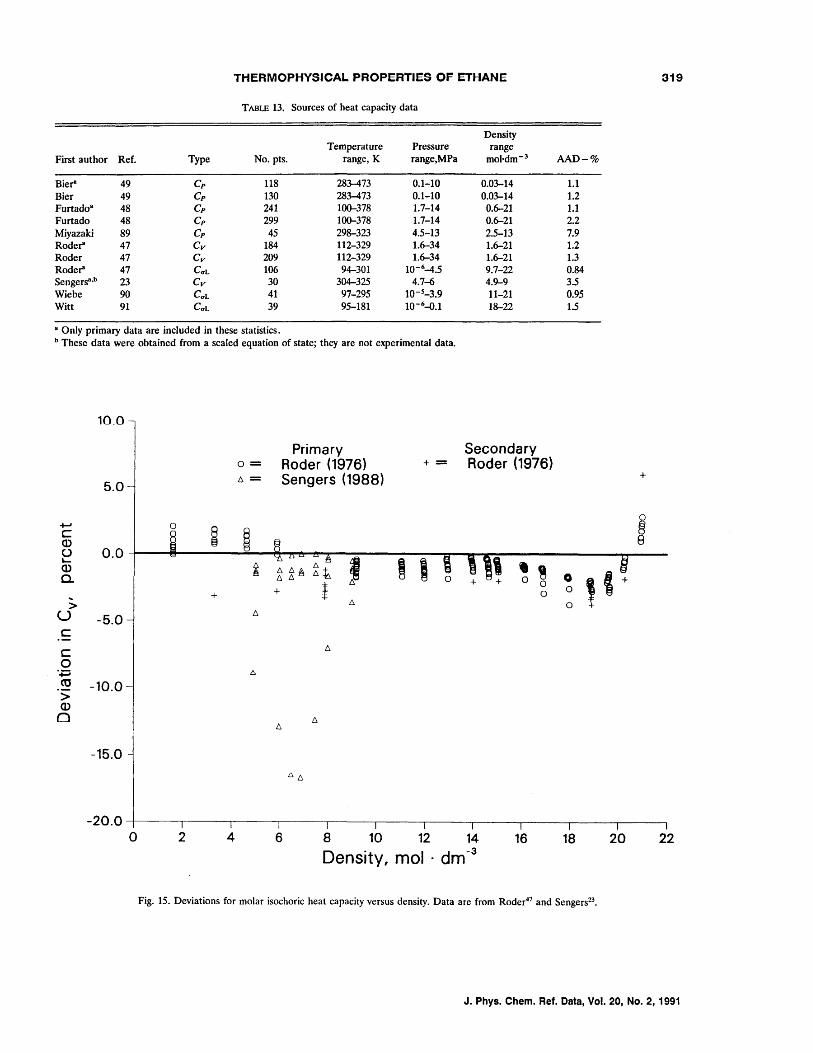
THERMOPHYSICAL PROPERTIES OF ETHANE 319
TABLE 13. Sources of heat capacity data
Density Temperature Pressure range
First author Ref. Type No. pts. range, K range,MPa mol·dm- 3 AAD-%
Bier" 49 Cp 118 283-473 0.1-10 0.03-14 1.1 Bier 49 Cp 130 283-473 O.l-to 0.03-14 1.2 Furtado8 48 Cp 241 100-378 1.7-14 0.6-21 1.1 Furtado 48 Cp 299 100-378 1.7-14 0.6-21 2.2 Miyazaki 89 Cp 45 298-323 4.5-13 2.5-13 7.9 Roder" 47 Cv 184 112-329 1.6-34 1.6-21 1.2 Roder 47 Cv 209 112-329 1.6-34 1.6-21 1.3 Roder" 47 CaL 106 94-301 10-6-4.5 9.7-22 0.84 Sengers8
•b 23 Cv 30 304-325 4.7-6 4.9-9 3.5
Wiebe 90 CaL 41 97-295 10-5-3.9 11-21 0.95 Witt 91 CaL 39 95-181 10-6-0.1 18-22 1.5
a Only primary data are included in these statistics. b These data were obtained from a scaled equation of state; they are not experimental data.
10_0
Primary Secondary 0= Roder (1976) + = Roder (1976) 1:::.= Sengers (1988) +
5.0
.t-J 0
~ ~ @
C Q) 8 u 0.0 L-
~ ~t J ~ i , , Q) ~ ~ & ~ , I + a. + 0 0
t 0
+ 0 0 +
> ~ 0 + U -5.0
I:::.
c: C 0
'';:; <0 -10.0 > Q)
0 I:::. t::.
-15.0 C:.I:::.
-20.0 0 2 4 6 8 10 12 14 16 18 20 22
Density, mol . dm -3
Fig. 15. Deviations for molar isochoric heat capacity versus density. Data are from Roder47 and Sengers23.
J. Phys. Chem. Ref. Data, Vol. 20, No.2, 1991
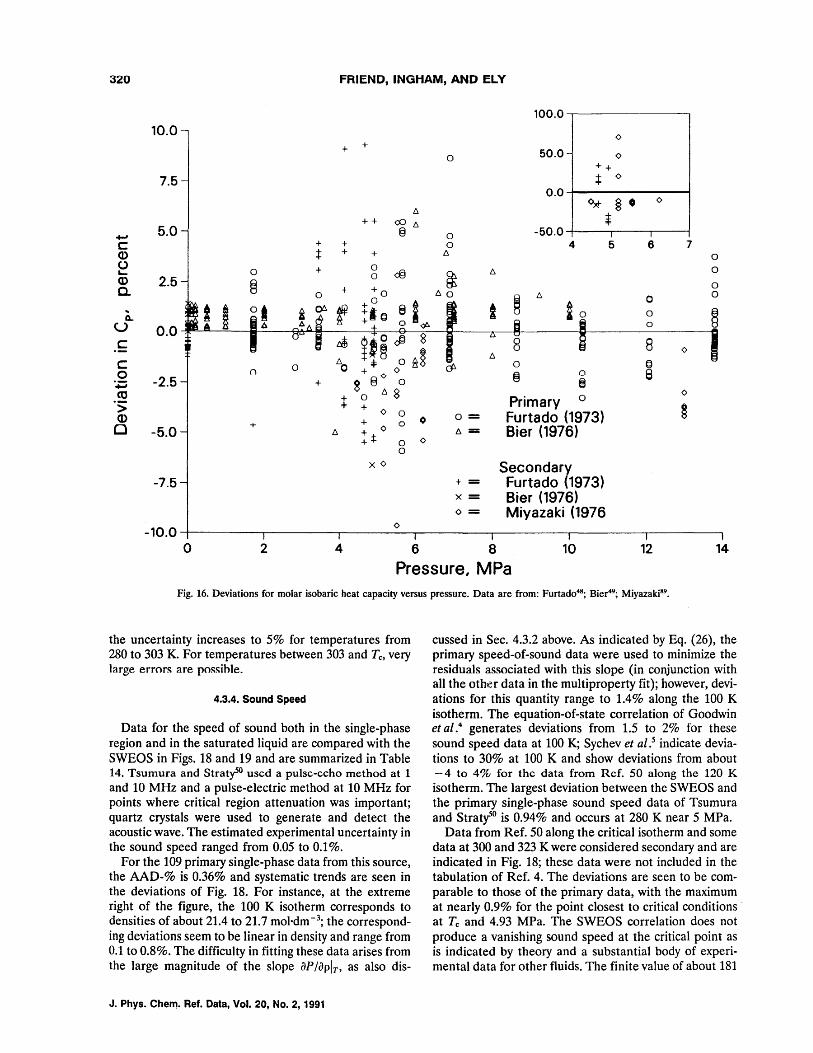
320 FRIEND, INGHAM, AND ELY
100.0 --r---------,
10.0 o + +
o 50.0 o
7.5 o
6.
5.0 + + <::0 6.
§ -50.0 -4-----,,.-----r----f +-I c: Q) () L-Q) C.
... 0... u
.£ c o . .;:; CO .s; Q)
D
o 2.5 §
() o -2.5
-5.0 +
-7.5
+ + 4: + +
+
+
XO
o o
6.
0=
6.=
+== x= 0==
4 5
Primary 0
Furtado (1973) Bier (1976)
Secondary Furtado (1973) Bier (1976) Miyazaki (1976
6 7
<>
o o o o
-10.0~--------.---------~------0~--------~--------~--------~------~ o 2 4 6 8 10 12 14
Pressure, MPa Fig. 16. Deviations for molar isobaric heat capacity versus pressure. Data are from: Furtado4!!; Bier49; Miyazaki!!9.
the uncertainty increases to 5% for temperatures from 280 to 303 K. For temperatures between 303 and Tc, very large errors are possihle.
4.3.4. Sound Speed
Data for the speed of sound both in the single-phase region and in the saturated liquid are compared with the SWEOS in Figs. 18 and 19 and are summarized in Table 14. Tsumura and StratyS° used a pulse-echo method at 1 and 10 MHz and a pulse-electric method at 10 MHz for points where critical region attenuation was important; quartz crystals were used to generate and detect the acoustic wave. The estimated experimental uncertainty in the sound speed ranged from 0.05 to 0.1 %.
For the 109 primary single-phase data from this source, the AAD-% is 0.36% and systematic trends are seen in the deviations of Fig. 18. For instance, at the extreme right of the figure, the 100 K isotherm corresponds to densities of about 21.4 to 21. 7 mol·dm -3; the corresponding deviations seem to be linear in density and range from 0.1 to 0.8%. The difficulty in fitting these data arises from the large magnitude of the slope aP /apIT' as also dis-
J. Phys. Chem. Ref. Data, Vol. 20, No.2, 1991
cussed in Sec. 4.3.2 above. As indicated by Eq. (26), the primary speed-of-sound data were used to minimize the residuals associated with this slope (in conjunction with all the other data in the multiproperty fit); however, deviations for this quantity range to 1.4% along the 100 K isotherm. The equation-of-state correlation of Goodwin et a/.4 generates deviations from 1.5 to 2% for these sound speed data at 100 K; Sychev et al.5 indicate deviations to 30% at 100 K and show deviations from about - 4 to 4% for the data from Ref. 50 along the 120 K isotherm. The largest deviation between the SWEOS and the primary single-phase sound speed data of Tsumura and Straryso is 0.94% and occurs at 280 K near 5 MPa.
Data from Ref. 50 along the critical isotherm and some data at 300 and 323 K were considered secondary and are indicated in Fig. 18; these data were not included in the tabulation of Ref. 4. The deviations are seen to be comparable to those of the primary data, with the maximum at nearly 0.9% for the point closest to critical conditions' at Tc and 4.93 MPa. The SWEOS correlation does not produce a vanishing sound speed at the critical point as is indicated by theory and a substantial body of experimental data for other fluids. The finite value of about 181
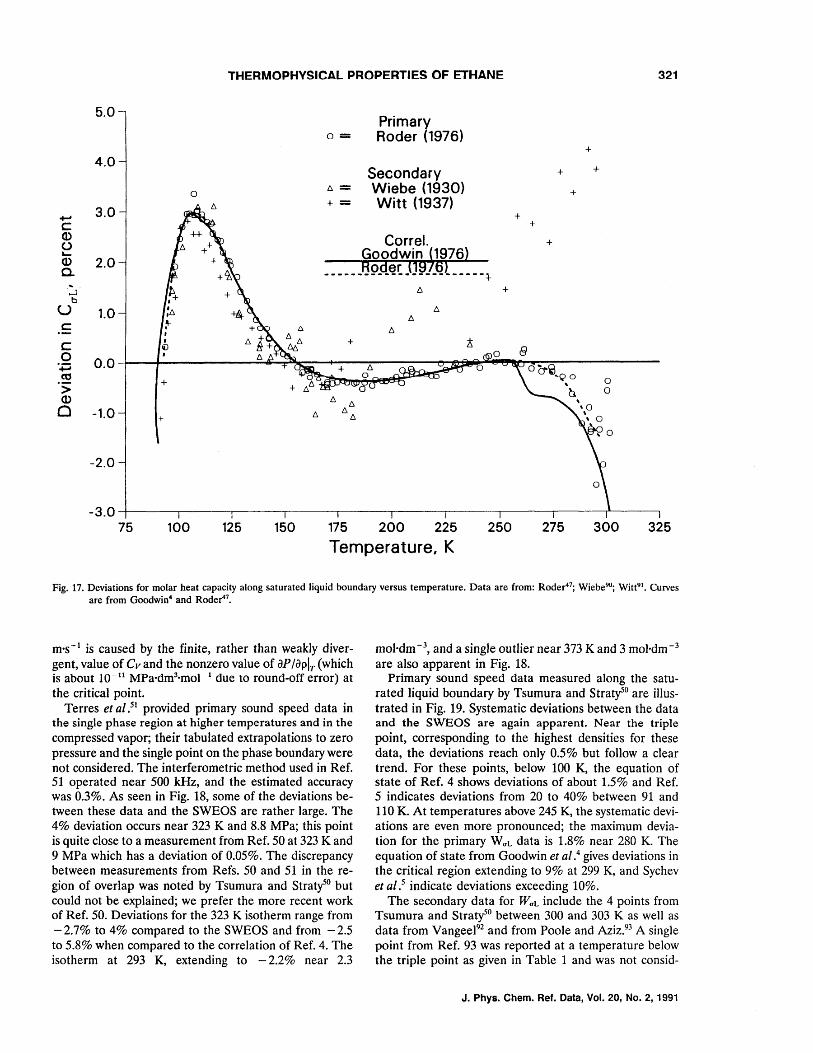
THERMOPHYSICAL PROPERTIES OF ETHANE 321
5.0 Primary
0= Roder (1976) +
4.0 + Secondary +
6.= Wiebe (1930) + 0 + = Witt (1937)
+oJ 3.0 +
c + Q) Correl. + u ~ Goodwin }1976) Q) 2.0 Roder (19 6) 0. ------------------------+
...J !::. + b
U 1.0 6. !::.
C !::.
C + 0 0.0 '';::::; 0'" ~ co (j' "Q 0
0 .s; + \,
ti 0 Q) !::. !::. \
0 -1.0 6. '0 !::. \
+ !::. , 0
-2.0
-3.0 75 100 125 150 175 200 225 250 275 300 325
Temperature, K
Fig. 17. Deviations for molar heat capacity along saturated liquid boundary versus temperature. Data are from: Rodec47; Wiebe90; Witt91• Curves
are from Goodwin4 and Roder47•
m's- l is caused by the finite, rather than weakly divergent, value of Cv and the nonzero value of ap /aplT (which is about 10- 11 MPa'dm3'mol 1 due to round-off error) at the critical point.
Terres et al.51 provided primary sound speed data in the single phase region at higher temperatures and in the compressed vapor; their tabulated extrapolations to zero pressure and the single point on the phase boundary were not considered. The interferometric method used in Ref. 51 operated near 500 kHz, and the estimated accuracy was 0.3%. As seen in Fig. 18, some of the deviations between these data and the SWEOS are rather large. The 4% deviation occurs near 323 K and 8.8 MPa; this point is quite close to a measurement from Ref. 50 at 323 K and 9 MPa which has a deviation of 0.05%. The discrepancy between measurements from Refs. 50 and 51 in the region of overlap was noted by Tsumura and StratfO but could not be explained; we prefer the more recent work of Ref. 50. Deviations for the 323 K isotherm range from -2.7% to 4% compared to the SWEOS and from -2.5 to 5.8% when compared to the correlation of Ref. 4. The isotherm at 293 K, extending to - 2.2% near 2.3
mol'dm-3, and a single outlier near 373 K and 3 mol·dm-3
are also apparent in Fig. 18. Primary sound speed data measured along the satu
rated liquid boundary by Tsumura and Stratf° are illustrated in Fig. 19. Systematic deviations between the data and the SWEOS are again apparent. Near the triple point, corresponding to the highest densities for these data, the deviations reach only 0.5% but follow a clear trend. For these points, below 100 K, the equation of state of Ref. 4 shows deviations of about 1.5% and Ref. 5 indicates deviations from 20 to 40% between 91 and 110 K. At temperatures above 245 K, the systematic deviations are even more pronounced; the maximum deviation for the primary WuL data is 1.8% near 280 K. The equation of state from Goodwin et al.4 gives deviations in the critical region extending to 9% at 299 K, and Sychev et al.5 indicate deviations exceeding 10%.
The secondary data for WuL include the 4 points from Tsumura and Stratf° between 300 and 303 K as well as data from Vangeel92 and from Poole and Aziz.93 A single point from Ref. 93 was reported at a temperature below the triple point as given in Table 1 and was not consid-
J. Phys. Chem. Ref. Data, Vol. 20, No.2, 1991
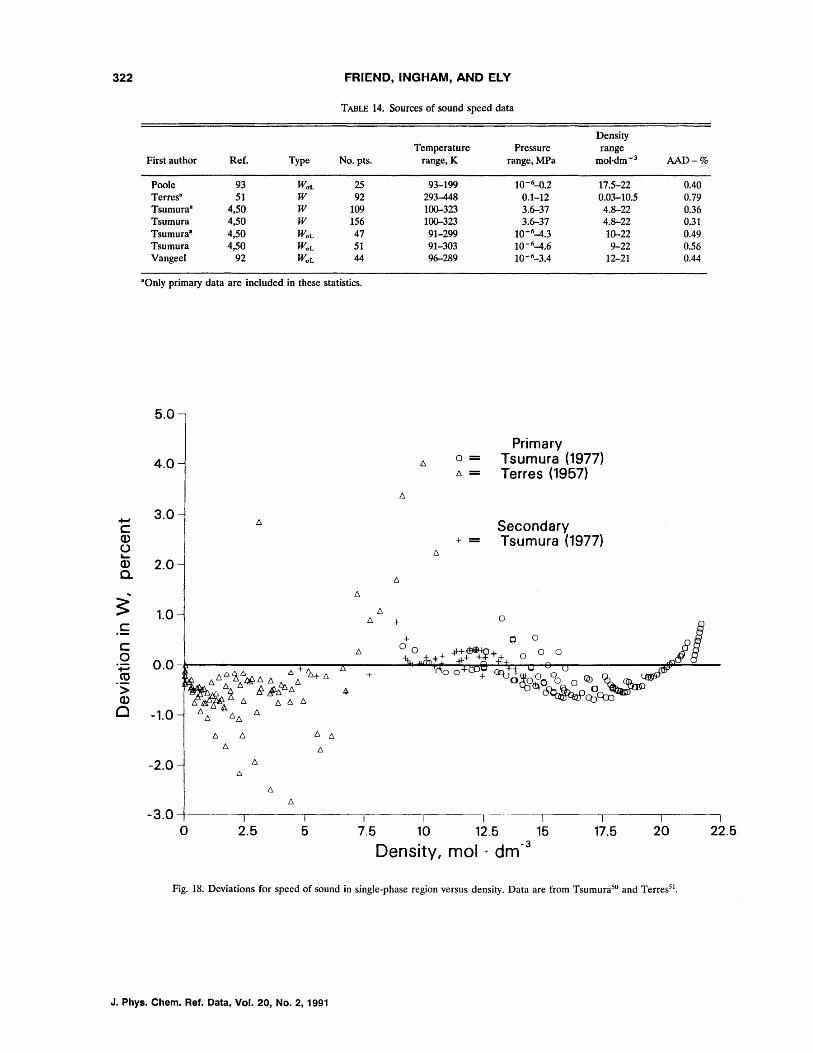
322
+"" c Q) () ~
Q) c..
.. ~ c: c 0 .~
CO .S; Q)
Cl
FRIEND, INGHAM, AND ELY
TABLE 14. Sources of sound speed data
Density Temperature Pressure range
First author Ref. Type No. pts. range, K range, MPa mol·dm-3
Poole 93 WaL 25 93-199 10-6-0.2 17.5-22 Terres8 51 W 92 293-448 0.1-12 0.03-10.5 TsumuraB 4,50 W 109 100-323 3.Cr37 4.8-22 Tsumura 4,50 W 156 100-323 3.Cr37 4.8-22 Tsumura8 4,50 WaL 47 91-299 10-6-4.3 10-22 Tsumura 4,50 WaL 51 91-303 10-6-4.6 9-22 Vangeel 92 WaL 44 9Cr289 10-6-3.4 12-21
BOnly primary data are included in these statistics.
5.0
4.0
3.0
2.0
1.0
0.0
4
-1.0 t:.
t:,. 6. t:,. !:::. t:,. !:::.
-2.0 !:::. 6-
!:::.
!:::.
-3.0 0 2.5 5
t:.
t:,.
t:,.
t:,.
t:,.
t:. t:,. +
+ t:. 00
+
0 -t:,. -
+ -
Primary Tsumura (1977) Terres (1957)
Secondary Tsumura (1977)
o
o 0
000
7.5 10 12.5 15 17.5
Density, mol· dm- 3
AAD-%
0.40 0.79 0.36 0.31 0.49 0.56 0.44
I
20
Fig. 18. Deviations for speed of sound in single-phase region versus density. Data are from Tsumura50 and Terres5!.
J. Phys. Chern. Ref. Data, Vol. 20, No.2, 1991
22.5
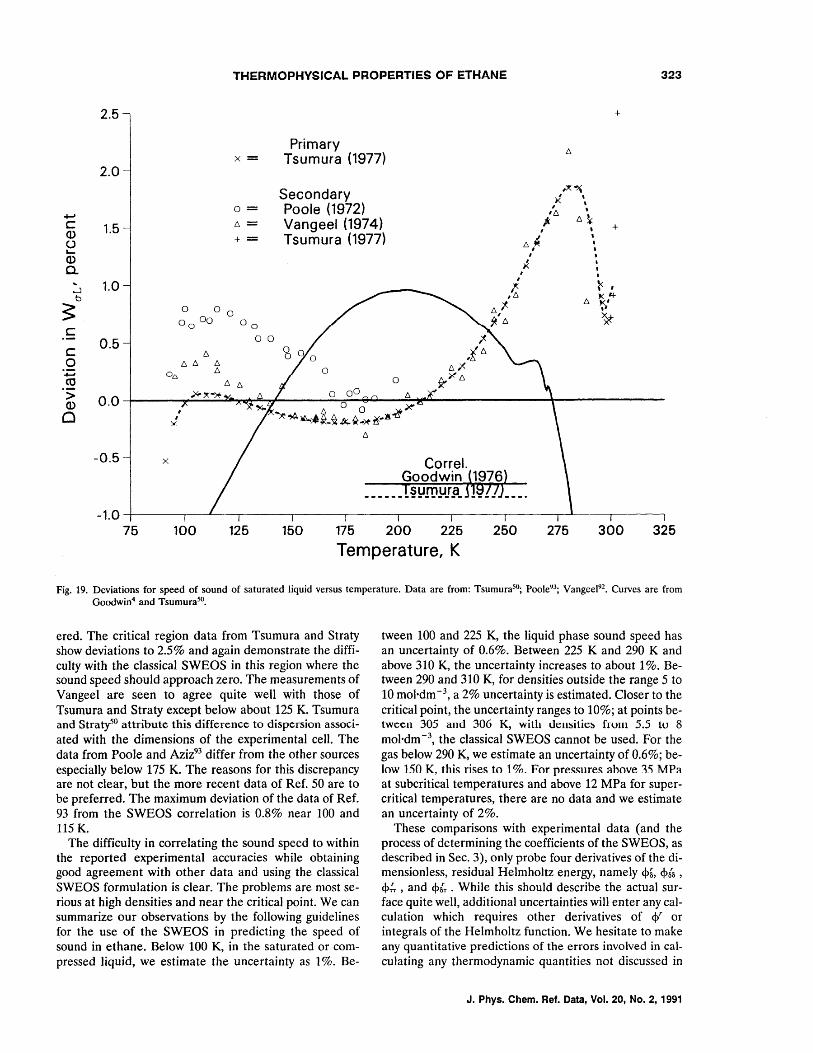
THERMOPHVSICAL PROPERTIES OF ETHANE 323
2.5 +
Primary x= Tsumura (1977)
2.0
Secondary ,~~
x , , 0= Poole (1972) , ,
'6. +-' 6.~ C 1.5 6.= Vangeel (1974) j. + Q) I
, + = Tsumura (1977) 6.~
, U
, 10....
, , Q)
, , , I
a. x , .. 1.0
, ~ ,
~ ,~ b 6. J<,'+
~ o 0 0 6." ~ o 00 0 0
~'6. ~ C
0
0.5 o 0 ~ C 6. '6 0 0 ,t 6. 0 6. 6. 6. 6.7-.~ 0 6
6. 0 ~~{:;
.~ 6. {:; 0
> ;r,. ~-)(o 0 0 0 6. 0.0 Q) o 0 >!!'
0 I "'X'o¢.~~t~ A.~-~ ri .. "1!~ I
'1.
6.
-0.5 x Correl. Goodwin {1976}
______ t§~ro!JJ~t 11tJ1JJ ___ . -1.0
75 100 125 150 175 200 225 250 275 300 325
Temperature, K
Fig. 19. Deviations for speed of sound of saturated liquid versus temperature. Data are from: Tsumura50; Poole93
; Vangeel92• CUlVes are from
Goodwin4 and Tsumura50•
ered. The critical region data from Tsumura and Straty show deviations to 2.5% and again demonstrate the difficulty with the classical SWEOS in this region where the sound speed should approach zero. The measurements of Vangeel are seen to agree quite well with those of Tsumura and Straty except below about 125 K. Tsumura and Straty'iO attribute this difference to dispersion associated with the dimensions of the experimental cell. The data from Poole and Aziz93 differ from the other sources especially below 175 K. The reasons for this discrepancy are not clear, but the more recent data of Ref. 50 are to be preferred. The maximum deviation of the data of Ref. 93 from the SWEOS correlation is 0.8% near 100 and 115K.
The difficulty in correlating the sound speed to within the reported experimental accuracies while obtaining good agreement with other data and using the classical SWEOS formulation is clear. The problems are most serious at high densities and near the critical point. We can summarize our observations by the following guidelines for the use of the SWEOS in predicting the speed of sound in ethane. Below 100 K, in the saturated or compressed liquid, we estimate the uncertainty as 1 %. Be-
tween 100 and 225 K, the liquid phase sound speed has an uncertainty of 0.6%. Between 225 K and 290 K and above 310 K, the uncertainty increases to about 1 %. Between 290 and 310 K, for densities outside the range 5 to 10 mol·dm -3, a 2% uncertainty is estimated. Closer to the critical point, the uncertainty ranges to 10%; at points between 305 and 306 K, with demsitk:s frum 5.5 Lu 8 mol·dm - 3, the classical SWEOS cannot be used. For the gas below 290 K, we estimate an uncertainty of 0.6%; below 150 K. this rises to 1 %. For pressnres above 35 MPa at subcritical temperatures and above 12 MPa for supercritical temperatures, there are no data and we estimate an uncertainty of 2%.
These comparisons with experimental data (and the process of determining the coefficients of the SWEOS, as described in Sec. 3), only probe four derivatives of the dimensionless, residual Helmholtz energy, namely <Ps, <pts , <P'::" , and <PtT • While this should describe the actual surface quite well, additional uncertainties will enter any calculation which requires other derivatives of <P' or integrals of the Helmholtz function. We hesitate to make any quantitative predictions of the errors involved in calculating any thermodynamic quantities not discussed in
J. Phys. Chern. Ref. Data, Vol. 20, No.2, 1991
324 FRIEND. INGHAM, AND ELY
this section, but we conjecture that these errors will be comparable to those found with any other precise equation of state for ethane.
4.4. Transport Property Comparisons
4.4.1. Viscosity
The viscosity of the dilute ethane gas, as described by Eq. (10), is compared with experimental data in the deviation plot of Fig. 20. The 6 primary data of Kestin
. et al.52-54 were obtained using an absolute method in an
oscillating disk instrument and had a reported accuracy of 0.2%; the comparison between these data and our correlation of Eq. (10) gives an AAD-% of 0.85%. Secondary data from Refs. 52, 53, 57, and 94-100 are also shown in the figure, and additional, especially earlier, data sources are discussed in these references and in Refs. 26, 27, and 101. Where appropriate, the data have been adjusted to zero density by subtracting the (small) value of the excess viscosity calculated from the correlation of Eq. (15) at the experimental pressure, which was usually near 0.1 MPa. The adjustment is less than 0.25% for all temperatures. Secondary data in the gas phase at pressures less than 0.12 MPa were included in dilute gas comparisons and not below with the total viscosity. For the 76 points illustrated, in the range from 250 K to 523 K, the comparison of the data to Eq. (10) gives an AAD-% of 0.89%, a BIAS-% of 0.18%, and an RMS-% of 0.98%.
The statistics above indicate considerable scatter among the data; this is also illustrated by Fig. 20. The two correlations shown, by Boushehri et al.27 and by Younglove and Ely,IO also indicate some systematic differences. Boushehri et al.27 did not consider any data below about 300 K (they do not include Ref. 97 among their secondary data) and indicate an accuracy of 0.5% in their entire range from 250 to 500 K; extrapolation of the curve to lower temperatures is not warranted. At 300 K, near the most reliable data, the difference between our correlation and that from Ref. [27] is about 0.3%. Both correlations differ from the primary data in this region: a deviation of about 1-1.2% is seen for the present correlation, and a deviation of about 0.8% is seen for the correlation of Boushehri et al. The original data papers specified an accuracy of 0.1-0.2%. At higher temperatures, the spread of even the most accurate data is apparent. At 420 K, for instance, the point from Ref. [52] differs by about 0.8% from the more recent data by Abe et al.95 Although the true value of the dilute gas viscosity may indeed lie between these two values, as fit by Boushehri et al., our correlation gives a value about 0.4% lower than the datum from Ref. [95] which we did not consider primary. Although the differences between our correlation and that from Ref. [27] are systematic, the maximum deviations of about 1.5% (near 250 K, the lower limit in Ref. [27]) are within combined uncertainties.
J. Phys. Chem. Ref. Data, Vol. 20, No.2, 1991
Younglove and ElylO, whose correlation for 1'10 and selection of primary data are quite similar to ours, give a value at 100 K which differs by less than 3% from that calculated using Eq. (10). All of the correlations considered here, from our Eq. (10), from Ref. [10], and from Ref. [27], are based on two adjustable parameters and have difficulty fitting the best experimental data over a wide range in temperature. We estimate the uncertainty of our correlation as 1 % in the range 300 to 375 K; 1.5% from 250 to 300 K and above 375 K; and 5% from the triple point temperature to 250 K.
There are also several sources for the viscosity of ethane at elevated pressures. The total viscosity is correlated by the sum of contributions from Eqs. (10) and (15). In addition to comparisons to the 438 primary data of Diller and Saher.55 ni11er.56 and Carmichael and Sage,57 we have included comparisons with data from Refs. 24, 96, 100, 102, and 103. The general experimental accuracies were specified as about 2% for Refs. 55 and 56 and about 0.5% for Ref. 57. Table 15 summarizes these data and comparisons for the entire set of 1225 points. Additional, especially older, data sources were cited by Hanley et al.26 and in the monograph by Stephan and Lucas;104 some of these are included in the comparisons of Ref. 3.
Figure 21a illustrates the deviations for the primary data and much of the secondary data. Data of Iwasaki and Takahashi96 and of Strumpf et al. 24 emphasized the region of the critical point and indicate a critical enhancement. Because of the small size of the critical region relevant to the viscosity enhancement and in the interest of simplicity of the correlating equations, we have not studied the theoretically predicted enhancement of the viscosity, nor have we critically evaluated the data of Refs. 24 and 96. Our correlation does not account for any critical enhancement in the viscosity; therefore, the critical region, 305-306 K and 6-7.5 mol·dm-3
, should be excluded when making calculations with this viscosity correlation. Because of the larger deviations between the correlation and data from Refs. 24 and 96, which may be of interest to some readers, these data are separately illustrated in Fig. 21b.
The AAD-% is 0.75% for the 438 selected primary viscosity data. Including the few secondary data from Diller and Saber,55 Diller,56 and Carmichael and Sage,57 as well as data from Baron et al., 102 Eakin et ai., 100 and Swift et al., 103 we have 718 points with an AAD-% of 1.05%. When the data compared include the critical region measurements of Iwasaki and Takahashi96 and Strumpf et al.,24 the AAD-% for the resulting 1225 points increases to 3.07% if the pressures of Ref. 96 are used and 2.01 % jf the densities of Ref. 96 are used. These statistical comparisons and the appearance of Figs. 21a and 21b warrant some discussion.
We are aware of no accurate data for the vapor phase below 290 K. From the subcritical data at 290 K and above, as well as supercritical data in the low density region, and our study of the dilute gas correlation, we can assess the uncertainty of the viscosity correlation in the vapor phase. From the triple point temperature to 250 K,
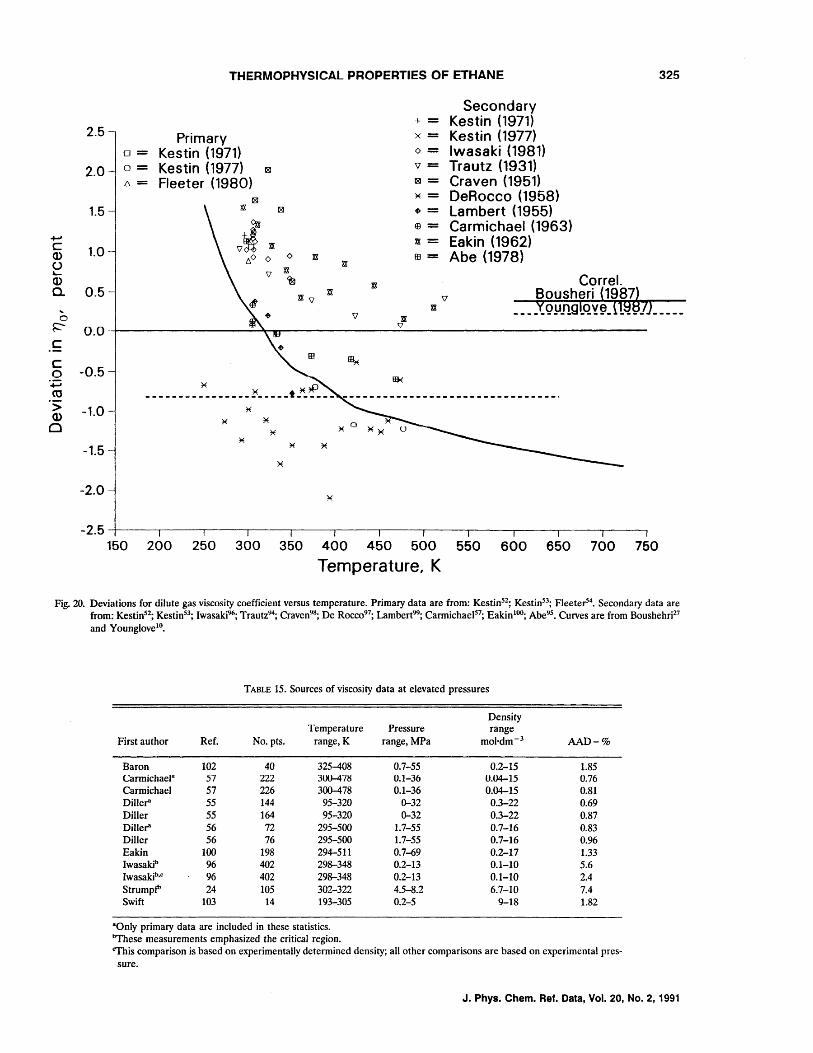
+-' C Q)
U L-
a> 0.
.. o ~
c: c: o
'+=i co .s; a> o
2.5
2.0
1.5
1.0
0.5
0.0
-0.5
-1.0
-1.5
-2.0
THERMOPHVSICAL PROPERTIES OF ETHANE 325
Primary 0= Kestin (1971) 0= Kestin (1977) 181
LJ= Fleeter (1980) 181
xx 0
~tl xx t,o 0 0 xx
'V xx ~
xx 'V xx
$
$ HI
~ ~ ~OP ______________________ t _____ _
xx
xx
'V xx ~
~
+= x =
0= 'V=
181= ~ = .= ro= xx= m=
'V xx
Secondary Kestin (1971) Kestin (1977) Iwasaki (1981) Trautz (1931) Craven (1951) DeRocco (1958) Lambert (1955) Carmichael (1963) Eakin (1962) Abe (1978)
Correl. Bousheri (1987~
____ '( Q!JJlglQY~_ {lQ _ JJ ____ _
-2.5~----~--~----~----~--~~--~----~----~--~~--~----~--~
150 200 250 300 350 400 450 500 550
Temperature, K 600 650 700 750
Fig. 20. Deviations for dilute gas viscosity coefficient versus temperature. Primary data are from: Kestin52; Kestin53; Fleeter4• Secondary data are
from: Kestin52; Kestin53; Iwasaki96; Trautz94
; Craven9!!; De Rocc097; Lambert99; Carmichael57; Eakin1oo
; Abe95. Curves are from BoushehrF7 and YounglovelO
•
TABLE 15. Sources of viscosity data at elevated pressures
Temperature First author Ref. No.pts. range, K
Baron 102 40 325-408 CarmichaelB 57 222 300-478 Carmichael 57 226 300-478 Dille~ 55 144 95-320 Diller 55 164 95-320 Dille~ 56 72 295-500 Diller 56 76 295-500 Eakin 100 198 294-511 Iwasakib 96 402 298-348 Iwasakib•c 96 402 298-348 Strumpf' 24 105 302-322 Swift 103 14 193-305
BOnly primary data are included in these statistics. b'fhese measurements emphasized the critical region.
Density Pressure range
range, MPa mol'dm-3 AAD-%
0.7-55 0.2-15 1.85 0.1-36 0.04-15 0.76 0.1-36 0.04-15 0.81
0-32 0.3-22 0.69 0-32 0.3-22 0.87
1.7-55 0.7-16 0.83 1.7-55 0.7-16 0.96 0.7-69 0.2-17 1.33 0.2-13 0.1-10 5.6 0.2-13 0.1-10 2.4 4.5-8.2 6.7-10 7.4 0.2-5 9-18 1.82
~is comparison is based on experimentally determined density; all other comparisons are based on experimental pressure.
J. Phys. Chem. Ref. Data, Vol. 20, No.2, 1991
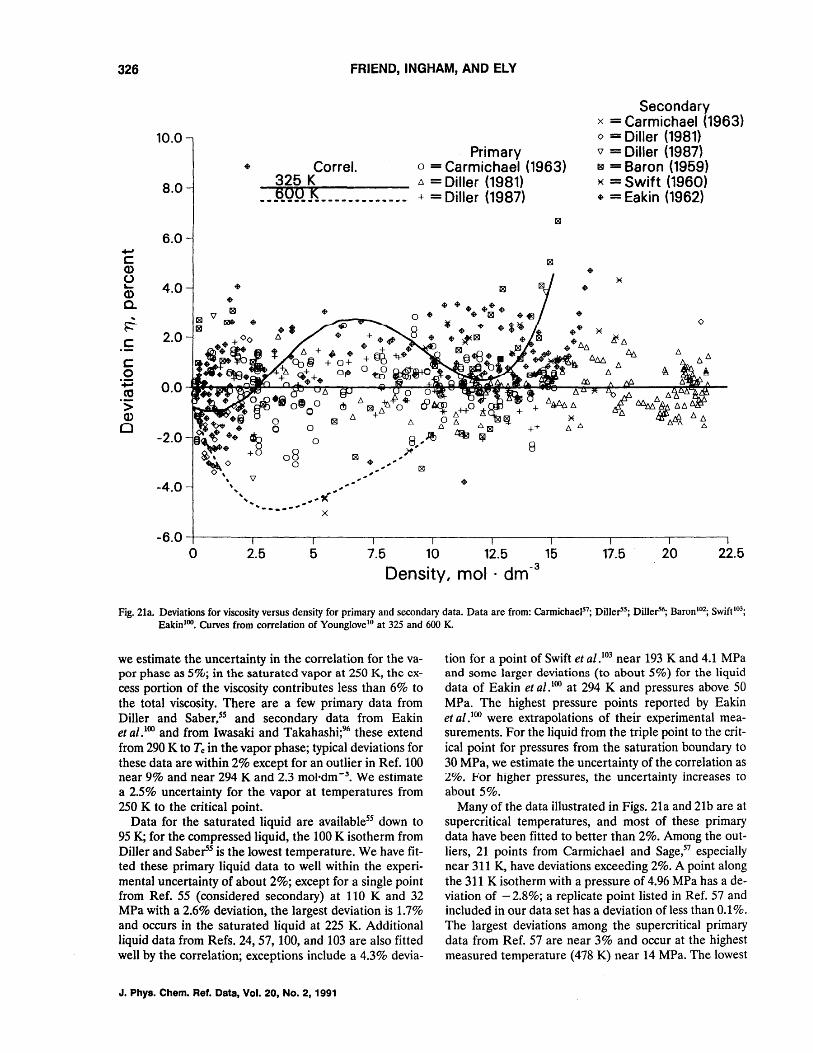
326 FRIEND, INGHAM, AND ELY
10.0 Primary
Secondary x = Carmichael (1963) o = Diller (1981) TV = Diller (1987)
• Correl. 0 = Carmichael (1963) ~ = Baron (1959) 8.0 325 K t. = Diller (1981) __ AQQJ~ _____________ + = Diller (1987)
~ = Swift (1960) • = Eakin (1962)
6.0 ...., c Q) ()
4.0 L.. • Q) c.
... ~
.S: 2.0
c:: 0
'';:; 0.0 CO .S; Q)
0 -2.0
-4.0
-6.0 0 2.5 5 7.5 10 12.5 15 17.5 20 22.5
Density, mol . dm-3
Fig. 21a. Deviations for viscosity versus density for primary and secondary data. Data are from: Carmichaels,; Dillers; Diller6; Baron102
; Swift103;
EakinlOO. Curves from correlation of Younglove lO at 325 and 600 K.
we estimate the uncertainty in the correlation for the vapor phase as 5%; in the saturated vapor at 250 K, the excess portion of the viscosity contributes less than 6% to the total viscosity. There are a few primary data from Diller and Saber,s5 and secondary data from Eakin et al. l
°O and from Iwasaki and Takahashi;96 these extend from 290 K to Tc in the vapor phase; typical deviations for these data are within 2% except for an outlier in Ref. 100 near 9% and near 294 K and 2.3 mol·dm-3
• We estimate a 2.5% uncertainty for the vapor at temperatures from 250 K to the critical point.
Data for the saturated liquid are available55 down to 95 K; for the compressed liquid, the 100 K isotherm from Diller and SaberS is the lowest temperature. We have fitted these primary liquid data to well within the experimental uncertainty of about 2%; except for a single point from Ref. 55 (considered secondary) at 110 K and 32 MPa with a 2.6% deviation, the largest deviation is 1.7% and occurs in the saturated liquid at 225 K. Additional liquid data from Refs. 24,57, 100, and 103 are also fitted well by the correlation; exceptions include a 4.3% devia-
J. Phys. Chem. Ref. Data, Vol. 20, No.2, 1991
tion for a point of Swift et al.103 near 193 K and 4.1 MPa and some larger deviations (to about 5%) for the liquid data of Eakin et al. 1OO at 294 K and pressures above 50 MPa. The highest pressure points reported by Eakin et al. l
°O were extrapolations of their experimental measurements. For the liquid from the triple point to the critical point for pressures from the saturation boundary to 30 MPa, we estimate the uncertainty of the correlation as 2%. For higher pressures, the uncertainty increases to about 5%.
Many of the data illustrated in Figs. 21a and 21b are at supercritical temperatures, and most of these primary data have been fitted to better than 2%. Among the outliers, 21 points from Carmichael and Sage,S7 especially near 311 K, have deviations exceeding 2%. A point along the 311 K isotherm with a pressure of 4.96 MPa has a deviation of - 2.8%; a replicate point listed in Ref. 57 and included in our data set has a deviation of less than 0.1 %. The largest deviations among the supercritical primary data from Ref. 57 are near 3% and occur at the highest measured temperature (478 K) near 14 MPa. The lowest
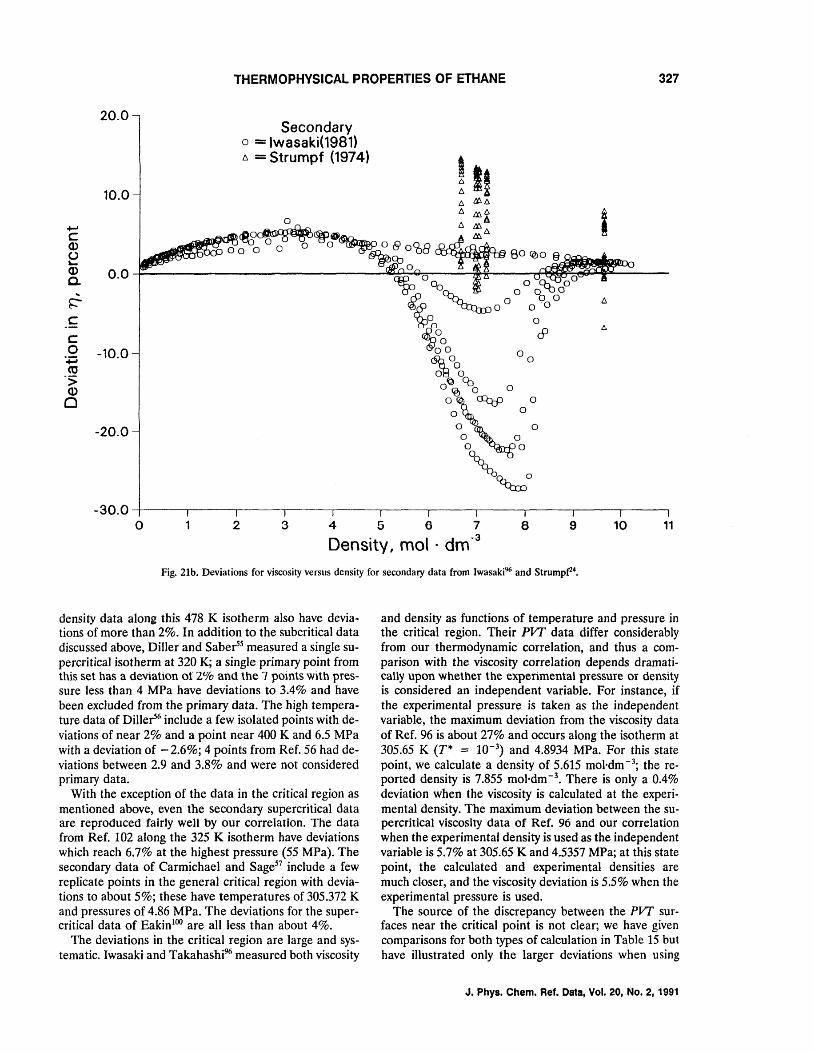
THERMOPHYSICAL PROPERTIES OF ETHANE 327
20.0
10.0
Secondary o = Iwasaki(1981) t:, = Strumpf (1974)
o.o~----------------------------~~~----~~--~~~~~~------.. ~ c c o -10.0
'';::; <C oS; Q)
o
-20.0
o o
-30.0~----~----~--~----~----~----~--~----~----~----~--~
o 2 3 456 7
Densitv, mol . dm-3 8 9 10 11
Fig. 21b. Deviations for viscosity versus density for secondary data from Iwasaki96 and Strump(24.
density data along this 478 K isotherm also have deviations of more than 2%. In addition to the subcritical data discussed above, Diller and Sabe~s measured a single supercritical isotherm at 320 K; a single primary point from this set has a deviation of 2% and the 7 pOints with pressure less than 4 MPa have deviations to 3.4% and have been exc1uded from the primary data. The high temperature data of Di1le~6 inc1ude a few isolated points with deviations of near 2% and a point near 400 K and 6.5 MPa with a deviation of - 2.6%; 4 points from Ref. 56 had deviations between 2.9 and 3.8% and were not considered primary data.
With the exception of the data in the critical region as mentioned above, even the secondary supercritical data are reproduced fairly well by our correlation. The data from Ref. 102 along the 325 K isotherm have deviations which reach 6.7% at the highest pressure (55 MPa). The secondary data of Carmichael and Sage57 include a few replicate points in the general critical region with deviations to about 5%; these have temperatures of 305.372 K and pressures of 4.86 MPa. The deviations for the supercritical data of Eakin100 are all less than about 4%.
The deviations in the critical region are large and systematic. Iwasaki and Takahashi96 measured both viscosity
and density as functions of temperature and pressure in the critical region. Their PIT data differ considerably from our thermodynamic correlation, and thus a comparison with the viscosity correlation depends dramatically upon whether the experimental pressure or density is considered an independent variable. For instance, if the experimental pressure is taken as the independent variable, the maximum deviation from the viscosity data of Ref. 96 is about 27% and occurs along the isotherm at 305.65 K (T* == 10-3
) and 4.8934 MPa. For this state point, we calculate a density of 5.615 mol·dm -3; the reported density is 7.855 mol·dm- 3
• There is only a 0.4% deviation when the viscosity is calculated at the experimental density. The maximum deviation between the supercritical viscosity data of Ref. 96 and our correlation when the experimental density is used as the independent variable is 5.7% at 305.65 K and 4.5357 MPa; at this state point, the calculated and experimental densities are much closer, and the viscosity deviation is 5.5% when the experimental pressure is used.
The source of the discrepancy between the PIT surfaces near the critical point is not clear; we have given comparisons for both types of calculation in Table 15 but have illustrated only the larger deviations when using
J. Phys. Chem. Ref. Data, Vol. 20, No.2, 1991
328 FRIEND, INGHAM, AND ELY
the experimental pressures. Strumpf et al.24 also measured densities for their isochoric data, but they did not measure pressure. Their viscosity data in the critical region differ considerably from those reported in Ref. 96 and large deviations from our correlation occur even at 322 K and 9.6 mol·dm-3; here the deviation is 7%. After considering the agreement among the alternate data, we have concluded that the data from Ref. 96 may suffer some systematic error. We estimate the uncertainty of the viscosity correlation in the supercritical region as generally 2%. At pressures greater than 50 MPa, the uncertainty increases to 5%, and in the critical region, from 305 to 307 K and 5 to 8.5 mol·dm -3 (but excluding the region 305-306 K and 6-7.5 mol·dm-3 as indicated above), the uncertainty is also 5%.
4.4.2. Thermal Conductivity
For the dilute ethane gas, the correlation of Eq. (13), using Eq. (14) for the factor fint, describes the thermal conductivity, and Fig. 22 illustrates the deviations of experimental data from this correlation. In addition to thc primary data of Roder and Nieto de CastroS
!! and of Prasad and Venart,S9 the figure includes points from Refs. 54, 98, 104a-106, 110 and 111. Other experimental work is cited in these references, and some data which incidentally include data at low pressures are included in the comparisons for the density-dependent thermal conductivity below. In all cases, we have used either the tabulated zero-density extrapolations of the authors, or we have subtracted a small value for the excess thermal conductivity as calculated from the correlation of Eqs. (17-18) at the experimental conditions. For the primary data, comprising 12 points spanning the temperature range 245-600 K, the AAD-% is 0.67%. Overall, for the 45 experimental points included in the figure, the AAD-% is 1.96%; the BIAS-% is - 0.48%; and the RMS-% is 2.38%.
The agreement among the sources of data as well as the quality of the present dilute gas correlation are worse than those seen in the dilute gas viscosity correlation. This last point is perhaps not surprising, since the theory for fint is not completely rigorous and the form we have chosen for this factor may be overly simplified.
Note added in final revision: A theoretical approach based on an approximate solution to the Wang ChangUhlenbeck equation has very recently been studied in analyzing new ethane thermal conductivity data. lIl This approach requires empirical evaluation of several collision integrals in addition to estimates of vibrational and rotational collision numbers. The new dilute gas extrapolations are shown in Fig. 22. Deviations from the correlation and from both primary and secondary data are substantial and systematic. However these new data agree with the correlation within combined uncertainties.
The correlations shown also represent fits of limited data. The CUlVe from Roder and Nieto de CastroS8 is their polynomial description of their zero-density extrapola-
J. Phys. Chem. Ref. Data, Vol. 20, No.2, 1991
tions, and the CUlVe from Hanley et al.26 is based on earlier data. Among the primary data, the largest deviation is 1.4% and occurs at 245 K for a point from Ref. 58. The statistical uncertainty which Roder and Nieto de Castro associate with the extrapolation needed to obtain this zero-density value is 2.7% and the general accuracy of the data is specified as 1.6%.
The Ao data from Ref. 58 at 225 K and 235 K were not considered primary; at 225 K, 8 measurements with various temperature rises at only 2 distinct densities were extrapolated. Although the statistical uncertainty given in Ref. 58 is 1.1%, a systematic change in these 8 data by only 0.5% will change the extrapolated value of AO from a deviation of 2.8% to a deviation of about 0.2% with respect to our correlation. The experimental uncertainty increases when extrapolations of limited measurements at low temperatures and pressures are made. The dispersion among the alternate data throughout the temperature range is unfortunate. Fleeter et al.,S4 who also used a transient hot-wire instrument, report a 0.3% uncertainty from their regression to obtain Ao at 301 K; this point has a deviation of 3.2% from our correlation. The low density results from Ref. 58 seem to show n slightly larger value of aA/aplT at 295 and 305 K and extend to lower densities than the isotherm at 301 K from Ref. 54. The experimental accuracy of the measurements from Yakush et al.lOS is not specified in that paper, and Le Neindre et al., 106 who used a coaxial cylinder method in the range 130-625 K, indicate a general experimental accuracy of 1.5%.
It is difficult to assess the uncertainty of our correlation for temperatures below that for which data are available. At the lowest temperatures, between the triple point and 200 K, where the transfer of energy between kinetic and internal degrees of freedom is expected to be most inhibited, the correlation seems to exaggerate this effect, and the calculated values of fint and hence the thermal conductivity may be too small. Thus, at temperatures below 200 K, where the vapor pressure is about 0.2 MPa, the correlation could give errors in excess of 10%. In the range 200 to 350 K, the uncertainty in the correlation is about 3%, and between 350 K and 600 K we estimate the uncertainty as 4%.
Additional measurements, especially at low temperatures and with sufficient isothermal data to permit extrapolation to zero density, could help improve the correlation and might justify a more elaborate expression for /int than the 2-parameter expression given in Eq. (14).
For higher pressures, the thermal conductivity has contributions from its dilute gas limit, Eq. (13), and the critical enhancement, Eq. (18), as well as from the excess function of Eq. (17). The critical enhancement is shown along isotherms in Fig. 23; the experimental points in the figure were obtained from the original data by subtracting the dilute gas and excess contributions and adjusting the data to lie along true isotherms as indicated. Our correlation gives a reasonable description of the enhancement throughout the range of the data. As indicated above, the distinction between the excess and enhance-
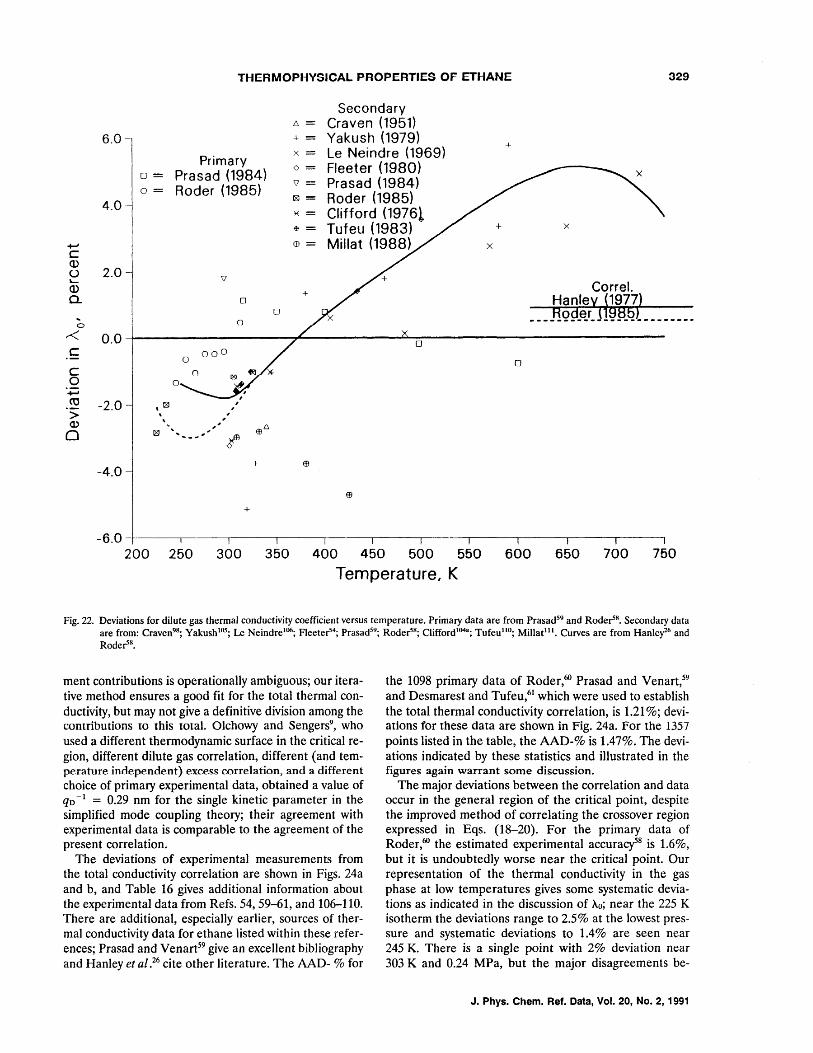
THERMOPHYSICAL PROPERTIES OF ETHANE 329
Secondary 6= Craven (1951)
6.0 += Yakush (1979) +
Primary X= Le Neindre (1969) 0= Fleeter (1980)
0= Prasad (1984) x
Roder (1985) \]= Prasad (1984)
0=
4.0 Il'l= Roder (1985) x= Clifford (1976l
Tufeu (1983) $= + x
+-' ffi= Millat (1988) x c (l)
2.0 () \] + ~
Q) + Correl. a. 0 Hanley r977)
0
~ 0 ___ J!QftEtr_J_~~t~t _______ •
r< 0.0 0 c 00 0
0 0 C n
L"'J <IJ:l x-
0 0 .~
co -2.0 , Il'l
> , , (l.) " , .. ,
ffiD 0 Il'l
.. , , ... _ .... '
~ +
-4.0
+
-6.0 I I I I I
200 250 300 350 400 450 500 550 600 650 700 750
Temperature, K
Fig. 22. Deviations for dilute gas thermal conductivity coefficient versus temperature. Primary data are from Prasad59 and Roder5!!. Secondary data are from: Craven9!!; Yakush105; Le NeindrelOti; Fleete~4; Prasad59
; Rode~!!; Clifford1043; Tufeullo; MilIatlll • Curves are from HanleyZti and
Roder5!!.
ment contributions is operationally ambiguous; our iterative method ensures a good fit for the total thermal conductivity, but may not give a definitive division among the contributions to this total. Olchowy and Sengers9
, who used a different thermodynamic surface in the critical region, different dilute gas correlation, different (and temperature independent) excess correlation, and a different choice of primary experimental data, obtained a value of qo -1 = 0.29 nm for the single kinetic parameter in the simplified mode coupling theory; their agreement with experimental data is comparable to the agreement of the present correlation.
The deviations of experimental measurements from the total conductivity correlation are shown in Figs. 24a and b, and Table 16 gives additional information about the experimental data from Refs. 54, 59-61, and 106-110. There are additional, especially earlier, sources of thermal conductivity data for ethane listed within these references; Prasad and Venart59 give an excellent bibliography and Hanley et al.26 cite other literature. The AAD- % for
the 1098 primary data of Roder/i) Prasad and Venart,59 and Desmarest and Tufeu,61 which were used to establish the total thermal conductivity correlation, is 1.21 %; deviations for these data are shown in Fig. 24a. For the 1357 points listed in the table, the AAD-% is 1.47%. The deviations indicated by these statistics and illustrated in the figures again warrant some discussion.
The major deviations between the correlation and data occur in the general region of the critical point, despite the improved method of correlating the crossover region expressed in Eqs. (18-20). For the primary data of Roder,60 the estimated experimental accuracf8 is 1.6%, but it is undoubtedly worse near the critical point. Our representation of the thermal conductivity in the gas phase at low temperatures gives some systematic deviations as indicated in the discussion of Ao; near the 225 K isotherm the deviations range to 2.5% at the lowest pressure and systematic deviations to 1.4% are seen near 245 K. There is a single point with 2% deviation near 303 K and 0.24 MPa, but the major disagreements be-
J. Phys. Chern. Ref. Data, Vol. 20, No.2, 1991
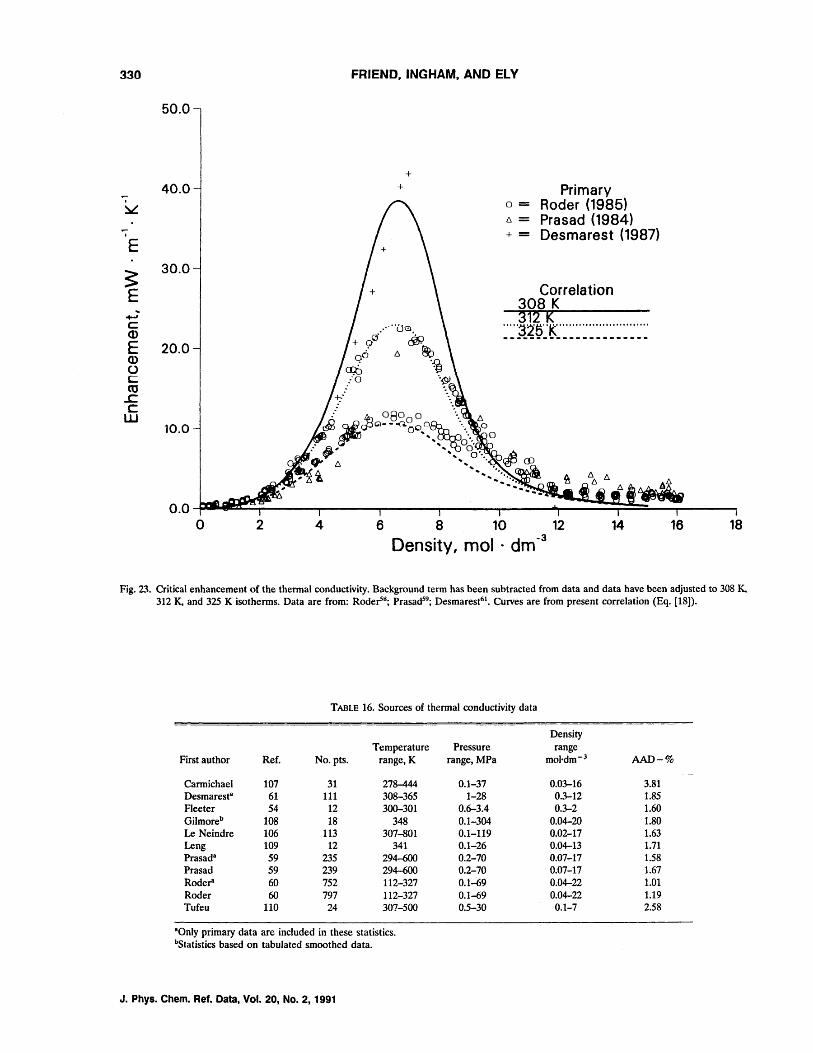
330 FRIEND, INGHAM, AND ELY
50.0
+ 40.0 + Primary
"7 0= Roder (1985) ~ 6.= Prasad (1984)
"7 += Desmarest (1987) E
~ 30.0
Correlation E 308 K +oJ 312 K c:
~~~~Q~~~~~~~~~~~~~~~~ (I)
E 20.0 (I) (J c: co
..c. c: w
10.0
o 2 4 6 8 10 12 14 16 18
Density, mol . dm-3
Fig. 23. Critical enhancement of the thermal conductivity. Background term has been subtracted from data and data have been adjusted to 308 K, 312 K, and 325 K isotherms. Data are from: Roder!!; Prasad59
; Desmarest61• Curves are from present correlation (Eq. [18]).
TABLE 16. Sources of thermal conductivity data
Density Temperature Pressure range
First author Ref. No. pts. range, K range, MPa mol·dm-3 AAD-% - -- -- -- -- --
Carmichael 107 31 278-444 0.1-37 0.03-16 3.81 Desmaresta 61 111 308-365 1-28 0.3-12 1.85 Fleeter 54 12 300-301 0.6-3.4 0.3-2 1.60 Gilmoreb 108 18 348 0.1-304 0.04-20 1.80 Le Neindre 106 113 307-801 0.1-119 0.02-17 1.63 Leng 109 12 341 0.1-26 0.04-13 1.71 Prasada 59 235 294-600 0.2-70 0.07-17 1.58 Prasad 59 239 294-600 0.2-70 0.07-17 1.67 RoderB 60 752 112-327 0.1-69 0.04-22 1.01 Roder 60 797 112-327 0.1-69 0.04-22 1.19 Tufeu 110 24 307-500 0.5-30 0.1-7 2.58
BOnly primary data are included in these statistics. bStatistics based on tabulated smoothed data.
J. Phys. Chern. Ref. Data, Vol. 20, No.2, 1991
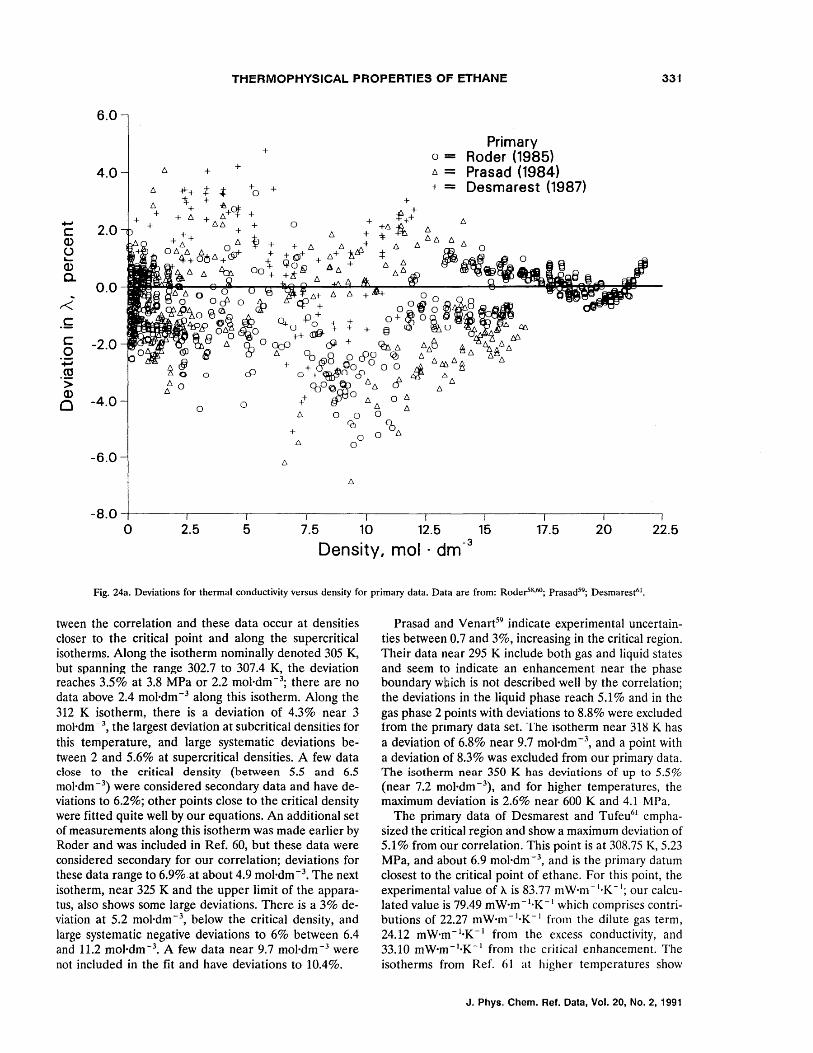
THERMOPHYSICAL PROPERTIES OF ETHANE 331
+-' C Q) U ~
Q)
0.
6.0
4.0
2.0
0.0
-6.0
6.
6. +
+ +
6. + +
*+ 1: t -t +
!+~ + + 6. + 6.6.
+ + + + 6.
6. 0 06. 6. 8~~ (§t 4+ +
6. ~ Lm
+
+ + o
+ 6.
+
Primary o = Roder (1985) 6. = Prasad (1984) + = Desmarest (1987)
-8.0~------~----~------~------~----~------~------~----~------.
o 2.5 5 7.5 10 12.5 15 17.5 20 22.5
Density, mol· dm- 3
Fig. 24a. Deviations for thermal conductivity versus density for primary data. Data are from: Roder5H,60; Prasad59; Desmarestl\l.
tween the correlation and these data occur at densities closer to the critical point and along the supercritical isotherms. Along the isotherm nominally denoted 305 K, but spanning the range 302.7 to 307.4 K, the deviation reaches 3.5% at 3.8 MPa or 2.2 mol·dm -3; there are no data above 2.4 mol·dm -3 along this isotherm. Along the 312 K isotherm, there is a deviation of 4.3% near 3 mol·dm·· 3
, the largest deviation at subcritical densities for this temperature, and large systematic deviations between 2 and 5.6% at supercritical densities. A few data close to the critical density (between 5.5 and 6.5 mol·dm -3) were considered secondary data and have deviations to 6.2%; other points close to the critical density were fitted quite well by our equations. An additional set of measurements along this isotherm was made earlier by Roder and was included in Ref. 60, but these data were considered secondary for our correlation; deviations for these data range to 6.9%.at about 4.9 mol'dm -3. The next isotherm, near 325 K and the upper limit of the apparatus, also shows some large deviations. There is a 3% deviation at 5.2 mol·dm- 3
, below the critical density, and large systematic negative deviations to 6% between 6.4 and 11.2 mo}·dm-3• A few data near 9.7 mo}·dm- 3 were not included in the fit and have deviations to 10.4%.
Prasad and Venart59 indicate experimental uncertainties between 0.7 and 3%, increasing in the critical region. Their data near 295 K include both gas and liquid states and seem to indicate an enhancement near the phase boundary wbich is not described well by the correlation; the deviations in the liquid phase reach 5.1 % and in the gas phase 2 points with deviations to 8.8% were excluded from the primary data set. The isotherm near 31S K has a deviation of 6.8% near 9.7 mol'dm-3, and a point with a deviation of 8.3% was excluded from our primary data. The isotherm near 350 K has deviations of up to 5.5% (near 7.2 mol·dm -3), and for higher temperatures, the maximum deviation is 2.6% near 600 K and 4.1 MPa.
The primary data of Desmarest and Tufeu61 emphasized the critical region and show a maximum deviation of 5.1 % from our correlation. This point is at 308.75 K, 5.23 MPa, and about 6.9 mol·dm- 3
, and is the primary datum closest to the critical point of ethane. For this point, the experimental value of A is 83.77 mW·m-I·K- 1
; our calculated value is 79.49 mW·m-1·K- 1 which comprises contributions of 22.27 mW·m-1·K- 1 from the dilute gas term, 24.12 mW'm-1'K- 1 from the excess conductivity, and 33.10 mW·m-1·K- 1 from the critical enhancement. The isotherms from Ref. 61 at higher temperatures show
J. Phys. Chern. Ref. Data, Vol. 20, No.2, 1991
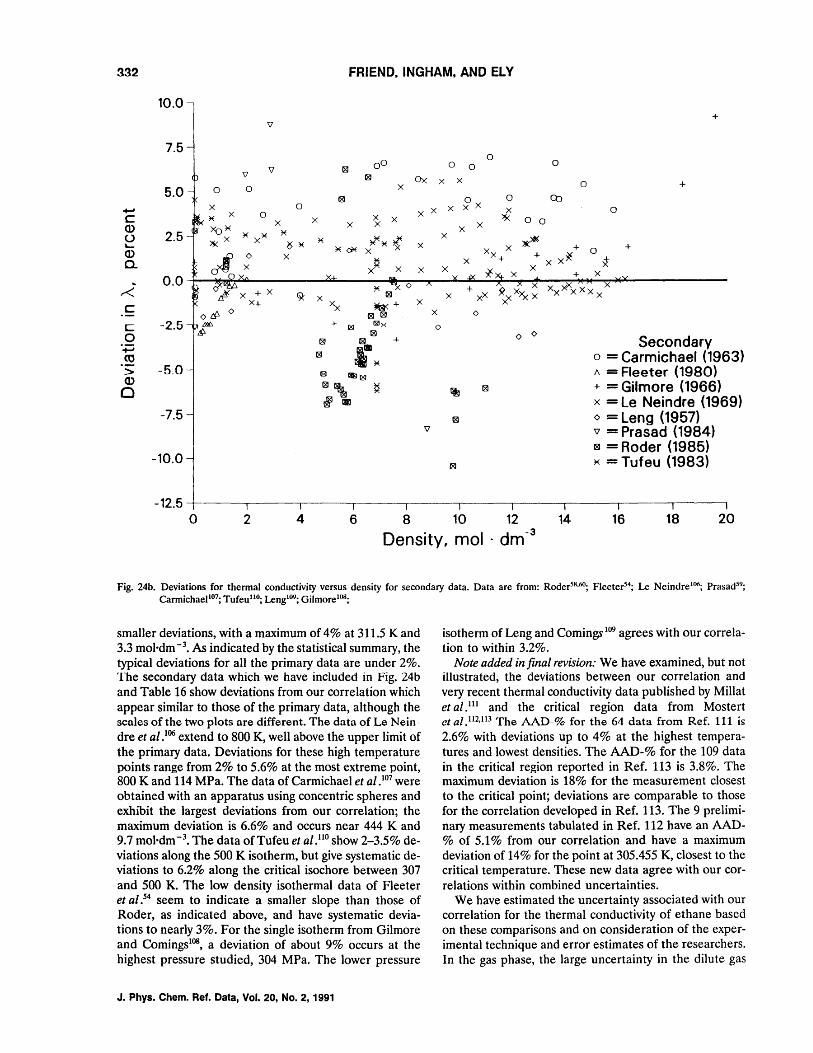
332 FRIEND. INGHAM. AND ELY
10.0 +
7.5 00
0 0
\J ~ 0 0
\J ~ Ox x x 0 x 0 +
5.0 ~ Jx 0 OJ
+-' 0 X X X 0
C 0 x x x * x x o 0
Q) x x x x 2.5 )«
() ~ x)« ~ ~)«~
x ~ ~ 6 ~
)«~ x x + + Q) x xx+ +
x x* 0 x ~ 0. J x
x x x x -1: x
0.0 x + x
<> x Xx xXx Xx x ,.<. x + x ~ ~ + ~X,?>x x ~ XXx X xX
x+ ~+ X C
~ ~ X <>
c:.: -2.5 ..J-j2g !l/Ix <>
0 ~ <> <> Secondary ~ ~ + '+J ~.)« .S! ~ o = Carmichael (1963) > -5_0 ~ ~t83 ~ = Fleeter (1980> Q)
~'\ ~ + = Gilmore (1966) 0 '" ~
~ 1:12 x = Le Neindre (1969) -7.5 ~ <> = Leng (1957)
\J \J = Prasad (1984) ~ = Roder (1985)
-10.0 ~ = Tufeu (1983)
-12.5 I I I I I I I I I 0 2 4 6 8 10 12 14 16 18 20
Density, mol . dm -3
Fig. 24b. Deviations for thermal conductivity versus density for secondary data. Data are from: Roderll,60; Fleeter4; Le Neindre106
; Prasad59;
Carmichael107; TufeullO
; Leng109; GilmorelOlI
;
smaller deviations, with a maximum of 4% at 311.5 K and 3.3 mol·dm-3
• As indicated by the statistical summary, the typical deviations for all the primary data are under 2%. The secondary data which we have included in Fig. 24b and Table 16 show deviations from our correlation which appear similar to those of the primary data, although the scales of the two plots are different. The data of Le Neindre et al.106 extend to 800 K, well above the upper limit of the primary data. Deviations for these high temperature points range from 2% to 5.6% at the most extreme point, 800 K and 114 MPa. The data of Carmichael et al. lo7 were obtained with an apparatus using concentric spheres and exhibit the largest deviations from our correlation; the maximum deviation is 6.6% and occurs near 444 K and 9.7 mol·dm-3
• The data of Tufeu et al. l1O show 2-3.5% deviations along the 500 K isotherm, but give systematic deviations to 6.2% along the critical isochore between 307 and 500 K. The low density isothermal data of Fleeter et al.54 seem to indicate a smaller slope than those of Roder, as indicated above, and have systematic deviations to nearly 3%. For the single isotherm from Gilmore and ComingslOS
, a deviation of about 9% occurs at the highest pressure studied, 304 MPa. The lower pressure
J. Phys. Chem. Ref. Data, Vol. 20, No.2, 1991
isotherm of Leng and Cominy 109 agrees with our correlation to within 3.2%.
Note added in final revision: We have examined, but not illustrated, the deviations between our correlation and very recent thermal conductivity data published by MiHat et al. lll and the critical region data from Mostert ct al.l12,m The AAD-% for the 64 data from Ref. 111 is 2.6% with deviations up to 4% at the highest temperatures and lowest densities. The AAD-% for the 109 data in the critical region reported in Ref. 113 is 3.8%. The maximum deviation is 18% for the measurement closest to the critical point; deviations are comparable to those for the correlation developed in Ref. 113. The 9 preliminary measurements tabulated in Ref. 112 have an AAD% of 5.1% from our correlation and have a maximum deviation of 14% for the point at 305.455 K, closest to the critical temperature. These new data agree with our correlations within combined uncertainties.
We have estimated the uncertainty associated with our correlation for the thermal conductivity of ethane based on these comparisons and on consideration of the experimental technique and error estimates of the researchers. In the gas phase, the large uncertainty in the dilute gas
THERMOPHYSICAL PROPERTIES OF ETHANE 333
contribution certainly dominates at temperatures below 200 K; the uncertainty in the total thermal conductivity is 10% for the gas at these low temperatures. For temperatures from 200 K to Tc, the uncertainty in the gas phase thermal conductivity is about 3%. For the compressed liquid, we estimate uncertainties of 2% to the upper pressure limit of 70 MPa. The asymptotically critical region extending from 305 to 306 K with densities between 6 and 7.5 mol·dm- 3 can still give large errors; our value of the thermal conductivity at the critical point is about 1.5 kW·m-1·K- 1, not infinity. In the more general critical region bounded by 305 and 307 K from 5 to 8.5 mol·dm-3
,
we estimate the uncertainty as 10%. At supercritical temperatures, the uncertainty is 4% for densities less than 2 mol·dm -3 and 2% for higher densities. For temperatures between 307 and 360 K, and densities between 5 and 8.5 mol·dm-3
, the critical enhancement contri~ution remains substantial, and an uncertainty of 5% is estimated.
5. Conclusions
The correlations we have presented represent improved empirical algebraic representations of the thermodynamic surface and transport properties over a broad range of the fluid states of ethane. The abundance of data for this important and relatively simple molecule has enabled us to determine these correlating equations and to establish limits on their accuracy. Unfortunately, there continues to be some disagreement among experimental measurements, to the extent that data are too often inconsistent when we consider the error bounds reported by the experimenters. We have used careful, conservative judgment when deciding on the relative weights of inconsistent data, and we think that our error estimates of Sec. 4 reflect the actual uncertainties of the correlations. In certain instances, a sparsity of data or a problem with the correlating function itself causes an increase in the uncertainty of predictions based on the correlation. These problems have been discussed in Sec. 4.
Additional measurements on fluid ethane, especially in some of the problem regions and for some of the specific properties mentioned above, will further refine future correhtions. For instance, additional PIT data in the highly compressed liquid, derivative and transport data in the critical region, low temperature gas-phase viscosity measurements, and also measurements near and on both liquid and vapor phase boundaries would be extremely useful. For greatest utility in developing correlations, such measurements should adhere strictly to appropriate guidelines concerning the acquisition of primary data. Samples should be well characterized and very pure; absolute determination of all experimental quantities, traceable to relevant standards, is preferred; and the tabulation of original, unsmoothed data, with all experimental correction factors fully discussed or referenced is imperative. Theoretical advances, including improved treatment of the critical region, calculation and incorporation of precise intermolecular potential functions, and a rigorous theory of energy transfer problems for the
thermal conductivity and initial density dependences for both transport properties, will also assist in the development of future correlations.
Within the specified ranges and tolerances, these correlations will allow the user to calculate the important thermodynamic and transport properties of ethane. They should also be useful for additional studies, such as for generalized corresponding states models and mixture calculations, especially in conjunction with our previous study of methane.
6. Acknowledgments
We gratefully acknowledge support from the Standard Reference Data Program of the National Institute of Standards and Technology. We thank R.D. McCarty and R.T. Jacobsen for helpful discussions and their careful review of parts of this manuscript. We thank G.C. Straty for discussions concerning some of the experimental data and D.E. Diller for providing some data prior to their publication. We also thank B.S. Coultrip for assistance with data compilation. The anonymous reviewers selected by the Journal have provided numerous suggestions which have greatly improved this paper.
7. References
1D. G. Friend, J. F. Ely, H. Ingham, J. Phys. Chern. Ref. Data 18,583 (1989).
2D. G. Friend, J. F. Ely, H. Ingham, "Tables of the Thennophysical Properties of Methane ," National Institute of Standards and Technology, U. S., Technical Note 1325 (1989).
3D. G. Friend, 1. F. Ely, H. Ingham, "Tables of the Thennophysical Properties of Ethane ," National Institute of Standards and Technology, U. S., Technical Note, 1346, to be published.
33D. G. Friend, 1. F. Ely, H. Ingham, "Tables of Experimental Data Used for the Correlation of the Thennophysical Properties of Ethane," National Institute of Standards and Technology, U. S., Internal Report 3953, to be published.
4R. D. Goodwin, H. M. Roder, and G. C. Straty, National Bureau of Standards, U. S., Tc!;huil;;al Notc 684 (1976).
5V. V. Sychev, A. A. Vasserman, A. D. Kozlov, V. A. Zagoruchenko, G. A. Spiridonov, and V. A. Tsymarny, Thennodynamic Properties of Ethane (Hemisphere Publishing, Washington, 1987), T. B. Selover Jr., English Language Edition Ed.
6R. Schmidt and W. Wagner, Fluid Phase Equil. 19, 175 (1985). 6au. Setzmann and W. Wagner, Int. 1. Thermophys. 10, 1103 (1989). 7J. O. Hirschfelder, C. F. Curtiss, and R. B. Bird, Molecular Theory of
Gases alld Liquids (Wiley, New York, 19(7). HM. Klein, H. 1. M. Hanley, F. J. Smith, and P. Holland, Natl. Bur.
Stand. (U. S. ), Monogr. 47 (1974). 9G. A. Olchowy and J. V. Sengers, Phys. Rev. Lett. 61, 15 (1988), Int.
J. Thermophys. 10, 417 (1989) and personal communication, Univ. Maryland, Inst. Phys. Sci. and Tech., College Park, Md, 1988.
lOB. A. Younglove and J. F. Ely, J. Phys. Chern. Ref. Data 16, 577 (1987).
11J. Chao, R. C. Wilhoit, and B. J. Zwolinski, J. Phys. Chern. Ref. Data 2, 427 (1973).
12R. D. Goodwin, 1. Research Nat. Bur. Stand. 7SA, 15 (1971). 13H. J. M. Hanley and M. Klein, National Bureau of Standards, U. S.,
Technical Note 628 (1972). 14R. C. Reid, J. M. Prausnitz, and B. E. Poling, The Properties of Gases
and Liquids (McGraw-Hili, New York, 4th Ed., 1987). 143J. C. Rainwater and D. G. Friend, Phys. Rev. A 36,4062 (1987).
J. Phys. Chern. Ref. Data, Vol. 20, No.2, 1991
334 FRIEND, INGHAM, AND ELY
15J. Y. Sengers, R. S. Basu, and J. M. H. Levelt Sengers, National Aeronautics and Space Administration, U. S., NASA Contractor Report 3424 (1981).
16E. R. Cohen and B. N. Taylor, J. Research Nat. Bur. Stand. 92, 85 (1987).
17IUPAC Commission on Atomic Weights and Isotopic Abundances, Pure Appl. Chern. 60, 842 (1988).
I!1IUPAC Commission on Atomic Weights and Isotopic Abundances, Pure Appl. Chern. 52, 2349 (1980).
19F. Pavese, J. Chern. Thermodynamics 10, 369 (1978). 20R. E. Bedford, G. Bonnier, H. Maas, and F. Pavese, Metrologia 20,
145 (1984). 21G. C. Straty and R. Tsumura, J. Chern. Phys. 64, 859 (1976). 22D. R. Douslin and R. H. Harrison, J. Chern. Thermodynamics 5,491
(1973). 23J. Y. Sengers, personal communication, Univ. Maryland, Inst. Phys.
Sci. and Tech., College Park, Md, 1988. 24H. J. Strumpf, A. F. Collings, and C. J. Pings, J. Chern. Phys. 60,3109
(1974). 248M. Burton and D. Balzarini, Canad. J. Phys. 52, 2011 (1974). 24bF. J. Wegner, Phys. Rev. B 5, 4529 (1972). 24cM. W. Pestak, R. E. Goldstein, M. H. W. Chan, J. R. de Bruyn, D.
Balzarini, and N. W. Ashcroft, Phys. Rev. B 36, 599 (1987). 1SL. J. Van Poolen, R. T Jacobsen, and M. Jahangiri, Int. J. Thermo
phys. 7, 513 (1986). 26H. J. M. Hanley, K. E. Gubbins, and S. Murad, J. Phys. Chern. Ref.
Data, 6, 1167 (1977). 27A. Boushehri, J. Bzowski, J. Kestin, and E. Mason, J. Phys. Chern.
Ref. Data 16, 445 (1987). 2l!F. M. Mourits and F. H. Rummens, Canad. J. Chern. 55, 3007 (1977). 29D. D. Wagman, W. H. Evans, Y. B. Parker, R. H. Schumm, I. Halow,
S. M. Bailey, K. L. Churney, and R. L. Nuttall, J. Phys. Chern. Ref. Data 11, Sup. 2 (1982).
30K. M Pamidimukkala, D. Rogers, and G. B. Skinner, J. Phys. Chern. Ref. Data 11, 83 (1982).
30aTRC Thermodynamic Tables-Hydrocarbons, Tables 23-3-1. 200 r-x, pp. 1350 r-x,Thermodynamics Research Center, Texas A&M University, College Station, TX (Oct. 31, 1985).
31A. K. Pal, G. A. Pope, Y. Arai, N. F. Carnahan, and R. Kobayashi, J. Chern. Eng. Data 21, 394 (1976); unsmoothed data of Pal reported in Ref. [32] were preferentially used; additional very small corrections based on personal communication (ca. 1976) were also applied. The complete set of data used is reported in Ref. [3].
32G. A. Pope, Ph. D. Thesis (Dept. Chern. Eng. ), Rice University (1971).
33W. T. Ziegler, B. S. Kirk, J. C. Mullins, and A. R. Berquist, Tech. Report No.2, Proj. A-764, Eng. Expt. Sta., Georgia Inst. Tech., Atlanta, GA (Dec. 1964); the data were used as adjusted in Ref. [4].
34G. C. Straty and R. Tsumura, J. Research Nat. Bur. Stand. 80A, 35 (1976).
35p. Sliwinski, Z. Phys. Chern. Neue Folge 63, 263 (1969). :l(,C. H. Chui and F. B. Canfield, Trans. Faraday Soc. ti7, 2933 (1971);
M. Y. Shana'a and F. B. Canfield, Trans. Faraday Soc. 64, 2281 (1968).
37J. B. Rodosevich and R. C. Miller, A. I. Ch. E. J. 19, 729 (1973). 3BW. M. Haynes and M. J. Hiza, J. Chern. Thermodynamics 9, 179 (1977). 39C. R. McClune, Cryogenics 16, 289 (1976). 4OJ. E. Orrit and J. M. Laupretre, Adv. Cryo. Eng. 23, 573 (1978); J. E.
Orrit and J. F. Olives, "Density of liquefied natural gas and its components, " distributed at Fourth International Conference on Liquefied Natural Gas, Algeria (1974).
41S. L. S. Jacoby, J. S. Kowalilc, and J. T. Pizzo, Iterative Methods for Nonlinear Optimization (Prentice-Hall, Englewood Cliffs, N. J. 1972).
42A. Michels, W. Van Straaten, and J. Dawson, Physica 20, 17 (1954). 43G. A. Pope, P. S. Chappelear, and R. Kobayashi, J. Chern. Phys. 59,
423 (1973). 44H. Mansoorian, K. R. Hall, and P. T. Eubank, Proc. 7th Symp. on Ther
mophysical Properties, A. Cezairliyan, ed., Amer. Soc. Mech. Engin., New York (1977) p. 456.
45M. L. McGlashan and D. J. Potter, Proc. Roy. Soc. (London) A267, 478 (1962).
J. Phys. Chern. Ref. Data, Vol. 20, No.2, 1991
46W. R. Parrish, Fluid Phase Equil. 18, 279 (1984). 47H. M. Roder, J. Research Nat. Bur. Stand. 80A, 739 (1976). 4!lA. Furtado, Ph. D. Thesis (Dept. Chern. Eng. ), University of Michi
gan, Ann Arbor, MI (1973). 49K. Bier, J. Kunze, and G. Maurer, J. Chern. Thermodynamics 8, 857
(1976). 49aK. Bier, J. Kunze, G. Maurer, and H. Sand, J. Chern. Engin. Data 21,
5 (1976). 50R. Tsumura and G. C. Straty, Cryogenics 17, 195 (1977). Sly. E. Terres, W. Jahn, and H. Reissmann, Brennstoff-Chemie 38,129
(1957). 52J. Kestin, H. E. Khalifa, and W. A. Wakeham, J. Chern. Phys. 66,1132
(1977). 53J. Kestin, S. T. Ro, and W. A. Wakeham, Trans. Far. Soc. 67, 2308
(1971). 54R. Fleeter, J. Kestin, and W. A. Wakeham, Physica 103A, 521 (1980). sSD. E. Diller and J. M. Saber, Physica 108A, 143 (1981); and D. E.
Diller, Proc. 8th Symp. on Thermophysical Properties, J. Y. Sengers, ed., Amer. Soc. Mech. Engin., New York (1982) p. 219.
SliD. E. Diller, High Temp.-High Pressures 21, 613 (1989). 57L. T. Carmichael and B. H. Sage, J. Chern. Engin. Data 8, 94 (1963). s!lH. M. Roder and C. A. Nieto de Castro, High Temp.-High Pressures
17, 453 (1985). 59R. C. Prasad and J. E. Yenart, Int. J. Thermophys. 5, 367 (1984). 6OH. M. Roder, National Bureau of Standards, U. S., Interagency Re
port, NBSIR 84-3006, (1984). 61p. Desmarest and R. Tufeu, Int. J. Thermophys. 8, 293 (1987). 62R. D. Goodwin, National Bureau of Standards, U. S., Interagency Re-
port, NBSIR 74-398, (1974). 63G. F. Carruth and R. Kobayashi, J. Chern. Engin. Data 18, 115 (1973). 64J. Regnier, J. Chimie Physique 69, 942 (1972). 65L. Djordjevich and R. A. Budenholzer, J. Chern. Engin. Data 15, 10
(1970). 66V. M. Miniovich and G. A. Sorina, Russ. J. Phys. Chern. 45, 306
(1971). 67p. T. Eubank, Adv. Cryo. Engin. 17, 270 (1971). 6IIJ. Klosek and C. McKinley, Proc. 1st Inter. Con! on LNG, Paper 22,
Chicago, (1968). 69L. C. Kahre, J. Chern. Engin. Data 18, 267 (1973). 70J. R. Tomlinson, Natural Gas Processors Association Tech. Publ. TP-
1, Tulsa, OK (1971). 71R. A. Perkins, H. M. Roder, D. G. Friend, and C. A. Nieto de Castro,
"The Thermal Conductivity and Heat Capacity of Fluid Nitrogen," Physica, to be published.
72F. Porter, J. Am. Chern. Soc. 48, 2055 (1926). 73K. Buhner, G. Maurer, and E. Bender, Cryogenics 21 157 (1981). 74A. Eucken and A. Parts, Z. Phys. Chern. B20, 184 (1933). 75J. H. Dymond and E. B. Smith, The Vinal Coefficiems of Pure Gases
and Mixtures, Clarendon Press, Oxford (1980). 76A. E. Hoover, I. Nagata, T. W. Leland, and R. Kobayashi, 1. Chern.
Phys. 48, 2633 (1968). 77R. D. Gunn, M. S. Thesis, Vnlv. Calif. (Berkeley) 19.58.
78J. A. Huff and T. M. Reed III, J. Chern. Engin. Data, 8, 306 (1963). 7~. K. Strein, R. N. Lichtenthaler, B. Schramm, and Kl. Schafer, Ber.
Bunsenges. Phys. Chern. 75, 1308 (1971). BOR. L. Powell, W. J. Hall, C. H. Hyink, L. L. Sparks, O. W. BUHls, M.
G. Scroger, and H. H. Plumb, Thermocouple Reference Tables Based on the IPTS-68, National Bureau of Standards, (u. S. ), Monograph 125 (1974).
81J. Y. Sengers and J. M. H. Levelt Sengers, Ann. Ref. Phys. Chern. 37, 189 (1986).
112J. A. Beattie, C. Hadlock, N. Poffenberger, J. Chern. Phys. 3, 93 (1935).
82aG. J. Besserer and D. B. Robinson, J. Chern. Engin. Data 18, 137 (1973).
113Ye. A. Golovskiy, E. P. Mitsevich, V. A. Tsymarnyy, "Measurement of the density of ethane at 90.24-270.21 K and at pressures to 604. 09 bar," VNIIEGazprom Dep. No. 39M USSR (1978); data have been tabulated in Ref. [5].
THERMOPHVSICAL PROPERTIES OF ETHANE 335
fWW. W. R. Law, "A continuously weighed pycnometer providing densities for CO2 + Ethane mixtures between 240 and 350 K at pressures to 35 MPa, " Ph. D. Thesis, Texas A&M University, (1986).
8sN. E. Khazanova and E. E. Sominskaya, Russ. J. Phys. Chern. 45, 87 (1971).
I16V. M. Miniovich and G. A. Sorina, Teplofiz. Svoistva Yeshchestv Mater., 6, 134 (1973).
l16aH. H. Reamer, R. H. Olds, B. H. Sage, and W. N. Lacey, Ind. Engin. Chern. 36, 957 (1944)
S7J. R. Tomlinson, "Liquid Densities of Ethane, Propane, and EthanePropane Mixtures ," Tech. Pub. TP-l, Natural Gas Processors Ass., Tulsa, OK (1971).
I!I!C. B. Wallace Jr., I. H. Silberberg, J. J. McKetta, Petrol. Refiner, Hydrocarbon Processing 43 No. 10, 177 (1964).
89'f. Miyazaki, A. V. Hejmaki, and J. E. Powers, J. Chern. Thermodynamics 12, 105 (1980).
9OR. Wiebe, K. H. Hubbard, and M. J. Brevoort, J. Am. Chern. Soc. 52, 611 (1930).
91R. K. Witt and J. D. Kemp, J. Am. Chern. Soc. 59, 273 (1937). 92E. Vangeel, Katholieke Universiteit. Leuven. Belgium, private com
munication to D. Diller, NIST., (1974); data were tabulated in Table 17 of Ref. [4].
93G. R. Poole and R. A. Aziz, Can. J. Phys. 50, 721 (1972). 94y. M. Trautz and K. G. Sorg, Ann. Phys. 10,81 (1931). 9Sy. Abe, J. Kestin, and H. E. Khalifa and W. A. Wakeham, Physica
93A, 155 (1978). 96H. Iwasaki and M. Takahashi, J. Chern. Phys. 74, 1930 (1981). 97A. G. De Rocco and J. O. Halford, J. Chern. Phys. 28, 1152 (1958). 98p. M. Craven and J. D. Lambert, Proc. Roy. Soc. 205A, 439 (1951). 99J. D. Lambert, K. J. Cotton, M. W. Pail thorpe, A. M. Robinson, J.
Scrivins, W. R. F. Yale, and R. M. Young, Proc. Roy. Soc. 231A, 280 (1955).
1OOE. Eakin, K. E. Starling, J. P. Dolan, and R. T. Ellington, J. Chern. Engin. Data 7, 33 (1962).
101y. S. Touloukian, S. C. Saxena, and P. Hesterrnans, VLScosity, Thermo-physical Properties of Matter, Vol. 11, Plenum, New York (1975).
l02J. D. Baron, J. G. Roof, and F. W. Wells, J. Chern. Engin. Data 4, 283 (1959).
103G. W. Swift, J. Lohrenz, and F. Kurata, A. I. Ch. E. J. 6, 415 (1960). 104K. Stephan and K. Lucas, VLScosity of Dense Fluids, (Plenum, N. Y.,
1979). l04sA. A. Clifford, E. Dickinson, and P. Gray, J. Chern. Soc. (London),
Faraday Trans. 172, 1997 (1976). lOSL. V. Yakush, N. A. Vanicheva, and L. S. Zaitseva, Inz.-Fiz. Zhurnal,
37, 1071 (1979); tr. in J. Eng. Phys. 37, 1071 (1979). lO6B. Le Neindre, R. Tufeu, P. Bury, P. Jahannin, and B. Vodar, in Proc.
8th Int. Con! Therm. Conduct., C. Y. Ho and R. E. Taylor, eds. (Plenum, N. Y., 1969), p. 229.
107L. T. Carmichael, V. Berry, and B. H. Sage, J. Chern. Engin. Data 8, 281 (1963).
lOST. F. Gilmore and E. W. Comings, A. I. Ch. E. J. 12, 1172 (1966). l09D. E. Leng and E. W. Comings, Ind. Engin. Chern. 49, 2042 (1957). noR. Tufeu, Y. Garrabos, and B. Le Neindre, in Proc. 16th Conf. Thenn.
Conduct., D. C. Larsen, ed. (Plenum, N. Y., 1983), p. 605. I11J. Millat, M. Ross, W. A. Wakeham, and M. Zalaf, Int. J. Thermo
phys. 9, 481 (1988). 112R. Mostert, H. R. van den Berg, and P. S. van der Gulik, Int. J. Ther
mophys. 10, 409 (1989). 1I3R. Mostert, H. R. van den Berg, P. S. van der Gulik, and J. Y. Sen
gers, J. Chern. Phys. 92, 5454 (1990).
J. Phys. Chern. Ref. Data, Vol. 20, No.2, 1991
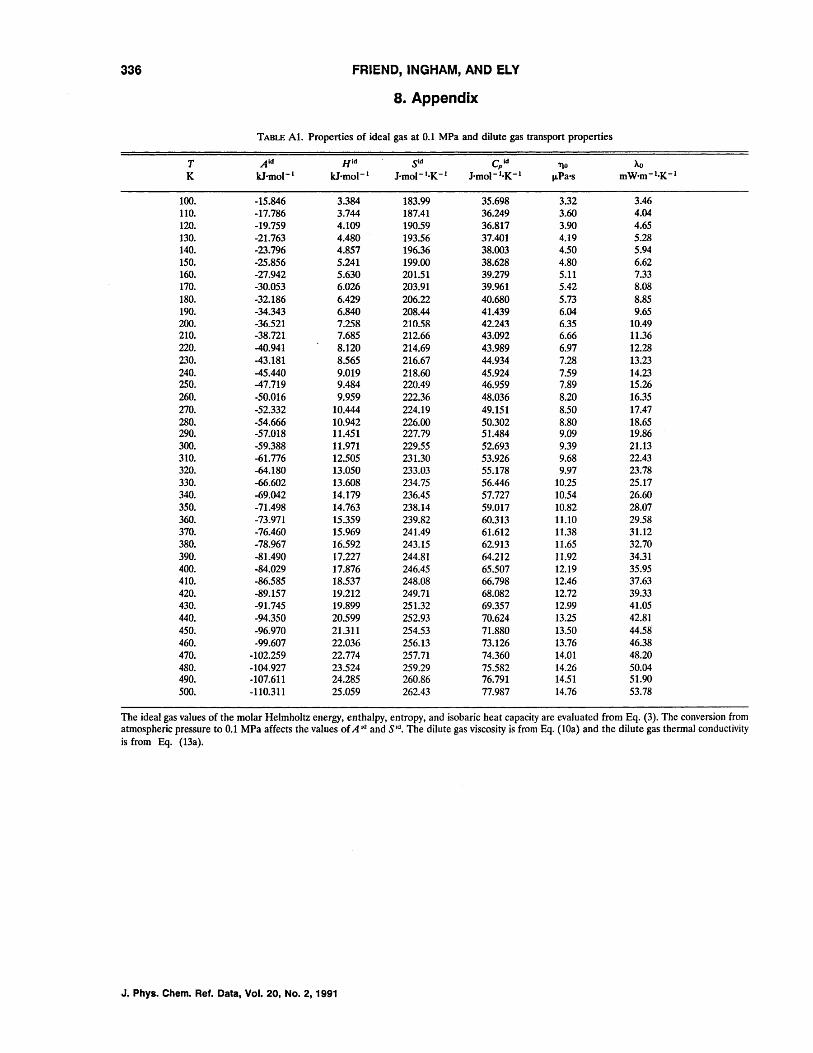
336 FRIEND, INGHAM, AND ELY
8. Appendix
TABLE AI. Properties of ideal gas at 0.1 MPa and dilute gas transport properties
T Aid Hid Sid Cpid 110 Au
K kJ'mol- 1 kJ'mol- 1 J·mol-1·K-l J·mol-1·K-l J.LPa-s mW·m-1·K-l
100. -15.846 3.384 183.99 35.698 3.32 3.46 110. -17.786 3.744 187.41 36.249 3.60 4.04 120. -19.759 4.109 190.59 36.817 3.90 4.65 130. -21.763 4.480 193.56 37.401 4.19 5.28 140. -23.796 4.857 196.36 38.003 4.50 5.94 150. -25.856 5.241 199.00 38.628 4.80 6.62 160. -27.942 5.630 201.51 39.279 5.11 7.33 170. -30.053 6.026 203.91 39.961 5.42 8.08 180. -32.186 6.429 206.22 40.680 5.73 8.85 190. -34.343 6.840 208.44 41.439 6.04 9.65 200. -36.521 7.258 21O.5R 42.243 6.35 10.49 210. -38.721 7.685 212.66 43.092 6.66 11.36 220. -40.941 8.120 214.69 43.989 6.97 12.28 230. -43.181 8.565 216.67 44.934 7.28 13.23 240. -45.440 9.019 218.60 45.924 7.59 14.23 250. -47.719 9.484 220.49 46.959 7.89 15.26 260. -50.016 9.959 222.36 48.036 8.20 16.35 270. -52.332 10.444 224.19 49.151 8.50 17.47 280. -54.666 10.942 226.00 50.302 8.80 18.65 290. -57.018 11.451 227.79 51.484 9.09 19.86 300. -59.388 11.971 229.55 52.693 9.39 21.13 310. -61.776 12.505 231.30 53.926 9.68 22.43 320. -64.180 13.050 233.03 55.178 9.97 23.78 330. -66.602 13.608 234.75 56.446 10.25 25.17 340. -69.042 14.179 236.45 57.727 10.54 26.60 350. -71.498 14.763 238.14 59.017 10.82 28.07 360. -73.971 15.359 239.82 60.313 11.10 29.58 370. -76.460 15.969 241.49 61.612 11.38 31.12 380. -78.967 16.592 243.15 62.913 11.65 32.70 390. -81.490 17.227 244.81 64.212 11.92 34.31 400. -84.029 17.876 246.45 65.507 12.19 35.95 410. -86.585 18.537 248.08 66.798 12.46 37.63 420. -89.157 19.212 249.71 68.082 12.72 39.33 430. -91.745 19.899 251.32 69.357 12.99 41.05 440. -94.350 20.599 252.93 70.624 13.25 42.81 450. -96.970 21.311 254.53 71.880 13.50 44.58 460. -99.607 22.036 256.13 73.126 13.76 46.38 470. -102.259 22.774 257.71 74.360 14.01 48.20 480. -104.927 23.524 259.29 75.582 14.26 50.04 490. -107.611 24.285 260.86 76.791 14.51 51.90 500. -110.311 25.059 262.43 77.987 14.76 53.78
The ideal gas values of the molar Helmholtz energy, enthalpy, entropy, and isobaric heat capacity are evaluated from Eq. (3). The conversion from atmospheric pressure to 0.1 MPa affects the values of A Id and Sid. The dilute gas viscosity is from Eq. (lOa) and the dilute gas thermal conductivity is from Eq. (13a).
J. Phys. Chem. Ref. Data, Vol. 20, No.2, 1991
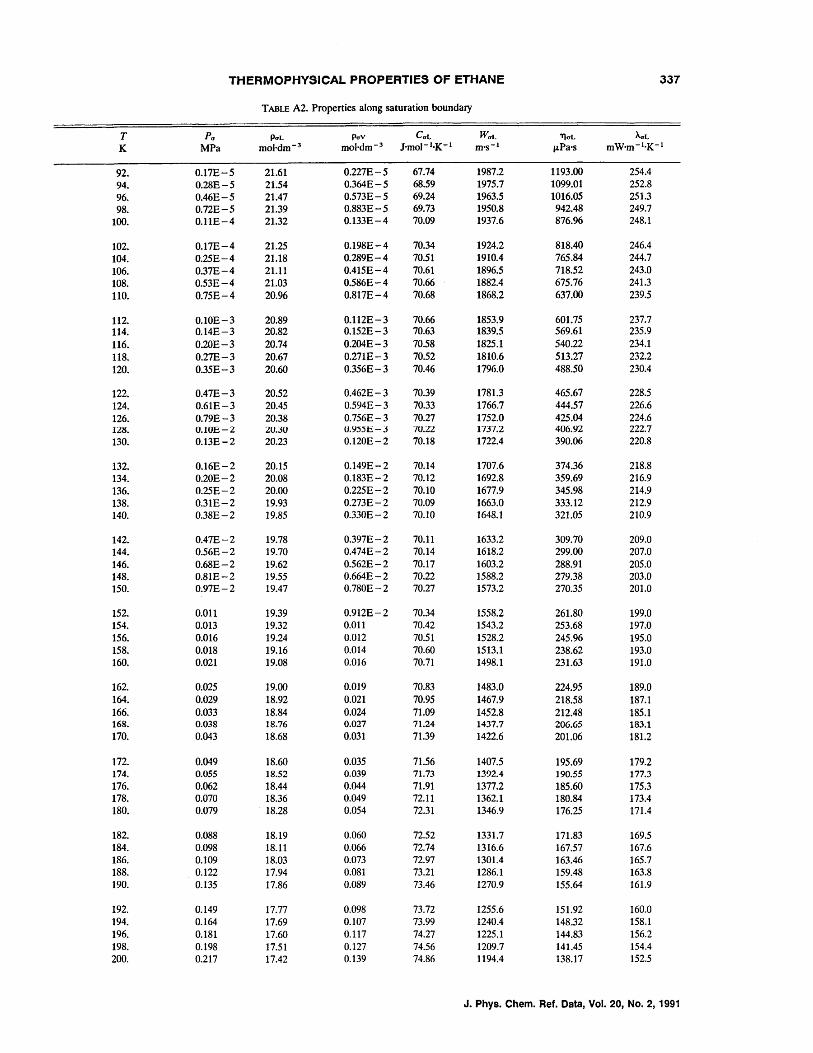
THERMOPHYSICAl PROPERTIES OF ETHANE 337
TABLE A2. Properties along saturation boundary
T Pa paL paY CaL WaL 1'JaL haL
K MPa mol·dm- 3 mol·dm- 3 J'mol-I.K -I m's- I J.LPa·s mW'm-I'K-l
92. 0.17E-5 21.61 0.227E-5 67.74 1987.2 1193.00 254.4 94. 0.28E-5 21.54 0.364E-5 68.59 1975.7 1099.01 252.8 96. 0.46E-5 21.47 0.573E-5 69.24 1963.5 1016.05 251.3 98. 0.72E-5 21.39 0.883E-5 69.73 1950.8 942.48 249.7
100. 0.l1E-4 21.32 0.133E-4 70.09 1937.6 876.96 248.1
102. 0.17E-4 21.25 0.198E-4 70.34 1924.2 818.40 246.4 104. 0.25E-4 21.18 0.289E-4 70.51 1910.4 765.84 244.7 106. 0.37E-4 21.11 0.415E-4 70.61 1896.5 718.52 243.0 108. 0.53E-4 21.03 0.586E-4 70.66 1882.4 675.76 241.3 110. 0.75E-4 20.96 0.817E-4 70.68 1868.2 637.00 239.5
112. 0.10E-3 20.89 0.112E-3 70.66 1853.9 601.75 237.7 114. 0.14E-3 20.82 0.152E-3 70.63 1839.5 569.61 235.9
116. 0.20E-3 20.74 0.204E-3 70.58 1825.1 540.22 234.1 118. 0.27E-3 20.67 0.271E-3 70.52 1810.6 513.27 232.2 120. 0.35E-3 20.60 0.356E-3 70.46 1796.0 488.50 230.4
122. 0.47E-3 20.52 0.462E-3 70.39 1781.3 465.67 228.5 124. 0.61E-3 20.45 0.594E-3 70.33 1766.7 444.57 226.6 126. 0.79E-3 20.38 0.756E-3 70.27 1752.0 425.04 224.6 128. O.lOE-2 :OW.3U U.Y55E-3 7U.22 1737.2 406.92 222.7 130. 0.13E-2 20.23 0.120E-2 70.18 1722.4 390.06 220.8
132. 0.16E-2 20.15 0.149E-2 70.14 1707.6 374.36 218.8 134. 0.20E-2 20.08 0.183E-2 70.12 1692.8 359.69 216.9 136. 0.25E-2 20.00 0.225E-2 70.10 1677.9 345.98 214.9 138. 0.31E-2 19.93 0.273E-2 70.09 1663.0 333.12 212.9 140. 0.38E-2 19.85 0.330E-2 70.10 1648.1 321.05 210.9
142. 0.47E-2 19.78 0.397E-2 70.11 1633.2 309.70 209.0 144. 0.56E-2 19.70 0.474E-2 70.14 1618.2 299.00 207.0 146. 0.68E-2 19.62 0.562E-2 70.17 1603.2 288.91 205.0 148. 0.81E-2 19.55 0.664E-2 70.22 1588.2 279.38 203.0 150. 0.97E-2 19.47 0.780E-2 70.27 1573.2 270.35 201.0
152. 0.011 19.39 0.912E-2 70.34 1558.2 261.80 199.0 154. 0.013 19.32 0.011 70.42 1543.2 253.68 197.0 156. 0.016 19.24 0.012 70.51 1528.2 245.96 195.0 158. 0.018 19.16 0.014 70.60 1513.1 238.62 193.0 160. 0.021 19.08 0.016 70.71 1498.1 231.63 191.0
162. 0.025 19.00 0.019 70.83 1483.0 224.95 189.0 164. 0.029 18.92 0.021 70.95 1467.9 218.58 187.1 166. 0.033 18.84 0.024 71.09 1452.8 212.48 185.1 168. 0.038 18.76 0.027 71.24 1437.7 206.65 183.1 170. 0.043 18.68 0.031 71.39 1422.6 201.06 181.2
172. 0.049 18.60 0.035 71.56 1407.5 195.69 179.2 174. 0.055 18.52 0.039 71.73 1392.4 190.55 177.3 176. 0.062 18.44 0.044 71.91 1377.2 185.60 175.3 178. 0.070 18.36 0.049 72.11 1362.1 180.84 173.4 180. 0.079 18.28 0.054 72.31 1346.9 176.25 171.4
182. 0.088 18.19 0.060 72.52 1331.7 171.83 169.5 184. 0.098 18.11 0.066 72.74 1316.6 167.57 167.6 186. 0.109 18.03 0.073 72.97 1301.4 163.46 165.7 188. 0.122 17.94 0.081 73.21 1286.1 159.48 163.8 190. 0.135 17.86 0.089 73.46 1270.9 155.64 161.9
192. 0.149 17.77 0.098 73.72 1255.6 151.92 160.0 194. 0.164 17.69 0.107 73.99 1240.4 148.32 158.1 196. 0.181 17.60 0.117 74.27 1225.1 144.83 156.2 198. 0.198 17.51 0.127 74.56 1209.7 141.45 154.4 200. 0.217 17.42 0.139 74.86 1194.4 138.17 152.5
J. Phys. Chem. Ref. Data, Vol. 20, No.2, 1991
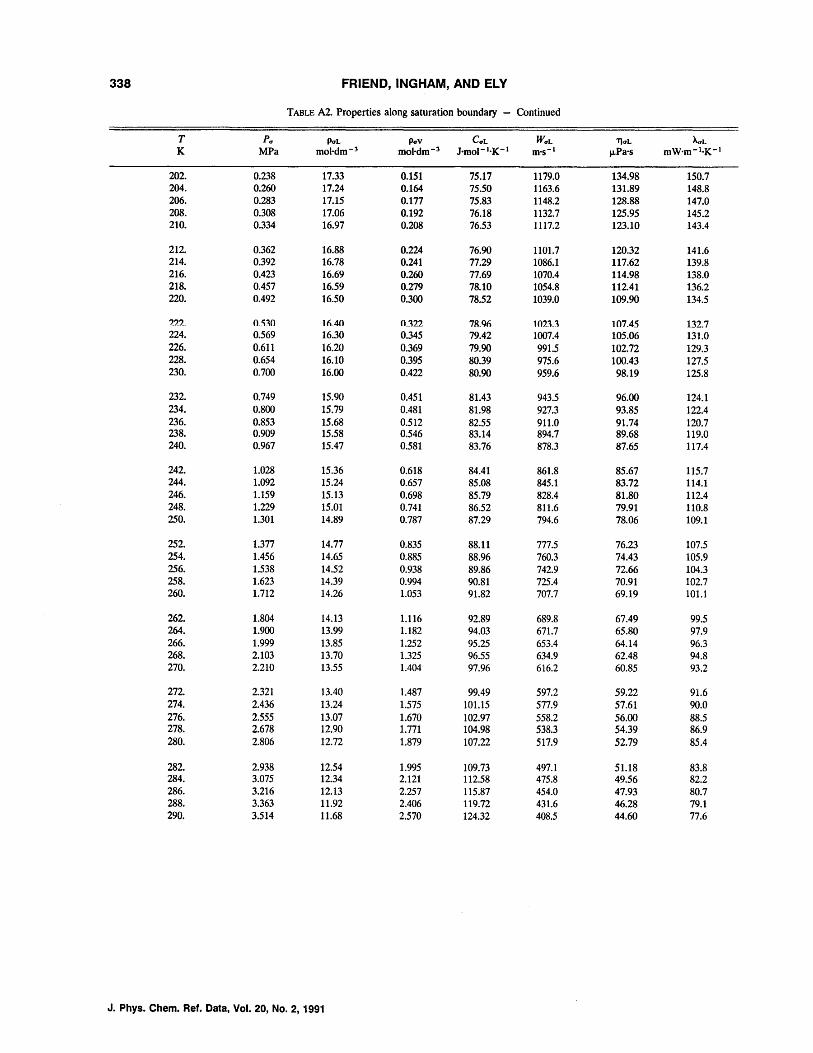
338 FRIEND, INGHAM, AND ELY
TABLE A2. Properties along saturation boundary - Continued
T Pa paL paV CaL WaL T\aL haL
K MPa mol·dm- 3 mol·dm- 3 ]·mol-1·K-l m's- 1 J.LPa·s mW·m-1·K-l
202. 0.238 17.33 0.151 75.17 1179.0 134.98 150.7 204. 0.260 17.24 0.164 75.50 1163.6 131.89 148.8 206. 0.283 17.15 0.177 75.83 1148.2 128.88 147.0 208. 0.308 17.06 0.192 76.18 1132.7 125.95 145.2 210. 0.334 16.97 0.208 76.53 1117.2 123.10 143.4
212. 0.362 16.88 0.224 76.90 1101.7 120.32 141.6 214. 0.392 16.78 0.241 77.29 1086.1 117.62 139.8 216. 0.423 16.69 0.260 77.69 1070.4 114.98 138.0 218. 0.457 16.59 0.279 78.10 1054.8 112.41 136.2 220. 0.492 16.50 0.300 78.52 1039.0 109.90 134.5
?'n._ o,,~o In_40 W~22 7KQn 1021_3 107.45 132.7 224. 0.569 16.30 0.345 79.42 1007.4 105.06 131.0 226. 0.611 16.20 0.369 79.90 991.5 102.72 129.3 228. 0.654 16.10 0.395 80.39 975.6 100.43 127.5 230. 0.700 16.00 0.422 SO.9O 959.6 98.19 125.8
232. 0.749 15.90 0.451 81.43 943.5 96.00 124.1 234. 0.800 15.79 0.481 81.98 927.3 93.85 122.4 236. 0.853 15.68 0.512 82.55 911.0 91.74 120.7 238. 0.909 15.58 0.546 83.14 894.7 89.68 119.0 240. 0.967 15.47 0.581 83.76 878.3 87.65 117.4
242. 1.028 15.36 0.618 84.41 861.8 85.67 115.7 244. 1.092 15.24 0.657 85.08 845.1 83.72 114.1 246. 1.159 15.13 0.698 85.79 828.4 81.80 112.4 248. 1.229 15.01 0.741 86.52 811.6 79.91 110.8 250. 1.301 14.89 0.787 87.29 794.6 78.06 109.1
252. 1.377 14.77 0.835 88.11 777.5 76.23 107.5 254. 1.456 14.65 0.885 88.96 760.3 74.43 105.9 256. 1.538 14.52 0.938 89.86 742.9 72.66 104.3 258. 1.623 14.39 0.994 90.81 725.4 70.91 102.7 260. 1.712 14.26 1.053 91.82 707.7 69.19 101.1
262. 1.804 14.13 1.116 92.89 689.8 67.49 99.5 264. 1.900 13.99 1.182 94.03 671.7 65.80 97.9 266. 1.999 13.85 1.252 95.25 653.4 64.14 96.3 268. 2.103 13.70 1.325 96.55 634.9 62.48 94.8 270. 2.210 13.55 1.404 97.96 616.2 60.85 93.2
272. 2.321 13.40 1.487 99.49 597.2 59.22 91.6 274. 2.436 13.24 1.575 101.15 577.9 57.61 90.0 276. 2.555 13.07 1.670 102.97 558.2 56.00 88.5 278. 2.678 12.90 1.771 104.98 538.3 54.39 86.9 280. 2.806 12.72 1.879 107.22 517.9 52.79 85.4
282. 2.938 12.54 1.995 109.73 497.1 51.18 83.8 284. 3.075 12.34 2.121 112.58 475.8 49.56 82.2 286. 3.216 12.13 2.257 115.87 454.0 47.93 80.7 288. 3.363 11.92 2.406 119.72 431.6 46.28 79.1 290. 3.514 11.68 2.570 124.32 408.5 44.60 77.6
J. Phys. Chern. Ref. Data, Vol. 20, No.2, 1991
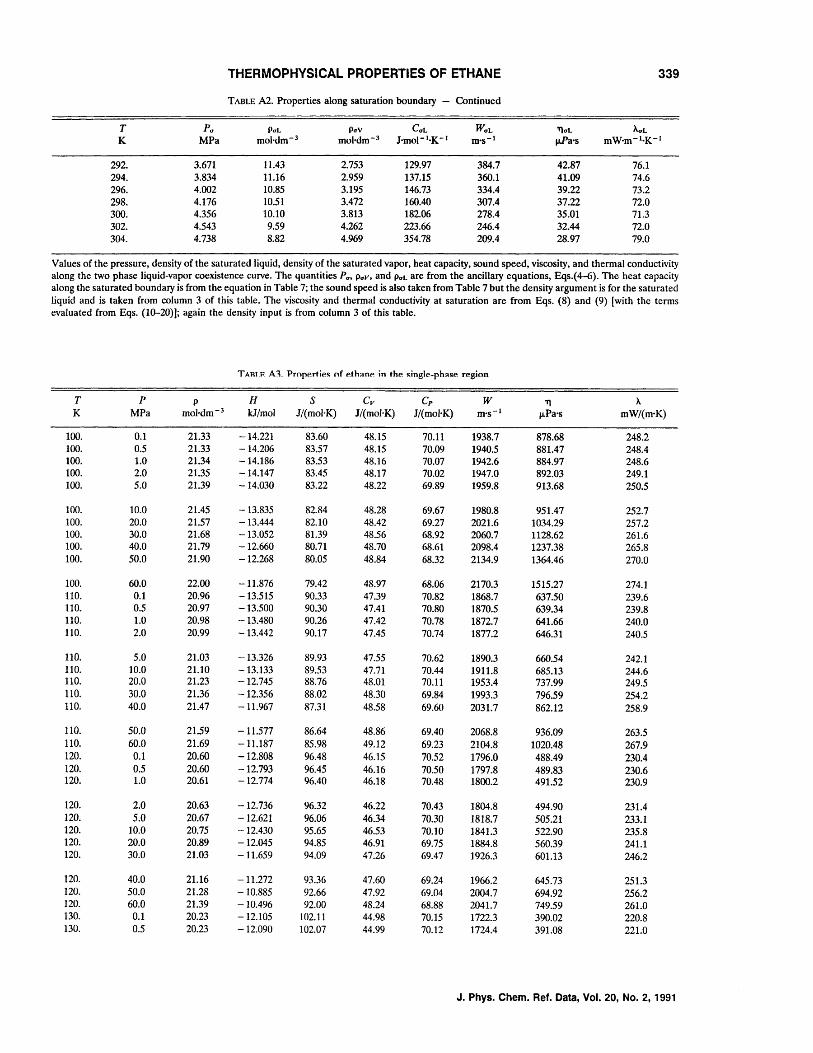
THERMOPHYSICAL PROPERTIES OF ETHANE 339
TABLE Al. Properties along saturation boundary - Continued
T Pa paL PaY CaL WaL TJaL AaL K MPa mol·dm- 3 mol·dm- 3 J·mol-1·K-l m's-1 ~a's mW·m-1·K-l
292. 3.671 11.43 2.753 129.97 384.7 42.87 76.1 294. 3.834 11.16 2.959 137.15 360.1 41.09 74.6 296. 4.002 10.85 3.195 146.73 334.4 39.22 73.2 298. 4.176 10.51 3.472 160.40 307.4 37.22 72.0 300. 4.356 10.10 3.813 182.06 278.4 35.01 71.3 302. 4.543 9.59 4.262 223.66 246.4 32.44 72.0 304. 4.738 8.82 4.969 354.78 209.4 28.97 79.0
Values of the pressure, density of the saturated liquid, density of the saturated vapor, heat capacity, sound speed, viscosity, and thermal conductivity along the two phase liquid-vapor coexistence curve. The quantities Pa , paY, and paL are from the ancillary equations, Eqs.(4-6). The heat capacity along the saturated boundary is from the equation in Table 7; the sound speed is also taken from Table 7 but the density argument is for the saturated liquid and is taken from column 3 of this table. The viscosity and thermal conductivity at saturation are from Eqs. (8) and (9) [with the terms evaluated from Eqs. (10-20)]; again the density input is from column 3 of this table.
TARIP A1~ Profl~rti~~ of p.th:m~ in the ~ingle-phase region
T P P H S Cv Cp W TJ A K MPa moI-dm- 3 kJ/mol J/(mo}·K) J/(mol'K) J/(mol'K) m's- 1 J,LPa's mW/(m'K)
100. 0.1 21.33 -14.221 83.60 48.15 70.11 1938.7 878.68 248.2 100. 0.5 21.33 -14.206 83.57 48.15 70.09 1940.5 881.47 248.4 100. 1.0 21.34 -14.186 83.53 48.16 70.07 1942.6 884.97 248.6 100. 2.0 21.35 -14.147 83.45 48.17 70.02 1947.0 892.03 249.1 100. 5.0 21.39 -14.030 83.22 48.22 69.89 1959.8 913.68 250.5
100. 10.0 21.45 -13.835 82.84 48.28 69.67 1980.8 951.47 252.7 100. 20.0 21.57 -13.444 82.10 48.42 69.27 2021.6 1034.29 257.2 100. 30.0 21.68 -13.052 81.39 48.56 68.92 2060.7 1128.62 261.6 100. 40.0 21.79 -12.660 80.71 48.70 68.61 2098.4 1237.38 265.8 100. 50.0 21.90 -12.268 80.05 48.84 68.32 2134.9 1364.46 270.0
100. 60.0 22.00 -11.876 79.42 48.97 68.06 2170.3 1515.27 274.1 110. 0.1 20.96 -13.515 90.33 47.39 70.82 1868.7 637.50 239.6 110. 0.5 20.97 -13.500 90.30 47.41 70.80 1870.5 639.34 239.8 110. 1.0 20.98 -13.480 90.26 47.42 70.78 1872.7 641.66 240.0 110. 2.0 20.99 -13.442 90.17 47.45 70.74 1877.2 646.31 240.5
110. 5.0 21.03 -13.326 89.93 47.55 70.62 1890.3 660.54 242.1 110. 10.0 21.10 -13.133 89.53 47.71 70.44 1911.8 685.13 244.6 110. 20.0 21.23 -12.745 88.76 48.01 70.11 1953.4 737.99 249.5 110. 30.0 21.36 -12.356 88.02 48.30 69.84 1993.3 796.59 254.2 110. 40.0 21.47 -11.967 87.31 48.58 69.60 2031.7 862.12 258.9
110. 50.0 21.59 11.577 86.64 48.86 69.40 2068.8 936.09 263.5 110. 60.0 21.69 -11.187 85.98 49.12 69.23 2104.8 1020.48 267.9 120. 0.1 20.60 -12.808 96.48 46.15 70.52 1796.0 488.49 230.4 120. 0.5 20.60 12.793 96.45 46.16 70.50 1797.8 489.83 230.6 120. 1.0 20.61 -12.774 96.40 46.18 70.48 1800.2 491.52 230.9
120. 2.0 20.63 -12.736 96.32 46.22 70.43 1804.8 494.90 231.4 120. 5.0 20.67 -12.621 96.06 46.34 70.30 1818.7 505.21 233.1 120. 10.0 20.75 -12.430 95.65 46.53 70.10 1841.3 522.90 235.8 120. 20.0 20.89 -12.045 94.85 46.91 69.75 1884.8 560.39 241.1 120. 30.0 21.03 -11.659 94.09 47.26 69.47 1926.3 601.13 246.2
120. 40.0 21.16 -11.272 93.36 47.60 69.24 1966.2 645.73 251.3 120. 50.0 21.28 -10.885 92.66 47.92 69.04 2004.7 694.92 256.2 120. 60.0 21.39 -10.496 92.00 48.24 68.88 2041.7 749.59 261.0 130. 0.1 20.23 -12.105 102.11 44.98 70.15 1722.3 390.02 220.8 130. 0.5 20.23 -12.090 102.07 44.99 70.12 1724.4 391.08 221.0
J. Phys. Chern. Ref. Data, Vol. 20, No.2, 1991
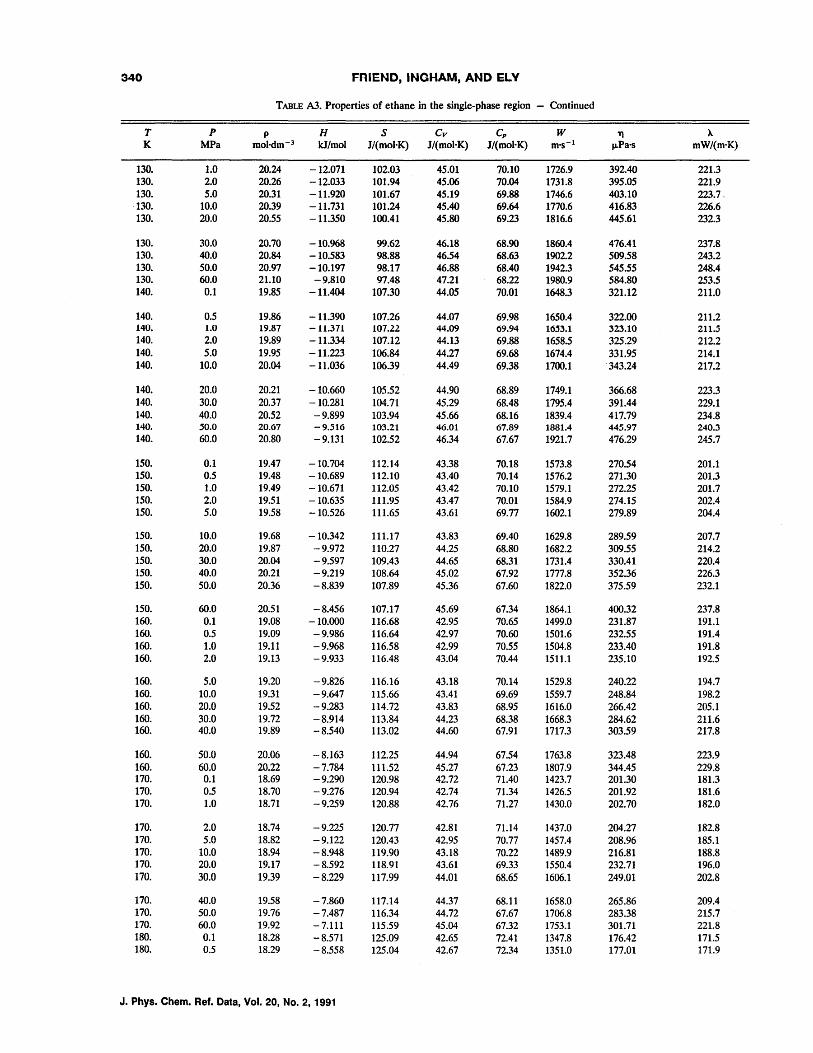
340 FRIEND, INGHAM, AND ELY
TABLE A3. Properties of ethane in the single-phase region - Continued
T p p H S Cy Cp W 1'\ ~
K MPa mol·dm-3 kJ/mol J/(mol'K) J/(mol'K) J/(mol'K) m's- 1 J.LPa·s mW/(m·K)
130. 1.0 20.24 -12.071 102.03 45.01 70.10 1726.9 392.40 221.3 130. 2.0 20.26 -12.033 101.94 45.06 70.04 1731.8 395.05 221.9 130. 5.0 20.31 -11.920 101.67 45.19 69.88 1746.6 403.10 223.7 .•
-130. 10.0 20.39 -11.731 101.24 45.40 69.64 1770.6 416.83 226.6 130. 20.0 20.55 -11.350 100.41 45.80 69.23 1816.6 445.61 232.3
130. 30.0 20.70 -10.968 99.62 46.18 68.90 1860.4 476.41 237.8 130. 40.0 20.84 -10.583 98.88 46.54 68.63 1902.2 509.58 243.2 130. 50.0 20.97 -10.197 98.17 46.88 68.40 1942.3 545.55 248.4 130. 60.0 21.10 -9.810 97.48 47.21 68.22 1980.9 584.80 253.5 140. 0.1 19.85 -11.404 107.30 44.05 70.01 1648.3 321.12 211.0
140. 0.5 19.86 -11.390 107.26 44.07 69.98 1650.4 322.00 211.2 140. 1.0 19.87 -11.371 107.22 44.09 69.94 16~3.1 323.10 211.S 140. 2.0 19.89 -11.334 107.12 44.13 69.88 1658.5 325.29 212.2 140. 5.0 19.95 -11.223 106.84 44.27 69.68 1674.4 331.95 214.1 140. 10.0 20.04 -11.036 106.39 44.49 69.38 1700.1 ·343.24 217.2
140. 20.0 20.21 -10.660 105.52 44.90 68.89 1749.1 366.68 223.3 140. 30.0 20.37 -10.281 104.71 45.29 68.48 1795.4 391.44 229.1 140. 40.0 20.52 -9.899 103.94 45.66 68.16 1839.4 417.79 234.8 140. '0.0 20.67 -9.S16 103.21 46.01 67.89 1881.4 445.97 240.3 140. 60.0 20.80 -9.131 102.52 46.34 67.67 1921.7 476.29 245.7
150. 0.1 19.47 -10.704 112.14 43.38 70.18 1573.8 270.54 201.1 150. 0.5 19.48 -10.689 112.10 43.40 70.14 1576.2 271.30 201.3 150. 1.0 19.49 -10.671 112.05 43.42 70.10 1579.1 272.25 201.7 150. 2.0 19.51 -10.635 111.95 43.47 70.01 1584.9 274.15 202.4 150. 5.0 19.58 -10.526 111.65 43.61 69.77 1602.1 279.89 204.4
150. 10.0 19.68 -10.342 111.17 43.83 69.40 1629.8 289.59 207.7 150. 20.0 19.87 -9.972 110.27 44.25 68.80 1682.2 309.55 214.2 150. 30.0 20.04 -9.597 109.43 44.65 68.31 1731.4 330.41 220.4 150. 40.0 20.21 -9.219 108.64 45.02 67.92 1777.8 352.36 226.3 150. 50.0 20.36 -8.839 107.89 45.36 67.60 1822.0 375.59 232.1
150. 60.0 20.51 -8.456 107.17 45.69 67.34 1864.1 400.32 237.8 160. 0.1 19.08 -10.000 116.68 42.95 70.65 1499.0 231.87 191.1 160. 0.5 19.09 -9.986 116.64 42.97 70.60 1501.6 232.55 191.4 160. 1.0 19.11 -9.968 116.58 42.99 70.55 1504.8 233.40 191.8 160. 2.0 19.13 -9.933 116.48 43.04 70.44 1511.1 235.10 192.5
160. 5.0 19.20 -9.826 116.16 43.18 70.14 1529.8 240.22 194.7 160. 10.0 19.31 -9.647 115.66 43.41 69.69 1559.7 248.84 198.2 160. 20.0 19.52 -9.283 114.72 43.83 68.95 1616.0 266.42 205.1 160. 30.0 19.72 -8.914 113.84 44.23 68.38 1668.3 284.62 211.6 160. 40.0 19.89 -8.540 113.02 44.60 67.91 1717.3 303.59 217.8
160. 50.0 20.06 -8.163 112.25 44.94 67.54 1763.8 323.48 223.9 160. 60.0 20.22 -7.784 111.52 45.27 67.23 1807.9 344.45 229.8 170. 0.1 18.69 -9.290 120.98 42.72 71.40 1423.7 201.30 181.3 170. 0.5 18.70 -9.276 120.94 42.74 71.34 1426.5 201.92 181.6 170. 1.0 18.71 -9.259 120.88 42.76 71.27 1430.0 202.70 182.0
170. 2.0 18.74 -9.225 120.77 42.81 71.14 1437.0 204.27 182.8 170. 5.0 18.82 -9.122 120.43 42.95 70.77 1457.4 208.96 185.1 170. 10.0 18.94 -8.948 119.90 43.18 70.22 1489.9 216.81 188.8 170. 20.0 19.17 -8.592 118.91 43.61 69.33 1550.4 232.71 196.0 170. 30.0 19.39 -8.229 117.99 44.01 68.65 1606.1 249.01 202.8
170. 40.0 19.58 -7.860 117.14 44.37 68.11 1658.0 265.86 209.4 170. 50.0 19.76 -7.487 116.34 44.72 67.67 1706.8 283.38 215.7 170. 60.0 19.92 -7.111 115.59 45.04 67.32 1753.1 301.71 221.8 180. 0.1 18.28 -8.571 125.09 42.65 72.41 1347.8 176.42 171.5 180. 0.5 18.29 -8.558 125.04 42.67 72.34 1351.0 177.01 171.9
J. Phys. Chern. Ref. Data, Vol. 20, No.2, 1991
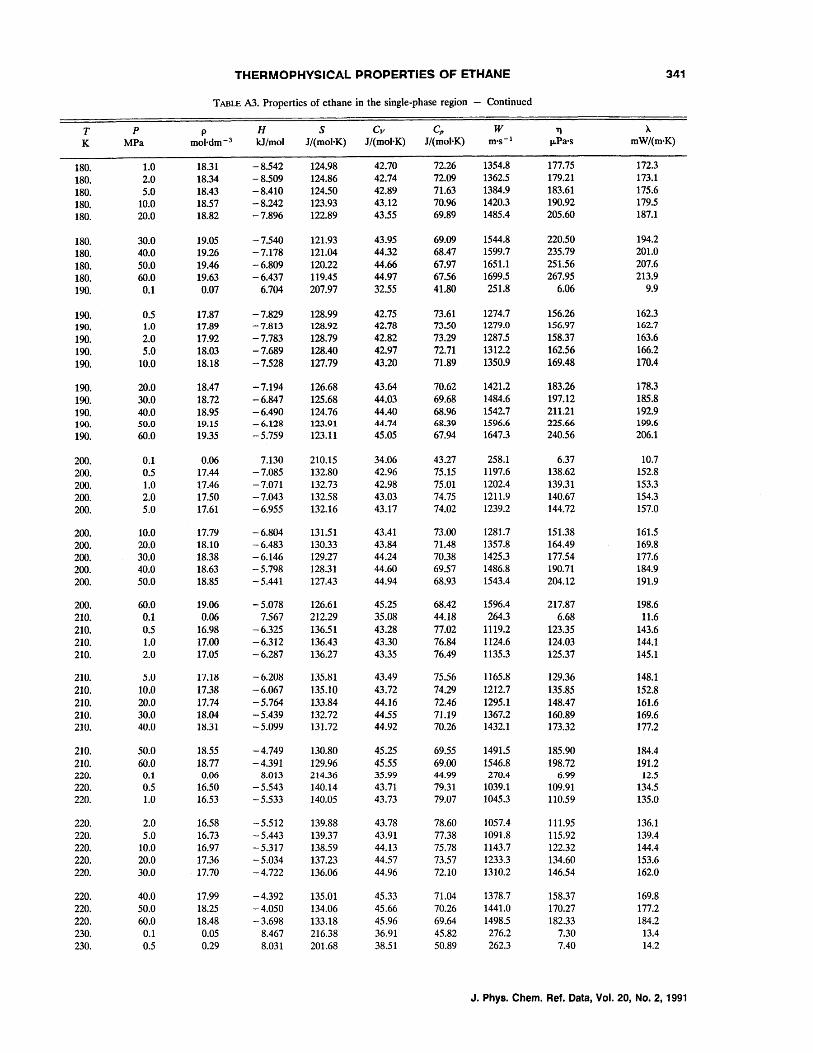
THERMOPHVSICAL PROPERTIES OF ETHANE 341
TABLE A3. Properties of ethane in the single-phase region - Continued
T p p H S Cv Cp W "l A
K MPa mol·dm- 3 kJ/mol l/(mol'K) l/(moloK) l/(mol·K) m's- 1 ~Pa's mW/(m'K)
180. 1.0 18.31 -8.542 124.98 42.70 72.26 1354.8 177.75 172.3
180. 2.0 18.34 -8.509 124.86 42.74 72.09 1362.5 179.21 173.1
180. 5.0 18.43 -8.410 124.50 42.89 71.63 1384.9 183.61 175.6
180. 10.0 18.57 -8.242 123.93 43.12 70.96 1420.3 190.92 179.5
180. 20.0 18.82 -7.896 122.89 43.55 69.89 1485.4 205.60 187.1
180. 30.0 19.05 -7.540 121.93 43.95 69.09 1544.8 220.50 194.2
180. 40.0 19.26 -7.178 121.04 44.32 68.47 1599.7 235.79 201.0
180. 50.0 19.46 -6.809 120.22 44.66 67.97 1651.1 251.56 207.6
180. 60.0 19.63 -6.437 119.45 44.97 67.56 1699.5 267.95 213.9
190. 0.1 0.07 6.704 207.97 32.55 41.80 251.8 6.06 9.9
190. 0.5 17.87 -7.829 128.99 42.75 73.61 1274.7 156.26 162.3 190. 1.0 17.89 -7.813 128.92 42.78 73.50 1279.0 156.97 162.7
190. 2.0 17.92 -7.783 128.79 42.82 73.29 1287.5 158.37 163.6
190. 5.0 18.03 -7.689 128.40 42.97 72.71 1312.2 162.56 166.2
190. 10.0 18.18 -7.528 127.79 43.20 71.89 1350.9 169.48 170.4
190. 20.0 18.47 -7.194 126.68 43.64 70.62 1421.2 183.26 178.3
190. 30.0 18.72 -6.847 125.68 44.03 69.68 1484.6 197.12 185.8
190. 40.0 18.95 -6.490 124.76 44.40 68.96 1542.7 211.21 192.9 190. 50.0 19.15 -6.12& 123.91 44.74 6&.39 1596.6 225.66 199.6
190. 60.0 19.35 -5.759 123.11 45.05 67.94 1647.3 240.56 206.1
200. 0.1 0.06 7.130 210.15 34.06 43.27 258.1 6.37 10.7 200. 0.5 17.44 -7.085 132.80 42.96 75.15 1197.6 138.62 152.8
200. 1.0 17.46 -7.071 132.73 42.98 75.01 1202.4 139.31 153.3 200. 2.0 17.50 -7.043 132.58 43.03 74.75 1211.9 140.67 154.3 200. 5.0 17.61 -6.955 132.16 43.17 74.02 1239.2 144.72 157.0
200. 10.0 17.79 -6.804 131.51 43.41 73.00 1281.7 151.38 161.5 200. 20.0 18.10 -6.483 130.33 43.84 71.48 1357.8 164.49 169.8 200. 30.0 18.38 -6.146 129.27 44.24 70.38 1425.3 177.54 177.6 200. 40.0 18.63 -5.798 128.31 44.60 69.57 1486.8 190.71 184.9 200. 50.0 18.85 -5.441 127.43 44.94 68.93 1543.4 204.12 191.9
200. 60.0 19.06 -5.078 126.61 45.25 68.42 1596.4 217.87 198.6 210. 0.1 0.06 7.567 212.29 35.08 44.18 264.3 6.68 11.6 210. 0.5 16.98 -6.325 136.51 43.28 77.02 1119.2 123.35 143.6 210. 1.0 17.00 - 6.312 136.43 43.30 76.84 1124.6 124.03 144.1 210. 2.0 17.05 -6.287 136.27 43.35 76.49 1135.3 125.37 145.1
210. 5.U 17.1~ -6.2U~ 135.~1 43.49 75.56 1165.8 129.36 148.1 210. 10.0 17.38 -6.067 135.10 43.72 74.29 1212.7 135.85 152.8 210. 20.0 17.74 -5.764 133.84 44.16 72.46 1295.1 148.47 161.6 210. 30.0 18.04 -5.439 132.72 44.55 71.19 1367.2 160.89 169.6 210. 4U.U llUl -5.U99 131.72 44.92 7U.26 1432.1 173.32 177.2
210. 50.0 18.55 -4.749 130.80 45.25 69.55 1491.5 185.90 184.4 210. 60.0 18.77 -4.391 129.96 45.55 69.00 1546.8 198.72 191.2 220. 0.1 0.06 8.013 214.36 35.99 44.99 270.4 6.99 12..5 220. 0.5 16.50 -5.543 140.14 43.71 79.31 1039.1 109.91 134.5 220. 1.0 16.53 -5.533 140.05 43.73 79.07 1045.3 110.59 135.0
220. 2.0 16.58 -5.512 139.88 43.78 78.60 1057.4 111.95 136.1 220. 5.0 16.73 -5.443 139.37 43.91 77.38 1091.8 115.92 139.4 220. 10.0 16.97 -5.317 138.59 44.13 75.78 1143.7 122.32 144.4 220. 20.0 17.36 -5.034 137.23 44.57 73.57 1233.3 134.60 153.6 220. 30.0 . 17.70 -4.722 136.06 44.96 72.10 1310.2 146.54 162.0
220. 40.0 17.99 -4.392 135.01 45.33 71.04 1378.7 158.37 169.8 220. 50.0 18.25 -4.050 134.06 45.66 70.26 1441.0 170.27 177.2 220. 60.0 18.48 -3.698 133.18 45.96 69.64 1498.5 182.33 184.2 230. 0.1 0.05 8.467 216.38 36.91 45.82 276.2 7.30 13.4 230. 0.5 0.29 8.031 201.68 38.51 50.89 262.3 7.40 14.2
J. Phys. Chern. Ref. Data, Vol. 20, No.2, 1991
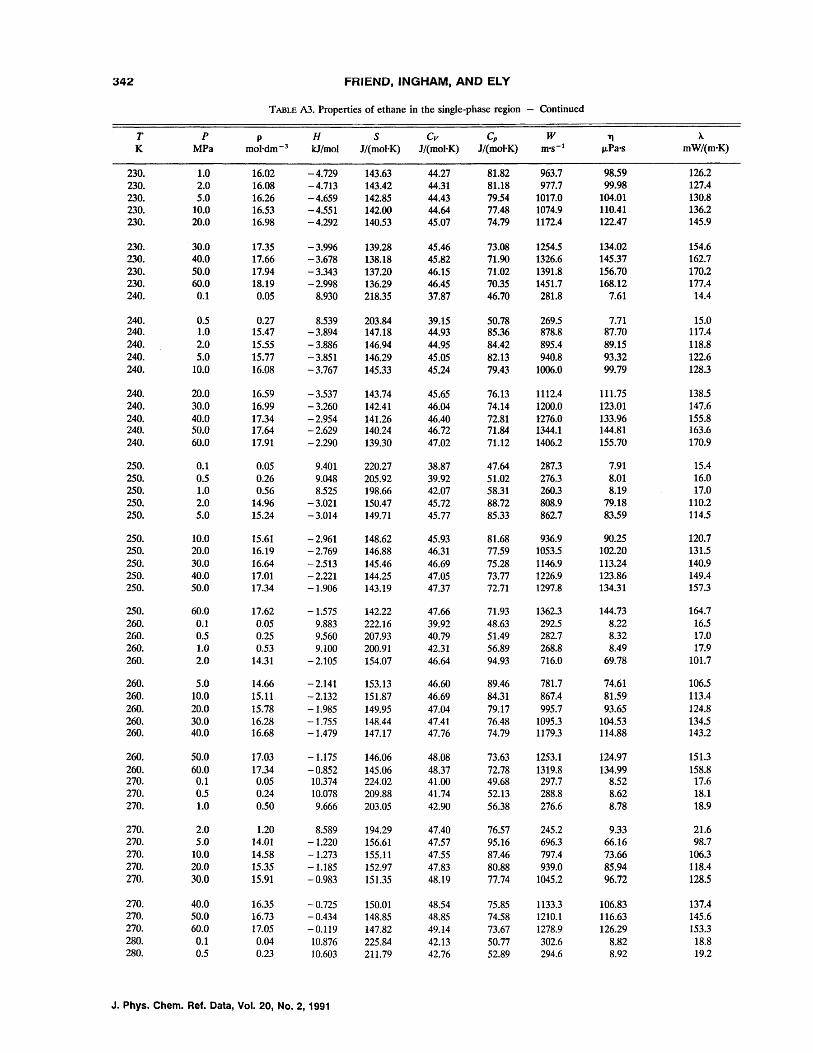
342 FRIEND, INGHAM, AND ELY
TABLE A3. Properties of ethane in the single-phase region - Continued
T p p H S Cv Cp W " A K MPa mol·dm- 3 kJ/mol J/(mo!'K) J/(mol'K) J/(mol'K) m's- 1 JLPa's mW/(m'K)
230. 1.0 16.02 -4.729 143.63 44.27 81.82 963.7 98.59 126.2 230. 2.0 16.08 -4.713 143.42 44.31 81.18 977.7 99.98 127.4 230. 5.0 16.26 -4.659 142.85 44.43 79.54 1017.0 104.01 130.8 230. 10.0 16.53 -4.551 142.00 44.64 77.48 1074.9 110.41 136.2 230. 20.0 16.98 -4.292 140.53 45.07 74.79 1172.4 122.47 145.9
230. 30.0 17.35 -3.996 139.28 45.46 73.08 1254.5 134.02 154.6 230. 40.0 17.66 -3.678 138.18 45.82 71.90 1326.6 145.37 162.7 230. 50.0 17.94 -3.343 137.20 46.15 71.02 1391.8 156.70 170.2 230. 60.0 18.19 -2.998 136.29 46.45 70.35 1451.7 168.12 177.4 240. 0.1 0.05 8.930 218.35 37.87 46.70 281.8 7.61 14.4
240. 0.5 0.27 8.539 203.84 39.15 50.78 269.5 7.71 15.0 240. 1.0 15.47 -3.894 147.18 44.93 85.36 878.8 87.70 117.4 240. 2.0 15.55 -3.886 146.94 44.95 84.42 895.4 89.15 118.8 240. 5.0 15.77 -3.851 146.29 45.05 82.13 940.8 93.32 122.6 240. 10.0 16.08 -3.767 145.33 45.24 79.43 1006.0 99.79 128.3
240. 20.0 16.59 -3.537 143.74 45.65 76.13 1112.4 111.75 138.5 240. 30.0 16.99 -3.260 142.41 46.04 74.14 i200.0 123.01 147.6 240. 40.0 17.34 -2.954 141.26 46.40 72.81 1276.0 133.96 155.8 240. 50.0 17.64 -2.629 140.24 46.72 71.84 1344.1 144.81 163.6 240. 60.0 17.91 -2.290 139.30 47.02 71.12 1406.2 155.70 170.9
250. 0.1 0.05 9.401 220.27 38.87 47.64 287.3 7.91 15.4 250. 0.5 0.26 9.048 205.92 39.92 51.02 276.3 8.01 16.0 250. 1.0 0.56 8.525 198.66 42.07 58.31 260.3 8.19 17.0 250. 2.0 14.96 -3.021 150.47 45.72 88.72 808.9 79.18 110.2 250. 5.0 15.24 -3.014 149.71 45.77 85.33 862.7 83.59 114.5
250. 10.0 15.61 -2.961 148.62 45.93 81.68 936.9 90.25 120.7 250. 20.0 16.19 -2.769 146.88 46.31 77.59 1053.5 102.20 131.5 250. 30.0 16.64 -2.513 145.46 46.69 75.28 1146.9 113.24 140.9 250. 40.0 17.01 -2.221 144.25 47.05 73.77 1226.9 123.86 149.4 250. 50.0 17.34 -1.906 143.19 47.37 72.71 1297.8 134.31 157.3
250. 60.0 17.62 -1.575 142.22 47.66 71.93 1362.3 144.73 164.7 260. 0.1 0.05 9.883 222.16 39.92 48.63 292.5 8.22 16.5 260. 0.5 0.25 9.560 207.93 40.79 51.49 282.7 8.32 17.0 260. 1.0 0.53 9.100 200.91 42.31 56.89 268.8 8.49 17.9 260. 2.0 14.31 -2.105 154.07 46.64 94.93 716.0 69.78 101.7
260. 5.0 14.66 -2.141 153.13 46.60 89.46 781.7 74.61 106.5 260. 10.0 15.11 -2.132 151.87 46.69 84.31 867.4 81.59 113.4 260. 20.0 15.78 -1.985 149.95 47.04 79.17 995.7 93.65 124.8 260. 30.0 16.28 -1.755 14K44 47-41 76.48 1095.3 104.53 134.5 260. 40.0 16.68 -1.479 147.17 47.76 74.79 1179.3 114.88 143.2
260. 50.0 17.03 1.175 146.06 48.08 73.63 1253.1 124.97 151.3 260. 60.0 17.34 -0.852 145.06 48.37 72.78 1319.8 134.99 158.8 270. 0.1 0.05 10.374 224.02 41.00 49.68 297.7 8.52 17.6 270. 0.5 0.24 10.078 209.88 41.74 52.13 288.8 8.62 18.1 270. 1.0 0.50 9.666 203.05 42.90 56.38 276.6 8.78 18.9
270. 2.0 1.20 8.589 194.29 47.40 76.57 245.2 9.33 21.6 270. 5.0 14.01 -1.220 156.61 47.57 95.16 696.3 66.16 98.7 270. 10.0 14.58 -1.273 155.11 47.55 87.46 797.4 73.66 106.3 270. 20.0 15.35 -1.185 152.97 47.83 80.88 939.0 85.94 118.4 270. 30.0 15.91 -0.983 151.35 48.19 77.74 1045.2 96.72 128.5
270. 40.0 16.35 -0.725 150.01 48.54 75.85 1133.3 106.83 137.4 270. 50.0 16.73 -0.434 148.85 48.85 74.58 1210.1 116.63 145.6 270. 60.0 17.05 -0.119 147.82 49.14 73.67 1278.9 126.29 153.3 280. 0.1 0.04 10.876 225.84 42.13 50.77 302.6 8.82 18.8 280. 0.5 0.23 10.603 211.79 42.76 52.89 294.6 8.92 19.2
J. Phys. Chem. Ref. Data, Vol. 20, No.2, 1991
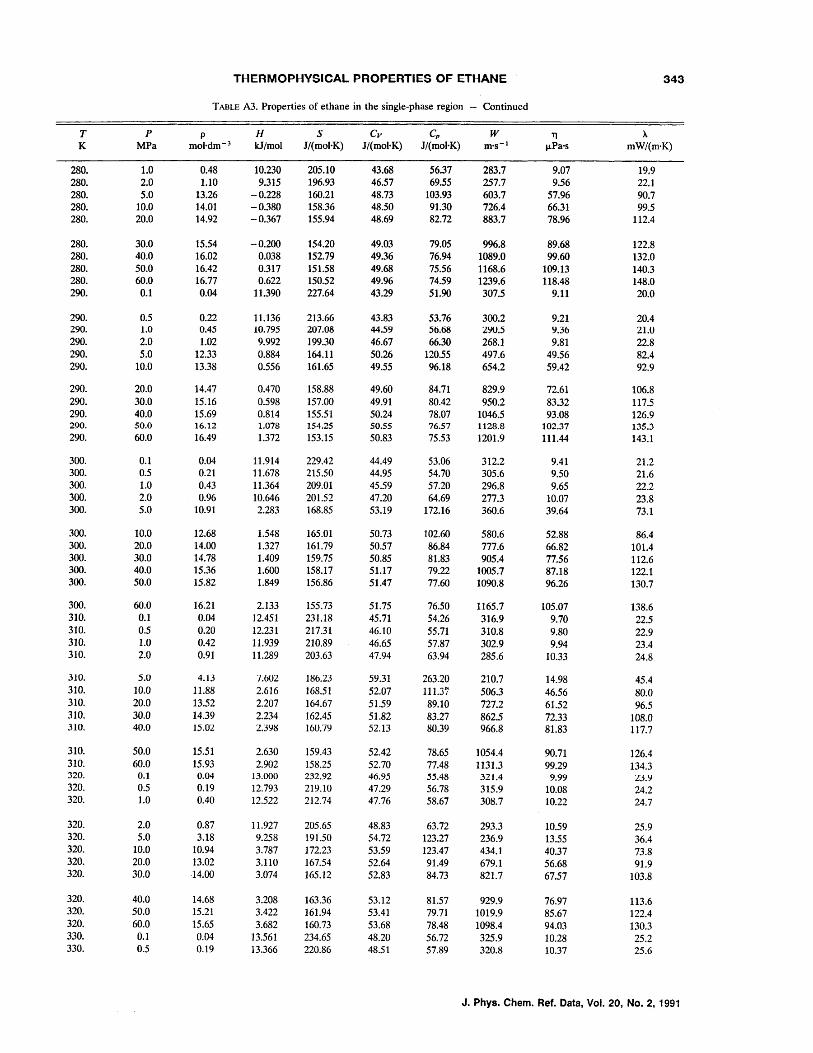
THERMOPHYSICAL PROPERTIES OF ETHANE 343
TABLE A3. Properties of ethane in the single-phase region - Continued
T p p H S Cv Cp W TJ A K MPa mol·dm- 3 kJ/mol J/(mol'K) J/(mol'K) J/(mol'K) m's- 1 J.LPa·s mW/(m'K)
280. 1.0 0.48 10.230 205.10 43.68 56.37 283.7 9.07 19.9 280. 2.0 1.10 9.315 196.93 46.57 69.55 257.7 9.56 22.1 280. 5.0 13.26 -0.228 160.21 48.73 103.93 603.7 57.96 90.7 280. 10.0 14.01 -0.380 158.36 48.50 91.30 726.4 66.31 99.5 280. 20.0 14.92 -0.367 155.94 48.69 82.72 883.7 78.96 112.4
280. 30.0 15.54 -0.200 154.20 49.03 79.05 996.8 89.68 122.8 280. 40.0 16.02 0.038 152.79 49.36 76.94 1089.0 99.60 132.0 280. 50.0 16.42 0.317 151.58 49.68 75.56 1168.6 109.13 140.3 280. 60.0 16.77 0.622 150.52 49.96 74.59 1239.6 118.48 148.0 290. 0.1 0.04 11.390 227.64 43.29 51.90 307.5 9.11 20.0
290. 0.5 0.22 11.136 213.66 43.83 53.76 300.2 9.21 20.4 290. 1.0 0.45 10.795 207.08 44.59 56.68 ZW.5 ~.36 21.U 290. 2.0 1.02 9.992 199.30 46.67 66.30 268.1 9.81 22.8 290. 5.0 12.33 0.884 164.11 50.26 120.55 497.6 49.56 82.4 290. 10.0 13.38 0.556 161.65 49.55 96.18 654.2 59.42 92.9
290. 20.0 14.47 0.470 158.88 49.60 84.71 829.9 72.61 106.8 290. 30.0 15.16 0.598 157.00 49.91 80.42 950.2 83.32 117.5 290. 40.0 15.69 0.814 155.51 50.24 78.07 1046.5 93.08 126.9 290. 50.0 16.12 1.078 154.25 50.55 76.57 1128.8 102.37 135.3 290. 60.0 16.49 1.372 153.15 50.83 75.53 1201.9 111.44 143.1
300. 0.1 0.04 11.914 229.42 44.49 53.06 312.2 9.41 21.2 300. 0.5 0.21 11.678 215.50 44.95 54.70 305.6 9.50 21.6 300. 1.0 0.43 11.364 209.01 45.59 57.20 296.8 9.65 22.2 300. 2.0 0.96 10.646 201.52 47.20 64.69 277.3 10.07 23.8 300. 5.0 10.91 2.283 168.85 53.19 172.16 360.6 39.64 73.1
300. 10.0 12.68 1.548 165.01 50.73 102.60 580.6 52.88 86.4 300. 20.0 14.00 1.327 161.79 50.57 86.84 777.6 66.82 101.4 300. 30.0 14.78 1.409 159.75 50.85 81.83 905.4 77.56 112.6 300. 40.0 15.36 1.600 158.17 51.17 79.22 1005.7 87.18 122.1 300. 50.0 15.82 1.849 156.86 51.47 77.60 1090.8 96.26 130.7
300. 60.0 16.21 2.133 155.73 51.75 76.50 1165.7 105.07 138.6 310. 0.1 0.04 12.451 231.18 45.71 54.26 316.9 9.70 22.5 310. 0.5 0.20 12.231 217.31 46.10 55.71 310.8 9.80 22.9 310. 1.0 0.42 11.939 210.89 46.65 57.87 302.9 9.94 23.4 310. 2.0 0.91 11.289 203.63 47.94 63.94 285.6 10.33 24.8
310. 5.0 4.13 7.6U2 1~6.23 59.31 263.20 210.7 14.98 45.4 310. 10.0 11.88 2.616 168.51 52.07 111.3~ 506.3 46.56 80.0 310. 20.0 13.52 2.207 164.67 51.59 89.10 727.2 61.52 96.5 310. 30.0 14.39 2.234 162.45 51.82 83.27 862.5 72.33 108.0 310. 40.0 15.02 2.:';1}~ 16U.79 52.13 80.39 966.8 81.83 117.7
310. 50.0 15.51 2.630 159.43 52.42 78.65 1054.4 90.71 126.4 310. 60.0 15.93 2.902 158.25 52.70 77.48 1131.3 99.29 134.3 320. 0.1 0.04 13.000 232.92 46.95 55.48 321.4 9.99 23.9 320. 0.5 0.19 12.793 219.10 47.29 56.78 315.9 10.08 24.2 320. 1.0 0.40 12.522 212.74 47.76 58.67 308.7 10.22 24.7
320. 2.0 0.87 11.927 205.65 48.83 63.72 293.3 10.59 25.9 320. 5.0 3.18 9.258 191.50 54.72 123.27 236.9 13.55 36.4 320. 10.0 10.94 3.787 172.23 53.59 123.47 434.1 40.37 73.8 320. 20.0 13.02 3.110 167.54 52.64 91.49 679.1 56.68 91.9 320. 30.0 -14.00 3.074 165.12 52.83 84.73 821.7 67.57 103.8
320. 40.0 14.68 3.208 163.36 53.12 81.57 929.9 76.97 113.6 320. 50.0 15.21 3.422 161.94 53.41 79.71 1019.9 85.67 122.4 320. 60.0 15.65 3.682 160.73 53.68 78.48 1098.4 94.03 130.3 330. 0.1 0.04 13.561 234.65 48.20 56.72 325.9 10.28 25.2 330. 0.5 0.19 13.366 220.86 48.51 57.89 320.8 10.37 25.6
J. Phys. Chern. Ref. Data, Vol. 20, No.2, 1991
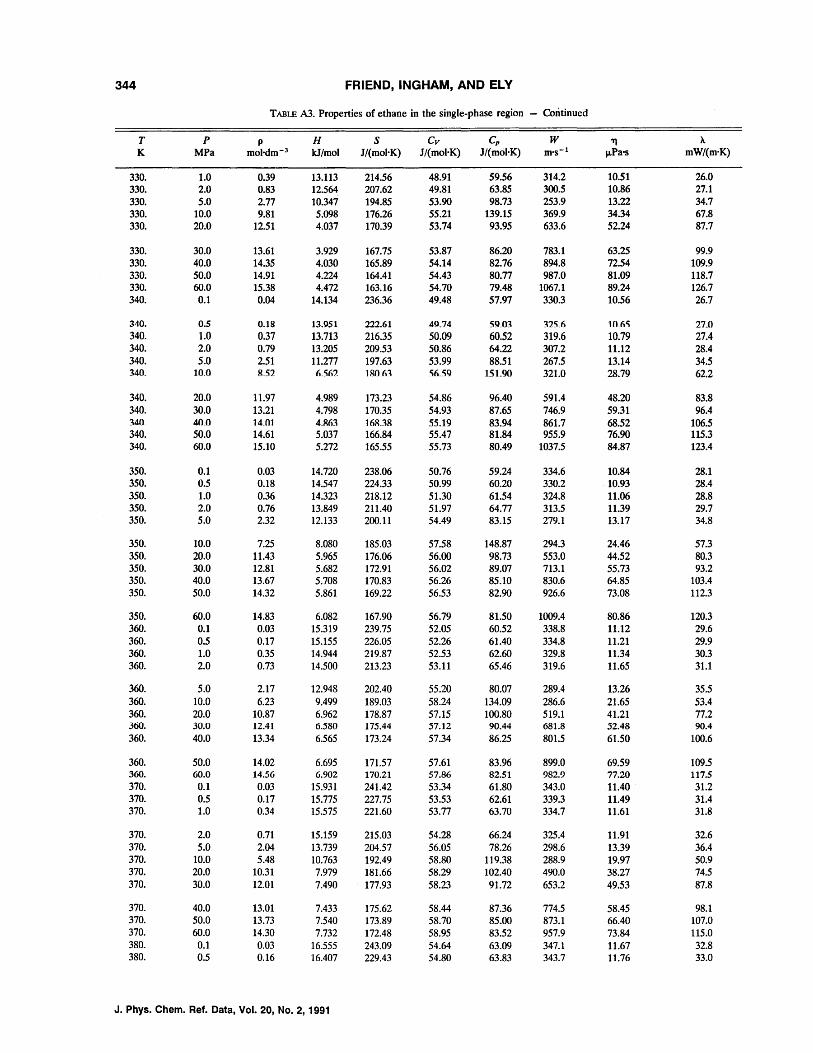
344 FRIEND, INGHAM, AND ELY
TABLE A3. Properties of ethane in the single-phase region - Continued
T p p H S Cv Cp W 1'1 ).
K MPa mol·dm-3 kJ/mol J/(mo)'K) J/(mol·K) J/(mo)'K) m's- 1 .... Pa·s mW/(m'K)
330. 1.0 0.39 13.113 214.56 48.91 59.56 314.2 10.51 26.0 330. 2.0 0.83 12.564 207.62 49.81 63.85 300.5 10.86 27.1 330. 5.0 2.77 10.347 194.85 53.90 98.73 253.9 13.22 34.7 330. 10.0 9.81 5.098 176.26 55.21 139.15 369.9 34.34 67.8 330. 20.0 12.51 4.037 170.39 53.74 93.95 633.6 52.24 87.7
330. 30.0 13.61 3.929 167.75 53.87 86.20 783.1 63.25 99.9 330. 40.0 14.35 4.030 165.89 54.14 82.76 894.8 72.54 109.9 330. 50.0 14.91 4.224 164.41 54.43 80.77 987.0 81.09 118.7 330. 60.0 15.38 4.472 163.16 54.70 79.48 1067.1 89.24 126.7 340. 0.1 0.04 14.134 236.36 49.48 57.97 330.3 10.56 26.7
340. O.S 0.18 13.951 222.61 49.74 59.OJ 325.6 10.115 27.0 340. 1.0 0.37 13.713 216.35 50.09 60.52 319.6 10.79 27.4 340. 2.0 0.79 13.205 209.53 50.86 64.22 307.2 11.12 28.4 340. 5.0 2.51 11.277 197.63 53.99 88.51 267.5 13.14 34.5 340. 10.0 8.52 6.562 1801\1 51\.59 151.90 321.0 28.79 62.2
340. 20.0 11.97 4.989 173.23 54.86 96.40 591.4 48.20 83.8 340. 30.0 13.21 4.798 170.35 54.93 87.65 746.9 59.31 96.4 340. 40.0 14.01 4.R63 16lt3R 55.19 83.94 861.7 68.52 106.5 340. 50.0 14.61 5.037 166.84 55.47 81.84 955.9 76.90 115.3 340. 60.0 15.10 5.272 165.55 55.73 80.49 1037.5 84.87 123.4
350. 0.1 0.03 14.720 238.06 50.76 59.24 334.6 10.84 28.1 350. 0.5 0.18 14.547 224.33 50.99 60.20 330.2 .10.93 28.4 350. 1.0 0.36 14.323 218.12 51.30 61.54 324.8 11.06 28.8 350. 2.0 0.76 13.849 211.40 51.97 64.77 313.5 11.39 29.7 350. 5.0 2.32 12.133 200.11 54.49 83.15 279.1 13.17 34.8
350. 10.0 7.25 8.080 185.03 57.58 148.87 294.3 24.46 57.3 350. 20.0 11.43 5.965 176.06 56.00 98.73 553.0 44.52 80.3 350. 30.0 12.81 5.682 172.91 56.02 89.07 713.1 55.73 93.2 350. 40.0 13.67 5.708 170.83 56.26 85.10 830.6 64.85 103.4 350. 50.0 14.32 5.861 169.22 56.53 82.90 926.6 73.08 112.3
350. 60.0 14.83 6.082 167.90 56.79 81.50 1009.4 80.86 120.3 360. 0.1 0.03 15.319 239.75 52.05 60.52 338.8 11.12 29.6 360. 0.5 0.17 15.155 226.05 52.26 61.40 334.8 11.21 29.9 360. 1.0 0.35 14.944 219.87 52.53 62.60 329.8 11.34 30.3 360. 2.0 0.73 14.500 213.23 53.11 65.46 319.6 11.65 31.1
360. 5.0 2.17 12.948 202.40 55.20 80.07 289.4 13.26 35.5 360. 10.0 6.23 9.499 189.03 58.24 134.09 286.6 21.65 53.4 360. 20.0 10.87 6.962 178.87 57.15 100.80 519.1 41.21 77.2 360. 30.0 12.41 6.580 175.44 57.12 90.44 681.8 .52.48 90.4 360. 40.0 13.34 6.565 173.24 57.34 86.25 801.5 61.50 100.6
360. 50.0 14.02 6.695 171.57 57.61 83.96 899.0 69.59 109.5 360. 60.0 14.56 6.902 170.21 57.86 82.51 982.9 77.20 117.5 370. 0.1 0.03 15.931 241.42 53.34 61.80 343.0 11.40 31.2 370. 0.5 0.17 15.775 227.75 53.53 62.61 339.3 11.49 31.4 370. 1.0 0.34 15.575 221.60 53.77 63.70 334.7 11.61 31.8
370. 2.0 0.71 15.159 215.03 54.28 66.24 325.4 11.91 32.6 370. 5.0 2.04 13.739 204.57 56.05 78.26 298.6 13.39 36.4 370. 10.0 5.48 10.763 192.49 58.80 119.38 288.9 19.97 50.9 370. 20.0 10.31 7.979 181.66 58.29 102.40 490.0 38.27 74.5 370. 30.0 12.01 7.490 177.93 58.23 91.72 653.2 49.53 87.8
370. 40.0 13.01 7.433 175.62 58.44 87.36 774.5 58.45 98.1 370. 50.0 13.73 7.540 173.89 58.70 85.00 873.1 66.40 107.0 370. 60.0 14.30 7.732 172.48 58.95 83.52 957.9 73.84 115.0 380. 0.1 0.03 16.555 243.09 54.64 63.09 347.1 11.67 32.8 380. 0.5 0.16 16.407 229.43 54.80 63.83 343.7 11.76 33.0
J. Phys. Chem. Ref. Data, Vol. 20, No.2, 1991
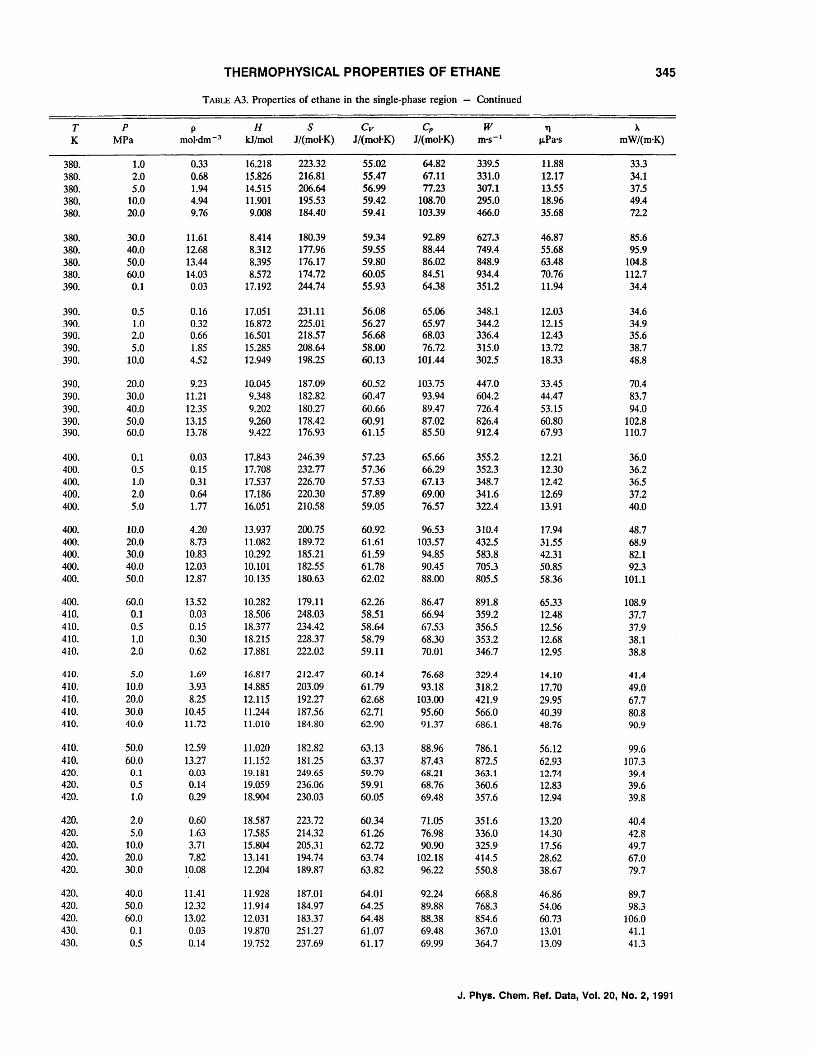
THERMOPHYSICAL PROPERTIES OF ETHANE 345
TABLE A3. Properties of ethane in the single-phase region - Continued
T p p H S Cv Cp W TJ A K MPa mol·dm- 3 kJ/mol J/(mol·K) J/(mol'K) J/(mol·K) m's- 1 J.LPa·s mW/(m'K)
380. 1.0 0.33 16.218 223.32 55.02 64.82 339.5 11.88 33.3 380. 2.0 0.68 15.826 216.81 55.47 67.11 331.0 12.17 34.1 380. 5.0 1.94 14.515 206.64 56.99 77.23 307.1 13.55 37.5 380. 10.0 4.94 11.901 195.53 59.42 108.70 295.0 18.96 49.4 380. 20.0 9.76 9.008 184.40 59.41 103.39 466.0 35.68 72.2
380. 30.0 11.61 8.414 180.39 59.34 92.89 627.3 46.87 85.6 380. 40.0 12.68 8.312 177.96 59.55 88.44 749.4 55.68 95.9 380. 50.0 13.44 8.395 176.17 59.80 86.02 848.9 63.48 104.8 380. 60.0 14.03 8.572 174.72 60.05 84.51 934.4 70.76 112.7 390. 0.1 0.03 17.192 244.74 55.93 64.38 351.2 11.94 34.4
390. 0.5 0.16 17.051 231.11 56.08 65.06 348.1 12.03 34.6 390_ 1.0 0_32 16_872 225.01 56.27 65.97 344.2 12.15 34_9 390. 2.0 0.66 16.501 218.57 56.68 68.03 336.4 12.43 35.6 390. 5.0 1.85 15.285 208.64 58.00 76.72 315.0 13.72 38.7 390. 10.0 4.52 12.949 198.25 60.13 101.44 302.5 18.33 48.8
390. 20.0 9.23 10.045 187.09 60.52 103.75 447.0 33.45 70.4 390. 30.0 11.21 9.348 182.82 60.47 93.94 604.2 44.47 83.7 390. 40.0 12.35 9.202 180.27 60.66 89.47 726.4 53.15 94.0 390. 50.0 13.15 9.260 178.42 60.91 87.02 826.4 60.80 t02.8 390. 60.0 13.78 9.422 176.93 61.15 85.50 912.4 67.93 110.7
400. 0.1 0.03 17.843 246.39 57.23 65.66 355.2 12.21 36.0 400. 0.5 0.15 17.708 232.77 57.36 66.29 352.3 12.30 36.2 400. 1.0 0.31 17.537 226.70 57.53 67.13 348.7 12.42 36.5 400. 2.0 0.64 17.186 220.30 57.89 69.00 341.6 12.69 37.2 400. 5.0 1.77 16.051 210.58 59.05 76.57 322.4 13.91 40.0
400. 10.0 4.20 13.937 200.75 60.92 96.53 310.4 17.94 48.7 400. 20.0 8.73 11.082 189.72 61.61 103.57 432.5 31.55 68.9 400. 30.0 to.83 to.292 185.21 61.59 94.85 583.8 42.31 82.1 400. 40.0 12.03 10.101 182.55 61.78 90.45 705.3 50.85 92.3 400. 50.0 12.87 10.135 180.63 62.02 88.00 805.5 58.36 101.1
400. 60.0 13.52 10.282 179.11 62.26 86.47 891.8 65.33 108.9 410. 0.1 0.03 18.506 248.03 58.51 66.94 359.2 12.48 37.7 410. 0.5 0.15 18.377 234.42 58.64 67.53 356.5 12.56 37.9 410. 1.0 0.30 18.215 228.37 58.79 68.30 353.2 12.68 38.1 410. 2.0 0.62 17.881 222.02 59.11 70.01 346.7 12.95 38.8
410. 5.0 1.69 16.817 212.47 60.14 76.68 329.4 14.10 41.4 410. 10.0 3.93 14.885 203.09 61.79 93.18 318.2 17.70 49.0 410. 20.0 8.25 12.115 192.27 62.68 103.00 421.9 29.95 67.7 410. 30.0 10.45 11.244 187.56 62.71 95.60 566.0 40.39 80.8 410. 40.0 11.72 11.010 184.80 62.90 91.37 686.1 48.76 90.9
410. 50.0 12.59 11.020 182.82 63.13 88.96 786.1 56.12 99.6 410. 60.0 13.27 11.152 181.25 63.37 87.43 872.5 62.93 107.3 420_ 0.1 0.03 19.181 249.65 59.79 68.21 363.1 12.74 39.4 420. 0.5 0.14 19.059 236.06 59.91 68.76 360.6 12.83 39.6 420. 1.0 0.29 18.904 230.03 60.05 69.48 357.6 12.94 39.8
420. 2.0 0.60 18.587 223.72 60.34 71.05 351.6 13.20 40.4 420. 5.0 1.63 17.585 214.32 61.26 76.98 336.0 14.30 42.8 420. 10.0 3.71 15.804 205.31 62.72 90.90 325.9 17.56 49.7 420. 20.0 7.82 13.141 194.74 63.74 102.18 414.5 28.62 67.0 420. 30.0 10.08 12.204 189.87 63.82 96.22 550.8 38.67 79.7
420. 40.0 11.41 11.928 187.01 64.01 92.24 668.8 46.86 89.7 420. 50.0 12.32 11.914 184.97 64.25 89.88 768.3 54.06 98.3 420. 60.0 13.02 12.031 183.37 64.48 88.38 854.6 60.73 106.0 430. 0.1 0.03 19.870 251.27 61.07 69.48 367.0 13.01 41.1 430. 0.5 0.14 19.752 237.69 61.17 69.99 364.7 13.09 41.3
J. Phys. Chem. Ref. Data, Vol. 20, No.2, 1991
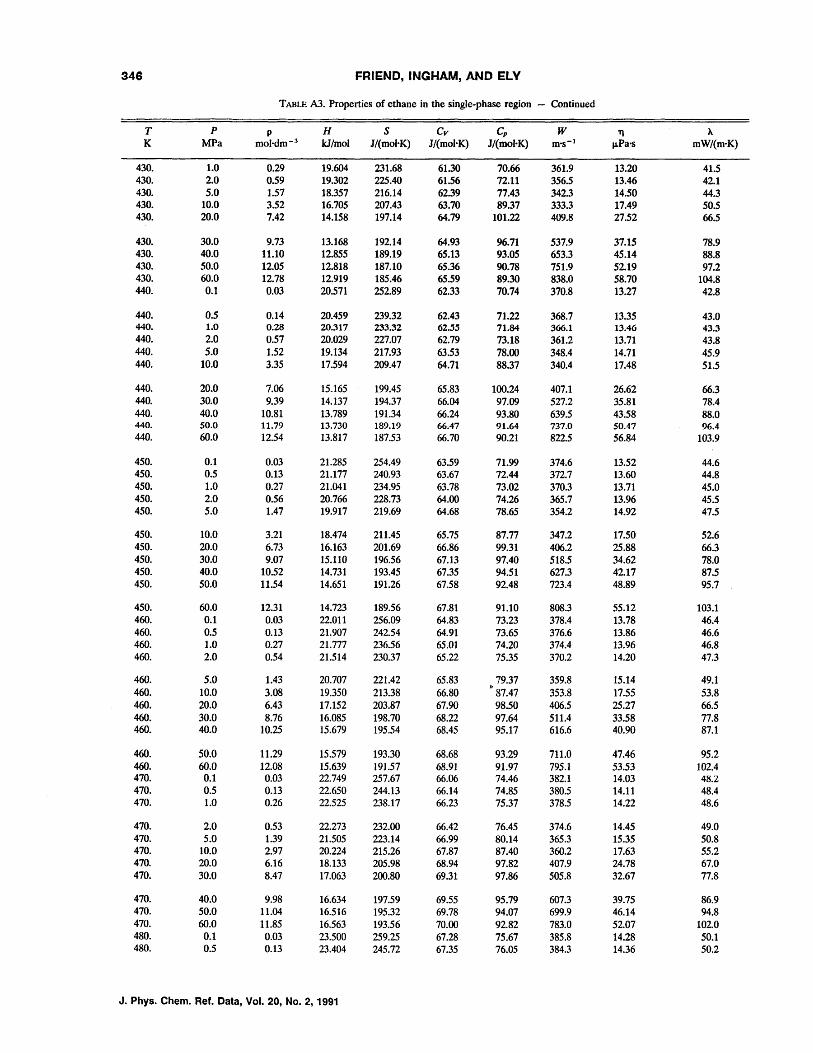
946 I=RIEND, INGHAM, AND ELY
TABLE A3. Properties of ethane in the single-phase region - Continued
T p p H S Cy Cp W TI ~
K MPa mol·dm- 3 kJ/mol J/(mol'K) J/(mol'K) J/(mol'K) m's- 1 ~Pa's mW/(m·K)
430. 1.0 0.29 19.604 231.68 61.30 70.66 361.9 13.20 41.5 430. 2.0 0.59 19.302 225.40 61.56 72.11 356.5 13.46 42.1 430. 5.0 1.57 18.357 216.14 62.39 77.43 342.3 14.50 44.3 430. 10.0 3.52 16.705 207.43 63.70 89.37 333.3 17.49 50.5 430. 20.0 7.42 14.158 197.14 64.79 101.22 409.8 27.52 66.5
430. 30.0 9.73 13.168 192.14 64.93 96.71 537.9 37.15 78.9 430. 40.0 11.10 12.855 189.19 65.13 93.05 653.3 45.14 88.8 430. 50.0 12.05 12.818 187.10 65.36 90.78 751.9 52.19 97.2 430. 60.0 12.78 12.919 185.46 65.59 89.30 838.0 58.70 104.8 440. 0.1 0.03 20.571 252.89 62.33 70.74 370.8 13.27 42.8
440. 0.5 0.14 20.459 239.32 62.43 71.22 368.7 13.35 43.0 440. 1.0 0.28 20.317 233.32 62.55 71.84 366.1 13.46 43.3 440. 2.0 0.57 20.029 227.07 62.79 73.18 361.2 13.71 43.8 440. 5.0 1.52 19.134 217.93 63.53 78.00 348.4 14.71 45.9 440. 10.0 3.35 17.594 209.47 64.71 88.37 340.4 17.48 51.5
440. 20.0 7.06 15.165 199.45 65.83 100.24 407.1 26.62 66.3 440. 30.0 9.39 14.137 194.37 66.04 97.09 527.2 35.81 78.4 440. 40.0 10.81 13.789 191.34 66.24 93.80 639.5 43.58 88.0 440. 50.0 11.79 13.730 189.19 66.47 91.64 737.0 50.47 96.4 440. 60.0 12.54 13.817 187.53 66.70 90.21 822.5 56.84 103.9
450. 0.1 0.03 21.285 254.49 63.59 71.99 374.6 13.52 44.6 450. 0.5 0.13 21.177 240.93 63.67 72.44 372.7 13.60 44.8 450. 1.0 0.27 21.041 234.95 63.78 73.02 370.3 13.71 45.0 450. 2.0 0.56 20.766 228.73 64.00 74.26 365.7 13.96 45.5 450. 5.0 1.47 19.917 219.69 64.68 78.65 354.2 14.92 47.5
450. 10.0 3.21 18.474 211.45 65.75 87.77 347.2 17.50 52.6 450. 20.0 6.73 16.163 201.69 66.86 99.31 406.2 25.88 66.3 450. 30.0 9.07 15.110 196.56 67.13 97.40 518.5 34.62 78.0 450. 40.0 10.52 14.731 193.45 67.35 94.51 627.3 42.17 87.5 450. 50.0 11.54 14.651 191.26 67.58 92.48 723.4 48.89 95.7
450. 60.0 12.31 14.723 189.56 67.81 91.10 808.3 55.12 103.1 460. 0.1 0.03 22.011 256.09 64.83 73.23 378.4 13.78 46.4 460. 0.5 0.13 21.907 242.54 64.91 73.65 376.6 13.86 46.6 460. 1.0 0.27 21.777 236.56 65.01 74.20 374.4 13.96 46.8 460. 2.0 0.54 21.514 230.37 65.22 75.35 370.2 14.20 47.3
460. 5.0 1.43 20.707 221.42 65.83 79.37 359.8 15.14 49.1 460. 10.0 3.08 19.350 213.38 66.80
!P
87.47 353.8 17.55 53.8 460. 20.0 6.43 17.152 203.87 67.90 98.50 406.5 25.27 66.5 460. 30.0 8.76 16.085 198.70 68.22 97.64 511.4 33.58 77.8 460. 40.0 10.25 15.679 195.54 68.45 95.17 616.6 40.90 87.1
460. 50.0 11.29 15.579 193.30 68.68 93.29 711.0 47.46 95.2 460. 60.0 12.08 15.639 191.57 68.91 91.97 795.1 53.53 102.4 470. 0.1 0.03 22.749 257.67 66.06 74.46 382.1 14.03 4~.2
470. 0.5 0.13 22.650 244.13 66.14 74.85 380.5 14.11 48.4 470. 1.0 0.26 22.525 238.17 66.23 75.37 378.5 14.22 48.6
470. 2.0 0.53 22.273 232.00 66.42 76.45 374.6 14.45 49.0 470. 5.0 1.39 21.505 223.14 66.99 80.14 365.3 15.35 50.8 470. 10.0 2.97 20.224 215.26 67.87 87.40 360.2 17.63 55.2 470. 20.0 6.16 18.133 205.98 68.94 97.82 407.9 24.78 67.0 470. 30.0 8.47 17.063 200.80 69.31 97.86 505.8 32.67 77.8
470. 40.0 9.98 16.634 197.59 69.55 95.79 607.3 39.75 86.9 470. 50.0 11.04 16.516 195.32 69.78 94.07 699.9 46.14 94.8 470. 60.0 11.85 16.563 193.56 70.00 92.82 783.0 52.07 102.0 480. 0.1 0.03 23.500 259.25 67.28 75.67 385.8 14.28 50.1 480. 0.5 0.13 23.404 245.72 67.35 76.05 384.3 14.36 50.2
J. Phys. Chern. Ref. Data, Vol. 20, No.2, 1991
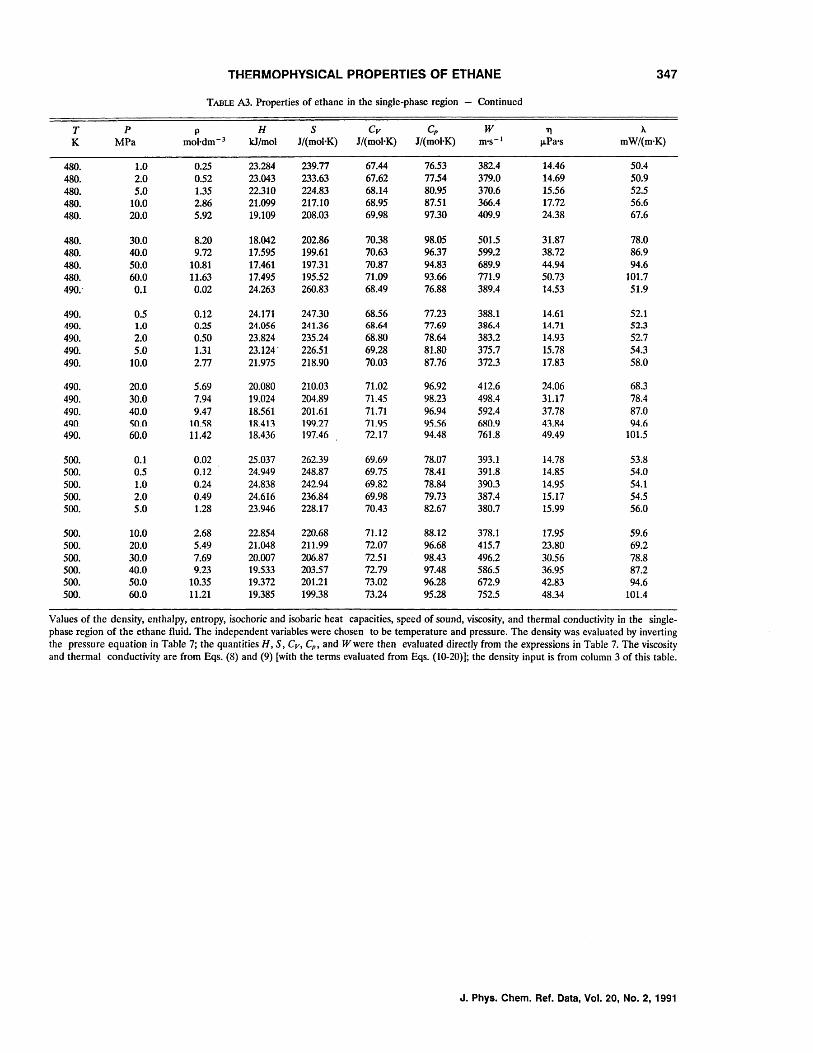
THERMOPHVSICAL PROPERTIES OF ETHANE 347
TABLE A3. Properties of ethane in the single-phase region - Continued
T p p H S Cv Cp W " A K MPa mol·dm- 3 kl/mol J/(mol·K) J/(mol'K) J/(mol·K) m's- 1 JLPa's mW/(m'K)
480. 1.0 0.25 23.284 239.77 67.44 76.53 382.4 14.46 50.4
480. 2.0 0.52 23.043 233.63 67.62 77.54 379.0 14.69 50.9
480. 5.0 1.35 22.310 224.83 68.14 80.95 370.6 15.56 52.5 480. 10.0 2.86 21.099 217.10 68.95 87.51 366.4 17.72 56.6 480. 20.0 5.92 19.109 208.03 69.98 97.30 409.9 24.38 67.6
480. 30.0 8.20 18.042 202.86 70.38 98.05 501.5 31.87 78.0 480. 40.0 9.72 17.595 199.61 70.63 96.37 599.2 38.72 86.9 480. 50.0 10.81 17.461 197.31 70.87 94.83 689.9 44.94 94.6 480. 60.0 11.63 17.495 195.52 71.09 93.66 771.9 50.73 101.7 490." 0.1 0.02 24.263 260.83 68.49 76.88 389.4 14.53 51.9
490. 0.5 0.12 24.171 247.30 68.56 77.23 388.1 14.61 52.1 490. 1.0 0.25 21.056 241.36 68.64 77.69 386.4 14.71 52.3 490. 2.0 0.50 23.824 235.24 68.80 78.64 383.2 14.93 52.7 490. 5.0 1.31 23.124 . 226.51 69.28 81.80 375.7 15.78 54.3 490. 10.0 2.77 21.975 218.90 70.03 87.76 372.3 17.83 58.0
490. 20.0 5.69 20.080 210.03 71.02 96.92 412.6 24.06 68.3 490. 30.0 7.94 19.024 204.89 71.45 98.23 498.4 31.17 78.4 490. 40.0 9.47 18.561 201.61 71.71 96.94 592.4 37.78 87.0 490 50.0 10.58 18.411 199.27 71.95 95.56 680.9 43.84 94.6 490. 60.0 11.42 18.436 197.46 72.17 94.48 761.8 49.49 101.5
500. 0.1 0.02 25.037 262.39 69.69 78.07 393.1 14.78 53.8 500. 0.5 0.12 24.949 248.87 69.75 78.41 391.8 14.85 54.0 500. 1.0 0.24 24.838 242.94 69.82 78.84 390.3 14.95 54.1 500. 2.0 0.49 24.616 236.84 69.98 79.73 387.4 15.17 54.5 500. 5.0 1.28 23.946 228.17 70.43 82.67 380.7 15.99 56.0
500. 10.0 2.68 22.854 220.68 71.12 88.12 378.1 17.95 59.6 500. 20.0 5.49 21.048 211.99 72.07 96.68 415.7 23.80 69.2 500. 30.0 7.69 20.007 206.87 72.51 98.43 496.2 30.56 78.8 500. 40.0 9.23 19.533 203.57 72.79 97.48 586.5 36.95 87.2 500. 50.0 10.35 19.372 201.21 73.02 96.28 672.9 42.83 94.6 500. 60.0 11.21 19.385 199.38 73.24 95.28 752.5 48.34 101.4
Values of the density, enthalpy, entropy, isochoric and isobaric heat capacities, speed of sound, viscosity, and thermal conductivity in the single-phase region of the ethane fluid. The independent variables were chosen to be temperature and pressure. The density was evaluated by inverting the pressure equation in Table 7; the quantities H, S, Cv, Cp , and Wwere then evaluated directly from the expressions in Table 7. The viscosity and thermal conductivity are from Eqs. (8) and (9) [with the terms evaluated from Eqs. (10-20)]; the density input is from column 3 of this table.
J. Phys. Chern. Ref. Data, Vol. 20, No.2, 1991