Thermodynamics of the formation of surface PtO2 stripes on ...
7
10634 | Phys. Chem. Chem. Phys., 2020, 22, 10634--10640 This journal is © the Owner Societies 2020 Cite this: Phys. Chem. Chem. Phys., 2020, 22, 10634 Thermodynamics of the formation of surface PtO 2 stripes on Pt(111) in the absence of subsurface oxygen† Selwyn Hanselman, a Ian T. McCrum, a Marcel J. Rost b and Marc T. M. Koper * a This paper examines the thermodynamics of PtO 2 stripes formed as intermediates of Pt(111) surface oxidation as a function of the degree of dilation parallel to the stripes, using density functional theory and atomistic thermodynamics. Internal energy calculations predict 7/8 and 8/9 stripe structures to dominate at standard temperature and pressure, which contain 7 or 8 elevated PtO 2 units per 8 or 9 supporting surface Pt atoms, respectively. Moreover, we found a thermodynamic optimum with respect to mean in-stripe Pt–Pt spacing close to that of a-PtO 2 . Vibrational zero point energies, including bulk layer contributions, make a small but significant contribution to the stripe free energies, leading to the 6/7 stripe being most stable, although the 7/8 structure is still close in free energy. These findings correspond closely to experimental observations, providing insight into the driving force for oxide stripe formation and structure as the initial intermediate of platinum surface oxidation, and aiding our understanding of platinum catalysts and surface roughening under oxidative conditions. 1. Introduction Surface oxidation, which happens both in gas-phase catalysis and in electrochemical environments, impacts profoundly the selectivity, activity and stability of (electro)catalysts. 1,2 A commonly-used electrocatalyst material, platinum, has long been known to undergo surface oxidation during catalyst operation. 1–4 Whether as an electrocatalyst or as a gas-phase heterogeneous catalyst, the metal surface is exposed to oxygen species, which may lead to surface reconstruction, or in the case of aqueous media, dissolution. 5 Dissolution, 6–8 and reduction of surface oxides, 9 drive further reconstruction and (irreversible) roughening of the surface. 4,8,10,11 In order to mitigate any deleterious effects and improve our understanding of oxygen- induced surface roughening, we need to know the adsorption patterns of oxygen on – and in – platinum. There is ample evidence for more complicated oxygenation of Pt(111) than simple on-surface adsorption. At low oxygen coverages generated under ultrahigh vacuum (UHV) conditions, Devarajan et al. observed this on-surface adsorption of oxygen in fcc hollow sites using temperature programmed desorption and scanning-tunneling microscopy (STM) experiments. 12 Yet for oxygen coverages greater than 0.40 ML, some Pt atoms are elevated, forming PtO x stripe segments and (above 0.71 ML) honeycombs. Density functional theory (DFT) calculations by Hawkins et al. and force field simulations by Farkas et al. corroborated part of these findings by finding stripe segments at coverages equivalent to 0.75 ML and stable PtO 2 stripes for 1 ML coverage; all these structures were supported by subsurface oxygen. 13,14 Holby et al., on the other hand, indicated that it is not necessary to incorporate subsurface oxygen: they found striped structures alternating between flat and buckled stripes. 15 In practice, platinum catalysts are usually operated under standard or elevated pressures and close to standard temperature in the presence of O 2 , as opposed to UHV and high-temperature conditions using more strongly oxygenating reagents. Luo et al. found that for platinum films, exposure to either pure O 2 or mixtures of O 2 and water vapor led to near-monolayer oxygen coverage. 16 In an in situ STM study of oxygenation patterns, Van Spronsen et al. exposed Pt(111) to O 2 at pressures ranging from 1–5 bar and at temperatures between 300–538 K. 17 During O 2 exposure at 1 bar, a spokewheel structure is observed, above 2.2 bar accompanied by stripes as illustrated in Fig. 1. 17 The linear segments, or spokes of the spokewheel, are PtO 2 stripe a Leiden Institute of Chemistry, Leiden University, P.O. Box 9502, 2300 RA Leiden, The Netherlands. E-mail: [email protected] b Huygens-Kamerlingh Onnes Laboratory, Leiden University, Niels Bohrweg 2, 2333 CA Leiden, The Netherlands † Electronic supplementary information (ESI) available: Thermodynamics of stripe formation and free molecules, computational details of DFT calculations and stripe geometries, DFT formation energies and corrections for free mole- cules, surface and stripe vibrational analysis including bulk modes, formation energies of PtO 2 structures under standard conditions, and stripe formation energies with respect to Pt binding energies. All calculations are performed at 300 K, and simulations were performed using the PBE exchange–correlation functional through VASP. All structural images were rendered using VESTA. 33 See DOI: 10.1039/c9cp05107d Received 16th September 2019, Accepted 30th October 2019 DOI: 10.1039/c9cp05107d rsc.li/pccp PCCP PAPER Open Access Article. Published on 30 October 2019. Downloaded on 3/26/2022 1:06:54 AM. This article is licensed under a Creative Commons Attribution 3.0 Unported Licence. View Article Online View Journal | View Issue
Transcript of Thermodynamics of the formation of surface PtO2 stripes on ...

10634 | Phys. Chem. Chem. Phys., 2020, 22, 10634--10640 This journal is©the Owner Societies 2020
Cite this:Phys.Chem.Chem.Phys.,
2020, 22, 10634
Thermodynamics of the formation of surface PtO2
stripes on Pt(111) in the absence of subsurfaceoxygen†
Selwyn Hanselman,a Ian T. McCrum,a Marcel J. Rostb and Marc T. M. Koper *a
This paper examines the thermodynamics of PtO2 stripes formed as intermediates of Pt(111) surface
oxidation as a function of the degree of dilation parallel to the stripes, using density functional theory
and atomistic thermodynamics. Internal energy calculations predict 7/8 and 8/9 stripe structures to
dominate at standard temperature and pressure, which contain 7 or 8 elevated PtO2 units per 8 or 9
supporting surface Pt atoms, respectively. Moreover, we found a thermodynamic optimum with respect
to mean in-stripe Pt–Pt spacing close to that of a-PtO2. Vibrational zero point energies, including bulk
layer contributions, make a small but significant contribution to the stripe free energies, leading to the
6/7 stripe being most stable, although the 7/8 structure is still close in free energy. These findings
correspond closely to experimental observations, providing insight into the driving force for oxide stripe
formation and structure as the initial intermediate of platinum surface oxidation, and aiding our
understanding of platinum catalysts and surface roughening under oxidative conditions.
1. Introduction
Surface oxidation, which happens both in gas-phase catalysisand in electrochemical environments, impacts profoundlythe selectivity, activity and stability of (electro)catalysts.1,2
A commonly-used electrocatalyst material, platinum, has longbeen known to undergo surface oxidation during catalystoperation.1–4 Whether as an electrocatalyst or as a gas-phaseheterogeneous catalyst, the metal surface is exposed to oxygenspecies, which may lead to surface reconstruction, or in the caseof aqueous media, dissolution.5 Dissolution,6–8 and reduction ofsurface oxides,9 drive further reconstruction and (irreversible)roughening of the surface.4,8,10,11 In order to mitigate anydeleterious effects and improve our understanding of oxygen-induced surface roughening, we need to know the adsorptionpatterns of oxygen on – and in – platinum.
There is ample evidence for more complicated oxygenationof Pt(111) than simple on-surface adsorption. At low oxygencoverages generated under ultrahigh vacuum (UHV) conditions,Devarajan et al. observed this on-surface adsorption of oxygenin fcc hollow sites using temperature programmed desorptionand scanning-tunneling microscopy (STM) experiments.12 Yetfor oxygen coverages greater than 0.40 ML, some Pt atoms areelevated, forming PtOx stripe segments and (above 0.71 ML)honeycombs. Density functional theory (DFT) calculations byHawkins et al. and force field simulations by Farkas et al.corroborated part of these findings by finding stripe segmentsat coverages equivalent to 0.75 ML and stable PtO2 stripes for1 ML coverage; all these structures were supported by subsurfaceoxygen.13,14 Holby et al., on the other hand, indicated that it is notnecessary to incorporate subsurface oxygen: they found stripedstructures alternating between flat and buckled stripes.15
In practice, platinum catalysts are usually operated understandard or elevated pressures and close to standard temperaturein the presence of O2, as opposed to UHV and high-temperatureconditions using more strongly oxygenating reagents. Luo et al.found that for platinum films, exposure to either pure O2 ormixtures of O2 and water vapor led to near-monolayer oxygencoverage.16 In an in situ STM study of oxygenation patterns,Van Spronsen et al. exposed Pt(111) to O2 at pressures rangingfrom 1–5 bar and at temperatures between 300–538 K.17 DuringO2 exposure at 1 bar, a spokewheel structure is observed, above2.2 bar accompanied by stripes as illustrated in Fig. 1.17 Thelinear segments, or spokes of the spokewheel, are PtO2 stripe
a Leiden Institute of Chemistry, Leiden University, P.O. Box 9502, 2300 RA Leiden,
The Netherlands. E-mail: [email protected] Huygens-Kamerlingh Onnes Laboratory, Leiden University, Niels Bohrweg 2,
2333 CA Leiden, The Netherlands
† Electronic supplementary information (ESI) available: Thermodynamics ofstripe formation and free molecules, computational details of DFT calculationsand stripe geometries, DFT formation energies and corrections for free mole-cules, surface and stripe vibrational analysis including bulk modes, formationenergies of PtO2 structures under standard conditions, and stripe formationenergies with respect to Pt binding energies. All calculations are performed at300 K, and simulations were performed using the PBE exchange–correlationfunctional through VASP. All structural images were rendered using VESTA.33 SeeDOI: 10.1039/c9cp05107d
Received 16th September 2019,Accepted 30th October 2019
DOI: 10.1039/c9cp05107d
rsc.li/pccp
PCCP
PAPER
Ope
n A
cces
s A
rtic
le. P
ublis
hed
on 3
0 O
ctob
er 2
019.
Dow
nloa
ded
on 3
/26/
2022
1:0
6:54
AM
. T
his
artic
le is
lice
nsed
und
er a
Cre
ativ
e C
omm
ons
Attr
ibut
ion
3.0
Unp
orte
d L
icen
ce.
View Article OnlineView Journal | View Issue

This journal is©the Owner Societies 2020 Phys. Chem. Chem. Phys., 2020, 22, 10634--10640 | 10635
structures which are platinum deficient relative to the under-lying surface, causing a B14% lattice mismatch of PtO2 struc-tures relative to the pristine surface lattice vectors. In otherterms, these structures contain 7/8 PtO2 units per Pt atompartaking in the reaction.
This lattice mismatch appears to be mirrored in sub-monolayer PtOx structures studied by Hawkins et al., whofound non-contiguous PtOx clusters supported by subsurfaceoxygen to be dilated relative to the underlying platinum bulklattice parameter.13 The presence of subsurface oxygen supportingPt atoms corresponds to the concept of place exchange, whichwas first proposed by Reddy et al. for electrochemical oxidationof platinum,18 and later supported by a kinetic study by Conwayet al. and X-ray measurements by You et al.19–21 The traditionaldefinition of place-exchange, as mentioned by Drnec et al.,involves switching one platinum atom in the surface byone oxygen atom, lifting the former from the surface andintegrating the latter into it. Yet, platinum atoms in VanSpronsen et al.’s study appear to be elevated in continuousstretches, and the oxygen coverage is twice the fraction ofsurface platinum atoms in the stripes, which are lifted throughoxidation. This suggests that contrary to Hawkins et al.’s PtOx
structures, Van Spronsen’s structures on average consist ofPtO2 units even below 1 ML oxygen coverage. All these liftedatoms are found to be adjacent in spokewheel structures, whichone would not expect if buckled stripes play a major role as inthe model proposed by Holby et al.15 XPS measurements onstripe structures by Van Spronsen show 0.88 ML O coverage,indicating regular 7/8 dilation, yet could not be elucidated
using STM imaging. Additionally, platinum atoms are expelledfrom the pristine surface domain on which these stripesare formed, an effect not taken into account by Hawkinset al.13 This may in turn aid the formation of serpentineislands otherwise attributed to adsorbate-induced strain byVan Spronsen et al. Most strikingly, Van Spronsen et al.’sresults indicate that subsurface oxygen is not necessaryto stabilize PtO2 surface structures under (near-)standardoxidizing conditions.
Apart from their role in gas-phase Pt oxidation, PtO2 stripesmay also be first intermediates in the electrochemical oxidationof Pt electrodes. Furuya et al. detected oxidized platinum atomsexposed on-surface under electrochemical conditions atB1.05–1.20 V, suggesting the formation of surface PtOx in aso-called quasi-3D structure as in gas-phase Pt oxidation.5
In situ electrochemical STM measurements by Jacobse et al.show that cycling of Pt(111) through relatively mild oxidativepotentials of 1.35 V initially causes island formation, andsubsequently irreversibly roughens the surface during multipleoxidation–reduction cycles,11 in agreement with X-ray spectro-scopy measurements by Ruge et al.22 Lifting of Pt atoms fromthe surface has been observed through in situ X-ray observa-tions of electrochemical Pt oxidation and assumed to involveplace exchange;4,23 Drnec et al., however, noted that theirmeasurements do not show either an ordered overlayer with adifferent lattice parameter, nor an amorphous oxide structure,but they cannot exclude the possibility of (long-range) oxidechain formation.4 Together, these findings suggest a role for aPtOx based intermediate not supported by subsurface oxygenunder electrochemical conditions, both regarding reactivity ofPt electrodes at high potentials and the surface transformationas a result of oxidation–reduction cycles.
In this study, we investigate the formation energies ofsubsurface oxygen-free PtO2 stripes as proposed by Van Spronsen,and attempt to reproduce their structures, using DFT methods.In the process, we compare various stripe PtO2/Pt(displaced)ratios, calculate their energies as a function of oxygen chemicalpotential and electrochemical potential, and discuss theirsimilarity to the ordering of the spokewheel segments, andhow these energies are related to PtO2 geometries and bulkplatinum properties.
2. Density functional theory methodsand initial structure generation
All calculations on Pt(111) and oxidized Pt(111) were performedusing density functional theory (DFT) in the Vienna Ab InitioSimulation Package,24 with the spin-restricted Perdew–Burke–Ernzerhof (PBE) exchange correlation functional.25 All plane-wave cutoffs are equal to 450 eV, while ionic cores are describedusing plane augmented wave (PAW) pseudopotentials for PBEsupplied in the VASP 5.2 distribution.24 Orbital occupancies inslab systems and bulk solids are subject to 0.20 eV first orderMethfessel–Paxton smearing,26 whereas gas-phase moleculesare subject to 0.0001 eV Gaussian smearing.27 The bulk Pt
Fig. 1 Artist’s impression of spokewheel (a) and stripe (b) models adaptedfrom Van Spronsen et al.17
Paper PCCP
Ope
n A
cces
s A
rtic
le. P
ublis
hed
on 3
0 O
ctob
er 2
019.
Dow
nloa
ded
on 3
/26/
2022
1:0
6:54
AM
. T
his
artic
le is
lice
nsed
und
er a
Cre
ativ
e C
omm
ons
Attr
ibut
ion
3.0
Unp
orte
d L
icen
ce.
View Article Online

10636 | Phys. Chem. Chem. Phys., 2020, 22, 10634--10640 This journal is©the Owner Societies 2020
lattice parameter a was found to be equal to 3.9754 Å throughminimization of internal energy of a single atom fcc bulk cellunder variation of lattice vector lengths. Computational detailspertaining to gas phase molecules (H2(g), H2O(g)) are listed inSection 3 of the ESI.†
We defined cells for (111) M� N surface slabs for each stripecoverage ratio; similarly, we created bulk cells by stacking six(111) layers of M � N platinum atoms. Cell dimensions andparameters used for these slabs and bulk cells are listed inTable S.1 in the ESI.† Specifically, each unit cell is defined ashaving a 2 � N-601 translational surface symmetry, and latticevectors (including the additional lattice vector in the bulk) runparallel to shortest-distance atom pair vectors. The k pointsamples along each lattice vector are obtained from gamma-centered (24/M) � (24/N) � 1 grids for surface slabs, andgamma-centered (24/M) � (24/N) � 4 grids for bulk crystal,respectively; 24 points were chosen per reciprocal atom for thatdensity provides a sufficient balance between computationalefficiency and convergence of the formation energy.
Within the constraints posed by the surface slab cells,we created one M � N surface for each slab cell defined inTable S.1 (ESI†), which we subsequently relaxed below a maximumatomic force of 0.01 eV Å�1. We generated simulation cellscontaining on-surface adsorbed O* configurations for 0.25 ML,
0.33 ML, and 1.0 ML coverages, using 4 � 4,ffiffiffi
32p�
ffiffiffi
32p
and4 � 4 unit cells respectively. For these on-surface O* configura-tions, all oxygen atoms are placed strictly above the top layer ofuncorrugated Pt(111) surfaces, and distributed as equidistantlyas possible. In these cells, no Pt atoms were lifted from the toplayer of the Pt(111) surface.
We generated initial PtO2 stripe supercells (1 ML) from the2 � 4 slab cell by lifting one surface row or a grid consisting ofeight atom-wide triangles, respectively, and suspending themusing oxygen atoms following the suggestions by Van Spronsenet al.17 From these structures we created cells containingdilated stripes (stripe/surface ratios: 2/3, 3/4, 4/5, 5/6, 6/7, 5/8,7/8, 8/9, 9/10) by removing one PtO2 unit from each stripesupercell, and scaling the remaining PtO2 segments along thelong surface vector to close the gap left behind. For the stripecells, Pt (in the oxide)-to-Pt (in the surface) ratios vary from 2/3to 9/10. To more broadly sample low-energy stripe structures,platinum and oxygen coordinates in initial PtO2 stripes wereeither shifted systematically relative to the surface (by eitherhalf or a quarter of bulk interatomic spacing) or randomlydisplaced, and oxygen atoms were selectively moved to obtaingeometries containing low-coordinated Pt sites in specificstripe segments. This process is illustrated in Fig. 2.
Resulting stripe structures and on-surface O* configurationswere relaxed, and vibrational analysis was performed on thelowest DFT energy configurations pertaining to individual stripePtO2/Pt(displaced) ratios. These computations are detailed in theESI.† Relaxed geometries of the 2/3, 3/4, 7/8, and 1/1 dilated PtO2
stripes are shown in Fig. 3. We calculated Helmholtz freeenergies for Pt(111) and oxidized Pt(111) surface slabs usingthe methods listed in Section 1 of the ESI.†
3. Results and discussion3.1 Results without vibrational energy
In all geometry optimizations (both in- and excluding vibra-tional energy), the most stable PtO2 stripes contain stretches ofnearly rectangular planar 4-coordinated stripe Pt atoms withsurrounding oxygen atoms slightly misaligned with respect tothe surface vectors, alternating with single 2-coordinated stripePt atoms as shown for the 7/8 structure in Fig. 3. This holds forall structures ranging from 4/5 to 8/9. Fig. 4 plots stripeenergies against individual and mean Pt–Pt spacing (excludingstripe vibrations), and shows that the formation energies aredirectly related to the degree of lattice mismatch. This assump-tion is reasonable given there are no apparent phase changes ineither the PtO2 stripes or in respective decorated surfaces.Excluding vibrations, the optimum PtO2/Pt(displaced) ratio liesbetween 7/8 and 8/9, judging from a least-squares quadratic fitof the four lowest-energy points (see Fig. 4). In general, theshorter Pt–Pt distances in the four most stable stripes clusterbetween the Pt–Pt distance in bulk a-PtO2 and that of theshorter Pt–Pt spacing in bulk b-PtO2, while the longer Pt–Ptdistances are close to that of longer Pt–Pt spacing in bulkb-PtO2. The optimum Pt–Pt spacing appears to be 3.20 Å, whilefor 7/8 and for 8/9, they are 3.22 Å and 3.17 Å, respectively(R2 = 0.930). The average Pt–Pt distances in the 7/8 and 8/9stripes are relatively close to those in bulk a-PtO2, which is the moststable bulk PtO2 phase. The relation between PtO2/Pt(displaced)ratios and stripe thermodynamics including vibrational energieswill be discussed later in this paper.
The most stable stripe structures found in our calculations,i.e. the 6/7, 7/8, and 8/9 stripes, correspond closely to the
Fig. 2 Initial geometry production process, from left to right: (side view) surfaceoptimization, formation of full coverage PtO2 stripe by lifting one surface row,(top view) omission of one PtO2 unit from an PtO2 covered surface supercell,and rearrangement of Pt and O atoms (illustrating final structure after both initialmanual displacement/dilation and DFT geometry relaxation).
Fig. 3 Relaxed PtO2 stripe structures in top and front views. Platinumatoms are gray (darker grey is deeper into the slab), and oxygen atoms arered and relatively smaller.
PCCP Paper
Ope
n A
cces
s A
rtic
le. P
ublis
hed
on 3
0 O
ctob
er 2
019.
Dow
nloa
ded
on 3
/26/
2022
1:0
6:54
AM
. T
his
artic
le is
lice
nsed
und
er a
Cre
ativ
e C
omm
ons
Attr
ibut
ion
3.0
Unp
orte
d L
icen
ce.
View Article Online

This journal is©the Owner Societies 2020 Phys. Chem. Chem. Phys., 2020, 22, 10634--10640 | 10637
spokewheel structures observed by Van Spronsen et al. There isa close correlation between the Pt–Pt atom spacing in the stripeand the formation energy. The correspondence of most stablePt–Pt spacing with those in most stable bulk structuresindicates the physics underlying Pt–O bulk and stripe oxideinteractions are remarkably similar; hence, such structures mayaid bulk formation. Taken together, both observations suggestthat the degree to which Pt–Pt or Pt–O bonds can relaxdominates stripe thermodynamics, and suggests that removalof platinum from the stripe relative to the density of Pt in theunderlying surface is favorable, allowing the stripe to dilate.
Energies of formation for each individual stripe – excludingvibrational free energies of the PtO2 units and the underlyingsurfaces – are plotted against the O2 chemical potential and theelectrochemical potential relative to the computational hydro-gen electrode (E0–ESHE) in Fig. 5. The plot includes on-surfaceO* configurations, in which no platinum is lifted from thesurface as described previously. For a Pt (in stripe)–Pt (insurface) ratio of 1, all original surface atoms lifted from thesurface remain in the stripe. For other PtO2/Pt(displaced) ratios,some platinum atoms are instead expelled from the area in whicha stripe is being formed, and migrate on top of the originalsurface. Hence, a plot of the free energy of formation againstthe chemical potential of the expelled Pt atom(s) is included inFigure S.2 in the ESI.†
We can infer from Fig. 5 that forming non-dilated stripes,i.e. surface oxidation without emitting Pt atoms from the surface,is stable only at high oxygen chemical potential or high electro-chemical potential. In contrast, 5/6, 6/7, 7/8, 8/9 dilated stripes aresignificantly more stable than either the Pt(111) surface or stripeswith other PtO2/Pt(displaced) ratios at 1 bar O2 pressure andstandard temperature. This means there is a clear (electronic)driving force towards lower PtO2/Pt(displaced) ratios in general.Stripe formation is also more favorable than high-coverage (1 ML)on-surface oxygen adsorption, as shown in Fig. 5.
3.2 Results with vibrational energy
As the internal energy difference between 7/8 and 8/9 stripes isB2 meV/Pt(surf), and the difference between 6/7 or 9/10 andthe 8/9 stripe is B20 meV/Pt(surf), vibrational energies mightinfluence the trend as for which stripe is most stable.
Our oxygen coverages are high, entire rows of Pt atomsare lifted out of the surface, there are strong adsorbate–surface interactions, and minute energy differences between
Fig. 4 Relative stripe formation energies (per surface platinum atom, without vibrational contribution to the energy) versus individual Pt–Pt distances(in the stripe) and mean spacings, including a quadratic fit of mean spacings near the energy minimum (marked by a descender from the apex ofthe parabola) and bulk Pt–Pt spacings for Pt, a-PtO2 and b-PtO2; legend in inset.
Fig. 5 Energies of formation, excluding the contribution of the vibrationalmodes, for oxygenated Pt surfaces with respect to the O2 chemicalpotential and the electrochemical potentials. Lines are labeled by thecorresponding stripe PtO2/Pt(displaced) ratios M/N or coverages x MLO*. Contiguous lines refer to PtO2 stripes; colors correspond to PtO2/Pt(displaced) ratios as defined in the color bars (bottom-left inset). Dashedlines refer to on-surface O*. Both figures are based on DFT bindingenergies for Pt bulk (see Table S.5 in the ESI†).
Paper PCCP
Ope
n A
cces
s A
rtic
le. P
ublis
hed
on 3
0 O
ctob
er 2
019.
Dow
nloa
ded
on 3
/26/
2022
1:0
6:54
AM
. T
his
artic
le is
lice
nsed
und
er a
Cre
ativ
e C
omm
ons
Attr
ibut
ion
3.0
Unp
orte
d L
icen
ce.
View Article Online
10638 | Phys. Chem. Chem. Phys., 2020, 22, 10634--10640 This journal is©the Owner Societies 2020
individual configurations. A traditional adsorbate-only vibrationalanalysis (where the surface vibrational modes are assumedun-perturbed by the adsorbate) may hence lead to incorrectapproximations of vibrational enthalpies and entropies. Hencewe attempt to subsume standard adsorbate-only vibrationalanalysis into a adsorbate-bulk vibrational analysis. This methodol-ogy is based on the assumption that the amplitudes of forcesexerted between two atoms in a lattice decay quickly enough withincreasing distance between them. This enables us to describetheir vibrational modes using only short-range interactions wherenecessary, including between different simulation models.
Using this method, we may stack bulk layers under thesurface of interest, aiming to converge to a vibrational energywhich accurately represents both surface, bulk, and surface–bulk interactions. While selecting the atoms taking part in thisvibrational analysis, one must take into account to which degreethe vibrational data correctly represents the atoms affected bythe chemical reaction under study. In the context of the stripe-oxygenated Pt surfaces we are studying, four categories of atomscan be defined: stripe atoms, the (remaining) top surface atoms,the first underlying layer and the underlying layers or bulk. Forpristine surfaces, the former two correspond to the top surfacelayer, while the second corresponds to the first subsurface layer.
We decided to analyze 5/6, 6/7, 7/8, and 8/9 stripes as theirinternal energies are closest to the optimum and, hence, theyare the structures of which the relative energies may be affectedmost by vibrational energy contributions (see Table S.6, ESI†).In calculating the vibrational contribution to the free energy, allvibrational modes were calculated by �0.02 Å single atomdisplacements along Cartesian unit vectors, of which one isparallel to the short edge of the surface, and the other isperpendicular to the surface. The forces exerted by thesestripe/surface/subsurface atoms on each other and on the firsttwo underlying layers are compiled into a group of Hessianmatrix elements – note that we only have information on stripe-to-underlying layer coupling rather than the other way around –which is combined with a large Hessian matrix describing theforce gradients of a set of bulk layers with the two underlyinglayers mentioned above and (if applicable) two layers above andbelow the current bulk layer. This matrix is illustrated inFig. S.1 in the ESI;† some further practical details are listedin ESI Section 4.†
When including only the first (corrugated) platinum layerand the oxygen atoms, vibrational contributions destabilizestable stripes by B0.35 eV per Pt(surf) relative to their respec-tive pristine surfaces. Including three bulk layers, for which thevibrational energy converges while remaining computationallyreliable as shown in ESI Section 4,† causes a further increaseof vibrational free energy for less dilated structures, and adecrease in energy for the more dilated structures. Addingtwo additional bulk layers beyond the first layer results invibrational free energy changes ranging from 10–40 meV perPt(surf), depending on the stripe PtO2/Pt(displaced) ratio (seeTable S.4 in the ESI†). The resulting vibrational energiesdepend monotonously on PtO2/Pt(displaced) ratios, indicatingthat stripes with PtO2/Pt(displaced) ratios between those
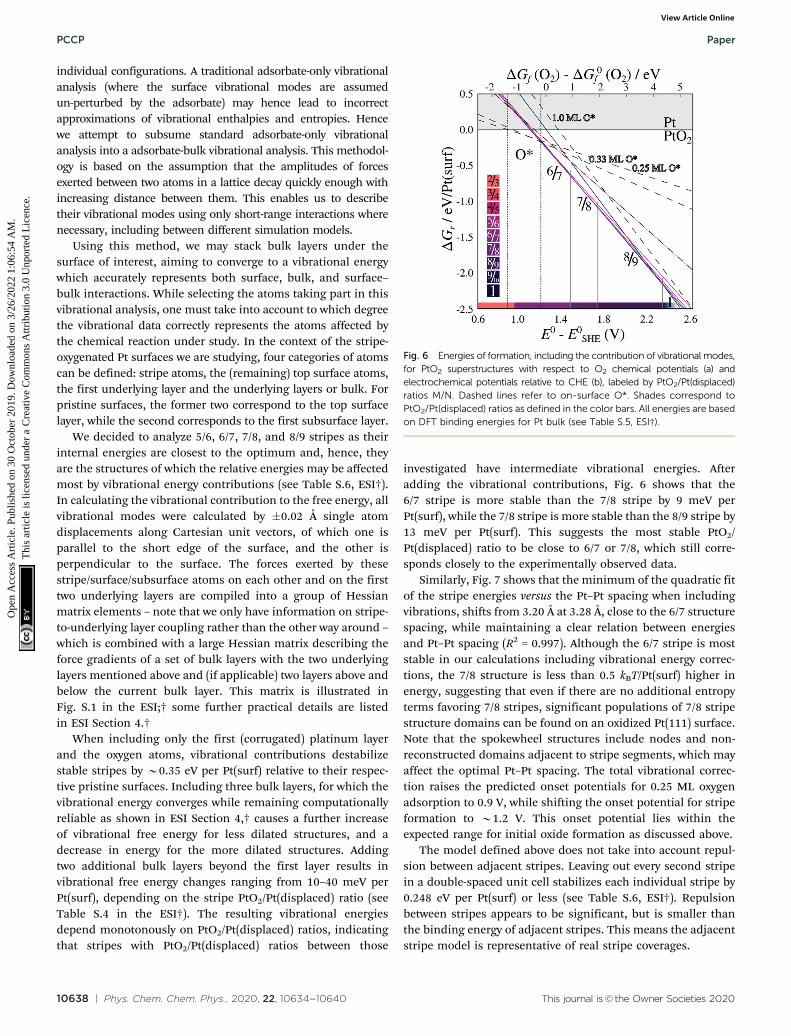
investigated have intermediate vibrational energies. Afteradding the vibrational contributions, Fig. 6 shows that the6/7 stripe is more stable than the 7/8 stripe by 9 meV perPt(surf), while the 7/8 stripe is more stable than the 8/9 stripe by13 meV per Pt(surf). This suggests the most stable PtO2/Pt(displaced) ratio to be close to 6/7 or 7/8, which still corre-sponds closely to the experimentally observed data.
Similarly, Fig. 7 shows that the minimum of the quadratic fitof the stripe energies versus the Pt–Pt spacing when includingvibrations, shifts from 3.20 Å at 3.28 Å, close to the 6/7 structurespacing, while maintaining a clear relation between energiesand Pt–Pt spacing (R2 = 0.997). Although the 6/7 stripe is moststable in our calculations including vibrational energy correc-tions, the 7/8 structure is less than 0.5 kBT/Pt(surf) higher inenergy, suggesting that even if there are no additional entropyterms favoring 7/8 stripes, significant populations of 7/8 stripestructure domains can be found on an oxidized Pt(111) surface.Note that the spokewheel structures include nodes and non-reconstructed domains adjacent to stripe segments, which mayaffect the optimal Pt–Pt spacing. The total vibrational correc-tion raises the predicted onset potentials for 0.25 ML oxygenadsorption to 0.9 V, while shifting the onset potential for stripeformation to B1.2 V. This onset potential lies within theexpected range for initial oxide formation as discussed above.
The model defined above does not take into account repul-sion between adjacent stripes. Leaving out every second stripein a double-spaced unit cell stabilizes each individual stripe by0.248 eV per Pt(surf) or less (see Table S.6, ESI†). Repulsionbetween stripes appears to be significant, but is smaller thanthe binding energy of adjacent stripes. This means the adjacentstripe model is representative of real stripe coverages.
Fig. 6 Energies of formation, including the contribution of vibrational modes,for PtO2 superstructures with respect to O2 chemical potentials (a) andelectrochemical potentials relative to CHE (b), labeled by PtO2/Pt(displaced)ratios M/N. Dashed lines refer to on-surface O*. Shades correspond toPtO2/Pt(displaced) ratios as defined in the color bars. All energies are basedon DFT binding energies for Pt bulk (see Table S.5, ESI†).
PCCP Paper
Ope
n A
cces
s A
rtic
le. P
ublis
hed
on 3
0 O
ctob
er 2
019.
Dow
nloa
ded
on 3
/26/
2022
1:0
6:54
AM
. T
his
artic
le is
lice
nsed
und
er a
Cre
ativ
e C
omm
ons
Attr
ibut
ion
3.0
Unp
orte
d L
icen
ce.
View Article Online

This journal is©the Owner Societies 2020 Phys. Chem. Chem. Phys., 2020, 22, 10634--10640 | 10639
The onset (electro)chemical potential for the formation ofatomic oxygen and surface oxide stripes compares well withoxygen adsorption/oxide formation observed experimentally.Before the formation of the PtO2 film, and in the absence ofspecific adsorption of Pt(111) (i.e. in perchloric acid), there is avoltammetric peak at 1.10 V (with an onset at B1.05 V) typicallyattributed to surface atomic oxygen (but see studies byHuang et al.28,29).30 Importantly, the formation of this surfacespecies does not involve any major structural rearrangement ofthe platinum surface atoms. Using in situ X-ray spectroscopy,Liu et al. have shown that higher densities of on-surface O* on aPt(111) electrode, which they find near 0.8 to 1.0 V, lead topartial perpendicular displacement of Pt atoms from the topsurface layer. This suggests that higher coverages may cause Ptatoms to be lifted from the surface, which is a first step towardsreconstruction into PtO2 stripes. Further oxidation of Pt(111)leads to a new voltammetric feature with an onset at ca. 1.25 V.In situ Raman spectroscopic measurements of Pt(111) by Huanget al. have shown that this feature is accompanied by theformation of an a-PtO2 film.28 Once this film is formedand subsequently reduced, the Pt(111) structure changes anddevelops defect sites,11 in agreement with the idea that theformation of the oxide film (or oxide stripes) leads to anexpulsion of Pt atoms, which do not return to their originalposition after oxide reduction. These observations are in excellentagreement with the predictions of Fig. 5 and 6. The relativestability of stripe structures also corresponds well with thefindings by Van Spronsen et al. mentioned in the Introduction,17
who observed 7/8 dilated spokewheel segments in SEM images.Van Spronsen’s stripes were created at 2.2 bar and 535 K, which isequivalent to an oxygen potential shift of�0.488 eV or an electrodepotential at 300 K of 1.11 V. The PtO2/Pt(displaced) ratio of thestripes determines the number of Pt atoms expelled from the Ptsurface during a single oxidation–reduction cycle (this numberis larger with a smaller PtO2/Pt(displaced) ratio). The larger this
number, the faster the surface will roughen during multipleoxidation–reduction cycles (for a detailed model of this surfaceroughening, see Rost et al.31). Pt from the platinum oxide may alsodissolve into the electrolyte during the reductive scan, leading toplatinum corrosion; however, this Pt dissolution is expected to bemore dominant when a thicker oxide is formed.6,32
When comparing the stripe model and our correspondingresults to the electrochemical place-exchange studies, we find thatoxide chains are plausible products of Pt(111) oxidation underelectrochemical conditions, compatible with X-ray diffractionanalysis by Drnec et al.4 Although the structures we studied exhibitlong-range order, which runs contrary to the conclusions of Drnecet al., the observation of disordered and isolated spokewheels byVan Spronsen et al. in early Pt(111) oxidation is consistent withboth our dilated stripe structures and findings by Drnec et al.4,17 Ptatoms are suspended by more than one oxygen atom; in fact, twooxygen atoms per Pt atom are adsorbed above surface platinumatoms. This agrees with electron distributions found by Drnecet al.,4 yet contradicts their assumed place exchange model inwhich one O atom displaces one Pt atom and is incorporated intothe surface.4,22 Additionally, even though they consider their databased on the traditional concept of place-exchange, their observa-tion of two discrete zones of oxygen atoms between two layers of Ptatoms, rather than being embedded within a surface Pt layer,4
suggests no oxygen is incorporated into the surface during placeexchange, and that no oxygen is found above the Pt atoms. Thiscontradicts the alternatingly buckled stripe model as proposedby Holby et al.15 The stripes found through our relaxation hadO atoms and lifted Pt atoms elevated roughly the same amountabove the original Pt(111) surface, which seems to disagree withthe Pt(surf)–O–Pt layering found by Drnec et al.; however, we didnot include dipole stabilization, which does happen in aqueousenvironments and may provide a driving force for lifted Pt atomsto pucker out of the stripe. Altogether, we find that non-buckledstripe – or spokewheel – formation is a more likely process ofelectrochemical oxidation of Pt(111) than either buckled stripesor traditional place exchange.
4. Conclusion
Understanding the driving forces for stripe structure formationallows us to better understand Pt catalyst structure evolutionunder oxidative and electrochemical conditions. We have founda clear correlation between increasingly oxidative potentials andthe surface phase transition from adsorbed oxygen to the PtO2
stripes, and the thermodynamics of stripe formation suggests thatthe optimum average Pt–Pt spacing, and the spacing observed inspokewheel PtO2 structures by Van Spronsen et al., is close to thatof both bulk PtO2 species. This results in expulsion of platinumatoms relative to the Pt density in the surface layer, allowing thedilation of the stripe to occur. Formation of these PtO2 stripes isplausible at electrochemical potentials similar to those suggestedin literature for oxygen adsorption and surface oxide formation.This indicates we have found a plausible early oxidation structurewhich not only closely corresponds to the stripe hypothesis by
Fig. 7 Comparison of selected stripe energies with and without vibrationalenergy corrections and their respective quadratic fits; legend in inset.
Paper PCCP
Ope
n A
cces
s A
rtic
le. P
ublis
hed
on 3
0 O
ctob
er 2
019.
Dow
nloa
ded
on 3
/26/
2022
1:0
6:54
AM
. T
his
artic
le is
lice
nsed
und
er a
Cre
ativ
e C
omm
ons
Attr
ibut
ion
3.0
Unp
orte
d L
icen
ce.
View Article Online

10640 | Phys. Chem. Chem. Phys., 2020, 22, 10634--10640 This journal is©the Owner Societies 2020
van Spronsen et al. and their observations in gas phase, but alsoprovide a good description of the electrochemical oxidation of thePt(111) surface. The platinum oxide structures we have found area key towards understanding the roughening observed duringoxidation–reduction cycles, as well as to the formation of thickeroxide layers on Pt(111).
Our findings show that accurate computational modeling ofelectrochemical oxidation reactions on Pt(111) is possible,including active sites specific to PtO2 stripes. This knowledgeis equally applicable to Pt(111) surfaces under elevated O2
pressure. Hence, future computational work may aid the designof more active real-life industrial platinum(-like) catalysts.
Conflicts of interest
There are no conflicts to declare.
Acknowledgements
This work was partially supported by the Netherlands Organiza-tion for Scientific Research (NWO) in the framework of the SolarFuels Graduate Program. Additionally this project has receivedfunding from the European Union’s Horizon 2020 research andinnovation programme under the Marie Skłodowska-Curie grantagreement No. 707404. Supercomputing facilities (Cartesius atsurfSARA) used in this project were sponsored by NWO PhysicalSciences, with financial support from NWO.
References
1 B. L. M. Hendriksen and J. W. M. Frenken, Phys. Rev. Lett.,2002, 89, 046101.
2 M. D. Ackermann, T. M. Pedersen, B. L. M. Hendriksen,O. Robach, S. C. Bobaru, I. Popa, C. Quiros, H. Kim,B. Hammer, S. Ferrer and J. W. M. Frenken, Phys. Rev. Lett.,2005, 95, 255505.
3 I. Langmuir, Trans. Faraday Soc., 1922, 17, 621–654.4 J. Drnec, M. Ruge, F. Reikowski, B. Rahn, F. Carla, R. Felici,
J. Stettner, O. M. Magnussen and D. A. Harrington,Electrochim. Acta, 2017, 224, 220–227.
5 Y. Furuya, T. Mashio, A. Ohma, M. Tian, F. Kaveh,D. Beauchemin and G. Jerkiewicz, ACS Catal., 2015, 5,2605–2614.
6 A. A. Topalov, I. Katsounaros, M. Auinger, S. Cherevko,J. C. Meier, S. O. Klemm and K. J. J. Mayrhofer, Angew.Chem., Int. Ed., 2012, 51, 12613–12615.
7 V. Komanicky, K. C. Chang, A. Menzel, N. M. Markovic,H. You, X. Wang and D. Myers, J. Electrochem. Soc., 2006,153, B446–B451.
8 M. Matsumoto, T. Miyazaki and H. Imai, J. Phys. Chem. C,2011, 115, 11163–11169.
9 T. M. Pedersen, W. X. Li and B. Hammer, Phys. Chem. Chem.Phys., 2006, 8, 1566–1574.
10 P. P. Lopes, D. Tripkovic, P. F. B. D. Martins, D. Strmcnik,E. A. Ticianelli, V. R. Stamenkovic and N. M. Markovic,J. Electroanal. Chem., 2018, 819, 123–129.
11 L. Jacobse, Y. F. Huang, M. T. M. Koper and M. J. Rost, Nat.Mater., 2018, 17, 277–282.
12 S. P. Devarajan, J. A. Hinojosa and J. F. Weaver, Surf. Sci.,2008, 602, 3116–3124.
13 J. M. Hawkins, J. F. Weaver and A. Asthagiri, Phys. Rev. B:Condens. Matter Mater. Phys., 2009, 79, 125434.
14 A. Farkas, D. Fantauzzi, J. E. Mueller, T. W. Zhu, C. Papp,H. P. Steinruck and T. Jacob, J. Electron Spectrosc., 2017, 221,44–57.
15 E. F. Holby, J. Greeley and D. Morgan, J. Phys. Chem. C, 2012,116, 9942–9946.
16 H. Luo, S. Park, H. Y. H. Chan and M. J. Weaver, J. Phys.Chem. B, 2000, 104, 8250–8258.
17 M. A. van Spronsen, J. W. M. Frenken and I. M. N. Groot,Nat. Commun., 2017, 8, 429.
18 A. K. N. Reddy, M. A. Genshaw and J. O. Bockris, J. Chem.Phys., 1968, 48, 671–674.
19 H. You, D. J. Zurawski, Z. Nagy and R. M. Yonco, J. Chem.Phys., 1994, 100, 4699–4702.
20 B. E. Conway, B. Barnett, H. Angerstein-Kozlowska andB. V. Tilak, J. Chem. Phys., 1990, 93, 8361–8373.
21 B. E. Conway, Prog. Surf. Sci., 1995, 49, 331–452.22 M. Ruge, J. Drnec, B. Rahn, F. Reikowski, D. A. Harrington,
F. Carla, R. Felici, J. Stettner and O. M. Magnussen, J. Am.Chem. Soc., 2017, 139, 4532–4539.
23 Y. H. Liu, A. Barbour, V. Komanicky and H. You, J. Phys.Chem. C, 2016, 120, 16174–16178.
24 G. Kresse and J. Furthmuller, Phys. Rev. B: Condens. MatterMater. Phys., 1996, 54, 11169–11186.
25 J. P. Perdew, K. Burke and M. Ernzerhof, Phys. Rev. Lett.,1996, 77, 3865–3868.
26 M. Methfessel and A. T. Paxton, Phys. Rev. B: Condens.Matter Mater. Phys., 1989, 40, 3616–3621.
27 S. Hanselman, M. T. M. Koper and F. Calle-Vallejo, ACSEnergy Lett., 2018, 3, 1062–1067.
28 Y. F. Huang, P. J. Kooyman and M. T. M. Koper, Nat.Commun., 2016, 7, 12440.
29 Y. F. Huang and M. T. M. Koper, J. Phys. Chem. Lett., 2017, 8,1152–1156.
30 A. M. Gomez-Marin and J. M. Feliu, Electrochim. Acta, 2012,82, 558–569.
31 M. J. Rost, L. Jacobse and M. T. M. Koper, Nat. Commun.,2019, DOI: 10.1038/s41467-019-13188-0.
32 X. Deng, F. Galli and M. T. M. Koper, J. Am. Chem. Soc., 2018,140, 13285–13291.
33 K. Momma and F. Izumi, J. Appl. Crystallogr., 2011, 44,1272–1276.
PCCP Paper
Ope
n A
cces
s A
rtic
le. P
ublis
hed
on 3
0 O
ctob
er 2
019.
Dow
nloa
ded
on 3
/26/
2022
1:0
6:54
AM
. T
his
artic
le is
lice
nsed
und
er a
Cre
ativ
e C
omm
ons
Attr
ibut
ion
3.0
Unp
orte
d L
icen
ce.
View Article Online