Thermodynamics of the Densification Process for Polymer ...
15
JOURNAL OF RESEARCH of the National Bureau of Standards-A. Physics and Chemistry Vol. 81A, Nos. 2 and 3, March-June 1977 Thermodynamics of the Densification Process for Polymer Glasses John E. McKinney Institute for Materials Research, National Bureau of Standards, Washington, D. C. 20234 and Robert Simha Department of Macromolecular Science, Case Western Reserve University, Cleveland, Ohio 44106 (May 3f 1977) A quantitative description is given for the densification process of glasses resulting from glass formation at elevated pressures. Phenomenological relations are derived, or justified, which allow estimation of the densifica- tion rate K' (with respect to formation pressure) from various thermodynamic quantities and glass transition behavior. In addition, the estimation of K' may be facilitated by the application of the hole theory of Simha and Somcynsky. Using these relations K' is estimated, and the results from the different methods are compared for data from 23 different organic polymers with glass transition temperatures ranging from 150 to 455 K. The amount of densification appears to be limited by the apparent convergence of the glass temperature and effective decomposi- tion temperature with increasing pressure. Some estimates of limiting values are presented. Finally, changes of refractive index resulting from densification are estimated from the observed, or predicted, densification rates. Key words: Compressibility; densification; glass; glass transition; liquid; polymer; pressure; PVT; pyrolysis; refractive index; thermal expansion; thermodynamic. 1. Introduction The density of a glass, as well as certain other properties, depend upon the thermodynamic history by which the glass is formed. For example, as shown schematically in figure la, an amorphous polymer subjected to an elevated pressure in the melt, followed by isobaric cooling at constant rate to a temperature well below the glass temperature, T g , and then depressurized, will have a larger density than that obtained by isobaric cooling at the same rate at atmospheric pressure to the same temperature in the glass. From the former proce- dure the pressure induced densification rate is defined as K! = -(l/V)(dV/dP') T , P , k (1) where V is the volume at temperature T and pressure P, and P' is the formation pressure maintained during constant rate of cooling k. Note that this definition parallels the usual one for the isothermal compressibility, K = -a/v)(dv/dP) TJ ,,, k , (2) the difference being that P andP' are interchanged. It is expected that the final depressurized volume in the glass will lie between the atmospheric and the pressurized value, as shown in figure la. It is then clear that the inequality, K g > K' >0 where K g is the compressibility of the glass, is obeyed. p=o P=P' T (o) vAo- Vbo- Glass Liquid S ST -^(k 2 ) k,>k2 /P=0 T (b) FIGURE 1. Schematic illustration of two methods used to obtain densified glasses. (a) Densification by elevating the formation pressure at the same cooling rate ki. (b) The same densification is obtained by commensurately decreasing the cooling rate at atmospheric pressure. 283
Transcript of Thermodynamics of the Densification Process for Polymer ...
JOURNAL OF RESEARCH of the National Bureau of Standards-A. Physics and Chemistry Vol. 81A, Nos. 2 and 3, March-June 1977
Thermodynamics of the Densification Process for Polymer Glasses
John E. McKinney
Institute for Materials Research, National Bureau of Standards, Washington, D. C. 20234
and
Robert Simha
Department of Macromolecular Science, Case Western Reserve University, Cleveland, Ohio 44106
(May 3f 1977)
A quantitative description is given for the densification process of glasses resulting from glass formation at elevated pressures. Phenomenological relations are derived, or justified, which allow estimation of the densification rate K' (with respect to formation pressure) from various thermodynamic quantities and glass transition behavior. In addition, the estimation of K' may be facilitated by the application of the hole theory of Simha and Somcynsky. Using these relations K' is estimated, and the results from the different methods are compared for data from 23 different organic polymers with glass transition temperatures ranging from 150 to 455 K. The amount of densification appears to be limited by the apparent convergence of the glass temperature and effective decomposition temperature with increasing pressure. Some estimates of limiting values are presented. Finally, changes of refractive index resulting from densification are estimated from the observed, or predicted, densification rates.
Key words: Compressibility; densification; glass; glass transition; liquid; polymer; pressure; PVT; pyrolysis; refractive index; thermal expansion; thermodynamic.
1. Introduction
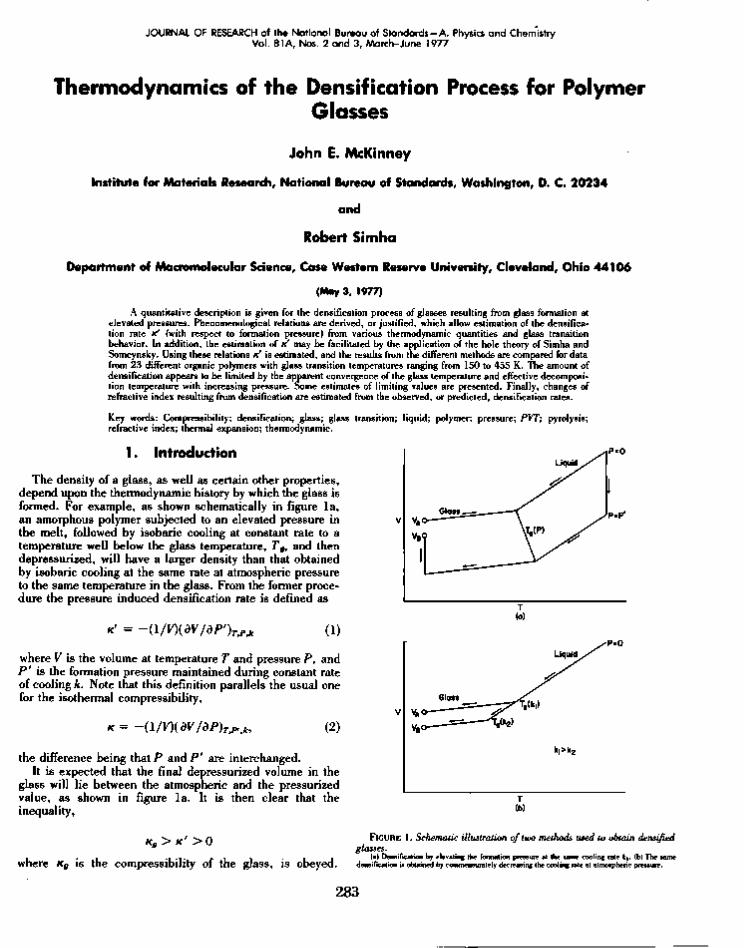
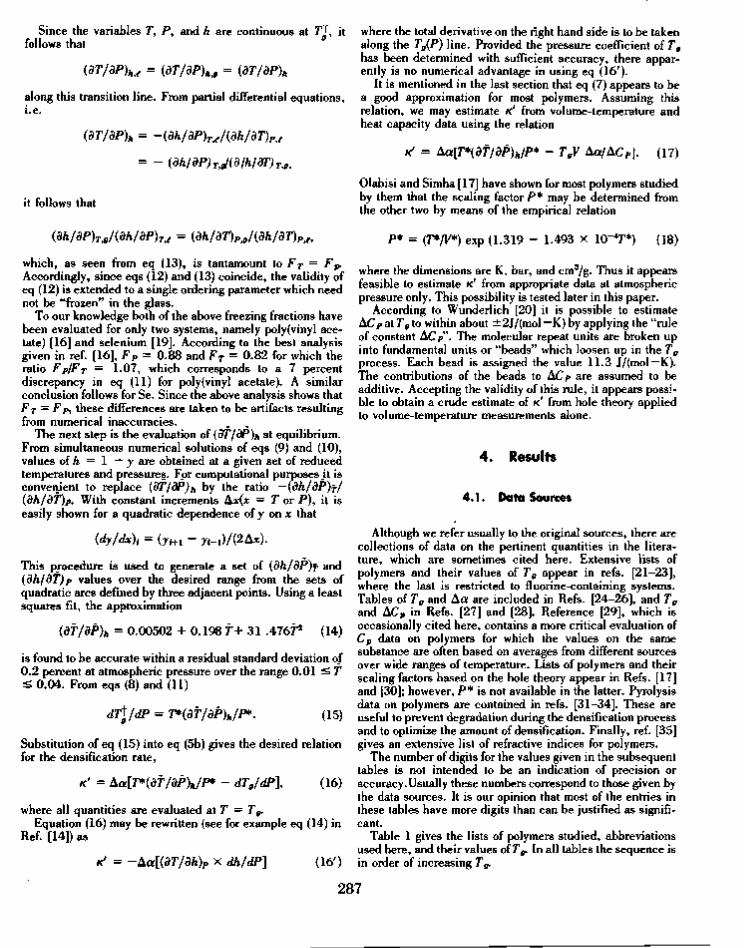
The density of a glass, as well as certain other properties, depend upon the thermodynamic history by which the glass is formed. For example, as shown schematically in figure la , an amorphous polymer subjected to an elevated pressure in the melt, followed by isobaric cooling at constant rate to a temperature well below the glass temperature, Tg, and then depressurized, will have a larger density than that obtained by isobaric cooling at the same rate at atmospheric pressure to the same temperature in the glass. From the former procedure the pressure induced densification rate is defined as
K! = -(l/V)(dV/dP')T,P,k (1)
where V is the volume at temperature T and pressure P, and P' is the formation pressure maintained during constant rate of cooling k. Note that this definition parallels the usual one for the isothermal compressibility,
K = -a/v)(dv/dP)TJ,,,k, (2)
the difference being that P a n d P ' are interchanged. It is expected that the final depressurized volume in the
glass will lie between the atmospheric and the pressurized value, as shown in figure la. It is then clear that the inequality,
Kg > K' > 0
where Kg is the compressibility of the glass, is obeyed.
p=o
P=P'
T (o)
vAo-
Vbo-
Glass
Liquid S
ST
- ^ ( k 2 )
k,>k2
/ P = 0
T (b)
FIGURE 1. Schematic illustration of two methods used to obtain densified glasses.
(a) Densification by elevating the formation pressure at the same cooling rate ki. (b) The same densification is obtained by commensurately decreasing the cooling rate at atmospheric pressure.
283

Although we may intuitively expect this relation to hold, as apparent from experiment, we do not know of any proof.
A well known alternative method of densifying glasses is simply to decrease the cooling rate as illustrated in figure lb . In principle one can obtain the same volume in the glass by this procedure as by elevating the pressure, except that the times required for the former are much longed. For example, it is estimated [ l ] 1 that a poly (vinyl acetate) glass obtained by isobaric cooling at 800 bar2 in 8 hours would require 500 years to reach the same volume at the same terminal temperature by cooling slowly at atmospheric pressure. It should be recognized, however, that the states of glasses at, the same volume, temperature, and pressure, but obtained through different histories, are not necessarily the same. As pointed out by Bree and coworkers [2], volume changes during iso-baric-isothermal volume relaxation [3] have a large effect on relaxation times for creep compliance, whereas almost no effect is observed from volume changes obtained by isobaric cooling at elevated pressures. Accordingly, it appears that the state of a glass is not determined by its volume, temperature, and pressure alone. Moreover, pressure induced densification does have an influence on physical properties. According to the data of Dale and Rogers [4] over a 5 kbar range, the compressive modulus of polystyrene appears to increase slightly with formation (or molding) pressure, leveling off at higher pressures, with the yield stress going through a maximum between 1 and 1.5 kbar. Wetton and Money-penny [5] have studied the dynamic mechanical and dielectric properties of several polymeric glasses formed at pressures up to slightly beyond 5 kbar. Both the real part of Young's modulus and its loss tangent, as well as the real part of the dielectric constant, increase with formation pressure. For polyvinyl acetate) McKinney and Goldstein [1] have observed a 3 percent increase in the bulk modulus at 0 C, corresponding to a formation pressure of 800 bar. This difference increases with decreasing temperature.
Thermal properties also seem to depend on the amount of pressure induced densification. Although the heat capacity Cp is found to be independent [6] of formation pressure, the enthalpy H seems to vary significantly at formation pressures above a certain value. According to Price [7], very little change in the enthalpy of poly(methyl methacrylate) is observed up to about 800 bar, followed by a nearly constant rate of increase of about 0.015 cm3/g up to 3 kbar, their maximum value. For polystyrene [8], the data have been evaluated as A// = //(densified) — //(normal) first decreasing slightly and then going back to zero at about 800 bar, followed by an increase with nearly constant slope up to the maximum pressure. Weitz and Wunderlich [9] have also observed this behavior and interpreted it in terms of two opposing mechanisms arising from holes and rotational isomers. It is not clear, however, that the apparent negative values of A// obtained by experiment are significant.
The purpose of this paper is to describe the thermodynamics of the pressure induced densification process by applying both phenomenological and molecular theory. Simple phenomenological relationships are derived between the densification rate K' and other thermodynamic properties for which values are more readily available in the literature. Moreover, it is shown how the hole theory of Simha and Somcynsky [10] may be used to facilitate the estimation of the
1 Figures in brackets indicate literature references at the end of this paper. 2 For conversion to SI units, 1 MPa = 10 bar.
densification rates for polymers using a minimum amount of experimental information. In both cases the derived relationships are tested using appropriate experimental data. An example of the utility of these results is demonstrated by estimating the change in the index of refraction corresponding to changes in molding pressure, assuming that the index of refraction is related to the volume by the Lorentz-Lorenz equation. The results have potential application to the adjustment of the refractive indices of lenses by varying the molding pressure.
2. Phenomenological Relationships
Two types of thermodynamic histories, shown schematically in figure 2, are pertinent to the development of the phenomenological relationships for pressure induced densification. In the first (Fig. 2a) the PVT surface of the glass is obtained from repeated isobaric cooling runs at the same constant rate, but at difference pressures, with all pressure changes occurring in the melt prior to each run. This procedure is called the variable formation history because the structure of the glass is different for each experimental pressure (which is the formation pressure, sinceP = P'). The glass transition at each pressure is assumed to occur at a constant mean relaxation time. Hence, the intersection of the liquid and glass PVT surfaces gives the proper Tg(P), from which dTg/dP is expected to approximate that obtained from the dynamic mechanical and dielectric frequency-temperature-pressure superposition. On the other hand, as a consequence of the varied structure, the glass PVT surface is not proper in the thermodynamic sense.
FIGURE 2. Schematic illustration of two thermodynamic histories used to m glasses. (a) Variable formation, (b) Constant formation.
284

With the other history (fig. 2b) the glass is formed also by isobaric cooling at constant rate at an arbitrary pressure, P' (which is usually atmospheric, but elevated in figure 2b to illustrate the more general case). At temperatures well below Tg, where viscoelastic relaxation times are large in comparison to effective experimental times, a thermodynamically reversible PVT surface for the glass is obtained by observing the volumetric response to "fast" changes in temperature and pressure. Since all of the data in the glass pertain to the same P ' , the PVT surface gives the proper values of the derivable thermodynamic quantities (for example, thermal expansion, isothermal compressibility, and internal pressure). The intersection of the liquid and glass surfaces defines the fictive temperature T%(P9 P').
The principal distinction in procedure between the two histories is that with variable formation all pressure changes are made in the melt, whereas with constant formation they are made in the glass. Note that the number of independent variables is different for Tg(P) and Tj(P, P'). The redundancy of using two arguments in the former arises from the fact that the formation and experimental pressure are always identical. Accordingly, Tg may be regarded as a special case of r t whenP = P'. The implicit argument k is deleted here because only one value appplies to these discussions for each case. For further details and interpretations of these histories, see Ref. [1].
In all of the schematic diagrams in this paper the glass transition is shown as a discrete intersection. With isobaric cooling at constant rate through Tg a gradual transition process is observed. The discrete intersections shown correspond to those obtained by extrapolation of the equilibrium isobars and the isochronal (nonrelaxing) ones for the glass.
We now proceed to evaluate the thermodynamic diagram in figure 3, in order to determine relationships for K! in terms of other measured quantities. Volume A is obtained by isobaric cooling at constant rate and atmospheric pressure (P = P' = 0). Volume B is reached by pressurizing to P = P ' = AP in the melt, followed by isobaric cooling at the same constant rate as for 4 , with subsequent depressurizing in the glass at the same terminal temperature as fory4. Note that Tg (in lieu
P*=AP V=V0
FIGURE 3 . Schematic illustration of the procedure used to derive the densification equation [See eqs (3) and (4)], and the distinction between Tg(P)
and rt(P,P').
of r j ) applies here, since the transition is observed at the formation pressure (P = P') in both cases. The isobaric extension of V B with increasing T (see dashed line) to its intersection with the liquid line yields the fictive temperature T](P, P') = r t ( 0 , AP).
In summing the thermodynamic contributions for small changes in T and P near TJf*) in the range where linear approximations are valid, we find
VA = V0(l- aAT,- agAT2)
VB = V0{1 - KlAP - atlAT, - (dTg/dP)AP] (3)
- O0[Ar2 + (dTg/dP)AP] + KgAP}
where a is the usual isobaric thermal expansivity, the A's indicate differences as shown on figure 3, and the subscripts / and g pertain to liquid and glass. For small changes eq (1) may be written in the form
K' = (VA - VB)/(VoAP) (4)
Substitution of eqs (3) for V A and V B yields
K' = AK - AadTjdP (5a)
where the A's here indicate the usual differences in the respective quantities between liquid and glass. Since
dT't/dP = AK/Aa (6a)
along r j , [11], K' may be expressed in terms of the difference between the two transition rates, i.e.,
K' = Aa(dTJ/dP - dTjdP) (5b)
Equation (5a) may also be written as an Ehrenfest-type relation, viz.,
dTjdP = AK/Aa - K'/AOL (5c)
which is consistent with the experimentally observed inequality
dTjdP < AK/Aa
provided the densification rate is non-negative. Expressions fully equivalent to eqs (5) have been derived by Goldstein [11] and given previously in Ref. [12]. From eqs (5) it is evident (as also pointed out by Goldstein [11]) that the necessary and sufficient condition (assuming Aa =F 0) for the PVT surface to be independent of formation pressure is the validity of the first Ehrenfest equation
dTjdP = AK/Aa. (6b)
The analogous argument applies to the entropy surfaces. Since the second Ehrenfest equation,
dTjdP = TgVAa/ACP (7)
where Cp is the usual heat capacity at constant pressure, appears to be a good approximation [11, 13], there should be
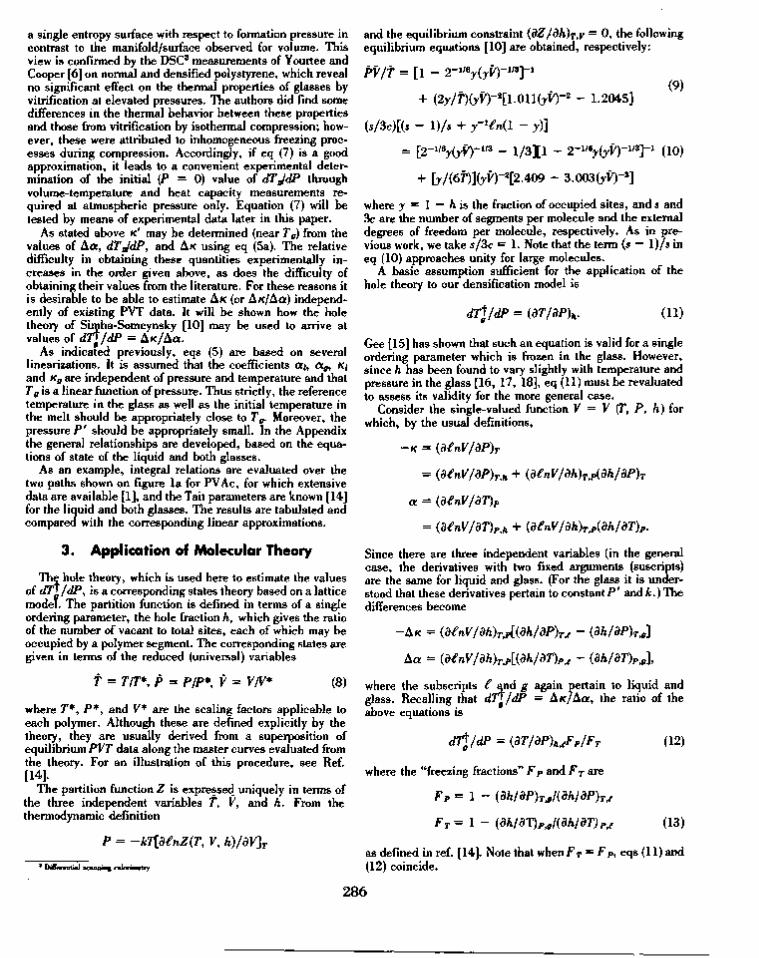
a single entropy surface with respect to formation pressure in contrast to the manifold/surface observed for volume. This view is confirmed by the DSC3 measurements of Yourtee and Cooper [6] on normal and densified polystyrene, which reveal no significant effect on the thermal properties of glasses by vitrification at elevated pressures. The authors did find some differences in the thermal behavior between these properties and those from vitrification by isothermal compression; however, these were attributed to inhomogeneous freezing processes during compression. Accordingly, if eq (7) is a good approximation, it leads to a convenient experimental determination of the initial (P = 0) value of dTJdP through volume-temperature and heat capacity measurements required at atmospheric pressure only. Equation (7) will be tested by means of experimental data later in this paper.
As stated above K' may be determined (near Tg) from the values of Aa, dTg/dP, and AK using eq (5a). The relative difficulty in obtaining these quantities experimentally increases in the order given above, as does the difficulty of obtaining their values from the literature. For these reasons it is desirable to be able to estimate A K (or AK/AQ:) independently of existing PVT data. It will be shown how the hole theory of Simha-Somcynsky [10] may be used to arrive at values of dTj/dP = Aic/Aa.
As indicated previously, eqs (5) are based on several linearizations. It is assumed that the coefficients ah ag, Kt
and Kg are independent of pressure and temperature and that Tg is a linear function of pressure. Thus strictly, the reference temperature in the glass as well as the initial temperature in the melt should be appropriately close to Tg. Moreover, the pressure P' should be appropriately small. In the Appendix the general relationships are developed, based on the equations of state of the liquid and both glasses.
As an example, integral relations are evaluated over the two paths shown on figure l a for PVAc, for which extensive data are available [1], and the Tait parameters are known [14] for the liquid and both glasses. The results are tabulated and compared with the corresponding linear approximations.
3. Application of Molecular Theory
The: hole theory, which is used here to estimate the values of dTj/dP, is a corresponding states theory based on a lattice model. The partition function is defined in terms of a single ordering parameter, the hole fraction h, which gives the ratio of the number of vacant to total sites, each of which may be occupied by a polymer segment. The corresponding states are given in terms of the reduced (universal) variables
f = TIT*, P = PjP*, V = V/V* (8)
where T*, P * , and V* are the scaling factors applicable to each polymer. Although these are defined explicitly by the theory, they are usually derived from a superposition of equilibrium PVT data along the master curves evaluated from the theory. For an illustration of this procedure, see Ref. [14].
The partition function Z is expressed uniquely in terms of the three independent variables T, V, and h. From the thermodynamic definition
P = -kT[d€nZ(T, V, h)/dV]T
3 Differential scanning calorimetry
and the equilibrium constraint (dZ fdh)TiV = 0, the following equilibrium equations [10] are obtained, respectively:
Pv/t = [i - 2-1/6r(rV0"1/3]~1
. . (9)
+ (2y/T)(yV)-\\.0l\(yV)-2 - 1.2045]
(*/3c)[(s - 1)A + y-Wnil ~ ?)] = [ 2 " 1 / 6 r W " 1 / 3 - 1 / 3 B - 2-1/6
r(yV0"1/3]~1 (10)
+ [y/(6T)](yV)-2[2A09 - 3.003(yVT2]
where y — 1 — h is the fraction of occupied sites, and s and 3c are the number of segments per molecule and the external degrees of freedom per molecule, respectively. As in previous work, we take s/3c = 1. Note that the term (s — l ) / s in eq (10) approaches unity for large molecules.
A basic assumption sufficient for the application of the hole theory to our densification model is
dTpdP = (BT/dP)h. (11)
Gee [15] has shown that such an equation is valid for a single ordering parameter which is frozen in the glass. However, since h has been found to vary slightly with temperature and pressure in the glass [16, 17, 18], eq (11) must be revaluated to assess its validity for the more general case.
Consider the single-valued function V = V (T, P, h) for which, by the usual definitions,
-K = (d€nV/dP)T
= (d€nV/dP)Tih + (d€nV/dh)T>P(dh/dP)T
a = (d€nV/dT)P
= (d€nV/dT)P,h + (d€nV/dh)TtP(dh/dT)P.
Since there are three independent variables (in the general case, the derivatives with two fixed arguments (suscripts) are the same for liquid and glass. (For the glass it is understood that these derivatives pertain to constantP' and k.) The differences become
- A K = (d€nV/dh)TJl(dh/dP)Ts - (dh/dP)T,g\
Aa = (d€nV/dh)TJ>[(dh/dT)Pge - (dh/dT)p,gl
where the subscripts € and g again pertain to liquid and glass. Recalling that dT^/dP = A/c/Aa, the ratio of the above equations is
dtl/dP = (dT/dP)h,(FP/FT (12)
where the "freezing fractions" F P and FT are
FP = 1 - (dh/dP)TJ(dhldP)Ti€
FT=1- (dhldT)PJ(dhldT)ps (13)
as defined in ref. [14]. Note that w h e n F r = FP, eqs (11) and (12) coincide.
286
Since the variables T, P, and h are continuous at 7*1", it follows that
(dT/dP)hj = (dT/dP)hJ, = (dT/dP)h
along this transition line. From partial differential equations, i.e.
(dT/dP)h = -(dh/dP)T,€/(dh/dT)P,€
= - (dh/dP)TJ(d/h/dT)T„,
it follows that
(dh/dP)TJ(dh/dP)Tj = (dh/dT)PJ(dh/dT)P,€,
which, as seen from eq (13), is tantamount to FT = Fp. Accordingly, since eqs (12) and (13) coincide, the validity of eq (12) is extended to a single ordering parameter which need not be "frozen" in the glass.
To our knowledge both of the above freezing fractions have been evaluated for only two systems, namely polyvinyl acetate) [16] and selenium [19]. According to the best analysis given in ref. [16], FP = 0.88 and FT = 0.82 for which the ratio FP/FT = 1.07, which corresponds to a 7 percent discrepancy in eq (11) for poly (vinyl acetate). A similar conclusion follows for Se. Since the above analysis shows that FT — Fp, these differences are taken to be artifacts resulting from numerical inaccuracies.
The next step is the evaluation of (dT/dP)h at equilibrium. From simultaneous numerical solutions of eqs (9) and (10), values of h = 1 ~~ y are obtained at a given set of reduced temperatures and pressures. For computational purposes j t is convenient to replace (dT/dP)h by the ratio —(dh/dP)f/ (dh/dT)p. With constant increments Ax(x = T or P) , it is easily shown for a quadratic dependence of y on x that
(dy/dx)i = (yi+1 - yi.1)/(2Ax).
This procedure is used to generate a set of (dh/dP)f and (dh/dT)p values over the desired range from the sets of quadratic arcs defined by three adjacent points. Using a least squares fit, the approximation
(dt/dP)h = 0.00502 + 0.198 T + 31 A76T2 (14)
is found to be accurate within a residual standard deviation of 0.2 percent at atmospheric pressure over the range 0.01 < T < 0.04. From eqs (8) and (11)
dT]/dP = T*(df/dP)h/P*. (15)
Substitution of eq (15) into eq (5b) gives the desired relation for the densification rate,
K' = Aa[T*(dt/dP)h/P* - dTg/dPl (16)
where all quantities are evaluated at T = Tg. Equation (16) may be rewritten (see for example eq (14) in
Ref. [14]) as
K' = -Aa[(dT/dh)P X dh/dP] (16')
where the total derivative on the right hand side is to be taken along the Tg(P) line. Provided the pressure coefficient of Tg
has been determined with sufficient accuracy, there apparently is no numerical advantage in using eq (16').
It is mentioned in the last section that eq (7) appears to be a good approximation for most polymers. Assuming this relation, we may estimate K' from volume-temperature and heat capacity data using the relation
K' = Aa[T*(df/dP)h/P* - TgV Aa/ACp]. (17)
Olabisi and Simha [17] have shown for most polymers studied by them that the scaling factor P* may be determined from the other two by means of the empirical relation
p * = (T*/V*) exp (1.319 - 1.493 X 10"4r*) (18)
where the dimensions are K, bar, and cm3/g. Thus it appears feasible to estimate K' from appropriate data at atmospheric pressure only. This possibility is tested later in this paper.
According to Wunderlich [20] it is possible to estimate AC p at Tg to within about ±2J/(mol —K) by applying the "rule of constant ACp\ The molecular repeat units are broken up into fundamental units or "beads" which loosen up in the Tg
process. Each bead is assigned the value 11.3 J/(mol_K). The contributions of the beads to ACp are assumed to be additive. Accepting the validity of this rule, it appears possible to obtain a crude estimate of K' from hole theory applied to volume-temperature measurements alone.
4. Results
4.1 . Data Sources
Although we refer usually to the original sources, there are collections of data on the pertinent quantities in the literature, which are sometimes cited here. Extensive lists of polymers and their values of Tg appear in refs. [21-23], where the last is restricted to fluorine-containing systems. Tables of Tg and A a are included in Refs. [24-26], and Tg
and ACP in Refs. [27] and [28]. Reference [29], which is occasionally cited here, contains a more critical evaluation of Cp data on polymers for which the values on the same substance are often based on averages from different sources over wide ranges of temperature. Lists of polymers and their scaling factors based on the hole theory appear in Refs. [17] and [30]; however, P * is not available in the latter. Pyrolysis data on polymers are contained in refs. [31-34]. These are useful to prevent degradation during the densification process and to optimize the amount of densification. Finally, ref. [35] gives an extensive list of refractive indices for polymers.
The number of digits for the values given in the subsequent tables is not intended to be an indication of precision or accuracy. Usually these numbers correspond to those given by the data sources. It is our opinion that most of the entries in these tables have more digits than can be justified as significant.
Table 1 gives the lists of polymers studied, abbreviations used here, and their values of Tg. In all tables the sequence is in order of increasing Tg.
287

TABLE 1. List of polymers studied, abbreviations, and glass temperatures
Abbreviations
PDMSi PIB NR PP SBRa
PMA PnBMA PVAc i-PMMA PEMA PET PVC P4P0S P3CS PS a-PMMA PCHMA P4M0S P4CS PoMS Pcarb PaMS (1) PaMS (2)
Polymer of
Dimethyl siloxane Isobutylene Natural Rubber Propylene Styrene-butadiene Methyl acrylate n -butyl methacrylate Vinyl acetate Isotatic methyl methacrylate Ethyl metacrylate Ethylene terephthalate Vinyl chloride 4-phenoxystyrene 3-chlorostyrene Styrene Atatic methyl methacrylate Cyclohexyl methacrylate 4-methoxy styrene 4-chlorostyrene o -methyl styrene Carbonate of bis(phenol A) a-methyl styrene (67% syndiotatic) a-methyl styrene (95% syndiotatic)
T*(K)
150 202 204 244 257 282 293 304 320 337 340 349 352 363 363 378 380 381 400 404 416 448 455
a 55 percent Styrene.
4.2. Scaling Factors
Table 2 gives the scaling factors based on the hole theory of Simha and Somcynsky [10]. These are determined through superposition of experimental equilibrium data on each polymer with respect to the theoretical equation of state. In this
TABLE 2. Polymer scaling factors
Polymer
PDMSi PDMSi PIB PIB NR PP SBRC
PMA PnBMA PVAc PVAc i-PMMA PEMA PET PVC PVC PS PS PS PS a-PMMA a-PMMA a-PMMA PCHMA PoMS Pcarb PaMS (1) PaMS (2)
Ref.
36, 30 a
37 38, 30 a
37 39 40 41
42, 17 43 , 17
1, 14 37 44
45 , 30 a
46 47 d , 17
48 15
47 d , 17 49 50 48
4 3 , 17 47 d , 17 43 , 17
50 5 1 , 30 a
52, 30 a
52, 30 a
K
7893 7893b
11220 11220b
8344 8966 9800 9200 9988 9419 94196
11170 11540 10870 11320 11363 12880 12700 11630 12680 11490 11920 11890 11290 12740 12130 12700 12790
v* cm3/g
0.9602 ,9602b
1.0902 1.0902b
1.0353 1.1230 0.9892
.7925
.9299
.8141
.8141b
.8160
.8862
.7406
.7105
.7083
.9601
.9625
.9480
.9598
.8220
.8370
.8350 0.8906
.9762
.8100
.9152
.8433
p *
bar
5061 5061
7316
8437
8456 9380 9158
10090
10350 9783 6628 7638 7881 7453 8987 9147 9303 8382 7458
P*calc bar
9461 9461 7208 7208 8672 7829 8577
10990 9402
10600 10600
9659 8694
10830 10990 11000
7333 7409 8082 7440 9403 8984 9024 8786 7285 9156 7792 8403
A P * / P %
87 87
- 1 . 4
- 7 . 2
11 13 16
- 4 . 3
6.2 12 11
- 2 . 9 2.6
- 0 . 2 4.6
- 1 . 8 - 3 . 0
4 .8 - 2 . 3
a T* and V* only are determined in this reference. b Volume-temperature data at atmospheric pressure taken from previous
listing. c 55 per cent Styrene. d For additional comments of interpretation on these experimental data
and evaluation of Tait parameters, see Ref. [53].
work the scaling factors are used solely to estimate dT\ I dP = A/c/Aa: for each polymer using eq (15). When two numbers appear in the reference column (in table 2 only), the first applies to the data source, and the second to the work by which the scaling factors are evaluated. When only one number appears, the scaling factors are either evaluated in the reference given, or by us.
Two values of P * for each polymer (or row) usually appear. The first of these (P*) is determined in the usual way through superposition as mentioned above. The second (P*aic) is obtained from eq (18). When volume-temperature data are available at atmospheric pressure only, it is necessary to use eq (18) to estimate P * . With the exception of PDMSi, P * and ^caic agree to within 17 percent with an 8 percent relative standard deviation of differences over 17 pairs. With PDMSi the disparity of 87 percent is outstanding, and it is to be noted that the reduced glass temperature lies significantly outside the range for which eq (18) was deduced. Similarly, F* and 71* are obtained at considerably higher temperatures than those employed here. A decrease of 71* by 7.2 percent and a concomitant decrease of V* by 2.4 percent over 100 K has been estimated [30] for this polymer. Accordingly, the scaling factors cannot be assigned significant constant values over the experimental range.
In order to obtain some measure of the uncertainty in the scaling factors, several data sources on each polymer are sometimes included.
4.3. Densification Rates from PVT Data
Table 3 gives the results of calculations of the densification rates from PVT data without recourse to molecular theory. K[ is determined from the definition:
Ki = (VA ~ VB)/VAP' (4')
which is identical to eq (4) setting AP = P', except that VA replaced V0. The difference between the values of K[ determined from eqs (4) and (4') are insignificant in comparison with experimental uncertainty. K'2 is determined from eq (5b). Note that there are only two polymers, PVAc and PaMS for which we found sufficient information to determine both K[ and K2. Although the two methods are not necessarily fully equivalent because of the assumptions used to derive eqs (5), the agreement in both cases is good. In instances of more than one set of values per polymer, it is clear that the deviations in dT^ /dP have the largest effect on the uncertainty of K!2. These apparent discrepancies are usually consistent with the differences in A/c. With polystyrene the maximum deviation in dTT/dP is 38 percent compared with those for dTa/dP, 23 percent and Aa, 10 percent. Since K2
involves the difference between the two transition rates, its maximum deviation is magnified to 56 percent with its relative standard deviation over the five values being 26 percent. It is interesting to note that the direct method giving K[ which one might expect to be more reliable, yields values for which the maximum deviation (for polystyrene) is 86 percent with relative standard deviation over seven values being 35 percent. The ratio of average values, k2/k'u is 1.6. These discrepancies are a measure of the difficulties in obtaining reliable PVT data on glassy polymers.
In many instances the values of Aa at TQ and the required transition rates are not tabulated in the data sources and, therefore, had to be evaluated. The accuracy of these evalua-
PDMSi PIB NR PP SBRa
PMA PnBMA PVAc i-PMMA PEMA PET PVC P4P0S P3CS PS a-PMMA PCHMA P4M0S P4CS PoMS Pcarb PaMS (1) PaMS (2)
Dimethyl siloxane Isobutylene Natural Rubber Propylene Styrene-butadiene Methyl acrylate n -butyl methacrylate Vinyl acetate Isotatic methyl methacrylate Ethyl metacrylate Ethylene terephthalate Vinyl chloride 4-phenoxystyrene 3-chlorostyrene Styrene Atatic methyl methacrylate Cyclohexyl methacrylate 4-methoxy styrene 4-chlorostyrene o -methyl styrene Carbonate of bis(phenol A) a-methyl styrene (67% syndiotatic) a-methyl styrene (95% syndiotatic)
150 202 204 244 257 282 293 304 320 337 340 349 352 363 363 378 380 381 400 404 416 448 455
PDMSi PDMSi PIB PIB NR PP SBRC
PMA PnBMA PVAc PVAc i-PMMA PEMA PET PVC PVC PS PS PS PS a-PMMA a-PMMA a-PMMA PCHMA PoMS Pcarb PaMS (1)
36, 30 a
37 38, 30 a
37 39 40 41
42, 17 43 , 17
1, 14 37 44
45 , 30 a
46 47 d , 17
48 15
47 d , 17 49 50 48
4 3 , 17 47 d , 17 43 , 17
50 5 1 , 30 a
52, 30 a
co ona
7893 7893b
11220 11220b
8344 8966 9800 9200 9988 9419 94196
11170 11540 10870 11320 11363 12880 12700 11630 12680 11490 11920 11890 11290 12740 12130 12700
0.9602 ,9602b
1.0902 1.0902b
1.0353 1.1230 0.9892
.7925
.9299
.8141
.8141b
.8160
.8862
.7406
.7105
.7083
.9601
.9625
.9480
.9598
.8220
.8370
.8350 0.8906
.9762
.8100
.9152
5061 5061
— 7316
— 8437
— —
8456 9380 9158
10090
— —
10350 9783 6628 7638 7881 7453 8987 9147 9303 8382 7458
— -
9461 9461 7208 7208 8672 7829 8577
10990 9402
10600 10600
9659 8694
10830 10990 11000
7333 7409 8082 7440 9403 8984 9024 8786 7285 9156 7792
87 87
- 1 . 4
- 7 . 2
11 13 16
- 4 . 3
6.2 12 11
- 2 . 9 2.6
- 0 . 2 4.6
- 1 . 8 - 3 . 0
4 .8 - 2 . 3
288

tions may be considerably limited when the data are presented in graphical form only. In ref. [47] the values of A/c are determined by a different definition from the one used by us. In our definition Kg is taken to be an isochronal (non-relaxing) function of temperature and pressure and therefore must be derived from data at temperatures below (or pressures above) the glass transition region. A/c at Tg is then obtained by extrapolation. This, apparently, was not done by Hellwege et al. [47], at least over the appropriate temperature range for the data to be effectively isochronal. The distinction between the two definitions is clearly illustrated by Boyer [57]. Our larger values of AK are determined from the Tait parameters given in ref. [53], which apply to the data of Hellwege et al. [47]. Note that the values of dTt/dP from reevaluating [53] their data are in good agreement with most of the others on the same polymers except for PMMA. This discrepancy would be increased by using their value of A/c given in ref. [47], along with poorer overall agreement with the other two polymers.
In ref. [1] the transition rates are given as tangent values along the transition lines at each experimental pressure. Here, we use the secant values dTg/dP and dTT/dP between 0 and 800 bar. This procedure gives average values and is more consistent with other treatments.
The smallest value of K' = 0.7 Mbar - * in table 3 applies to PnBMA. Such a small value implies that the first Ehrenfest equation is a good approximation for this polymer. [See eqs (5c) and (6b)].
TABLE 3. Densification rate calculations at atmospheric pressure from PVT
data
Polymer
PnBMA PVAc i-PMMA PVC PVC PVC P4POS P3CS PS PS PS PS PS PS PS PS PS PS PS PS a-PMMA a-PMMA a-PMMA a-PMMA a-PMMA PCHMA P4M0S P4CS PoMS Pcarb PaMSb
Ref.
43~~ 1
44 47 48
2 5 5
15 47 49 50
2 4 5 6 8 9
54 55 48 47 43
2 54 43
5 5
50 2
56
A a X 104
K - i
L69 4.32 3.49 2.93 3.71 — — —
2.84 3.05 3.15 2.97 — — — — — — —
3.12 3.1 2.95 2.35 — —
3.38 — —
2.71 _
3.98 J
dTg/dP K/kbar
20.4 21.2 21.1 13.5 14 — — — 31 30.0 25.0 31.6 — — — — — — — 32 18 23 23.6 — — 22.4 — — 34.2 — 39
1 dTJ/dP K/kbar 24^3 42.4 35.2 35.5a
46 — — — 71 56.4a
49.8 74.2 — — — — — — — 73 71 35.9a
54.5 — — 59.8 — — 73.0 — 52
Mbar 1
— 8.8
— — — 4.4 7.2 5.8
— — — — 5.5
10 7.2 4.3 5.6 9.5 4.5
— — — — 5.9 4.9
— 7.1 9.5
— 5.1 4.9
Mbar 1
0.7 9.2 4.9 6.4
12 — — — 11 8.1 7.8
13 — — — — — — — 13.8 15 3.8 7.3
— — 13 — — 11 — 5.2
a The values of A/c here are not consistent with those given in Ref. [47].
For distinction, see text and/or Ref. [57]. b Tacticity not known to correspond to listings in table 1.
4.4. Theoretical Estimation of the Transition Rate dTt/dP
As stated in section 3 the transition rate dTj/dP = A/c/ Aa applicable to the constant formation history, may be estimated from the value of (dT/dP)h at Tg. Table 4 summarizes the results of these calculations. In all cases except for PDMSi and PIB the data encompass Tg. With these two polymers the first reference for each applies to the source of data at atmospheric pressure, and the second, at elevated pressures.
Equation (14) and the scaling temperatures and pressures as applied to eq (15) provide the requisite information. The distinction between the values of (dT/dP)h in columns A and B is that they correspond to P* and P*aic> respectively, in table 2. Values of dJl/dP are included for comparison with those of (dT/dP)^ in cases where there is sufficient experimental information.
With natural rubber (NR) AK is determined from dynamic compressibility data [60]. This involves the measurement of the adiabatic compressibility in a hydrostatic stress field alternating at low audio frequencies. The low- and high frequency limiting compressibilities are converted from adiabatic to isothermal conditions, providing the difference A/c. The fact that AK is determined at about 20 K above normal Tg
is expected to have no appreciable effect. Except for PDMSi, the corresponding values of (dT/dP)h
are nearly the same in columns A and B. The discrepancy for PDMSi is explained by the factors mentioned earlier. (See sec. 4.2.). Excluding this polymer, the relative standard deviation of the differences between corresponding values in these columns is 6 percent, which is considered to be good agreement. For comparison with experiment, the residual standard deviation between corresponding values of (dT/dP)^ (column A) and dT\ /'dP is 18 percent. Poor agreement is noted for PnMBa, and two samples of a-PMMA.
Over a single substance, for example polystyrene where we have four sets of values, the relative standard deviations with respect to the averages for (dT/dP)h (column A) and dTj/dP are 6 and 15 percent, respectively. That for the differences between corresponding values of these quantities is 11 percent. Thus, based on these simple statistics, the most serious limitation is not the inadequacy of the theory, but the uncertainty in the experimental determination of dTj/dP. The agreement between values of dTt/dP from different investigators is even worse for a-PMMA.
4.5. Application of Hole Theory
After determining the values of (dT/dP)^ for each substance, K' may be estimated by eq (16), where dTg/dP may be determined by means of PVT data, dynamic measurements at elevated pressures, or heat capacity and thermal expansion data, both at atmospheric pressure.
PVT Data
Since PVT measurements are often made by the variable formation history only (for example, polypropylene, ref. [40]), there is insufficient information to determine A/c, and hence dTT /dP, to be applied to eq (5b). Accordingly, this quantity is replaced by T*(dT/dP)tJP* leading to eq (16). The results of these estimates are given in table 5, where K' corresponds
289

to K'2 in table 3. In all cases (&T/dP)n is taken from column A of table 4. Since the expression for K' involves the difference between two transition rates, its value is very sensitive to (&T/ dP)h. This effect is reflected in the large standard deviation, 2.5 Mbar - 1 , with a relative value of 28 percent, for the differences over 14 pairs of corresponding values of K'2 and K' in tables 3 and 5. The values of PaMS are not included in this calculation because there are insufficient data in ref. [56] to determine the scaling factors applicable to this particular sample. Based on the fact that the standard deviation of K'2
for polystyrene (table 3) over five values is 2.8 Mbar - 1
corresponding to 26 percent, the overall 28 percent value above appears to be dominated by experimental uncertainty.
TABLE 4. Transition rates calculated from hole theory
Polymer
PDMSi PIB NR PP SBR PMA PnBMA PVAc i-PMMA PEMA PET PVC PVC PS PS PS PS a-PMMA a-PMMA a-PMMA PCHMA PoMS Pcarb PaMSd
PaMS (1) PaMS (2)
T Ref. -
36, 37 37, 38
39 40 41 42 43
1 44 45 46 47 48 15 47 49 50 48 47 43 43 50 51 56 52 52
150a
202b
204 244 256 281 293 304 320 338 340 349 349 362 362 365 365 376 378 378 380 404 423 440 448 455
X 105
1900 1800 2445 2721 2622 3054 2934 3226 2865 2928 3128 3083 3071 2811 2850 3138 2879 3272 3179 3171 3366 3171 3487 3465 3528 3557
(vr/dp)h x 105
2014 1878 2868 3371 3185 4042 3792 4416 3653 3780 4201 4104 4079 3546 3623 4223 3681 4520 4312 4295 4735 4295 5020 4967 5118 5189
A B
(&T/dP)h K/kbar
31.4 28.8
35.8
44.8 44.3 40.4
44.9 47.4 68.9 60.2 62.3 62.6 57.8 55.1 56.0 63.8 73.4
(&T/dP)h K/kbar
16.8 29.2 27.6 38.6 36.4 33.8 40.3 39.2 42.2 50.2 42.2 42.3 42.1 62.3 62.1 60.8 62.7 55.2 56.8 57.0 60.8 75.1 66.5 81.0 83.4 86.5
dT^0l dP
K/kbar
24c
24.3 42.4 35.2
41 46 71.0 56 55.5 74.2 71 35.9 54.5 59.8 73.0
52
a Tg taken from ref. [58]. b Tg taken from ref. [59]. c AK determined from dynamic compressibility data [60] on vulcanized
natural rubber with 12 percent combined sulfur. See text. d Scaling factors taken the same as for PaMS (1).
Dynamic Data
From the assumption that the value of dT JdP, approximates that of (dT/dP)^ where O) is the angular frequency, frequency-temperature-pressure superposition of dynamic data, including dielectric and ultrasonic, may be used to determine dTJdP appearing in eq (16). The validity of this assumption is, of course, subject to the condition that (dT/ dP)w for the Tg -process is essentially independent of frequency. (Numerical comparisons between different experimental transition rates are made below.)
The results of these calculations are given in table 6. Since values of (dT/dP)n in column A of table 4 involve fewer assumptions than those in column B, the former are used where there is a choice. The standard deviation of the differences of K' over eight pairs, where there are values on the
TABLE 5. Densification rate calculations u$ing PVT data and hole theory
Polymer
PP PnBMA PVAc i-PMMA PVC PVC PS PS PS PS a-PMMA a-PMMA a-PMMA PCHMA PoMS PaMS3
Ref.
40 43
1 44 47 48 15 47 49 50 48 47 43 43 50 56
Aa X 104
K"1
4.41 1.69 4.32 3.49 2.93 3.71 2.84 3.05 3.15 2.97 3.1 2.95 2.35 3.38 2.71 3.98
dTJdP K/kbar
20 20.4 21.2 21.1 13.5 14 31 30.0 25.0 31.6 18 23 23.6 22.4 34.2 39
(&T/dP)h K/kbar
35.8 44.8 44.3 40.4 44.9 47.4 68.9 60.2 62.3 62.6 57.8 55.1 56 63.8 73.4 81
K' Mbar 1
7.0 4.1
10 6.7 9.2
12 11 9.2
12 12 12 9.5 7.6
14 11 17
Scaling factors taken for PaMS (1), Ref. [52].
same substances in table 3 including K\ for Pcarb, is 2.2 Mbar - 1 or 30 percent, which is about the same as the experimental uncertainty given above (2.8 Mbar - 1 or 26 percent) for polystyrene. This value is also about the same as the 28 percent value given for the PVT data even though data on different substances are involved. It is possible, however, that dTJdP values determined from dynamic data, in particular dielectric, where high resolution is obtained, are more reliable than PVT values. Tg determinations from PVT data usually involve extrapolations which are not used in the superposition of dynamic data.
Heat Capacity and Thermal Expansion
The estimation of K' from heat capacity and thermal expansion data is based on the apparent validity of the second Ehrenfest equation [eq (7)]. (This relation is tested in the next section.) The results of the calculations based on eq (17) are summarized in table 7. In this case the statistics may not be meaningful because there are only five values of K' which correspond to those in table 3 including Kx for Pcarb. PaMS is excluded for the reason given above. The standard deviation of the differences is 1.4 Mbar - 1 or 17 percent, which is somewhat less than the experimental uncertainty (26 percent) based on polysytrene data (table 3). In view of the high experimental uncertainty for all methods, this method of estimating K' appears to be reliable, except for PDMSi and PaMS.
In ref. [12] a negative value of Kf for PDMSi [based on eq (17)] is reported. This is a surprising, but not necessarily an incorrect result. The analysis of this polymer is hindered by the lack of good thermal expansion data through Tg, largely a consequence of the low temperatures required, and the strong tendency for this polymer to crystallize. The negative value of K' is obtained by using the value of Aa = 10.28 K - 1 from table I of ref. [26]. This value is based on the linear thermal expansion data of Weir, Leser, and Wood [58]. After a thorough examination of their results and consultation with Dr. Wood, it was decided that the temperature range for which Voii was evaluated is too small and too remote from Tg
to evaluate Aa at Tg. In order to obtain what we consider to be the best available estimate of Aa, we used the value of Vag = 2.7 X 10 - 4 cm3/(g-K) from ref. [58], and at = 8.7 X 10 - 4 K - 1 and Vg = 0.904 cm3/g from the density-temperature
PDMSi PIB NR PP SBR PMA PnBMA PVAc i-PMMA PEMA PET PVC PVC PS PS PS PS a-PMMA a-PMMA a-PMMA PCHMA PoMS Pcarb PaMSd
PaMS (1) PaMS (2)
36, 37 37, 38
39 40 41 42 43
1 44 45 46 47 48 15 47 49 50 48 47 43 43 50 51 56 52 52
150a
202b
204 244 256 281 293 304 320 338 340 349 349 362 362 365 365 376 378 378 380 404 423 440 448 455
1900 1800 2445 2721 2622 3054 2934 3226 2865 2928 3128 3083 3071 2811 2850 3138 2879 3272 3179 3171 3366 3171 3487 3465 3528 3557
2014 1878 2868 3371 3185 4042 3792 4416 3653 3780 4201 4104 4079 3546 3623 4223 3681 4520 4312 4295 4735 4295 5020 4967 5118 5189
31.4 28.8
35.8
44.8 44.3 40.4
44.9 47.4 68.9 60.2 62.3 62.6 57.8 55.1 56.0 63.8 73.4
16.8 29.2 27.6 38.6 36.4 33.8 40.3 39.2 42.2 50.2 42.2 42.3 42.1 62.3 62.1 60.8 62.7 55.2 56.8 57.0 60.8 75.1 66.5 81.0 83.4 86.5
24 c
24.3 42.4 35.2
41 46 71.0 56 55.5 74.2 71 35.9 54.5 59.8 73.0
52
290

TABLE 6. Densification rate calculations from dynamic data at elevated pressures and hole, theory
Polymer
PIB NR PMA PnBMA PVAc PVAca
PEMA PVC PVC PS a-PMMA Pcarb
Ref.
37, 38, 59 39 42 43
1 1
45 47 47 50 43 51
Aa x 104 K-1
4.2 5.40 3.7 1.69 4.32 4.32 2.95 2.93 2.93 2.97 2.35 2.81
(oT/dP)h K/kbar
28.8 27.6 33.8 40.3 39.2 39.2 50.2 44.9 44.9 62.6 56.0 66.5
Ref.
61 60 62 63 13 64 65 66 67 68 67 13
Method
U C D D D C D D S D S D
(ar/ap)w K/kbar 25 24 18 16.7 22 20 20 18 16.5 32 24.5 44
K' Mbar 1
1.6 1.9 5.8 4.0 7.4 8.3 8.9 7.9 8.3 9.1 7.4 6.3
a All quantities derived for same sample. U Ultrasonic D Dielectric C Dynamic Compressibility S Dynamic Shear
Polymer
PDMSib
PIB NR ppc SBRd
PVAce
PVC PS a-PMMA Pcarb PaMS c
TABLE 7. Densification rate calculations from thermal expansion and heat capacity data and hole theory
Ref.
58, 30 59 39 40 41
1 47 50 43 51 56
TgK
150 202 204 244 256 304 349 365 378 423 440
V„cm3/g
0.904 1.072 1.023 1.127 0.987
.843
.729
.976
.864
.854
.958
A a X 104 K"1
6.0 4.2 5.40 4.41 3.92 4.32 2.93 2.97 2.35 2.81 3.98
(dT/dP)h K/kbar
31.4 28.8 27.6 35.8 36.4 44.3 44.9 62.6 56.0 66.5 81.0
Ref.
27 69 70 71 72 16e
29 f
29 f
29 f
73 56
ACpJ/(g-K)
0.30 .377 .455 .51 .456 .50 .34 .368 .33 .22 .32
dTg/dPa K/kbar
27.0 24.1 24.8 23.8 21.7 22.1 21.9 28.8 23.3 46.1 52.4
K' Mbar 1
2.6 2.0 1.5 5.3 5.8 9.6 6.7
10 7.7 5.7
11 a *dTJdP = TgV Aa/ACp. b Partially crystalline sample. c All quantities derived from the same sample.
d 55 percent Styrene for Tg, Vg and Aa, 43 percent AC p. e Measurements by J. J. Weeks reported in Ref. 16. f Average over different sources.
equation of Shih and Flory [36]. Although this equation is derived from data at temperatures well above Tg, its nearly linear response apparently allows valid extrapolation to much lower temperatures. The value VgOti = 7.9 X 10 - 4 cm3/(g-K) is slightly less than the average, 8.7 X 1 0 - 4 , of the others for this polymer in table I of ref. [26] which are obtained from different sources of data at higher temperatures not encompassing Tg. Also the extrapolated value of V g = 0.904 cm3/g above essentially coincides with 0.905 in ref. [26]. The revised thermal expansion values give the positive value of K' shown in table 7.
4.6. Comparison of Experimental Transition Rates
In tables 6 and 7 the assumptions that dTg/dP could be replaced by (dT/dP)^ or TVAa/ACp, respectively, are employed. In table 8 values of these quantities are compared for each polymer. A similar table was prepared by O'Reilly [13] in 1962 for glass-forming liquids not restricted to polymers. Values of A/c/Aa are also included here for comparison; however, agreement with dTg/dP is not expected since the validity of the inequality
dT0/dP < A/c/Aa
appears to be quite strong and general. In most instances, agreement between dTg/dP, (dT/dP)^, and TV a/AC p seems to
TABLE 8.
Polymer
PIB NR PP PVAcc
PVC PVC PS PSC
PS a-PMMA a-PMMAc
Pcarb PaMS
Ref.
39, 60 40
1 47 48 50
9 55 43
9
56
Comparison of experimental transition ratesa
PVT
dTgldP
20 21.2 13.5 14 31.6 31 32 23.6 22
39
A K / A «
26b
48.2 33.5 46 74.2
73 54.5
52
Dynamic
Ref.
61 60
64 66 67 68
67
13
(ar/ap)„ 25 24
22 18 16.5 32
24.5
44
Thermal
Ref.
59, 69 39, 70 40, 71
1, 16d
47, 29 48, 29 50, 29
9 55
43, 29 9
51 , 73 56
TVAa/ACp
24.1 24.8 23.8 22.1 21.9 28.6 28.8 30.5 34 23.3 32 46.1 52
a All units in K/kbar. b AK = 1.2 X 1 0 - 5 ba r - 1 determined from dynamic compressibility. c All given determinations on same sample. d Measurements by J. J. Weeks reported in Ref. [16].
be within experimental error. Small differences may be anticipated because the conditions under which these quantities are evaluated may be vastly different.
According to these results the Prigogine-Defay ratio
r = A/c ACP/[7Y(Aa)2]
291

is essentially unity for natural rubber and PaMS. Unfortunately, we do not have a PVT value of dTJdP for the former to test the validity of the Ehrenfest equations [eqs (6) and (7)]. With PaMS it would appear that although neither of the Ehrenfest equations is obeyed, the Prigogine-Defay ratio is still unity, which is an atypical result. This implies that dTt/dP for volume and entropy are equal, but dTg/dP is distinct. However, since data in tabular, or even graphical form, are not included in ref. [56], evaluation of these numbers cannot be scrutinized. Poor agreement for PVC in all cases is apparent; however, this may be a result of sample differences including the degree of crystallinity which is difficult to control in this polymer. Also poor agreement is noted for a-PMMA of ref. [9], where both quantities are obtained from the same sample. On the other hand, the data in the row above on the same polymer reveal good agreement including that with dTJdP (PVT) of ref. [9]. In all cases agreement is very good for polystyrene.
These results indicate that dTg/dP = (dT/dP)^ is a valid relation and dT JdP = 7YAa/ACP seems to hold most of the time. The validity of the first may be argued on a qualitative phenomenological basis (see sec. 2.) The second relation is evaluated at atmospheric pressure only. There is no apparent reason to assume that the approximation will be as good at elevated pressures.
In section 4.3 we mentioned that PVT data on PnBMA suggest that the first Ehrenfest equation [eq (6b)] is a good approximation for this polymer. This result is tantamount to essentially no densification. (See table 3.) Unfortunately, we have no heat capacity values for this polymer, which are needed to check the second Ehrenfest equation [eq (7)]. In section 3 we noted the possibility of using the "rule of constant ACp" [20] to estimate the heat capacity difference at Tg. (For a comparison of experimental and "bead" values of ACp on polymers, see ref. [28].) For PnBMA the molecular weight of the polymeric repeat unit is 142.2 g/mol. Assigning one bead to each of the two carbon backbones, and one to the oxygen atom, we obtain a total of three beads, which for 11.3 J/(mol-K-bead) gives ACP = 0.24 J/(g-K). Taking this value along with those for A a and Tg from tables 3 and 4, respectively, and Vg = 0.946 cm3/g from ref. [43], we obtain 7YAa/ ACp = 20 K/kbar, which is in good agreement with 20.4 in table 3. Thus both of the Ehrenfest equations appear to be fairly good approximations for this polymer, along with a corresponding Prigogine-Defay ratio of nearly unity. (The value 1.2 is obtained for PnMBA. The average value obtained from table 8, exclusive of NR and PaMS, which were treated separately, is 2.1.) These results imply that both the density and entropy of PnBMA are essentially independent of formation pressure, at least at low pressures.
4.7. Pressure Dependence of K' and Limitations Imposed by Chemical Instability
The previous discussions in this paper pertain to the initial values of K' or at least at very low formation pressures. Most of these are either tangent values at P' = 0 (atmospheric pressure) or secant values obtained fromP' = 1 kbar or less. There are data in the literature, however, which include densifications obtained at different formation pressures.
There are two important physical considerations in optimizing the procedure to obtain "permanent," densified glasses. The first and more obvious, is to select and maintain the temperature of depressurization at temperatures sufficiently
below Tg. It is clear that the ambient conditions must be such as to maintain structural relaxation times which are large in comparison to the desired "lifetime" of the glass. Accordingly, high Tg substances are preferable for room temperature stability. The second is to choose TQ, the temperature of isothermal pressurization, large enough that the equilibrium melt is always maintained during pressurization. Stated alternatively, the inequality
T0 > Tg{P') (19)
must be approximately satisfied, as illustrated in figure 1. This condition implies that the effective time of the pressurization process must be large in comparison to the structural relaxation time at the final pressure P'. In cases where TQ < Tgip') there will be a much smaller contribution to the densification process when the condition TQ = TgiP) is approximated and exceeded during pressurization. This situation is revealed by a leveling off in the volume as illustrated schematically in figure 4, where volume changes are plotted with respect to formation pressure at different pressurization temperatures. The densification is expected to be independent of TQ at low pressures, when ineq (19) is satisfied, as is revealed by the coalescence of these curves with decreasing P'. Such a coalescence is not expected, however, when TQ < Tg as is illustrated by the data of Shishkin [54] on polystyrene. In figure 4 the dashed line represents the extension of the envelope established from arbitrarily large values of TQ.
FIGURE 4. Illustration of the influence of the pressurization temperature T0 on the densification process.
The dashed line is the envelope approached at large temperatures.
One of the better experimental examples which illustrates the behavior shown in figure 4 is provided by the data of Shishkin on PMMA and PS. Formation pressures up to four kbar are applied; but not all of the pressurization temperatures are above T^P'). At the lower pressures, K' increases wi thP ' as is indicated by the increasing slopes of Shishkin's volume-formation pressure curves, and as is shown in figure
292

4. This is the opposite of the trend for the isothermal compressibility K, which decreases with increasing pressure (see for example refs. [12] and [74]). The data of Shishkin, as well as those of Kimmel and Uhlmann [75] on PMMA, show that some densification is possible with pressurization temperatures below Tg, but the effect is diminished as the difference between these two temperatures is increased. Other examples illustrating the dependence of densification on formation pressure are refs. [6], [9] and [55] on polystyrene, and [56] on PaMS. Yourtee and Cooper [6] observe a very slight decrease in the densification rate with formation pressure for polystyrene over a 6 kbar range. For the same polymer, Weitz and Wunderlich [9] find a much larger dependence with the same trend, where the density gradually becomes nearly constant at 4 kbar. These trends are contrary to the marked increase in the densification rate with formation pressure observed by Shishkin on PS and PMMA and Ichihara et al. [56] on PaMS. K' does not necessarily have to tend to zero for the volume to be non-negative at large formation pressures. Using our definition of K' , the densified volume tends to zero at arbitrarily large formation pressures when K' is a positive constant.
According to the experiments of Weitz and Wunderlich on polystyrene, there is a monotonic increase in density at a decreasing rate which the density seems to level off at 4 kbar. Thus, beyond this point the formation pressure would have no effect on the densification process. On the other hand, with most of the other investigations mentioned above, including those on polystyrene, it would appear that chemical stability is the limiting factor. Whether the reaction rate constant of a given rate process increases or decreases with pressure depends upon the sign of its corresponding activation volume [76]. In most cases it is expected that the total activation volume will be positive with a corresponding increase in the effective decomposition temperature with increasing pressure. This behavior may be complicated, however, by the different temperature and pressure dependencies of the various decomposition modes, and, possibly by the initiation of new ones at elevated pressures.
The important consideration here is whether, or not, the decomposition temperature and Tg -pressure curves come sufficiently close at any point to limit the densification process. For example, with polytetrafluoroethylene the increase of decomposition temperature with pressure is only about 3.5 K/ kbar [77]. Although this rate is small, the decomposition temperature is sufficiently remote from the observed phase transitions, since its initial (atmospheric pressure) value is about 700°C. In addition, the melting and decomposition curves diverge with increasing pressure over the experimental range of 28 kbar, investigated so far.
In cases where the decomposition temperature Ta increases with pressure, TQ should also be allowed to increase with pressure to optimize the densification. With polytetrafluoroethylene this process would appear to continue without bound because of the observed divergence mentioned above. In instances where T a and Tg converge or intersect at a finite pressure, the densification would be essentially limited by the effective intersection temperature as illustrated in figure 5. Except for the polymer mentioned above, pressure dependent pyrolysis data are apparently non-existent in the literature4.
The results in table 9 summarize an attempt to estimate the optimum densification on a few polymers beyond which thermal decomposition would occur. In the absence of reliable pyrolysis data at elevated pressures, we will estimate optimum densification by commencing isothermal pressurization at TQ = Ta. Since in most cases Ta is expected to increase with pressure, this procedure should underestimate the maximum densification as illustrated by the lower value of P'max obtained by the dashed line path in figure 5.
4 Preliminary work of this kind on 18 polymers, including PMMA, PS, Pcarb, and PVC, has been reported by H. Eyring and coworkers in Ref. [78]. In all of these the decomposition temperature increases monotonically with pressure. We have been unable to obtain a final report on this activity.
Pressurization in Melt
FIGURE 5. Schematic illustration of temperature-pressure history used to optimize the densification process before the onset of pyrolysis.
Polymer
PIB PP PMA PVAc PVC PS a-PMMA PaMS
Ref.
79 79 80
8 1 , 82 83 80 80 80
TABLE 9. Estimation of maximum densification f
AH kj/mol
218 255 155 112 126 218 230 243
TK
593 623 558 497 508 608 583 546
k(T) %/min
0.268 .069 .270
5.58 0.43
.163
.250
.276
TdK
558 606 515 409 a
458 577 552 519
TgK
202 244 282 304 349 363 378 448
rom pyrolysis data
dTJdP K/kbar
25 20 18 21.2 13.5 30.0 23.6 39
P'max kbar
14 18 13
5 8 7 7 2
K' Mbar l
1.6 7.0 5.8 9.3 6.4 8.1 7.3 4.9
\ y ) m a x
% 2
13 8 5 5 6 5 1
a Stated to be unstable at temperatures above 463K in Ref. [81]. During sample preparation [1] slight discoloration was observed after heating overnight in a vacuum at 403 K.
293

In table 9 T a is taken arbitrarily at the value for which the initial reaction rate constant k = 1%/hr, applicable to the total degredation process. Assuming Arrhenius behavior Ta may be calculated from the relation
1/Td= \/T - (R/AH)€n[(l/60)/k(T)]
where/? = 8.314 J/(mol-K) and A// is the activation energy. T is arbitrarly chosen from the closest data point to Ta, which in all cases, but one (PVAc), involves extrapolation. These decomposition temperatures correspond to those given in table 7 of ref. [34], except the latter apparently apply to k = 1 percent/min and, accordingly, are larger. The ceiling temperatures in the same table, which apply to the propagation mode at equilibrium, are apparently not relevant to the densification process. Tg, dTJdP, and K' are selected from previous tables in this paper. P'max> the pressure corresponding to the onset of pyrolysis at T0 = Ta and — (AV/ F) m a x , the corresponding maximum densification, are obtained from the simple relations
P'max = \Jd - Tg{0)V(dTg/dP) - ( A F / F U x = K' X P'max-
From these results it appears that P' m a x varies inversely with Tg; however, no trend is apparent for (&V/V)max.
4.8. Dependence of Refractive Index on Densification
A reliable estimate of the change of refractive index on densification should be obtained by means of the Lorentz-Lorenz equation,
(n2-l)/(n2+2) =Kp, (20)
where n is the index of refraction and p the density. K depends upon the polarizability, which is expected to be essentially independent of formation pressure, or alternatively, the density at constant temperature and pressure. The relative change of index of refraction with formation pressure,
8' = (l/n) (dn/dP)TJ>,
is obtained explicitly by differentiation of eq (20), viz,
8' = ( l ^ n 2 ) ^ 2 - 1 )(n2 + 2 )* ' . (21)
Table 10 presents the results for polymers for which values for JIB (sodium D line) are available from ref. [35] with K' selected from our tables. The rip values are converted to those at Tg by means of the temperature coefficients given in ref. [84]. As seen from the table, these corrections are insignificant. Since all of these values range between 1.48 and 1.58, a very slight (10 percent) error will be incorporated in 8' by taking the function f(n) = ( l /6n 2)(n 2 - l)(n2 + 2 ) as a constant, as revealed by the table. Accordingly, in view of the large experimental uncertainties in K' (35 percent for polystyrene), the additional uncertainties obtained on replacing eq (21) by the approximation
8' = 0 . 4 K '
are slight. The values of 8' in the table however, are calculated from eq (21). We do not have any direct experimental data giving the dependence of the index of refraction on formation pressure. '
TABLE 10. Estimation of change in refractive index from densification rate
Polymer
PIB NR PP SBR PMA PnBMA PVAc PEMA PVC PS a-PMMA PCHMA Pcarb
T0°C
- 7 1 - 6 9 - 2 9 - 1 6
9 20 31 64 76 90
105 107 143
1 nD{Tf (°C)
1.51c
1.52(25) 1.49c
1.53c
1.47(20) 1.48(25) 1.48(20) 1.48(25) 1.55c
1.59c
1.49(20) 1.51(20) 1.58c
dnDldT*> o c _ i
- 0 . 0 0 0 3 - 0 . 0 0 0 3 7
(d) (d) (d) (d)
- 0 . 0 0 0 1 (e) (e)
- 0 . 0 0 0 1 3 - 0 . 0 0 0 1 2 - 0 . 0 0 0 1 3
(e)
nD(Tg)
1.54 1.55 1.51 1.54 1.47 1.48 1.48 1.48 1.54 1.58 1.48 1.50 1.57
f(nD)
0.421 .428 .400 .421 .373 .380 .380 .380 .421 .449 .380 .394 .442
K'
Mbar - 1
1.6 1.9 4.1 5.8 5.8 0.7 9.1 8.9 7.6 8.2 7.4
12.6 5.1
8' Mbar - 1
0.7 .8
1.6 2.4 2.2 0.3 3.5 3.5 3.2 3.7 2.8 5.0 2.3
a Taken from Ref. [35]. d dnD/dT taken as - 0 . 0 0 0 3 . b Taken from Ref. [84]. e dnD/dT taken as - 0 . 0 0 0 1 . c Temperature taken as 25°C.
These evaluations have potential application in optimization or adjustment of the refractive indices of plastic lenses by appropriately setting the molding pressure. The values in the last column in table 10 give the relative percent changes (&ji/n) resulting from a moding pressure of 10 kbar. For PS and PMMA, which are common constituents for plastic lenses, n would change by 4 and 3 percent, respectively. However, it was estimated in the last section that thermal decomposition of these polymers would limit the pressuriza-tion to 7 and 8 kbar, respectively. In these analyses isothermal pressurization is considered at the decomposition temperature. If this temperature increases with pressure as indicated by ref. [78] for PS and PMMA, an additional increase in their refractive indices could be obtained by appropriately increasing the temperature during pressurization.
5. Conclusion
Several methods have been evaluated to estimate the densification rate, K ' , applicable to glass formation by isobaric cooling at constant rate. Other than the direct measurement of the volume difference in the glass, K' is always computed from an expression involving the difference between two transition rates, dTg/dP and dTj/dP. The hole theory is shown to be sufficiently accurate in estimating dT^/dP for the 23 polymers evaluated except for possibly those of dimethyl siloxane and a-methyl styrene. With these it is not clear whether the discrepancies result from experimental error or lack of generality in the application of the theory. Although dTJdP is only evaluated experimentally, there are independent alternatives. The simplest of these involves the differences between thermal expansions and heat capacities at Tg for liquid and glass at atmospheric pressure only.
The principal problem in the estimation of densification using these procedures appears to be the large amount of experimental uncertainty in all of the relevant quantities, in particular, the compressibility. Since the expression for K' involves the difference between two quantities of similar
294

magnitude, even small experimental errors may have a pronounced effect. Accordingly, it is difficult to assess the relative merits of the different methods employed here, including the application of the hole theory.
The results of these analyses appear to have practical applications. Densifying glasses produces a hardening effect as revealed by an increase in moduli. However, these effects do not appear to be as pronounced, in particular viscosity or relaxation time, as those obtained at the same volume, temperature, and pressure in the glass by commensurately decreasing the cooling rate at atmospheric pressure. This procedure however is usually not practical because of the large times required for glass formation. According to one investigation it is possible to optimize the ultimate properties through the appropriate adjustment of the formation or molding pressure. More work is necessary to establish the generality of this result and to determine the formation pressures for maximum yield stress. Moreover, the relation between the refractive index and densification quantity presented could be used to quantitatively regulate the refractive index of lenses through appropriate adjustment of the molding pressure. The maximum value would appear to be limited by chemical instability at the high temperatures necessary to exceed Tg(P), which increases with pressure. The simple relation given does not include the influence of densification on optical dispersion. Again, experimental work is required to assess the validity of our estimates and the possible influence of densification on dispersion.
This work was supported in part by the National Science Foundation under Grant DMR 75-15401.
6. Appendix
As indicated earlier, eqs (5) in the text involve a linearization of pertinent quantities and proximity to the transition line Tg(P) in figure 3. The experimental data found in the literature often do not satisfy these conditions. Hence we reconsider here the processes depicted in figure 3, by replacing the simplifications adopted earlier by the more general form. This will not only permit the prediction of densification effects under more extreme conditions, but also allow us to gage the quantitative validity of the linearization. Clearly, a knowledge of the equations of state is required for an explicit evaluation, but is certainly not available for the wide range of systems discussed here. However we shall be able to present typical numerical illustrations using PVAc where appropriate data exist [1, 14].
From the definitions of the coefficients a and K it follows that:
where the subscript indicates an initial value. However, it will be accurate enough to omit second and higher powers in the expansions of the exponentials. Considering an average, temperature independent value for the liquid, (a) = 8 X 1 0 - 4 K_ 1 , and a temperature interval of 100 degrees, we obtain for the integral a value of 8 X 1 0 - 2 . Thus the quadratic term changes the total result by 0.34 percent. The
values were chosen so as to magnify the effect. For the glass, the approximation will be even more adequate. With a pressure difference of 2 kbar and (K) = 4 X 10~5 ba r - 1 , the magnitude of the relative volume change is the same and identical conclusions are obtained as for the a-term.
Denoting the initial temperature in the melt as T0 and the final temperature in the glass as 71/, with the initial pressure taken as zero, we obtain instead of eq (3), when the pressure dependence of the a's and the temperature dependence of the K'S are taken into account, the following expression:
(VA ~ VB)/V0 = f^iTo, P) - Kg,c(Tf, P) ] dP
- fT°%X«i(T, 0) - ag,c(T, P')] dT + J*V>M7\ P') 1 g 9
- a,(7\ 0)] dT - f«°\ag,b{T, 0) - aff,c(7\ />')] dT
(A-l)
where the subscripts b and c pertain to the low and high pressure glasses respectively. This choice conforms with the nomenclature used in refs. [1] and [14]. In the linearized derivation, a and K for both liquid and glass are taken to be constants. Accordingly, there is no distinction between the values of (Xgj and aQ}C, and, similarly, Kg>b and Kg>c.
To proceed further, we make use of an explicit equation of state. It is most convenient to employ the extensively tested Tait relations for both melt and glass. To recapitulate the pertinent equation (14), [50]:
K ( P , T) = C{[P + B] X [1 - Ctn(\ + P/B]}-1
where
B(T) = aexp(-bT)
and
a(T, P) - a(T, 0) = PK(T, P) d€nB/dT = -bPK.
(A-2)
The last transforms eq (A-l) into
(VA ~ VB)/V0 = SP0'[«i(To, P) ~ Kg,c(Tf, P)] dP
~ ff&Mtf', 0) - agJT, 0)] dT - ftm[ag,b{T, 0) lo lf
XdT- bgiCP' f«p,)Ka,c(T, F) dT, (A-3)
where the first two terms will predominate. We now proceed to evaluate the integrals in eq (A-3) which
are identified as follows:
V/V0 = exp Ul otdT]; V/V 0 = exp \_-fP «dP] ag,c(T, 0)] dT W'SrlrMT-n
295
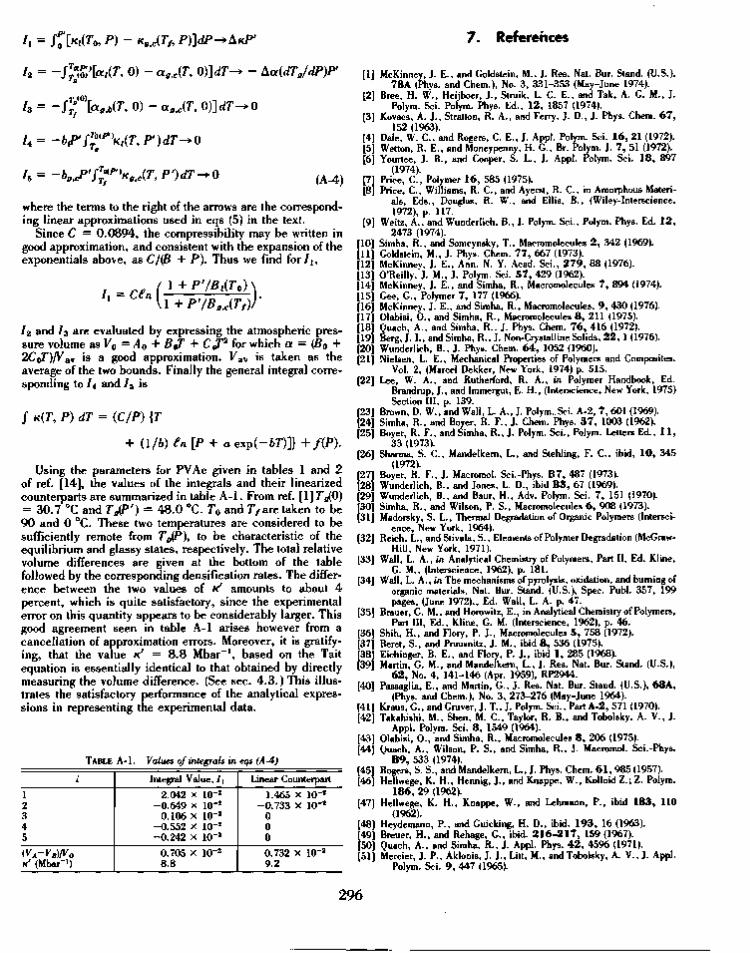
/i = OKKFO, P) - Ka,c(Tf, P)]dP^AKP' 7. References
h = - / r l S ' M r , 0) - ag,c{T, 0)]dT-* - Aa(dTg/dP)P'
h = -SX\oc9,b(T, 0) - ag,c(T, 0)]dT^0
h= -baJ"Sl«p,iK9AT,P')dT-*0 (A-4)
where the terms to the right of the arrows are the corresponding linear approximations used in eqs (5) in the text.
Since C = 0.0894, the compressibility may be written in good approximation, and consistent with the expansion of the exponentials above, as C/(B + P) . Thus we find for7\,
1 + P'/Btfo) e I 1 + P'/Bi(T0) \ h = C€n{l+P'/B9JTf))-
12 and ^3 are evaluated by expressing the atmospheric pressure volume as V0 = A0 + B^1 + C J12 for which a = (B0 + 2C07
7)/Vav is a good approximation. Vav is taken as the average of the two bounds. Finally the general integral corresponding to 14 and / 5 is
/ #c(7\ P) dT = (C/P) {T
+ (1/6) €n [P + a exp(-bT)]} + f(P).
Using the parameters for PVAc given in tables 1 and 2 of ref. [14], the values of the integrals and their linearized counterparts are summarized in table A-l . From ref. [1] T^O) = 30.7 °C and TJp') = 48.0 °C. T0 and Tf are taken to be 90 and 0 °C. These two temperatures are considered to be sufficiently remote from TJf*), to be characteristic of the equilibrium and glassy states, respectively. The total relative volume differences are given at the bottom of the table followed by the corresponding densification rates. The difference between the two values of K' amounts to about 4 percent, which is quite satisfactory, since the experimental error on this quantity appears to be considerably larger. This good agreement seen in table A-l arises however from a cancellation of approximation errors. Moreover, it is gratifying, that the value K' = 8.8 Mbar -1, based on the Tait equation is essentially identical to that obtained by directly measuring the volume difference. (See sec. 4.3.) This illustrates the satisfactory performance of the analytical expressions in representing the experimental data.
TABLE A- l . Values of integrals in eqs (A-4)
i
1 2 3 4 5
(VA-VBWO K' (Mbar-1)
Integral Value, /{
2.042 X lO"2
- 0 . 6 4 9 X lO"2
0.106 X lO"2
- 0 . 5 5 2 X l O - 2
- 0 . 2 4 2 X 10"2
0.705 x lO"2
8.8
Linear Counterpart
1.465 X lO"2
- 0 . 7 3 3 X lO"2
0 0 0
0.732 X lO"2
9.2
[9
[10 [11 [12 [13 [14 [15 [16. [17; [18; [19; [20 [21
[22
[23 [24 [25
[26
[27. [28 [29 [30 [31
[32
[33
[34
[35
[36 [37 [38 [39;
[4o;
[41 [42
[43 [44;
[45 [46
[47;
[48 [49 [50 [51
in Amorphous Materi-(Wiley-Interscience,
Macromolecules 2 , 342 (1969).
McKinney, J. E., and Goldstein, M., J. Res. Nat. Bur. Stand. (U.S.), 78A (Phys. and Chem.), No. 3 , 331-353 (May-June 1974).
Bree, H. W., Heijboer, J., Struik, L. C. E., and Tak, A. G. M., J. Polym. Sci. Polym. Phys. Ed., 1 2 , 1857 (1974).
Kovacs, A. J., Stratton, R. A., and Ferry, J. D., J. Phys. Chem. 6 7 , 152 (1963).
Dale, W. C , and Rogers, C. E., J. Appl. Polym. Sci. 1 6 , 21 (1972). Wetton, R. E., and Moneypenny, H. G., Br. Polym. J. 7 , 51 (1972). Yourtee, J. B., and Cooper, S. L., J. Appl. Polym. Sci. 1 8 , 897
(1974). Price, C , Polymer 1 6 , 585 (1975). Price, C , Williams, R. C , and Ayerst, R. C ,
als, Eds., Douglas, R. W., and Ellis, B. 1972), p. 117.
Weitz, A., and Wunderlich, B., J. Polym. Sci., Polym. Phys. Ed. 1 2 , 2473 (1974).
Simha, R., and Somcynsky, T., Goldstein, M., J. Phys. Chem. 7 7 , 667 (1973). McKinney, J. E., Ann. N. Y. Acad. Sci., 2 7 9 , 88 (1976). O'Reilly, J. M., J. Polym. Sci. 5 7 , 429 (1962). McKinney, J. E., and Simha, R., Macromolecules 7 , 894 (1974). Gee, G., Polymer 7 , 177 (1966). McKinney, J. E., and Simha, R., Macromolecules, 9 , 430 (1976). Olabisi, 0 . , and Simha, R., Macromolecules 8 , 211 (1975). Quach, A., and Simha, R., J. Phys. Chem. 7 6 , 416 (1972). Berg, J. I., and Simha, R., J. Non-Crystalline Solids, 2 2 , 1 (1976). Wunderlich, B., J. Phys. Chem. 6 4 , 1052 (1960). Nielsen, L. E., Mechanical Properties of Polymers and Composites.
Vol. 2, (Marcel Dekker, New York, 1974) p. 515. Lee, W. A., and Rutherford, R. A., in Polymer Handbook, Ed.
Brandrup, J., and Immergut, E. H. , (Interscience, New York, 1975) Section III, p. 139.
Brown, D. W., and Wall, L. A., J. Polym..Sci. A-2, 7 , 601 (1969). Simha, R., and Boyer, R. F. , J. Chem. Phys. 3 7 , 1003 (1962). Boyer, R. F. , and Simha, R., J. Polym. Sci., Polym. Letters Ed., 1 1 ,
33 (1973). Sharma, S. C , Mandelkem, L., and Stehling, F. C , ibid, 1 0 , 345
(1972). ~ " J. Macromol. Sci.-Phys. B 7 , 487 (1973).
L. D., i b i d B 3 , 67 (1969). H., Adv. Polym. Sci. 7 , 151 (1970). S., Macromolecules 6 , 908 (1973).
Madorsky, S. L., Thermal Degradation of Organic Polymers (Interscience, New York, 1964).
Reich, L., and Stivala, S., Elements of Polymer Degradation (McGraw-Hill, New York, 1971).
Wall, L. A., in Analytical Chemistry of Polymers, Part II, Ed. Kline, G. M., (Interscience, 1962), p. 181.
Wall, L. A., in The mechanisms of pyrolysis, oxidation, and burning of organic materials, Nat. Bur. Stand. (U.S.), Spec. Publ. 357, 199 pages, (June 1972)., Ed. Wall, L. A. p. 47.
Brauer, G. M., and Horowitz, E., in Analytical Chemistry of Polymers, Part III, Ed., Kline, G. M. (Interscience, 1962), p. 46.
Shih, H., and Flory, P. J., Macromolecules 5 , 758 (1972). Beret, S., and Prausnitz, J. M., ibid 8 , 536 (1975). Eichinger, B. E., and Flory, P. J., ibid 1, 285 (1968). Martin, G. M., and Mandelkem, L., J. Res. Nat. Bur. Stand. (U.S.),
6 2 , No. 4, 141-146 (Apr. 1959), RP2944. Passaglia, E., and Martin, G., J. Res. Nat. Bur. Stand. (U.S.), 6 8 A ,
(Phys. and Chem.), No. 3 , 273-276 (May-June 1964). Kraus, G., and Gruver, J. T., J. Polym. Sci., Part A-2 , 571 (1970). Takahishi, M., Shen, M. C , Taylor, R. B., and Tobolsky, A. V., J.
Appl. Polym. Sci. 8 , 1549 (1964). Olabisi, O., and Simha, R., Macromolecules 8 , 206 (1975). Quach, A., Wilson, P. S., and Simha, R., J. Macromol. Sci.-Phys.
B 9 , 533 (1974). Rogers, S. S., and Mandelkem, L., J. Phys. Chem. 6 1 , 985 (1957). Hellwege, K. H., Hennig, J., and Knappe, W., Kolloid Z.; Z. Polym.
1 8 6 , 29 (1962). Hellwege, K. H., Knappe, W., and Lehmann, P . , ibid 1 8 3 , 110
(1962). Heydemann, P. , and Guicking, H. D., ibid. 1 9 3 , 16 (1963). Breuer, H. , and Rehage, G., ibid. 2 1 6 - 2 1 7 , 159 (1967). Quach, A., and Simha, R., J. Appl. Phys. 4 2 , 4596 (1971). Mercier, J. P. , Aklonis, J. J., Litt, M., and Tobolsky, A. V., J. Appl.
Polym. Sci. 9 , 447 (1965).
Boyer, R. F, Wunderlich, B., and Jones Wunderlich, B., and Baur, Simha, R., and Wilson, P.
296

[52] Cowie, J. M. G., and Toporowski, P. M., J. Macromol. Sci.-Phys., 1, 81 (1969).
[53] Simha, R., Wilson, P. S., and Olabisi, 0 . , KolloidZ.; Z. Polym. 2 5 1 , 402 (1973).
[54] Shishkin, N. I., Sov. Phys., Solid State Phys. 2 , 322 (1960). [55] Ichihara, S., Komatsu, A., Tsujita, Y., Nose, T., and Hata, T., Polym.
J. 2 , 530 (1971). [56] Ichihara, S., Komatsu, A., and Hata, T., Polym. J. 2 , 650 (1971). [57] Boyer, R. F. , Styrene Polymers (Physical Properties-Thermal Charac
teristics), in Encyclopedia on Polymer Science and Technology, Boyer, R. F. , Ed., (Wiley and Sons, New York, 1970), p. 297.
[58] Weir, C. F. , Leser, W. H., and Wood, L. A., J. Res. Nat. Bur. Stand. (U.S.), 4 4 , 367-372 (Apr. 1950), RP2084.
[59] Ferry, J. D., and Parks, G. S., J. Chem. Phys. 4 , 70 (1936). [60] McKinney, J. E., Belcher, H. V., and Marvin, R. S., Trans. Soc.
Rheology 4 , 347 (1960). [61] Singh, H. , and Nolle, A. W., J. Appl. Phys. 3 0 , 337 (1959). [62] Williams, G., Trans, Faraday Soc. 6 0 , 1556 (1964). [63] Williams, G., and Edwards, D. A., ibid 6 2 , 1329 (1966). [64] McKinney, J. E., and Belcher, V., J. Res. Nat. Bur. Stand. (U.S.),
6 7 A (Phys. and Chem.), No. 1, 43-53 (Jan.-Feb. 1963). [65] Williams, G., Trans. Faraday Soc. 6 2 , 2091 (1966). [66] Koppelman, J., and Gielessen, J., Z. fiir Electrochemie 6 5 , 689
(1961). [67] Zosel, A., Kolloid Z.; Z. Polym. 1 9 9 , 113 (1964). [68] Sasabe, H., and Saito, S., Polym. J. 3 , 749 (1972). [69] Furukawa, G. T., and Reilly, M. L., J. Res. Nat. Bur. Stand. (U.S.),
5 6 , No. 5, 285-288 (May 1956), RP2676. [70] Bekkedahl, N., and Matheson, H., J. Res. Nat. Bur. Stand. (U.S.),
1 5 , 503-515 (Nov. 1935), RP844.
[71] Passaglia, E., and Kevorkian, H. K., J. Appl. Phys. 3 4 , 90 (1963). [72] Furukawa, G. T., McCoskey, R. E., and Reilly, M. L., J. Res. Nat.
Bur. Stand. (U.S.), 55, No. 3, 127-132 (Sept. 1955), RP2610. [73] O'Reilly, J. M., Karasz, F. E., and Bair, H. E., J. Polym. Sci., Part C,
6 , 109 (1964). [74] McKinney, J. E., and Lindsay, R., Density and Compressibility of
Liquids, in American Institute of Physics Handbook, Gray, D. W., Ed. (McGraw-Hill, New York, 1972). Section 2, p. 167.
[75] Kimmel, R. M., and Uhlman, D. R., J. Appl. Phys. 4 1 , 2917 (1970). [76] Lin, S. H., Li, K. P. , and Eyring, H., in Physical Chemistry, An
Advanced Treatise, Vol VII (Academic Press, New York, N.Y., 1975), p. 38.
[77] Tamayama, M., Andersen, T. N., and Eyring, H., Proc. Nat. Acad. Sci. 5 7 , 554 (1967).
[78] Eyring, H., in Proceedings, New Materials from High-Pressure High-Temperature Processes, U.S. Army Research Office-Durham 27-28 Sept. 1967 at Watervliet Arsenal, Watervliet, N.Y.
[79] Madorsky, S. L., and Straus, S., J. Res. Nat. Bur. Stand. (U.S.), 53A No. 6, 361-370 (Dec. 1954), RP2553. •
[80] Wall, L. A., and Madorsky, S. L., J. Polym. Sci. 1 1 , 491 (1953). [81] Grassie, N., Trans. Faraday Soc. 4 8 , 379 (1952). [82] ibid. 4 9 , 835 (1953). [83] Stromberg, R. R., Straus, S., and Achhammer, B. G., J. Polym. Sci.
3 5 , 355 (1959). [84] Newman, S. B., ref. [35], p. 284.
(Paper 81A2&3-931)
297