
Thermodynamics of the Corn-Ethanol Biofuel...
105
Thermodynamics of the Corn-Ethanol Biofuel Cycle Tad W. Patzek Department of Civil and Environmental Engineering 425 Davis Hall University of California, Berkeley, CA 94720 Email: [email protected] Critical Reviews in Plant Sciences, 23(6):519-567 (2004) This Web Version is being periodically updated New: Appendix D on fuel cells, consistent use of fuel HHVs, corrected theoretical yield of ethanol from starch, equivalent CO 2 emissions and CExC adjusted to Patzek’s, not Shapouri et al.’s inputs, added eroded soil humus oxidation Increased ethanol yield to ∼2.5 gal/wet bushel, 91.5% of theoretical yield Appendix E on free energy consumed to produce machinery July 22, 2006
Transcript of Thermodynamics of the Corn-Ethanol Biofuel...
Thermodynamics of the Corn-EthanolBiofuel Cycle
Tad W. PatzekDepartment of Civil and Environmental Engineering
425 Davis Hall
University of California, Berkeley, CA 94720
Email: [email protected]
Critical Reviews in Plant Sciences, 23(6):519-567 (2004)
This Web Version
is being periodically updated
New: Appendix D on fuel cells, consistent use of fuel HHVs,corrected theoretical yield of ethanol from starch, equivalent CO2
emissions and CExC adjusted to Patzek’s, not Shapouri et al.’s inputs,added eroded soil humus oxidation
Increased ethanol yield to ∼2.5 gal/wet bushel, 91.5% of theoretical yieldAppendix E on free energy consumed to produce machinery
July 22, 2006


CRPS, 23(6), 2004 T. W. PATZEK i
Contents
1 Introduction 1
1.1 Corn Highlights . . . . . . . . . . . . . . . . . . . . . . . . . . . . . . . . . . . . . . . 2
1.2 Energy Inputs to Corn Production . . . . . . . . . . . . . . . . . . . . . . . . . . . . 3
1.3 Layout . . . . . . . . . . . . . . . . . . . . . . . . . . . . . . . . . . . . . . . . . . . . 4
I Mass & Energy Balance 5
1 Introduction 5
2 Mass Balance of Corn 5
3 Major Energy Inputs to Corn Production 7
3.1 Field Chemicals . . . . . . . . . . . . . . . . . . . . . . . . . . . . . . . . . . . . . . . 7
3.1.1 Specific Energy Requirements for Nitrogen Fertilizer . . . . . . . . . . . . . . 8
3.1.2 Other Energy Inputs to Fertilizer Production . . . . . . . . . . . . . . . . . . 10
3.1.3 Specific Energy Requirements for Phosphorus Fertilizers . . . . . . . . . . . . 10
3.1.4 Specific Energy Requirements for Potassium Fertilizers . . . . . . . . . . . . . 11
3.1.5 Specific Energy Requirements for Calcinated Lime . . . . . . . . . . . . . . . 11
3.1.6 Specific Energy Requirements for Herbicides and Insecticides . . . . . . . . . 12
3.2 Specific Energy Requirements for Fossil Fuels . . . . . . . . . . . . . . . . . . . . . . 12
3.3 Use of Electricity . . . . . . . . . . . . . . . . . . . . . . . . . . . . . . . . . . . . . . 14
3.4 Averages Can Be Misleading. . . . . . . . . . . . . . . . . . . . . . . . . . . . . . . . . 15
3.5 Energy in Human Labor . . . . . . . . . . . . . . . . . . . . . . . . . . . . . . . . . . 15
3.6 Energy in Corn Seeds . . . . . . . . . . . . . . . . . . . . . . . . . . . . . . . . . . . 16
3.7 Energy in Irrigation . . . . . . . . . . . . . . . . . . . . . . . . . . . . . . . . . . . . 16
3.8 Energy in Transportation . . . . . . . . . . . . . . . . . . . . . . . . . . . . . . . . . 17
3.8.1 Personal Commute . . . . . . . . . . . . . . . . . . . . . . . . . . . . . . . . . 18
3.9 Machinery & Infrastructure . . . . . . . . . . . . . . . . . . . . . . . . . . . . . . . . 18
3.10 Fossil Energy Inputs into Corn Production . . . . . . . . . . . . . . . . . . . . . . . . 19
3.11 Solar Energy Input into Corn Production . . . . . . . . . . . . . . . . . . . . . . . . 19
3.12 Soil Humus and Micro-Element Depletion by Corn Production . . . . . . . . . . . . 20
4 Major Energy Inputs to Ethanol Production 22
4.1 Corn Mass Balance Revisited . . . . . . . . . . . . . . . . . . . . . . . . . . . . . . . 22
4.2 Transport in Ethanol Refineries . . . . . . . . . . . . . . . . . . . . . . . . . . . . . . 24
4.3 Fossil Energy Inputs to Ethanol . . . . . . . . . . . . . . . . . . . . . . . . . . . . . . 24
4.4 Energy Credits . . . . . . . . . . . . . . . . . . . . . . . . . . . . . . . . . . . . . . . 25
4.5 Overall Energy Balance of the Corn-Ethanol Process . . . . . . . . . . . . . . . . . . 25
II Sustainability & Renewability 28
1 Introduction 28
2 Disclaimer 28
ii Thermodynamics of corn-ethanol biofuel. . . Web Version
3 Preliminaries 29
4 Laws of Thermodynamics 29
5 Thermodynamics and Economics 31
6 Economic Activity 32
7 Agriculture 34
8 Industrial Production 35
9 Waste 36
10 Sustainability 36
10.1 The Earth is an Open System to Heat Flow . . . . . . . . . . . . . . . . . . . . . . . 38
10.2 Conclusions . . . . . . . . . . . . . . . . . . . . . . . . . . . . . . . . . . . . . . . . . 39
III Sustainability of Corn-Ethanol Cycle 41
1 Introduction 41
2 Available Free Energy 41
2.1 Introduction to Exergy . . . . . . . . . . . . . . . . . . . . . . . . . . . . . . . . . . . 41
2.2 Change of Bth between Two States . . . . . . . . . . . . . . . . . . . . . . . . . . . . 42
2.3 An Industrial Flow Process . . . . . . . . . . . . . . . . . . . . . . . . . . . . . . . . 42
2.4 Cumulative Exergy Consumption (CExC) . . . . . . . . . . . . . . . . . . . . . . . . 44
3 The Ideal and Real Corn-Ethanol Cycle 44
4 System Boundary 46
5 The Carbon Cycle 46
5.1 Net CO2 Emissions . . . . . . . . . . . . . . . . . . . . . . . . . . . . . . . . . . . . . 47
5.2 Conclusions . . . . . . . . . . . . . . . . . . . . . . . . . . . . . . . . . . . . . . . . . 49
6 Water Cycle 50
7 Exergy Analysis of the Ideal Corn Ethanol Cycle 52
7.1 Chemistry of the CO2-Glucose-EtOH Cycle . . . . . . . . . . . . . . . . . . . . . . . 52
7.1.1 The Maximum Cycle Output per Unit Mass of Corn . . . . . . . . . . . . . . 53
8 Exergy Analysis of the Modified Ideal Corn-Ethanol Cycle 53
9 Resource Consumption and Waste Generation in the Industrial Corn-EthanolCycle 54
9.1 Cleanup of BOD in Ethanol Plant Wastewater . . . . . . . . . . . . . . . . . . . . . 55
9.2 Cleanup of Contaminated Field Runoff Water . . . . . . . . . . . . . . . . . . . . . . 56
9.3 Restoration Work . . . . . . . . . . . . . . . . . . . . . . . . . . . . . . . . . . . . . . 57

CRPS, 23(6), 2004 T. W. PATZEK iii
10 Conclusions 58
IV Other Problems with Corn-Ethanol 60
1 Introduction 60
2 First-Law View of Corn-Ethanol Production in 2004 60
3 Second-Law View of Corn-Ethanol Production in 2004 61
4 Public Health Problems 63
V Summary & Conclusions 64
A Examples of Entropy Production and Disposal 69
B Availability and Irreversibility in Thermal Systems 72
C Is Economic Sustainability Possible? 75
D Efficiency of a Fuel Cell System 77
E Cumulative Exergy Consumption in Steel Production 79E.1 Steel component manufacturing . . . . . . . . . . . . . . . . . . . . . . . . . . . . . . 79
VI Tables 87
List of Tables
1 Corn kernel composition . . . . . . . . . . . . . . . . . . . . . . . . . . . . . . . . . . 872 Application rates of field chemicals . . . . . . . . . . . . . . . . . . . . . . . . . . . . 873 Specific energies and application rates of nitrogen fertilizer . . . . . . . . . . . . . . . 874 Energy consumption in superphosphate production . . . . . . . . . . . . . . . . . . . 885 Specific energy and application rate of phosphorus fertilizers . . . . . . . . . . . . . . 886 Energy consumption in potassium fertilizer production . . . . . . . . . . . . . . . . . 887 Specific energy and application rates of potassium fertilizer . . . . . . . . . . . . . . 888 Specific energy and application rates of calcinated lime . . . . . . . . . . . . . . . . . 899 Specific energy and application rates of herbicides . . . . . . . . . . . . . . . . . . . 8910 Specific energy and application rates of insecticides . . . . . . . . . . . . . . . . . . . 8911 Average high and low heating values of fuels . . . . . . . . . . . . . . . . . . . . . . . 9012 Calorific values and specific volumes of gasoline . . . . . . . . . . . . . . . . . . . . . 9013 Calorific values and specific volumes of diesel fuel . . . . . . . . . . . . . . . . . . . . 9114 Calorific values and specific volumes of LPG fuel . . . . . . . . . . . . . . . . . . . . 9115 Calorific values and specific volumes of methane . . . . . . . . . . . . . . . . . . . . 9116 Electricity use in corn farming . . . . . . . . . . . . . . . . . . . . . . . . . . . . . . 9217 Energy used in transportation related to corn farming . . . . . . . . . . . . . . . . . 9318 Corn kernel composition . . . . . . . . . . . . . . . . . . . . . . . . . . . . . . . . . . 93

iv Thermodynamics of corn-ethanol biofuel. . . Web Version
19 Specific CO2 emissions . . . . . . . . . . . . . . . . . . . . . . . . . . . . . . . . . . . 93
20 Chemical exergies of compounds in the ideal corn-ethanol cycle . . . . . . . . . . . . 94
21 Product exergies after each step of the ideal corn-ethanol cycle . . . . . . . . . . . . 94
22 Product exergies after each step of the ideal corn-ethanol-hydrogen cycle . . . . . . . 94
23 CExC of major non-renewable resources used in the industrial corn-ethanol cycle . . 95
24 First Law summary of the U.S. corn-ethanol production in 2004 . . . . . . . . . . . . 95
25 Second Law summary of the U.S. corn-ethanol production in 2004 . . . . . . . . . . 96
26 Primary energy consumption in steel production from ore . . . . . . . . . . . . . . . 96
27 Primary energy consumption in steel production from scrap . . . . . . . . . . . . . . 96
28 Estimates of primary energy embedded in steel and its constituents . . . . . . . . . . 97
29 Estimates of CExC in steelmaking . . . . . . . . . . . . . . . . . . . . . . . . . . . . 97
List of Figures
1 Starch molecule . . . . . . . . . . . . . . . . . . . . . . . . . . . . . . . . . . . . . . . 6
2 Mean ethanol yield . . . . . . . . . . . . . . . . . . . . . . . . . . . . . . . . . . . . . 7
3 History of energy efficiency of ammonia production . . . . . . . . . . . . . . . . . . . 8
4 Seven largest ammonia plants in the U.S. . . . . . . . . . . . . . . . . . . . . . . . . 9
5 Various estimates of the unit energy consumption to produce ammonium nitrate . . 10
6 The overall fertilizer application rates . . . . . . . . . . . . . . . . . . . . . . . . . . 12
7 The overall application rates of herbicides and insecticides . . . . . . . . . . . . . . . 13
8 The overall fossil fuel volumes used in corn farming . . . . . . . . . . . . . . . . . . . 14
9 By-state and average use of methane in corn farming . . . . . . . . . . . . . . . . . . 14
10 By-state and average use of electricity in corn farming . . . . . . . . . . . . . . . . . 15
11 Energy use in labor . . . . . . . . . . . . . . . . . . . . . . . . . . . . . . . . . . . . . 16
12 Specific energy use in transport related to corn farming . . . . . . . . . . . . . . . . 17
13 Major fossil energy inputs into corn farming . . . . . . . . . . . . . . . . . . . . . . . 18
14 Solar energy dominates all other energy inputs to corn farming . . . . . . . . . . . . 20
15 soil nutrient losses with corn grain and stover removal . . . . . . . . . . . . . . . . . 21
16 Mass balance of dry corn and efficiency of ethanol production . . . . . . . . . . . . . 23
17 Average wet and dry corn yields . . . . . . . . . . . . . . . . . . . . . . . . . . . . . 23
18 Average fossil energy inputs to ethanol production in a wet milling plant . . . . . . 24
19 The overall energy balance of ethanol production . . . . . . . . . . . . . . . . . . . . 26
20 Fossil energy gain/loss in corn ethanol production . . . . . . . . . . . . . . . . . . . 27
21 Net energy yield in corn production . . . . . . . . . . . . . . . . . . . . . . . . . . . 27
22 The boundary, process, and environment . . . . . . . . . . . . . . . . . . . . . . . . . 29
23 The Second Law efficiency of copper production . . . . . . . . . . . . . . . . . . . . . 32
24 The 2001 per capita energy consumption in the world . . . . . . . . . . . . . . . . . 33
25 The 1990 per capita water consumption in the world . . . . . . . . . . . . . . . . . . 33
26 The 1999 per capita carbon emissions in the world . . . . . . . . . . . . . . . . . . . 34
27 August 14, 2003, power blackout in New York . . . . . . . . . . . . . . . . . . . . . . 35
28 A linear process in industry . . . . . . . . . . . . . . . . . . . . . . . . . . . . . . . . 36
29 A linear process in industrial agriculture . . . . . . . . . . . . . . . . . . . . . . . . . 37
30 Energy and mass flow in an ecosystem . . . . . . . . . . . . . . . . . . . . . . . . . . 38
31 Thermodynamic cycles . . . . . . . . . . . . . . . . . . . . . . . . . . . . . . . . . . . 38
32 Exergy balance in an isothermal, ideal flow machine . . . . . . . . . . . . . . . . . . 42
33 Exergy balance in ideal and real nonisothermal industrial process . . . . . . . . . . . 43

CRPS, 23(6), 2004 T. W. PATZEK v
34 The ideal corn-ethanol cycle . . . . . . . . . . . . . . . . . . . . . . . . . . . . . . . . 4435 Average U.S. corn yield from 1866 to 1939 . . . . . . . . . . . . . . . . . . . . . . . . 4536 The industrial corn-ethanol cycle . . . . . . . . . . . . . . . . . . . . . . . . . . . . . 4637 The carbon cycle . . . . . . . . . . . . . . . . . . . . . . . . . . . . . . . . . . . . . . 4738 Specific CO2 emissions in the industrial corn-ethanol cycle . . . . . . . . . . . . . . . 4839 Total CO2 emissions in the industrial corn-ethanol cycle . . . . . . . . . . . . . . . . 4940 The water cycle . . . . . . . . . . . . . . . . . . . . . . . . . . . . . . . . . . . . . . . 5041 Exergy flow the ideal CO2-Glucose-EtOH cycle . . . . . . . . . . . . . . . . . . . . . 5242 Exergy flow the ideal CO2-Glucose-EtOH-H2 cycle . . . . . . . . . . . . . . . . . . . 5443 Some of the useful work from the industrial corn-ethanol cycle is diverted to “undo”
mining of the environment by this cycle . . . . . . . . . . . . . . . . . . . . . . . . . 5544 CExC by the industrial corn-ethanol cycle. . . . . . . . . . . . . . . . . . . . . . . . 5645 The minimum cumulative exergy consumption by the industrial corn-ethanol cycle
and its maximum useful work . . . . . . . . . . . . . . . . . . . . . . . . . . . . . . . 5746 Societal costs of ethanol production in the U.S. . . . . . . . . . . . . . . . . . . . . . 6147 The cumulative one-hour exceedances of maximum legal ozone level in Southern
California . . . . . . . . . . . . . . . . . . . . . . . . . . . . . . . . . . . . . . . . . . 6248 Electricity obtained from solar cells and ethanol powered fuel cells . . . . . . . . . . 76


CRPS, 23(6), 2004 T. W. PATZEK 1
Abstract
In this paper I define sustainability, sustainable cyclic processes, and quantify the degree ofnon-renewability of a major biofuel: ethanol produced from industrially-grown corn.
First, I demonstrate that more fossil energy is used to produce ethanol from corn than theethanol’s calorific value. Analysis of the carbon cycle shows that all leftovers from ethanolproduction must be returned back to the fields to limit the irreversible mining of soil humus.Thus, production of ethanol from whole plants is unsustainable. In 2004, ethanol productionfrom corn will generate 11 million tonnes of incremental CO2, over and above the amount ofCO2 generated by burning gasoline with 115% of the calorific value of this ethanol.
Second, I calculate the cumulative exergy (available free energy) consumed in corn farmingand ethanol production, and estimate the minimum amount of work necessary to restore the keynon-renewable resources consumed by the industrial corn-ethanol cycle. This amount of workis compared with the maximum useful work obtained from the industrial corn-ethanol cycle. Itappears that if the corn ethanol exergy is used to power a car engine, the minimum restorationwork is about 7 times the maximum useful work from the cycle. This ratio drops down to 2.4,if an ideal (but nonexistent) fuel cell is used to process the ethanol.
Third, I estimate the U.S. taxpayer subsidies of the industrial corn-ethanol cycle at $3.3billion in 2004. The parallel subsidies by the environment are estimated at $1.9 billion in 2004.The latter estimate will increase manifold when the restoration costs of aquifers, streams andrivers, and the Gulf of Mexico are also included.
Finally, I estimate that (per year and unit area) the inefficient solar cells produce ∼100times more electricity than corn ethanol. We need to rely more on sunlight, the only source ofrenewable energy on the earth.
KEY WORDS: biofuel, ethanol, fossil fuels, corn, sustainability, thermodynamics, energy, en-tropy, exergy, solar
Nullis in verba (Take nobody’s word)The motto of the Royal Society of London, 1662
1 Introduction
In the Preface to What is Life? – one of the great science classics of all times – Erwin Schrodinger
(1967) observed: “A scientist is supposed to have a complete and thorough knowledge, at first hand,of some subjects and, therefore, is usually expected not to write on any topic of which he is not amaster. This is regarded as a matter of noblesse oblige.”
The principle of non-interference with the far-away fields of science often precludes the scientistsfrom seeking to explain the universal aspects of science, which are of paramount importance tothe society at large. For example, the sophisticated technological models of biofuel production,e.g., Hemelinck (2004), cannot be formulated alone, without welding them first to a detailedanalysis of the possibilities of depleting the environment in the long-term and destroying the valu-able ecosystems1. This example is not merely of academic interest. A United Nations Bioenergy
Primer (Kartha and Larson, 2000) states: “In the most biomass-intensive scenario, [modernized]biomass energy contributes...by 2050...about one half of total energy demand in developing coun-tries. . . . The IPCC’s2 biomass intensive future energy supply scenario includes 385 million hectaresof biomass energy plantations globally in 2050 (equivalent to about one quarter of current plantedagricultural area), with three quarters of this area established in developing countries.” The magic
1For a definition, see Footnote 33.2Intergovernmental Panel on Climate Change.

2 Thermodynamics of corn-ethanol biofuel. . . Web Version
word “sustainable” appears 130 times in this Primer, without ever being defined3. What will hap-pen if the developing countries entrust their fragile ecosystems and societies to a fundamentallyflawed, unsustainable energy supply scheme? What if the distributed generation of solar power isa significantly better alternative to biofuels?
So here I renounce the noblesse and embark on a synthesis of facts and theories related to theproduction of a common biofuel, ethanol from corn, albeit with second-hand knowledge of some ofthese facts – and at a risk of making a fool of myself. I hope that some or most of this paper will beread by the concerned farmers, engineers, environmentalists, and policymakers. In particular I wishto reach the fellow scientists, who – for most part – remain blissfully unaware of the astronomicalreal problems with supplying energy to over 6 billion people, but who often vigorously analyze theperipheral issues (which in addition are tackled in isolation and out of context).
Most traditional biofuels, such as ethanol from corn, wheat, or sugar beets, and biodiesel fromoil seeds, are produced from classic agricultural food crops that require high-quality agriculturalland for growth. A significant portion of the sunlight these crops capture is diverted to produceseeds and store sugar, and their growing seasons are short. The net energy yield of corn4, ∼100-130GJ/ha-crop (Part I of this paper), is significantly lower that those5 of perennial crops and grasses(200-300 GJ/ha-crop), and sugarcane (∼400 GJ/ha-crop) (Rogner, 2000). Also, the environmentalcosts of annual crops are very high: they cause more soil erosion (up to 100-fold), require 7-10times more pesticides, and more fertilizers than perennial grasses or wood (Berndes et al., 2003).Finally, industrial manufacturing of hybrid seeds is very energy-intensive.
In this paper, I will describe in some detail the unfavorable thermodynamics of the industrialproduction of ethanol from one particular food crop, corn. I will use the Second Law of thermo-dynamics to track what is happening to us (or, is it U.S.?) as mere years pass, and the preciousresources the sun and the earth have been making and storing for millions of years are beingsquandered in front of our eyes.
1.1 Corn Highlights
The U.S. is the single largest corn producer in the world. Large overproduction of subsidized cheapcorn forces corn producers and processors to invent new ingenious uses for their product6. In termsof their large negative impact on the society and the environment, two corn products – ethanol andhigh-fructose syrup – stand out (Pollan, 2002; Elliott et al., 2002). About 13% of the U.S. cornproduction is now diverted to produce ethanol. Hence, in this paper I will de facto argue that theU.S. corn production should be reduced by at least 13% with significant benefits to the taxpayersand the planet. A telegraphic description of the U.S. corn farming and processing is as follows:
• Corn is the single largest U.S. crop (a record 300 million tonnes of moist corn grain in 2004).
• Corn is harvested from ∼30 million hectares, roughly the area of Poland or Arizona, and abit less than 1/4 of all harvested cropland in the U.S.
• The recent average yield7 of moist corn grain has been ∼8600 kg/ha (and a record 10100kg/ha in 2004).
3The endlessly repeated harvest of whole plants that grow on the same soil would have to be sustainable.4The energy of dry corn grain minus the fossil energy inputs per hectare and per crop.5The reported net energy yields of perennial grasses, sugarcane, etc., seem somewhat high to me.6“Ethanol production makes huge amounts of the nation’s corn disappear – some 1.4 billion bushels went into
ethanol production in 2004 – and that affects overall corn supply and helps shore up corn prices nationwide.” NationalCorn Growers Association, http://www.ncga.com/ethanol/main/economics.htm, accessed July 2, 2005.
7Source: USDA NASS database: www.usda.gov/nass/

CRPS, 23(6), 2004 T. W. PATZEK 3
• 42% of world’s 708 million tonnes of moist corn grain8 in 2004 was produced in U.S.
• All of the U.S. corn fields are fertilized.
• Corn requires more fertilizer than any other major crop; 40% of all nitrogen fertilizer goes tocorn (Frink et al., 1999).
• Corn erodes soil much faster than it can rejuvenate by natural processes.
• Corn needs ∼100 cm water, 15% of corn is irrigated.
• Between 1995 and 2003, USDA distributed $37.4 billions, or ∼$2 – $7 billions per year, in corncrop subsidies. Recipients of payments made through most cooperatives, and the amounts,have not been made public9.
• From 1995 to 2003, the top 10 percent of corn subsidy recipients were paid 68 percent ofall corn subsidies. The mean payments were $465 172 each for the top first percent, and$176 415 each for the top tenth percent of recipients. The bottom 80% of farmers receivedmean payments of $4763 each.
• Over 12 billion liters of corn ethanol was produced in the U.S. in 2004.
• U.S. goal: Produce 20 billion liters of ethanol from corn annually.
• Ethanol producers receive ∼$3 billion annually from the federal government and state gov-ernments, and extract ∼$2 billion from the environment.
1.2 Energy Inputs to Corn Production
Fossil energy is essential to industrial agriculture. The following are the major energy inputs toindustrial corn farming:
• Nitrogen fertilizers (all fossil energy)
• Phosphate, potash, and lime (mostly fossil energy)
• Herbicides and insecticides (all fossil energy)
• Fossil fuels: diesel, gasoline, liquified petroleum gas (LPG), and natural gas (NG)
• Electricity (almost all fossil energy)
• Transportation (all fossil energy)
• Corn seeds and irrigation (mostly fossil energy)
• Infrastructure (mostly fossil energy)
• Labor (mostly fossil energy)
Corn produced at a large expense of fossil energy is then transformed, with even more fossilenergy, into pure ethanol.
8Source: 2004 world production of corn: www.cbot.com/cbot/pub/static/files/c−
wprod.gif.9Source: Farm Subsidy Database, http://www.ewg.org/farm, accessed July 2, 2005
4 Thermodynamics of corn-ethanol biofuel. . . Web Version
1.3 Layout
This paper is divided into five parts, each of which can be read more-less independently. InPart I, I discuss the mass balance of corn processing, and the energy and mass balances of cornfarming and ethanol production. Any First Law analysis of the corn-ethanol production process isfundamentally incomplete, and gives rise to confusion and arguments, which become moot once amore complete Second Law analysis is performed. Therefore, in Part II, I overview the fundamentalsof thermodynamics, define the linear processes and cycles, irreversibility and sustainability, as wellas exergy (the free energy available relative to the environmental conditions). In Part III, I applythe concepts developed in Part II to the industrial corn-ethanol cycle and answer the followingquestions:
1. Is ethanol production from corn a sustainable process?
2. If it is not sustainable, how unsustainable is it?
3. Can process changes result in making ethanol production from corn sustainable?
In particular, in Part III, I discuss the Carbon Cycle, the Water Cycle, the Ideal and Indus-trial Corn-Ethanol Cycles, and calculate the minimum work required to restore the nonrenewableresources consumed to produce corn ethanol. In Part IV, I estimate the various subsidies lavishedon the transnational agribusiness corporations by the U.S. federal and local governments, and thehuge subsidy extracted by these corporations from the U.S. environment: the rural population, soil,groundwater, rivers, the Gulf of Mexico, air, plants, and wildlife. Part V lists all major conclusionsfrom this work.
Through my analysis, I hope to put to rest the sweeping statements made by some scientists,such as the following (Deluga et al., 2004):
Fast and efficient fuel reforming is one of the critical steps in producing H2 forfuel cells and the “hydrogen economy,” and ethanol is now the most available andeconomically renewable fuel.. . .
. . . Recent studies indicate that the energy in the fuel-ethanol is at least 1.34 timesthe energy used in its production.

CRPS, 23(6), 2004 T. W. PATZEK 5
Part I
Mass & Energy Balance
1 Introduction
Here, I revisit the classical story of ethanol from corn: the cumulative mass and energy balanceof corn farming and subsequent ethanol production. There have been several well-known prede-cessors who told their versions of this story before. Professor David Pimentel of Cornell is theworld-famous agricultural expert from Cornell University, author of the CRC Handbook of En-
ergy Utilization in Agriculture (Pimentel, 1990), the book Food, Energy, and Society (Pimentel,1996), and dozens of publications on the subjects of ethics and energy efficiency of agriculture,e.g., (Pimentel et al., 1988; Pimentel and Dazhong, 1990; Pimentel, 1991; Pimentel et al., 1994;Pimentel, 2001). Here I will use only his most recent analysis of production of corn-ethanol (Pi-mentel, 2003). Doctor Michael Wang, Christopher Saricks, and May Wu are the authors ofthe 1997 Argonne National Laboratory Report, Fuel-Cycle Fossil Energy Use and Greenhouse Gas
Emissions of Fuel Ethanol Produced from the U.S. Midwestern Corn (Wang et al., 1997), which toldquite a different version of the corn-ethanol story. Doctor Hosein Shapouri, James Duffield,and Michael Wang co-wrote the most recent 2002 USDA Report: The Energy Balance of Corn
Ethanol: An Update (Shapouri et al., 2002a), which was less rosy than the Argonne Report, butconsiderably more optimistic than Professor Pimentel’s analysis. I joined the corn-ethanol storyin late 2002, after reading the thought-provoking book, Food, Energy, and Society by Pimentel.Subsequently, in Spring 2003, I decided to teach a Freshman Seminar at Cal on the subject of cornethanol, and published with the students our own version of the story, Ethanol from Corn: Clean
Renewable Fuel for the Future, or Drain on Our Resources and Pockets? (?), highly critical of theArgonne Report, and also critical of the 2002 USDA Report.
The new twist in my current story is the consistent split of all energy flows into the specificenergies in MJ/kg, and the mass fluxes in kg/ha-crop10. This split will make my explanationsclearer, and the remaining errors easier to spot and correct. However nicely told, the classicalethanol-from-corn story is fundamentally incomplete and should be treated as Part I of the Ethanol
Biofuel Trilogy. Parts II and III of this Trilogy must be told in the somewhat exotic language ofthe Second Law of thermodynamics, which describes the passage of Time and limits the possibledirections of natural and industrial processes.
2 Mass Balance of Corn
Mass will be usually expressed in kilograms per hectare. One hectare is 10000 m2 or 2.47 acres.It is safe to assume that the average corn yield in the U.S. has increased 5-fold over the last 70
years (NASS, 2004b). For example, in Indiana (Nielsen, 2002), the average corn yield was ∼3011
bushels per acre in 1930 and 156 bushels per acre in 2001. The steadily improving yield resultedmostly from the increased fertilizer use12 and better corn genetics.
In 2001-2003, corn in the U.S. was harvested from ∼28 × 106 hectares (NASS, 2004a). Theaverage corn yield varied from 130 bushels per acre in 2002, to 138.2 bushels/acre in 2001, and
10The notation kg/ha-crop stresses that the time unit in the average fluxes is the duration of a single crop, e.g.,120 days in the case of corn plants.
11The lowest average yield of corn in the U.S., ∼18.2 bushels/acre, was recorded in 1901 and 1934, USDA, http://-usda.mannlib.cornell.edu/data-sets/crops/96120/trackrec2003.txt.
12Between 1960 and 2000, the use of nitrogen fertilizer increased 5-fold (USDA-NASS database).
6 Thermodynamics of corn-ethanol biofuel. . . Web Version
142.2 bushels/acre in 2003. (NASS, 2004a).
Definition 1 One equivalent bushel is defined as 56 pounds (25.4 kg) of corn grain that contains15 percent of moisture by weight (Bender and Hill, 1997). 2
Therefore, the mean corn yield over the last 3 years was just below 8600 kg/ha of moist corngrain, or 8600 × 0.85 = 7300 kg/ha of dry corn grain.
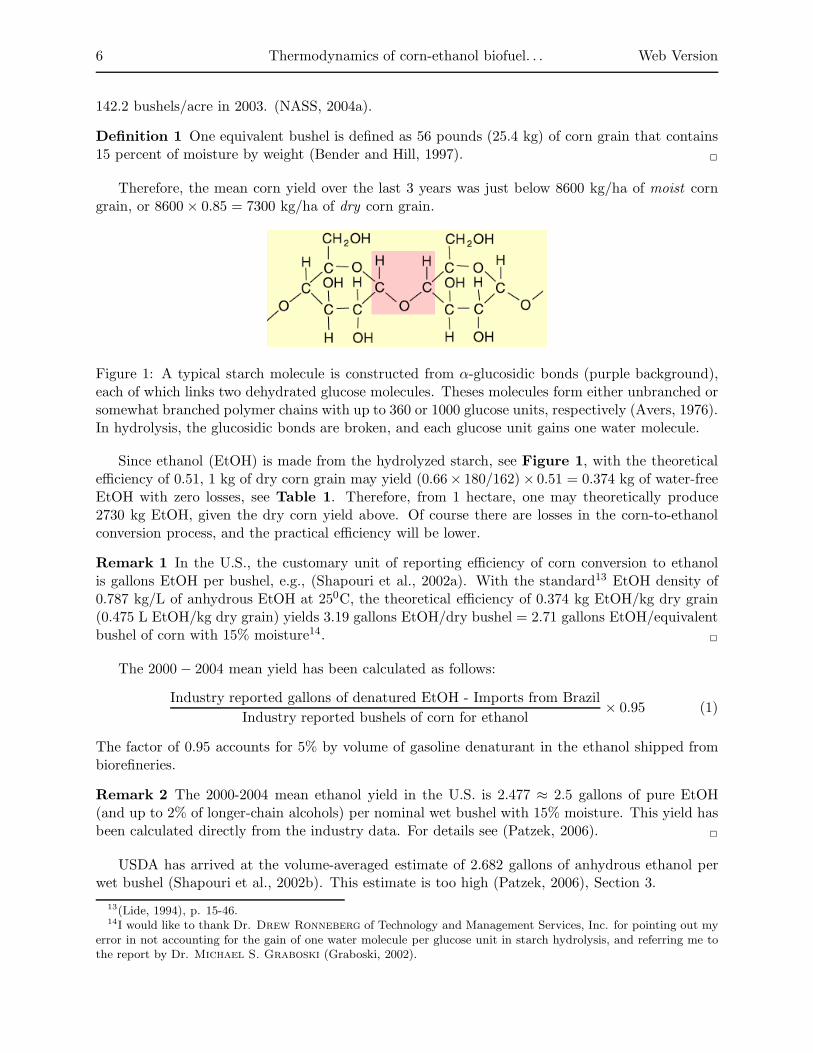
Figure 1: A typical starch molecule is constructed from α-glucosidic bonds (purple background),each of which links two dehydrated glucose molecules. Theses molecules form either unbranched orsomewhat branched polymer chains with up to 360 or 1000 glucose units, respectively (Avers, 1976).In hydrolysis, the glucosidic bonds are broken, and each glucose unit gains one water molecule.
Since ethanol (EtOH) is made from the hydrolyzed starch, see Figure 1, with the theoreticalefficiency of 0.51, 1 kg of dry corn grain may yield (0.66× 180/162) × 0.51 = 0.374 kg of water-freeEtOH with zero losses, see Table 1. Therefore, from 1 hectare, one may theoretically produce2730 kg EtOH, given the dry corn yield above. Of course there are losses in the corn-to-ethanolconversion process, and the practical efficiency will be lower.
Remark 1 In the U.S., the customary unit of reporting efficiency of corn conversion to ethanolis gallons EtOH per bushel, e.g., (Shapouri et al., 2002a). With the standard13 EtOH density of0.787 kg/L of anhydrous EtOH at 250C, the theoretical efficiency of 0.374 kg EtOH/kg dry grain(0.475 L EtOH/kg dry grain) yields 3.19 gallons EtOH/dry bushel = 2.71 gallons EtOH/equivalentbushel of corn with 15% moisture14. 2
The 2000 − 2004 mean yield has been calculated as follows:
Industry reported gallons of denatured EtOH - Imports from Brazil
Industry reported bushels of corn for ethanol× 0.95 (1)
The factor of 0.95 accounts for 5% by volume of gasoline denaturant in the ethanol shipped frombiorefineries.
Remark 2 The 2000-2004 mean ethanol yield in the U.S. is 2.477 ≈ 2.5 gallons of pure EtOH(and up to 2% of longer-chain alcohols) per nominal wet bushel with 15% moisture. This yield hasbeen calculated directly from the industry data. For details see (Patzek, 2006). 2
USDA has arrived at the volume-averaged estimate of 2.682 gallons of anhydrous ethanol perwet bushel (Shapouri et al., 2002b). This estimate is too high (Patzek, 2006), Section 3.
13(Lide, 1994), p. 15-46.14I would like to thank Dr. Drew Ronneberg of Technology and Management Services, Inc. for pointing out my
error in not accounting for the gain of one water molecule per glucose unit in starch hydrolysis, and referring me tothe report by Dr. Michael S. Graboski (Graboski, 2002).

CRPS, 23(6), 2004 T. W. PATZEK 7
2000 2001 2002 2003 2004 20052.4
2.5
2.6
2.7
2.8
EtO
H y
ield
, gal
lon/
wet
bus
hel
Industry−reported yieldsSubtract Brazil importsSubtract 5% gasolineMean = 2.48 gal/buUSDA estimate
Figure 2: The mean of industry-reported ethanol yields. Source: (Patzek, 2006), Section 3.3.
3 Major Energy Inputs to Corn Production
Most energy inputs will be expressed in MJ/kg of active ingredient in the input. For example,ammonia contains 82% nitrogen (active component); therefore, the specific energy input in MJ toobtain one kg of ammonia will be divided by 0.82.
3.1 Field Chemicals
• Nitrogen is a component of many important structural, genetic and metabolic compoundsin plant cells. It is a major component of chlorophyll, amino acids, cell energy carriers(ATP/ADP), and genetic material (DNA/RNA).
• Phosphorus is one of the primary structural components of cell membranes. It is involvedin the photosynthesis (ADP/ATP), synthesis of proteins and vitamins, and it occurs in im-portant enzymes.
• Potassium activates enzymes that produce proteins and sugars. It maintains water contentand, hence, the turgor (rigidity) of plant cells.
• Calcinated lime is used to increase the pH of soil acidified by nitrogen fertilizer. The idealpH for corn is 6.6.
• Herbicides, such as Atrazine, Acetochlor, S-Metolachlor, Dicamba, Nicosulfuron, etc. areused to protect corn from weeds.
• Insecticides, such as Chlorpyrifos, Terbufos, Carbofuran, Tefluthrin, etc. are used to protectcorn from insects.
The average application rates of major field chemicals used in corn farming are reported inTable 2.

8 Thermodynamics of corn-ethanol biofuel. . . Web Version
3.1.1 Specific Energy Requirements for Nitrogen Fertilizer
1945 1950 1955 1960 1965 1970 1975 1980 1985 1990 199530
35
40
45
50
55
Year
MJ/kg
Nin
NH
3
Figure 3: History of energy efficiency of ammonia production in MJ/kg N. Source: G. Kongshaug
(1998).
Nitrogen fertilizers are derived from ammonia, nitric acid, and carbon dioxide. Practically allammonia is produced from natural gas and nitrogen in the Haber-Bosch process (Worrell et al.,1994; Kongshaug, 1998; Worrell et al., 2000). The energy efficiency of the Haber-Bosch processhas been improved by 1/3 over the last 60 years, see Figure 3. Therefore, the age of the ammonia-producing plant does matter. Ernst Worrell et al. (2000) have compiled the ages and outputsof the 44 largest U.S. ammonia plants, see Figure 4. Most of these plants were built in the 1960’s,and some were later modernized and expanded. The fact is that the major U.S. plants were built40 years ago, and some were revamped 20-30 years ago. Another example comes from Europe:In 1995, ammonia synthesis in modern European plants consumed approx. 36.93 MJ/kg N, whileolder plants needed about 43.08 MJ/kg N (Biermann et al., 1999).
Remark 3 For nitrogen fertilizer production, I will use the average efficiency of 30-year old plants.I will also assume that all nitrogen fertilizer applied to the U.S. corn fields is represented byammonium nitrate. 2
Kongshaug (1998) analyzed energy efficiency of ammonia production and divided ammoniaplants into three classes: “Modern,” “Average European plants,” and ”30-years old plants.” Usinghis terminology, the major nitrogen fertilizers are produced with the following specific energy inputsper unit mass of nitrogen in them.
Ammonia, NH3, has 82% of nitrogen by mass. Following Kongshaug (1998), I will assume thefollowing net energy consumption to produce ammonia:
30 Years Old 47 MJ/kg NAverage Europe 39 MJ/kg N
Modern 34.5 MJ/kg N(2)
CRPS, 23(6), 2004 T. W. PATZEK 9
0 0.5 1 1.5 2
1966?/1971
1965?
1966?
1975/1986
1966?/1977
1968/1977
1966
Mt of Ammonia/Year
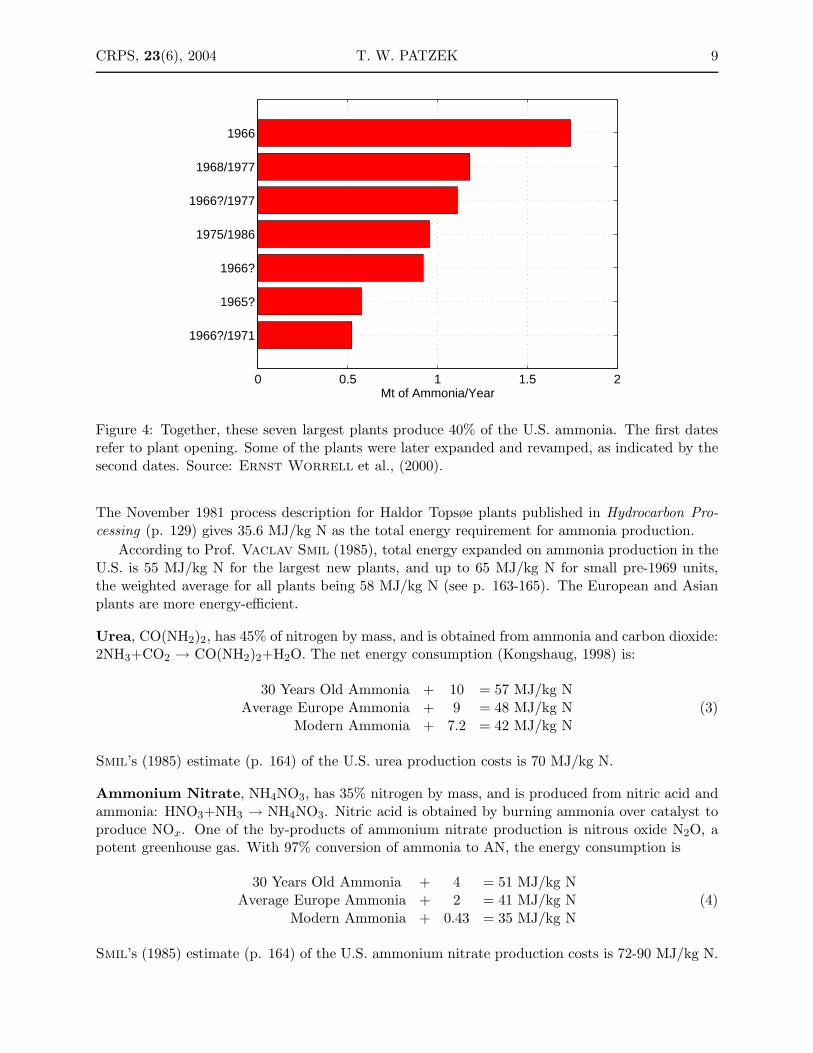
Figure 4: Together, these seven largest plants produce 40% of the U.S. ammonia. The first datesrefer to plant opening. Some of the plants were later expanded and revamped, as indicated by thesecond dates. Source: Ernst Worrell et al., (2000).
The November 1981 process description for Haldor Topsøe plants published in Hydrocarbon Pro-cessing (p. 129) gives 35.6 MJ/kg N as the total energy requirement for ammonia production.
According to Prof. Vaclav Smil (1985), total energy expanded on ammonia production in theU.S. is 55 MJ/kg N for the largest new plants, and up to 65 MJ/kg N for small pre-1969 units,the weighted average for all plants being 58 MJ/kg N (see p. 163-165). The European and Asianplants are more energy-efficient.
Urea, CO(NH2)2, has 45% of nitrogen by mass, and is obtained from ammonia and carbon dioxide:2NH3+CO2 → CO(NH2)2+H2O. The net energy consumption (Kongshaug, 1998) is:
30 Years Old Ammonia + 10 = 57 MJ/kg NAverage Europe Ammonia + 9 = 48 MJ/kg N
Modern Ammonia + 7.2 = 42 MJ/kg N(3)
Smil’s (1985) estimate (p. 164) of the U.S. urea production costs is 70 MJ/kg N.
Ammonium Nitrate, NH4NO3, has 35% nitrogen by mass, and is produced from nitric acid andammonia: HNO3+NH3 → NH4NO3. Nitric acid is obtained by burning ammonia over catalyst toproduce NOx. One of the by-products of ammonium nitrate production is nitrous oxide N2O, apotent greenhouse gas. With 97% conversion of ammonia to AN, the energy consumption is
30 Years Old Ammonia + 4 = 51 MJ/kg NAverage Europe Ammonia + 2 = 41 MJ/kg N
Modern Ammonia + 0.43 = 35 MJ/kg N(4)
Smil’s (1985) estimate (p. 164) of the U.S. ammonium nitrate production costs is 72-90 MJ/kg N.
10 Thermodynamics of corn-ethanol biofuel. . . Web Version
0 10 20 30 40 50 60 70
Shapouri et al., 2002
Wang et al., 1997
Patzek, 2004
Pimentel, 2003
45−Year−Old AN
30−Year−Old AN
Average EU AN
Modern AN
MJ/kg N
ProductionGranulationOther
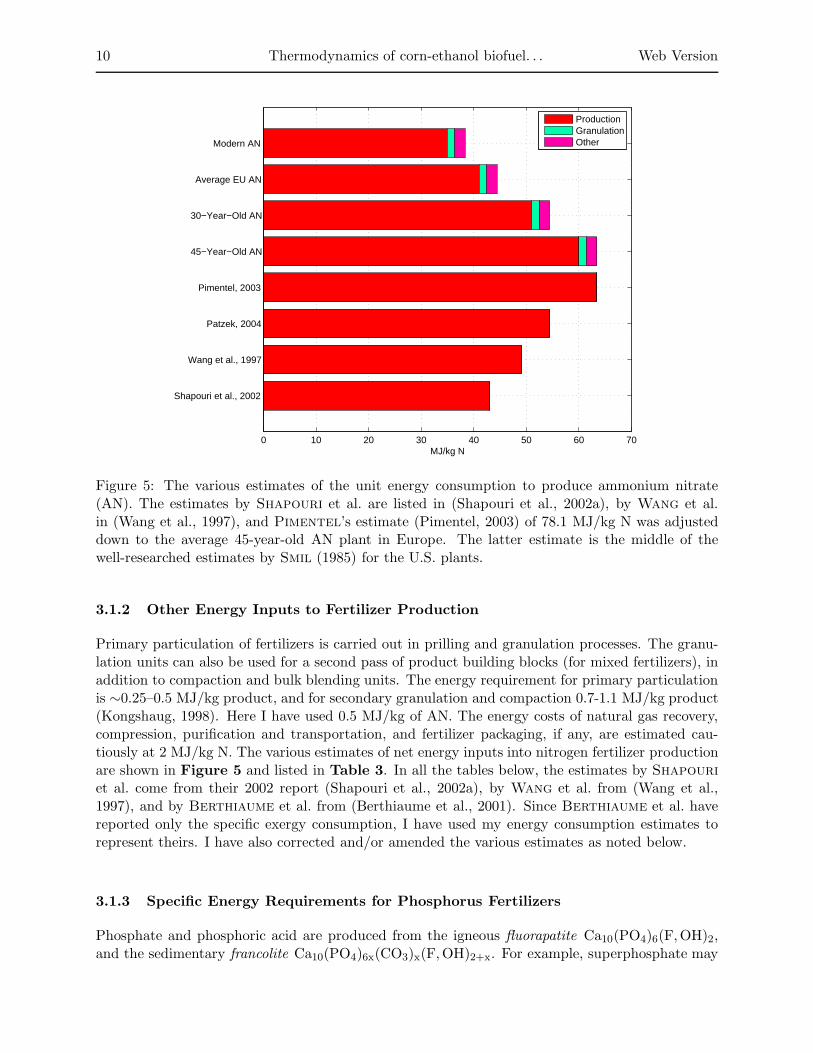
Figure 5: The various estimates of the unit energy consumption to produce ammonium nitrate(AN). The estimates by Shapouri et al. are listed in (Shapouri et al., 2002a), by Wang et al.in (Wang et al., 1997), and Pimentel’s estimate (Pimentel, 2003) of 78.1 MJ/kg N was adjusteddown to the average 45-year-old AN plant in Europe. The latter estimate is the middle of thewell-researched estimates by Smil (1985) for the U.S. plants.
3.1.2 Other Energy Inputs to Fertilizer Production
Primary particulation of fertilizers is carried out in prilling and granulation processes. The granu-lation units can also be used for a second pass of product building blocks (for mixed fertilizers), inaddition to compaction and bulk blending units. The energy requirement for primary particulationis ∼0.25–0.5 MJ/kg product, and for secondary granulation and compaction 0.7-1.1 MJ/kg product(Kongshaug, 1998). Here I have used 0.5 MJ/kg of AN. The energy costs of natural gas recovery,compression, purification and transportation, and fertilizer packaging, if any, are estimated cau-tiously at 2 MJ/kg N. The various estimates of net energy inputs into nitrogen fertilizer productionare shown in Figure 5 and listed in Table 3. In all the tables below, the estimates by Shapouri
et al. come from their 2002 report (Shapouri et al., 2002a), by Wang et al. from (Wang et al.,1997), and by Berthiaume et al. from (Berthiaume et al., 2001). Since Berthiaume et al. havereported only the specific exergy consumption, I have used my energy consumption estimates torepresent theirs. I have also corrected and/or amended the various estimates as noted below.
3.1.3 Specific Energy Requirements for Phosphorus Fertilizers
Phosphate and phosphoric acid are produced from the igneous fluorapatite Ca10(PO4)6(F,OH)2,and the sedimentary francolite Ca10(PO4)6x(CO3)x(F,OH)2+x. For example, superphosphate may

CRPS, 23(6), 2004 T. W. PATZEK 11
be produced as follows:
2Ca3(PO4)2 + 6H2SO4 → 4H3PO4 + 6CaSO4
Ca3(PO4)2 + 4H3PO4 → 3Ca(H2PO4)2︸ ︷︷ ︸
superphosphate
(5)
Calcium sulphate (gypsum) produced in reaction (5)1 may be precipitated as a dihydrate, usingmilder conditions, 26-32% P2O5 at 70-800C, or a hemihydrate, using 40-52% P2O5 at 90-1100C.Even though it demands more energy, the hemihydrate reaction is preferred because it optimizesuse of sulfuric acid. The energy costs of gypsum disposal are omitted here.
Unlike the European Fertilizer Manufacturers Association (EFMA), which maintains an infor-mative web site, the U.S. does not have clear statistics on the types of phosphorus (and other)fertilizers used. From the USGS and U.S. Census Bureau documents, e.g., (Jasinski, 2002) andreferences therein, it may be deduced that calcium phosphates (triple superphosphate and singlesuperphosphate) dominate in the U.S., followed by Di-Ammonium Phosphate (DAP).
Just as with nitrogen fertilizers, phosphate fertilizers have different contents of active ingredient,here P2O5. For example, triple superphosphate is 46% P2O5, single superphosphate 18-20%, anddi-ammonium phosphate 46%.
In this analysis, I will use the single superphosphate as the reference phosphorus fertilizer. Thetypical energy consumption for the 30 years old technology is given by Kongshaug (1998), seeTable 4. In contrast to the energy input for nitrogen fertilizer, the data for phosphorus vary widelybetween 5.1 MJ/kg P2O5 and 26.4 MJ/kg P2O5 (Pimentel and Dazhong, 1990). EFMA uses 15.8MJ/kg P2O5 (Biermann et al., 1999).
Using the data in Table 4, the typical U.S. energy consumption is 0.3+6.5 = 6.8 MJ/kg P2O5 assingle superphosphate. The specific energy consumption for phosphorus and its application ratesare listed in Table 5.
3.1.4 Specific Energy Requirements for Potassium Fertilizers
The energy requirements for potassium vary from 4.0 MJ/kg K2O (Mudahar and Hignett, 1982) to13.7 MJ/kg K2O (Patyk and Reinhardt, 1997). EFMA uses 9.3 MJ/kg K2O (Biermann et al., 1999).The typical energy requirements to produce different potassium fertilizers are listed in Table 6.Here I will use the muriate of potash (MOP), or KCl, as the typical potassium fertilizer. Productionof KCl is mainly carried out by shaft mining and beneficiation. The most energy efficient potashprocesses, based on a high quality sylvanite salt, require only 1.5 MJ/kg MOP (2.5 MJ/kg K2O).The energy consumption, however, varies a lot, and estimates up to 6 MJ/kg MOP are reportedfor mining of more mixed salts (Kongshaug, 1998).
Here I will treat KCl as an admixture to a superphosphate fertilizer, and give it an identicalenergy consumption of 6.8 MJ/kg K2O. The specific energy inputs and application rates for thepotassium fertilizers are listed in Table 7.
3.1.5 Specific Energy Requirements for Calcinated Lime
Lime must be added to de-acidify soil after heavy use of nitrogen fertilizers. Calcinated lime,CaO, is obtained from limestone and dolomites. The calcination process is energy-intensive, andgenerates one mole of CO2 per one mole of CaO. EFMA uses 2.97 MJ/kg CaO (Biermann et al.,1999), but here I will follow the Australian Academy of Sciences and assume that only 1.75 MJ/kgCaO is used to produce calcinated lime.

12 Thermodynamics of corn-ethanol biofuel. . . Web Version
Lime application rate is not commonly reported by the USDA. The suggested application rateis 1.8 times the application rate of nitrogen (Tisdale et al., 1985), but there are reports of severaltimes higher application rates, e.g., (Pimentel, 2003).
The total application rates of nitrogen, phosphorus and potash fertilizers, as well as that ofcalcinated lime are shown in Figure 6.
0 100 200 300 400 500 600 700 800 900 1000
Wang et al., 1997
Shapouri et al., 2002
Berthiaume et al., 2001
Patzek, 2004
Pimentel, 2003
NPKCa
kg/ha
Figure 6: The total fertilizer application rates listed in Tables 3, 5, 7, and 8.
3.1.6 Specific Energy Requirements for Herbicides and Insecticides
There are many active ingredients in commercial herbicides and insecticides, but all have very highspecific energy requirements for their production. Here I have used the data collected in Table 5in Shapouri et al.’s report (2002a).
The specific energy inputs and application rates of herbicides and insecticides are listed inTables 9 and 10. The overall application rates of herbicides and insecticides are also shown inFigure 7.
3.2 Specific Energy Requirements for Fossil Fuels
A unit mass of a fossil fuel gives out a specific amount of heat (its calorific value) when burned. TheLow Heating Value (LHV), or Net Calorific Value (NCV), of a fossil fuel assumes that combustionproducts contain the water of combustion as vapor. The heat contained in this water is notrecovered. Outside of power stations and fuel cells, water remains as vapor after combustion. TheHigh Heating Value (HHV), or Gross Calorific Value (GCV), assumes that combustion water isentirely condensed. The heat contained in this water is recovered. Pimentel (2003), Shapouri
et al. (2002a) seem to use HHV for all fuels. Wang et al. (1997) give only the total amount ofenergy for each fossil fuel; therefore, their specific values are back-calculated for each fuel and agreewith my estimates.

CRPS, 23(6), 2004 T. W. PATZEK 13
0 0.5 1 1.5 2 2.5 3 3.5 4 4.5 5
Berthiaume et al., 2001
Pimentel, 2003
Wang et al., 1997
Patzek, 2004
Shapouri et al., 2002
HerbicidesInsecticides
kg/ha
Figure 7: The total herbicide and insecticide application rates listed in Tables 9 and 10.
In prior work, I used the low heating values of fuels in combustion engines to perform the FirstLaw energy balance calculations (Patzek, 2004; Patzek et al., 2005). More recently, however, Iwas swayed by Bossel (2003b) to use the high heating values. The reason is simple: Regardlessof a machine (an internal combustion engine or a fuel cell) we use to burn a fuel, the fuel’s fullenergetic potential could be realized if we improved this machine. In other words, in determiningsustainability, we check what possibly could be done, not what actually is done.
Remark 4 (Use of High Heating Values) From now on, the high heating values of all fuelswill be used to determine whether a technological process is sustainable according to the First andSecond Law of thermodynamics. 2
After deciding on a high heating value for each fossil fuel, one needs to find the standard valuesfor “average” gasoline, diesel fuel, LPG, and natural gas. Finding consensus was more difficult thanI expected. The International Energy Agency’s (IEA) standards up to the year 2000 are publishedin (IEA, 2000). IEA changed its standards for gasoline equivalent and diesel fuel equivalent in 2003.Finally, I decided to use the high heating values measured and compiled by Professor Dietram
Castorph et al. at the Technical University of Munich (Castorph et al., 1999), see Table 11. Forreference, the standard densities of liquid fuels used in this work are: gasoline, 0.74 kg/L; dieselfuel, 0.84 kg/L; LPG, 0.58 kg/L; natural gas, 0.84 kg/sm3, and ethanol 0.79 kg/L.
The calorific values and average volumes of fossil fuels used in corn farming are listed in Tables12 – 15. The cumulative volumes of all fossil fuels are shown in Figure 8.
Notice that not all sources account for all five fossil fuels, especially for LPG and natural gas.Both LPG and natural gas are used for corn drying and as fuel to power water pumps in irrigation.Their uses vary greatly from one state to another, and from one season to another, see Figure 9.

14 Thermodynamics of corn-ethanol biofuel. . . Web Version
0 50 100 150 200 250 300 350
Wang et al., 1997
Pimentel, 2003
Patzek, 2004
Shapouri et al., 2002
Berthiaume et al., 2001
DieselGasolineLPG
Liters/ha
Figure 8: The total fossil fuel volumes listed in Tables 12 - 15.
0 5 10 15 20 25 30 35 40
Pimentel, 2003
Berthiaume et al., 2001
Shapouri et al., 2002
Patzek, 2004
Wang et al., 1997
MN
OH
SD
IA
IL
MI
WI
IN
NE
Standard m3/ha
Figure 9: By-state and average use of methane in corn farming. The 1996 methane volume datafrom the largest corn-producing states are from Shapouri et al. (2002a). Note the large variabilityof methane use depending on wet/dry weather.
3.3 Use of Electricity
The average electric energy spent on farming 1 hectare of corn is listed in Table 16. Shapouri
et al. (2002a) have attempted to include the efficiency of fossil energy conversion into electricity in

CRPS, 23(6), 2004 T. W. PATZEK 15
0 50 100 150 200 250 300 350 400
Wang et al., 1997
Pimentel, 2003
Berthiaume et al., 2001
Patzek, 2004
Shapouri et al., 2002
IL
SD
WI
OH
MI
NE
MN
IN
IA
kWh/ha
Figure 10: By-state and average use of electricity in corn farming. The 1996 electricity data fromthe largest corn-producing states are from Shapouri et al. (2002a). Note the large variability ofelectricity use depending on wet/dry weather.
their estimates. I have not done it here in the energy balance, but will consider all the steps in freeenergy conversion in the exergy balance in Part III. The average and the state data are comparedin Figure 10. As with natural gas, variability in electricity use is very large.
3.4 Averages Can Be Misleading. . .
• Depending on the weather, state-to-state (regional) and year-to-year (temporal) variations inthe use of electricity, liquid petroleum gas, and methane can be extreme.
• Therefore, a single calculation of energy efficiency of corn production for all states and allyears is insufficient for the generalizations readily made from such a calculation. In otherwords, in the same corn growing season, the energy balance of corn ethanol production maybe highly unfavorable in one state, and only somewhat unfavorable in another one.
3.5 Energy in Human Labor
Average labor time is 6.2 hrs/ha per growth season (Pimentel, 2003). I will assume that a physicalworker is on a 4000 kcal/day diet. The specific energy to sustain a worker is then
4 × 10⁶ cal/day × 4.186J
cal×
1
24
1
hr= 0.7
MJ
hr, (6)
and it is negligible.In my estimate, I have used Shapouri et al.’s (2002a) custom labor estimate plus the worker
sustenance energy, see Figure 11.

16 Thermodynamics of corn-ethanol biofuel. . . Web Version
0 200 400 600 800 1000 1200
Berthiaume et al., 2001
Wang et al., 1997
Pimentel, 2003
Shapouri et al., 2002
Patzek, 2004
CustomFood
MJ/ha
Figure 11: Energy use in labor.
3.6 Energy in Corn Seeds
The production of hybrid corn seeds is very energy intensive (Pimentel, 2004a). Two corn genotypesare needed. The pollen from one genotype is used, and the pollen from the other genotype mustbe prevented from pollinating the genotype from which the corn seed will be harvested. Because ofall these manipulations, about 7 times more energy is required to produce hybrid seeds comparedwith the energy in the same mass of corn grain.
The following data have been used to estimate the specific energy requirements for corn seeds:
• The seed rate is 57,000 (Corn Belt) –74,000 (West) seeds per ha (White and Johnson, 2003),p. 255.
• The mean weight of 1000 corn seeds is 0.332 kg (White and Johnson, 2003), p. 202.
• The caloric value of corn grain with 13-15% moisture is 15-16 MJ/kg.
• The production of hybrid corn requires about 104 MJ/kg (Heichel, 2004).
Both Shapouri et al. (2002a), and Wang et al. (1997) ignored the hybrid seed energy, andassigned just the diesel fuel energy for planting the seeds. I have amended their calculations withthe seed energy, based on their reported seed rates, and moved their estimates of diesel fuel use incorn planting to the fuel category.
3.7 Energy in Irrigation
Corn gets water mostly from rainfall, but some irrigation is generally required. In a dry season,the use of irrigation systems may increase substantially, as seen from the electricity use by statereported in Figure 10. I have made the following assumptions to estimate the energy cost of cornirrigation:
CRPS, 23(6), 2004 T. W. PATZEK 17
0 200 400 600 800 1000 1200
Berthiaume et al., 2001
Shapouri et al., 2002
Wang et al., 1997
Patzek, 2004
Pimentel, 2003
MJ/ha
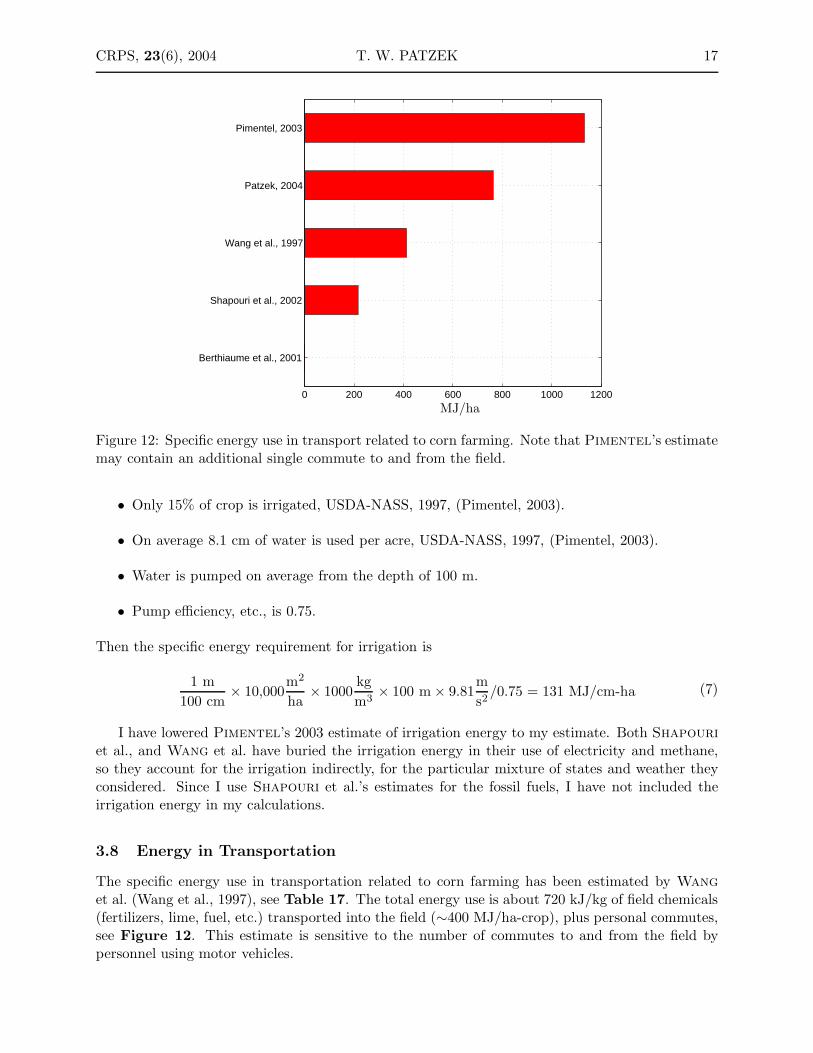
Figure 12: Specific energy use in transport related to corn farming. Note that Pimentel’s estimatemay contain an additional single commute to and from the field.
• Only 15% of crop is irrigated, USDA-NASS, 1997, (Pimentel, 2003).
• On average 8.1 cm of water is used per acre, USDA-NASS, 1997, (Pimentel, 2003).
• Water is pumped on average from the depth of 100 m.
• Pump efficiency, etc., is 0.75.
Then the specific energy requirement for irrigation is
1 m
100 cm× 10,000
m2
ha× 1000
kg
m3× 100 m × 9.81
m
s2/0.75 = 131 MJ/cm-ha (7)
I have lowered Pimentel’s 2003 estimate of irrigation energy to my estimate. Both Shapouri
et al., and Wang et al. have buried the irrigation energy in their use of electricity and methane,so they account for the irrigation indirectly, for the particular mixture of states and weather theyconsidered. Since I use Shapouri et al.’s estimates for the fossil fuels, I have not included theirrigation energy in my calculations.
3.8 Energy in Transportation
The specific energy use in transportation related to corn farming has been estimated by Wang
et al. (Wang et al., 1997), see Table 17. The total energy use is about 720 kJ/kg of field chemicals(fertilizers, lime, fuel, etc.) transported into the field (∼400 MJ/ha-crop), plus personal commutes,see Figure 12. This estimate is sensitive to the number of commutes to and from the field bypersonnel using motor vehicles.

18 Thermodynamics of corn-ethanol biofuel. . . Web Version
3.8.1 Personal Commute
At 6.2 hr/ha/crop of labor, 20 l/100km gasoline use, and a 30 km round trip, the energy cost ofcommuting is
6.2
9
hr/ha/crop
hr work day× 60 km × 20
liter
100km×
1
100× 0.74
kg
liter gasoline× 47
MJ
kg gasoline
= 288 MJ/ha-crop
(8)
Therefore a single commute nearly doubles the overall transportation energy costs. This issueshould be investigated further.
3.9 Machinery & Infrastructure
Industrial agriculture requires heavy machinery (trucks, tractors, ploughs, cranes, railroad cars,airplanes, locomotives, barges, ships, etc.), which must be replaced periodically. Industrial agri-culture also requires an extensive infrastructure with a large environmental footprint (spare parts,machine shops, machine manufacturing factories, access roads, railroad tracks, ports, silos, pumps,driers, electricity generators, air-conditioners, etc.). Industrial corn is the single largest crop in theU.S., and its share of this infrastructure should be highest. The energy inputs as hardware havebeen estimated in Appendix E at 68-168 MJ/kg of operational machinery, close to the 110 MJ/kgestimated by Pimentel (2003). The mass of hardware assigned by Pimentel to corn farming is55 kg/ha. Note that this estimate includes only a tiny part of the huge infrastructure listed above.
Both Shapouri et al. (2002a) and Wang et al. (1997) omit this input altogether, but I havenot amended their calculations.
0 5 10 15 20 25 30 35
Berthiaume et al., 2001
Wang et al., 1997
Shapouri et al., 2002
Patzek, 2004
Pimentel, 2003
GJ/ha
Fossil FuelsIrrigationNitrogenP−K−CaHerbi−/InsecticidesElectricityTransportationRepairs/MaintenanceSeedsMachinery
Figure 13: Major fossil energy inputs into corn farming.
CRPS, 23(6), 2004 T. W. PATZEK 19
3.10 Fossil Energy Inputs into Corn Production
The specific fossil energy requirements in industrial corn farming are shown in Figure 13. A fewcomments are in order.
• The lowered Pimentel’s 2003 estimate of fossil fuel energy plus irrigation is identical withthat of Shapouri et al.
• The lowered Pimentel’s 2003 estimate of nitrogen fertilizer energy is higher than the uncor-rected one by Shapouri et al., which is too low. My estimate is in the middle.
• Pimentel’s 2003 lime application rate is twice those of everyone else’s. It reflects the 1997USDA average.
• Pimentel’s 2003 transportation energy is higher than everyone else’s. It may reflect 1-2more commutes/ha/crop.
• Shapouri and Wang et al. have underestimated the fossil energy in seeds and left out themachinery and infrastructure.
• I have added my seed energy estimate to their inputs, but left the machinery out.
• Berthiaume et al. (2001) have not included several of the energy inputs in corn farming, sotheir estimate is presented here only for comparison.
• The estimates of fossil energy inputs range from 19 GJ/ha (Wang) to 33 GJ/ha (Pimentel).My estimate is 28 GJ/ha.
• Wang et al.’s estimates are consistently too low. Shapouri et al.’s and my estimatesare almost identical. The only significant difference is the inclusion of machinery into myestimates.
• The fossil energy use in corn farming is large and equivalent to 0.4 (Wang et al.) to 0.7(Pimentel) metric tonne of gasoline per hectare and per crop.
• The average energy use in corn farming does not tell the whole story because of the very largevariability of energy use by state, depending on the local weather conditions.
• All estimates, including mine, have had errors and/or omissions at one stage or another. Ihope that by bringing the approaches of all authors into a common framework, most of thedeficiencies of the prior analyses have been eliminated.
3.11 Solar Energy Input into Corn Production
The amount of solar energy that irradiates 1 average hectare of corn field in the U.S. during thegrowth season is gigantic, and it dwarfs all fossil energy inputs and the calorific value of the 8600kg of corn grain harvested from this hectare, see Figure 14. In fact, during the 120-day growthseason, roughly only ∼0.7% of the solar energy is converted by corn plants into biomass (Biermannet al., 1999). In contrast, solar cells can collect sunlight all year long, see Appendix C. On anannual basis, the solar efficiency of corn plants drops by a factor of 3, i.e., only ∼0.2% of the solarenergy is captured by an average corn crop15. In summary, the solar energy does not limit corn
15Two tenth of one percent is 20 parts in 10000 parts of mean insolation. Roughly half of these 20 parts becomescorn grain.

20 Thermodynamics of corn-ethanol biofuel. . . Web Version
0 5 10 15 20 25
Wang et al., 1997
Shapouri et al., 2002
Patzek, 2004
Pimentel, 2003
Solar Energy
Fossil Energy+Corn GrainSolar Energy
TJ/ha-crop
Figure 14: Comparison of the cumulative solar energy input and the fossil+grain energy inputs perhectare and per crop (120 days).
production – soil, water, and the dissolved nutrients do. I will discuss this crucially importantpoint later. Here it suffices to say that if the sun were the limiting factor, the Sahara desert wouldbe the best place to grow corn (Georgescu-Roegen, 1971).
3.12 Soil Humus and Micro-Element Depletion by Corn Production
Because good soil quality sustains farming, one needs to account for the extraction by corn plantsof soil humus and metals.
Definition 2 Humus is the soil component which develops over time by the decomposition oforganic matter. 2
Soil humus is among the principal carbon pools on continents. One hectare of corn produces8600 kg of corn grain, cf. Section 2, and 8600 kg of stalk, leaves and roots (Pimentel, 2004a). Byscaling Michaud’s (1995) results to the average U.S. corn yield, I have estimated that about 2600kg/ha-crop of soil humus is extracted by the corn monoculture grown on tilled soil. Similarly, Ihave calculated that decomposing all 8600 kg of plant parts returns about 2100 kg/ha of humus(4:1 ratio). Therefore, with the full decomposition of plant leftovers, corn depletes ∼500 kg/ha-cropof humus.
The net humus depletion of 500 kg/ha-crop could be replenished by returning to the field 2000kg/ha of corn grain leftovers from ethanol production. Otherwise, industrial corn farming is alsosoil mining, in addition to being crude oil, natural gas, and coal mining. I will come back tothis point when I discuss the energy credits for ethanol production assumed by Wang et al. andShapouri et al..
Based on the information in Troeh & Thompson (1993), Prof. Pimentel (2004b) has calcu-lated that only 1630 kg of humus would be added to the soil from the 8600 kg/ha of corn residues.

CRPS, 23(6), 2004 T. W. PATZEK 21
On the other hand, he points out that with appropriate field practices16 and continuous use ofsynthetic fertilizers, it is possible to keep soil humus at a constant value. The 20-year study ofconventional corn and soybean production system in Rodale, Pennsylvania, following Penn. Staterecommendations, confirms that the soil humus has remained relatively constant at about 1.7% ofsoil carbon over most of the 20 years. At Rodale, the application rate of synthetic nitrogen fertilizerhas been 140 kg/ha; phosphorus and potassium have been applied too17.
Stanley A. Barber (1977) estimated that harvesting about 9000 kg/ha of corn grain removes∼150 kg/ha of N and ∼30 kg/ha of P, see Figure 15. Currently farmers are applying ∼150 kg/haof N and ∼50kg/ha of P. The additional ∼9500 kg/ha of corn stover contains ∼80 kg/ha of N and∼10 kg/ha of P. Back in the 1930’s - 1940’s, with corn yields below 2000 kg/ha, only 10–20 kg/ha ofN was harvested with the grain. However, nitrogen was also being lost by leaching, denitrification,and erosion. With soil erosion rates of 20 to 30 t/ha/yr, from 50 to 90 kg/ha of nitrogen were beinglost by erosion alone. Since then, soil erosion rates in the U.S. corn fields have declined to 10 to 15t/ha/yr. Soil erosion is deadly when it comes to nutrient and water loss (Larson, 1979; Lindstromet al., 1979).
0 50 100 150 200 250
S
P
Ca
Mg
K
N
GrainStover
Nutrient Loss, kg/ha
Figure 15: Soil nutrient losses with corn grain and stover removal. From Barber (1977), scaledto 9 t/ha of grain and 9.75 t/ha of stover.
All corn plant parts, other than the starch in corn grain, should be decomposed and recycled torecover their N, P, K, C, Ca, Mg, Zn, B, Cu, Mn, etc., and diminish the degree of unsustainabilityof corn farming. However, most of the nitrogen and phosphorus and some other nutrients are
16Good field practices might include: (1) Soybean/corn crop rotation to naturally bind nitrogen and limit syntheticfertilizer use; (2) Corn stover decomposition in the field to conserve soil nutrients and limit erosion; and (3) Moderatesoil tilling, or no tilling, to diminish loss of soil carbon and erosion.
17In Part II, I will show that the use of synthetic fertilizers makes farming unsustainable.

22 Thermodynamics of corn-ethanol biofuel. . . Web Version
translocated from vegetative plant parts to the developing grain later in the season. According toFigure 15, a corn crop harvested with no recycling removes more than 1.5 times as much nitrogen,1.6 as much phosphorus, 4 times as much potassium, 13 times as much calcium and 6 times as muchmagnesium as when this crop is harvested for grain. Other estimates are even more unfavorable(Wheaton et al., 1993). Whole plant harvest also removes most of the soil metals essential to thewell-being of corn plants. The need to recycle plant parts and limit soil erosion largely negatesthe now fashionable attempts to produce ethanol from whole corn plants by harvesting everythingfrom the corn field, see e.g., (NREL, 2002; Sheehan et al., 2004). Every ecosystem on the earth ishighly optimized to recycle almost all mass it generates; otherwise life would not persist.
4 Major Energy Inputs to Ethanol Production
Conversion of corn grain into 100% ethanol (EtOH) is a fossil energy-intensive process, which alsogenerates significant gas emissions, as well as liquid and solid waste. Here I will consider onlywet-milling of corn to convert it into glucose, which is subsequently fermented to industrial beer,and distilled to 96% ethanol. The final water removal is achieved in molecular sieves that excludewater, or by distillation with benzene, see Eq. (9). Fermentation is a slightly exothermic catalyticburning of aqueous glucose, in which 49% of its mass is converted to carbon dioxide gas. Themain liquid reaction product, ethanol, retains most of the free energy of the glucose. Dry millingis energetically similar, and need not be considered.
Corn Grain︸ ︷︷ ︸
SteepingGrinding
Germ Separation
→ Starch︸ ︷︷ ︸
GlutenLiquefaction
Saccharification
→ Glucose︸ ︷︷ ︸
FermentationCO2
→ Ethanol︸ ︷︷ ︸
DistillationDehydration
(9)
4.1 Corn Mass Balance Revisited
In Section 2, I calculated the theoretical efficiency of corn conversion into ethanol, in which everystep is 100% efficient. Here, in agreement with the USDA estimate (Shapouri et al., 2002b), Iwill assume that the conversion of corn grain into 100% ethanol incurs 8.5% losses18 by mass, seeFigure 16.
Two important conclusions can be drawn from Figure 16:
1. The average yield of anhydrous ethanol from corn is now 0.435 L EtOH/kg dry corn grain, or2.914 gallons of EtOH per 56 lbs of dry corn grain (“dry bushel”), or 2.477 gallons of EtOHper nominal wet bushel with 15% moisture.
2. The reported field corn yields must be multiplied by 0.85 to convert the harvested corn towater-free or “dry” corn, see Figure 17.
3. In the literature, the USDA estimate of 2.682 gallons EtOH/bushel has been multiplied by themoist corn grain yields; this is incorrect and leads to an overestimation of the corn-ethanolyield by 8% (∼1/4 of the positive fossil energy balance claimed by USDA).
18This 8.5% overall loss lumps the losses in broken corn kernels and foreign matter (nominally 3% by mass forNo. 2 yellow corn), in starch separation and hydrolysis, fermentation, distillation/rectification, and ethanol trans-portation and distribution. The fermentation process has several byproducts: n-propyl, isobutyl, amyl, iso-amyl,1,2,3-propanetriol (glycerol) and higher alcohols; acetic aldehyde and acid; etc., see (White and Johnson, 2003), page710; also see Appendix D for more details. The fermentation selectivity to ethanol can be less than 90%.

CRPS, 23(6), 2004 T. W. PATZEK 23
0 1000 2000 3000 4000 5000 6000 7000 8000
Fermentation
Corn Feed
StarchCorn OilGluten mealGluten feedEthanolCO2Losses
kg/ha
Figure 16: The result of practical corn conversion into ethanol with 8.5% losses is 0.435 L EtOH/kgdry corn grain = 2.48 gal EtOH/wet bushel with 15% moisture. Note that the dry starch is swollenby a factor of 180/162 caused by hydrolysis to glucose.
0 1000 2000 3000 4000 5000 6000 7000 8000 9000
Berthiaume et al., 2001
Shapouri et al., 2002
Wang et al., 1997
Pimentel, 2003
Patzek, 2004
Dry GrainWater
kg/ha
Figure 17: Average wet and dry corn yields.

24 Thermodynamics of corn-ethanol biofuel. . . Web Version
4.2 Transport in Ethanol Refineries
Transport of materials and people in-and-out of an ethanol plant requires energy, and there is somedisagreement between Pimentel and Patzek on one hand, and Shapouri et al. and Wang et al.on the other. Here it suffices to state that
• Corn grain (8600 kg/ha) and fuel (e.g., ∼1200 kg/ha of coal) must be transported in.
• Ethanol (∼2200 kg/ha), gluten meal and feed (∼2600 kg/ha) must be transported out
• Workers must travel in-and-out.
• Both Shapouri et al. and Wang et al. seem to underestimate these transport costs by afactor of 3-4.
0 2 4 6 8 10 12 14 16 18
Wang et al., 1997
Shapouri et al., 2002
Corn Handbook, 2003
Pimentel, 2003
Patzek, 2004
Berthiaume et al., 2001
MJ/Liter of Ethanol
ProcessingTransportCreditsHB Total
Figure 18: The average fossil energy inputs to ethanol production in a wet milling plant. Thelength of each bar is the total energy outlay to produce 1 liter of EtOH, and the blue parts denotethe size of energy credits assumed by the different authors. The modern dry mill plants use 11.36MJ/L as steam and 3.12 MJ/L as electricity, 14.5 MJ/L total, not counting transportation costs.
4.3 Fossil Energy Inputs to Ethanol
Because transportation is but a small fraction of the total energy outlay in ethanol production,there is little disagreement in the various estimates of the total energy used to produce ethanolfrom corn, which are all close to 15 MJ/L EtOH, see Table 18. This is easily seen when the totallengths of the bars in Figure 18 are compared19.
19For comparison, a recent feasibility study for a new ethanol plant (International, 2001) projects 13.08 MJ/LEtOH in methane, and 1.675 MJ/L EtOH in electricity, for the total of 14.8 MJ/L EtOH, excluding transport and

CRPS, 23(6), 2004 T. W. PATZEK 25
4.4 Energy Credits
Major disagreements surface when it comes to energy credits used by the different authors to offsetthe high energy cost of ethanol production. The idea is to somehow use the market or energy valueof gluten meal and gluten feed, see Table 1, both by-products of wet milled corn, to offset the fossilenergy used to produce ethanol. Gluten meal is a more valuable by-product, but it is 4 times lessabundant than gluten feed. The key assumptions made by the different authors are as follows:
• Wang et al. (1997) assume an energy credit of 30% of all energy inputs into ethanol produc-tion.
• Shapouri et al. (2002a) assume an energy credit of 5.9 MJ/L of ethanol, justifying it as thereplacement value of soybean meal with corn gluten feed and meal.
• Pimentel (2003; 2004a), assumes an energy credit of 1.9 MJ/L of ethanol, justifying it asthe replacement value of distiller’s dried grain in dry milling, which is similar in compositionto soybean meal (it contains 30% protein, 8% fat). Pimentel also argues that gluten feed doesnot replace soybean meal; in addition soybean plants fix nitrogen, and corn does not, so thereplacement is really difficult to justify.
• I give ethanol zero energy credit, and want the ethanol refineries to bear the transportationand disposal costs of gluten feed and meal, as well as all other solid and liquid waste fromethanol production. Some of the environmental restoration costs will be included in thediscussion of the carbon and water cycles in ethanol production from corn. In Section 3.12,I have already argued that all of the ethanol processing leftovers should be returned to thefield to replenish soil humus and micro-elements.
4.5 Overall Energy Balance of the Corn-Ethanol Process
With the energy credits or without, ethanol production from corn is a fossil energy losing propo-sition, even if the energy costs of environmental damage are neglected, see Figures 19 and 20.In addition, the net energy20 gained from corn production is small, see Figure 21; several timeslower than those of perennial grasses and sugarcane (Rogner, 2000). As I have demonstrated above,corn grain is not the sun’s gift to the producers of corn ethanol, but it is one of the fossil energyinputs. The calorific value of corn grain is therefore shown in Figure 19 to demonstrate that a largefraction of the energy inputs into ethanol production is dissipated on fermentation, distillation, andfarming. The horizontal lines in the middle of each bar in Figure 19 denote the corrected ethanolyield, cf. Section 4.1, given the corn yields shown in Figure 17.
Remark 5 It appears that the high net energy yields of corn production – up to 200 GJ/ha-crop– reported in the literature, e.g., (Rogner, 2000), are unrealistic, and result from an incompletethermodynamic analysis of industrial corn production. 2
Non-scientists should stop looking for shortcuts around the hard work of
learning the science
— CHRISTOPHER ESSEX and ROSS MCKITRICK
Taken by Storm, The Troubled Science,
Policy and Politics of Global Warming (BPR Publishers, 2002)
commute costs. This study seems to contain some mistakes. For example, the efficiency of grain conversion intoethanol is overestimated, and the amount of feed water is significantly underestimated.
20The energy of dry corn grain minus the fossil energy inputs per hectare and per crop.

26 Thermodynamics of corn-ethanol biofuel. . . Web Version
0 50 100 150 200 250GJ/ha
Corn FossilEt FossilEt CreditsCorn kernels
Berthiaume et al., 2001
Wang et al., 1997
Shapouri et al., 2002
Patzek, 2004
Pimentel, 2003
Figure 19: The overall energy balance of ethanol production. The two or three leftmost parts ofeach bar represent the specific fossil energy used in corn farming and ethanol production. The fossilenergy inputs into ethanol production are the sum of the green part and the blue energy credit partfor some authors. The rightmost part is the calorific value of corn grain harvested from 1 hectare.The total lengths of the horizontal bars represent all energy inputs into ethanol production. Thehorizontal lines with the vertical anchors represent the calorific value of ethanol obtained from onehectare of corn. Note that the total energy inputs into ethanol production are equivalent to ∼4–5metric tonnes of gasoline per hectare. The ethanol’s calorific value is equal to 1–1.3 metric tonnesof gasoline.

CRPS, 23(6), 2004 T. W. PATZEK 27
−15 −10 −5 0 5 10
Pimentel, 2003
Patzek, 2004
Berthiaume et al., 2001
Shapouri et al., 2002
Wang et al., 1997
Fossil Energy Gain/Loss, GJ/ha
Figure 20: Fossil energy gain/loss in corn ethanol production. Note that the dubious energy creditsdescribed in Section 4.4 do not eliminate the use of fossil fuels in the first place, but presentalternative useful outcomes of this use.
0 20 40 60 80 100 120 140
Berthiaume et al., 2001
Shapouri et al., 2002
Pimentel, 2003
Patzek, 2004
Wang et al., 1997
Net Energy Yield, GJ/ha
Figure 21: The net energy yield in industrial corn grain production is relatively small, 100 – 135GJ/ha-crop. The HHV of dry corn grain is 18.8 MJ/kg, based on the mean of the values reportedby Schneider & Spraque (1955), p. 496, 2033 kcal/lb; and Miller (1958), p. 639, 2059 kcal/lb.1 thermochemical kcal = 4.184 kJ.

28 Thermodynamics of corn-ethanol biofuel. . . Web Version
Part II
Sustainability & Renewability
1 Introduction
The following type of reasoning (Sheehan et al., 2004) is not uncommon in environmental literature:
(Page 118: . . . Sustainability is fundamentally an ethical issue, the technologicalcontext. . . is not adequate to fully assess the sustainability of ethanol or any other fuelchoices. . . . The stakeholders21 established a list of indicators that they felt should beused to measure the relative sustainability of switching from gasoline to [corn] stover-derived ethanol to fuel our cars22.
More broadly, an informal check of Amazon.com, performed on August 16, 2003, revealed 4454book titles containing the word “sustain⋆.” In particular, there were 573 book titles with “sustain⋆”and “⋆culture”23.” The phrase sustainable development is firmly rooted in our consciousness.Therefore, one must ask the following question: Is sustainable anything possible in nature? In theeconomy? Also, how sustained are the processes deemed by some as “sustainable”?
Human nature, being what it is, destines us to choose a “truly great but brief, not a longand dull, career24” on the earth. After our eventual demise, the earth will be home to other lessambitious and impatient species. The name of the game, therefore, is to make the human presenceon the earth as happy as possible, albeit not too short25. These two tasks require careful thoughtand delicate balance of human actions. No country has demonstrated an adequate implementationof either. In fact the opposite may be true. As the entropy on the earth increases, the actions ofgovernments and societies resemble more and more episodic spasms, with ever less forethought anddeliberation. The current hot button issues: the Hydrogen Economy, Ethanol from Corn, and theWar on Terrorism are good examples.
2 Disclaimer
The next eight sections of this paper are punctuated with verbatim quotations from, and mydigestion of the most important book I have read in decades: The Entropy and the Economic Pro-cess by Nicholas Georgescu-Roegen (1906-1994), who was a great twentieth century thinker,economist, mathematician, historian, and philosopher. The impact of this book on my thinkinghas been profound.
21“A group of farmers, environmentalists, automakers, grain processors, and government researchers.”22Therefore, any fuel or technology can be declared as “sustainable,” whenever there exists a group of people who
feel good about it, and say that it is!23My favorite: Permaculture: Principles and Pathways Beyond Sustainability by David Holmgren, published by
Holmgren Design Services (July 2003).24Georgescu-Roegen (1971), page 304.25Preaching alone will not do. People will never choose less fulfilling life styles without coercion. This is why
communism, or any other totalitarian “ism,” can never work; they strive to convert the thinking individuals intoslaves or working animals. Says Percy Williams Bridgman, (1955), p.114, italics mine: “The individual is theunit in terms of which all our social concepts ultimately find their meanings.”
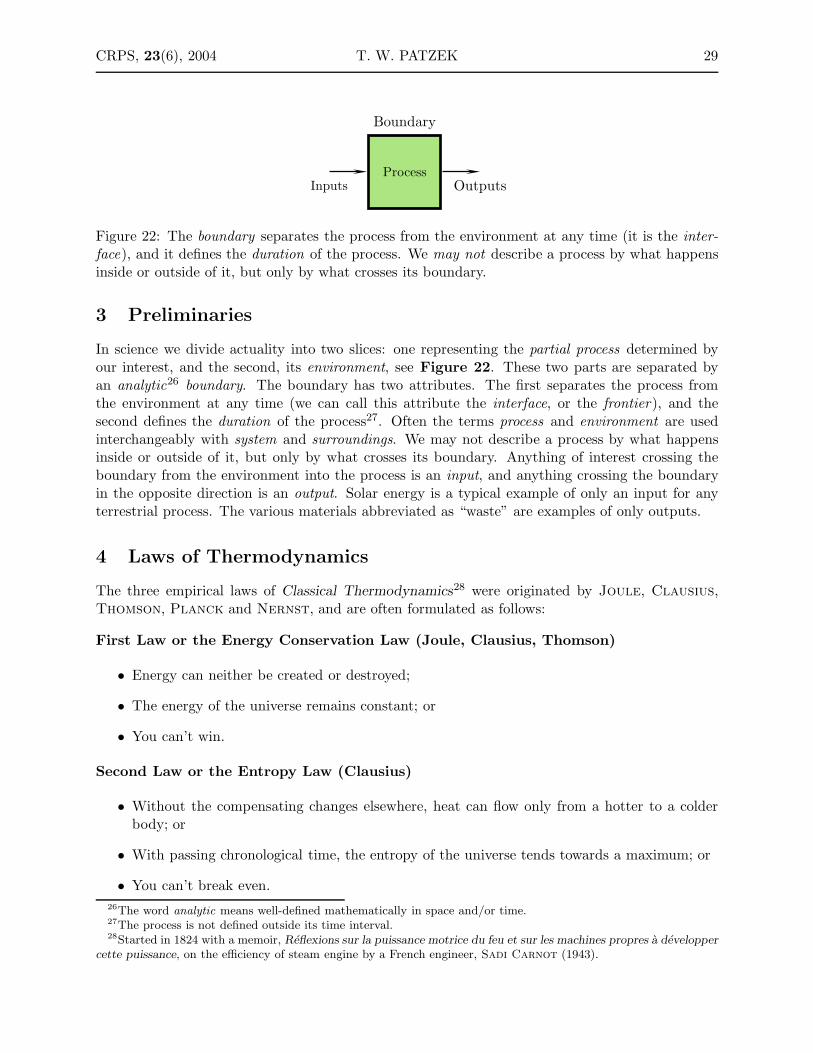
CRPS, 23(6), 2004 T. W. PATZEK 29
ProcessInputs Outputs
Boundary
Figure 22: The boundary separates the process from the environment at any time (it is the inter-face), and it defines the duration of the process. We may not describe a process by what happensinside or outside of it, but only by what crosses its boundary.
3 Preliminaries
In science we divide actuality into two slices: one representing the partial process determined byour interest, and the second, its environment, see Figure 22. These two parts are separated byan analytic26 boundary. The boundary has two attributes. The first separates the process fromthe environment at any time (we can call this attribute the interface, or the frontier), and thesecond defines the duration of the process27. Often the terms process and environment are usedinterchangeably with system and surroundings. We may not describe a process by what happensinside or outside of it, but only by what crosses its boundary. Anything of interest crossing theboundary from the environment into the process is an input, and anything crossing the boundaryin the opposite direction is an output. Solar energy is a typical example of only an input for anyterrestrial process. The various materials abbreviated as “waste” are examples of only outputs.
4 Laws of Thermodynamics
The three empirical laws of Classical Thermodynamics28 were originated by Joule, Clausius,Thomson, Planck and Nernst, and are often formulated as follows:
First Law or the Energy Conservation Law (Joule, Clausius, Thomson)
• Energy can neither be created or destroyed;
• The energy of the universe remains constant; or
• You can’t win.
Second Law or the Entropy Law (Clausius)
• Without the compensating changes elsewhere, heat can flow only from a hotter to a colderbody; or
• With passing chronological time, the entropy of the universe tends towards a maximum; or
• You can’t break even.
26The word analytic means well-defined mathematically in space and/or time.27The process is not defined outside its time interval.28Started in 1824 with a memoir, Reflexions sur la puissance motrice du feu et sur les machines propres a developper
cette puissance, on the efficiency of steam engine by a French engineer, Sadi Carnot (1943).

30 Thermodynamics of corn-ethanol biofuel. . . Web Version
Third Law (Nernst and Planck)
• The entropy of any condensed substance, i.e., liquid or solid, has at zero absolute temperaturethe value zero; or
• Zero absolute temperature cannot be reached; or
• You have to stay in the game.
The story of Classical Thermodynamics is rather simple if we ignore the fine print. Energycomes in two qualities: (1) free or available, and (2) bound or dissipated. Free energy can betransformed into mechanical work29. Like heat, free energy dissipates itself, without any loss, intobound energy. The material universe, therefore, changes spontaneously in such a way that freeenergy is degraded. The final outcome is a state where all energy is dissipated, the Heat Death asit was called in the earliest thermodynamics30.
For some technical reasons, which need not bother us now, entropy was defined by the formula:
∆S = δQ/T (10)
where ∆S is the entropy increment, δQ is the quantity of heat transferred from a hotter to a colderbody, and T is the absolute temperature at which the transfer is made. The entropy incrementsare always determined in the direction of Time31, from the earlier to the later moment in Time.So, if chronological Time τ2 is later than another Time τ1, then the entropy of the universe (oranother closed system) is
S(τ2) > S(τ1) (11)
The Entropy Law is the simplest (and thus far the only) law known to science, by which theexistence of true happening in nature is recognized. The Entropy Law defines the boundaries ofwhat cannot happen, but does not prescribe entirely what can. This loophole resulted in life. Alllife32 feeds on an environment of low-to-moderate entropy (highly organized ecosystems33, suchas shallow sea water, a river or lake, a jungle, etc.), and is extinguished when the entropy of theenvironment becomes too high (the degraded environment of sterile desert or chemically pollutedwater).
29Initially free heat was defined as the heat which can be exchanged between a hotter body and a colder one, andwhich can move a turbine in power station. If the hotter body, i.e., a steam boiler, remains unchanged, and thecolder body, i.e., the environment, warms up, the amount of free heat goes down and the power station produces lesselectricity, as happened in Europe during the record-breaking summer heat wave of 2003.
30Bridgman disagrees, (1955), p. 265.31Time is a notion of extraordinary complexity. Here I use the historical or chronological Time, as opposed to the
mechanical clock time.32Not only biological life, but also social life. Consider the following comment made by Joseph Samaha in the
daily Al Safir of Beirut about the desperately dissipative, high-entropy political situation in the Middle East: “Letus expel every mediator. Let us banish every international organization. Let the situation collapse. Let electricityand water be cut off. Let the pumping of oil stop. Let theft prevail. Let the universities and schools close down. Letbusinesses go bankrupt. Let civilian life break down.” Source NYT, August 21, 2003, page A13.
33eco – From late Latin oeco- household, from Greek oik -, oiko-, from oikos house habitat or environment (Webster,1993). Ecosystems are the earth’s households, and ecology is the study of these households.

CRPS, 23(6), 2004 T. W. PATZEK 31
5 Thermodynamics and Economics
Classical thermodynamics and economics34 are thoroughly bonded. In fact, thermodynamics hasbeen mostly a physical theory of economic value from its inception by Carnot. Just as physicallife, our whole economic life feeds on low entropy, e.g., on grain, lumber, steel, copper, aluminum,cloth, computers, etc., all of which are highly organized structures. A slab of electrolytic aluminumis worth much more than the dispersed molecules of aluminum oxide, diffused so much as to be ofno use to us.
In 1860 or so, William Stanley Jevons described the phenomenon of resource degradationand dilution as follows: “The expression “exhaustion of our coal mines,” states the subject in thebriefest form, but is sure to convey erroneous notions to those who do not reflect upon the longseries of changes in our industrial condition which must result from the gradual deepening of ourcoal mines and the increased price of fuel. Many persons perhaps entertain a vague notion thatsome day our coal seams will be found emptied to the bottom, and swept clean like a coal-cellar.Our fires and furnaces, they think, will then be suddenly extinguished, and cold and darkness willbe left to reign over a depopulated country. It is almost needless to say, however, that our minesare literally inexhaustible. We cannot get to the bottom of them; and though we may some dayhave to pay dear for fuel, it will never be positively wanting35.” Today we may substitute “crudeoil” or “natural gas” for “coal”, and Jevons’ statement will be as true36.
In particular, thermodynamics explains to us (while economics usually does not37) why landhas economic value, as opposed to price. Even though land cannot be consumed, it derives itseconomic value from two physical facts: (1) land allows humans to catch the most vital form oflow entropy – sunlight – and (2) the earth stopped making land in large quantities. Other physicaland chemical characteristics of fertile land38 are scarce in a different sense: (1) the amount of lowentropy in the soil is finite and it decreases39 continuously and irrevocably, and (2) a given amountof low entropy can be used only once.
A different example of irrevocably lost low entropy is given by mining copper ore and trans-forming it into pure metallic copper. A sheet of manufactured copper metal is made of: (1) copperore, (2) other raw and processing materials, (3) electricity from fossil fuels, and (4) mechanicalwork. All these factors ultimately resolve into an orderly structure of primary materials (e.g.,highly concentrated copper atoms in the ore, fuel, electricity), i.e., to environmental low entropyand nothing else. The free energy used in production to deliver mechanical work, or to heat theore, is irrevocably lost.
We cannot bootleg any entropy40 by means of an ingenious process or device. Just like a
34A social science concerned chiefly with description and analysis of the production, distribution, and consumptionof goods and services; from Greek oikonomica – skilled in the management of a household (Webster, 1993).
35(Jevons, 1866), Preface, pp. vi-vii, my italics. Jevons could not possibly imagine that coal, or any other fossilfuel, could be wanting at the rate we need to produce it in the 21st century, regardless of the price.
36In fact, it is more difficult to extract crude oil than coal. After we finish exploiting an oilfield, 1/2 to 2/3 of theoil present initially in the rock interstices is left there forever. Also, producing conventional crude oil and naturalgas at the incredibly high rates required by the world economy will soon be physically impossible, regardless of theirprices. Therefore substitution of crude oil by natural gas will be impossible. As pointed out by Dr. Ronneberg,economists simply do not comprehend this looming calamity.
37With the notable exception of Georgescu-Roegen (1971).38Natural soil fertilizers, soil-bonding humus, interstitial water, etc.39Unless the soil is a part of an ecosystem that recycles all mass, see Section 10.40In the 1930’s, the young physicists became so confused by statistical thermodynamics that a famous thermody-
namicist, Percy Williams Bridgman (1955), wrote an essay on the impossibility of constructing a machine that“shall violate the second law of thermodynamics on a scale large enough to be commercially profitable (pp. 236-268).”
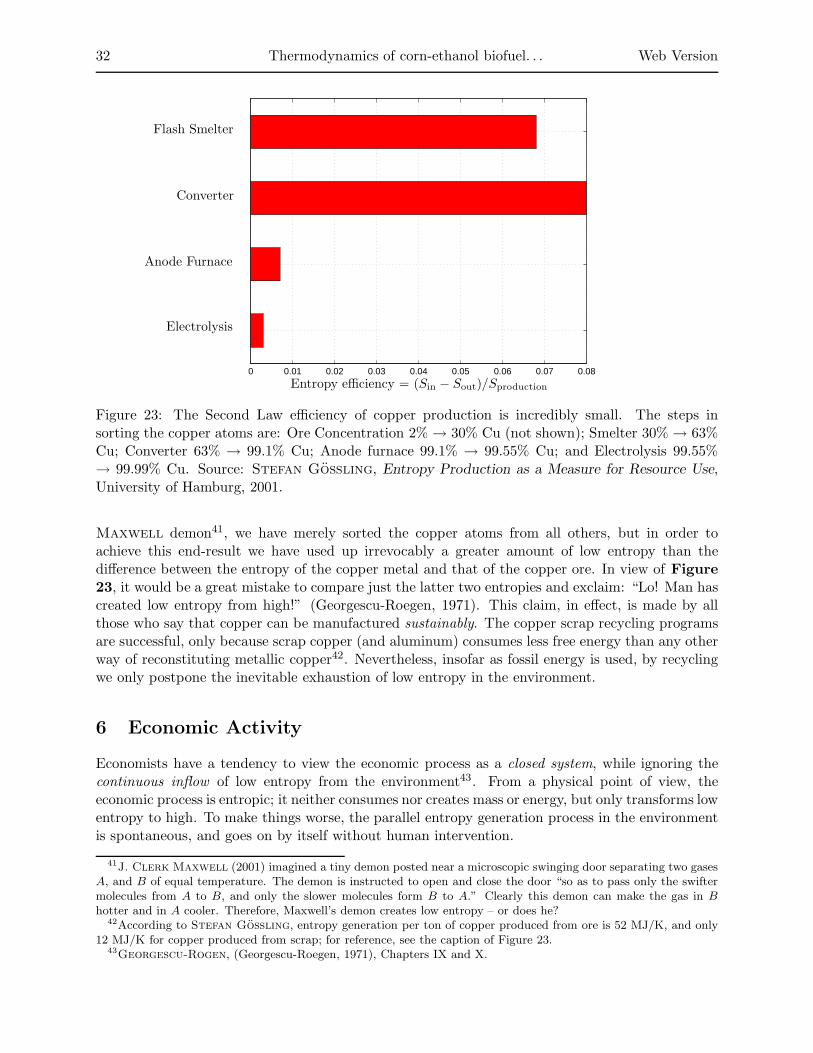
32 Thermodynamics of corn-ethanol biofuel. . . Web Version
0 0.01 0.02 0.03 0.04 0.05 0.06 0.07 0.08
Entropy efficiency = (Sin − Sout)/Sproduction
Flash Smelter
Converter
Anode Furnace
Electrolysis
Figure 23: The Second Law efficiency of copper production is incredibly small. The steps insorting the copper atoms are: Ore Concentration 2% → 30% Cu (not shown); Smelter 30% → 63%Cu; Converter 63% → 99.1% Cu; Anode furnace 99.1% → 99.55% Cu; and Electrolysis 99.55%→ 99.99% Cu. Source: Stefan Goßling, Entropy Production as a Measure for Resource Use,University of Hamburg, 2001.
Maxwell demon41, we have merely sorted the copper atoms from all others, but in order toachieve this end-result we have used up irrevocably a greater amount of low entropy than thedifference between the entropy of the copper metal and that of the copper ore. In view of Figure23, it would be a great mistake to compare just the latter two entropies and exclaim: “Lo! Man hascreated low entropy from high!” (Georgescu-Roegen, 1971). This claim, in effect, is made by allthose who say that copper can be manufactured sustainably. The copper scrap recycling programsare successful, only because scrap copper (and aluminum) consumes less free energy than any otherway of reconstituting metallic copper42. Nevertheless, insofar as fossil energy is used, by recyclingwe only postpone the inevitable exhaustion of low entropy in the environment.
6 Economic Activity
Economists have a tendency to view the economic process as a closed system, while ignoring thecontinuous inflow of low entropy from the environment43. From a physical point of view, theeconomic process is entropic; it neither consumes nor creates mass or energy, but only transforms lowentropy to high. To make things worse, the parallel entropy generation process in the environmentis spontaneous, and goes on by itself without human intervention.
41J. Clerk Maxwell (2001) imagined a tiny demon posted near a microscopic swinging door separating two gasesA, and B of equal temperature. The demon is instructed to open and close the door “so as to pass only the swiftermolecules from A to B, and only the slower molecules form B to A.” Clearly this demon can make the gas in Bhotter and in A cooler. Therefore, Maxwell’s demon creates low entropy – or does he?
42According to Stefan Goßling, entropy generation per ton of copper produced from ore is 52 MJ/K, and only12 MJ/K for copper produced from scrap; for reference, see the caption of Figure 23.
43Georgescu-Rogen, (Georgescu-Roegen, 1971), Chapters IX and X.

CRPS, 23(6), 2004 T. W. PATZEK 33
0 1000 2000 3000 4000 5000 6000 7000 8000 9000 10000
Less DC
Other DC
U.S.
Liters of crude oil equivalent per year per person
Figure 24: The 2001 per capita energy consumption in the U.S., other Developed Countries (DC),and the less Developed Countries. Source: The U.S. DOE Energy Information Agency.
0 1000 2000 3000 4000 5000 6000
Africa
S. America
Asia
Europe
U.S.
Liters of water per year per person
Figure 25: The 1990 per capita total (personal + industrial) water consumption in the U.S., andelsewhere. Source: Water Quality Association, 151 Naperville Road Lisle, IL 60532-1088, USA.
The material production process, in contrast, depends on the intervention of humans, who likethe Maxwell demon, sort and direct environmental entropy according to the process rules44. Thissorting activity is not a part of natural environmental processes and creates high entropy, i.e., waste,at a (much) faster rate than the biological life processes. From a purely material point of view, theeconomic process always transforms low entropy into waste. So what could be the justification for
44When watching an SUV commercial, I often see a monstrous truck carelessly damaging a low-entropy fragileecosystem, a pristine meadow, river bed, or an alpine mountain slope. Thus the SUV commercials are a goodmetaphor for the interactions of the present-day economics with the environment.

34 Thermodynamics of corn-ethanol biofuel. . . Web Version
0 1000 2000 3000 4000 5000 6000
India
China
World
Top 20
EU
U.S.
Kilograms of carbon per year per person
Figure 26: The 1999 per capita carbon emission estimates in the U.S., and elsewhere. Source:World Resources Institute, U.S. EIA.
economic activity? As described by Georgescu-Roegen, the true output of an economic processis not merely waste, but the enjoyment of life. It is not a coincidence that the very country, whichon July 4, 1776 declared: “We hold these truths to be self-evident, that all men are created equal,that they are endowed by their Creator with certain unalienable Rights, that among these are Life,Liberty and the pursuit of Happiness,” uses over twice as much free energy per capita than anyother country on the earth, see Figures 24- 26. In general, abundant free energy equals enjoymentof life. The converse statement is as true in real life as it is in Logic, see Figure 27.
7 Agriculture
The following statement is made surprisingly often: “Properly used, [the plants on the earth]can by their reproductive powers supply us indefinitely with the food, the wood, and the othernatural products we require.45” Even though the intensity of sunlight that reaches the earth hasnot changed appreciably over the human scale of Time, the apparent dominance of solar energyin agricultural production should not obscure the importance of the entropic soil degradation bycontinuous cultivation. Soil degradation can be severe over a human life span. Even the earliestfarmers knew that manuring a soil does not remove its degradation, and to farm always meant tomine, in part, the soil. Clean water is necessary for agriculture. Water is inevitably polluted byagricultural waste; therefore, water too is mined.
It would be a mistake to believe that the practice of fertilizing soil can defeat the Entropy Lawand transform food production into an everlasting process. Life feeds not only on sunlight but alsoon the low entropy of an ecosystem46.
With time, draft animals, oxen, buffalo and horse, were replaced by machines. A tractor is madeof iron, other metals, oil and coal, and it feeds on oil. The natural manure fertilizer from farm
45(Cepede et al., 1964), p. 309.46A process that cycles living organisms. Only the solar energy and waste heat flow across the ecosystem boundary,
everything else is recycled, cf. Section 10.

CRPS, 23(6), 2004 T. W. PATZEK 35
Figure 27: After the power blackout, people poured onto 8th Avenue, outside the Port Authority,unable to leave the city. The New York Times, August 14, 2003.
animals was replaced by the chemical fertilizers manufactured from methane, coal, oil, iron, copper,and the earth minerals. The importance of this switch should be self-evident: the main source oflow entropy feeding agriculture has been switched from the practically infinite solar energy to thevery finite stock of minerals in the earth’s crust. Of course, this switch limits how long and howmany people can be fed by the earth. It is no longer the practically unlimited stock of the energyin the sun that limits our survival, but the meager stock of natural minerals mined from the earthcrust. If M is the accessible fraction47 of this stock, and r is the average rate of its use, thenM = rt, where t is the corresponding duration of human civilization that depends on the crustalminerals. Depending on the mineral, and its rate of use, this time can be estimated as several tensof years (high quality crude oil), through many hundreds of years (coal), to thousands of years(uranium); so much for sustainable development.
8 Industrial Production
Every car or appliance produced today means fewer human lives in the future. Every styrofoam cup,cell phone or TV set in a landfill now means fewer resources and happy humans later. In industry,just as in agriculture, the price of technological progress has been a shift from the abundant sourceof low entropy – the sun –, to the earth’s mineral resources. Any time these resources are wasted,we shorten the survival time of humanity. Confronted in the distant future with exhaustion ofmineral resources, mankind will be tempted to retrace its steps; however, in view of the EntropyLaw, it is impossible. Human evolution is irrevocable and cannot be retraced.
47This fraction may be very small. For example, the vast majority of carbon on the earth is bound in the carbonaterocks. No one in their right mind would dream of extracting this carbon. See also footnote 36.

36 Thermodynamics of corn-ethanol biofuel. . . Web Version
Because of the Entropy Law, the large-scale industrial production of fossil fuels (e.g., ethanol)from the industrial plants manufactured (Kimbrell, 2003) by modern agriculture, will only hastenthe depletion of mineral resources and the eventual demise of our civilization.
9 Waste
The ever-increasing rate of economic activity generates ever more chemical waste. For the earth aswhole, this waste cannot be disposed of48. Unless we use more free energy to process it, toxic wasteonce produced is here to stay. This free energy can only be used once, and will always diminish ourfuture standard of living. Waste cleanup, collection and recycling have begun to interfere with ourlife and pockets49, and are no longer hidden from our industrial civilization. The ever-accumulatinggarbage and the toxic by-products of agriculture and industry are the living proof of the EntropyLaw in action.
The process of concentrating copper atoms, whose entropy efficiency is shown in Figure 23, isanalogous to the process of fishing out the contaminant molecules dispersed in a huge volume ofwater and rock. The entropy efficiency of any contaminant cleanup process must be lower thanthat of the copper production process.
10 Sustainability
Stock offossil fuels 500 years
Chemicalwaste
Waste heat
Figure 28: A linear process of converting a stock of fossil fuels into waste matter and heat cannotbe sustainable. The waste heat is exported to the universe, but the chemical waste accumulates.To replenish some of the fossil fuel stock, it will take another 50-400 million years of photosynthesis,burial, and entrapment.
The opposite of as yet undefined sustainability is irreversibility, and I define it first after Max
Karl Ernst Ludwig Planck (1858-1947):
Definition 3 (Irreversibility) A process is irreversible if it can in no way be reversed, all otherprocesses are reversible. It is impossible, even with the assistance of all agents in nature, to restore
48Therefore hiding our waste by injecting it into the oceans, aquifers, or burying it in shallow graves - landfills -will always come back to haunt us.
49NYT, August 20, 2003: “Crews have completed the removal of more than 12 metric tons of weapons-gradeplutonium from the Rocky Flats (CO) nuclear weapons site as part of a $7 billion cleanup effort that is expected tobe finished in 2006, 12 years ahead of schedule. The plant manufactured plutonium triggers for 40 years until it wasclosed in 1989 for safety violations. The plutonium has been shipped to South Carolina; lower-grade nuclear wastewill be sent to New Mexico. The 6,000-acre Rocky Flats site is expected to become a wildlife refuge.” In other words,the cost of picking and sorting the plutonium waste is $583/g, compared with $11/g to buy gold.

CRPS, 23(6), 2004 T. W. PATZEK 37
everywhere the exact initial state when the irreversible process has once taken place (Planck,1926). 2
Corollary 1 From the definition above, a linear process that converts the low entropy of fossil fuelsinto waste is irreversible and cannot be sustainable. 2
Stock ofsoil/waterfossil fuels 200 years?
Chemicalwaste
Waste heat
Figure 29: Current industrial agriculture is another example of a linear process, which by definitioncannot be sustainable.
In a linear process, see Figure 28 and 29, a finite stock of fossil fuels is rapidly depletedand burned to serve as a collective heat source for all heat engines employed by our civilization,see Figure 31a. In addition, the atmosphere, which acts as a heat sink, becomes polluted bychemical waste from combustion (chemical entropy), as well as by waste heat (thermal entropy).The earth can only export thermal entropy through its atmosphere, see Appendix A. In additionto the atmosphere, the earth, which is the system in Appendix B, also accumulates chemicalentropy. As a result, the linear fossil fuel process accumulates chemical entropy in the earth andthe atmosphere, and irreversibly degrades our planet on a time scale of our civilization, measuredin hundreds of years.
In contrast, a cyclic ecosystem can be sustainable, see Figure 30. A natural cycle uses thesun as its source of energy and low entropy, and it expels only waste heat into the atmosphereand, ultimately, into the universe, see Figure 31b. Most importantly, all materials involved inan ecosystem are recycled, and when the natural cycle is completed, only waste heat, or thermalentropy is generated.
In order to discuss the existence and constraints on sustainability, I need first to define it.
Definition 4 (Sustainability) A cyclic process is sustainable if and only if
1. It is capable of being sustained, i.e., maintained without interruption, weakening or loss ofquality “forever,” and
2. The environment on which this process feeds and to which it expels its waste is also sustained“forever.”
Corollary 2 A cyclic process, which is also “sustainable,” must not reject chemicals into the en-vironment, i.e., its net mass production must be “close” to zero “forever.”
Corollary 3 A sustainable cyclic process must not reject heat into the environment at a ratethat is too high for the earth to export this heat to the universe; otherwise, the environment propertieswill change.

38 Thermodynamics of corn-ethanol biofuel. . . Web Version
Otherlife
Death &Decay
H2O, CO2
Nutrients
PlantMatter
Waste heatWaste heat
Sun energy
“Forever”
Figure 30: An ecosystem transforms the sun energy (low thermal entropy) into waste heat (highthermal entropy). The waste heat is continuously exported to the universe. Everything else iscompletely reused, or recycled.
Work
Heat source
Heat sink
Life
Sun
Universe(a) (b)
Figure 31: Thermodynamic cycles: (a) A heat engine, and (b) An ecosystem.
10.1 The Earth is an Open System to Heat Flow
Attributes (1)-(2) of a sustainable cyclic process would be a thermodynamic contradiction if theearth were approximately a closed system with respect to the infrared radiation (heat). These twoattributes would then make a sustainable process a perpetual machine of the second kind. Luckilyfor us, the earth can be treated as an open system with respect to visible and infrared light, and a

CRPS, 23(6), 2004 T. W. PATZEK 39
sustainable cyclic process may generate thermal entropy at a rate per unit area of the earth surface(specific entropy rate or flux ) which is no more than the average flux of entropy export from theearth to the universe, jE
S , calculated from Eq. (34) in Appendix A, minus the specific rate ofentropy generation in the atmosphere due to export of the solar energy, calculated from Eq. (39)in Appendix A.
To quantify sustainability, I first assert that a cyclic process always converts all forms of entropyto thermal entropy. Thermal entropy is the ultimate waste from all “sustainable” cyclic processeson the earth, and it should be used for comparisons. Second, per unit area of the earth, we knowthat (1) the always positive specific rate of thermal entropy generation due to everything happeningon the earth is σ > 0, (2) the rate of increase of the specific thermal entropy of the atmospheredue to all these happenings is σa > 0, and (3) the specific rate of thermal entropy generation dueto the energy transport from the earth to the universe is σt > 0. Then, for cyclic processes, strongsustainability can be defined mathematically, see Appendix B, as
σ + σa ≤ jES − σt (12)
at every point on the earth, and at all times.
Over an arbitrary time interval [τ1, τ2], we can write the global condition of sustainability of allcyclic processes on the earth as (Eq. (55) in Appendix B)
[Sa(τ2) − Sa(τ1)]︸ ︷︷ ︸
Increase of atmospheric entropy
+ [S(τ2) − S(τ1)]︸ ︷︷ ︸
Increase of earth entropy
−SE(τ1, τ2) + St(τ1, τ2) ≤ 0 (13)
where SE(τ1, τ2) is the total thermal entropy exported by the earth over the time interval [τ1, τ2],and St is the corresponding thermal entropy generation in the atmosphere due to the solar energyexport.
10.2 Conclusions
The immediate observations from the above discussion are:
• To the extent that humans use 80-90% of fossil and nuclear energy to run the heat enginesthat power the global economy, our civilization is 80-90% unsustainable.
• If the atmosphere dissipates more energy due to the increased greenhouse gas loading byhuman (and natural) activities (σt increases), there will be less room for all other humanactivities to remain sustainable. Stahl estimates, (1996), Table 1, the specific entropy gen-eration rate in the atmosphere to be σt = 0.2 W/K-m2. So only 1 W/K-m2 of thermal entropygeneration is left to all human and other natural activities, see Appendix A.
• Only energy generation directly from the sun, sun-driven wind, and water can be sustainable.
• Burning or extracting large quantities of wood or green matter requires chemical fertilizationand cannot be sustainable to the extent that growing plants mines fossil fuels as well as lowentropy from the soil, see Section 7.
• Industrial agriculture can never be sustainable because it relies on the irreversible burningand chemical transformations of fossil fuels, see Section 7.

40 Thermodynamics of corn-ethanol biofuel. . . Web Version
Thanks to the human heart by which we live,
Thanks to its tenderness, its joys, and fears,
To me the meanest flower that blows can give
Thoughts that do often lie too deep for tears.
— WILLIAM WORDSWORTH
Intimations of Immortality from Recollections of Early Childhood (1803-1806)
In thermodynamics, you have to get to the point where you understand
what any damn fool means no matter what he says
— PROF. A. R. GORDON
(Lecture Notes, Department of Chemistry, University of Toronto)

CRPS, 23(6), 2004 T. W. PATZEK 41
Part III
Sustainability of Corn-Ethanol Cycle
1 Introduction
As pointed out in Part II, our standard of life is maintained by the exploitation of natural resourcesthat have accumulated in the earth over millions of years. A natural resource whose chemicalcomposition differs most from the dead states of the elements comprising it is most valuable.
This part is devoted to the life-cycle analysis of industrial corn and the ethanol biofuel producedfrom it. In my analysis, I will move along the trail charted in the brilliant, albeit incomplete,paper by three Canadian scientists, Richard Berthiaume, Christian Bouchard, and Marc
A. Rosen (Berthiaume et al., 2001). There will be, however, important differences. I define theindustrial corn-ethanol system differently, include more inputs (which are more carefully estimated),and do not require the carbon and water cycles to close.
2 Available Free Energy
For example, relative to a datum environment (T0 = 250 C, p0 = 1 atm), the quality of heat rejectedby a process depends on temperature:
1J of heat at 5000C = 0.614 J of work
1J of heat at 500C = 0.077 J of work(14)
Gibbs, Guoy, Stodola, and Keenan’s available free energy, see Appendix B, is knownin chemical and engineering thermodynamics as exergy, and is denoted with the symbol B. Theconcept of exergy and its cumulative consumption in an industrial process has been significantlyadvanced by the distinguished Polish thermodynamicist, Jan Szargut, a professor at the ChemicalEngineering Department of my Alma Mater, the Silesian Technical University, Gliwice, Poland.His monograph, published in English with David R. Morris and Frank R. Steward in 1988(Szargut et al., 1988) was based on two decades of development and industrial applications of life-cycle analysis. Today, this monograph is still the most comprehensive source of exergy concepts,data, and examples.
2.1 Introduction to Exergy
An easy to understand definition of exergy was proposed by Ludwig Riekert (1975).
Definition 5 Exergy, B, is equal to the shaft work or electrical energy necessary to produce amaterial in its specified state from materials common in the environment in a reversible way, heatbeing exchanged with the environment at constant temperature T0. 2
We distinguish the potential exergy, Bp, kinetic exergy, Bk, physical exergy Bph, and chemicalexergy, Bch:
• Physical exergy, Bph is the work obtainable by a reversible physical process from its initialstate (T, P ) to the environment state (T0, p0).

42 Thermodynamics of corn-ethanol biofuel. . . Web Version
• Chemical exergy, Bch, is the work obtained by taking a substance at the pressure andtemperature of the environment to the state of thermodynamic equilibrium with the datumlevels of components of the environment.
• Thermal exergy, Bth, is the sum of physical and chemical exergies:
Bth = Bph + Bch (15)
H1, S1
H2, S2
T0
Q0r
Wmax = −∆Bth
Figure 32: Exergy balance in an isothermal, ideal flow machine. The maximum possible shaft workfrom this machine is equal to the negative change of thermal exergy.
2.2 Change of Bth between Two States
Consider an ideal (reversible) flow machine, see Figure 32. An exergy carrier with enthalpyH1, and entropy S1 enters the machine. After physical and/or chemical changes, the effluent hasenthalpy H2, and entropy S2. Heat is transferred between the environment and the working fluidat the ambient temperature T0. The first and second law of thermodynamics are simply:
Wmax = Bth1− Bth2
= H1 − H2 + Q0r (I Law)
S2 − S1 −Q0r
T0= 0 (II Law)
Bth1− Bth2
= −∆Bth = H1 − H2 − T0(S1 − S2) (I+II Law)
(16)
Physical exergy can be calculated immediately from Eq. (16)
Bph = H − H0 − T0(S − S0) = Hph − T0Sph (17)
2.3 An Industrial Flow Process
Consider now an industrial steady-state flow process, which can occur in a heat engine, corn field,or ethanol plant, see Figure 33. The input to this irreversible process is an exergy carrier with theenthalpy H1, and entropy S1. The process is also supplied with the quantity of heat Q1 from thesource having temperature T1 > T0. The process effluent has enthalpy H2, and entropy S2. Therejected amount of heat Q0 is transferred to the environment. The useful outcome of the process

CRPS, 23(6), 2004 T. W. PATZEK 43
H1, S1
H2, S2
Wu or Hu, Su
T0
Q0
T1
Q1
Figure 33: Exergy balance in ideal (reversible) and real (irreversible) nonisothermal industrialprocess.
can be mechanical work Wu or a chemical product having parameters Hu and Su. The effect ofirreversibility is studied by comparing the industrial process with a reversible process with the sameinflow and outflow parameters, and the same amount of driving heat. The only difference betweenthese two processes is the amount of heat rejected to the environment. For the reversible processthis heat is Q0r, and for the irreversible one, it is Q0.
The first and second law balances for the two processes are:
Hu = H1 − H2 + Q1 − Q0 Real process
Hur = H1 − H2 + Q1 − Q0r Reversible process
Hur − Hu = Q0 − Q0r
(18)
The increased useful effect of the reversible process causes the amount of rejected heat to be smallerthan that in the industrial process, Q0r < Q0. The sum of all entropy increases in the industrialprocess is
∑
∆S = −Q1
T1+ S2 − S1 +
Q0
T0+ Su > 0 (19)
while that in the reversible process is
∑
∆Sr = −Q1
T1+ S2 − S1 +
Q0r
T0+ Sur ≡ 0 (20)
From Eqs. (19) and (20) it follows that
Q0 − Q0r = T0(∑
∆S + Sur − Su) (21)
and we obtain
(Hur − T0Sur)︸ ︷︷ ︸
Bth,r
− (Hu − T0Su)︸ ︷︷ ︸
Bth
≡ δB = T0
∑
∆S(22)
The left hand-side of Eq. (22) represents the difference of the useful thermal exergy in the reversibleand industrial process, δB. It therefore represents the exergy loss due to the irreversibility of theindustrial process under consideration. We have recovered, again, the famous Guoy-Stodola law,also derived in Appendix B.

44 Thermodynamics of corn-ethanol biofuel. . . Web Version
2.4 Cumulative Exergy Consumption (CExC)
All steps of a production process leading from natural resources taken from the environment to thefinal product result in exergy losses or exergy consumption.
Definition 6 (CExC) The cumulative exergy consumption (CExC) is the sum of the exergy ofall natural resources in all the steps of a production process. 2
The problem of cumulative energy consumption (CEnC), discussed in Part I, is better known,but calculation of CExC is more informative because it accounts for the exergy of non-energeticraw materials (soil, water, air, minerals) extracted from the environment.
3 The Ideal and Real Corn-Ethanol Cycle
HeatEthanol
Corn
Solar Radiation
Heat
Work
HeatCombustion
Figure 34: The ideal corn-ethanol cycle. Adapted from Figure 2 in Berthiaume et al. (2001).
Ideally, see Figure 34, the corn-ethanol system and cycle consist of three parts: (1) Sustainablecorn farming, (2) Sustainable ethanol production, and (3) Ethanol combustion to produce usefulwork.
The cycle is driven only by solar energy, and all its chemical by-products are fully recycled.Only the low quality heat is rejected by the ideal corn-ethanol cycle into the environment, and thisheat is exported through the atmosphere into the universe. All carbon dioxide is recycled, and sois all water. This low-rate ideal cycle cannot deliver the massive quantities of ethanol fuel from(bi)-annual corn crops, see Figure 35.
Remark 6 Between 1866 and 1939 (NASS, 2004b), the average yield of corn in the U.S. hoveredaround 26 ± 3 bushels per acre, or 1600 kg/ha, 1/5 of the average yield today. I will assume that1600 kg/ha is the almost sustained corn yield using manuring, composting, crop rotation, andother not quite sustainable field practices. Note that between 1906 and 1937, the average cornyield declined, most likely due to the progressing soil deterioration50, cf. Section 7. 2
50Pimentel (2004c) observes: “Between 1900 and 1938, the early [U.S.] farmers were probably mining the soil ofnutrients and soil erosion was quite severe. At that time, most farmers kept livestock and were applying manure to

CRPS, 23(6), 2004 T. W. PATZEK 45
1860 1870 1880 1890 1900 1910 1920 1930 194018
20
22
24
26
28
30
32
Year
Co
rn y
ield
Figure 35: Between 1866 and 1939, the average yield of corn in the U.S. was 26 ± 3 bushels/acre,or 1600 kg of moist corn grain per hectare. The broken line is the 5-year moving central average ofannual reports. Between 1906 and 1937, the average yield declined in general due to soil mining.Source: USDA (NASS, 2004b).
Corollary 4 From Remark 6 it follows that without the fossil fuel-derived fertilizers, the cornproduced today in the U.S. would require at 140− 180 million hectares, close to the entire croplandarea in the U.S (187 million hectares total, 122 million hectares harvested in 2002, U.S. Census).There would not be enough animals to manure the fields, and low entropy in the soil would beexhausted within some 30 years. The same conclusion follows (perhaps with a different time scale)for any other industrial source of biomass. In short, no biofuel derived from plants is sustainable.2
Instead of relying on the current solar energy, we use the ancient solar energy in the form of fossilfuels to accelerate the ideal corn-ethanol cycle, see Figure 36. With the massive infusion of crudeoil, natural gas, coal, and their products, as well as fertilizers, pesticides and herbicides, we greatlyincrease the corn yield and the rate of ethanol production, but we also produce massive amounts ofchemical waste. In addition, we deplete soil by removing too much plant matter from the fields, anddeplete groundwater whenever there is not enough rain. The industrial corn-ethanol cycle relieson the linear processes of mining fossil fuels, soil, water, and air, and in view of Part II, it cannot
the land. Most did not apply the manure until spring, when more than half of the nitrogen had escaped into theatmosphere. Most of the corn was grown in rotation. If the corn were grown after a legume crop, some nitrogen wouldbe available to the corn crop. Although manure was being applied, it probably was applied in the neighborhood ofonly 5 tonnes of stored manure per hectare, and thus would have only about 12 to 15 kg/ha of nitrogen. For a cornyield of 1600 kg/ha the manure application only would provide a minimum amount of nitrogen.”

46 Thermodynamics of corn-ethanol biofuel. . . Web Version
be sustainable. All published statements to the contrary, e.g., (Wang et al., 1997; Shapouri et al.,2002a; Deluga et al., 2004; Sheehan et al., 2004), and many others, are scientifically indefensible.Below, I will quantify just how unsustainable the industrial corn-ethanol cycle is.
4 System Boundary
As required by thermodynamics, see Figure 34, I define the system as the topsoil of the cornfields, the corn plants, the corn-processing ethanol refineries, and the ethanol-burning combustionengines. The system inputs are the manufactured hybrid corn seeds, solar energy, fossil fuels,field chemicals, earth minerals (muriate of potash, phosphates, calcinated lime, etc.), electricity,machines, air (oxygen and carbon dioxide), and the atmospheric, surface and subsurface water. Thesystem outputs are heat, oxygen O2, carbon dioxide CO2, carbon monoxide CO, gaseous ammoniaNH3, nitrogen oxides NOx, sulfur oxides SOx, methane CH4, water as liquid and vapor, and amultitude of organic and inorganic water, soil and air contaminants.
Farming
CombustionNon-renewable
Resources Fermentation
DistillationMatter Heat
Matter Heat
Solar Radiation
Heat
Matter
Heat
Matter
Work
Figure 36: The industrial corn-ethanol cycle. The nonrenewable resources (NRR’s) at the centerof the cycle are: crude oil, methane, coal, electricity from fossil fuels, earth minerals, soil nutrients,groundwater, etc. Adapted from Figure 3 in Berthiaume et al. (2001).
5 The Carbon Cycle
The simplified carbon cycle inside the industrial corn-ethanol cycle is depicted in Figure 37.Consistently with the discussion in Part I, I require that all organic carbon be returned from theethanol refineries to the fields. Therefore, the internal carbon cycle is closed. The corn plants bindCO2 from the air, which is then released back into the atmosphere by burning the ethanol fuelproduced by the cycle, and by decomposing the stalk, roots and leaves of corn plants, as well as allthose parts of corn grain that were not used to produce the ethanol.
Remark 7 Most of the biomass must be returned to the field51 to preserve topsoil. This require-ment puts severe restrictions of the various schemes of converting biomass (rice straw, corn straw,tree parts, whole plants, etc.) to biofuels. 2
51Not necessarily the same field.

CRPS, 23(6), 2004 T. W. PATZEK 47
Pure EtOH
CO2
Corn+stalk,leaves, roots
Dried corn
EtOH+H2O
Combustion
Distillation
Fer
men
tation
Harvesting & Drying
Industrial
farmin
g
Stalk,leaves, roots
Gluten
WasteH2O
Soil humus
Decomposition
Figure 37: The internal carbon cycle in the industrial corn-ethanol cycle can be closed only by re-cycling most of the corn-plant and corn-grain components. Adapted from Figure 6 in Berthiaume
et al. (2001).
5.1 Net CO2 Emissions
As shown in Figure 36, our corn field-ethanol plant-combustion engine system uses fossil fuels asinputs, and outputs their combustion products into the environment. Therefore the industrialcorn-ethanol cycle generates extra CO2 and other greenhouse gases, which will all be translatedinto equivalent CO2 for simplicity.
The question now is as follows: Does the industrial corn-ethanol cycle generate more equivalentCO2 from its fossil fuel inputs than the gaseous emissions from replacing the cycle’s ethanol withgasoline, methane or diesel fuel? To make this comparison fair, I will account for the cumulativeexergy consumption in production of the fossil fuels by adding another 15% to their calorific values,in agreement with Szargut et al. (1988) and Sheehan et al. (1998).
By asking and answering this question, I seek to dispel common misconceptions about theindustrially-manufactured biofuels, best summarized by the following quotation:
About 70 million barrels52 of ethanol are included in annual U.S. gasoline consumptionafter 1992. Because ethanol is a biofuel, the carbon it contains should not be countedas an emission. Hence, carbon from ethanol is deducted from transportation gasolineconsumption53.
EIA is right, but then the CO2 emissions associated with the consumption of non-renewableresources in the industrial ethanol-corn cycle should be added to the transportation gasoline con-sumption. The question now is: What is the net balance?
To answer this question, I will use the EIA and the European Fertilizer Manufactures’ Asso-ciation (EFMA) data on the specific carbon dioxide emissions from the fossil fuel inputs into theindustrial corn-ethanol cycle, see Table 19. These specific emissions, in kg of CO2 per MJ in afossil fuel, will be multiplied by the respective energy input fluxes in MJ ha−1 crop−1, established
52About 11 giga liters.53The U.S. Energy Information Agency (EIA) (2002), Appendix A, page A3, my italics.

48 Thermodynamics of corn-ethanol biofuel. . . Web Version
in Part I. Electricity is treated differently, and its specific CO2 emissions account for the averageU.S. efficiency of conversion of thermal energy into electricity.
0 5 10 15 20 25 30 35 40 45
P2O5
KCl
NG
Herbicides
Transportation
Electricity
Gasoline
Custom work
LPG
Seeds
Diesel
CaO
Wastewater BOD
EtOH Plant Transport
Machinery
Nitrogen as Ammonia
Humus Oxid.
EtOH Plant Fuel
Equivalent Carbon Dioxide Emissions, g/MJ in EtOH
Figure 38: Equivalent CO2 emissions from each major non-renewable resource consumed by theindustrial Corn-EtOH cycle.
To convert the NOx emissions from the industrial corn-ethanol cycle to the equivalent CO2
emissions, I will follow the guidelines of EIA (2002), the Intergovernmental Panel on ClimateChange (IPCC) (1997), and EFMA (Biermann et al., 1999):
• 1.25% of applied N fertilizer escapes into the air as N2O.
• 30% of applied N escapes from the field, and 2.5% of that quantity is converted to N2O insurface water.
• 10% of applied N escapes as NH3 into the air, and 1% of that becomes N2O.
• Nitrous oxide is 300 times more potent as a greenhouse gas (GHG) than CO2.
• An average ammonia plant emits 0.03 kg N2O/kg N in nitric acid, which is used to makeammonium nitrate.
The equivalent CO2 emissions from the fertilized corn fields are then ∼950 kg/ha. The equivalentCO2 emissions from the production of ammonium nitrate are ∼150×0.03×300×63/80 = ∼1000kg/ha54.
54One may dispute this last number to the extent that ammonium nitrate is not used as fertilizer.

CRPS, 23(6), 2004 T. W. PATZEK 49
The CO2 emissions resulting from electricity use in the removal of Biological Oxygen Demand(BOD) in wastewater from ethanol refineries, cf. Section 6, are also included.
In addition I have made the following assumptions:
• Emissions from humus oxidation in soil eroded by wind are included with the following as-sumptions: (a) topsoil contains 4% of humus (Stevenson, 1982), (b) humus contains 50% ofC by weight (Stevenson, 1982), wind-eroded soil is enriched in humus by (1.3 + 5)/2 ≈ 3 onaverage (Allison, 1973), (c) wind erodes only 1 mm of topsoil per year, or 10 tonnes/ha-yr(Pimentel, 2006), and (d) the airborne humus is completely oxidized.
• To make the comparisons meaningful, methane, gasoline, and diesel fuel are now chargedwith incremental 17% (2% more than before) emissions for their recovery, transportation,and processing.
0 20 40 60 80 100 120 140
NRR in EtOH−Corn Cycle
Diesel Fuel
Gasoline Fuel
Methane Fuel
Equivalent Carbon Dioxide Emissions, g/MJ in Fuel
Fossil FuelsCorn FarmingEthanol PlantBOD Treatment
Figure 39: The total equivalent CO2 emissions from the consumption of nonrenewable resourcesby the industrial corn-ethanol cycle. The CO2 emissions from the energy-equivalent amounts ofmethane, gasoline and diesel fuel were increased by 17% to account for their recovery, transport,and refinement.
5.2 Conclusions
The results of my calculations, shown in Figures 38 and 39, lead to the following conclusions:
1. According to my estimates, 1 ha of industrial corn-for-ethanol generates 8955 kg of equivalentCO2 from the fossil fuel inputs and humus oxidation.

50 Thermodynamics of corn-ethanol biofuel. . . Web Version
2. If the amount of gasoline with the energy content of 117% of 2498 kg EtOH/ha obtained onaverage from corn were burned, it would generate 5817 kg of CO2.
3. The net equivalent CO2 emissions are then 8955−5817 ≈ 3100 kg/ha above those of gasoline.
4. Today, the industrial corn-ethanol cycle generates on 4.9 million hectares about 15.4 millionmetric tonnes of equivalent CO2/year over and above the energy-equivalent gasoline.
5. To satisfy 10% of U.S. fuel consumption, the additional equivalent CO2 emissions will beabout 127 million metric tonnes per year.
6 Water Cycle
Water vapor
Contaminatedwater
Treatment
Evapora
tion
WasteH2O
RainIrrigation
Evapotranspiration
Runoff & seepage
Water tank
Treatment
Pure EtOH
CO2
Corn+stalk,leaves, roots
Dried corn
EtOH+H2O
Combustion
Distillation
Fer
men
tation
Harvesting & Drying
Industrial
farmin
g
Figure 40: The water cycle in corn-ethanol production. Compared with the water requirement bycorn plants, the feed water requirement of an ethanol-producing plant is small, and the link betweenthe tank and the fermentation stage was not drawn. Adapted from Figure 7 in Berthiaume et al.(2001).
The water cycle can be idealized by bringing all necessary water to an imaginary “water tank”at the top of Figure 40. The water is then dispensed from this tank as rain, irrigation water, andethanol plant feed water. Water is used by the corn plants, but it also evaporates from the fields,runs off as contaminated surface water, and seeps back into the groundwater, contaminating theunderlying aquifers as well. Additional water is evaporated during drying of the harvested corn inNG/LPG driers.
To estimate the average water requirement by corn plants, I will use Pimentel’s (2003) averageestimate of ∼100 cm of water per crop55. This translates into 10 × 106 L/ha-crop. About 15%
55The rule of thumb is that corn needs 1000 – 1800 kilograms of water per kilogram of grain produced. This

CRPS, 23(6), 2004 T. W. PATZEK 51
of the water demand (USDA, 1998), 8.1 × 10⁵ L/ha-crop, comes from pumping groundwater andsurface water to irrigate corn. For comparison, the average water requirement by corn in Nebraskais 53-71 cm, and roughly 50% of corn acreage is irrigated there (Benham, 1998). Nebraska sits ontop of the most prolific part of the giant High Plains aquifer (USGS, 2003; Rosenberg et al., 1999).Water mining from the High Plains aquifer continues in Texas, Kansas, Oklahoma, New Mexicoand Colorado, while the water levels in Nebraska and Wyoming have stabilized or increased, seeUSGS (2003) and the references therein.
To estimate the water inputs into a wet-milling ethanol plant I will use the data published in theCorn Chemistry and Technology Handbook (White and Johnson, 2003) and by Pimentel (2003).According to White and Johnson (2003), one needs the following amounts of process water per1 liter of ethanol:
• 10-12 liters in corn fractionation (p. 450).
• 20-25 liters in glucose fermentation (p. 697).
• The total amount is 30-37 liters of clean process water per 1 liter of ethanol, or 38-46 litersof water per kilogram of ethanol.
• The average 5-day biochemical oxygen demand (BOD) of waste water is 1000-2000 mg/L.
According to Pimentel (2003), 159 liters of water are needed to produce 1 liter of 95% ethanol,which translates to 190 liters of water per kg of 100% ethanol. Twelve liters of waste-water aregenerated per 1 liter of ethanol from the separation of industrial beer with 8 percent of ethanol byvolume. The wastewater BOD is 18000-37000 mg/L, 10-20 times higher than the previous estimate.This estimate makes sense because the beer wastewater contains dead yeast and unreacted glucose.After mixing with cleaner process water, the overall BOD must go down. Berthiaume et al.(2001), erroneously use 160 L of wastewater per L of EtOH, with the BOD of 20000 mg/L.
For the time being, I will go along with 46 L water/kg EtOH with the BOD56 of 2000 mg/L.Thus, a wet milling ethanol plant needs on average
46L
kg EtOH× 2499
kg EtOH
ha-crop= 0.11 × 10⁶ L
ha-crop, (23)
of water, and it generates 230 kg of BOD/ha-crop. This amount of process water is 100 timessmaller than the amount of water needed to grow corn in the field.
Remark 8 The industrial corn-ethanol cycle needs about 10× 106 liters of water per hectare andper crop. This amount of water must be deposited in the tank. Depending on the weather andlocation, some or most of this water may have to come from mining an aquifer or surface water. 2
Since the volume of process water passing through the ethanol plant is two orders of magnitudesmaller than that passing through the field, and all of the process water is readily accessible inholding tanks, ponds, etc., problems with cleaning it up are insignificant when compared with thefield runoff water.
rule translates into 86-150 cm of water requirement, see, e.g., http://www.jica.go.jp/english/publication/network/-net
−vol18/02.html.
56A Google search yields BOD values between 600 and 9200 mg/L in the wastewater streams from wet- and drymilling ethanol refineries that use different biomass feeds.

52 Thermodynamics of corn-ethanol biofuel. . . Web Version
Sola
rhν,∆
b0 ch
=+
2833
C6H12O6+6O2
6CO2
∆b0ch
= +119
∆b0ch
= −1612CO2+2C2H5OH+6O2
6CO2 C2H
5O
HC
om
bust
ion
∆b0 c
h=
−2672
6H2O6H2O
Figure 41: Exergy diagram of the ideal CO2-Glucose-EtOH cycle.
Remark 9 Industrial agriculture uses a huge land area, and it mines and contaminates hugeamounts of soil, water, and air. The environmental damage it causes is much more widespread andmore difficult to reign in than that from the highly-concentrated industrial sources. In addition,industrial agriculture invades and destroys large ecosystems. In other words, twenty-first centuryindustrial agriculture poses a more acute threat to life on the earth, than the nineteenth centurysmoke stacks ever did57. 2
7 Exergy Analysis of the Ideal Corn Ethanol Cycle
7.1 Chemistry of the CO2-Glucose-EtOH Cycle
The ideal CO2-Glucose-EtOH cycle consists of three steps:
Step 1 Photosynthesis of glucose from atmospheric CO2:
6CO2 + 6H2O + Solar radiation → C6H12O6 + 6O2 + Heat (24)
Step 2 Production of ethanol from glucose:
C6H12O6 + 6O2 → 2C2H5OH + 2CO2 + 6O2 + Heat (25)
Step 3 Combustion of ethanol:
2C2H5OH + 2CO2 + 6O2 → 4CO2 + 2CO2 + 6H2O + Heat (26)
The compounds that appear on both sides of the chemical reactions in Steps 2 and 3 do notparticipate in these reactions, but appear to close the cycle. The chemical exergies of all compoundsare listed in Table 20. The chemical exergies of the products of each step of the cycle are listedin Table 21, and the exergy flow is depicted in Figure 41.
57For an in-depth analysis of the deadly industrial agriculture, see Kimbrell et al. (2002).

CRPS, 23(6), 2004 T. W. PATZEK 53
7.1.1 The Maximum Cycle Output per Unit Mass of Corn
To calculate the maximum possible energy output from the ideal CO2-Glucose-EtOH cycle, I madethe following assumptions:
• Dry corn is 66% glucose (100% hydrolyzed starch) by mass.
• Starch is converted into ∼100% ethanol with 0% losses.
• Corn delivered to an ethanol plant is 15% water.
• The net chemical exergy of an ideal ethanol cycle per kg of moist corn grain is
15.74MJ
kg glucose× 0.66 ×
180
162
kg glucose
kg dry corn× 0.85
kg dry corn
kg wet corn= 9.81
MJ
kg wet corn(27)
• At ∼8600 kg of moist corn per hectare58, the chemical exergy from an industrial ethanolcycle is
9.81MJ
kg wet corn× 8590
kg wet corn
ha= 84.4 GJ/ha (28)
• With 91.5% overall conversion efficiency of starch into 100% ethanol, the chemical exergy is
84.4 GJ/ha × 0.915 = 77.1 GJ/ha (29)
Remark 10 The output of the industrial CO2-Glucose-EtOH cycle is the chemical exergy ofethanol equal to 77.1 GJ/ha-crop. This exergy can be transformed into useful work (e.g., shaftwork or electricity) by different devices. 2
For example, the efficiency of an excellent internal combustion engine is 35% (usually it is 20%)
Wu = 77.1 × 0.35 = 27.0 GJ/ha (30)
For fuel cell/electric motor vehicles the efficiency of conversion of chemical exergy to shaft work ishigher. Suppose that we could reform ethanol to hydrogen, and use a fuel cell with 60% efficiency59
(Deluga et al., 2004)Wu = 77.1 × 0.60 = 46.3 GJ/ha (31)
to obtain electricity, and shaft work.
8 Exergy Analysis of the Modified Ideal Corn-Ethanol Cycle
Now let us look at the useful exergy production in the modified ideal corn-ethanol-hydrogen cyclediscussed by Deluga et al. (2004). This cycle is essentially the same as the cycle described in Eqs.(24 – 26). The only difference is in Step 3, which is moderately endothermic, and lowers the cycleefficiency by one percent, see Figure 42. The chemical exergies of the products of each step of themodified cycle are listed in Table 22.
Step 3, reforming ethanol to hydrogen, is a catalytic variant of water-shift reaction:
58See Remark 6. Without synthetic fertilizers, I would have to use 1500 kg/ha-crop of corn as the average yield.59As shown by (Bossel, 2003a) and in Appendix D, a 60%-efficient PEM fuel cell-powered car cannot exist! The
real-life efficiency of such a car is about 38%. The reckless promoters of a hydrogen economy neglect to mention thisimportant downward correction.

54 Thermodynamics of corn-ethanol biofuel. . . Web Version
Sola
rhν,∆
b0 ch
=+
2833
C6H12O6+6O2+6H2O
6CO2
∆b0ch
= +119
∆b0ch
= −161
2CO2+2C2H5OH+6H2O+6O2
∆b0ch
= +184
4CO2+12H2+6O2+2CO2
6CO2
H2
Com
bust
ion
∆b0 c
h=
−2857
12H2O12H2O
Figure 42: Exergy diagram of the ideal CO2-Glucose-EtOH-H2 cycle.
Steps 3ab Ethanol oxidation to CO, and then CO2:
2C2H5OH + 2H2O → 4CO + 8H2 3a
4CO + 4H2O → 4CO2 + 4H2 3b(32)
Note that Deluga et al. (2004) use a somewhat different stoichiometry with 10H2 and 10H2O, butthis difference is insignificant.
Remark 11 The ideal CO2-Glucose-Ethanol-H2 cycle discussed in Deluga et al. (2004) producespractically the same amount of useful chemical exergy as the ideal CO2-Glucose-Ethanol cycle.Therefore, all conclusions pertinent to the latter hold for the former. 2
9 Resource Consumption and Waste Generation in the Industrial
Corn-Ethanol Cycle
Now I will focus my attention on the industrial corn-ethanol cycle depicted in Figure 36. In contrastto the sun-driven ideal cycle, the industrial cycle relies heavily on fossil energy. Therefore, a partWR of the useful work Wu, must be diverted to restore the non-renewable resources depleted bythe cycle, see Figure 43. As long as the useful work exceeds the restoration work, Wu > WR, theindustrial corn-ethanol cycle is beneficial, otherwise it is indefensible.
Remark 12 The depletion of concentrated natural resources is irrevocable, cf. Part II. Withoutcausing changes in the environment, we cannot remanufacture the depleted amounts of oil, methaneand coal in a reversible process, and put these fuels back into their deposits. Therefore, the reversiblerestoration work calculation provides the lowest estimate of the degree to which the irreversibleindustrial corn-ethanol cycle is also unsustainable. 2
From Definition 6, it follows directly that the minimum restoration work is equal to the sum ofthe cumulative exergy consumption (CExC) by all the processes that convert natural resources into

CRPS, 23(6), 2004 T. W. PATZEK 55
DegradedNon-Ren. Res.
Real EtOH Cycle
Non-Ren. Res.Restored
Chemical Waste
Wu
WR
Solar Radiation Heat
Figure 43: A part, WR, of the useful work, Wu, from the industrial corn-ethanol cycle is divertedto “undo” mining of the environment by this cycle. If Wu > WR, there is net benefit from theethanol biofuel, otherwise its use should be stopped. Adapted from Figure 4 in Berthiaume et al.(2001).
inputs of the industrial corn-ethanol cycle. The specific CExC for each such input is listed in Table23. For example, the CExC by the production of ammonium nitrate starts from natural gas inthe subsurface and nitrogen in the atmosphere, and continues by summing up all the intermediatesteps. Even though the chemical exergy of ammonium nitrate is only 10.51 MJ/kgN, the cumulativeexergy consumption to produce it is almost 10 times larger. The CExC by electricity generation isbased on the average exergy efficiency of ten large modern power stations in the U.S. (Gill, 1984;Termuehlen and Emsperger, 2003).
Remark 13 Currently, the fossil fuels are mined from very concentrated deposits and upgradedin very large and efficient plants. Therefore, their CExC’s are relatively small. As the rich crudeoil and natural gas deposits are depleted, in part to fuel extravagant and politically-driven projectssuch as corn-ethanol in the U.S., the CExC by gasoline, diesel fuel, and clean natural gas willincrease dramatically. I will address this looming problem elsewhere. 2
The total CExC for each input is the product of the specific value in Table 23 (in MJ/kg)multiplied by the flux (in kg/ha-crop) estimated in Part I. The CExC by cleanup of the watercontaminated in the industrial ethanol cycle was not yet considered, and will be discussed now.
9.1 Cleanup of BOD in Ethanol Plant Wastewater
The CExC by the cleanup of ethanol plant wastewater is the product of the total biological oxygendemand (BOD) in the wastewater stream in kg O2/ha-crop, and the specific CExC by BOD removalin MJ/kg O2. As discussed in Section 6, the total BOD is
BOD = 46L water
kg EtOH× 0.002
kg O2
L water× 2499
kg EtOH
ha-crop= 230
kg O2
ha-crop(33)

56 Thermodynamics of corn-ethanol biofuel. . . Web Version
0 10 20 30 40 50
NG
Transportation
P2O5
Herbicides
Custom work
KCl
Gasoline
LPG
Electricity
Seeds
CaO
Diesel
Machinery
EtOH Plant Transport
Wastewater BOD
Nitrogen
EtOH Plant Fuel
CExC, GJ/ha
Figure 44: The specific cumulative exergy consumption (CExC) by each major non-renewableresource input to the industrial corn-ethanol cycle.
After Berthiaume et al. (Berthiaume et al., 2001), I will base the specific CExC of BOD on asurvey of energy consumption in municipal wastewater treatment facilities in the Canadian provinceof Quebec. According to Blais et al. (1995), an average electricity consumption of 4.13 kWh perkg of BOD removal was observed there.
I have used these estimates in the CO2 emission calculations shown in Figures 38 and 39.
9.2 Cleanup of Contaminated Field Runoff Water
Analysis of the cumulative exergy consumption in the cleanup of contaminated agricultural waterthat
• Seeps into the aquifers, causing, e.g., the omnipresent nitrate contamination of groundwaterin the Corn Belt (Patzek et al., 2005), and
• Runs off to streams, rivers, into the Mississippi River, and to the Gulf of Mexico, generatinga large anoxic zone there,
is the subject of future research and will not be discussed here.
The Second Law of thermodynamics puts a high price on concentrating and removing dilutecontamination, especially from the subsurface. Therefore the restoration work of cleaning up thefield runoff water will be several orders of magnitude larger than that of the ethanol plant runoffwater.
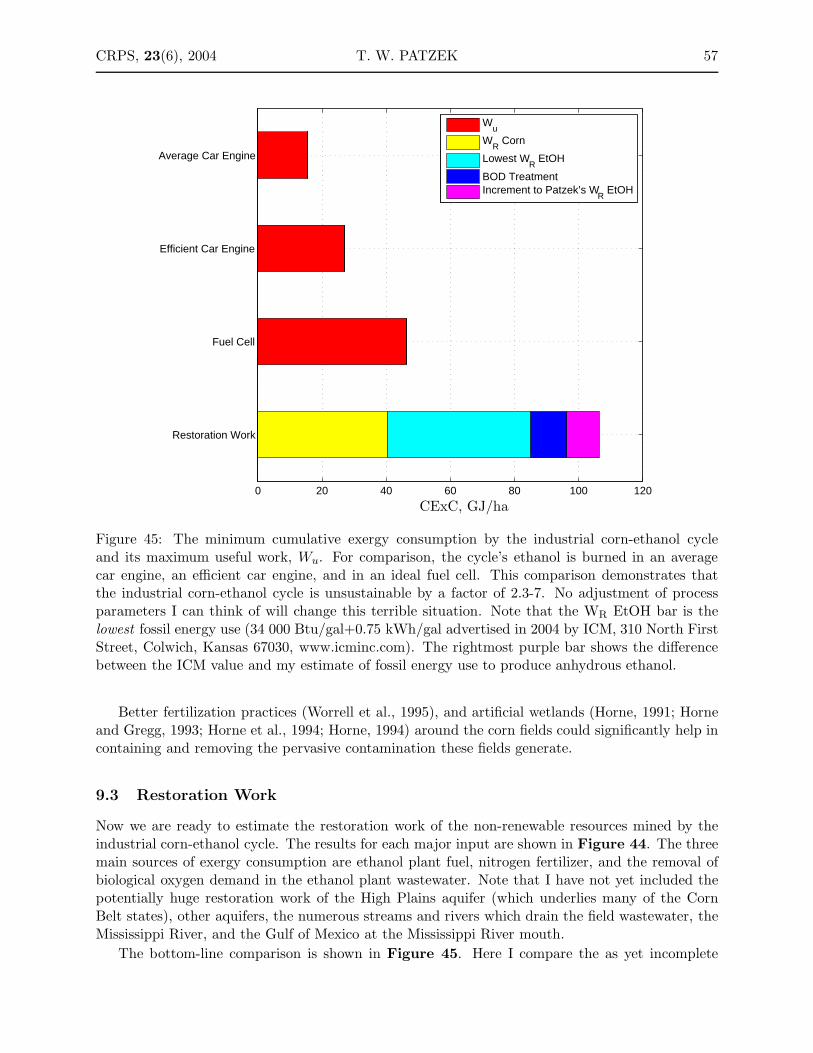
CRPS, 23(6), 2004 T. W. PATZEK 57
0 20 40 60 80 100 120
Restoration Work
Fuel Cell
Efficient Car Engine
Average Car Engine
W
u
WR
Corn
Lowest WR
EtOH
BOD TreatmentIncrement to Patzek’s W
R EtOH
CExC, GJ/ha
Figure 45: The minimum cumulative exergy consumption by the industrial corn-ethanol cycleand its maximum useful work, Wu. For comparison, the cycle’s ethanol is burned in an averagecar engine, an efficient car engine, and in an ideal fuel cell. This comparison demonstrates thatthe industrial corn-ethanol cycle is unsustainable by a factor of 2.3-7. No adjustment of processparameters I can think of will change this terrible situation. Note that the WR EtOH bar is thelowest fossil energy use (34 000 Btu/gal+0.75 kWh/gal advertised in 2004 by ICM, 310 North FirstStreet, Colwich, Kansas 67030, www.icminc.com). The rightmost purple bar shows the differencebetween the ICM value and my estimate of fossil energy use to produce anhydrous ethanol.
Better fertilization practices (Worrell et al., 1995), and artificial wetlands (Horne, 1991; Horneand Gregg, 1993; Horne et al., 1994; Horne, 1994) around the corn fields could significantly help incontaining and removing the pervasive contamination these fields generate.
9.3 Restoration Work
Now we are ready to estimate the restoration work of the non-renewable resources mined by theindustrial corn-ethanol cycle. The results for each major input are shown in Figure 44. The threemain sources of exergy consumption are ethanol plant fuel, nitrogen fertilizer, and the removal ofbiological oxygen demand in the ethanol plant wastewater. Note that I have not yet included thepotentially huge restoration work of the High Plains aquifer (which underlies many of the CornBelt states), other aquifers, the numerous streams and rivers which drain the field wastewater, theMississippi River, and the Gulf of Mexico at the Mississippi River mouth.
The bottom-line comparison is shown in Figure 45. Here I compare the as yet incomplete

58 Thermodynamics of corn-ethanol biofuel. . . Web Version
cumulative exergy consumption by the industrial corn-ethanol cycle with the cycle’s maximumuseful work performed by three different machines. This comparison reveals that the corn-ethanolcycle consumes 2.3-7 times more exergy than it replaces.
The lowest deficiency of the cycle, by a factor of 2.3, is realized by employing an imaginary60%-efficient Proton-Exchange Membrane (PEM) fuel cell to power a car. As shown in AppendixD and elsewhere, such a cell simply cannot exist (Bossel, 2003b). Real fuel cells are 2-3 ordersmore expensive than a car engine, 10 times less reliable, and may never be mass-produced (Keithand Farrell, 2003; Dresselhaus et al., 2003; Bossel et al., 2003; Davis et al., 2002). A 35%-efficientinternal combustion engine produces 4 times less useful work than the restoration work, and today’saverage car engine produces 7 times less work. Note that if one uses the lowest advertised (but notnecessarily true) value of fossil fuel consumption to produce anhydrous ethanol, these factors are2, 3, and 6 respectively.
Remark 14 No matter how efficient the engine is that transforms the industrial corn-ethanolcycle’s output into shaft work, the cycle remains utterly unsustainable and unattractive as a sourceof fossil fuel. 2
10 Conclusions
• Excluding the restoration work of decontaminating aquifers, rivers, and the Gulf of Mexico,the minimum cumulative exergy consumption in restoring the environment polluted anddepleted by the industrial corn-ethanol cycle is over 7 times higher than the maximum shaftwork of a car engine burning the cycle’s ethanol.
• This unfavorable ratio decreases to ∼4, when an efficient internal combustion engine is usedto burn the ethanol, and to 2.3 when an imaginary hydrogen fuel cell is used.
• The industrial corn cycle is not renewable, and is unsustainable by a wide margin (at least2.3 – 7 times).
• No process changes can make this cycle more viable.
• The annual corn-ethanol biofuel production is a human assault on geologic processes and thegeologic time scale, and it can never work.
• The limiting factors, nutrient-rich humus and water that carries the dissolved nutrients toplant roots are augmented by chemicals obtained in the linear, irreversible fossil fuel-basedprocesses.
• Over the last fifty years, corn yield has grown five-fold, mostly because of the steep increasesin fertilization rate of corn fields.
• Sunlight is not a limiting factor, and could be used to great benefit if we were in less of ahurry, cf. Appendix C.

CRPS, 23(6), 2004 T. W. PATZEK 59
In vain, through every changeful year,
Did Nature lead him as before;
A primrose by a river’s brim
A yellow primrose was to him,
And it was nothing more.
— WILLIAM WORDSWORTH, Peter Bell (1819)
The outside world is something independent from man, something absolute, and the
quest for the laws which apply to this absolute appeared
to me as the most sublime scientific pursuit in life
— MAX PLANCK
Scientific Autobiography, and Other Papers (1949)

60 Thermodynamics of corn-ethanol biofuel. . . Web Version
Part IV
Other Problems with Corn-Ethanol
1 Introduction
The results obtained in Part I and III can now be used to estimate the annual subsidies of theU.S. corn-ethanol biofuel. These subsidies fall into two categories: (1) the monetary subsidies bythe U.S. Federal Government and State Governments to corn and ethanol producers, and (2) thenon-monetary contributions of the U.S. population and environment polluted and mined by theindustrial corn-ethanol cycle.
The first type of subsidy is easy to estimate:
• The U.S. pays its corn farmers $10 billion a year in subsidies60 (13% of corn acreage in nowdevoted to ethanol).
• The federal excise taxes per gallon of fuel61: $0.184 for gasoline and $0.132 for EtOH-10 (10vol% ethanol).
• Relative to gasoline, the federal tax breaks per 1 gallon of ethanol are
10 × ($0.184 − $0.132) = $0.52
• The state excise taxes per gallon of fuel vary widely and their volume-weighted average isdifficult to estimate:
– Gasoline $0.075 in Georgia, up to $0.36 in Connecticut
– EtOH-10 $0 in Arizona, up to $0.2535 in West Virginia
– Minnesota offers a $0.20 tax subsidy on EtOH-10. The state’s 13 ethanol refineries havereceived up to $3 million a year62.
• I will assume that the average state subsidy is only $0.10/gallon of ethanol. It is likely thatthe state subsidies of corn growers, ethanol producers, and EtOH-10 excise tax breaks areseveral times higher than my estimate.
The second type of subsidy can only be estimated by comparing the maximum useful output ofthe corn-ethanol cycle with the minimum restoration work necessary to undo the cycle’s negativeimpact on the environment.
2 First-Law View of Corn-Ethanol Production in 2004
In February 2004, the U.S. ethanol industry set an all-time monthly production record of 212,000barrels per day (b/d) (12.3 GL/year), according to data released by the U.S. Energy InformationAdministration (EIA), the Renewable Fuels Association (RFA) reported. The previous all-timerecord was 211 000 b/d in the previous month. Production was up 25 percent compared to lastFebruary when 169 000 b/d (9.8 GL/year) of ethanol were produced.
60Corn subsidies, OXFAM.61Excise Taxes, Reuters, Washington, Nov. 15, 2003.62Cat Lazaroff - ENS, 3 Oct., 2002.

CRPS, 23(6), 2004 T. W. PATZEK 61
0 0.5 1 1.5 2
State EtOH subsidies
Federal corn subsidies
Federal EtOH subsidies
Environment mining
Billion U.S. Dollars per Year
Figure 46: The U.S. environment and taxpayers subsidize corn growers and ethanol producers. TheU.S. rural population, soil, water, air, plants, fish and wildlife pay the most.
“U.S. ethanol producers are doing everything they can to add much needed volume and octaneto the U.S. gasoline market, thereby helping to hold down gasoline prices,” said RFA PresidentBob Dinneen. The ethanol industry is expected to produce more than 3.3 billion gallons in 2004,up from 2.81 billion gallons in 2003. Currently, 75 ethanol refineries have the capacity to producemore than 3.2 billion gallons annually. Thirteen additional plants under construction will add 500million gallons of annual production capacity, RFA said.
The highlights of the U.S. corn-ethanol production in 2004 are listed in Table 24. Note thatthe 12.3 GL/yr of corn-ethanol replace only 9.2 GL/yr of gasoline equivalent (GE), and require10.1 GL/yr of GE to produce. Corn-ethanol brings no energy savings and no lessening of the U.S.energy dependency on foreign crude oil, natural gas, and liquified petroleum gas. The oppositehappens, we import more methane, LPG, and crude oil. We then burn these fuels to producecorn-ethanol and, finally, we burn the ethanol in our cars, causing extensive environmental damageat each stage of the industrial corn-ethanol cycle. Also note that the ethanol and corn tax-subsidiesprojected for 2004, will be 10 times higher than the total political contributions of Agribusinessover the last 14 years63.
3 Second-Law View of Corn-Ethanol Production in 2004
Second Law exergy analysis brings into the picture the significant contribution of the environmentto corporate profits. Depending on which thermodynamic device transforms the chemical exergy
63According to the Center for Responsive Politics, http://www.opensecrets.org/industries/indus.asp?Ind=A, be-tween 1990 and 2005, Agribusiness paid $355 534 846 to elected officials, 31% to Democrats and 69% to Republicans.The peak donations occurred in the 2000 and 2002 election cycles, exceeding 59 and 54 million dollars, respectively.The 2004 election cycle donations exceeded 53 million dollars.

62 Thermodynamics of corn-ethanol biofuel. . . Web Version
of corn-ethanol into useful work, the difference between the minimum restoration work and themaximum useful work by the cycle will vary. This difference in GJ/ha, can be translated roughlyinto $/ha, and into the cumulative environmental cost of the industrial corn-ethanol cycle. Thehidden cost of mining the environment by the industrial corn-ethanol cycle is real, but rarelymentioned. According to the RFA President Bob Dinneen, ethanol displaces imported crude oil.Therefore, to arrive at an estimate of corn-ethanol’s environmental costs, I assume that the totalexergy deficit will be “paid” with the imported crude oil, whose price in the first half of 2004 wasclose to $35/barrel. I also assume that 1 barrel of oil is 136 kg of 350 API oil, with the specificenergy content of 45 MJ/kg. The results are listed in Table 25.
In 2004, the environment has contributed an estimated 1.8 billion dollars per year by beingcontinuously and irrevocably damaged and depleted. This huge gift to the corporate coffers from theU.S. rural population, soil, water, air, plants, and wildlife is as real as the federal tax subsidies. The60%-efficient fuel cell car does not exist now, or in the future (Bossel, 2003b; Patzek and Pimentel,2006). But even if in the next 20-years we were to replace all existing cars with efficient fuel cellcars, the environment’s contribution would still be $1.2 billion per year. If 10% of fuel consumptionin the U.S. were supplied by corn-ethanol, the annual contribution from the environment would be$12 billion.
Again, my current estimate should be viewed as the lowest bound on the environmental costs fortwo reasons: (1) The true restoration work is irreversible and significantly larger than the reversiblerestoration work, and (2) I have not yet calculated the minimum reversible work of restoring surfaceand ground water, and soil contaminated by the corn field runoff water.
31/01 28/02 31/03 30/04 31/05 30/06 30/07 31/08 30/09 31/10 30/11 31/120
5
10
15
20
25
30
35
40
45
50
2000 Max 0.182001 Max 0.192002 Max 0.172003 Max 0.23
Exce
edan
ce,%
Figure 47: The cumulative one-hour exceedances of maximum legal ozone level in Southern Cali-fornia. Source: Cal Hodge, President of A 2nd Opinion, Inc.
All the subsidies to corn growers, ethanol producers and distributors are compared in Figure46.

CRPS, 23(6), 2004 T. W. PATZEK 63
4 Public Health Problems
The stated goal of adding ethanol from corn to gasoline was to help in cleaning the air we breatheand lessen the U.S. dependence on foreign oil. The opposite is achieved. Air becomes more polluted,and as much oil and more methane are burned as without the corn-ethanol. At the same time,additional health hazards are created by the agricultural chemicals, fertilizers, insecticides andherbicides, and by the waste water streams.
For example, in 2002, twelve Minnesota ethanol refineries agreed to spend $2 million per plant,pay penalties of $29,000-$39,000, and limit the following air emissions64
• Volatile organic compounds by 2400 - 4000 tons per year,
• Carbon monoxide emissions by 2000 tons per year,
• Nitrogen oxides emissions by 180 tons per year,
• Particulate matter by 450 tons per year,
• Other hazardous air pollutants by 250 tons per year.
Ethanol-in-gasoline seriously pollutes the air (Hodge, 2002). The reactivity of the combinedexhaust and evaporative emissions using the ethanol-blended reformulated gasoline is estimatedto be about 17% larger than those using the MTBE-blended reformulated gasoline (NRC, 1999).Ethanol does reduce the carbon monoxide emissions, but increases those of nitrogen oxides (NOx),acetaldehyde, and peroxy-acetyl-nitrate (PAN) (Rice et al., 1999). The negative effects of usinggasoline-ethanol blends are clearly seen in Southern California, where ozone levels in the air ex-ceeded the one-hour legal limits more often, see Figure 47. By 2003, over 70% of gasoline producedin Southern California was blended with ethanol.
In 2004, the California Air Quality Board completed a study (Hancock, 2005) in which thefuel systems of several vehicles were tested for diurnal evaporative permeation emissions with fuelscontaining MTBE and EtOH. The results were applied to the existing fleet in the South CoastAir Basin and Sacramento. Their analysis showed a 17-ton-per-day (ton/d) increase in the SouthCoast Air Basin on an ozone episodic day, an increase of 14% for evaporative emissions. For theSacramento Metropolitan area, the increase in evaporative emissions due to ethanol was estimatedto be 18% and 2.4 ton/d. In an earlier draft report, the California Air Quality Board concluded(ARB, 2005) that in the South Coast Air Basin alone, the removal of ethanol oxygenate fromthe reformulated gasoline CaRFG3 would decrease hydrocarbon emissions by 27.4 ton/d, NOx
emissions by 6.7 ton/d, and increase CO emissions by 1.4 tons/d. So much for the cleaner air. . .
Friends, Romans, countrymen, lend me your ears;
I come to bury Cæsar, not to praise him.
The evil that men do lives after them;
The good is oft interred with their bones;
— WILLIAM SHAKESPEARE
Julius Cæsar Act 3, Scene 2,
(1599)
64Cat Lazaroff - ENS, 3 Oct 2002.

64 Thermodynamics of corn-ethanol biofuel. . . Web Version
Part V
Summary & Conclusions
The purpose of this paper was to prove beyond any reasonable doubt that the industrial corn-ethanolcycle accelerates the irrevocable depletion of natural resources: fossil fuels, minerals, top soil,surface and subsurface water, and air, while creating wide-spread environmental damage throughoutthe continental United States. My arguments relied entirely on the First and Second Law ofthermodynamics, and on the Law of Mass Conservation.
I have tried to avoid political questions, but at some point one should ask how it was possible fora poor agri-industrial technology to grow so explosively in the last four years? The only plausibleanswer lies in politics. The recent growth of ethanol production could occur only because ofthe massive transfer of money from the collective pocket of the U.S. taxpayers to the transnationalagricultural cartel, represented most notably by Archer Daniel Midlands Co., Cargill Inc., MonsantoCo., and A. E. Stanley Manufacturing Co. This flow of billions of dollars from the pockets of themany to the pockets of the few was accomplished by federal subsidies of corn producers, and thefederal and state tax subsidies of ethanol producers. It was spearheaded by many powerful, and Iwould like to think, thoroughly misinformed politicians.
More ominously, as a country, we have diverted our collective attention from the most importantissue of this century: energy conservation and increased reliance on the only renewable source ofenergy, the sun, and its weak derivative, the wind, see Appendix C. Instead, we have somewhataccelerated the rate of depletion of the precious natural gas and crude oil deposits, in exchange forthe significantly more wide-spread pollution of water, soil and air over roughly 1/2 of the area ofthe United States, the incremental carbon dioxide emissions, the substandard ethanol fuel, and thecontinuous drain of taxpayers’ money.
To make things worse, the scientific community in the U.S. seems to be preoccupied withpromulgating empty illusions of a future global energy bliss brought about by the new and sexy,but inherently unsustainable technologies. The ethanol biofuel for hydrogen (Deluga et al., 2004),the fossil fuel-based “hydrogen economy” (Davis et al., 2002; Bossel et al., 2003; Dresselhaus et al.,2003; Keith and Farrell, 2003; Tromp et al., 2003; DOE, 2003), the subsurface carbon dioxidesequestration (Celia, 2002), etc., come to mind. I suggest that we – the scientists – should insteadbe advocating the simpler and less expensive, but painful, real solutions of the overwhelmingenergy problems facing the world. These solutions must involve far more energy conservation inevery aspect of the U.S. economy, and the significantly increased reliance on the sun.
The philosophical, ethical, and political arguments ought to be developed further, but I willleave this task to the others, see e.g., the transcript of an excellent speech by Nicholas E. Hollis,Ethics and Agribusiness – In Search of the New Food Security, given in Newcastle-on-Tyne, UnitedKingdom, March 15, 2004. Here I will only reiterate the following:
1. The industrial corn-ethanol cycle brings no energy savings and no lessening of the U.S. energydependency on foreign crude oil, natural gas, and liquified petroleum gas. The oppositehappens, (a) we import somewhat more methane, LPG, and crude oil; (b) we burn thesefossil fuels to produce corn and ethanol; and (c) we burn the corn ethanol in car engines. Allthree steps of this cycle increase the extent of environmental damage beyond that caused byburning the same fossil fuels directly in the cars.
2. The industrial corn-ethanol cycle generates more carbon-dioxide equivalents than would begenerated by the energy-equivalent quantity of gasoline or diesel fuel penalized by 15% to

CRPS, 23(6), 2004 T. W. PATZEK 65
account for the cumulative use of free energy in their production. Currently these incrementalemissions are about 11 million tonnes of equivalent CO2 per year.
3. The taxpayers’ subsidies of the industrial corn-ethanol cycle are estimated at $3.5 billion in2004. The parallel subsidies by the U.S. environment are estimated at $2.0 billion in 2004.The latter estimate will increase manifold when the restoration costs of aquifers, streams andrivers, and the Gulf of Mexico are also included.
4. The rate of sequestration of the unlimited solar energy as organic plant matter is controlledby the availability of water in soil and the minerals dissolved in this water. For the reasonsexplained in this paper, water and soil nutrients are finite, easily degradable, and must bereplenished by decomposing all corn plant leftovers, including the byproducts of ethanolproduction.
5. The mass balance of starch in dry corn grain sets the theoretical efficiency of conversion ofcorn to ethanol to 0.374 kg EtOH/kg dry grain (0.475 L EtOH/kg dry grain), or to 3.19gallons EtOH/dry bushel = 2.71 gallons EtOH/equivalent bushel of corn with 15% moisture.
6. A 4-year average of the ethanol industry reported yields is 2.477 gal EtOH/wet bushel, or91.5% of the theoretical average.
7. Therefore, the commonly accepted USDA estimate of ethanol yield, 2.682 gallons EtOH/bushel(Shapouri et al., 2002b) is inconsistent with the industry data and too high.
8. All considered analyses of the fossil energy inputs into the industrial corn-ethanol cycle (Wanget al., 1997; Shapouri et al., 2002a; Pimentel, 2003; Berthiaume et al., 2001; Patzek et al.,2005) have been corrected and/or amended, as detailed in Part I.
9. With the corrected estimates of the fossil fuel inputs to corn farming and ethanol production,and using the high heating values of fossil fuels, three published estimates predict that pro-duction of corn-ethanol is the fossil energy losing proposition, and two show slight surpluses,see Figure 19. When the low heating values are used, all published analyses show that thecorn ethanol’s calorific value is less than those of the fossil fuels (Patzek, 2004).
10. In view of Conclusion 4, the robust ∼30% energy credits for ethanol production used in (Wanget al., 1997; Shapouri et al., 2002a) are indefensible. In Part II, the Second Law analysis ofthe industrial corn-ethanol cycle reaffirms this conclusion.
11. The mere energy balance of the industrial corn-ethanol cycle does not take into accountthe cumulative consumption of the non-fossil environmental resources: soil, water, air andminerals, and provides an incomplete picture of this cycle.
12. Because all published First Law balances of the industrial corn-ethanol cycle have been in-complete by definition, their comparison has led to different interpretations, and endlessacrimonious debate, see e.g., (Patzek et al., 2005), which served little useful purpose. Worseyet, this debate has diverted our collective attention from the real problems with corn-ethanoland provided cover for the ethanol lobby.
13. Only when the Second Law of thermodynamics and the concept of available free energy, orexergy, are introduced (Parts II and III, Appendix A and B), a definitive analysis of theindustrial corn-ethanol cycle is possible.

66 Thermodynamics of corn-ethanol biofuel. . . Web Version
14. In the Second Law analysis, the environment is defined as anything but the top soil of thecorn field, the corn plants, the ethanol-producing plants, and the devices that process theethanol (internal combustion engines and fuel cells). The environment, therefore, is the sun,water, air, nutrients, crude oil, methane, coal, electricity, field chemicals, roads, trucks, etc.,and the cold universe to which the heat generated by the cycle’s ethanol is rejected. Thus,the environment defined here cannot be dismissed summarily as the raving of a green lunatic.
15. From the definitions of irreversibility and sustainability (Part II, Appendix A and B), it followsclearly that the industrial corn-ethanol cycle, which relies heavily on mining the environment,is irrevocable and unsustainable. The common references to the cycle sustainability, see, e.g.,(Deluga et al., 2004), are scientifically indefensible.
16. In view of Conclusion 4, the recently-advertised ethanol production from “agricultural waste,”i.e., from plant leaves, stems, and roots is even more unsustainable.
17. Because the industrial corn-ethanol cycle is irrevocable, the precious natural resources wastedby it disappear forever from the earth, and diminish the wellbeing of future generations.
18. The free energy available on the earth (exergy) is consumed by the industrial corn-ethanolcycle. The cumulative net consumption of the exergy is a good quantitative indicator of thedegree of unsustainability of this cycle.
19. The maximum useful free energy generated by the industrial cycle, 77.1 GJ/ha as corn-ethanol, produces useful shaft work, electricity, or both.
20. When an average car engine (20% efficiency) burns corn-ethanol, it produces 15.4 GJ/ha ofuseful work. A very efficient car engine (35% efficiency) produces 27.0 GJ/ha of useful work.An imaginary fuel cell/electric motor car with 60% efficiency, produces 46.3 GJ/ha of usefulwork (see Appendix D).
21. The maximum useful work from the industrial corn-ethanol cycle has been compared withthe minimum reversible work required to undo the environmental damage caused by thiscycle. Of course, this environmental damage cannot be undone in reality, and the minimumreversible restoration work is only a tool used to quantify the damage.
22. The cumulative exergy consumption in performing the minimum reversible work of “undoing”the industrial corn-ethanol cycle, exceeds by a factor 7, 4 and 2.3, respectively, the maximumuseful work from a 20%-efficient car engine, 35%-efficient car engine, and a nonexistent 60%-efficient fuel cell car.
23. No process change can improve the very unfavorable ratio of benefits from the industrialcorn ethanol cycle to its environmental costs, and I have not yet included the exponentiallygrowing costs of restoring surface and ground water, and soil contaminated by the fertilizer-,pesticide- and insecticide-rich runoff from the corn fields.
24. More attention should be devoted to harvesting the only renewable source of energy on theearth: sunlight. An inefficient solar cell that continuously operates at moderate latitudeproduces ∼100 times more electricity than a corn ethanol-burning fuel cell (see Appendix C).Somewhat better, more durable and cheaper solar cells that are distributed worldwide woulddramatically increase the chances of long-term survival of our civilization.

CRPS, 23(6), 2004 T. W. PATZEK 67
25. One hectare of solar cells placed anywhere can free 100 hectares of fertile agricultural land fromindustrial corn, and allow for the low-intensity, diversified, and almost sustainable agriculture.
17 Now I beseech you, brethren, mark them which cause divisions and
offences contrary to the doctrine which ye have learned; and avoid them.
18 For they that are such serve not our Lord Jesus Christ, but their own belly;
and by good words and fair speeches deceive the hearts of the simple.
— THE EPISTLE OF PAUL THE APOSTLE TO THE ROMANS,
(The New Testament)

68 Thermodynamics of corn-ethanol biofuel. . . Web Version
Acknowledgements
More than 60% of the work presented in this paper was performed at TU Delft, where I was aVisiting Professor at the Earth Sciences Department between February and June 2004. I would liketo thank Prof. Jan-Dirk Jansen for hosting me and arranging financial support from TU Delft. Ithank the bright and intellectually engaged Freshman Students at U.C. Berkeley, who attended myFreshman Seminars in Spring and Fall 2003, and greatly contributed to the ideas presented here.I thank Prof. David Pimentel of Cornell for patiently answering my endless questions, critiqueof my arguments, reviews of the evolving manuscript, and kind words of encouragement. I thankProf. Clayton J. Radke of U.C. Berkeley for his critique of the early versions of the manuscriptand suggestions of numerous improvements. Prof. Radke’s persistent skepticism has sharpenedmy arguments immeasurably. I also thank my son Lucas J. Patzek, a biochemistry senior atU.C. Santa Cruz, for meticulously correcting and improving the manuscript, as well as mitigatingmany of my statements.
Subsequent to the CRPS article publication, Dr. Drew Ronneberg of Technology and Man-agement Services, Inc. has pointed out my error in calculating the theoretical efficiency of ethanolproduction from corn, kindly provided me with additional information about corn ethanol refineries,and highlighted the incompleteness of Jevons’ arguments about coal production.

CRPS, 23(6), 2004 T. W. PATZEK 69
A Examples of Entropy Production and Disposal
The Rate of Entropy Export by the Earth
In the simplest model, the earth is in thermal equilibrium; continuously heated by the sun’s radia-tion, and cooled by the infrared radiation into the universe.
The solar constant is the power collected at the top of the earth atmosphere by a unit area (1m2) perpendicular to the light path. This power is remarkably constant, see e.g., (Hickey et al.,1980), and equal to q = 1370 Watts65 per square meter (W/m2). The projection of the sun-litearth hemisphere in the direction perpendicular to the sun light is πr2
e , where re = 6371 km is themean volumetric earth radius, or 1/2 of the hemisphere area, and 1/4 of the earth surface area(Ae ≈ 510 × 106 km2).
The Planck temperature of the sun’s radiation is Ts ≈ 5700 K, and the Planck temperatureat which the earth radiates its heat is Te ≈ 254 K66. The earth reflects about 30% of the sunradiation, so its surface is reached by only 0.7 of the solar energy. Therefore, the time-averagedflux of entropy exported by the earth into the universe is
jES =
∆S
4πr2e
=4
30.7q
1
4
(1
Te
−1
Ts
)
= 1.20 W/K-m2 (34)
where the factor 4/3 comes from the Stefan-Boltzmann law67. This estimate agrees very wellwith the jE
S = 1.2 W/K-m2 reported by Prof. Arne Stahl (1996).
The Simplest Climate Model
The earth is in thermal equilibrium:
Rate of energy input from the sun = Rate of energy radiation by the earth
Ein = Eout = P = const(35)
Similarly to Frondel, Oertel and Rubbelke (2002), I assume that the earth’s atmosphereis a heat-transporting68 gas layer. The surface temperature of the earth is T0 and the Planck
temperature of its radiation is Te. The stationary heat flow through the atmosphere occurs at aconstant rate:
P = kAe(T0 − Te) (36)
where Ae is the surface area of the earth. In this simple model, the steady-state rate of energyexport from the earth depends on the mean temperature difference between the earth surface andthe uppermost atmosphere. The overall heat transfer coefficient, k, depends on how effectively theatmosphere transports heat. With the increasing concentration of heat absorbers (the greenhousegases) this coefficient decreases, and the earth temperature must go up.
At steady state, Second Law of thermodynamics requires the entropy flow rate to satisfy thefollowing equation:
P = T0S0 = TeSe (37)
651 Watt = 1 Joule/second.66The actual temperature of the earth surface is about 34 K higher due to the greenhouse effect. Therefore there
is entropy generation in the atmosphere, see the section below.67See Szargut’s monograph, (1988), page 72, Eq. (2.53).68Heat transport through the atmosphere proceeds through turbulent convection and mixing, water evaporation
and condensation, thermal conduction, and radiation.
70 Thermodynamics of corn-ethanol biofuel. . . Web Version
where S0 is the rate of entropy change near the earth surface, and Se is the rate of entropy change atthe outer layers of the atmosphere. Therefore, the net rate of entropy generation in the atmospheredue to energy transport is
St = P
(1
Te
−1
T0
)
> 0 (38)
Since both P and Te are constant, it follows that as the temperature of the earth surface increases,so does the rate of entropy generation in the atmosphere. This positive feedback effect, or dominoeffect, will intensify the impact of human entropy production on the earth climate. The rateof entropy generation in the atmosphere per unit surface area of the earth defines the specificatmospheric entropy generation rate:
σt =St
Ae
(39)
With the numbers used in Eq. (34), this specific rate is equal to 0.11 W/K-m2, not bad for such asimplistic model. For comparison, Stahl (1996) reports 0.2 W/K-m2.
Entropy Generated by a Human
A sedentary human needs about 2400 kcal per day in food to live and work a little. This foodconsumption translates roughly into an average sustained power of Q = 100 W, i.e., one man =one 100 W bulb shining infrared light for 24 hours a day. This power is dissipated through work,thermal convection, radiation, excrements, etc., and appears as heat at the ambient temperatureT0 = 273 + 15 = 288K. Thus the entropy generation rate is
S =Q
T0= 0.35 W/K (40)
per person. At 3500 kcal per day, a quantity more representative of the U.S. feeding habits, therate of entropy generation by one person is S = 0.5 W/K, in agreement with (Stahl, 1996). Thismeans, that if one crowds 2-3 people per square meter, they will generate more entropy than theearth can export.
Entropy Generated By Fossil Fuels
In the year 2000, the U.S. burned 83 quads (1 quad = 1 quadrillion or 1015 BTU69) in fossil energyand 2.9 quads in wood, alcohol, etc. For simplicity, I will treat all this energy as the source of heatrejected70 into the earth environment at the mean ambient temperature of T0 = 288 K. The U.S.population was N = 282 million people in 2000. Therefore, in A.D. 2000, the per capita thermalentropy generation rate in the U.S. was
S =Q
T0N=
(83 + 2.9) × 1015 × 1055/365/24/3600
288 × 282 × 106= 36 W/K-person (41)
My estimate of the per capita thermal entropy generation rate in the U.S. is somewhat higher thanthe 35 W/K-person calculated by Stahl (1996).
In the year 2000, the U.S. emitted about 1.65×10¹² kg of carbon dioxide by burning fossil fuels(Marland et al., 2004) (1/4 of the global carbon dioxide emissions). The standard molar entropy
691 BTU = 1055 Joules of energy.70In reality, a portion of the fossil energy, probably 20-30%, generates work, resulting in less heat dumped into the
environment. Therefore, this analysis provides the uppermost bound on the entropy generation rate.

CRPS, 23(6), 2004 T. W. PATZEK 71
of carbon dioxide is 213.8 kJ/kmol-K. Therefore, the per capita U.S. rate of generation of chemicalentropy of carbon dioxide in the atmosphere:
Schem =1.65 × 1012 × 213.8 × 103
44 × 365 × 24 × 3600 × 282 × 106= 0.9 W/K-person (42)
is much smaller than the corresponding thermal entropy rate in Eq. (41). Unfortunately, thischemical entropy cannot be exported to the universe, and thus accumulates on the earth.
The whole world produced 400 quads of energy in the year 2000, therefore the U.S. used roughly1/4 of it. The per capita entropy rate for the whole world excluding the U.S. was 6 W/K-person,or 1/6 of the U.S. rate. This means that where it really counts, in entropy generation rate, theU.S. society is six times as wasteful as the world at large, including Europe and Japan.
The U.S. thermal entropy generation rate may also be expressed per unit surface area of thecountry (9,629,100 km2), resulting in the specific anthropogenic entropy rate σ +σa = 0.001 W/K-m2, or 0.1% of the net entropy flux exported from the earth. Of course, most of this entropy isgenerated on a small fraction of the U.S. land area. If all anthropogenic entropy were generatedover 0.1% of the U.S. area71, roughly the area of Los Angeles, it would overwhelm the entropyexport capacity of the earth. This calculation omits the entropy generation rate to “restore” theenvironment polluted chemically by the fossil fuel by-products. Nevertheless, the anthropogenicthermal entropy generation is still very small when compared with the capacity of the earth toexport entropy. The chemical entropy, in contrast, continuously accumulates on the earth. Eventhe transport entropy in the atmosphere is generated at a specific rate 100-200 times higher thanthe mean generation rate of anthropogenic specific entropy in the U.S.. Note that in his interestingpaper Rubbelke (1998) made a mistake (p. 198) by claiming that the U.S. population producedentropy at the rate of 35 W/K-m2, not 35 W/K-person as calculated by Stahl (1996). Theconsequences of this mistake influenced erroneously his conclusions about sustainability.
What this calculation does not show, is the fast and irreversible exhaustion of the meager stockof high quality crustal materials (low entropy) that feed our civilization with the accompanyingincrease of chemical entropy.
71A physical impossibility!

72 Thermodynamics of corn-ethanol biofuel. . . Web Version
B Availability and Irreversibility in Thermal Systems
Because the earth can export entropy by infrared radiation from the outer layers of the atmosphere,in this appendix I define any thermodynamic system on the earth as interacting with the atmosphereonly. The atmosphere will be treated as being in stable dynamic equilibrium, and characterizedby the constant absolute temperature T0, volume Va, and the hydrostatic pressure, p0 = 1 atm, atsea level. By including within the system as much surface land area, surface water, groundwater,minerals, material, plants, machinery, etc.72, as affected by the process of interest, one is alwaysable to construct the system that interacts with the atmosphere only. For simplicity, chemicalentropy generated by the system is not considered here.
Gibbs73 showed that for any process which can occur under these circumstances the quantitydefined as
Φ = E + p0V − T0S (43)
decreases∆Φ ≤ 0 (44)
where E is the total energy of the system, V its volume, S its entropy, and the increment of Φ,∆Φ, is taken in the direction of increasing chronological Time.
The process of interest can only occur until the system pressure is uniformly hydrostatic andits uniform temperature is T0. Therefore, the state from which no spontaneous change can occuris the state in which the system has the hydrostatic pressure (p0 at sea level) and the atmospherictemperature T0, and for which Φ has the smallest possible value, Φmin. If only one state of thesystem results in this minimum value, the system is in stable equilibrium. Otherwise, if there areseveral states corresponding to the minimum value of Φmin, the system is in neutral equilibrium ofmaximum stability.
Gibbs74 referred to the differenceΦ − Φmin, (45)
where Φ corresponds to the state in question, as the “. . . available energy of the body (our system)and the medium (our surroundings).”
Joseph H. Keenan (1951) later showed that for the system undergoing change from an earlierstate 1 to a later state 2, the amount of useful work Wu is
Wu ≤ Φ1 − Φ2 ≤ Φ1 − Φmin (46)
Therefore, for any state 1, the maximum possible useful work done by the system is Φ1 − Φmin.Keenan proposed to call this maximum value availability, Λ. It may be said75 that for any systemin the stable atmosphere
Λ ≥ 0 (47)
and that for the most stable state of the system
Λ = 0 (48)
From Eq. (46) it also follows that
∆Λ = ∆Φ
Wu ≤ Wu,max = Φ1 − Φmin = −∆Φ = −∆Λ(49)
72The entire globe, if necessary.73(Gibbs, 1994), p. 40.74(Gibbs, 1994), p. 53; my comments in italics.75(Keenan, 1951), Eqs. (12) and (13).

CRPS, 23(6), 2004 T. W. PATZEK 73
Keenan also quantified the irreversibility76, I, of a process executed by the system-atmospherecombination:
I =Wu,max − Wu
= − ∆Φ − Wu
= − ∆Λ − Wu
(50)
and showed that
I =T0∆S + ∆Ea + p0∆Va
=T0∆(Sa + S)(51)
Of course, Keenan’s irreversibility was discovered much earlier and independently by Gouy (1889)and Stodola (1898; 1927)77. Regardless, the irreversibility of a process is equal to the increase ofentropy of everything involved in the process multiplied by the temperature of the atmosphere.
One may use Eq. (51) in the differential form, and per unit area of the earth surface, by writing
1
Ae
dI
dt=T0
(1
Ae
dSa
dt+
1
Ae
dS
dt
)
σI =T0(σa + σ)
(52)
where σI is the specific rate of irreversibility, σa is the specific rate of entropy increase in theatmosphere generated by the process, and σ is the specific rate of entropy increase of the system.Note that as the atmospheric temperature increases, so does the irreversibility of any process onthe earth.
From Appendix A it follows that we can treat the atmosphere as an open system that exportsentropy to the universe with the flux jE
S calculated from Eq. (34). The energy transport throughthe atmosphere generates entropy at the specific rate of σt calculated from Eq. (39). Thus, we mayrewrite Eq. (52) as
σnetI /T0 = (σa + σ)
︸ ︷︷ ︸
Thermal entropy fromEarth processes
+ (−jES + σt)
︸ ︷︷ ︸
Thermal entropy fromSolar processes
(53)
Using equation (53), we can define sustainability as
σnetI ≤ 0
σa + σ − jES + σt ≤ 0
For all places on the earth, and at all times
(54)
For sustainability, equation (54) requires that the net rate of increase of entropy of everything atevery place on the earth and for all times be less or equal to zero! Note that the process andenergy transport increase the entropy of the earth and the atmosphere, and low-temperature heatradiation decreases it.
Remark 15 As derived, Eq. (54) is quite deceiving. The anthropogenic part of the thermalentropy generation rates, σ + σa, can only be sustainable if this entropy is generated in cycles inwhich all process materials are completely recycled, and all chemical entropy is transformed intothermal entropy. If we rely on a finite stock of fossil energy, then even if the entropy generationrate in a process is much lower than the entropy export flux, the process is never sustainable.Therefore, sustainability can only be discussed in the context of cyclic processes. 2
76(Keenan, 1951), Eqs. (31) - (36).77In particular, Volume II of Stodola’s monograph (1927), pp. 1271-1330, brings a thorough discussion of The
Highest Possible Conversion into Work on the Basis of the Second Law of Thermodynamics.

74 Thermodynamics of corn-ethanol biofuel. . . Web Version
Over an arbitrary time interval [τ1, τ2], we can write the global condition of sustainability of allcyclic processes on the earth as
[Sa(τ2) − Sa(τ1)]︸ ︷︷ ︸
Increase of atmospheric entropyfrom earth processes
+ [S(τ2) − S(τ1)]︸ ︷︷ ︸
Increase of earth entropy
−SE(τ1, τ2) + St(τ1, τ2) ≤ 0
For the entire earth, and arbitrary τ1, τ2
(55)
where SE(τ1, τ2) = jES Ae(τ2 − τ1) is the total thermal entropy exported by the earth over the time
interval [τ1, τ2], and St(τ1, τ2) = σtAe (τ2 − τ1) is the corresponding thermal entropy generated inthe atmosphere by the steady-state energy transport to the universe.

CRPS, 23(6), 2004 T. W. PATZEK 75
C Is Economic Sustainability Possible?
I have already demonstrated that anything sustainable on the earth must involve a closed materialloop (a cycle) which is driven by the sun. Solar energy is like a fine mist: it dribbles at a constantrate on every square inch of the earth’s surface. We cannot increase its flow rate, it dries upovernight, and we cannot store it easily. So one may ask legitimately: is solar power enough todrive the world economy, and if so what constraints does it impose?
The time- and area-average solar energy flux in the U.S. is ∼200 W/m2 at the earth surface. Atmore moderate latitudes this flux goes down to about 100-150 W/m2, and in the tropics it can be ashigh as 300 W/m2. Thirty percent of the earth’s surface, 153× 106 km2, is land. Suppose that 1%of land mass on the earth were covered with solar cells that were 10% efficient, and received only100 W/m2 of solar energy. The total solar power converted by these cells to electricity would thenbe 1.5 × 10⁴ gigawatts (1GW = 109W). Currently, the mean world power consumption is about1.3 × 104 GW. Therefore covering one percent of the earth’s land with solar cells would deliverpower equal to the mean world power consumption. For the U.S., it would take closer to 3% of theland area, or 300,000 km2 (the area of Poland) to replace the entire mean fossil and nuclear power.
There are problems, however, with these calculations:
1. With the necessary infrastructure, the surface area of the solar power plants would probablydouble or triple.
2. Mass production of solar cells will generate associated chemical waste (high chemical entropy,which cannot be exported by the earth).
3. There are few big transmission lines in the hot barren areas of the world.
4. The peak power consumption in the world can be several times the mean power, and poweris needed at night.
5. A significant portion of the world power (over 1/3 in the U.S.) is used by automobiles.
6. Large-scale manufacturing of solar cells does not exist (Hayden, 2002).
7. At 1 U.S. dollar per watt (1/7-1/5 of the current U.S. price, given sufficient manufacturingcapacity), it would take 15 trillion dollars to replace most of the fossil and nuclear energyworldwide with solar cells. This amount would probably double if massive new transmissiongrids and the required transformers were to be built worldwide.
The first and the last item above suggest that decentralization of power generation is necessary.With small and micro power plants, one avoids access roads, big transformers, and long transmissionlines. Covering large areas with solar cells is also impossible in the mountains and forests.
The second item requires an intensive research and development effort to weigh the solar cellefficiency and reliability versus the production costs, the use of exotic rare-earth elements, and thegeneration of chemical waste.
The fourth item dictates a dramatic adjustment of industrial activity: (1) Most factories wouldhave to shut down before sunset. (2) For winter and nocturnal use, energy could be stored ashydrogen from solar-driven water electrolysis. (3) The industrial world would have to slow down,and reassess its social priorities, in sharp contrast to my introductory remarks in Part II.
Solar Cells vs. Biofuels. The superiority of solar cells over any biofuel can be illustrated asfollows. The cumulative energy balance in Part I shows that the unsustainable industrial corn

76 Thermodynamics of corn-ethanol biofuel. . . Web Version
10 100 1000
Eucalypts
Corn
Sugar cane
Acacias
Solar cells
Electricity, GJ/ha−yr
Figure 48: The amount of electricity generated in 1 year with solar cells on 1 ha dwarfs thosegenerated with hydrogen-burning 60%-efficient fuel cells or in power stations. The hydrogen isobtained with no losses from ethanol from corn and sugarcane, and electricity is generated withthe 35%-efficiency from eucalypt and acacia wood pellets. The annual electricity yields have beencalculated by Patzek & Pimentel (2006). The minimum solar cell yield follows the assumptionsin this appendix. Note that the bar scale is logarithmic, and annually the solar cells produce ∼100times more electricity than corn ethanol.
farming captures about 100 GJ/ha per crop that lasts, say, 120 days. Because soybean or anotherlegume is planted afterwards, the annualized energy yield from corn remains the same. The product,corn grain, is a fossil fuel which is later converted into another fossil fuel, ethanol, at a large expenseof fossil energy. The ethanol yield is about 74 GJ/ha-yr, and the energy conversion efficiency of afuel cell is 60%. Thus, corn can deliver 74×0.60 = 44 GJ/ha-yr as electricity. The fossil fuel inputsexceed the calorific value of the ethanol by about 2-20 GJ/ha-yr. In Part III, I showed that a fuelcell can deliver about 46 GJ/ha-yr as electricity from the industrial corn-ethanol cycle, but therestoration work is at least twice as large. During one year, an inefficient solar cell that convertsonly 10% of only 100 W/m2 will sustainably produce 3000 GJ/ha of electricity, see Figure 48.Therefore, the solar cells described above can produce 100 times more electricity than the cornethanol(hydrogen)-burning fuel cells. One hectare of solar cells placed anywhere can thereforefree 100 hectares of fertile agricultural land from industrial corn, and allow for the low-intensity,diversified, and almost sustainable agriculture. The socially and scientifically defensible choice isclear78.
78Some, e.g., (Sheehan et al., 2004), argue that corn should be farmed continuously (with no crop rotation): thewhole plants are harvested, the grain is processed for ethanol, and the rest is burned for energy. This energy supplyscheme requires 2-10 times more field chemicals (see Part I), irreversibly depletes and damages the soil, and is evenmore unsustainable than a single corn crop (see Parts II and III).

CRPS, 23(6), 2004 T. W. PATZEK 77
D Efficiency of a Fuel Cell System
In their Science paper, Deluga et al. (2004) claim the following:
. . . Further, combustion used for transportation has ∼20% efficiency as comparedwith up to 60% efficiency for a fuel cell. . . The efficiency of these processes for a fuel cellsuggests that it may be possible to capture >50% of the energy from photosynthesisas electricity in an economical chemical process that can be operated at large or smallscales. (p. 996).
Following Deluga et al.’s paper and common chemical engineering knowledge, I will assumethe following:
1. The catalyst is made of a rare-earth metal, rhodium79, and a Lanthanoid, cerium80.
2. The catalytic reaction has 100% selectivity and >95% conversion efficiency. I will assumehere the conversion efficiency η1 = 0.96.
3. The ethanol-water reactant mixture for the catalytic conversion to hydrogen is ultra pure(on the order of 99.9999% pure C2H5OH and H2O). Otherwise, any and all of the impuritieslisted in Footnotes 81 and 82, and carbon deposition, will destroy the catalyst and reactor.Therefore, one must separate all impurities from the 8 − 10% alcohol81-yeast-rest beer82
by multiple distillations, rectification, and molecular sieve exclusion (Maiorella, 1985). Asdescribed in Part II, all these processes consume irreversibly large amounts of free energy.
4. The reaction products are hydrogen, carbon dioxide, carbon monoxide, water vapor, pluswhatever other impurities. The hydrogen fuel separation from all other components of reactoreffluent is almost perfect. Compared with the reference hydrogen of 99.9999999% purity, eventiny amounts of impurities can cause a noticeable drop in performance of a fuel cell83. Someof these impurities are CO (at 5-10 ppm), SO2 (at 2 ppm), H2S (at 1-2 ppm), HCHO (at10-20 ppm), and HCOOH (at 50-100 ppm).
5. In summary, by the time we are ready to use the ethanol-derived hydrogen in a fuel-cell/electriccar, we have spent a lot of free energy on picking ethanol, water, and hydrogen molecules;much more than on distilling the relatively dirty ethanol to be mixed with gasoline. Thelatter free energy expenditure is ∼15 MJ/L EtOH, or >50% of the ethanol’s high heatingvalue.
79Rhodium is a precious metal whose price is about US$30 000/kg, 3×more expensive than gold, http://-www.kitco.com/charts/rhodium.html.
80The nanoparticles of cerium dioxide are called ceria, and cost $250/kg, http://www.advancedmaterials.us/58N-0801.htm
81Alcohol dissolves a large number of substances insoluble in water and acids, such as many inorganic salts,phosphorus, sulphur, iodine, resins, essential oils, fats, coloring matters, etc. (Wright, 1994).
82The beer obtained by mashing and fermenting consists of volatile components, such as water, alcohols (mostlyethyl, but also traces of methyl, propyl, butyl, amyl, and other alcohols – depending on the impurities in glucose),essential oils, and a little acetic acid; and of non-volatile substances, such as cellulose, dextrine (an intermediateproduct of starch hydrolysis), unaltered sugar and starch, mineral matter, lactic acid, glycerol, etc.
83Japan Automotive Research Institute (JARI), DOE Hydrogen Codes and Standards, Coordinating Commit-tee Fuel Purity Specifications Workshop, April 26, 2004, http://www.eere.energy.gov/hydrogenandfuelcells/pdfs/-fuel
−purity
−notes.pdf

78 Thermodynamics of corn-ethanol biofuel. . . Web Version
After Bossel (2003a), I will summarize efficiency of a Proton Exchange Membrane (PEM) fuelcell as follows. In fuel cells, gaseous hydrogen is combined with oxygen to water. This process isthe reversal of the electrolysis of liquid water and should provide an open circuit voltage of 1.23V (Volts) per cell. Because of polarization losses at the electrode interfaces the maximum voltageobserved for PEM fuel cells is between 0.95 and 1.0 V. Under operating conditions the voltage isfurther reduced by ohmic resistance within the cell. A common fuel cell design voltage is 0.7 V.The mean cell voltage of 0.75 V may be representative for standard driving cycles. Consequently,the average energy released by reaction of a single hydrogen molecule is equivalent to the productof the charge current of two electrons and the actual voltage of only 0.75 V instead of the 1.48 Vcorresponding to the hydrogen high heating value84. Therefore, in automotive applications, PEMfuel cells may reach mean voltage efficiencies of
η2 =0.75 V
1.48 V= 0.50 (56)
However, there are more losses to be considered. The fuel cell systems consume part of the generatedelectricity. Typically, automotive PEM fuel cells consume 10% or more of the rated stack poweroutput to provide power to pumps, blowers, heaters, controllers, etc. At low power demand the fuelcell efficiency is improved, while the relative parasitic losses increase. The small-load advantagesare lost by increasing parasitic losses. Let us assume optimistically that for all driving conditionsthe net power output of an automotive PEM fuel cell system is about η3 = 0.9 of the power outputof the fuel cell stack.
Depending on the chosen drive train technology, the DC power is converted to frequency-modulated AC or to voltage-adjusted DC, before motors can provide motion for the wheels. Energyis always lost in the electric system between fuel cell and wheels. The overall electrical efficiencyof the electric drive train can hardly be better than η4 = 0.9.
By multiplying the efficiency estimates, one obtains for the maximum possible tank-to-wheelefficiency of a hydrogen fuel cell vehicle
η = η1η2η3η4 = 0.96 × 0.50 × 0.90 × 0.90 = 0.38, (57)
or 38%. This optimistic estimate agrees with another analysis (31-39%) (Fleischer and Ørtel, 2003),and is significantly less than the 60% used by the reckless promoters of a hydrogen economy andhydrogen fuel cell vehicles.
84According to Faraday’s Law, the standard enthalpy of combustion of hydrogen, ∆H0f = −285.9 kJ/mol, can also
be expressed as an electrochemical potential (“standard potential”) U0 = −∆H0f/neF = 1.48 V with ne = 2 being
the number of electrons participating in the conversion and F = 96485 Coulomb/mol the Faraday constant.

CRPS, 23(6), 2004 T. W. PATZEK 79
E Cumulative Exergy Consumption in Steel Production
The primary commercial iron ores in the world are hematite (Fe2O3) and magnetite (Fe3O4).Taconite, the principal iron ore mined in the United States, has a low (20 – 30%) iron content andis found in hard, fine-grained, banded iron formations. About 99% of iron ore is used in the ironand steel industry. Scrap can be considered a supplement to iron ore in the steelmaking process butis limited as a major feed material owing to inadequate supply of high-quality scrap. Alternatives,such as direct reduced iron (DRI), are also available, and their use continues to grow.
Ore is put into a blast furnace and smelted to produce molten iron, which is then convertedto steel by removing most of the remaining carbon in a basic oxygen furnace (BOF). Almost allmolten iron goes directly to the BOF, eliminating the molds. The blast furnace product is usuallyreferred to as pig iron.
Iron ore consumption in the U.S. in 2003 was 61 million metric tonnes (Mt), a rise of slightlymore than 1 Mt from that of 2002. There was an average of 30 blast furnaces active during 2003, upslightly from that of 2002 when the average number of blast furnaces operating was 29, the lowestsince 1961. Accordingly, pig iron production at 40.6 Mt in 2003 was slightly above that of 2002,which had been the lowest since 1982. Crude steel production at 94 Mt increased by 2% comparedwith that of 2002. Steel demand remained constant at revised 2002 levels of 107 Mt. The largedifference between ore production and steel demand is explained by examining the minimill sectorand net imports of iron ore substitutes. In 2003, the minimill sector of the steel industry producedmore than 50% of the crude steel in the United States. Minimills do not use iron ore as feedstock;instead they use iron and steel scrap, and some DRI in electric arc furnaces (EAF). For a moredetailed summary, see Jorgenson & Kirk (2003).
Several literature estimates of primary energy consumption in producing steel via integratedU.S. mills and BOF are listed in Table 26. The same-source estimates of primary energy consump-tion in producing steel from 100% scrap in EAF are listed in Table 27. The embedded energy andequivalent CO2 emissions in SAE 1045 and SAE 15V45 steel are listed in Table 28.
E.1 Steel component manufacturing
As an example, the track roller shaft in a Caterpillar tractor has been investigated in (Beloff et al.,2004). This track roller is conventionally produced with medium carbon steel, typically SAE 1045or modified SAE 5038. Due to physical and cost benefits at least within the “shape and treat”manufacturing stage of the lifecycle, the part is now produced with microalloyed steel, namely SAE
15V45.
In addition to the primary energy contained in the energy sources, exergy includes work that isavailable in other materials that contribute to the lifecycle. For simplicity, only iron and mineralsthat make up the compositions of the steels have been included in (Beloff et al., 2004) in addition tothe primary energy, i.e., wastes and auxiliary materials have been ignored. With these assumptions,the primary energy embedded in the track roller is 30 and 27 MJ/kg-part, respectively, for SAE 1045and SAE 15V45 steels. The standard chemical exergy embedded in these two steels is 6.7 MJ/kg.The incomplete cumulative exergy consumption (CExC) is 37 and 34 MJ/kg-part respectively. TheGHG emissions are about 2.7 kg CO2 equiv./kg-part. Other, apparently more complete estimatesof cumulative exergy consumption in steelmaking (Szargut et al., 1988) are listed in Table 29.They range from 46 to 84 MJ/kg of finished steel products.
Remark 16 The average cumulative exergy consumption per kg of steel in machinery is between34 and 84 MJ/kg. Taking into account the extensive infrastructure this machinery uses to function,

80 Thermodynamics of corn-ethanol biofuel. . . Web Version
and the concomitant environment pollution, the steel-only estimate should at least double (Wall,1997) to 68-168 MJ/kg. 2
References
Allison, F. E. 1973, Soil Organic Matter and Its Role in Crop Production, Elsevier, New York.ARB 2005, A summary of the staff’s assessment regarding the effect of ethanol in California gasoline
on emissions, Draft report, Air Resources Board, Sacramento, CA 95812, www.arb.ca.gov/-fuels/gasoline/meeting/2005/030105etohrpt.pdf.
Avers, C. J. 1976, Cell Biology, D. van Nostrand Company, New York.Barber, S. A. 1977, Our Land and Its Care, Chapt. Plant nutrient needs, pp 41 – 51, The Fertilizer
Institute, Washington, D.C..Beloff, B., Tanzil, D., and Chuzhoy, L. 2004, Assessment of Potential Life Cycle Environmental
Impacts of Microstructure-Level Simulation for a Steel Component: An Exploratory Research,Final project report, grant number dmi-0245431, National Science Foundation, Washington,DC, www.bridgestos.org/NSFFinalReport.pdf.
Bender, K. and Hill, L. (eds.) 1997, Adjusting for Moisture - Equivalent Bushel Workshop, Vol.AE4720, Urbana-Champaign, University of Illinois, Department of Agricultural and ConsumerEconomics.
Benham, B. L. 1998, Irrigating Corn, University of Nebraska, South Central Research and Exten-sion Center, Clay Center, G98-1354-A, http://ianrpubs.unl.edu/fieldcrops/g1354.htm.
Berndes, G., Hoogwijk, M., and Van den Broek, R. 2003, The contribution of biomass in the futureglobal energy supply: A review of 17 studies, Biomass & Bioenergy 25: 1–28.
Berthiaume, R., Bouchard, C., and Rosen, M. A. 2001, Exergetic evaluation of the renewability ofa biofuel, Exergy Int. J. 1(4): 256–68.
Biermann, S., Rathke, G. W., Hulsbergen, K. J., and Diepenbrock, W. 1999, Energy Recoveryby Crops in Dependence on the Input of Mineral Fertilizer, Report, Martin-Luther-UniversityHalle-Wittenberg, Agroecological Institute and Institute of Agronomy and Crop Science, Halle(Saale).
Blais, J.-F., Mamouny, K., Nlombi, K., Sasseville, J.-L., and Letourneau, M. 1995, Les mesures defi-cacite energetique electrique dans le secteur de leau, Scientific Report 405, INRS-Eau, Quebec,Sasseville, J.-L. and Blais, J-F., eds., Les mesures deficacite energetique pour lepuration deseaux usees municipales, Vol. 3.
Bossel, U. 2003a, Efficiency of Hydrogen Fuel Cell, Diesel-SOFC-Hybrid and Battery ElectricVehicles, Technical report, European Fuel Cell Forum, Morgenacherstrasse 2F, CH-5452 Ober-rohrdorf, Switzerland, http://www.efcf.com.
Bossel, U. 2003b, Well-to-Wheel Studies, Heating Values, and the Energy Conservation Principle,Technical report, European Fuel Cell Forum, Morgenacherstrasse 2F, CH-5452 Oberrohrdorf,Switzerland, http://www.efcf.com.
Bossel, U., Eliasson, B., and Taylor, G. 2003, The Future of the Hydrogen Economy: Brightor Bleak – Final Report, April 15, Technical report, http://www.efcf.com/reports/-hydrogen
−economy.pdf.
Bridgman, P. W. 1955, Reflections of a Physicist, Philosophical Library, Inc., New York.BUWAL 1990, Adapted by PricewaterhouseCoopers Ecobilan, Paris, in DEAM lifecycle assess-
ment database, Environmental series no. 132, Swiss Federal Office of Environment, Forests andLandscape, Geneva, Switzerland.

CRPS, 23(6), 2004 T. W. PATZEK 81
Carnot, S. 1943, Reflections on the Motive Power of Heat and on the Machines Fitted to DevelopThis Power, The American Society of Mechanical Engineers, New York.
Castorph, D., Kollera, M., and Waas, P. 1999, Brennwert und Heizwert (The High and LowHeating Values), Technical report, Fachhochschule Munchen, FB 03, Dachauer Straße 98 b,80335 Munchen, http://www.fm.fh-muenchen.de/labore/waas/skripten/kap11.pdf.
Celia, M. A. 2002, How hydrogeology can save the world – An Editorial, Ground Water 40(2):113.
Cepede, M., Houtart, F., and Grond, L. 1964, Population and Food, Sheed and Ward, New York.Davis, M., Balog, F., Nemanich, G., Katsaros, A., J., O., and Niedzwiecki, A. 2002, National Hydro-
gen Energy Roadmap – Toward a More Secure and Cleaner Energy Future for America - Produc-tion – Delivery – Storage – Conversion – Applications – Public education and outreach, Technicalreport, Based on the results of the National Hydrogen Energy Roadmap Workshop Washing-ton, DC, April 2-3, 2002, U.S. DOE, http://www.eere.energy.gov/hydrogenandfuelcells/pdfs/-national
−h2
−roadmap.pdf.
Deluga, G. A., Salge, J. R., Schmidt, L. D., and Verykios, X. E. 2004, Renewable hydrogen fromethanol by authothermal reforming, Science 303: 993–996.
DOE 2003, Hydrogen Fuel Cells & Infrastructure Technologies Program, http://www.eere.energy.-gov/hydrogenandfuelcells/mypp/ click on Appendices.
Domalski, E. S., Jobe Jr., T. L., and Milne, T. A. (eds.) 1987, Thermodynamic Data for BiomassMaterials and Waste Components, The American Society of Mechanical Engineers, UnitedEngineering Center, 345 East 47th Street, New York, N.Y. 10017.
Dresselhaus, M., Crabtree, G., and Buchanan, M. 2003, Basic Research Needs for the HydrogenEconomy, Technical report, Argonne National Laboratory, Basic Energy Sciences, U.S. DOE,http://www.sc.doe.gov/bes/hydrogen.pdf.
EIA 2002, Emissions of Greenhouse Gases in the United States, 2001, U.S. Department ofEnergy, Energy Information Administration: http://www.eia.doe.gov/oiaf/1605/gg02rpt/pdf/-appendixa.pdf, etc..
Elliott, S. S., Keim, N. L., Stern, J. S., Teff, K., and Havel, P. J. 2002, Fructose, weight gain, andthe insulin resistance syndrome, Am. J. Clin. Nutr. 76: 911–22.
Fleischer, T. and Ørtel, D. 2003, Impact and consequences of fuel cells technology on sustainable de-velopment, Technical report, Institut fur Technikfolgenabschatzung und Systemanalyse (ITAS),Prospective Technology Studies Joint Research Centre.
Frink, C. R., Waggoner, P. E., and Ausubel, J. H. 1999, Nitrogen fertilizer: Retrospect andprospect, Proc. Natl. Acad. Sci. 96: 1175–1180.
Frondel, M., Oertel, K., and Rubbelke, D. 2002, The domino effect of climate change, InternationalJournal of Environment and Pollution 17(3): 201–210.
Fruehan, R. J., Paxton, H. W., and Giarratani, L. 1994, A Vision of the Future Steel Industry,Report prepared for the u.s. doe, sponsored by the sloan steel industry competitiveness study,Carnegie Mellon University.
Georgescu-Roegen, N. 1971, The Entropy Law and the Economic Process, Harvard UniversityPress, Cambridge, Massachusetts.
Gibbs, J. W. 1994, The Scientific Papers of J. Willard Gibbs, Ph. D. , LL. D. , Vol. I, Thermo-dynamics, Ox Bow Press, Woodbridge, Connecticut.
Gill, A. B. 1984, Power plant performance, Butterworths, London.Gouy, G. 1889, About available energy (in French), Journal Physique II 8: 501–518.Graboski, M. S. 2002, Fossil Energy Use in the Manufacture of Corn Ethanol, Report prepared
for the National Corn Growers Association, Colorado School of Mines.Haasen, P. and Cahn, R. W. (eds.) 1996, Physical Metallurgy, North Holland, Amsterdam, 4

82 Thermodynamics of corn-ethanol biofuel. . . Web Version
edition.Hamelinck, C. N. 2004, Ph.D. thesis, Utrecht University, Faculteit Scheikunde.Hancock, B. 2005, EMFAC Modeling Change Technical Memo: Correction factor for increased
evaporative emissions due to ethanol replacement in oxygenated gasoline, www.arb.ca.gov/-fuels/gasoline/meeting/2005/030105etohapp.pdf, California Air Resources Board, Sacramento,CA 95812.
Hayden, H. C. 2002, The Solar Fraud: Why Solar Energy Won’t Run the World, Vales LakePublishing Llc., New York.
Heichel, G. 2004, Private Communication, University of Illinois.Hickey, J. R., Stowe, L. L., Jacobowitz, H., Pellegrino, P., Maschhoff, R. H., House, F., and
Vonder Haar, T. H. 1980, Initial solar irradiance determination from Nimbus-7 cavity radiometermeasurements, Science 208: 281–283.
Hodge, C. 2002, Ethanol use in US gasoline should be banned, not expanded, Oil&Gas JournalSept. 9.
Horne, A. J. 1991, Selenium detoxification in wetlands by permanent flooding, I. Effects on amacroalga, an epiphytic herbivore, and an invertebrate predator in the long-term mesocosmexperiment at Kesterson Reservoir, Water, Air, and Soil Pollut. 57: 43.
Horne, A. J. 1994, Environment, Marcel Dekker, New York.Horne, A. J. and Gregg, J. H. 1993, Short-term distribution and fate of trace metals in a con-
structed wetland receiving treated municipal wastewater: A microcosm study using radiotracers,Report 93-4, University of California, Berkeley, Environmental Engineering and Health SciencesLaboratory.
Horne, A. J., Roth, J. C., Barrett, N., Commins, M. L., and Johnson, P. 1994, Progress report forthe diagnostic study of Walker Lake, Nevada (July 1992-October 1993), Report, University ofCalifornia, Berkeley, Environmental Engineering and Health Sciences Laboratory.
IDEMAT 2001, Material selection software, www.io.tudelft.nl/research/dfs/idemat/index.htm,Faculty of Design, Engineering and Production, Delft University of Technology, The Nether-lands.
IEA 2000, International Energy Agency: Energy Statistics of OECD Countries, 1999-2000.International, B. 2001, East Kansas Agri-Energy Ethanol Plant Feasibility Study, BBI Inter-
national, PO Box 159, Cotopaxi, Colorado 81223, (719) 942-4353, http://www.ekaellc.com/-about/EKAE
−FS
−May
−2001.pdf.
IPCC 1997, Greenhouse Gas Inventory Reference Manual: Revised 1996 IPCC Guidelines forNational Greenhouse Gas Inventories, Report Vol. 3, p. 1.53, Intergovernmental Panel onClimate Change, Paris, France, www.ipcc.ch/pub/guide.htm.
Jasinski, S. M. 2002, Phosphate rock, http://minerals.usgs.gov/minerals/pubs/commodity/-phosphate
−rock/phosmyb02.pdf.
Jevons, S. W. 1866, The Coal Question: An Inquiry Concerning the Progress of the Nation andthe Probable Exhaustion of Our Coal Mines, Macmillan & Co., London, 2nd edition.
Jorgenson, J. D. and Kirk, W. S. 2003, Iron Ores, http://minerals.usgs.gov/minerals/pubs/-commodity/iron
−ore/feoremyb03.pdf, Also see USGS, http://minerals.usgs.gov/minerals/-
pubs/commodity/iron−ore/.
Kartha, S. and Larson, E. D. 2000, Bioenergy primer: Modernised biomass energy for sustainabledevelopment, Technical Report UN Sales Number E.00.III.B.6, United Nations DevelopmentProgramme, 1 United Nations Plaza, New York, NY 10017, USA.
Keenan, J. H. 1951, Availability and irreversibility in thermodynamics, The British Journal ofApplied Physics 2: 183–192.
Keith, D. W. and Farrell, A. 2003, Rethinking hydrogen cars, Science 301: 315–316.

CRPS, 23(6), 2004 T. W. PATZEK 83
Kimbrell, A. (ed.) 2002, Fatal Harvest: The Tragedy of Industrial Agriculture, Island Press,Washington.
Kimbrell, A. (ed.) 2003, Fatal Harvest: The Tragedy of Industrial Agriculture, Foundation for DeepEcology, New York.
Kongshaug, G. 1998, European Fertilizer Manufacturers Association, EFMA Seminar, Prague.Larson, W. E. 1979, Crop residue: Energy production or erosion control?, J. Soil & Water
Conservation 34(2): 74–76.Lide, D. R. (ed.) 1994, CRC Handbook of Chemistry and Physics, CRC Press, Boca Raton, FL, 75
edition.Lindstrom, M. J., C., G. S., Onstad, C. A., Larson, W. E., and Holt, R. E. 1979, Tillage and crop
residue effects on soil erosion in the Corn Belt, J. Soil & Water Conservation 34(2): 80–82.Maiorella, B. 1985, Comprehensive Biotechnology, Vol. 3, Chapt. Ethanol, Pergamon Press.Marland, G., Boden, T. A., and Andres, R. J. 2004, Carbon Dioxide Information Analysis Center,
U.S. Department of Energy, Oak Ridge National Laboratory, http://cdiac.esd.ornl.gov/trends/-emis/em
−cont.htm.
Maxwell, J. C. 2001, Theory of Heat, Dover, New York, 9th edition.Michaud, A. 1995, in Auberge des Seigneurs Saint-Hyacinthe, Conseil des productions vegetales du
Quebec, pp 89–113.Miller, D. F. 1958, Composition of Cereal Grains and Forages, National Academy of Sciences –
National Research Council, Washington, D. C..Mudahar, M. S. and Hignett, T. P. 1982, Handbook of energy in world agriculture, pp 50–94,
Elsevier, Essex.NASS 2002, National Agricultural Chemical Usage – 2001 Field Crops Summary, National Agricul-
tural Statistics Service (NASS), Agricultural Statistics Board, U.S. Department of Agriculture:http://usda.mannlib.cornell.edu/reports/nassr/other/pcu-bb/% -agcs0502.pdf.
NASS 2004a, Crop Production - 2003 Summary, National Agricultural Statistics Service (NASS),Agricultural Statistics Board, U.S. Department of Agriculture: http://usda.mannlib.cornell.-edu/reports/nassr/field/pcp-bban/cropan04.pdf.
NASS 2004b, National Agricultural Chemical Usage – Historic Data, National Agricultural Statis-tics Service (NASS), Agricultural Statistics Board, U.S. Department of Agriculture: http://-www.usda.gov/nass/pubs/dataprd1.htm.
Nielsen, R. L. 2002, Corn Yield Trends for Indiana 1930 - 2001, Agronomy Dept., Purdue Univ.:http://www.agry.purdue.edu/ext/corn/news/CornYldTrend01.html.
NRC 1999, Ozone-Forming Potential of Reformulated Gasoline, National Academy Press, Wash-ington, D.C., National Research Council Committee.
NREL 2002, Life Cycle Analysis – Corn Stover vs Petroleum in Iowa, National Renewable EnergyLaboratory, U.S. Department of Energy: http://www.nrel.gov/docs/gen/fy02/31792.pdf.
Patyk, A. and Reinhardt, G. A. 1997, Dungemittel – Energie – und Strombilanzen, Vieweg-Verlag,Wiesbaden.
Patzek, T. W. 2004, Thermodynamics of the corn-ethanol biofuel cycle, Critical Reviews in PlantSciences 23(6): 519–567, An updated web version is at http://petroleum.berkeley.edu/papers/-patzek/CRPS416-Patzek-Web.pdf.
Patzek, T. W. 2006, Letter, Science 312: 1747.Patzek, T. W., Anti, S.-M., Campos, R., Ha, K. W., Lee, J., Li, B., Padnick, J., and Yee, S.-A.
2005, Ethanol from corn: Clean renewable fuel for the future, or drain on our resources andpockets?, Environment, Development & Sustainability 7: 319 – 336.
Patzek, T. W. and Pimentel, D. 2006, Thermodynamics of energy production from biomass, CriticalReviews in Plant Sciences 24(5–6): 329–364, Available at http://petroleum.berkeley.edu/-

84 Thermodynamics of corn-ethanol biofuel. . . Web Version
papers/patzek/CRPS-BiomassPaper.pdf.Pimentel, D. 1990, Handbook of Energy Utilization in Agriculture, CRC Press, Boc Raton, FL..Pimentel, D. 1991, Ethanol fuels: Energy security, economics, and the environment, Journal of
Agricultural and Environmental Ethics 4: 1–13.Pimentel, D. 1996, Food, Energy, and Society, University Press of Colorado, Niwot, CO.Pimentel, D. 2001, Encyclopedia of Physical Science and Technology, Chapt. The limits of biomass
energy, Academic Press, New York, 3 edition.Pimentel, D. 2003, Ethanol fuels: Energy balance, economics, and environmental impacts are
negative, Natural Resources and Research 12(2): 127–134.Pimentel, D. 2004a, Private Communication, Cornell University.Pimentel, D. 2004b, Private Communication, Cornell University.Pimentel, D. 2004c, Private Communication, Cornell University.Pimentel, D. 2006, Soil erosion: A food and environment threat, Environment, Development &
Sustainability 8: 119–137.Pimentel, D. and Dazhong, W. 1990, Agroecology, Chapt. Technological changes in energy use in
U.S. agricultural production, pp 147–164, McGraw Hill, New York.Pimentel, D., Herdendorf, S., Eisenfeld, S., Olander, L., Corroquino, M., Corson, C., McDade, J.,
Chung, Y., Cannon, W., Roberts, J., Bluman, L., and Gregg, J. 1994, Achieving a secure energyfuture: environmental and economic issues, Ecological Economics 9(3): 201–219.
Pimentel, D., Warneke, A. F., Teel, W. S., Schwab, K. A., Simcox, N. J., Ebert, D. M., Baenisch,K. D., and Aaron, M. R. 1988, Food versus biomass fuel: Socioeconomic and environmentalimpacts in the United States, Brazil, India, and Kenya, Advances in Food Research 32: 185–238.
Planck, M. 1926, Treatise on Thermodynamics, Dover Publications, Inc., New York, 3 edition,1945 Dover Reproduction.
Pollan, M. 2002, Industrial Corn – Destroying Our Health & Environment, New York Times, July18th, Op Ed.
Rice, D. W. et al. 1999, Health and Environmental Assessment of the Use of Ethanol as a Fuel Oxy-genate - Report to the California Environmental Policy Council in Response to Executive OrderD-5-99, UCRL-AR-135949, Air Resources Board, Lawrence Livermore National Laboratory,CA.
Riekert, L. 1975, Energy transformation through chemical processes (in German), Chem. Ing.Tech. 47: 48–51.
Rogner, H. H. 2000, World Energy Assessment, Chapt. Energy Resources, pp 135–171, UnitedNations Development Programme, New York, USA.
Rosenberg, N. J., Epstein, D. J., Wang, D., Vail, L., Srinivasan, R., and Arnold, J. G. 1999,Possible impacts of global warming on the hydrology of the Ogallala aquifer, Climatic Change42: 677–692.
Rubbelke, D. 1998, Entropic limits of irreversible processes and possible adaptation mechanismsfor sustainable development, World Resource Review 10(2): 186–205.
Schneider, B. H. and Spraque, G. F. 1955, Corn and Corn Improvement, Academic Press, NewYork.
Schrodinger, E. 1967, What is Life? The physical aspects of the living cell, Cambridge UniversityPress, Cambridge, U.K..
Shapouri, H., Duffield, J. A., and Wang, M. 2002a, The Energy Balance of Corn Ethanol: AnUpdate, Agricultural Economic Report No. 814, U.S. Department of Agriculture, EconomicResearch Service, Office of the Chief Economist, Office of Energy Policy and New Uses, Wash-ington, D.C..
Shapouri, H., Gallagher, P., and Graboski, M. S. 2002b, USDA’s 1998 Ethanol Cost-of-Production

CRPS, 23(6), 2004 T. W. PATZEK 85
Survey, Agricultural Economic Report No. 808, U.S. Department of Agriculture, EconomicResearch Service, Office of Energy and New Uses, Washington, D.C..
Sheehan, J., Aden, A., Paustian, K., Killian, K., Brenner, J., Walsh, M., and Nelson, R. 2004,Energy and environmental aspects of using corn stover for fuel ethanol, J. Ind. Ecology 7(3-4):117–146.
Sheehan, J., Camobreco, V., Duffield, J., Graboski, M., and Shapouri, H. 1998, Life Cy-cle Inventory of Biodiesel and Petroleum Diesel for Use in an Urban Bus, Final Re-port NREL/SR-580-24089, National Renewable Energy Laboratory, Golden, Colorado 80401,www.nrel.gov/docs/legosti/fy98/24089.pdf.
Smil, V. 1985, Carbon – Nitrogen – Sulfur – Human Interferences in Grand Biospheric Cycles,Plenum Press, New York and London.
Spiers, H. M. 1961, Technical Data on Fuel, The British National Committee, World PowerConference, 201 Grand Buildings, Trafalgar Square, London WC2, 6 edition.
Stahl, A. 1996, Entropiebilanzen und Ressourcenverbrauch, Naturwissenschaften 83: 459–466.Stevenson, F. J. 1982, Humus chemistry. Genesis, composition, reactions, John Wiley & Sons,
New York.Stodola, A. 1898, The cyclic processes of the gas engine (in German), Zeitschrift des Vereines
Deutscher Ingenieure (Z. VDI) 32(38): 1086–1091.Stodola, A. 1927, Steam and Gas Turbines with the Supplement on the prospects of the thermal
prime mover, McGraw-Hill Book Company, Ltd., New York, 1 edition, Two volumes, authorizedtranslation of the sixth German edition.
Szargut, J., Morris, D. R., and Steward, F. R. 1988, Exergy analysis of thermal and metallurgicalprocesses, Hemisphere Publishing Corporation, New York.
Termuehlen, H. and Emsperger, W. 2003, Clean and Efficient Coal-fired Power Plants - Develop-ment toward advanced technologies, ASME Press, New York.
Tisdale, S. L., Nelson, W. L., and Beaton, J. D. (eds.) 1985, Soil Fertility and Fertilizers, Macmillan,New York.
Troeh, F. R. and Thompson, L. M. 1993, Soils and Soil Fertility, Oxford University Press, NewYork.
Tromp, T. K., Shia, R.-L., Allen, M., Eiler, J. M., and Yung, Y. L. 2003, Potential environmentalimpact of a hydrogen economy on the stratosphere, Science 300: 1740–1742.
USDA 1998, Farm and Ranch Irrigation Survey, 1998, National Agricultural Statistics Service(NASS), Agricultural Statistics Board, U.S. Department of Agriculture: 1997 Census of Agri-culture. v. 3, Special Studies, http://www.nass.usda.gov/census/census97/fris/fris.htm.
USGS 2003, Water-level changes 1980-1997, and saturated thickness, 1996-97, in the High PlainsAquifer, U.S. Geological Survey, http://water.usgs.gov/pubs/FS078-03.
Wall, G. 1997, Thermodynamic Analysis and Improvement of Energy Systems, Proceedings of theInternational Conference on Thermodynamic Analysis and Improvement of Energy Systems:Exergy use in the Swedish society 1994, pp 403–413, Chinese Society of Engineering Thermo-physics and American Society of Mechanical Engineers, Beijing, China.
Wang, M., Saricks, C., and Wu, M. 1997, Fuel-cycle fossil energy use and greenhouse gas emissionsof fuel ethanol produced from U.S. Midwest corn, Report sponsored by the Illinois Departmentof Commerce and Community Affairs, Argonne National Laboratory, Center for TransportationResearch, Argonne, IL 60439.
Webster 1993, Webster’s Third New International Dictionary of the English Language - Unabridged,Encyclopædia Britannica, Inc., Chicago.
Wheaton, H. N., Martz, F., Meinershagen, F., and Sewell, H. 1993, Corn Silage, Departmentof Agronomy, University of Missouri-Columbia: http://muextension.missouri.edu/explore/-

86 Thermodynamics of corn-ethanol biofuel. . . Web Version
agguides/crops/g04590.htm.White, P. J. and Johnson, L. A. (eds.) 2003, Corn Chemistry and Technology, American Association
of Cereal Chemists.Worrell, E., Meuleman, B., and Blok, K. 1995, Energy savings by efficient application of fertilizer,
Resources, Conservation, Recycling 13: 233–250.Worrell, E., Pylipsen, D., and Martin, N. 2000, Energy use and energy intensity of the U.S.
chemical industry, Report LBNL-44314, Energy Analysis Department, Environmental EnergyTechnologies Division, LBNL, Berkeley, CA 94720.
Worrell, E., van Heijningen, R. J. J., de Castro, J. F. M., Hazeewinkel, J. H. O., de Beer, J. G.,Fauu, A. P. C., and Vringer, K. 1994, New gross energy-requirement figures for materialsproduction, Energy 19: 627–640.
Wright, F. B. 1994, Distillation of alcohol and de-naturing, Lindsay Publications, Bradley, IL, 2edition.
Young, S. and Vanderburg, W. H. 1994, Applying environmental life-cycle analysis to materials,JOM 46(4): 22 – 27.

CRPS, 23(6), 2004 T. W. PATZEK 87
Part VI
Tables
Table 1: Average dry mass composition of corn grain (White and Johnson, 2003)
Component % by massStarch 66
Oil 3.9
Gluten feed (21% protein) 24
Gluten meal (60% protein) 5.7
Losses 0.4
Table 2: Average application rates of corn field chemicals in 2001 (NASS, 2002)
Compound True Fraction ha Mean
kg/ha w/ applied kg/ha
N 148.8 0.96 142.8
P2O5a 62.5 0.79 49.4
K2Oa 93.5 0.65 60.8
Herbicides 2.54 0.98 2.49
Insecticides 1.08 0.29 0.31
aUSDA (NASS, 2002) reports “P” and “K” but, according to Ms. Barbara Tidwell of the NASS/MISOCustomer Service, they mean P2O5 and K2O.
Table 3: Specific energy consumption and application rates of nitrogen fertilizer
Active Specific Application Source
Ingredient Energy MJ/kg Rate kg/ha
N 63.43 148.0 Pimentel, 2003
N 54.43 148.8 Patzek, 2004
N 43.00 140.0 Shapouri et al., 2002
N 49.06 153.0 Wang et al., 1997
N 54.43a 150.0 Berthiaume et al., 2001
a Berthiaume et al. (2001) do not give the specific N, P, K, Ca fertilizer energies, only the specific exergies.I have assumed that the specific energies of Berthiaume et al. are equal to my estimates, and used theirreported application rates.
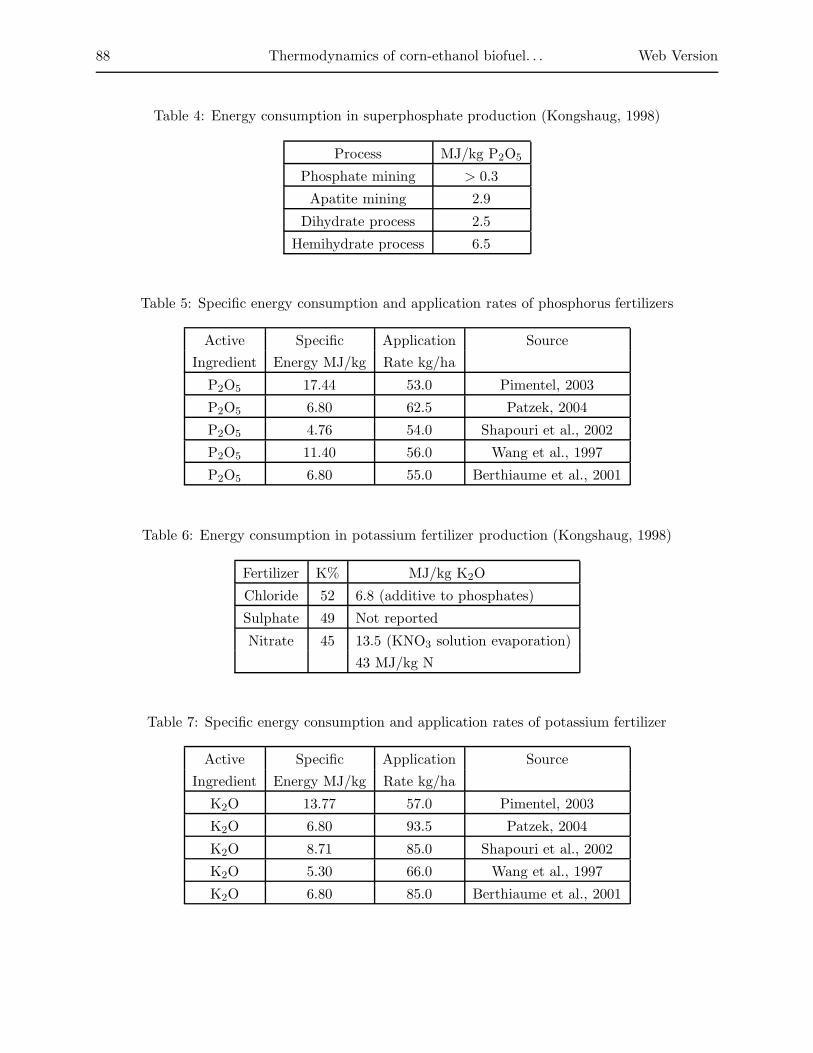
88 Thermodynamics of corn-ethanol biofuel. . . Web Version
Table 4: Energy consumption in superphosphate production (Kongshaug, 1998)
Process MJ/kg P2O5
Phosphate mining > 0.3
Apatite mining 2.9
Dihydrate process 2.5
Hemihydrate process 6.5
Table 5: Specific energy consumption and application rates of phosphorus fertilizers
Active Specific Application Source
Ingredient Energy MJ/kg Rate kg/ha
P2O5 17.44 53.0 Pimentel, 2003
P2O5 6.80 62.5 Patzek, 2004
P2O5 4.76 54.0 Shapouri et al., 2002
P2O5 11.40 56.0 Wang et al., 1997
P2O5 6.80 55.0 Berthiaume et al., 2001
Table 6: Energy consumption in potassium fertilizer production (Kongshaug, 1998)
Fertilizer K% MJ/kg K2O
Chloride 52 6.8 (additive to phosphates)
Sulphate 49 Not reported
Nitrate 45 13.5 (KNO3 solution evaporation)
43 MJ/kg N
Table 7: Specific energy consumption and application rates of potassium fertilizer
Active Specific Application Source
Ingredient Energy MJ/kg Rate kg/ha
K2O 13.77 57.0 Pimentel, 2003
K2O 6.80 93.5 Patzek, 2004
K2O 8.71 85.0 Shapouri et al., 2002
K2O 5.30 66.0 Wang et al., 1997
K2O 6.80 85.0 Berthiaume et al., 2001
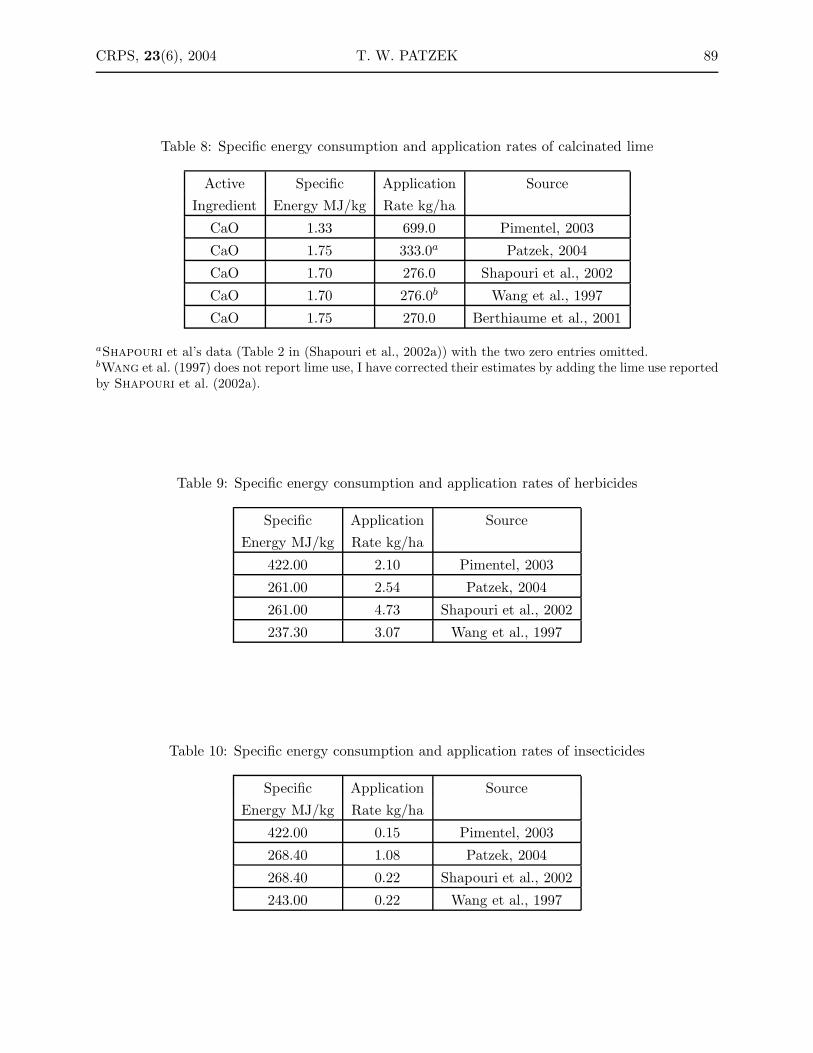
CRPS, 23(6), 2004 T. W. PATZEK 89
Table 8: Specific energy consumption and application rates of calcinated lime
Active Specific Application Source
Ingredient Energy MJ/kg Rate kg/ha
CaO 1.33 699.0 Pimentel, 2003
CaO 1.75 333.0a Patzek, 2004
CaO 1.70 276.0 Shapouri et al., 2002
CaO 1.70 276.0b Wang et al., 1997
CaO 1.75 270.0 Berthiaume et al., 2001
aShapouri et al’s data (Table 2 in (Shapouri et al., 2002a)) with the two zero entries omitted.bWang et al. (1997) does not report lime use, I have corrected their estimates by adding the lime use reportedby Shapouri et al. (2002a).
Table 9: Specific energy consumption and application rates of herbicides
Specific Application Source
Energy MJ/kg Rate kg/ha
422.00 2.10 Pimentel, 2003
261.00 2.54 Patzek, 2004
261.00 4.73 Shapouri et al., 2002
237.30 3.07 Wang et al., 1997
Table 10: Specific energy consumption and application rates of insecticides
Specific Application Source
Energy MJ/kg Rate kg/ha
422.00 0.15 Pimentel, 2003
268.40 1.08 Patzek, 2004
268.40 0.22 Shapouri et al., 2002
243.00 0.22 Wang et al., 1997

90 Thermodynamics of corn-ethanol biofuel. . . Web Version
Table 11: Average high and low heating values of some fossil fuels from (Castorph et al., 1999;Bossel, 2003b; Spiers, 1961). Other sources are listed in the footnotes.
Fuel Density HHVa LHVa HHVa LHVa Sourcei
kg/sm3 MJ/kg MJ/kg MJ/kg MJ/kg
Gasoline 720-800 46.7b 42.5b 46.8 43.6 Table 339
Diesel fuel 840 45.9 43.0 45.3 42.3 Table 350
Methane 0.66d 55.5c 50.1c 55.1(g) Table 347
LPGe 0.58 50.0 46.0
NGf 0.84 48.7 43.9
Ethanol 787h 29.7g 26.7g 29.6 26.8 Table 353
Corn grain dry 18.8j
Corn stoverk 17.7 16.5
Corn stalksl 15.8 14.8
Corn mealm 16.0
Corn oiln 909.5 39.5 38.8
aHHV = High Heating Value; LHV = Low Heating ValuebAverage of gas station fuels, I choose the mean density of 740 kg/m3, The leftmost gasoline, diesel fuel, LPG, and NG dataare from (Castorph et al., 1999)cFrom Bossel, Table A, (Bossel, 2003b)d (Lide, 1994), 6-25eA mixture of propane and butane, C3H8 and C4H10f An average of natural gas compositions from Groningen, Orenb., Ekofisk, and Leman Bankg http://bioenergy.ornl.gov/papers/misc/energy
−conv.html
h (Lide, 1994), 15-46i (Spiers, 1961)j Based on the mean of the values reported by Schneider & Spraque (1955), p. 496, 2033 kcal/lb; and Miller (1958), p.639, 2059 kcal/lb. 1 thermochemical kcal = 4.184 kJk The mature corn stalks of corn from which the ears have been removed. (Domalski et al., 1987), p. 16l (Domalski et al., 1987), p. 17m Zea mays, 11.79% moisture (Domalski et al., 1987), p. 93n Liquid vegetable oil (Domalski et al., 1987), p. 223
Table 12: Calorific values and specific volumes of gasoline used in corn farming
Calorific Volume Source
Value MJ/kg L/ha
56.32 56.0 Pimentel, 2003
46.70 29.0 Patzek, 2004
59.10 29.0 Shapouri et al., 2002
46.70 30.8 Wang et al., 1997

CRPS, 23(6), 2004 T. W. PATZEK 91
Table 13: Calorific values and specific volumes of diesel fuel used in corn farming
Calorific Volume Source
Value MJ/kg L/ha
50.24 90.0 Pimentel, 2003
45.90 80.0 Patzek, 2004
53.97 82.1 Shapouri et al., 2002
45.90 74.3 Wang et al., 1997
45.90 71.0 Berthiaume et al., 2001
Table 14: Calorific values and specific volumes of Liquified Petroleum Gas (LPG) used in cornfarming
Calorific Volume Source
Value MJ/kg L/ha
50.00 47.0 Patzek, 2004
49.18 59.0 Shapouri et al., 2002
50.00 28.7 Wang et al., 1997
50.00 252.0a Berthiaume et al., 2001
a Large quantities of LPG are used to dry wet corn in Quebec.
Table 15: Calorific values and specific volumes of methanea used in corn farming
Calorific Volume Source
Value MJ/kg sm3/ha
55.50 21.3 Patzek, 2004
61.90 14.0 Shapouri et al., 2002
55.50 35.7 Wang et al., 1997
a I will treat natural gas from the various sources as methane

92 Thermodynamics of corn-ethanol biofuel. . . Web Version
Table 16: Specific electric energy inputs to corn farming
Amount Source
kWh/ha
39.9 Pimentel, 2003
191.0 Patzek, 2004
207.6 Shapouri et al., 2002
24.1 Wang et al., 1997
132.0 Berthiaume et al., 2001

CRPS, 23(6), 2004 T. W. PATZEK 93
Table 17: Specific energy used in transportation related to corn farming. Source: Wang et al.(1997)
Category Plant→ Center→ Mixer→
Center Mixer Farm
Travel distance 1700/ 80 50
(km one way) 850
Mode barge/ Class 8b Class 6
rail truck truck
Energy use (kJ/kg) 71 25 53
Total energy use is 720 kJ/kg of field input materials or ∼400 MJ/ha + Commute of Personnel
Table 18: Ethanol yield, specific energy inputs, and energy credits
Yield Yielda Transport Fuel Total Inputs Credits SourceL/ha GJ/ha MJ/L MJ/L MJ/L MJ/L
3201 74.82 1.32 14.75 16.07 1.88 Pimentel, 20033175 74.22 1.74 14.45 16.19 0.00 Patzek, 2004
3137 73.32 0.44 14.45 14.89 5.89 Shapouri et al., 2002
3189 74.55 0.43 13.96 14.39 5.38 Wang et al., 1997
2406 56.24 0.00 17.18 17.18 0.00 Berthiaume et al., 2001
aBased on High Heating Value of ethanol
Table 19: Specific CO2 emissions
NRR Emission Units
Electricity 0.322 kg CO2/kWh
Coal 0.089 kg CO2/MJ
Gasoline 0.067 kg CO2/MJ
Diesel 0.069 kg CO2/MJ
LPG 0.059 kg CO2/MJ
Methane 0.050 kg CO2/MJ
Lime 0.785 kg CO2/kg CaO
Nitrogena 2.70 kg CO2/kg N
Sources: Energy Information Administration (EIA, 2002) Emissions of Greenhouse Gases in the United States 2001, Table B1a G. Kongshaug (1999)

94 Thermodynamics of corn-ethanol biofuel. . . Web Version
Table 20: The specific chemical exergies of compounds participating in the ideal corn-glucose-EtOHcycle. Source: Szargut et al. (1988), Tables I and II in Appendix.
Component Standard Chemical Exergy
MJ/kmol
C6H12O6(s) 2928.8
C2H5OH(l) 1363.9
CO2(g) 19.87
O2(g) 3.97
H2O(l) 0.00
H2(g) 236.1
Table 21: The calculated chemical exergies of the products of steps in Eqs. (24 – 26).
Step Product Exergy After Step
MJ/kmol C6H12O6
1 2952.6
2 2791.4
3 119.2
Net 2833
Net chemical exergy per kg of glucose = 15.74 MJ/kgExergy of matter after Step 1 per kg of glucose = 16.4 MJ/kg = 3920 kcal/kgCycle efficiency = 96%
Table 22: The calculated chemical exergies of the products of steps 1-3 of the ideal corn-ethanol-hydrogen cycle.
Step Product Exergy After Step
MJ/kmol C6H12O6
1 2952.6
2 2791.4
3 2976.2
4 119.2
Net 2809.8
Net chemical exergy per kg of glucose = 15.61 MJ/kgCycle efficiency = 95%

CRPS, 23(6), 2004 T. W. PATZEK 95
Table 23: CExC of major non-renewable resources used in the industrial corn-ethanol cycle.Sources: Table 5.2 in Szargut et al. (1988), and calculations by the author.
NRR Exergy CExC Units Comments
Ammonium Nitrate 10.51 99.6 MJ/kgN 30-years old technology
Phosphate 0.1 10.1 MJ/kg P2O5 H2SO4 CExC
KCl 0.26 6.09 MJ/kg KCl Sylvinite ore, 1:1 K:Na
Lime 1.96 10 MJ/kg CaO Calcinated limestone
Herbicides 261 300 MJ/kg 1.15 exergy
Seeds 104 119 MJ/kg 1.15 exergy
Electricity 3.6 11.83 MJ/kWh Plant eff. of 34.6%
Diesel 44.4 53.2 MJ/kg Typical value
Gasoline 48.3 57.5 MJ/kg Mean value
Natural Gas 50.7 57.9 MJ/kg Typical value
LPG 48.8 61.6 MJ/kg Authothermic cracking
Steel 7.1 45.9 MJ/kg Process ore, blast furnace
Table 24: The First Law summary of the U.S. corn-ethanol production in 2004
29.6 million hectares of corn harvested in the U.S.
299.67 million tonnes of moist corn grain harvested
3.8 million hectares of U.S. cropland growing corn for ethanol
12.7 % of all U.S. corn is farmed for ethanol
0.435 liters of ethanol from 1 kg of corn
12.28 GL/yr of ethanol produced in the U.S.
3.25 billion gal/yr of ethanol produced in the U.S.
9.21 GL GE/yr as ethanol produced in the U.S.
10.01 GL GE/yr burned to produce this ethanol
1.4 % of U.S. automobile fuel from ethanol
25.9 million hectares for 10% U.S. automobile fuel energy
$1.69 billion/yr in federal subsidies for ethanol
$0.32 billion/yr in average state subsidies for ethanol
$1.27 billion/yr in corn-for-ethanol price subsidies
$3.28 billion/yr in total ethanol subsidies
GL = Giga Liter = 109 L; GE = Gasoline Equivalent

96 Thermodynamics of corn-ethanol biofuel. . . Web Version
Table 25: The Second Law summary of the U.S. corn-ethanol production in 2004
$ 1.84 billion/yr Subsidy by the environment with 20% efficient car engine
$ 1.59 billion/yr Subsidy by the environment with 35% efficient car engine
$ 1.18 billion/yr Subsidy by the environment with 60% efficient car engine
$ 12.69 billion/yr 10% of U.S. fuel consumption with 20% efficient car engine
$ 10.98 billion/yr 10% of U.S. fuel consumption with 35% efficient car engine
$ 8.13 billion/yr 10% of U.S. fuel consumption with 60% efficient car engine
Table 26: Primary energy consumption in steel production via integrated mills (Beloff et al., 2004)
Source Processes Reported Energy Notes(MJ/kg-steel)
Young & Vanderburg (1994) Cokemaking, blast fur-nace, BOF, rolling
27 (range 18 - 36) Review of literaturedata, includes 30% scrap
Fruehan et al. (1994) Cokemaking, ore ag-glomeration, blastfurnace, BOF, hot rolling
31.35 Reported as “typical”energy consumption; hotrolling for flat steel
BUWAL (1990) Ore mining, sintering,blast furnace, BOF, hot
26.94 Based on US production1975-1990; for hot-rolledrolling coils
IDEMAT (2001) Raw materials extrac-tion, cokemaking, sinter-ing, pelletizing, blast fur-nace, BOF, oxygen mak-ing, casting
18.85 Based on productionat CORUS plant inthe Netherlands, mayinclude some scrap
Table 27: Primary energy consumption in steel production from 100% recycled scarp via electricarc furnace (EAF) minimills (Beloff et al., 2004)
Source Processes Reported Energy Notes(MJ/kg-steel)
Young & Vanderburg (1994) EAF, rolling 18 (range 9 - 27) Review of literature data
Fruehan et al. (1994) EAF, hot rolling 9.46 Reported as “typical” en-ergy consumption; hotrolling for flat steel
BUWAL (1990) EAF, hot rolling, elec-trode production
14.09 Based on US production1980-1985; for hot-rolledrolled coils
IDEMAT (2001) Recycling, EAF, casting 23.95 Based on steel alloy pro-duced in the Netherlands

CRPS, 23(6), 2004 T. W. PATZEK 97
Table 28: Estimates of primary energy embedded in steel and its constituents (Beloff et al., 2004)
Component Energy GHG Emissions Source(MJ/kg) kg CO2-equiv./kg
Steel 22.5 2.1 Young & Vanderburg (1994)
Manganese 70 5.4 (Haasen and Cahn, 1996)Vanadium 415 33 IDEMAT (2001)
Table 29: Estimates of cumulative exergy consumption (CExC) in steelmaking
Component Exergy CExC Notes(MJ/kg) MJ/kg
Steel billets from ore in the ground 7.1 48.35 (Szargut et al., 1988)
Track roller shaft in a Caterpillar tractor50% ore in the ground and 50% scrap
6.7 34 – 37 (Beloff et al., 2004), material, ore extrac-tion and steelmaking, shape & treat, noaccounting for wastes and utilities
Steel forgings from ore 7.1 83.75 (Szargut et al., 1988)
Steel (finished general products) fromore in the ground
7.1 45.9 (Szargut et al., 1988), ore processing,blast furnace, BOF, continuous castingand finishing
Steel (finished general products) fromore in the ground
7.1 45.9 (Szargut et al., 1988), ore processing, di-rect reduction, EAF, continuous castingand finishing