Thermodynamics of lithium ion batteries · Formation of SEI; Relative thermochemical stabilities of...
43
KIT – University of the State of Baden-Wuerttemberg and National Research Center of the Helmholtz Association Institute for Applied Materials – Applied Materials Physics (IAM-AWP) www.kit.edu Thermodynamics of lithium ion batteries Hans J. Seifert
Transcript of Thermodynamics of lithium ion batteries · Formation of SEI; Relative thermochemical stabilities of...

KIT – University of the State of Baden-Wuerttemberg and National Research Center of the Helmholtz Association
Institute for Applied Materials – Applied Materials Physics (IAM-AWP)
www.kit.edu
Thermodynamics of lithium ion batteriesHans J. Seifert

Crystal structures,Crystal chemistry, Microstructure,Reactivity
Materials- Thermodynamics,- Phase Diagrams, - Kinetics
Electrochemical performanceand safety ofcells / batteries
- SPP1473, Scientific Aims -
Micro- andNanomaterials

Kang and Ceder (2009)
Li-Fe-P-O System

Ong et al. (2008)
Li-Fe-P-O System

Dodd et al. (2006)Li-Fe-P-O System

Detailed phase relationships in the subsystemLiMn2O4 - Li4Mn5O12 – Li2Mn4O9 (Yonemura et al. 2004).
Li-Mn-O System

Temperature-Composition Ratio Section in the Li-Mn-O System
60
p(O2)=0.21 atm
[1999Pau] Paulsen and Dahn, Chem. Mater., 11, 3065-3079, 1999
Li-Mn-O System
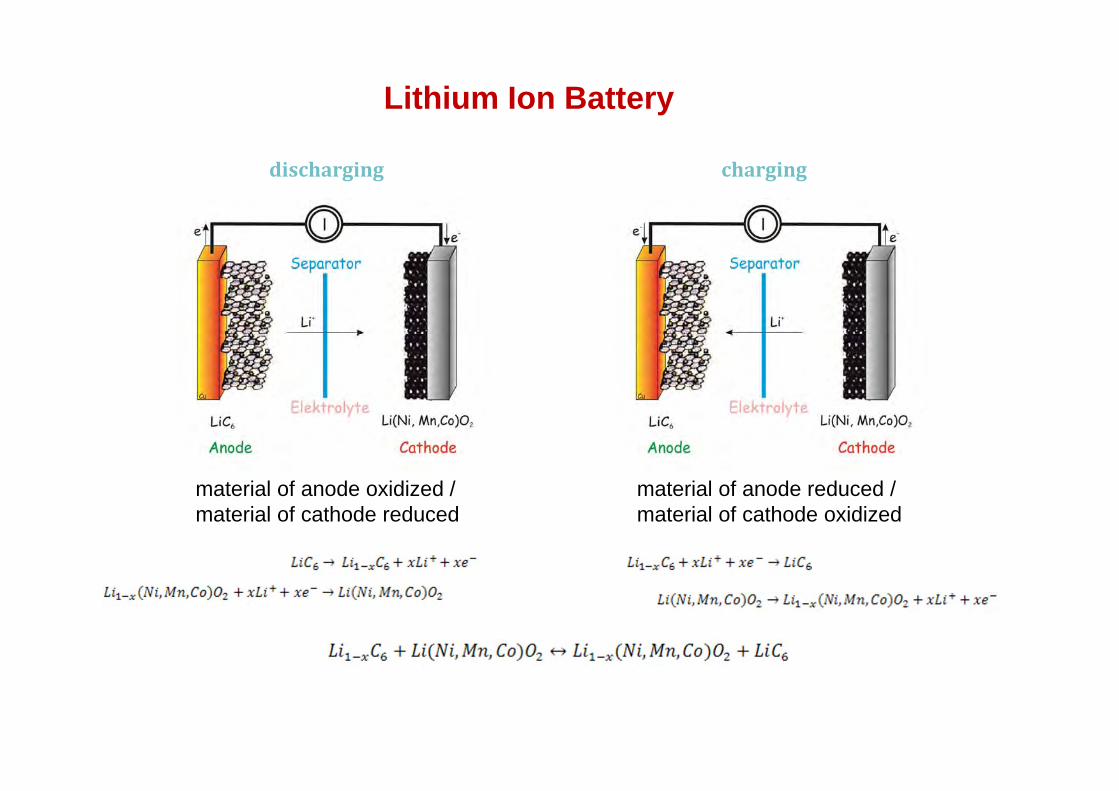
discharging charging
Lithium Ion Battery
material of anode oxidized /material of cathode reduced
material of anode reduced /material of cathode oxidized

Li-Mn-O System

Li-Mn-O System
R. Huggins, Advanced Batteries

Heat generation rates
Sources of heat generation:1. The “reversible” heat released (or absorbed)
by the chemical reaction of the cell2. The “irreversible” heat generation by ohmic
resistance and polarisation3. The heat generation by “side reactions”,
i.e. parasitic/corrosion reactions and “chemical shorts”
S. Hallaj, H. Maleki, J.S. Hong, J.R. Selman, J. Power Source 83, p.1-8 (1999)

Cp, eff measurement on a 40Ah pouch cell
U = 4,1V
U = 3,0V

J.R. Selman, S. Hallaj , J. Power Source 97-98, p.726-732 (2001)
Separation of reversible and irreversible parts

Li-Mn-O Temperature-Composition Ratio Section
Li-rich boundary of the homogeneity range Li1+xMn2-xO4 should be refined• Samples prepared using a modified Pechini method• The homogeneity range of the spinel phase determined using thermogravimmetric analysis atpo2=0.2 atm
0.525
755°C
Enthalpy of Drop Solution of Li1+xMn2-xO4-δ

Section in the Li-Mn-O phase diagram(Thackeray et al., 1995).
Li-Mn-O System

69
Li-Mn-O System, sample preparation

Decomposition of LiMn2O4 in air Samples heat treated at 15 hours and quenched in liquid nitrogen
70
Li-Mn-O System

Open circuit voltage as a function of Li concentration in LiMn2O4
Entropy as a function of Li concentration in LiMn2O4
In-situ technique “entropymetry”
Yazami et al. in Lithium Ion Rechargeable Batteries, WILEY-VCH (2010)
Note: Half cells measured

2nd kind phase diagram in the Li-Mn-O system
Luo and Martin, 2007
Paulsen and Dahn, 1999
Yonemura et al. 2004
Li-Mn-O System

Battery Properties Thermodynamics and Kinetics
Thermal runaway Oxygen partial pressure,Gibbs free energies of reactions
Voltage, potential Chemical potentials (of lithium)Capacity, energy- and power density
Phase diagrams,Gibbs free energies
Life time Stability of compounds in battery; Materials constitution
Power- and materials loss during first charge cycle
Formation of SEI; Relative thermochemical stabilities of materials for electrodes and electrolyte
German Research Foundation, Priority Program 1473,Materials with New Design for Improved Lithium Ion Batteries -
WeNDeLIB

2
1
021
),(x
x x
xx T
TxEFS
2
1
00
21
),(),(x
x x
xx dx
TTxETTxEFH
10,max
yxxy
1
0
010
),( dyT
TyEFSy
1
0
00
10
),(),( dyT
TyETTyEFHy
Relationships Thermodynamics and Electrochemistry
Total change in enthalpy and entropy between two electrode compositions x1 and x2:
… and with normalization
Thermodynamic functions of active materials are needed
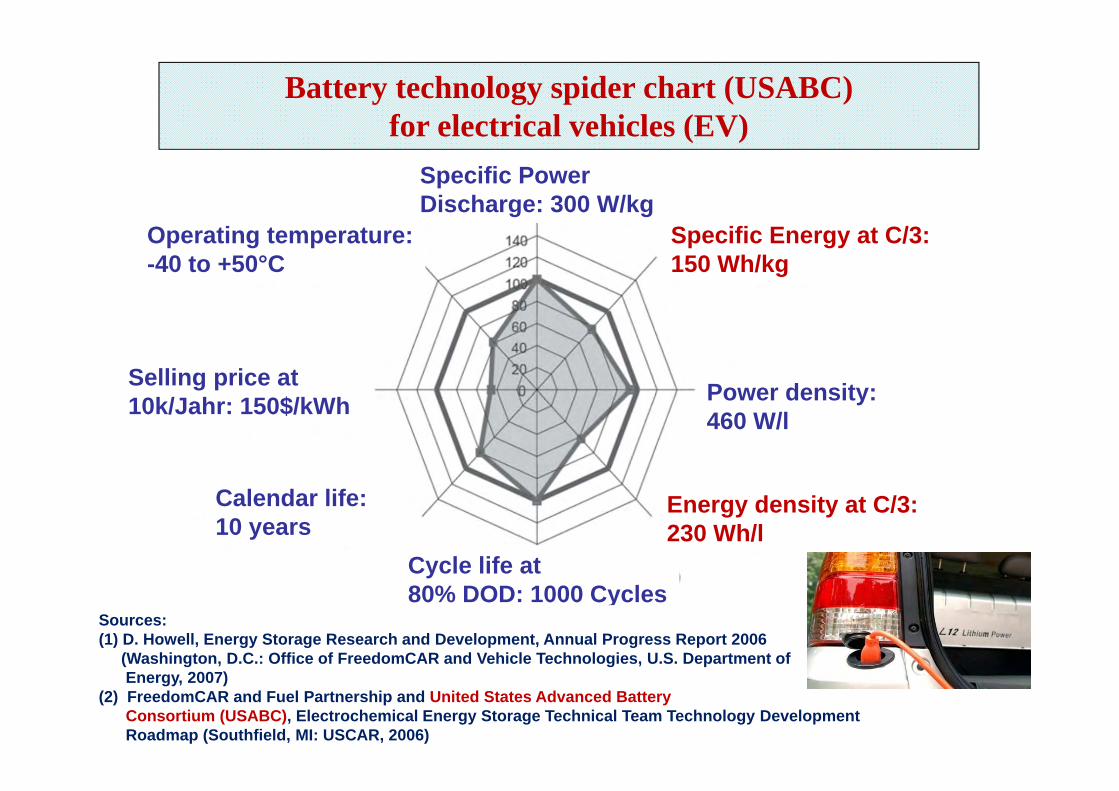
Cycle life at80% DOD: 1000 Cycles
Calendar life:10 years
Selling price at10k/Jahr: 150$/kWh
Operating temperature:-40 to +50°C
Specific Power Discharge: 300 W/kg
Specific Energy at C/3:150 Wh/kg
Power density:460 W/l
Energy density at C/3:230 Wh/l
Sources: (1) D. Howell, Energy Storage Research and Development, Annual Progress Report 2006
(Washington, D.C.: Office of FreedomCAR and Vehicle Technologies, U.S. Department of Energy, 2007)
(2) FreedomCAR and Fuel Partnership and United States Advanced Battery Consortium (USABC), Electrochemical Energy Storage Technical Team Technology Development Roadmap (Southfield, MI: USCAR, 2006)
Battery technology spider chart (USABC)for electrical vehicles (EV)

M Winter, J. O. Besenhard, Chem. uns. Zeit 33, p. 320-332 (1999)

Thermodynamic calculations based on the CALPHAD method– predict battery performanceequilibrium voltages (OCV)plateau capacities
Database development for the Li-Cu-Fe-O System– The Cu-Fe-O ternary system assessed by Khvan et al. – First calculated phase diagrams in the Li-Cu-Osystem addressed in present work
K. Chang, B. Hallstedt, CALPHAD, 2011, 35:160-164N. Saunders, I. Ansara (Ed), Cost 507, Report,1994,168–169B. Hallstedt,L.J. Gauckler CALPHAD, 2003, 27:177-191
Li-Cu-Fe-O System

Discharge parameters:- Method: constant current (CC)- Umin = 2.75 V- I = 16 mA → 1C-rate
Charge parameters:- Method: constant current,
constant voltage(CCCV)- Umax = 4.25 V- I = 16 mA → 1C-rate- Imin = 1.6 mA
Isothermal Battery Calorimeter (IBC)
Cell type: coin cell LIR 2016, Conrad energy (commercial)Capacity: 20 5 mAh; Working voltage: 3.6 V
Isothermal calorimetric measurements on a 16 mAh Lithium ion coin cell

Temperature Tenv = 20 °C Temperature Tenv = 40 °C
0 2500 5000 7500 10000 1250002468
102,753,003,253,503,754,004,25-15-10-505
1015
Hea
t [m
W]
Time [s]
Volta
ge [V
]
Cur
rent
[mA
]
0 2500 5000 7500 10000 1250002468
102,753,003,253,503,754,004,25-15-10-505
1015
Hea
t [m
W]
Time [s]
Volta
ge [V
]
Cur
rent
[mA
]
Isothermal calorimetric measurements on a 16 mAh Lithium ion coin cell
Charge (16 mA) Charge (16 mA)Discharge (16 mA) Discharge (16 mA)

Accelerating Rate Calorimeter (ARC)
EVARC: Ø: 25cmh: 50cm
ARC provides an adiabatic environment in which a samplemay be studied under conditions of negligible heat loss
heat of reaction:
total heat generated:
ESARC: Ø: 10cmh: 10cm

Thermodynamics of electrochemical reactions
Thermal Runaway electrochemical reaction
Gibbs-Helmholtz equation
entropic change of electrochem. reaction
reversible heat
S. Tobishima, J.Yamaki, J. Power Source 81-82, p. 882–886 (1999)A.K. Shukla, T.P. Kumar, Current Sci. 94, p. 314-331 (2008)
start of thermal runawaycell catch fire

AlexSys 1000, SETARAMHigh Temperature Calvet Calorimeter
Enthalpy of Drop Solution of Li1+xMn2-xO4-δ
Sodium Molybdate, 700°C

Sample Number DROP 1 DROP 2 DROP 3 DROP 4 DROP 5Date 08. Mai 08. Mai 08. Mai 08. Mai 08. MaiMass pellet (mg) 6,00 5,14 6,10 6,62 4,85T(room) (°C) 23,90 24,10 24,20 24,10 24,20T(cal.) (°C) 700,40 700,40 700,40 700,40 700,40Formula weight (g/mol) 180,815 180,815 180,815 180,815 180,815Moles of LiMn2O4 (mol) 0,0000332 0,0000284 0,0000337 0,0000366 0,0000268Peak Area [µV.s] 1832,4170 1538,5640 1765,6030 1910,2030 1402,3320Calibration factor from Al2O3 calibration[J/µV.s] 0,00462077 0,00462077 0,00462077 0,00462077 0,00462077Measured Heat Effect (kJ/mol) 255,1652 250,0926 241,8308 241,0849 241,5781Accepted Measurement 0 0 1 1 1
DROP 6 DROP 7 DROP 809. Mai 09. Mai 09. Mai
5,35 4,83 5,5924,50 24,30 24,20
700,40 700,40 700,40180,815 180,815 180,815
0,0000296 0,0000267 0,00003091544,6110 1397,2290 1611,2630
0,00462077 0,00462077 0,00462077241,2203 241,6957 240,8258
1 1 1
Enthalpy of Drop Solution of Li1+xMn2-xO4-δ

2nd kind phase diagram in the Li-Mn-O system
Luo and Martin, 2007
Paulsen and Dahn, 1999
Yonemura et al. 2004
Li-Mn-O System

Chemical potential diagram in the Li-Mn-O system (Tsuji et al. 2005).
What to do next: (1) Evaluation; (2) Solution phase modeling; (3) Thermodynamic optimization
Li-Mn-O System

Experimental Potential Diagram for Stoichiometric LiMn2O4
86[2005Tsu] Tsuji et al., J. Chem. Phys. Solids, 66, 283-287, 2005
Li-Mn-O System

Critically Evaluated Potential Diagram for Stoichiometric LiMn2O4
87
Li-Mn-O System

Temperature-Composition Ratio and Potential Diagrams LiMn2O4 composition is a vertical line in the temperature-composition ratio diagram p(O2)=0.21 atm is a horizontal line in the potential diagram
88
Li-Mn-O System

Potential diagram at constant Li/Mn ratio
89
Li/Mn ratio for LiMn2O4
LiMn2O4 ↔ zLi2MnO3 + Li1-2zMn2-zO4-3z-y(tet) + (y/2)O2Li1-2zMn2-zO4-3z-y (tet) ↔ LiMnO2 +(1/3) Mn3O4 + {(1/3)-(y/2)}O2[1999 Pau] Chem. Mater., 11 (1999), 3065-3079.[2005 Tsu] J. Phys. Chem., Solids. 66 (2005), 283-287.
Li-Mn-O System
p(O2)=0.21 atm

Spinel
Commercial cathode material LiMn2O4
Spinel structure
LiMn2O4 : ≈ 100 mAh/g
Gravimetrical energy density (capacity)

Dodd et al. (2006) Li-Fe-P-O System

Graphite LiCoO2
Solid Electrolyte Interface
Lithium Ion Batteries – Operation
Separator

Ong et al. (2008)
Li-Fe-P-O System

Li-Fe-P-O System

Modellingand SimulationCALPHAD
Phase Field
Ab-initio
Kratzer et al.,http://www.fhi-berlin.mpg.de
++
interfaces(length scale)
mechanical equilibrium(energy scale)
transport / diffusion(time scale)
+
Chelikowsky et al.,Phys. Rev. B 14, 556 (1976)
covalent
ionic

Accidents with lithium ion batteries
stationary energy storage– overcharging
Rechargable batteryof a laptop– overheating orinternal short circuit
Fire 3 days after crashtest with EV – mechanical impact