Thermodynamics Heat & Work The First Law of...
56
Thermodynamics Heat & Work The First Law of Thermodynamics Lana Sheridan De Anza College April 26, 2016
Transcript of Thermodynamics Heat & Work The First Law of...

ThermodynamicsHeat & Work
The First Law of Thermodynamics
Lana Sheridan
De Anza College
April 26, 2016

Last time
• applying the ideal gas equation
• thermal energy
• heat capacity
• phase changes
• latent heat
Overview
• more about phase changes
• work, heat, and the first law of thermodynamics
• P-V diagrams
• applying the first law in various cases
• heat transfer

Evaporation
evaporation
the process by which a liquid changes to a gas at the liquid surface
Since changing from a liquid to a gas requires heat, when a liquidevaporates it takes heat from its surroundings.
This is why humans sweat in hot weather, pigs wallow puddles,and dogs pant. All are trying to use evaporation of water to reducebody temperature.

Evaporation
Ben Franklin noticed that a wet shirt kept him feeling cool on ahot day.
He decided to experiment to see if the temperature of objectscould be lowered by this process.
In 1758 he and John Hadley took a mercury thermometer andrepeatedly wet the bulb with ether while using bellows to keep airmoving over it.
Despite it being a warm day, they recorded temperatures as low as7◦ F (−14◦C) at the bulb of the thermometer.
This is the basic idea behind refrigeration!

Regelation
This is a phenomenon seen in water because its density is lower inits solid state.
High pressure applied to solid water causes it to melt, even at lowtemperatures.
This makes ice skating work.

Phase Change paths

Phase Diagrams
1A typical phase diagram. The dashed green line shows the unusualbehavior of water. Diagram by Matthieumarechal, Wikipedia.
Liquids below their melting point & above theirboiling point
Phase changes require the bond structure of the substance tochange.
As a liquid is cooled, it will generally start to freeze at one pointbefore another. (Symmetry breaking.) For example, ice cubes in afreezer freeze from the top down.
As water freezes solid crystals form and spread throughout.
If the water is very pure and cooled without shaking, it can becooled below 0◦C without freezing.
This is called supercooling and can happen in some other liquidsalso under the right conditions.

Liquids below their melting point & above theirboiling point
The same thing can happen when water (or other liquids) areheated just above their boiling points.
As the liquid starts to boil, bubbles of vapor form inside it. Thishappens most easily at defects in the edges of the container.
If the container is very smooth and not shaken, the only way theliquid can vaporize is from the middle. Surface tension opposesthis.
The liquid can be heated a bit above its boiling point.
This is called superheating.
It is used in bubble chambers to observe charged particles.

Liquids below their melting point & above theirboiling point
Bubble chambers:
1Left, figure by aarchiba, Wikipedia; right, IOPhttp://cerncourier.com/cws/article/cern/28742

Heat and Work
We now take a closer look at the first law of thermodynamics.
To do this, we will take a deeper look at work and heat.
We also need to consider our system more carefully.
Thermodynamic Equilibrium States
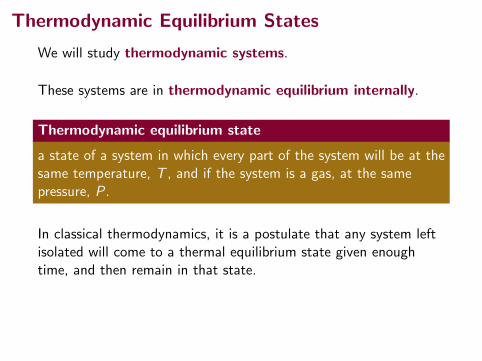
We will study thermodynamic systems.
These systems are in thermodynamic equilibrium internally.
Thermodynamic equilibrium state
a state of a system in which every part of the system will be at thesame temperature, T , and if the system is a gas, at the samepressure, P.
In classical thermodynamics, it is a postulate that any system leftisolated will come to a thermal equilibrium state given enoughtime, and then remain in that state.
In particular, for our present discussion we will be considering anideal gas. (Can use PV = nRT .)

Thermodynamic Equilibrium States
We will study thermodynamic systems.
These systems are in thermodynamic equilibrium internally.
Thermodynamic equilibrium state
a state of a system in which every part of the system will be at thesame temperature, T , and if the system is a gas, at the samepressure, P.
In classical thermodynamics, it is a postulate that any system leftisolated will come to a thermal equilibrium state given enoughtime, and then remain in that state.
In particular, for our present discussion we will be considering anideal gas. (Can use PV = nRT .)

Ideal Gases
Ideal gas clarification.
We make the following assumptions in the ideal gas model:
• the volume of the gas particles is negligible compared to thetotal gas volume
• molecules are identical hard spheres (will relax this later)
• collisions between molecules are elastic
• there are no intermolecular forces (aside from hard-spherecollisions)
• there are no long-range forces from the environment (can berelaxed)
A real gas is behaves as an idea gas when it is at high temperatureand low density (far from condensation).

Variables
The variables we will use can be broken into types:
state variables – describe system’s state / properties – T , P, V ,and Eint.
transfer variables – describing energy transferred into our out ofthe system – Q, W
intensive variables – variables that don’t change value when thesystem is doubled in size – P, T , ρ, c
extensive variables – variables that double their value when thesystem is doubled in size – V , Eint, m, C

Work done on a gas
Imagine compressing a gas in a piston quasi-statically (meaningslowly enough so the gas remains in thermal equilibrium).
20.4 Work and Heat in Thermodynamic Processes 601
dy
P
A
V
a b
Figure 20.4 Work is done on a gas contained in a cylinder at a pressure P as the piston is pushed downward so that the gas is compressed.
What if the final state of the system is water at 100°C? Would we need more steam or less steam? How would the analysis above change?
Answer More steam would be needed to raise the temperature of the water and glass to 100°C instead of 50.0°C. There would be two major changes in the analysis. First, we would not have a term Q 3 for the steam because the water that condenses from the steam does not cool below 100°C. Second, in Q cold, the temperature change would be 80.0°C instead of 30.0°C. For practice, show that the result is a required mass of steam of 31.8 g.
WHAT IF ?
Substitute numerical values:
ms 5 210.200 kg 2 14 186 J/kg # 8C 2 150.08C 2 20.08C 2 1 10.100 kg 2 1837 J/kg # 8C 2 150.08C 2 20.08C 212 010 J/kg # 8C 2 11008C 2 1308C 2 2 12.26 3 106 J/kg 2 1 14 186 J/kg # 8C 2 150.08C 2 1008C 2
5 1.09 3 1022 kg 5 10.9 g
▸ 20.4 c o n t i n u e d
20.4 Work and Heat in Thermodynamic ProcessesIn thermodynamics, we describe the state of a system using such variables as pres-sure, volume, temperature, and internal energy. As a result, these quantities belong to a category called state variables. For any given configuration of the system, we can identify values of the state variables. (For mechanical systems, the state vari-ables include kinetic energy K and potential energy U.) A state of a system can be specified only if the system is in thermal equilibrium internally. In the case of a gas in a container, internal thermal equilibrium requires that every part of the gas be at the same pressure and temperature. A second category of variables in situations involving energy is transfer vari-ables. These variables are those that appear on the right side of the conservation of energy equation, Equation 8.2. Such a variable has a nonzero value if a process occurs in which energy is transferred across the system’s boundary. The transfer variable is positive or negative, depending on whether energy is entering or leaving the system. Because a transfer of energy across the boundary represents a change in the system, transfer variables are not associated with a given state of the system, but rather with a change in the state of the system. In the previous sections, we discussed heat as a transfer variable. In this section, we study another important transfer variable for thermodynamic systems, work. Work performed on particles was studied extensively in Chapter 7, and here we investigate the work done on a deformable system, a gas. Consider a gas contained in a cylinder fitted with a movable piston (Fig. 20.4). At equilibrium, the gas occupies a volume V and exerts a uniform pressure P on the cylinder’s walls and on the piston. If the pis-ton has a cross-sectional area A, the magnitude of the force exerted by the gas on the piston is F 5 PA. By Newton’s third law, the magnitude of the force exerted by the pis-ton on the gas is also PA. Now let’s assume we push the piston inward and compress the gas quasi-statically, that is, slowly enough to allow the system to remain essen-tially in internal thermal equilibrium at all times. The point of application of the force on the gas is the bottom face of the piston. As the piston is pushed downward by an external force F
S 5 2F j through a displacement of d rS 5 dy j (Fig. 20.4b), the
work done on the gas is, according to our definition of work in Chapter 7,
dW 5 FS
?d rS 5 2F j ?dy j 5 2F dy 5 2PA dy
The mass of the piston is assumed to be negligible in this discussion. Because A dy is the change in volume of the gas dV, we can express the work done on the gas as
dW 5 2P dV (20.8)
If the gas is compressed, dV is negative and the work done on the gas is positive. If the gas expands, dV is positive and the work done on the gas is negative. If the
How much work is done on the gas?1Figure form Serway & Jewett.

Work done on a gas
20.4 Work and Heat in Thermodynamic Processes 601
dy
P
A
V
a b
Figure 20.4 Work is done on a gas contained in a cylinder at a pressure P as the piston is pushed downward so that the gas is compressed.
What if the final state of the system is water at 100°C? Would we need more steam or less steam? How would the analysis above change?
Answer More steam would be needed to raise the temperature of the water and glass to 100°C instead of 50.0°C. There would be two major changes in the analysis. First, we would not have a term Q 3 for the steam because the water that condenses from the steam does not cool below 100°C. Second, in Q cold, the temperature change would be 80.0°C instead of 30.0°C. For practice, show that the result is a required mass of steam of 31.8 g.
WHAT IF ?
Substitute numerical values:
ms 5 210.200 kg 2 14 186 J/kg # 8C 2 150.08C 2 20.08C 2 1 10.100 kg 2 1837 J/kg # 8C 2 150.08C 2 20.08C 212 010 J/kg # 8C 2 11008C 2 1308C 2 2 12.26 3 106 J/kg 2 1 14 186 J/kg # 8C 2 150.08C 2 1008C 2
5 1.09 3 1022 kg 5 10.9 g
▸ 20.4 c o n t i n u e d
20.4 Work and Heat in Thermodynamic ProcessesIn thermodynamics, we describe the state of a system using such variables as pres-sure, volume, temperature, and internal energy. As a result, these quantities belong to a category called state variables. For any given configuration of the system, we can identify values of the state variables. (For mechanical systems, the state vari-ables include kinetic energy K and potential energy U.) A state of a system can be specified only if the system is in thermal equilibrium internally. In the case of a gas in a container, internal thermal equilibrium requires that every part of the gas be at the same pressure and temperature. A second category of variables in situations involving energy is transfer vari-ables. These variables are those that appear on the right side of the conservation of energy equation, Equation 8.2. Such a variable has a nonzero value if a process occurs in which energy is transferred across the system’s boundary. The transfer variable is positive or negative, depending on whether energy is entering or leaving the system. Because a transfer of energy across the boundary represents a change in the system, transfer variables are not associated with a given state of the system, but rather with a change in the state of the system. In the previous sections, we discussed heat as a transfer variable. In this section, we study another important transfer variable for thermodynamic systems, work. Work performed on particles was studied extensively in Chapter 7, and here we investigate the work done on a deformable system, a gas. Consider a gas contained in a cylinder fitted with a movable piston (Fig. 20.4). At equilibrium, the gas occupies a volume V and exerts a uniform pressure P on the cylinder’s walls and on the piston. If the pis-ton has a cross-sectional area A, the magnitude of the force exerted by the gas on the piston is F 5 PA. By Newton’s third law, the magnitude of the force exerted by the pis-ton on the gas is also PA. Now let’s assume we push the piston inward and compress the gas quasi-statically, that is, slowly enough to allow the system to remain essen-tially in internal thermal equilibrium at all times. The point of application of the force on the gas is the bottom face of the piston. As the piston is pushed downward by an external force F
S 5 2F j through a displacement of d rS 5 dy j (Fig. 20.4b), the
work done on the gas is, according to our definition of work in Chapter 7,
dW 5 FS
?d rS 5 2F j ?dy j 5 2F dy 5 2PA dy
The mass of the piston is assumed to be negligible in this discussion. Because A dy is the change in volume of the gas dV, we can express the work done on the gas as
dW 5 2P dV (20.8)
If the gas is compressed, dV is negative and the work done on the gas is positive. If the gas expands, dV is positive and the work done on the gas is negative. If the
Definition of work:
W =
∫F · dr
For this system:
W =
∫(−F j) · dy j
= −
∫F dy
= −
∫P A dy
= −
∫P dV
W = −
∫Vf
Vi
P dV
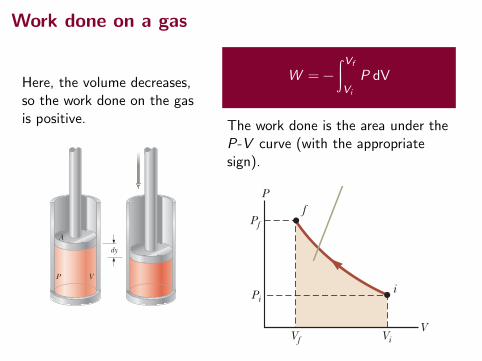
Work done on a gas
Here, the volume decreases,so the work done on the gasis positive.
20.4 Work and Heat in Thermodynamic Processes 601
dy
P
A
V
a b
Figure 20.4 Work is done on a gas contained in a cylinder at a pressure P as the piston is pushed downward so that the gas is compressed.
What if the final state of the system is water at 100°C? Would we need more steam or less steam? How would the analysis above change?
Answer More steam would be needed to raise the temperature of the water and glass to 100°C instead of 50.0°C. There would be two major changes in the analysis. First, we would not have a term Q 3 for the steam because the water that condenses from the steam does not cool below 100°C. Second, in Q cold, the temperature change would be 80.0°C instead of 30.0°C. For practice, show that the result is a required mass of steam of 31.8 g.
WHAT IF ?
Substitute numerical values:
ms 5 210.200 kg 2 14 186 J/kg # 8C 2 150.08C 2 20.08C 2 1 10.100 kg 2 1837 J/kg # 8C 2 150.08C 2 20.08C 212 010 J/kg # 8C 2 11008C 2 1308C 2 2 12.26 3 106 J/kg 2 1 14 186 J/kg # 8C 2 150.08C 2 1008C 2
5 1.09 3 1022 kg 5 10.9 g
▸ 20.4 c o n t i n u e d
20.4 Work and Heat in Thermodynamic ProcessesIn thermodynamics, we describe the state of a system using such variables as pres-sure, volume, temperature, and internal energy. As a result, these quantities belong to a category called state variables. For any given configuration of the system, we can identify values of the state variables. (For mechanical systems, the state vari-ables include kinetic energy K and potential energy U.) A state of a system can be specified only if the system is in thermal equilibrium internally. In the case of a gas in a container, internal thermal equilibrium requires that every part of the gas be at the same pressure and temperature. A second category of variables in situations involving energy is transfer vari-ables. These variables are those that appear on the right side of the conservation of energy equation, Equation 8.2. Such a variable has a nonzero value if a process occurs in which energy is transferred across the system’s boundary. The transfer variable is positive or negative, depending on whether energy is entering or leaving the system. Because a transfer of energy across the boundary represents a change in the system, transfer variables are not associated with a given state of the system, but rather with a change in the state of the system. In the previous sections, we discussed heat as a transfer variable. In this section, we study another important transfer variable for thermodynamic systems, work. Work performed on particles was studied extensively in Chapter 7, and here we investigate the work done on a deformable system, a gas. Consider a gas contained in a cylinder fitted with a movable piston (Fig. 20.4). At equilibrium, the gas occupies a volume V and exerts a uniform pressure P on the cylinder’s walls and on the piston. If the pis-ton has a cross-sectional area A, the magnitude of the force exerted by the gas on the piston is F 5 PA. By Newton’s third law, the magnitude of the force exerted by the pis-ton on the gas is also PA. Now let’s assume we push the piston inward and compress the gas quasi-statically, that is, slowly enough to allow the system to remain essen-tially in internal thermal equilibrium at all times. The point of application of the force on the gas is the bottom face of the piston. As the piston is pushed downward by an external force F
S 5 2F j through a displacement of d rS 5 dy j (Fig. 20.4b), the
work done on the gas is, according to our definition of work in Chapter 7,
dW 5 FS
?d rS 5 2F j ?dy j 5 2F dy 5 2PA dy
The mass of the piston is assumed to be negligible in this discussion. Because A dy is the change in volume of the gas dV, we can express the work done on the gas as
dW 5 2P dV (20.8)
If the gas is compressed, dV is negative and the work done on the gas is positive. If the gas expands, dV is positive and the work done on the gas is negative. If the
W = −
∫Vf
Vi
P dV
The work done is the area under theP-V curve (with the appropriatesign).
602 Chapter 20 The First Law of Thermodynamics
volume remains constant, the work done on the gas is zero. The total work done on the gas as its volume changes from Vi to Vf is given by the integral of Equation 20.8:
W 5 23Vf
Vi
P dV (20.9)
To evaluate this integral, you must know how the pressure varies with volume dur-ing the process. In general, the pressure is not constant during a process followed by a gas, but depends on the volume and temperature. If the pressure and volume are known at each step of the process, the state of the gas at each step can be plotted on an important graphical representation called a PV diagram as in Figure 20.5. This type of diagram allows us to visualize a process through which a gas is progressing. The curve on a PV diagram is called the path taken between the initial and final states. Notice that the integral in Equation 20.9 is equal to the area under a curve on a PV diagram. Therefore, we can identify an important use for PV diagrams:
The work done on a gas in a quasi-static process that takes the gas from an initial state to a final state is the negative of the area under the curve on a PV diagram, evaluated between the initial and final states.
For the process of compressing a gas in a cylinder, the work done depends on the particular path taken between the initial and final states as Figure 20.5 suggests. To illustrate this important point, consider several different paths connecting i and f (Fig. 20.6). In the process depicted in Figure 20.6a, the volume of the gas is first reduced from Vi to Vf at constant pressure Pi and the pressure of the gas then increases from Pi to Pf by heating at constant volume Vf . The work done on the gas along this path is 2Pi(Vf 2 Vi). In Figure 20.6b, the pressure of the gas is increased from Pi to Pf at constant volume Vi and then the volume of the gas is reduced from Vi to Vf at constant pressure Pf . The work done on the gas is 2Pf(Vf 2 Vi). This value is greater than that for the process described in Figure 20.6a because the piston is moved through the same displacement by a larger force. Finally, for the process described in Figure 20.6c, where both P and V change continuously, the work done on the gas has some value between the values obtained in the first two processes. To evaluate the work in this case, the function P(V ) must be known so that we can evaluate the integral in Equation 20.9. The energy transfer Q into or out of a system by heat also depends on the pro-cess. Consider the situations depicted in Figure 20.7. In each case, the gas has the same initial volume, temperature, and pressure, and is assumed to be ideal. In Figure 20.7a, the gas is thermally insulated from its surroundings except at the bottom of the gas-filled region, where it is in thermal contact with an energy reservoir. An energy reservoir is a source of energy that is considered to be so great that a finite transfer of energy to or from the reservoir does not change its temperature. The piston is held
Work done on a gas X
fPf
P
i
VViVf
Pi
fPf
P
i
VViVf
Pi
fPf
P
i
VViVf
Pi
A constant-pressure compression followed by a constant-volume process
A constant-volume process followed by a constant-pressure compression
An arbitrary compression
a b c
Figure 20.6 The work done on a gas as it is taken from an initial state to a final state depends on the path between these states.
Figure 20.5 A gas is compressed quasi-statically (slowly) from state i to state f. An outside agent must do positive work on the gas to compress it.
fPf
P
i
VViVf
Pi
The work done on a gas equals the negative of the area under the PV curve. The area is negative here because the volume is decreasing, resulting in positive work.

Aside: P-V Diagrams
P-V diagrams are very useful in thermodynamics.
Example of a P-V diagram:
602 Chapter 20 The First Law of Thermodynamics
volume remains constant, the work done on the gas is zero. The total work done on the gas as its volume changes from Vi to Vf is given by the integral of Equation 20.8:
W 5 23Vf
Vi
P dV (20.9)
To evaluate this integral, you must know how the pressure varies with volume dur-ing the process. In general, the pressure is not constant during a process followed by a gas, but depends on the volume and temperature. If the pressure and volume are known at each step of the process, the state of the gas at each step can be plotted on an important graphical representation called a PV diagram as in Figure 20.5. This type of diagram allows us to visualize a process through which a gas is progressing. The curve on a PV diagram is called the path taken between the initial and final states. Notice that the integral in Equation 20.9 is equal to the area under a curve on a PV diagram. Therefore, we can identify an important use for PV diagrams:
The work done on a gas in a quasi-static process that takes the gas from an initial state to a final state is the negative of the area under the curve on a PV diagram, evaluated between the initial and final states.
For the process of compressing a gas in a cylinder, the work done depends on the particular path taken between the initial and final states as Figure 20.5 suggests. To illustrate this important point, consider several different paths connecting i and f (Fig. 20.6). In the process depicted in Figure 20.6a, the volume of the gas is first reduced from Vi to Vf at constant pressure Pi and the pressure of the gas then increases from Pi to Pf by heating at constant volume Vf . The work done on the gas along this path is 2Pi(Vf 2 Vi). In Figure 20.6b, the pressure of the gas is increased from Pi to Pf at constant volume Vi and then the volume of the gas is reduced from Vi to Vf at constant pressure Pf . The work done on the gas is 2Pf(Vf 2 Vi). This value is greater than that for the process described in Figure 20.6a because the piston is moved through the same displacement by a larger force. Finally, for the process described in Figure 20.6c, where both P and V change continuously, the work done on the gas has some value between the values obtained in the first two processes. To evaluate the work in this case, the function P(V ) must be known so that we can evaluate the integral in Equation 20.9. The energy transfer Q into or out of a system by heat also depends on the pro-cess. Consider the situations depicted in Figure 20.7. In each case, the gas has the same initial volume, temperature, and pressure, and is assumed to be ideal. In Figure 20.7a, the gas is thermally insulated from its surroundings except at the bottom of the gas-filled region, where it is in thermal contact with an energy reservoir. An energy reservoir is a source of energy that is considered to be so great that a finite transfer of energy to or from the reservoir does not change its temperature. The piston is held
Work done on a gas X
fPf
P
i
VViVf
Pi
fPf
P
i
VViVf
Pi
fPf
P
i
VViVf
Pi
A constant-pressure compression followed by a constant-volume process
A constant-volume process followed by a constant-pressure compression
An arbitrary compression
a b c
Figure 20.6 The work done on a gas as it is taken from an initial state to a final state depends on the path between these states.
Figure 20.5 A gas is compressed quasi-statically (slowly) from state i to state f. An outside agent must do positive work on the gas to compress it.
fPf
P
i
VViVf
Pi
The work done on a gas equals the negative of the area under the PV curve. The area is negative here because the volume is decreasing, resulting in positive work.
They are graphs of pressure vs volume for a fixed quantity(n moles) of an ideal gas.
They contain a lot of information.
1Figure form Serway & Jewett, 9th ed, page 602.

Aside: P-V Diagrams
Example of a P-V diagram:
53720-3 CHANG E I N E NTROPYPART 2
Entropy differs from energy in that entropy does not obey a conservation law.The energy of a closed system is conserved; it always remains constant. Forirreversible processes, the entropy of a closed system always increases. Because ofthis property, the change in entropy is sometimes called “the arrow of time.” Forexample, we associate the explosion of a popcorn kernel with the forwarddirection of time and with an increase in entropy. The backward direction of time(a videotape run backwards) would correspond to the exploded popcorn re-forming the original kernel. Because this backward process would result in anentropy decrease, it never happens.
There are two equivalent ways to define the change in entropy of a system:(1) in terms of the system’s temperature and the energy the system gains or losesas heat, and (2) by counting the ways in which the atoms or molecules that makeup the system can be arranged. We use the first approach in the next section andthe second in Section 20-8.
20-3 Change in EntropyLet’s approach this definition of change in entropy by looking again at a processthat we described in Sections 18-11 and 19-11: the free expansion of an ideal gas.Figure 20-1a shows the gas in its initial equilibrium state i, confined by a closedstopcock to the left half of a thermally insulated container. If we open thestopcock, the gas rushes to fill the entire container, eventually reaching the finalequilibrium state f shown in Fig. 20-1b. This is an irreversible process; all themolecules of the gas will never return to the left half of the container.
The p-V plot of the process, in Fig. 20-2, shows the pressure and volumeof the gas in its initial state i and final state f. Pressure and volume are stateproperties, properties that depend only on the state of the gas and not on how itreached that state. Other state properties are temperature and energy. We nowassume that the gas has still another state property—its entropy. Furthermore,we define the change in entropy Sf ! Si of a system during a process that takesthe system from an initial state i to a final state f as
(change in entropy defined). (20-1)
Here Q is the energy transferred as heat to or from the system during the process,and T is the temperature of the system in kelvins. Thus, an entropy changedepends not only on the energy transferred as heat but also on the temperatureat which the transfer takes place. Because T is always positive, the sign of "S isthe same as that of Q. We see from Eq. 20-1 that the SI unit for entropy andentropy change is the joule per kelvin.
There is a problem, however, in applying Eq. 20-1 to the free expansion ofFig. 20-1. As the gas rushes to fill the entire container, the pressure, temperature,and volume of the gas fluctuate unpredictably. In other words, they do not have asequence of well-defined equilibrium values during the intermediate stages of thechange from initial state i to final state f. Thus, we cannot trace a pressure–vol-ume path for the free expansion on the p-V plot of Fig. 20-2, and we cannot find arelation between Q and T that allows us to integrate as Eq. 20-1 requires.
However, if entropy is truly a state property, the difference in entropybetween states i and f must depend only on those states and not at all on the waythe system went from one state to the other. Suppose, then, that we replace theirreversible free expansion of Fig. 20-1 with a reversible process that connectsstates i and f. With a reversible process we can trace a pressure–volume path ona p-V plot, and we can find a relation between Q and T that allows us to useEq. 20-1 to obtain the entropy change.
"S # Sf ! Si # !f
i
dQT
Fig. 20-1 The free expansion of anideal gas. (a) The gas is confined to the lefthalf of an insulated container by a closedstopcock. (b) When the stopcock isopened, the gas rushes to fill the entirecontainer.This process is irreversible; thatis, it does not occur in reverse, with the gasspontaneously collecting itself in the lefthalf of the container.
Vacuum
Insulation
System
(a) Initial state i
(b) Final state f
Irreversibleprocess
Stopcock open
Stopcock closed
Pres
sure
Volume
i
f
Fig. 20-2 A p-V diagram showing theinitial state i and the final state f of the freeexpansion of Fig. 20-1.The intermediatestates of the gas cannot be shown becausethey are not equilibrium states.
halliday_c20_536-560hr.qxd 4-11-2009 16:08 Page 537
These diagrams
• represent the (thermodynamic)equilibrium states of the idealgas sample,
• each point is a state,
• imply the temperature of aknown sample, and
• show the internal energy of thegas. (Eint ∝ T )
PV = nRT
1Figure (modified) from Halliday, Resnick, and Walker, page 537.

Aside: P-V Diagrams
Example of a P-V diagram:
602 Chapter 20 The First Law of Thermodynamics
volume remains constant, the work done on the gas is zero. The total work done on the gas as its volume changes from Vi to Vf is given by the integral of Equation 20.8:
W 5 23Vf
Vi
P dV (20.9)
To evaluate this integral, you must know how the pressure varies with volume dur-ing the process. In general, the pressure is not constant during a process followed by a gas, but depends on the volume and temperature. If the pressure and volume are known at each step of the process, the state of the gas at each step can be plotted on an important graphical representation called a PV diagram as in Figure 20.5. This type of diagram allows us to visualize a process through which a gas is progressing. The curve on a PV diagram is called the path taken between the initial and final states. Notice that the integral in Equation 20.9 is equal to the area under a curve on a PV diagram. Therefore, we can identify an important use for PV diagrams:
The work done on a gas in a quasi-static process that takes the gas from an initial state to a final state is the negative of the area under the curve on a PV diagram, evaluated between the initial and final states.
For the process of compressing a gas in a cylinder, the work done depends on the particular path taken between the initial and final states as Figure 20.5 suggests. To illustrate this important point, consider several different paths connecting i and f (Fig. 20.6). In the process depicted in Figure 20.6a, the volume of the gas is first reduced from Vi to Vf at constant pressure Pi and the pressure of the gas then increases from Pi to Pf by heating at constant volume Vf . The work done on the gas along this path is 2Pi(Vf 2 Vi). In Figure 20.6b, the pressure of the gas is increased from Pi to Pf at constant volume Vi and then the volume of the gas is reduced from Vi to Vf at constant pressure Pf . The work done on the gas is 2Pf(Vf 2 Vi). This value is greater than that for the process described in Figure 20.6a because the piston is moved through the same displacement by a larger force. Finally, for the process described in Figure 20.6c, where both P and V change continuously, the work done on the gas has some value between the values obtained in the first two processes. To evaluate the work in this case, the function P(V ) must be known so that we can evaluate the integral in Equation 20.9. The energy transfer Q into or out of a system by heat also depends on the pro-cess. Consider the situations depicted in Figure 20.7. In each case, the gas has the same initial volume, temperature, and pressure, and is assumed to be ideal. In Figure 20.7a, the gas is thermally insulated from its surroundings except at the bottom of the gas-filled region, where it is in thermal contact with an energy reservoir. An energy reservoir is a source of energy that is considered to be so great that a finite transfer of energy to or from the reservoir does not change its temperature. The piston is held
Work done on a gas X
fPf
P
i
VViVf
Pi
fPf
P
i
VViVf
Pi
fPf
P
i
VViVf
Pi
A constant-pressure compression followed by a constant-volume process
A constant-volume process followed by a constant-pressure compression
An arbitrary compression
a b c
Figure 20.6 The work done on a gas as it is taken from an initial state to a final state depends on the path between these states.
Figure 20.5 A gas is compressed quasi-statically (slowly) from state i to state f. An outside agent must do positive work on the gas to compress it.
fPf
P
i
VViVf
Pi
The work done on a gas equals the negative of the area under the PV curve. The area is negative here because the volume is decreasing, resulting in positive work.
When these diagrams include a path,they
• show reversible processes,eg. compression of gas,
• show all the intermediatethermal states passed through,
• show the work done on the gas,
• indicate the heat transferred tothe gas.
∆Eint = W + Q

Work done depends on the process
Different paths or processes to go from (Vi ,Pi ) to (Vf ,Pf ) requiredifferent amounts of work.
602 Chapter 20 The First Law of Thermodynamics
volume remains constant, the work done on the gas is zero. The total work done on the gas as its volume changes from Vi to Vf is given by the integral of Equation 20.8:
W 5 23Vf
Vi
P dV (20.9)
To evaluate this integral, you must know how the pressure varies with volume dur-ing the process. In general, the pressure is not constant during a process followed by a gas, but depends on the volume and temperature. If the pressure and volume are known at each step of the process, the state of the gas at each step can be plotted on an important graphical representation called a PV diagram as in Figure 20.5. This type of diagram allows us to visualize a process through which a gas is progressing. The curve on a PV diagram is called the path taken between the initial and final states. Notice that the integral in Equation 20.9 is equal to the area under a curve on a PV diagram. Therefore, we can identify an important use for PV diagrams:
The work done on a gas in a quasi-static process that takes the gas from an initial state to a final state is the negative of the area under the curve on a PV diagram, evaluated between the initial and final states.
For the process of compressing a gas in a cylinder, the work done depends on the particular path taken between the initial and final states as Figure 20.5 suggests. To illustrate this important point, consider several different paths connecting i and f (Fig. 20.6). In the process depicted in Figure 20.6a, the volume of the gas is first reduced from Vi to Vf at constant pressure Pi and the pressure of the gas then increases from Pi to Pf by heating at constant volume Vf . The work done on the gas along this path is 2Pi(Vf 2 Vi). In Figure 20.6b, the pressure of the gas is increased from Pi to Pf at constant volume Vi and then the volume of the gas is reduced from Vi to Vf at constant pressure Pf . The work done on the gas is 2Pf(Vf 2 Vi). This value is greater than that for the process described in Figure 20.6a because the piston is moved through the same displacement by a larger force. Finally, for the process described in Figure 20.6c, where both P and V change continuously, the work done on the gas has some value between the values obtained in the first two processes. To evaluate the work in this case, the function P(V ) must be known so that we can evaluate the integral in Equation 20.9. The energy transfer Q into or out of a system by heat also depends on the pro-cess. Consider the situations depicted in Figure 20.7. In each case, the gas has the same initial volume, temperature, and pressure, and is assumed to be ideal. In Figure 20.7a, the gas is thermally insulated from its surroundings except at the bottom of the gas-filled region, where it is in thermal contact with an energy reservoir. An energy reservoir is a source of energy that is considered to be so great that a finite transfer of energy to or from the reservoir does not change its temperature. The piston is held
Work done on a gas X
fPf
P
i
VViVf
Pi
fPf
P
i
VViVf
Pi
fPf
P
i
VViVf
Pi
A constant-pressure compression followed by a constant-volume process
A constant-volume process followed by a constant-pressure compression
An arbitrary compression
a b c
Figure 20.6 The work done on a gas as it is taken from an initial state to a final state depends on the path between these states.
Figure 20.5 A gas is compressed quasi-statically (slowly) from state i to state f. An outside agent must do positive work on the gas to compress it.
fPf
P
i
VViVf
Pi
The work done on a gas equals the negative of the area under the PV curve. The area is negative here because the volume is decreasing, resulting in positive work.
In all of the processes shown above, there are temperature changesduring the process.
1Figure form Serway & Jewett.

Heat transfer also depends on the process
This process (shown) happens at constant temperature: 20.5 The First Law of Thermodynamics 603
Figure 20.7 Gas in a cylinder. (a) The gas is in contact with an energy reservoir. The walls of the cylinder are perfectly insulating, but the base in contact with the reservoir is conducting. (b) The gas expands slowly to a larger volume. (c) The gas is contained by a membrane in half of a volume, with vacuum in the other half. The entire cylinder is perfectly insulating. (d) The gas expands freely into the larger volume.
The hand reduces its downward force, allowing the piston to move up slowly. The energy reservoir keeps the gas at temperature Ti . The gas is
initially at temperature Ti .
a b
Energy reservoir at Ti Energy reservoir at Ti
c d
The gas is initially at temperatureTi and containedby a thin membrane, with vacuum above.
The membraneis broken, and the gas expands freely into the evacuated region.
at its initial position by an external agent such as a hand. When the force holding the piston is reduced slightly, the piston rises very slowly to its final position shown in Fig-ure 20.7b. Because the piston is moving upward, the gas is doing work on the piston. During this expansion to the final volume Vf , just enough energy is transferred by heat from the reservoir to the gas to maintain a constant temperature Ti. Now consider the completely thermally insulated system shown in Figure 20.7c. When the membrane is broken, the gas expands rapidly into the vacuum until it occupies a volume Vf and is at a pressure Pf . The final state of the gas is shown in Figure 20.7d. In this case, the gas does no work because it does not apply a force; no force is required to expand into a vacuum. Furthermore, no energy is transferred by heat through the insulating wall. As we discuss in Section 20.5, experiments show that the temperature of the ideal gas does not change in the process indicated in Figures 20.7c and 20.7d. Therefore, the initial and final states of the ideal gas in Figures 20.7a and 20.7b are identical to the initial and final states in Figures 20.7c and 20.7d, but the paths are different. In the first case, the gas does work on the piston and energy is transferred slowly to the gas by heat. In the second case, no energy is transferred by heat and the value of the work done is zero. Therefore, energy transfer by heat, like work done, depends on the particular process occurring in the system. In other words, because heat and work both depend on the path followed on a PV diagram between the initial and final states, neither quantity is determined solely by the endpoints of a thermodynamic process.
20.5 The First Law of ThermodynamicsWhen we introduced the law of conservation of energy in Chapter 8, we stated that the change in the energy of a system is equal to the sum of all transfers of energy across the system’s boundary (Eq. 8.2). The first law of thermodynamics is a spe-cial case of the law of conservation of energy that describes processes in which only the internal energy5 changes and the only energy transfers are by heat and work:
DE int 5 Q 1 W (20.10) �W First law of thermodynamics
5It is an unfortunate accident of history that the traditional symbol for internal energy is U, which is also the tra-ditional symbol for potential energy as introduced in Chapter 7. To avoid confusion between potential energy and internal energy, we use the symbol Eint for internal energy in this book. If you take an advanced course in thermody-namics, however, be prepared to see U used as the symbol for internal energy in the first law.
Heat Q is transferred to the gas, and the gas does positive work onits surroundings. (Equivalently, negative work is done on the gas.)

Heat transfer also depends on the processThis process also happens at constant temperature, and has thesame start and end points, (Vi ,Pi ) to (Vf ,Pf ): 20.5 The First Law of Thermodynamics 603
Figure 20.7 Gas in a cylinder. (a) The gas is in contact with an energy reservoir. The walls of the cylinder are perfectly insulating, but the base in contact with the reservoir is conducting. (b) The gas expands slowly to a larger volume. (c) The gas is contained by a membrane in half of a volume, with vacuum in the other half. The entire cylinder is perfectly insulating. (d) The gas expands freely into the larger volume.
The hand reduces its downward force, allowing the piston to move up slowly. The energy reservoir keeps the gas at temperature Ti . The gas is
initially at temperature Ti .
a b
Energy reservoir at Ti Energy reservoir at Ti
c d
The gas is initially at temperatureTi and containedby a thin membrane, with vacuum above.
The membraneis broken, and the gas expands freely into the evacuated region.
at its initial position by an external agent such as a hand. When the force holding the piston is reduced slightly, the piston rises very slowly to its final position shown in Fig-ure 20.7b. Because the piston is moving upward, the gas is doing work on the piston. During this expansion to the final volume Vf , just enough energy is transferred by heat from the reservoir to the gas to maintain a constant temperature Ti. Now consider the completely thermally insulated system shown in Figure 20.7c. When the membrane is broken, the gas expands rapidly into the vacuum until it occupies a volume Vf and is at a pressure Pf . The final state of the gas is shown in Figure 20.7d. In this case, the gas does no work because it does not apply a force; no force is required to expand into a vacuum. Furthermore, no energy is transferred by heat through the insulating wall. As we discuss in Section 20.5, experiments show that the temperature of the ideal gas does not change in the process indicated in Figures 20.7c and 20.7d. Therefore, the initial and final states of the ideal gas in Figures 20.7a and 20.7b are identical to the initial and final states in Figures 20.7c and 20.7d, but the paths are different. In the first case, the gas does work on the piston and energy is transferred slowly to the gas by heat. In the second case, no energy is transferred by heat and the value of the work done is zero. Therefore, energy transfer by heat, like work done, depends on the particular process occurring in the system. In other words, because heat and work both depend on the path followed on a PV diagram between the initial and final states, neither quantity is determined solely by the endpoints of a thermodynamic process.
20.5 The First Law of ThermodynamicsWhen we introduced the law of conservation of energy in Chapter 8, we stated that the change in the energy of a system is equal to the sum of all transfers of energy across the system’s boundary (Eq. 8.2). The first law of thermodynamics is a spe-cial case of the law of conservation of energy that describes processes in which only the internal energy5 changes and the only energy transfers are by heat and work:
DE int 5 Q 1 W (20.10) �W First law of thermodynamics
5It is an unfortunate accident of history that the traditional symbol for internal energy is U, which is also the tra-ditional symbol for potential energy as introduced in Chapter 7. To avoid confusion between potential energy and internal energy, we use the symbol Eint for internal energy in this book. If you take an advanced course in thermody-namics, however, be prepared to see U used as the symbol for internal energy in the first law.
No heat is transferred to the gas, and the gas does no work.
(We cannot represent the path for this process on a P-V diagram.)

First Law of ThermodynamicsReminder:
Internal energy, Eint or U
The energy that a system has as a result of its temperature and allother molecular motions, effects, and configurations, when viewedfrom a reference frame at rest with respect to the center of massof the system.
1st Law
The change in the internal energy of a system is equal to the sumof the heat added to the system and the work done on the system.
∆Eint = W + Q
This is just the conservation of energy assuming only the internalenergy changes.

Applying the 1st Law
Some special cases of interest:
• for an isolated system,W = Q = 0 ⇒ ∆Eint = 0
• for a process (Vi ,Pi ) to (Vi ,Pi ),a cycle, ∆Eint = 0 ⇒ Q = −W
53720-3 CHANG E I N E NTROPYPART 2
Entropy differs from energy in that entropy does not obey a conservation law.The energy of a closed system is conserved; it always remains constant. Forirreversible processes, the entropy of a closed system always increases. Because ofthis property, the change in entropy is sometimes called “the arrow of time.” Forexample, we associate the explosion of a popcorn kernel with the forwarddirection of time and with an increase in entropy. The backward direction of time(a videotape run backwards) would correspond to the exploded popcorn re-forming the original kernel. Because this backward process would result in anentropy decrease, it never happens.
There are two equivalent ways to define the change in entropy of a system:(1) in terms of the system’s temperature and the energy the system gains or losesas heat, and (2) by counting the ways in which the atoms or molecules that makeup the system can be arranged. We use the first approach in the next section andthe second in Section 20-8.
20-3 Change in EntropyLet’s approach this definition of change in entropy by looking again at a processthat we described in Sections 18-11 and 19-11: the free expansion of an ideal gas.Figure 20-1a shows the gas in its initial equilibrium state i, confined by a closedstopcock to the left half of a thermally insulated container. If we open thestopcock, the gas rushes to fill the entire container, eventually reaching the finalequilibrium state f shown in Fig. 20-1b. This is an irreversible process; all themolecules of the gas will never return to the left half of the container.
The p-V plot of the process, in Fig. 20-2, shows the pressure and volumeof the gas in its initial state i and final state f. Pressure and volume are stateproperties, properties that depend only on the state of the gas and not on how itreached that state. Other state properties are temperature and energy. We nowassume that the gas has still another state property—its entropy. Furthermore,we define the change in entropy Sf ! Si of a system during a process that takesthe system from an initial state i to a final state f as
(change in entropy defined). (20-1)
Here Q is the energy transferred as heat to or from the system during the process,and T is the temperature of the system in kelvins. Thus, an entropy changedepends not only on the energy transferred as heat but also on the temperatureat which the transfer takes place. Because T is always positive, the sign of "S isthe same as that of Q. We see from Eq. 20-1 that the SI unit for entropy andentropy change is the joule per kelvin.
There is a problem, however, in applying Eq. 20-1 to the free expansion ofFig. 20-1. As the gas rushes to fill the entire container, the pressure, temperature,and volume of the gas fluctuate unpredictably. In other words, they do not have asequence of well-defined equilibrium values during the intermediate stages of thechange from initial state i to final state f. Thus, we cannot trace a pressure–vol-ume path for the free expansion on the p-V plot of Fig. 20-2, and we cannot find arelation between Q and T that allows us to integrate as Eq. 20-1 requires.
However, if entropy is truly a state property, the difference in entropybetween states i and f must depend only on those states and not at all on the waythe system went from one state to the other. Suppose, then, that we replace theirreversible free expansion of Fig. 20-1 with a reversible process that connectsstates i and f. With a reversible process we can trace a pressure–volume path ona p-V plot, and we can find a relation between Q and T that allows us to useEq. 20-1 to obtain the entropy change.
"S # Sf ! Si # !f
i
dQT
Fig. 20-1 The free expansion of anideal gas. (a) The gas is confined to the lefthalf of an insulated container by a closedstopcock. (b) When the stopcock isopened, the gas rushes to fill the entirecontainer.This process is irreversible; thatis, it does not occur in reverse, with the gasspontaneously collecting itself in the lefthalf of the container.
Vacuum
Insulation
System
(a) Initial state i
(b) Final state f
Irreversibleprocess
Stopcock open
Stopcock closed
Pres
sure
Volume
i
f
Fig. 20-2 A p-V diagram showing theinitial state i and the final state f of the freeexpansion of Fig. 20-1.The intermediatestates of the gas cannot be shown becausethey are not equilibrium states.
halliday_c20_536-560hr.qxd 4-11-2009 16:08 Page 537
48918-9 A CLOS E R LOOK AT H EAT AN D WOR KPART 2
HALLIDAY REVISED
which you change the system from its initial state to its final state is called a ther-modynamic process. During such a process, energy may be transferred into thesystem from the thermal reservoir (positive heat) or vice versa (negative heat).Also, work can be done by the system to raise the loaded piston (positive work)or lower it (negative work). We assume that all such changes occur slowly, withthe result that the system is always in (approximate) thermal equilibrium (that is,every part of the system is always in thermal equilibrium with every other part).
Suppose that you remove a few lead shot from the piston of Fig. 18-13, allowingthe gas to push the piston and remaining shot upward through a differential dis-placement d with an upward force . Since the displacement is tiny, we can as-sume that is constant during the displacement. Then has a magnitude that isequal to pA, where p is the pressure of the gas and A is the face area of the piston.The differential work dW done by the gas during the displacement is
dW ! ! d ! (pA)(ds) ! p(A ds)! p dV, (18-24)
in which dV is the differential change in the volume of the gas due to the move-ment of the piston. When you have removed enough shot to allow the gas tochange its volume from Vi to Vf, the total work done by the gas is
(18-25)
During the volume change, the pressure and temperature may also change. Toevaluate Eq. 18-25 directly, we would need to know how pressure varies with vol-ume for the actual process by which the system changes from state i to state f.
There are actually many ways to take the gas from state i to state f. One way isshown in Fig. 18-14a, which is a plot of the pressure of the gas versus its volume and
W ! ! dW ! !Vf
Vi p dV.
s:F:
F:
F:
F:
s:
Lead shot
W
Insulation
Thermal reservoir T
Control knob
Q
The gas does workon this piston.
We control the heat transferby adjusting the temperature.
Fig. 18-13 A gas is confined to a cylin-der with a movable piston. Heat Q can beadded to or withdrawn from the gas by reg-ulating the temperature T of the adjustablethermal reservoir.Work W can be done bythe gas by raising or lowering the piston.
Fig. 18-14 (a) Theshaded area represents thework W done by a systemas it goes from an initialstate i to a final state f.Work W is positive be-cause the system’s volumeincreases. (b) W is still pos-itive, but now greater. (c)W is still positive, but nowsmaller. (d) W can be evensmaller (path icdf ) orlarger (path ighf). (e) Herethe system goes from statef to state i as the gas iscompressed to less volumeby an external force.Thework W done by the sys-tem is now negative. ( f )The net work Wnet done bythe system during a com-plete cycle is representedby the shaded area.
Volume
Pres
sure
Process
f
i
W > 00 Volume
Pres
sure
f
i
W > 0
0
a
Volume
Pres
sure
f
i
W > 00
Volume
Pres
sure
f
i
0
g
(a) (b) (c)
(d) Volume
Pres
sure
f
i
W < 00(e) (f)
h
dcPr
essu
ref
i
Wnet > 0
Volume0
Gas moves from i to f,doing positive work.
We can control howmuch work it does.
Moving from f to i, it does negative work.
Cycling clockwiseyields a positive network.
It still goes from i to f,but now it does morework.
It still goes from i to f,but now it does lesswork.
A
halliday_c18_476-506v2.qxd 22-10-2009 12:03 Page 489
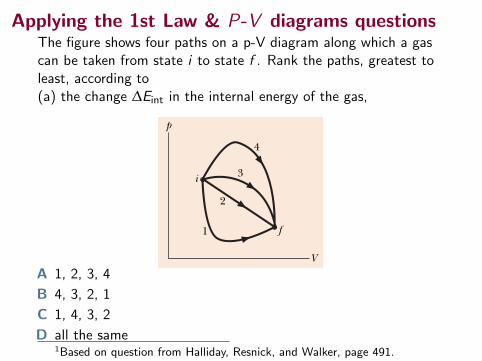
Applying the 1st Law & P-V diagrams questionsThe figure shows four paths on a p-V diagram along which a gascan be taken from state i to state f . Rank the paths, greatest toleast, according to(a) the change ∆Eint in the internal energy of the gas,
49118-10 TH E F I RST LAW OF TH E R MODYNAM ICSPART 2
HALLIDAY REVISED
18-10 The First Law of ThermodynamicsYou have just seen that when a system changes from a given initial state to agiven final state, both the work W and the heat Q depend on the nature of theprocess. Experimentally, however, we find a surprising thing. The quantity Q 2 Wis the same for all processes. It depends only on the initial and final states anddoes not depend at all on how the system gets from one to the other. All othercombinations of Q and W, including Q alone, W alone, Q ! W, and Q " 2W, arepath dependent; only the quantity Q " W is not.
The quantity Q " W must represent a change in some intrinsic property ofthe system.We call this property the internal energy Eint and we write
#Eint $ Eint,f " Eint,i $ Q " W (first law). (18-26)
Equation 18-26 is the first law of thermodynamics. If the thermodynamic systemundergoes only a differential change, we can write the first law as*
dEint $ dQ " dW (first law). (18-27)
In Chapter 8, we discussed the principle of energy conservation as it ap-plies to isolated systems — that is, to systems in which no energy enters orleaves the system. The first law of thermodynamics is an extension of that prin-ciple to systems that are not isolated. In such cases, energy may be transferredinto or out of the system as either work W or heat Q. In our statement of thefirst law of thermodynamics above, we assume that there are no changes in thekinetic energy or the potential energy of the system as a whole; that is, #K $#U $ 0.
Before this chapter, the term work and the symbol W always meant the workdone on a system. However, starting with Eq. 18-24 and continuing through thenext two chapters about thermodynamics, we focus on the work done by a sys-tem, such as the gas in Fig. 18-13.
The work done on a system is always the negative of the work done by thesystem, so if we rewrite Eq. 18-26 in terms of the work Won done on the system,we have #Eint $ Q ! Won. This tells us the following: The internal energy of asystem tends to increase if heat is absorbed by the system or if positive work isdone on the system. Conversely, the internal energy tends to decrease if heat islost by the system or if negative work is done on the system.
The internal energy Eint of a system tends to increase if energy is added as heat Q andtends to decrease if energy is lost as work W done by the system.
*Here dQ and dW, unlike dEint, are not true differentials; that is, there are no such functions asQ(p, V) and W(p, V) that depend only on the state of the system.The quantities dQ and dW arecalled inexact differentials and are usually represented by the symbols dQ and dW. For our purposes, we can treat them simply as infinitesimally small energy transfers.
CHECKPOINT 5
The figure here shows four paths on a p-V diagramalong which a gas can be taken from state i to state f.Rank the paths according to (a) the change #Eint inthe internal energy of the gas, (b) the work W doneby the gas, and (c) the magnitude of the energy trans-ferred as heat Q between the gas and its environ-ment, greatest first.
i
f
V
p
1
2
3
4
halliday_c18_476-506v2.qxd 22-10-2009 12:03 Page 491
A 1, 2, 3, 4
B 4, 3, 2, 1
C 1, 4, 3, 2
D all the same1Based on question from Halliday, Resnick, and Walker, page 491.

Applying the 1st Law & P-V diagrams questionsThe figure shows four paths on a p-V diagram along which a gascan be taken from state i to state f . Rank the paths, greatest toleast, according to(b) the work W done on the gas,
49118-10 TH E F I RST LAW OF TH E R MODYNAM ICSPART 2
HALLIDAY REVISED
18-10 The First Law of ThermodynamicsYou have just seen that when a system changes from a given initial state to agiven final state, both the work W and the heat Q depend on the nature of theprocess. Experimentally, however, we find a surprising thing. The quantity Q 2 Wis the same for all processes. It depends only on the initial and final states anddoes not depend at all on how the system gets from one to the other. All othercombinations of Q and W, including Q alone, W alone, Q ! W, and Q " 2W, arepath dependent; only the quantity Q " W is not.
The quantity Q " W must represent a change in some intrinsic property ofthe system.We call this property the internal energy Eint and we write
#Eint $ Eint,f " Eint,i $ Q " W (first law). (18-26)
Equation 18-26 is the first law of thermodynamics. If the thermodynamic systemundergoes only a differential change, we can write the first law as*
dEint $ dQ " dW (first law). (18-27)
In Chapter 8, we discussed the principle of energy conservation as it ap-plies to isolated systems — that is, to systems in which no energy enters orleaves the system. The first law of thermodynamics is an extension of that prin-ciple to systems that are not isolated. In such cases, energy may be transferredinto or out of the system as either work W or heat Q. In our statement of thefirst law of thermodynamics above, we assume that there are no changes in thekinetic energy or the potential energy of the system as a whole; that is, #K $#U $ 0.
Before this chapter, the term work and the symbol W always meant the workdone on a system. However, starting with Eq. 18-24 and continuing through thenext two chapters about thermodynamics, we focus on the work done by a sys-tem, such as the gas in Fig. 18-13.
The work done on a system is always the negative of the work done by thesystem, so if we rewrite Eq. 18-26 in terms of the work Won done on the system,we have #Eint $ Q ! Won. This tells us the following: The internal energy of asystem tends to increase if heat is absorbed by the system or if positive work isdone on the system. Conversely, the internal energy tends to decrease if heat islost by the system or if negative work is done on the system.
The internal energy Eint of a system tends to increase if energy is added as heat Q andtends to decrease if energy is lost as work W done by the system.
*Here dQ and dW, unlike dEint, are not true differentials; that is, there are no such functions asQ(p, V) and W(p, V) that depend only on the state of the system.The quantities dQ and dW arecalled inexact differentials and are usually represented by the symbols dQ and dW. For our purposes, we can treat them simply as infinitesimally small energy transfers.
CHECKPOINT 5
The figure here shows four paths on a p-V diagramalong which a gas can be taken from state i to state f.Rank the paths according to (a) the change #Eint inthe internal energy of the gas, (b) the work W doneby the gas, and (c) the magnitude of the energy trans-ferred as heat Q between the gas and its environ-ment, greatest first.
i
f
V
p
1
2
3
4
halliday_c18_476-506v2.qxd 22-10-2009 12:03 Page 491
A 1, 2, 3, 4
B 4, 3, 2, 1
C 1, 4, 3, 2
D all the same1Based on question from Halliday, Resnick, and Walker, page 491.

Applying the 1st Law & P-V diagrams questionsThe figure shows four paths on a p-V diagram along which a gascan be taken from state i to state f . Rank the paths, greatest toleast, according to(c) the energy transferred to the gas as heat Q.
49118-10 TH E F I RST LAW OF TH E R MODYNAM ICSPART 2
HALLIDAY REVISED
18-10 The First Law of ThermodynamicsYou have just seen that when a system changes from a given initial state to agiven final state, both the work W and the heat Q depend on the nature of theprocess. Experimentally, however, we find a surprising thing. The quantity Q 2 Wis the same for all processes. It depends only on the initial and final states anddoes not depend at all on how the system gets from one to the other. All othercombinations of Q and W, including Q alone, W alone, Q ! W, and Q " 2W, arepath dependent; only the quantity Q " W is not.
The quantity Q " W must represent a change in some intrinsic property ofthe system.We call this property the internal energy Eint and we write
#Eint $ Eint,f " Eint,i $ Q " W (first law). (18-26)
Equation 18-26 is the first law of thermodynamics. If the thermodynamic systemundergoes only a differential change, we can write the first law as*
dEint $ dQ " dW (first law). (18-27)
In Chapter 8, we discussed the principle of energy conservation as it ap-plies to isolated systems — that is, to systems in which no energy enters orleaves the system. The first law of thermodynamics is an extension of that prin-ciple to systems that are not isolated. In such cases, energy may be transferredinto or out of the system as either work W or heat Q. In our statement of thefirst law of thermodynamics above, we assume that there are no changes in thekinetic energy or the potential energy of the system as a whole; that is, #K $#U $ 0.
Before this chapter, the term work and the symbol W always meant the workdone on a system. However, starting with Eq. 18-24 and continuing through thenext two chapters about thermodynamics, we focus on the work done by a sys-tem, such as the gas in Fig. 18-13.
The work done on a system is always the negative of the work done by thesystem, so if we rewrite Eq. 18-26 in terms of the work Won done on the system,we have #Eint $ Q ! Won. This tells us the following: The internal energy of asystem tends to increase if heat is absorbed by the system or if positive work isdone on the system. Conversely, the internal energy tends to decrease if heat islost by the system or if negative work is done on the system.
The internal energy Eint of a system tends to increase if energy is added as heat Q andtends to decrease if energy is lost as work W done by the system.
*Here dQ and dW, unlike dEint, are not true differentials; that is, there are no such functions asQ(p, V) and W(p, V) that depend only on the state of the system.The quantities dQ and dW arecalled inexact differentials and are usually represented by the symbols dQ and dW. For our purposes, we can treat them simply as infinitesimally small energy transfers.
CHECKPOINT 5
The figure here shows four paths on a p-V diagramalong which a gas can be taken from state i to state f.Rank the paths according to (a) the change #Eint inthe internal energy of the gas, (b) the work W doneby the gas, and (c) the magnitude of the energy trans-ferred as heat Q between the gas and its environ-ment, greatest first.
i
f
V
p
1
2
3
4
halliday_c18_476-506v2.qxd 22-10-2009 12:03 Page 491
A 1, 2, 3, 4
B 4, 3, 2, 1
C 1, 4, 3, 2
D all the same1Based on question from Halliday, Resnick, and Walker, page 491.

Applying the 1st Law: new Vocabulary
There are infinitely many paths (Vi ,Pi ) to (Vf ,Pf ) that we mightconsider.
Ones that are of particular interest for modeling systems in engines,etc. are processes that keep one of the variabless constant.
There is a technical name for each kind of process that keeps avariable constant.

Applying the 1st Law: new Vocabulary
Adiabatic process
is a process where no heat is transferred into or out of the system.
Q = 0
This type of transformation occurs when the gas is in a thermallyinsulated container, or the process is very rapid, so there is no timefor heat transfer.
Since Q = 0:∆Eint = W
Applying the 1st Law: new Vocabulary
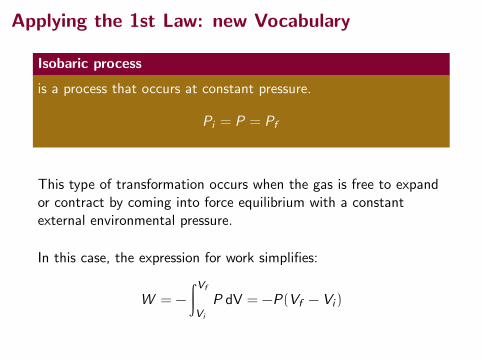
Isobaric process
is a process that occurs at constant pressure.
Pi = P = Pf
This type of transformation occurs when the gas is free to expandor contract by coming into force equilibrium with a constantexternal environmental pressure.
In this case, the expression for work simplifies:
W = −
∫Vf
Vi
P dV = −P(Vf − Vi )

Applying the 1st Law: new Vocabulary
Isovolumetric process
is a process that occurs at constant volume.
Vi = V = Vf
In an isovolumetric process the work done is zero, since the volumenever changes.
W = 0 ⇒ ∆Eint = Q
(An isovolumetric process can also be called an “isochoricprocess”.)

Applying the 1st Law: new Vocabulary
Isothermal process
is a process that occurs at constant temperature.
Ti = T = Tf
This kind of transformation is achieved by putting the system inthermal contact with a large constant-temperature reservoir.
In an isothermal process, assuming no change of phase (staying anideal gas!):
∆Eint = 0

Isothermal Expansion of an Ideal GasSince ∆T = 0, PV = nRT reduces to:
PV = a
where a is a constant. We could also write this as:
P =a
VPlotting this function:
606 Chapter 20 The First Law of Thermodynamics
Isothermal Expansion of an Ideal GasSuppose an ideal gas is allowed to expand quasi-statically at constant temperature. This process is described by the PV diagram shown in Figure 20.9. The curve is a hyperbola (see Appendix B, Eq. B.23), and the ideal gas law (Eq. 19.8) with T con-stant indicates that the equation of this curve is PV 5 nRT 5 constant. Let’s calculate the work done on the gas in the expansion from state i to state f. The work done on the gas is given by Equation 20.9. Because the gas is ideal and the process is quasi-static, the ideal gas law is valid for each point on the path. Therefore,
W 5 23Vf
Vi
P dV 5 23Vf
Vi
nRT
V dV
Because T is constant in this case, it can be removed from the integral along with n and R:
W 5 2nRT 3Vf
Vi
dVV
5 2nRT lnV `Vf
Vi
To evaluate the integral, we used e(dx/x) 5 ln x. (See Appendix B.) Evaluating the result at the initial and final volumes gives
W 5 nRT ln aVi
Vfb (20.14)
Numerically, this work W equals the negative of the shaded area under the PV curve shown in Figure 20.9. Because the gas expands, Vf . Vi and the value for the work done on the gas is negative as we expect. If the gas is compressed, then Vf , Vi and the work done on the gas is positive.
Q uick Quiz 20.4 Characterize the paths in Figure 20.10 as isobaric, isovolumet-ric, isothermal, or adiabatic. For path B, Q 5 0. The blue curves are isotherms.
Example 20.5 An Isothermal Expansion
A 1.0-mol sample of an ideal gas is kept at 0.0°C during an expansion from 3.0 L to 10.0 L.
(A) How much work is done on the gas during the expansion?
Conceptualize Run the process in your mind: the cylinder in Figure 20.8 is immersed in an ice-water bath, and the piston moves outward so that the volume of the gas increases. You can also use the graphical representation in Figure 20.9 to conceptualize the process.
Categorize We will evaluate parameters using equations developed in the preceding sections, so we categorize this example as a substitution problem. Because the temperature of the gas is fixed, the process is isothermal.
S O L U T I O N
Substitute the given values into Equation 20.14: W 5 nRT ln aVi
Vfb
5 11.0 mol 2 18.31 J/mol # K 2 1273 K 2 ln a 3.0 L10.0 L
b5 22.7 3 103 J
(B) How much energy transfer by heat occurs between the gas and its surroundings in this process?
f
i
V
PV = constant
IsothermP
Pi
Pf
Vi Vf
The curve is a hyperbola.
Figure 20.9 The PV diagram for an isothermal expansion of an ideal gas from an initial state to a final state.
A
BC
D
V
P
T1
T3
T2
T4
Figure 20.10 (Quick Quiz 20.4) Identify the nature of paths A, B, C, and D.
S O L U T I O N
Find the heat from the first law: DE int 5 Q 1 W
0 5 Q 1 WQ 5 2W 5 2.7 3 103 J

Isothermal Expansion of an Ideal Gas
Since nRT is constant, the work done on the gas in an isothermalexpansion is:
W = −
∫Vf
Vi
P dV
= −
∫Vf
Vi
nRT
VdV
= −nRT ln
(Vf
Vi
)
W = nRT ln
(Vi
Vf
)

Questions
Which path is isobaric?
606 Chapter 20 The First Law of Thermodynamics
Isothermal Expansion of an Ideal GasSuppose an ideal gas is allowed to expand quasi-statically at constant temperature. This process is described by the PV diagram shown in Figure 20.9. The curve is a hyperbola (see Appendix B, Eq. B.23), and the ideal gas law (Eq. 19.8) with T con-stant indicates that the equation of this curve is PV 5 nRT 5 constant. Let’s calculate the work done on the gas in the expansion from state i to state f. The work done on the gas is given by Equation 20.9. Because the gas is ideal and the process is quasi-static, the ideal gas law is valid for each point on the path. Therefore,
W 5 23Vf
Vi
P dV 5 23Vf
Vi
nRT
V dV
Because T is constant in this case, it can be removed from the integral along with n and R:
W 5 2nRT 3Vf
Vi
dVV
5 2nRT lnV `Vf
Vi
To evaluate the integral, we used e(dx/x) 5 ln x. (See Appendix B.) Evaluating the result at the initial and final volumes gives
W 5 nRT ln aVi
Vfb (20.14)
Numerically, this work W equals the negative of the shaded area under the PV curve shown in Figure 20.9. Because the gas expands, Vf . Vi and the value for the work done on the gas is negative as we expect. If the gas is compressed, then Vf , Vi and the work done on the gas is positive.
Q uick Quiz 20.4 Characterize the paths in Figure 20.10 as isobaric, isovolumet-ric, isothermal, or adiabatic. For path B, Q 5 0. The blue curves are isotherms.
Example 20.5 An Isothermal Expansion
A 1.0-mol sample of an ideal gas is kept at 0.0°C during an expansion from 3.0 L to 10.0 L.
(A) How much work is done on the gas during the expansion?
Conceptualize Run the process in your mind: the cylinder in Figure 20.8 is immersed in an ice-water bath, and the piston moves outward so that the volume of the gas increases. You can also use the graphical representation in Figure 20.9 to conceptualize the process.
Categorize We will evaluate parameters using equations developed in the preceding sections, so we categorize this example as a substitution problem. Because the temperature of the gas is fixed, the process is isothermal.
S O L U T I O N
Substitute the given values into Equation 20.14: W 5 nRT ln aVi
Vfb
5 11.0 mol 2 18.31 J/mol # K 2 1273 K 2 ln a 3.0 L10.0 L
b5 22.7 3 103 J
(B) How much energy transfer by heat occurs between the gas and its surroundings in this process?
f
i
V
PV = constant
IsothermP
Pi
Pf
Vi Vf
The curve is a hyperbola.
Figure 20.9 The PV diagram for an isothermal expansion of an ideal gas from an initial state to a final state.
A
BC
D
V
P
T1
T3
T2
T4
Figure 20.10 (Quick Quiz 20.4) Identify the nature of paths A, B, C, and D.
S O L U T I O N
Find the heat from the first law: DE int 5 Q 1 W
0 5 Q 1 WQ 5 2W 5 2.7 3 103 J
1Based on Quick Quiz 20.4, Serway & Jewett, page 606.

Questions
Which path is isothermal?
606 Chapter 20 The First Law of Thermodynamics
Isothermal Expansion of an Ideal GasSuppose an ideal gas is allowed to expand quasi-statically at constant temperature. This process is described by the PV diagram shown in Figure 20.9. The curve is a hyperbola (see Appendix B, Eq. B.23), and the ideal gas law (Eq. 19.8) with T con-stant indicates that the equation of this curve is PV 5 nRT 5 constant. Let’s calculate the work done on the gas in the expansion from state i to state f. The work done on the gas is given by Equation 20.9. Because the gas is ideal and the process is quasi-static, the ideal gas law is valid for each point on the path. Therefore,
W 5 23Vf
Vi
P dV 5 23Vf
Vi
nRT
V dV
Because T is constant in this case, it can be removed from the integral along with n and R:
W 5 2nRT 3Vf
Vi
dVV
5 2nRT lnV `Vf
Vi
To evaluate the integral, we used e(dx/x) 5 ln x. (See Appendix B.) Evaluating the result at the initial and final volumes gives
W 5 nRT ln aVi
Vfb (20.14)
Numerically, this work W equals the negative of the shaded area under the PV curve shown in Figure 20.9. Because the gas expands, Vf . Vi and the value for the work done on the gas is negative as we expect. If the gas is compressed, then Vf , Vi and the work done on the gas is positive.
Q uick Quiz 20.4 Characterize the paths in Figure 20.10 as isobaric, isovolumet-ric, isothermal, or adiabatic. For path B, Q 5 0. The blue curves are isotherms.
Example 20.5 An Isothermal Expansion
A 1.0-mol sample of an ideal gas is kept at 0.0°C during an expansion from 3.0 L to 10.0 L.
(A) How much work is done on the gas during the expansion?
Conceptualize Run the process in your mind: the cylinder in Figure 20.8 is immersed in an ice-water bath, and the piston moves outward so that the volume of the gas increases. You can also use the graphical representation in Figure 20.9 to conceptualize the process.
Categorize We will evaluate parameters using equations developed in the preceding sections, so we categorize this example as a substitution problem. Because the temperature of the gas is fixed, the process is isothermal.
S O L U T I O N
Substitute the given values into Equation 20.14: W 5 nRT ln aVi
Vfb
5 11.0 mol 2 18.31 J/mol # K 2 1273 K 2 ln a 3.0 L10.0 L
b5 22.7 3 103 J
(B) How much energy transfer by heat occurs between the gas and its surroundings in this process?
f
i
V
PV = constant
IsothermP
Pi
Pf
Vi Vf
The curve is a hyperbola.
Figure 20.9 The PV diagram for an isothermal expansion of an ideal gas from an initial state to a final state.
A
BC
D
V
P
T1
T3
T2
T4
Figure 20.10 (Quick Quiz 20.4) Identify the nature of paths A, B, C, and D.
S O L U T I O N
Find the heat from the first law: DE int 5 Q 1 W
0 5 Q 1 WQ 5 2W 5 2.7 3 103 J
1Based on Quick Quiz 20.4, Serway & Jewett, page 606.
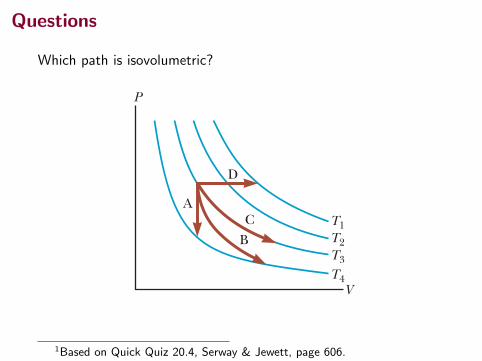
Questions
Which path is isovolumetric?
606 Chapter 20 The First Law of Thermodynamics
Isothermal Expansion of an Ideal GasSuppose an ideal gas is allowed to expand quasi-statically at constant temperature. This process is described by the PV diagram shown in Figure 20.9. The curve is a hyperbola (see Appendix B, Eq. B.23), and the ideal gas law (Eq. 19.8) with T con-stant indicates that the equation of this curve is PV 5 nRT 5 constant. Let’s calculate the work done on the gas in the expansion from state i to state f. The work done on the gas is given by Equation 20.9. Because the gas is ideal and the process is quasi-static, the ideal gas law is valid for each point on the path. Therefore,
W 5 23Vf
Vi
P dV 5 23Vf
Vi
nRT
V dV
Because T is constant in this case, it can be removed from the integral along with n and R:
W 5 2nRT 3Vf
Vi
dVV
5 2nRT lnV `Vf
Vi
To evaluate the integral, we used e(dx/x) 5 ln x. (See Appendix B.) Evaluating the result at the initial and final volumes gives
W 5 nRT ln aVi
Vfb (20.14)
Numerically, this work W equals the negative of the shaded area under the PV curve shown in Figure 20.9. Because the gas expands, Vf . Vi and the value for the work done on the gas is negative as we expect. If the gas is compressed, then Vf , Vi and the work done on the gas is positive.
Q uick Quiz 20.4 Characterize the paths in Figure 20.10 as isobaric, isovolumet-ric, isothermal, or adiabatic. For path B, Q 5 0. The blue curves are isotherms.
Example 20.5 An Isothermal Expansion
A 1.0-mol sample of an ideal gas is kept at 0.0°C during an expansion from 3.0 L to 10.0 L.
(A) How much work is done on the gas during the expansion?
Conceptualize Run the process in your mind: the cylinder in Figure 20.8 is immersed in an ice-water bath, and the piston moves outward so that the volume of the gas increases. You can also use the graphical representation in Figure 20.9 to conceptualize the process.
Categorize We will evaluate parameters using equations developed in the preceding sections, so we categorize this example as a substitution problem. Because the temperature of the gas is fixed, the process is isothermal.
S O L U T I O N
Substitute the given values into Equation 20.14: W 5 nRT ln aVi
Vfb
5 11.0 mol 2 18.31 J/mol # K 2 1273 K 2 ln a 3.0 L10.0 L
b5 22.7 3 103 J
(B) How much energy transfer by heat occurs between the gas and its surroundings in this process?
f
i
V
PV = constant
IsothermP
Pi
Pf
Vi Vf
The curve is a hyperbola.
Figure 20.9 The PV diagram for an isothermal expansion of an ideal gas from an initial state to a final state.
A
BC
D
V
P
T1
T3
T2
T4
Figure 20.10 (Quick Quiz 20.4) Identify the nature of paths A, B, C, and D.
S O L U T I O N
Find the heat from the first law: DE int 5 Q 1 W
0 5 Q 1 WQ 5 2W 5 2.7 3 103 J
1Based on Quick Quiz 20.4, Serway & Jewett, page 606.

Questions
Which path is adiabatic?
606 Chapter 20 The First Law of Thermodynamics
Isothermal Expansion of an Ideal GasSuppose an ideal gas is allowed to expand quasi-statically at constant temperature. This process is described by the PV diagram shown in Figure 20.9. The curve is a hyperbola (see Appendix B, Eq. B.23), and the ideal gas law (Eq. 19.8) with T con-stant indicates that the equation of this curve is PV 5 nRT 5 constant. Let’s calculate the work done on the gas in the expansion from state i to state f. The work done on the gas is given by Equation 20.9. Because the gas is ideal and the process is quasi-static, the ideal gas law is valid for each point on the path. Therefore,
W 5 23Vf
Vi
P dV 5 23Vf
Vi
nRT
V dV
Because T is constant in this case, it can be removed from the integral along with n and R:
W 5 2nRT 3Vf
Vi
dVV
5 2nRT lnV `Vf
Vi
To evaluate the integral, we used e(dx/x) 5 ln x. (See Appendix B.) Evaluating the result at the initial and final volumes gives
W 5 nRT ln aVi
Vfb (20.14)
Numerically, this work W equals the negative of the shaded area under the PV curve shown in Figure 20.9. Because the gas expands, Vf . Vi and the value for the work done on the gas is negative as we expect. If the gas is compressed, then Vf , Vi and the work done on the gas is positive.
Q uick Quiz 20.4 Characterize the paths in Figure 20.10 as isobaric, isovolumet-ric, isothermal, or adiabatic. For path B, Q 5 0. The blue curves are isotherms.
Example 20.5 An Isothermal Expansion
A 1.0-mol sample of an ideal gas is kept at 0.0°C during an expansion from 3.0 L to 10.0 L.
(A) How much work is done on the gas during the expansion?
Conceptualize Run the process in your mind: the cylinder in Figure 20.8 is immersed in an ice-water bath, and the piston moves outward so that the volume of the gas increases. You can also use the graphical representation in Figure 20.9 to conceptualize the process.
Categorize We will evaluate parameters using equations developed in the preceding sections, so we categorize this example as a substitution problem. Because the temperature of the gas is fixed, the process is isothermal.
S O L U T I O N
Substitute the given values into Equation 20.14: W 5 nRT ln aVi
Vfb
5 11.0 mol 2 18.31 J/mol # K 2 1273 K 2 ln a 3.0 L10.0 L
b5 22.7 3 103 J
(B) How much energy transfer by heat occurs between the gas and its surroundings in this process?
f
i
V
PV = constant
IsothermP
Pi
Pf
Vi Vf
The curve is a hyperbola.
Figure 20.9 The PV diagram for an isothermal expansion of an ideal gas from an initial state to a final state.
A
BC
D
V
P
T1
T3
T2
T4
Figure 20.10 (Quick Quiz 20.4) Identify the nature of paths A, B, C, and D.
S O L U T I O N
Find the heat from the first law: DE int 5 Q 1 W
0 5 Q 1 WQ 5 2W 5 2.7 3 103 J
1Based on Quick Quiz 20.4, Serway & Jewett, page 606.

Example 20.6: Boiling water
This example illustrates how we can apply these ideas to liquidsand solids also, and even around phase changes, as long as we arecareful.
Suppose 1.00 g of water vaporizes isobarically at atmosphericpressure (1.013× 10⁵ Pa).
Its volume in the liquid state is Vi = Vliq = 1.00 cm3, and itsvolume in the vapor state is Vf = Vvap = 1671 cm3.
Find the work done in the expansion and the change in internalenergy of the system. Ignore any mixing of the steam and thesurrounding air; imagine that the steam simply pushes thesurrounding air out of the way.

Example 20.6: Boiling water
Vi = Vliq = 1.00 cm3
Vf = Vvap = 1671 cm3
Lv = 2.26× 10⁶ J/kg
Heat Transfer
We are now changing gears.
We are still thinking about heat in more detail, but we are notnecessarily talking about ideal gases.
(Section 20.7 of the textbook.)

Heat Transfer Mechanisms
When objects are in thermal contact, heat is transferred from thehotter object to the cooler object
There are various mechanisms by which this happens:
• conduction
• convection
• radiation

Conduction
Heat can “flow” along a substance.
When it does, heat is said to be transferred by conduction fromone part of the substance to another.
Some materials allow more heat to flow through them in a shortertime than others.
These materials are called “good conductors” of heat:
• metals (copper, aluminum, etc)

Conduction
In solids, conduction happens via
• vibrations
• collisions of molecules
• collective wavelike oscillations (phonons)
• diffusion and collisions of free electrons
In liquids and gases, conduction happens through diffusion andcollisions of molecules.

Conduction
Some materials are not good conductors and are referred to asthermal insulators.
Examples:
• air (and hence down feathers, wool)
• styrofoam
• wood
• snow

Conduction
Some materials are not good conductors and are referred to asthermal insulators.
Examples:
• air (and hence down feathers, wool)
• styrofoam
• wood
• snow
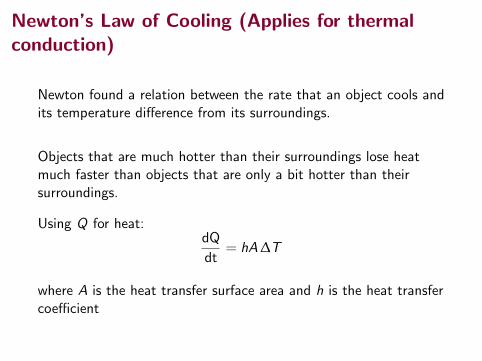
Newton’s Law of Cooling (Applies for thermalconduction)
Newton found a relation between the rate that an object cools andits temperature difference from its surroundings.
Objects that are much hotter than their surroundings lose heatmuch faster than objects that are only a bit hotter than theirsurroundings.
Using Q for heat:dQ
dt= hA∆T
where A is the heat transfer surface area and h is the heat transfercoefficient

Newton’s Law of Cooling (Applies for thermalconduction)
dQ
dt= hA∆T
If there is no phase change in the substance, then we can use therelation for heat capacity:
Q = −C ∆T
where in this case the heat is transferred out of the hot object tothe environment.to get:
d(∆T)
dt= −r ∆T
where the constant r = hA/C .

Newton’s Law of Cooling Example
Hot leftover soup must be cooled before it can be put in therefrigerator. To speed this process, you put the pot in a sink withcool, running water, that is maintained at 5◦C. The hot soup coolsfrom 75◦C to 40◦C in 8 minutes. Why might you predict that itstemperature after another 8 minutes will be 22.5◦C?

Summary
• more about phase changes
• work, heat, and the first law of thermodynamics
• P-V diagrams
• applying the first law in various cases
• heat transfer
Homework Serway & Jewett:
• Read chapter 20 an look at the examples.
• prev: Ch 20, onward from page 615. OQs: 3, 5, 7; CQs: 3,11; Probs: 1, 3, 9, 13, 19
• new: Ch 20, OQs: 1, 13; Probs: 25, 27, 29, 31, 35, 39, 41,59, 71, 77