VICU53616BSS - Viking Parts by Viking - Factory Parts for ...

Thermodynamic comparison of the FICFB and Vikinggasification concepts
Martin Gassner, Francois Marechal
Laboratory for Industrial Energy Systems
Ecole Polytechnique Federale de Lausanne
CH – 1015 Lausanne, Switzerland
Energy (2009), in press, doi:10.1016/j.energy.2009.05.011
Abstract
Two biomass gasification concepts, i.e. indirectly heated, fast internally circulating fluidised bed(FICFB) gasification with steam as gasifying agent and two-stage, directly heated, fixed bed Vikinggasification are compared with respect to their performance as gas generators. Based on adjustedequilibrium equations, the gas composition and the energy requirements for gasification are accu-rately modelled. Overall energy balances are assessed by an energy integration with the heat cascadeconcept and considering energy recovery in a steam Rankine cycle. A detailed inventory of energyand exergy losses of the different process sections is presented and potential process improvementsdue to a better utility choice or feed pretreatment like drying or pyrolysis are discussed. WhileViking gasification performs better as an isolated gas generator than state-of-the-art FICFB gasifi-cation, there is large potential for improvement of the FICFB system. Furthermore, a concludinganalysis of the gasification systems in an integrated plant for synthetic natural gas production showsthat FICFB gasification is more suitable overall due to a more advantageous energy conversion re-lated to the producer gas composition.
Keywords: gasification, modelling, energy integration, exergy analysis, SNG
Nomenclature
AbbreviationsFICFB Fast internally circulating fluidised bedHHV Higher heating valueITM Ion transfer membraneLHV Lower heating valueMER Minimum energy requirementSNG Synthetic natural gasRoman letterscp Specific heat at constant pressure kJ/(kg K)E Mechanical or electrical power kWEq Heat exergy kWEy Exergy of material streams kWkp Partial pressure ratio between C2H4 and CH4 -Kp Equilibrium constant based on pressure -Kp Apparent equilibrium constant -L Exergy loss kWm Mass flow kg/sp Pressure bar
1

Q Heat kWT Temperature ◦CTa Atmospheric temperature ◦CTg Gasification temperature ◦CTa,d Air temperature at dryer inlet ◦CGreek lettersΔh0
r Standard heat of reaction kJ/molΔhvap Latent heat of vaporisation kJ/kgΔh0
i Lower heating value of substance i kJ/kgΔk0
i Exergy value of substance i kJ/kgΔp Pressure drop barΔT Temperature difference ◦Cε Energy efficiency %η Exergy efficiency %Φwood Wood humidity %wtSubscriptsbd Boudouard equilibriumcg Cold gasel Electrichg Hydrogenating gasification equilibriumHT Heat transferth Thermaltot Totalwg Water gas shift equilibriumSuperscripts0 Standard conditions+ Material or energy stream entering the system− Material or energy stream leaving the system
1 Introduction
Due to its renewable character, biomass and waste gasification is commonly considered as one of thepromising technologies for rational and carbon-neutral conversion of energy (Perry et al., 2008). Besidesthe traditional application of this technology for generating power in centralised combined cycle plants(Craig and Mann, 1996; Brown et al., 2009) or in the local production of combined heat and powerusing gas engines (Hofbauer et al., 2002; Henriksen et al., 2006; Yoshikawa, 2006) and more recentlyfuel cells (Omosun et al., 2004; Karellas et al., 2008), there is currently also a large interest in processesfor the synthesis of liquid and gaseous fuels (Spath and Dayton, 2003; Mozaffarian and Zwart, 2003;Hamelinck et al., 2004; Duret et al., 2005; Gassner and Marechal, 2009b; Heyne et al., 2008; Ptasinski,2008; Luterbacher et al., 2009).
In process design, suitable biomass gasification technology is usually identified considering designconstraints like capacity and criteria like gas composition, calorific value and contaminants that arerelated to the specific application (Mozaffarian and Zwart, 2003; Hamelinck et al., 2004; Stucki, 2005).Process integration aspects are regarded to a lesser extent, although heat requirements of gasifiers aregenerally important and influence the systems’ overall performance markedly. Especially for biomass-based fuel production, a high chemical gas conversion is essential since the primary product is the energystored in the material outlet streams. Furthermore, the energy requirements and recovery possibilities ofthe reforming steps after gasification are different to those in power generation, and proven technologyestablished for this specific application does not necessarily fit the modified demand.
For this reason, the present paper investigates the thermodynamic performance of two potential gasifi-cation systems for fuel production as producer gas generators. Several authors have recently investigated
2
the thermodynamic and exergetic performance of gasification (Ptasinski et al., 2007; Jarungthammachoteand Dutta, 2007; Prins et al., 2007) and gasification systems for the production of power (Brown et al.,2009; Prins et al., 2007; Fryda et al., 2008) and fuels (Ptasinski, 2008). Apart from (Brown et al., 2009),however, all these studies disregard or discuss the effects of process integration only very briefly, andlack a systematic approach as provided by pinch analysis techniques. The present work paper thereforefocusses on the integrated energetic and exergetic performance and addresses two exemplary gasifica-tion systems for whom this type of analysis has yet to be carried out. In particular, an indirectly heatedfluidised bed gasifier with steam as gasifying agent (FICFB process (Hofbauer et al., 2002)) – beingcurrently regarded as promising option for synthetic natural gas (SNG) production (Heyne et al., 2008;Stucki, 2005) – and a directly heated, fixed bed gasifier based on a relatively novel two-stage concept(Viking process (Henriksen et al., 2006)) are compared.
In the first step of the analysis, process models based on adjusted equilibrium equations are developedto investigate the level of thermodynamic conversion of the produced gas. The heat requirements ofthe gasification process are then used in an energy integration to determine the overall thermodynamicperformance of the system. By assessing the energy and exergy losses in the different process sections indetail, both systems are compared and potential improvements are proposed. Finally, the performancesof an integrated SNG plant are assessed for both gasification systems and confronted with their isolatedperformance as gas generators.
2 Process description
Developed at the Technical University of Vienna, FICFB gasification has been designed as an internallycirculating fluidised bed system where heat is transferred by circulating the bed material between twophysically separated gasification and combustion chambers (Hofbauer et al., 2002). As shown on theleft of Figure 1, gasifying steam is injected into a stationary fluidised bed where drying, pyrolysis andgasification of the raw material take place. The reactor is heated indirectly by transferring hot bedmaterial via a cyclone from a combustion chamber, where the ungasified char and additional fuel –typically cold producer gas – are oxidised. The obtained synthesis gas is cooled to 150◦C, filtered andwashed with water or biodiesel in order to remove dust particles, tar and other contaminants before beingused in an energy conversion unit or a fuel conversion process.
The fundamental design idea behind the Viking gasification process developed at the Technical Uni-versity of Denmark is to perform a thermally staged gasification with intermediate partial oxidation fortar cracking (Henriksen et al., 2006). As shown on the conceptual flowsheet (Fig. 1, right), wood isfirst conveyed through a screw pyrolysis unit, where it is heated to 500-600◦C and partially decomposed.After thermal cracking of the tars through partial oxidation of the gas phase, the remaining solid speciesare gasified in a fixed bed. The synthesis gas leaving the gasifier at 700-800◦C is cooled to 90◦C andfiltered. Finally, the condensates are removed at ambient conditions in a gas-liquid separator.
3 Process modelling
3.1 Method
Following a systematic methodology for preliminary process design and analysis (Gassner and Marechal,2009a), the thermodynamic process modelling is performed in two successive steps. First, commercialflowsheeting software (Belsim SA, last visited 04/2009) is used to calculate the operation of the processunits by applying conservation principles and simple model equations. From this energy-flow model, theheat and power requirements are identified and transferred to the energy-integration model. In this secondstep, the combined production of gas and power from residual heat below the pinch is maximised. Sincethe operating conditions of the non-linear energy-flow model are fixed after the first step, the energy-integration model can be formulated as a linear subproblem, which is resolved by mixed integer linearprogramming minimising the operating cost and considering the heat cascade equations as constraints
3

Wood
Ash
Air
Fuel
Producer gas
Water
Bed material/ungasified char
Condensates
Flue gas
40°C
150°C
120°C
Particles
Pyrolysis/Gasification
Char/fuelcombustion
90°C
Volatiles
700-800°CGasification
Pyrolysis
500 -600°C
Particles Ash/char
Air
Wood
Condensates
Producer gas
Partial oxidation800-900°C 1300°C
Figure 1: Conceptual flowsheets for FICFB (left) and Viking gasification (Note: The purpose of theseschematics is to illustrate the model structure and does not correspond to the physical process layout, i.e.the pyrolysis, oxidation/combustion and gasification reactors correspond to one physical unit.)
(Gassner and Marechal, 2009a). One of the key advantages of this approach is that the topology of theheat exchanger network and the fuel supply for indirectly heated gasification are not defined a priori, butcomputed in the integration step, which makes the method very suitable for preliminary process design.In addition, as the heat transfer and the chemical conversion are addressed separately, this approachallows for better understanding the exergy losses in the heat transfer operations with a systematic visionsince it considers all the possible heat recovery by heat exchange.
3.2 Energy-flow models
3.2.1 Gasification
Due to the inherent need for simple model equations in flowsheet calculations, gasification systems areoften modelled assuming thermodynamic equilibrium of the gas phase at the reactor outlet, as for ex-ample for steam gasification in (Schuster et al., 2001). However, comparisons with experimental datashow that this is generally not a valid assumption and kinetic effects must be taken into account. Manyauthors, for example (Li et al., 2004; Pellegrini and de Oliveira Jr., 2007; Proll and Hofbauer, 2008),therefore fix the carbon conversion and/or the fraction of methane and higher hydrocarbons, or correctthe equilibrium constant with a multiplication factor (Jarungthammachote and Dutta, 2007; Huang andRamaswamy, 2009). Introduced by Gumz (1950) and discussed for the application to biomass gasifica-tion by for instance (Prins et al., 2007) and in more detail by (Bacon et al., 1982; Kersten, 2002; Brown,2007), a thermodynamically more consistent way to adjust the equilibrium equations is to correct theequilibrium temperature by introducing artificial temperature differences ΔT of the form:
Kp = Kp(Tg + ΔT) (1)
where Kp is the theoretical equilibrium constant andKp the apparent equilibrium constant correspondingto the experimentally observed composition at the gasification temperature Tg. By adjusting the ΔTwith experimental data, it is possible to use a simple thermodynamic relationship to correctly computeboth the gas compositions and energy balance around the nominal operation conditions and to model theinfluence of the design variables of the gasifier.
Considering that the outlet streams of the gasifiers consist of H2, CO, CO2, CH4, H2O, N2 and C(s),three equations in addition to the atomic balances are required to determine the gas composition. In ourmodel, two solid-gas, i.e. the hydrogenating gasification (Eq. 2) and the Boudouard (Eq. 3) equilibria,
4

and the water-gas shift (Eq. 4) reactions have been used:
C(s)+2H2 � CH4 Δh0r = −75kJ/mol (2)
C(s)+CO2 � 2CO Δh0r = +173kJ/mol (3)
CO+H2O � CO2 +H2 Δh0r = −41kJ/mol (4)
In FICFB gasification, experimental data of the gasifier shows that higher hydrocarbons are produced,which could as well be represented by an adjusted equilibrium equation in the form of Eq. 1. However,very high values are typically found and indicate that the mathematical representation has no physicalmeaning. Its amount is therefore calculated assuming that they are appropriately represented by etheneand that its partial pressure is proportional to one of methane:
pC2H4 = kp pCH4 (5)
According to these equations, the four parameters to be fitted in the gasification models are ΔThg (Eq.2), ΔTbd (Eq. 3), ΔTwg (Eq. 4) and kp (Eq. 5).
3.2.2 Pyrolysis
The equilibrium-based models represent the products and heat demand of gasification with reasonableaccuracy, but do not allow for taking the bulk formation of condensable hydrocarbons during pyrolysisinto account. A recently published experimental study (Fassinou et al., 2009) of the screw pyrolysissection of the Viking systems show that these condensable substances (incl. H2O) contribute to 28-78%wt of the gaseous phase from pyrolysis. Although some yield data and the detailed non-condensablegas composition are reported, no complete mass- and energy-balances can be deduced from the giveninformation. Model validation is thus impossible, and no rigorous model for the conversion of species inthe pyrolysis has been developed. Instead, a simplified formulation based on a partial gasification of thebiomass feed is adopted. It is considered that the atomic species in the biomass are uniformly gasified,which fixes the solid composition. Assuming further that the complete volatile fraction identified in theproximate analysis is released, two model equations are necessary to fix the gas phase composition andthe heat demand. For this purpose, the hydrogenating gasification (Eq. 2) and water-gas shift (Eq. 4)reactions are used and reconciled with the consistent dataset for the overall plant.
3.2.3 Data reconciliation
With the general assumptions and operating conditions detailed in Tables 1 and 2, the model parametersof the gasification reactor model are determined using data of wood characteristics, process conditionsand gas compositions from Gøbel et al. (2004); Henriksen et al. (2005); Rauch (written around 2004). ForFICFB gasification, the reference temperature for gasification is 850◦C, while the artificial temperaturedifferences in Viking gasification refer to pyrolysis and gasification temperatures of 600◦C and 750◦Crespectively. The values of the identified parameters and their accuracy with respect to the measured dataare given in Tables 3 and 4.
3.2.4 Error analysis
According to Table 4, the model is able to accurately reproduce the measured composition of the pro-ducer gas. Except for the CO2 fraction of the FICFB reactor with a relative error of 5.5%, all calculatedcompositions are within a 5% error range. As already discussed in Section 3.2.2, the model parametersand gas composition after pyrolysis must however be considered as artificial since the higher hydrocar-bons are not explicitly included as model species, but partially accounted for by the non-condensablespecies and the ungasified raw material. According to experimental data, about 14%vol CH4, 40%volCO, 18%vol CO2, 19%vol H2 and 3%vol C4H4−6 are typically obtained in the dry, non-condensableproduct at nominal conditions (Fassinou et al., 2009). However, for the validity of the following energy
5
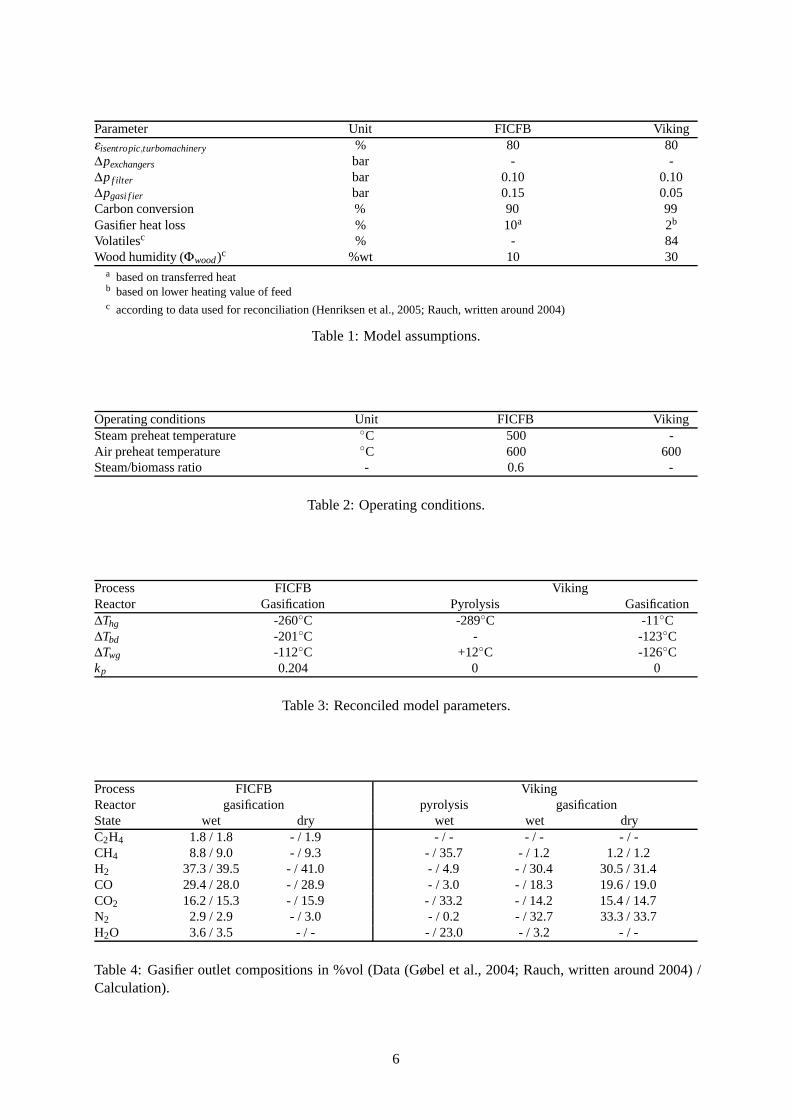
Parameter Unit FICFB Vikingεisentropic,turbomachinery % 80 80Δpexchangers bar - -Δp f ilter bar 0.10 0.10Δpgasi f ier bar 0.15 0.05Carbon conversion % 90 99Gasifier heat loss % 10a 2b
Volatilesc % - 84Wood humidity (Φwood)c %wt 10 30
a based on transferred heatb based on lower heating value of feedc according to data used for reconciliation (Henriksen et al., 2005; Rauch, written around 2004)
Table 1: Model assumptions.
Operating conditions Unit FICFB VikingSteam preheat temperature ◦C 500 -Air preheat temperature ◦C 600 600Steam/biomass ratio - 0.6 -
Table 2: Operating conditions.
Process FICFB VikingReactor Gasification Pyrolysis GasificationΔThg -260◦C -289◦C -11◦CΔTbd -201◦C - -123◦CΔTwg -112◦C +12◦C -126◦Ckp 0.204 0 0
Table 3: Reconciled model parameters.
Process FICFB VikingReactor gasification pyrolysis gasificationState wet dry wet wet dryC2H4 1.8 / 1.8 - / 1.9 - / - - / - - / -CH4 8.8 / 9.0 - / 9.3 - / 35.7 - / 1.2 1.2 / 1.2H2 37.3 / 39.5 - / 41.0 - / 4.9 - / 30.4 30.5 / 31.4CO 29.4 / 28.0 - / 28.9 - / 3.0 - / 18.3 19.6 / 19.0CO2 16.2 / 15.3 - / 15.9 - / 33.2 - / 14.2 15.4 / 14.7N2 2.9 / 2.9 - / 3.0 - / 0.2 - / 32.7 33.3 / 33.7H2O 3.6 / 3.5 - / - - / 23.0 - / 3.2 - / -
Table 4: Gasifier outlet compositions in %vol (Data (Gøbel et al., 2004; Rauch, written around 2004) /Calculation).
6

integration and exergy analysis, the accuracy of the intermediate composition has no influence since onlya correct reproduction of the heat demand for pyrolysis is crucial. Indeed, this is assured by the computednitrogen fraction in the producer gas, which is in very good agreement with the data from the plant. Asit enters the reactor in a known ratio to oxygen, this fraction directly represents the degree of partialoxidation in the gasification. The enthalpy balance of the gasification reactor is thus accurate, which alsoimplies that the total enthalpy of the close-coupled pyrolysis products is correct.
3.2.5 Discussion
Examining the reconciled model parameters, it is obvious that the synthesis gas from both gasifiers is notin thermodynamic equilibrium. All the apparent equilibrium temperatures observed in the gasificationsections are below the actual reactor temperatures. Compared to equilibrium, the gasifiers produce gasesthat contain too much hydrocarbons and carbon dioxide and too little hydrogen and carbon monoxide.The difference from equilibrium is thereby not as substantial in case of Viking gasification, which maybe due to the different reactor types. A previous study (Gassner and Marechal, 2009b) observed similartemperature deviations for air blown and steam blown gasifiers of fluidised bed type and reasoned similarcatalytic activity of the bed. Unlike in fluidised bed reactors, the temperature in fixed beds is not equallydistributed and part of the gas might be formed at higher temperatures. In case of Viking gasification,the pyrolysis gas is furthermore heated to 1100◦C by partial oxidation in order to thermally crack thetars. Since this shifts the gas equilibrium towards H2 and CO and reaction kinetics tend to acceleratewith temperature, this might also lead to approach thermodynamic equilibrium at the gasifier outlet to agreater extent.
3.3 Energy integration
3.3.1 Problem definition
After the calculation of the thermodynamic unit conversions in the energy-flow models, the energy in-tegration of the process is performed. For this purpose, the heat requirements of the process streams,available utilities and energy recovery technology are assembled in the heat cascade formulation, whichis used to model the heat exchanger network (Gassner and Marechal, 2009a).
In this analysis, the heat demand above the pinch is satisfied through combustion of cold producergas and ungasified char. In directly heated gasification, residual char is diluted in the ash and cannotbe recovered. Excess heat below the pinch is recovered and converted to electricity by a steam Rankinecycle. In this work, typical small scale operating conditions of 60 bar for steam production and 500◦Cfor steam superheating are assumed. Two intermediate steam utilisation levels at 15.5 bar (200◦C) and1.0 bar (100◦C) and one condensation level at 0.23 bar (20◦C) fed with cooling water are used. Par-tial condensation in a condensing stage is allowed to minimum vapour fraction of 85%, and isentropicefficiencies for the backpressure and condensing turbine stages are of 80% and 70%, respectively. Inthe heat cascade formulation, minimum approach temperatures of 8◦C, 4◦C and 2◦C for gaseous, liquidand condensing or evaporating streams, respectively, are assumed. For the heat transfer to the reactivesections (pyrolysis, FICFB-gasification) and from the fumes down to a stack temperature of 120◦C, theminimum approach temperature is set to 25◦C.
The performance of the process is assessed by calculating the energy balances, the cold gas efficiencyεcg (Eq. 6) and the overall energy efficiency εtot (Eq. 7), defined as:
εcg =Δh0
gasmgas
Δh0woodmwood
(6)
εtot =Δh0
gasmgas + E−
Δh0woodmwood + E+
(7)
where Δh0 and m designate the lower heating value per unit mass and the mass flow, respectively. E−
7

Proximate analysis Ultimate analysisΔh0
wood,dry 19.2 MJ/kgdry C 50.93 %wtΔh0
wooda 18.2 MJ/kgdry H 6.11 %wt
Δk0wood
b 21.6 MJ/kgdry O 42.16 %wtΦwood 30 %wt N 0.80 %wt
a Δh0wood is calculated considering the latent heat of vaporisation of the moisture and referred to the dry mass of wood, i.e.
Δh0wood = Δh0
wood,dry −ΔhvapΦwood/(1−Φwood ).b Chemical exergy is calculated according to Szargut and Styrylska (1964).
Table 5: Feedstock properties.
refers to overall produced and E+ to overall consumed power, whereas one of these terms is equal tozero since only the overall balance is of interest.
For a proper comparison of the gasification systems, the same feedstock properties as shown in Table5 and an arbitrary total energy input of 1 MWth,wood are chosen since the model is independent of theequipment size.
3.3.2 Results and Discussion
The resulting energy balances and composite curves without and with a steam cycle for energy recoveryare depicted in Table 6 and Figure 2. The data reveals a considerable difference of the performance of theinvestigated gasification systems. In case of FICFB gasification, only 78% of the chemical energy input isconverted into product, while 91% are recovered in Viking gasification. From the energy loss inventory,it is seen that the lower carbon conversion in FICFB gasification is not the reason for the difference sinceit is used as fuel in the combustion. However, significant amounts of energy are lost in the gas coolingand cooling water, and a considerable by-production of electricity is observed. The composite curvesshow that the FICFB gasification system is pinched at 875◦C , and of the endothermal reaction must besupplied at this high temperature. From the whole demand of 266 kWth/MWwood , only 30% are satisfiedwith the ungasified char and 19% of the total cold producer gas is required to supply the remaining70%. Consecutively, an important amount of 148 kWth/MWwood of sensible heat of the fumes and wetproducer gas is available below the pinch, from which 36% can be recovered as electricity with a Rankinecycle (Fig. 2b). In Viking gasification, the heat demand is satisfied by partial oxidation inside the reactorand the composite curves do not show a process pinch due to heat transfer. The key advantage of thistechnology in terms of gas efficiency is however caused by the staged gasification concept. In contrastto FICFB gasification where the entire heat demand for the decomposition must be withdrawn from thechemical energy of the material streams, part of this demand is satisfied by recovering the sensible heatfrom the producer gas in the pyrolysis. Less heat is thereby released from the material stream, and only amarginal 20 kWel/MWwood can be by-produced from the 52 kWth/MWwood that must be evacuated fromthe system.
4 Exergy analysis
4.1 Method
In order to further investigate the loss sources of the gasification systems, exergy balances consideringthe exergy value of material, thermal and mechanical streams (designatedEy, Eq and E respectively) aredefined for all process sections. The exergy losses L (Eq. 8) and efficiency η (Eq. 9) are then calculated
8

200
300
400
500
600
700
800
900
1000
1100
1200
1300
-300 -250 -200 -150 -100 -50 0 50 100 150 200
T [K
]
Q [kW]
Other process streamsGasification (with steam preparation) cooling water
producer gasand fumes
producer gas,fumes andair preheat
steam preparation
gasification reactor
combustion
200
300
400
500
600
700
800
900
1000
1100
1200
1300
-300 -250 -200 -150 -100 -50 0 50 100 150 200
T [K
]Q [kW]
Other process streamsPyrolysis reactor cooling water
producer gas
producer gasand air preheat
a - Heat supply for gasification and pyrolysis from utility and process streams (without the steam cycle).
200
300
400
500
600
700
800
900
1000
1100
1200
1300
-150 -125 -100 -75 -50 -25 0 25 50 75 100 125 150
T [K
]
Q [kW]
Process streamsSteam network
Mech. power
200
300
400
500
600
700
800
900
1000
1100
1200
1300
-150 -125 -100 -75 -50 -25 0 25 50 75 100 125 150
T [K
]
Q [kW]
Process streamsSteam network
Mech. power
b - Heat recovery from the process streams with a steam cycle.
-0.1
0
0.1
0.2
0.3
0.4
0.5
0.6
0.7
0.8
0.9
1
-150 -125 -100 -75 -50 -25 0 25 50 75 100 125 150
1-T a
/T [-
]
Q [kW]
Process streamsSteam network
Mech. power
-0.1
0
0.1
0.2
0.3
0.4
0.5
0.6
0.7
0.8
0.9
1
-150 -125 -100 -75 -50 -25 0 25 50 75 100 125 150
1-T a
/T [-
]
Q [kW]
Process streamsSteam network
Mech. power
c - Exergy representation of the heat recovery from the process streams with a steam cycle.
Figure 2: Composite curves for FICFB (left) and Viking gasification (right).
9

Type FICFB VikingConsumption Wood 1000 kW 1000 kW
Electricity 2 kW 2 kWProduction Gas 784 kW 907 kW
Electricity 54 kW 20 kWLosses Gasification 13 kW 27 kW
Combustion 14 kW -Gas cooling 59 kW 22 kWCooling water 91 kW 32 kWTotal 177 kW 81 kW
Efficiencies εcg 78.4% 90.7%εtot 83.8% 92.5%
Table 6: Energy balances. Note that the total consumption must not necessarily equal the total productionand losses since the consumption and production terms are based on lower heating value, but the gascooling loss includes condensation.
according to:
L =∑ E+y +∑ E+
q +∑ E+
− (∑ E−
y +∑ E−q +∑ E−)
(8)
η =1− L
∑ E+y + ∑ E+
q + ∑ E+ (9)
where superscripts ’+’ and ’-’ refer to streams entering and leaving the section, respectively. The exergyvalue of material streams is determined by adding its exergy value at atmospheric temperature Ta and theexergy necessary for heating the stream:
Ey = m
[Δk0 +
∫ T
Ta
cp
(1− Ta
T
)dT
]
= m[Δk0 + cp (T −Ta(1+ ln(T/Ta))
](10)
where Δk0 is the exergy value per unit mass and cp the specific sensible heat at constant pressure. In thisformulation, the contribution of the pressure is not included in Ey, since the whole system operates atatmospheric pressure. The assumption of a constant cp is also used to determine the exergy value of thethermal streams:
Eq =∫ T2
T1
(1− Ta
T
)dQ
= m∫ T2
T1
cp
(1− Ta
T
)dT
= mcp [(T2 −T1)−Ta · ln(T2/T1)]
= Q
(1−Ta · ln(T2/T1)
(T2 −T1)
)(11)
Finally, the exergy value of mechanical streams equals is energy valueE .
4.2 Results and discussion
Complementary to the energy conversion analysis of the previous section, the exergy inventory of Table7 highlights that the principal irreversible losses occur in the reactive part of the processes. A comparisonof the gasifiers thereby shows that the exergy depletion in directly heated gasification is higher than inthe indirectly heated reactor since partial oxidation occurs. However, this loss exactly equals out with
10

FICFB VikingL η L η
Section [kW] [%] [kW] [%]Gasificationa 176 87.4 245 80.2Combustion 71 80.5 - -Heat transfer- above pinch 32 85.8 - -- below pinch 27 83.1 16 83.3Gas coolingb 24 75.4 13 87.1Steam turbine 12 86.7 4 86.0Total 342 70.8 278 76.6
a including pyrolysisb The exergy efficiency of the cooling section is assessed on the basis of the theoretical work potential of the rejected heat -
the separation of condensates is not considered as a transformation and the chemical exergy of the inlet material stream is
not included in the denominator of Eq. 9.
Table 7: Exergy losses and efficiencies.
the combined depletion in gasification and combustion of the FICFB technology. As already perceivedin the energy integration analysis, it is the consequences of the combustion that induce the differencein performance. Exergy analysis thereby allows one to directly quantify the potential loss due to thedegradation of valuable thermal energy in heat transfer. Since the loss in mechanical energy potentialcorresponds to the surface area between the uncorrected hot and cold streams in the exergy compositecurves, it is clear that it is impossible to entirely recover the potential of the elevated amount of sensibleheat of hot fumes and wet producer gas. As illustrated in Figure 2c, the indirect heat transfer fromcombustion to gasification above the pinch increases the exergy loss of this section by 13%. Togetherwith the depletion due to the heat transfer below the pinch and the gas cooling section, this results in anoverall exergy efficiency of 70.8% for FICFB gasification, while 76.6% is reached by Viking technology.
5 Potential process improvements
The energy integration and exergy analysis identifies that the main drawback of the FICFB gasificationprocess is its elevated heat requirement at high temperature. This results in a relatively low cold gasefficiency, and the irreversible losses in all process sections do not allow for entirely recovering theconsiderable amount of sensible heat from the fumes and the wet producer gas as electricity. By mainlytargeting to decrease the minimum energy requirement (MER) above the pinch and the exergy losses inthe reactive steps, this section presents measures to increase the cold gas and total process efficiency.
5.1 Fuel choice
In the FICFB demonstration plant, the combustion zone is fed with additional cold, clean producer gasto balance the heat demand of the gasification (Hofbauer et al., 2002). This has the main advantage thatthe gas handling is conveniently simple, but it consumes energy from above the pinch to heat the coldgas in the combustion zone. In order to satisfy the heat demand of the gasification reactor in a moreefficient way, hot producer gas could be withdrawn from the gasifier outlet. Although the actual MERof 266 kWth/MWwood does not change, no more heat from combustion is used to preheat the fuel. Asshown in Table 8, the exergy losses in the combustion and the energy losses in the cooling water arereduced, and less energy must be withdrawn from the product stream. An advantageous side-effect isfurther observed in the gas cooling section since less gas is processed. Overall, using the hot and dirtyproducer gas instead of clean and dry one would allow for increasing the cold gas and total efficienciesby 3% and 2%, respectively.
11
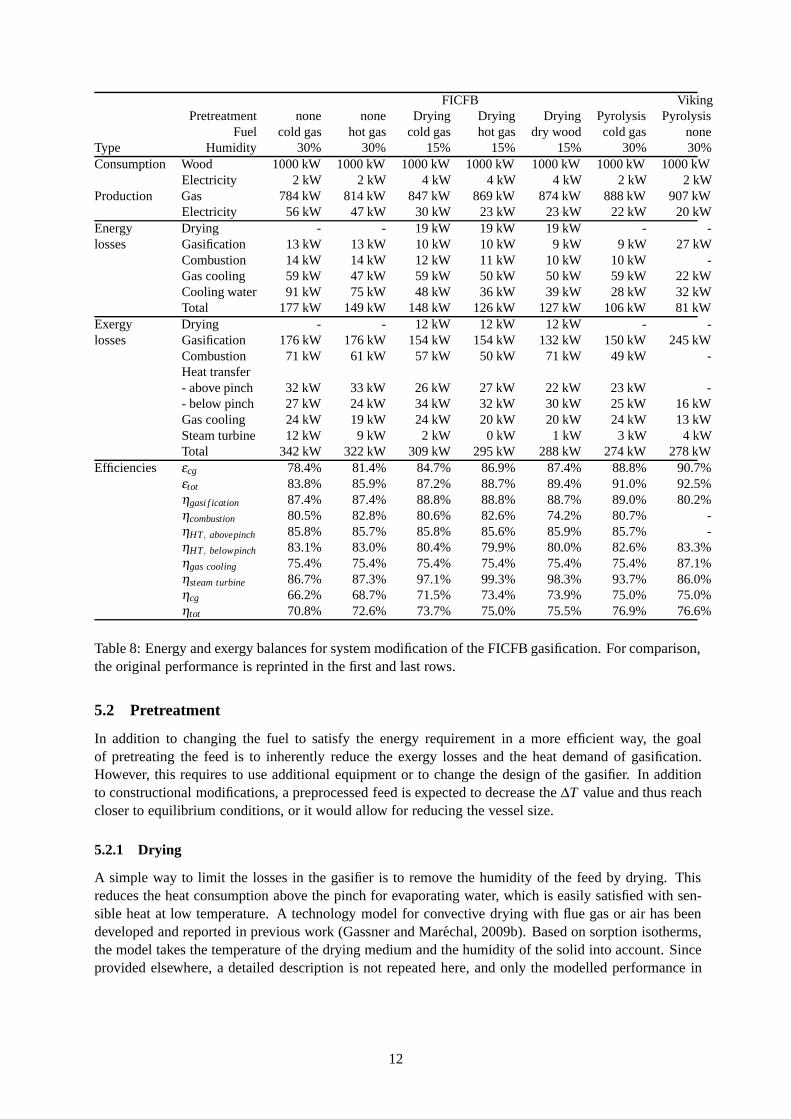
FICFB VikingPretreatment none none Drying Drying Drying Pyrolysis Pyrolysis
Fuel cold gas hot gas cold gas hot gas dry wood cold gas noneType Humidity 30% 30% 15% 15% 15% 30% 30%Consumption Wood 1000 kW 1000 kW 1000 kW 1000 kW 1000 kW 1000 kW 1000 kW
Electricity 2 kW 2 kW 4 kW 4 kW 4 kW 2 kW 2 kWProduction Gas 784 kW 814 kW 847 kW 869 kW 874 kW 888 kW 907 kW
Electricity 56 kW 47 kW 30 kW 23 kW 23 kW 22 kW 20 kWEnergy Drying - - 19 kW 19 kW 19 kW - -losses Gasification 13 kW 13 kW 10 kW 10 kW 9 kW 9 kW 27 kW
Combustion 14 kW 14 kW 12 kW 11 kW 10 kW 10 kW -Gas cooling 59 kW 47 kW 59 kW 50 kW 50 kW 59 kW 22 kWCooling water 91 kW 75 kW 48 kW 36 kW 39 kW 28 kW 32 kWTotal 177 kW 149 kW 148 kW 126 kW 127 kW 106 kW 81 kW
Exergy Drying - - 12 kW 12 kW 12 kW - -losses Gasification 176 kW 176 kW 154 kW 154 kW 132 kW 150 kW 245 kW
Combustion 71 kW 61 kW 57 kW 50 kW 71 kW 49 kW -Heat transfer- above pinch 32 kW 33 kW 26 kW 27 kW 22 kW 23 kW -- below pinch 27 kW 24 kW 34 kW 32 kW 30 kW 25 kW 16 kWGas cooling 24 kW 19 kW 24 kW 20 kW 20 kW 24 kW 13 kWSteam turbine 12 kW 9 kW 2 kW 0 kW 1 kW 3 kW 4 kWTotal 342 kW 322 kW 309 kW 295 kW 288 kW 274 kW 278 kW
Efficiencies εcg 78.4% 81.4% 84.7% 86.9% 87.4% 88.8% 90.7%εtot 83.8% 85.9% 87.2% 88.7% 89.4% 91.0% 92.5%ηgasi f ication 87.4% 87.4% 88.8% 88.8% 88.7% 89.0% 80.2%ηcombustion 80.5% 82.8% 80.6% 82.6% 74.2% 80.7% -ηHT, abovepinch 85.8% 85.7% 85.8% 85.6% 85.9% 85.7% -ηHT, belowpinch 83.1% 83.0% 80.4% 79.9% 80.0% 82.6% 83.3%ηgas cooling 75.4% 75.4% 75.4% 75.4% 75.4% 75.4% 87.1%ηsteam turbine 86.7% 87.3% 97.1% 99.3% 98.3% 93.7% 86.0%ηcg 66.2% 68.7% 71.5% 73.4% 73.9% 75.0% 75.0%ηtot 70.8% 72.6% 73.7% 75.0% 75.5% 76.9% 76.6%
Table 8: Energy and exergy balances for system modification of the FICFB gasification. For comparison,the original performance is reprinted in the first and last rows.
5.2 Pretreatment
In addition to changing the fuel to satisfy the energy requirement in a more efficient way, the goalof pretreating the feed is to inherently reduce the exergy losses and the heat demand of gasification.However, this requires to use additional equipment or to change the design of the gasifier. In additionto constructional modifications, a preprocessed feed is expected to decrease the ΔT value and thus reachcloser to equilibrium conditions, or it would allow for reducing the vessel size.
5.2.1 Drying
A simple way to limit the losses in the gasifier is to remove the humidity of the feed by drying. Thisreduces the heat consumption above the pinch for evaporating water, which is easily satisfied with sen-sible heat at low temperature. A technology model for convective drying with flue gas or air has beendeveloped and reported in previous work (Gassner and Marechal, 2009b). Based on sorption isotherms,the model takes the temperature of the drying medium and the humidity of the solid into account. Sinceprovided elsewhere, a detailed description is not repeated here, and only the modelled performance in
12

5 10 15 20 25 3078
80
82
84
86
88
90
Wood humidity after drying [%wt]
εdrying
εcg
εtot
Ta,d
= 160°C
Ta,d
= 200°C
Ta,d
= 240°C
40
50
60
70
80
90
100ε
drying
[%]
εcgε
tot
[%]
Figure 3: Drying efficiency and impact of drying on the process performance.
terms of drying efficiency εdrying is reported:
εdrying =Δhvap mH2O,vap + Qdrywood
Qair preheat + E f an(12)
where Δhvap represents the vaporisation enthalpy of water, mH2O,vap the amount of evaporated water inthe dryer, Qdrywood and Qair preheat the sensible heat of the dried wood and preheated air, and E f an theelectric power consumption of the fan. Figure 3 shows the drying efficiency for three different air preheattemperature levels and the impact of drying on the cold gas and total efficiency of the process. Due to thelarge amount of heat that is available in this temperature range, the process efficiencies are not sensibleto the drying efficiency. Only for very intense drying at low efficiency, the usage of heat gets conflictivewith the electricity generation in the Rankine cycle. More importantly, the graph shows that the processperformance is considerably increased by drying the feed. At a humidity level of 15% detailed in thecomparative table (Tab. 8), the cold gas efficiency is increased by more than 6% compared to woodat 30% humidity. Since heat below the pinch is used, the MER is decreased by 18% from 266 to 217kWth/MWwood and the exergy losses due to water evaporation at high temperature in the gasifier drop bymore than 12%. Drying therefore appears as a chemical heat pump.
In analogy with using hot instead of cold producer gas, some more benefit from drying can be obtainedif the heat demand is satisfied with dried wood. Since less feed material is processed, the MER isfurther reduced to 185 kWth/MWwood , and the cold gas efficiency increases by 9% overall compared tothe reference technology. However, this solution would require a technical redesign of the combustionchamber and adding a biomass hopper.
5.2.2 Pyrolysis
Alternatively to installing a wood dryer, it is conceivable to feed the FICFB gasification reactor via thesame type of screw pyrolysis device used in Viking gasification. This would have an amplified beneficialeffect on the conversion efficiency, since the humidity is completely evaporated and the endothermaldecomposition is set on with heat below the pinch. By reducing the MER to 185 kWth/MWwood , thecomparative table (Tab. 8) shows that more than 10% improvement in cold gas and 7% in total effi-ciency compared to the reference solution is possible. If hot producer gas is furthermore used to supplythe remaining heat, the cold gas and total efficiency increase to 90.5% and 92.2% in terms of energyand 76.4% and 77.9% in terms of exergy, respectivly. With similar pretreatment, the performance ofFICFB gasification is thus very close to Viking gasification, and might even exceed it with respect to theindicators based on exergy.
The conceptual flowsheet with a practicable structure of the heat exchanger network and the corre-sponding composite curve of this process option are shown in Figure 4. According to the calculations,
13

Ash
Air
Fuel (withdrawn from cold producer gas)
Producer gas
Water
Bed material/ungasified char
Condensates
Flue gas
40°C
150°C
120°C
Particles
Pyrolysis/Gasification
Char/fuelcombustion
800-900°C
Pyrolysis
Wood
heat from16 and 1 bar utilisation headers of steam cycle
heat to combustion air preheatand 60 bar steam production
heat fromflue gas cooling
200
300
400
500
600
700
800
900
1000
1100
1200
1300
-300 -250 -200 -150 -100 -50 0 50 100 150 200
T [K
]
Q [kW]
Other process streamsPyrolysis and gasification with stream preparation
steam condensationby cooling water
producer gasand fumes
steam preparation
gasification reactor
combustion
16 bar and 1 barsteam headers
pyrolysis
producer gas, fumesand air preheat
producer gas, fumes,air preheat and steamsuperheat
Figure 4: Modified flowsheet with outline of heat exchanger network (left) and composite curve ofFICFB gasification with feed pretreatment by Viking pyrolysis.
the sensible heat of the producer gas balances the heat demand of the pyrolysis. It could thus be cooledin the jacket of the pyrolysis screw before entering the cold gas cleaning. The sensible heat of the fumesis left to preheat the combustion air and to produce steam in order to cogenerate electricity via the steamRankine cycle.
6 Performance in SNG production
Producer gas from gasification is generally not a product on its own, but further converted to electricity,chemicals or fuels. Obviously, the overall performance of such systems does not only rely on the gasifierefficiency, but also on its integration with the rest of the system. For the two gasification systems, thiseffect is studied at the example of SNG production, which is a promising alternative to liquid synthe-sis fuels for transport applications. In such a process, clean producer gas is catalytically converted tomethane by reforming the higher hydrocarbons (Eq. 13) and methanation of CO and H2 (Eq. 14) tothermodynamic equilibrium at 300-400◦C , whereas the necessary CO is provided by the simultaneouslyoccurring water gas shift reaction (Eq. 4):
C2H4 +2H2O � 2CO+4H2 Δh0r =209kJ/mol (13)
CO+3H2 � CH4 +H2O Δh0r =−206kJ/mol (14)
As producer gas from biomass feedstock generally lacks hydrogen to be completely reformed intomethane, a considerable amount of CO2 is by-produced in these reactions. In order to inject the gas intogrid, the crude product must be upgraded to natural gas quality by drying and removal of the bulk CO2
to reach a Wobbe Index of at least 13.3 kWhHHV /Nm3. With both producer gas compositions of Table4, this criterion can however not be met without removing the nitrogen. Instead of a cumbersome post-treatment, nitrogen is more conveniently avoided by primary measures directly in gasification. In FICFBgasification, the relatively small amount of nitrogen the producer gas is due to its usage for feed inerti-sation and some slip from the gasification chamber. In a new plant, inertisation could be done with CO2,and by taking special care to nitrogen slip in the design, it is assumed that its concentration is decreasedto 0.5%vol. In Viking gasification, the nitrogen is introduced with the air for partial oxidation and canonly be avoided by using oxygen. In this work, either ion transfer membranes (ITM) or electrolysis areconsidered for oxygen production. ITM is an emerging technology that is not yet commercially proven.It is expected to consume about 147 kWhel /tonO2 and 1.25 MWhth/tonO2 to heat the air from 500◦C upto the membrane’s operating temperature of 900◦C (van Stein et al., 2002). As an alternative, oxygenproduction by electrolysis is accompanied by an important by-production of hydrogen, which could itselfbe used in the methanation to increase the SNG yield from biomass (Gassner and Marechal, 2008).
14

gasification methanation CO2-removalUnit FICFB Viking FICFB Viking Vikinga FICFB Viking Vikinga
C2H4 %vol 2.4 - - - - - - -CH4 %vol 11.7 2.7 49.8 38.5 49.8 92.0 91.9 92.3H2 %vol 41.9 46.5 3.0 2.3 3.0 4.8 5.0 4.8CO %vol 22.8 28.4 0.1 0.1 0.1 0.1 0.2 0.1CO2 %vol 20.6 22.0 46.1 58.3 46.5 1.0 1.1 1.3N2 %vol 0.5 0.4 1.1 0.8 0.8 2.1 1.9 1.4
a with hydrogen injection from electrolysis.
Table 9: Dry gas compositions, flowrates and energy balance in SNG production.
FICFB VikingPretreatment none Drying Pyrolysis Pyrolysis Pyrolysis
Type O2-production none none none ITM ElectrolysisChemical energy wood, wet, in 1000 kW 1000 kW 1000 kW 1000 kW 1000 kW
wood, dry 1000 kW 1034 kW 1000 kW 1000 kW 1000 kWproducer gas- gross 1026 kW 1026 kW 1026 kW 931 kW 931 kW- net 770 kW 839 kW 875 kW 896 kW 931 kWcrude SNG, methanation 672 kW 730 kW 762 kW 724 kW 973 kWSNG, out 645 kW 704 kW 734 kW 698 kW 941 kW
electric energy consumption 33 kW 39 kW 37 kW 57 kW 433 kWproduction 109 kW 82 kW 82 kW 94 kW 117 kWnet production 76 kW 43 kW 45 kW 37 kW -316 kW
Efficiencies εcg 64.5% 70.4% 73.4% 69.8% 94.1%εtot 72.1% 74.7% 77.9% 73.6% 71.5%ηcg 56.2% 61.2% 63.9% 60.8% 81.9%ηtot 62.5% 64.9% 67.6% 63.9% 64.7%
Table 10: Chemical energy flows and overall energy balances in SNG production.
With the process model develop in previous work (Gassner and Marechal, 2009b), the system perfor-mance for both gasifiers is determined by considering that the bulk CO2 is removed by pressure swingadsorption in order to meet the condition on the Wobbe Index. In order to limit the number of options tobe discussed, it is assumed that the process heat demand is satisfied with cold producer gas. For Vikinggasification, the steam network used for energy recovery is slightly adapted to the different process con-ditions. Instead of steam production at 60 bar, methanation at 320◦C and a low amount of heat availableabove favours steam production at 50 bar and superheating to 480◦C (ITM) or 460◦C (electrolysis).
Tables 9 shows the computed gas compositions for this process setup. With the chosen approach forthe gasification modelling, the ratios between the species are preserved. As the producer gas from indi-rectly heated, steam-blown gasification contains more (atomic) hydrogen, the relative share of methanein the crude product is higher than the one obtained from the partially oxidised producer gas. However,this share equals out if by-produced H2 from water separation is added before methanation. In order tocompare the performance of both in the system, the chemical energy flows and overall efficiencies areshown in Table 10 for the pretreatment options discussed in Section 5. According to the thermodynamicanalysis of the gasifiers, the net producer gas yield from gasification is in all cases higher for Vikingtechnology. After methanation, however, this advantage is considerably reduced or even lost if the feedis dried or pyrolysed. As less methane is present in the partially oxidised producer gas, the equilibriumconversion to methane is higher, and more energy is released in the exothermal methanation reactions.The system with FICFB gasification actually benefits from the fact that the producer gas is further awayfrom equilibrium because the gasification reactions are less endothermal – and the ones in methanationless exothermal. With respect to chemical and overall performance, Viking gasification with pure oxy-gen is therefore only better if the FICFB feed is not dried. As for the isolated performance, drying and
15

pyrolysis considerably increase the cold gas efficiency of the latter by 6% and 9%. With an potentialoverall efficiency of almost 78% for FICFB gasification with pyrolysis pretreatment, this technologyseems clearly advantageous for SNG production. Directly heated gasification with oxygen from elec-trolysis shows a very high SNG yield and an acceptable total efficiency especially in terms of exergy.The balance demonstrates that it is a way to increase the SNG yield from wood by converting electricityto SNG. From a practical point of view, the rationality of such a conversion might however be doubtedsince the energy and exergy value of the gas are technologically by far not recoverable to supply a usefulenergy service.
7 Conclusions
Using adjusted equilibrium equations in flowsheet calculations and performing the process integrationwith pinch analysis, indirectly heated, fluidised bed gasification with steam as gasifying agent (FICFB)and two-stage, fixed bed gasification with air as gasifying agent (Viking) are compared with respect to thethermodynamic conversion and energetic performance. The modelling approach allows for accuratelyreproducing experimentally observed gas compositions and to quantify the difference to thermodynamicequilibrium. Directly heated, fixed bed gasifier is observed to be closer to equilibrium than FICFBgasification. The reason for this is suspected in an unequal temperature distribution in the reactor andintermediate heating of the pyrolysis product for tar cracking.
In order to analyse the overall performance and identify the major losses, the energy integration hasbeen completed with an exergy analysis of the different process sections. Due to a pinch of the FICFBprocess streams at high temperature, its hot utility requirements satisfied with cold producer gas are ele-vated and the exergy potential of the sensible heat is only partially recovered. Viking gasification provesparticularly efficient since part of the sensible heat is used to dry and start the endothermal decomposi-tion at low temperature. With the actual technology at demonstration status, the advantage of a nitrogenfree product gas with high calorific value obtained from FICFB gasification is thus penalised by a 12%lower cold gas and 9% lower overall energy efficiency for wood at 30% humidity. However, process in-tegration allows for partly compensating the exergy losses and substantial improvements can be obtainedby satisfying the heat requirement of the plant with other streams and using additional technology. Inparticular, balancing the heat requirement with hot producer gas would increase the cold gas and totalenergy efficiencies by 3% and 2%, drying the feed to 15% humidity allows for a 6% and 3% increase,and using the same type of screw pyrolysis than in Viking gasification improves these efficiencies by10% and 7%, respectively. By applying several of these modifications, the gap to Viking gasification isreduced in terms of energy efficiency, and even surmounted in terms of exergy efficiency.
A final comparison of the performance of both gasification technologies in an integrated plant forSNG production shows that the advantage in cold gas efficiency is quickly compensated by a higherheat release in methanation. The fact that the producer gas from FICFB gasification is further awayfrom equilibrium turns out to be an advantage since the endothermicity of the gasification reactions isrestrained and less chemical energy is lost in methanation.
References
Bacon, D., Downie, J., Hsu, J., Peters, J., 1982. Fundamentals of thermochemical biomass conversion.Elsevier, London, Ch. Modeling of fluidized bed wood gasifiers, pp. 717–732.
Belsim SA, last visited 04/2009. Vali IV. www.belsim.com.
Brown, D., 2007. Development and application of an equilibrium reaction modelling approach and ofheat integration methodologies for the conceptual design of biomass gasification energy conversionsystems. Ph.D. thesis, Tokyo Institute of Technology.
16

Brown, D., Gassner, M., Fuchino, T., Marechal, F., 2009. Thermo-economic analysis for the optimalconceptual design of biomass gasification energy conversion systems. Applied Thermal Engineering29, 2137–2152.
Craig, K., Mann, M., 1996. Cost and performance analysis of biomass-based integrated gasificationcombined-cycle power systems. Tech. rep., NREL, Colorado, USA.
Duret, A., Friedli, C., Marechal, F., 2005. Process design of Synthetic Natural Gas (SNG) productionusing wood gasification. Journal of Cleaner Production 13, 1434–1446.
Fassinou, W. F., Van de Steene, L., Toure, S., Volle, G., Girard, P., 2009. Pyrolysis of pinus-pinaster ina two-stage gasifier: Influence of processing parameters and thermal cracking of tar. Fuel ProcessingTechnology 90, 75–90.
Fryda, L., Panopoulos, K. D., Karl, J., Kakaras, E., 2008. Exergetic analysis of solid oxide fuel cell andbiomass gasification integration with heat pipes. Energy 33, 292–299.
Gassner, M., Marechal, F., 2008. Thermo-economic optimisation of the integration of electrolysis insynthetical natural gas production from wood. Energy 33, 189–198.
Gassner, M., Marechal, F., 2009a. Methodology for the optimal thermo-economic, multi-objective designof thermochemical fuel production from biomass. Computers and Chemical Engineering 33, 769–781.
Gassner, M., Marechal, F., 2009b. Thermo-economic process model for thermochemical production ofsynthetic natural gas (SNG) from lignocellulosic biomass. Submitted in revised form to Biomass andBioenergy , .
Gøbel, B., Henriksen, U., Ahrenfeldt, J., Jensen, T., Hindsgaul, C., Bentzen, J., Sørensen, L., 2004. Status– 2000 hours of operation with the Viking gasifier. In: Proceedings of the 2nd World Conference andTechnology Exhibition on Biomass for Energy and Industry. Rome.
Gumz, W., 1950. Gas producers and blast furnaces. Wiley, New York.
Hamelinck, C. N., Faaij, A. P. C., den Uil, H., Boerrigter, H., 2004. Production of FT transportationfuels from biomass; technical options, process analysis and optimisation, and development potential.Energy 29, 1743–1771.
Henriksen, U., Ahrenfeldt, J., Bentzen, J., 2005. Langtidsforsøg med totrinsforgasseren ”Viking”. Tech.Rep. MEK-ET-2005-7, DTU, Lyngby, Denmark.
Henriksen, U., Ahrenfeldt, J., Jensen, T., Gøbel, B., Bentzen, J., Hindsgaul, C., Sørensen, L., 2006. Thedesign, construction and operation of a 75 kW two-stage gasifier. Energy 31, 1542–1553.
Heyne, S., Thunman, H., Harvey, S., 2008. Integration aspects for synthetic natural gas production frombiomass based on a novel indirect gasification concept. In: PRES 2008, 11th Conference on ProcessIntegration, Modelling and Optimisation for Energy Saving and Pollution Reduction. Prague.
Hofbauer, H., Rauch, R., Loeffler, G., Kaiser, S., Fercher, E., Tremmel, H., 2002. Six years experiencewith the FICFB-gasification process. In: Proceedings of the 12th European Conference and Technol-ogy Exhibition on Biomass for Energy, Industry and Climate Protection. Amsterdam, Netherlands.
Huang, H., Ramaswamy, S., 2009. Modeling biomass gasification using thermodynamic equilibriumapproach. Applied Biochemistry and Biotechnology, Article in Press 154, 14–25.
Jarungthammachote, S., Dutta, A., 2007. Thermodynamic equilibrium model and second law analysis ofa downdraft waste gasifier. Energy 32, 1660–1669.
17

Karellas, S., Karl, J., Kakaras, E., 2008. An innovative biomass gasification process and its coupling withmicroturbine and fuel cell systems. Energy 33, 284–291.
Kersten, S., 2002. Biomass gasification in circulating fluidized beds. Ph.D. thesis, Twente University,Enschede.
Li, X. T., Grace, J. R., Lim, C. J., Watkinson, A. P., Chen, H. P., Kim, J. R., 2004. Biomass gasificationin a circulating fluidized bed. Biomass and Bioenergy 26, 171–193.
Luterbacher, J., Froling, M., Vogel, F., Marechal, F., Tester, J. W., 2009. Hydrothermal gasification ofwaste biomass: Process design and life cycle assessment. Environmental Science and Technology 43,1578–1583.
Mozaffarian, M., Zwart, R. W. R., 2003. Feasibility of biomass/waste-related SNG production technolo-gies. Tech. rep., ECN, Petten.
Omosun, A. O., Bauen, A., Brandon, N. P., Adjiman, C. S., Hart, D., 2004. Modelling system efficienciesand costs of two biomass-fuelled sofc systems. Journal of Power Sources 131, 96–106.
Pellegrini, L. F., de Oliveira Jr., S., 2007. Exergy analysis of sugarcane bagasse gasification. Energy 32,314–327.
Perry, S., Klemes, J., Bulatov, I., 2008. Integrating waste and renewable energy to reduce the carbonfootprint of locally integrated energy sectors. Energy 33, 1489–1497.
Prins, M. J., Ptasinski, K. J., Janssen, F. J. J. G., 2007. From coal to biomass gasification: Comparisonof thermodynamic efficiency. Energy 32, 1248–1259.
Proll, T., Hofbauer, H., 2008. H2 rich syngas by selective co2 removal from biomass gasification in adual fluidized bed system – process modelling approach. Fuel Processing Technology 89, 1207–1217.
Ptasinski, K. J., 2008. Thermodynamic efficiency of biomass gasification and biofuels conversion. Bio-fuels, Bioproducts and Biorefining 2, 239–253.
Ptasinski, K. J., Prins, M. J., Pierik, A., 2007. Exergetic evaluation of biomass gasification. Energy 32,568–574.
Rauch, R., written around 2004. Stromerzeugung aus Biomasse durch Wasserdampfvergasung. Tech.rep., Institut fur Verfahrens-, Brennstoff- und Umwelttechnik, TU Wien, www.ficfb.at, last visited04/2009.
Schuster, G., Loffler, G., Weigl, K., Hofbauer, H., 2001. Biomass steam gasification – an extensiveparametric modeling study. Bioresorce Technology 77, 71–79.
Spath, P., Dayton, D., 2003. Preliminary screening – technical and economic assessment of synthesis gasto fuels and chemicals with emphasis on the potential for biomass-derived syngas. Tech. rep., NREL,Colorado, USA.
Stucki, S., 2005. Projet bois–methane. Rapport sur la cloture de la phase 1 du projet: Preuve de lafaisabilite technique a l’echelle du laboratoire. Tech. rep., PSI, Villigen, Switzerland.
Szargut, J., Styrylska, T., 1964. Angenaherte Bestimmung der Exergie von Brennstoffen. Brennstoff-Warme-Kraft 16, 589–636.
van Stein, E. E., Juwono, E., Demetri, E. P., 2002. The impact of ITM oxygen on economics for coal-based IGCC. In: Proceedings of the 27th International Technical Conference on Coal Utilization &Fuel Systems. Clearwater, Florida.
Yoshikawa, K., 2006. R&d (research and development) on distributed power generation from solid fuels.Energy 31, 1656–1665.
18

![Viking™ M / Viking™ L / Viking™XLportale.siva.it/files/doc/product/7it137105 rev 4 - viking m-l-xl_.pdf · Viking M / Viking L / Viking XL • 7IT137105 Rev 4 3 'H¿QL]LRQL](https://static.fdocuments.net/doc/165x107/5e50e48a160c0c016b766bb4/vikinga-m-vikinga-l-vikinga-rev-4-viking-m-l-xlpdf-viking-m-viking.jpg)