Thermodynamic Analysis of DNA Nanotubes - … · Thermodynamic Analysis of DNA Nanotubes ......
46
UNIVERSITY OF CALIFORNIA Santa Barbara Thermodynamic Analysis of DNA Nanotubes A Dissertation Submitted in Partial Satisfaction of the Requirements for Honors in the Degree of Bachelor of Science in Physics by Matthew Rowley Thesis Advisor: Dr. Deborah Fygenson Professor of Physics June 2010
Transcript of Thermodynamic Analysis of DNA Nanotubes - … · Thermodynamic Analysis of DNA Nanotubes ......
UNIVERSITY OF CALIFORNIA
Santa Barbara
Thermodynamic Analysis of DNA Nanotubes
A Dissertation Submitted in Partial Satisfaction of the
Requirements for Honors in the Degree of
Bachelor of Science
in
Physics
by
Matthew Rowley
Thesis Advisor:
Dr. Deborah Fygenson
Professor of Physics
June 2010
The Dissertation of Matthew Rowley is Approved by:
_____________________________________________________________
Faculty Mentor Date
_____________________________________________________________
Faculty Advisor Date
University of CaliforniaSpring 2010
Table of Contents
Chapter 1: Introduction………………………………………………… 1
I. Abstract……………………………………………………..1
II. Background and Motivation……………………………….. 1
Chapter 2: Materials and Methods…………………………………….. 6
I. DNA Strands and Tile Design …………………………….. 6
II. Fluorescence Monitoring Technique ………………............ 6
III. Construct Preparation……………………………………… 7
IV. Analysis Protocols…………………………………………. 8
Chapter 3: Results……………………………………………………….. 12
I. Technical Results…...……...……...……...……...……........12
a) Evaporation Control………………………………………. 12b) Fluorescence Fluctuations………………………………… 15c) Fluorescence Decay……………………………………...... 16d) Transition Identification………………………………...…. 18e) Comparing Absorbance and Fluorescence…………...…… 19
II. Tile Construct Results………........................................... 21
a) Nanotube Melting Characteristics………………………… 21b) Dimers, Tetramers and Ladders…………………………... 23c) Van’t Hoff Analysis of Tetramers…………………………. 26d) Nearest Neighbor Thermodynamic Calculations…………. 29
Chapter 4: Discussion…………………………………………………….31
I. Cooperativity…...……...……...……...……...……...……... 31
II. Predicting Tm for Dimers and Nanotubes……….................. 34
III. Hysteresis and Cooperativity………………………………. 36
IV. Directions for Further Research…………………………… 38
Chapter 5: Conclusion………………………………………………….... 39
List of Figures………………………………………………………40
References…………………………………………………………..41
Appendix A1: Strand Sequences…………………………………... 42
1
1. Introduction
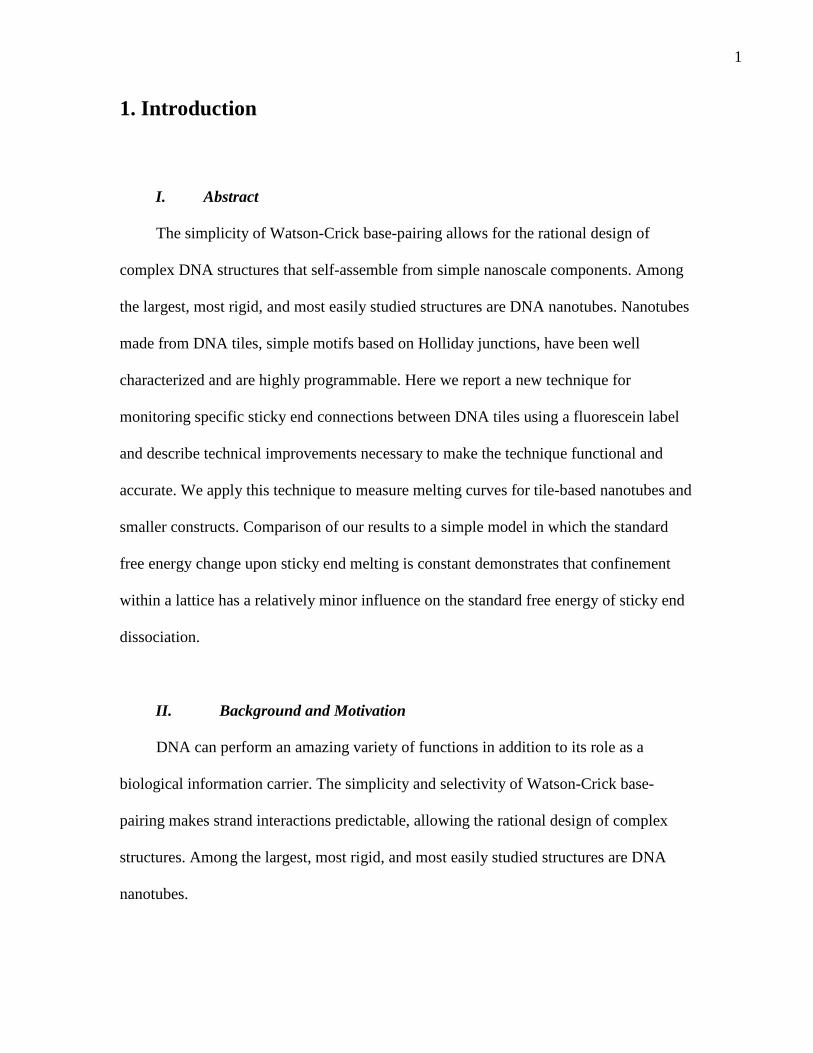
I. Abstract
The simplicity of Watson-Crick base-pairing allows for the rational design of
complex DNA structures that self-assemble from simple nanoscale components. Among
the largest, most rigid, and most easily studied structures are DNA nanotubes. Nanotubes
made from DNA tiles, simple motifs based on Holliday junctions, have been well
characterized and are highly programmable. Here we report a new technique for
monitoring specific sticky end connections between DNA tiles using a fluorescein label
and describe technical improvements necessary to make the technique functional and
accurate. We apply this technique to measure melting curves for tile-based nanotubes and
smaller constructs. Comparison of our results to a simple model in which the standard
free energy change upon sticky end melting is constant demonstrates that confinement
within a lattice has a relatively minor influence on the standard free energy of sticky end
dissociation.
II. Background and Motivation
DNA can perform an amazing variety of functions in addition to its role as a
biological information carrier. The simplicity and selectivity of Watson-Crick base-
pairing makes strand interactions predictable, allowing the rational design of complex
structures. Among the largest, most rigid, and most easily studied structures are DNA
nanotubes.
2
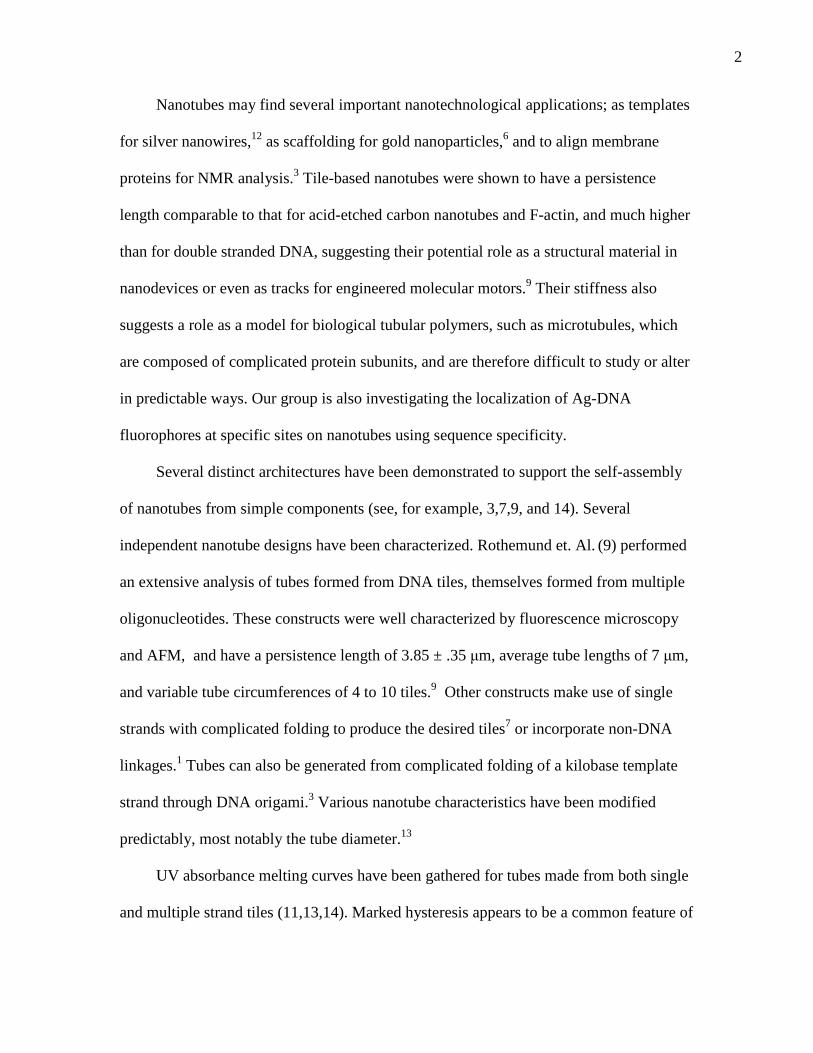
Nanotubes may find several important nanotechnological applications; as templates
for silver nanowires,12 as scaffolding for gold nanoparticles,6 and to align membrane
proteins for NMR analysis.3 Tile-based nanotubes were shown to have a persistence
length comparable to that for acid-etched carbon nanotubes and F-actin, and much higher
than for double stranded DNA, suggesting their potential role as a structural material in
nanodevices or even as tracks for engineered molecular motors.9 Their stiffness also
suggests a role as a model for biological tubular polymers, such as microtubules, which
are composed of complicated protein subunits, and are therefore difficult to study or alter
in predictable ways. Our group is also investigating the localization of Ag-DNA
fluorophores at specific sites on nanotubes using sequence specificity.
Several distinct architectures have been demonstrated to support the self-assembly
of nanotubes from simple components (see, for example, 3,7,9, and 14). Several
independent nanotube designs have been characterized. Rothemund et. Al. (9) performed
an extensive analysis of tubes formed from DNA tiles, themselves formed from multiple
oligonucleotides. These constructs were well characterized by fluorescence microscopy
and AFM, and have a persistence length of 3.85 ± .35 μm, average tube lengths of 7 μm,
and variable tube circumferences of 4 to 10 tiles.9 Other constructs make use of single
strands with complicated folding to produce the desired tiles7 or incorporate non-DNA
linkages.1 Tubes can also be generated from complicated folding of a kilobase template
strand through DNA origami.3 Various nanotube characteristics have been modified
predictably, most notably the tube diameter.13
UV absorbance melting curves have been gathered for tubes made from both single
and multiple strand tiles (11,13,14). Marked hysteresis appears to be a common feature of
3
nanotube transitions. A detailed analysis (11) of melting curves of nanotubes made from
single strand tiles reported a stark contrast between melting and annealing temperatures,
with a melting temperature of 70-73 ºC and an annealing temperature of 30-40 ºC
supported by UV absorbance, fluorescence microscopy, and AFM data.11 The boundary
between tile transitions and tube transitions in this system, however, does not seem to be
well defined, with a single transition or multiple overlapping transitions visible in the UV
data. Correspondence with other data also appears to have been used to assign transition
identities, since there is no characteristic of the UV curve that is distinctive for different
transitions.
FRET has been used to study the melting of sticky end connections between tiles,8
but the tiles studied were incapable of forming tubes. As expected, increasing the number
of sticky end connections increased the melting temperature, with the incremental effect
of each additional sticky end decreasing.8 This was attributed to entropic effects in which
the additional sticky ends constrict relative rotational degrees of freedom.8 Sticky end
positioning had a smaller, but still significant, effect on the melting temperature, which
was rationalized as resulting from changing constraints on relative motion of the tiles.8
With the exception of the tubes formed by DNA origami, nanotubes are
supramolecular polymers, meaning that they are formed from their constituent monomers
by non-covalent interactions. The hysteresis seen in nanotube melting curves implies that
they can be classified as cooperative nucleated supramolecular polymers.2 The process of
nucleation is therefore very important for nanotube formation, and controlling nucleation
barriers may be an important means to growing longer and more perfect nanotubes.
Schulman and Winfree10 analyzed UV melting curves for DNA ribbons assuming that the
4
sticky end interactions were non-cooperative, and used basic kinetic assumptions to
effectively model the UV melting curves. They also found that adding a seed, consisting
of four linked tiles, greatly reduced the observed hysteresis, indicating that the kinetic
barrier to nucleation can be controlled by heterogeneous nucleation.10 The success of
these efforts at modeling a tile system indicate that nanotubes may also be susceptible to
similar analysis and manipulation. The programmability of tile-based DNA nanotube
systems may allow their use in modeling the behavior of microtubules, biological
supramolecular polymers that also exhibit nucleated growth,5 in which a nucleation
barrier is important for cellular control of microtubule formation.
In this paper, we introduce a new method for monitoring the melting of DNA
nanostructures based on changes in the fluorescence of a fluorescein molecule covalently
linked to the terminal nucleotide at the base of a sticky end. A fluorescent label allows
the isolation of individual sticky end transitions, overcoming the problem inherent in
absorbance measurements, in which the signal change from the sticky end is small
relative to the signal change resulting from internal transitions within the tiles.8 With this
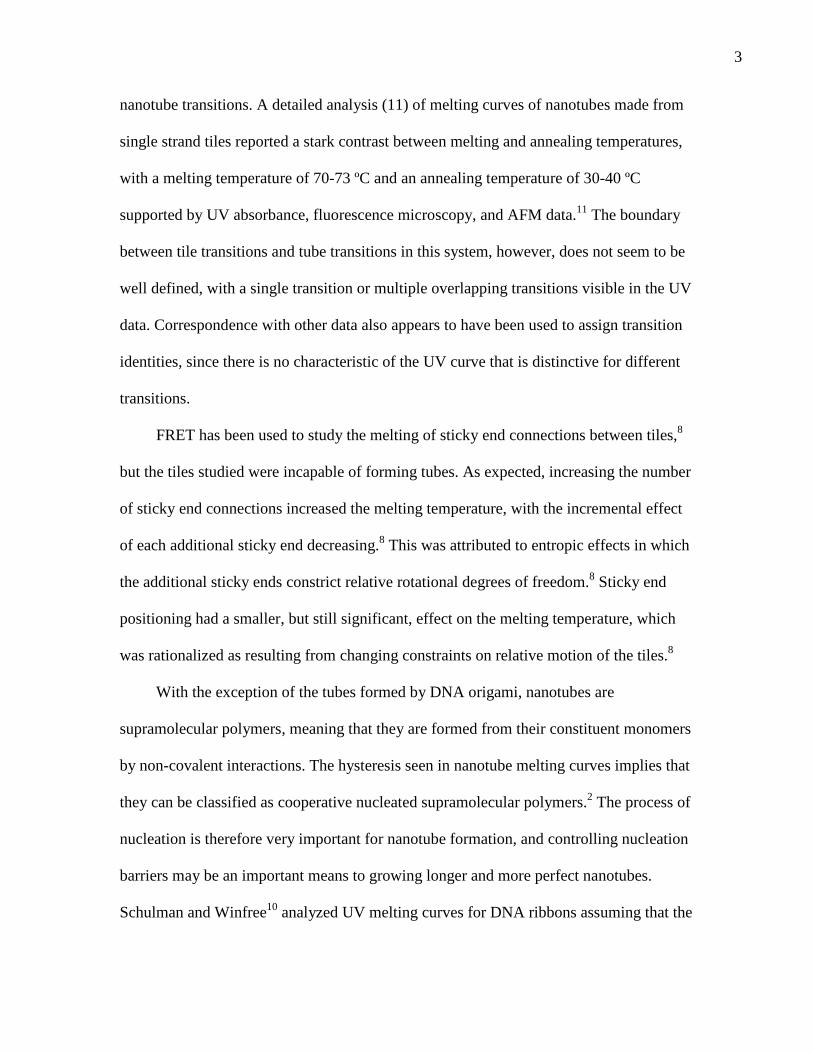
technique, we analyze melting curves of the REp-SEp nanotubes described in (9) and
shown in Figure 1.1, in which melting of the nanotubes occurs at a considerably lower
temperature than does melting of the constituent tiles, allowing the transitions to be
analyzed separately. We also compare transition characteristics, particularly melting
temperatures, for tetrameric and linear structures with the same sticky end connections
and sequences. Differences between the melting transitions of nanotubes and smaller
constructs are compared with a simple non-cooperative model to look for thermodynamic
effects of constraint within a lattice. These measurements allow us to test the assumption
5
in (10) that sticky end bond energies are decoupled, and will improve our ability to
rationally design nanotube characteristics.
a)
b)
c)
d)
Figure 1.1: Schematic describing the REp-SEp Nanotube design described in (9) and used forthese experiments. a) Two similar but distinct tiles (RE, green and SE, blue) are each formedfrom 5 strands (sequences described in methods). b) Sticky end complementarity allows thetiles to form a rectangular lattice structure. c) Once formed, a lattice can roll up to form ananotube. d) Nanotubes are nanoscale in diameter but microscale in length, long enough to beeasily observed by fluorescence microscopy.
6
2. Materials and Methods
I. DNA Strands and Tile Design
All oligonucleotide strands were
purchased from IDT with HPLC
purification, dissolved in water at a
concentration of 10 μM as determined by
O.D. 260 using IDT extinction coefficients,
and stored at -20 ºC. Strand sequences are
given in Appendix A1. All constructs
employed the REp-SEp tile cores,
conserving strands 1,3, and 5. The sticky
end strands, 2 and 4, were modified for
various constructs by selectively removing
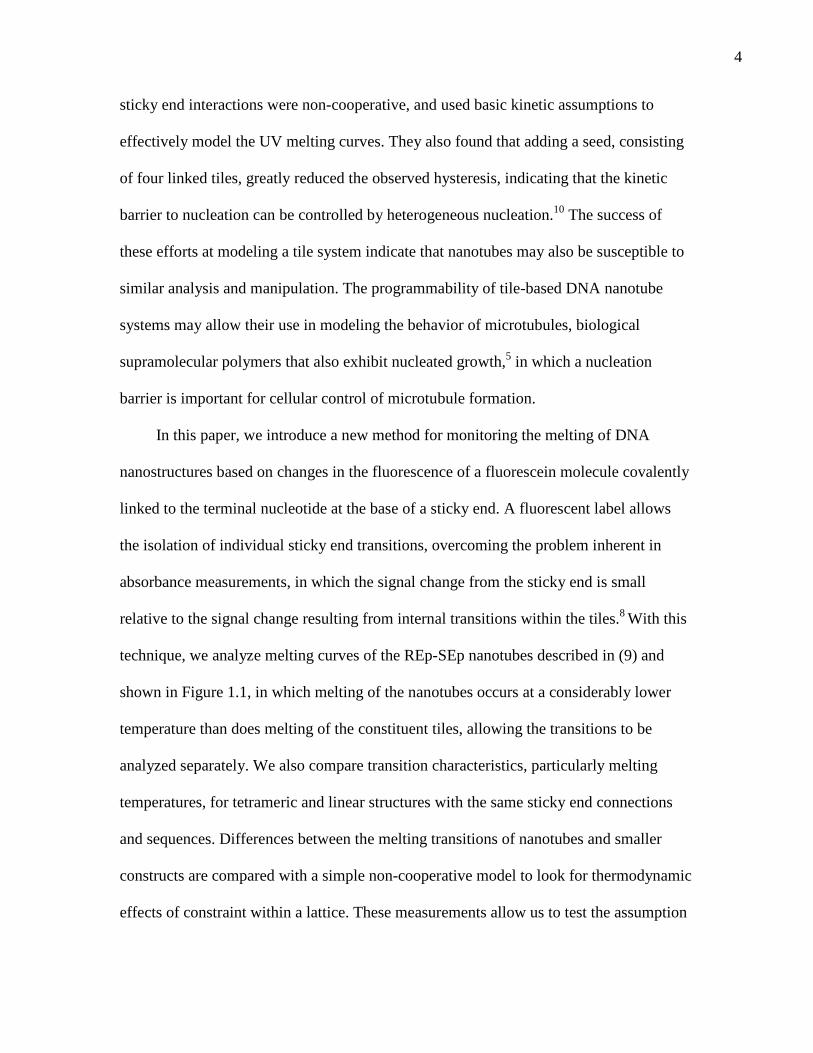
the 5-base sticky end regions. Figure 2.1 illustrates tetramer and ladder constructs formed
in this way.
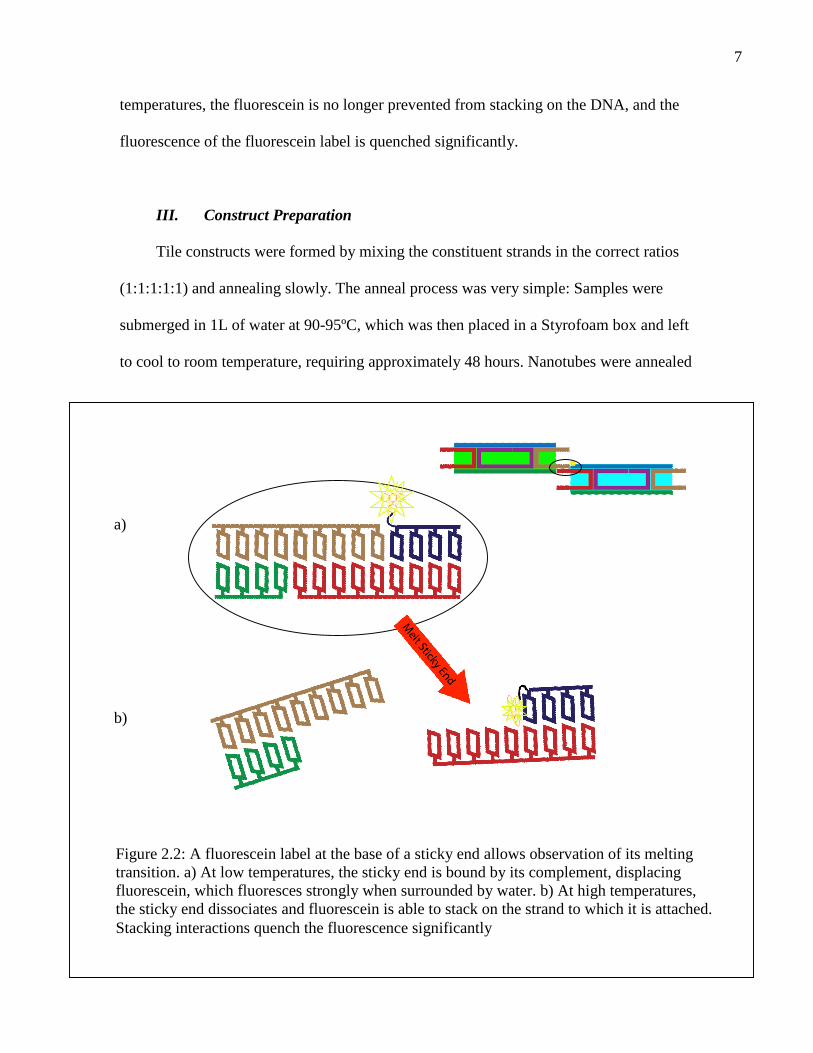
II. Fluorescence-Based Monitoring Technique
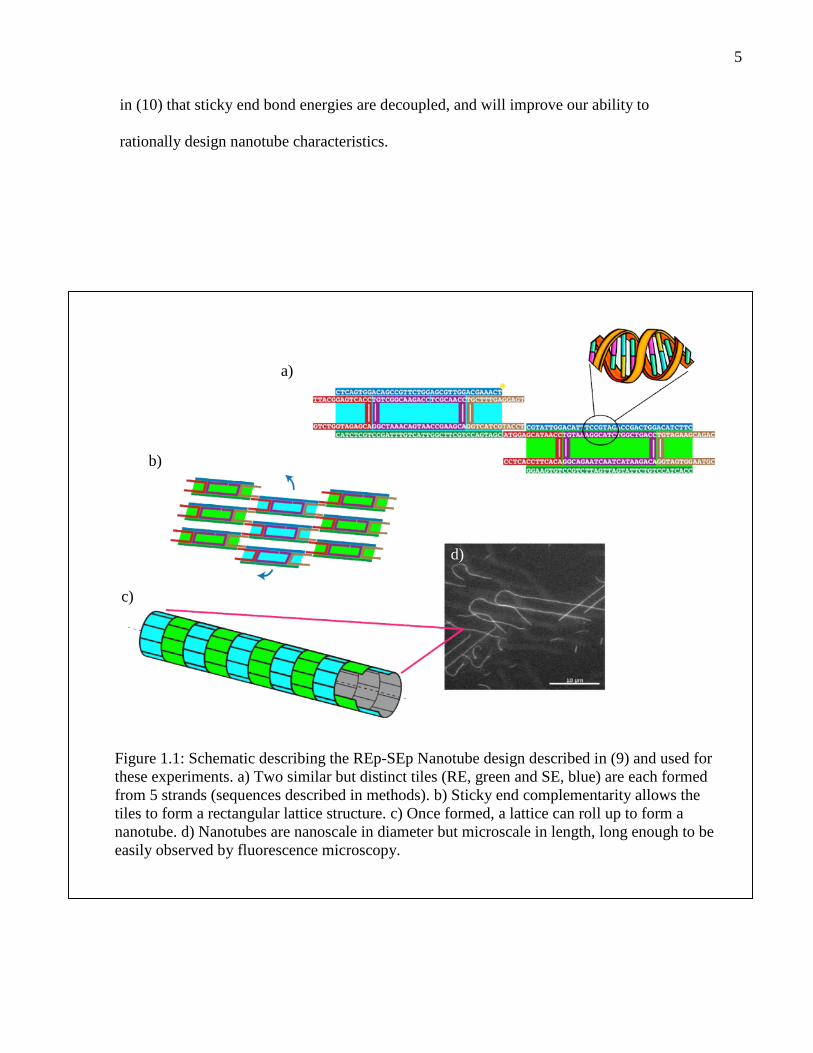
Sticky end melting was monitored by a novel technique in which a fluorescein
moiety was covalently linked to the 5’ or 3’ end of one of the edge strands of SE tiles
(Figure 2.2). At low temperatures, sticky ends are bound together, sterically excluding the
fluorescein from stacking on the end of the DNA helix and forcing it into an aqueous
environment, where it fluoresces brightly. When the sticky ends melt at higher
Anneal A
Anneal B
b) Ladder
a) Tetramer
Figure 2.1: Two tile constructs used for theexperiments described below. a) A tetrameris made from four tiles with two sticky endseach. The two shaded regions are annealedseparately and combined. b) A ladder is ableto polymerize in a single direction. Laddersare similarly made from two anneals.
7
temperatures, the fluorescein is no longer prevented from stacking on the DNA, and the
fluorescence of the fluorescein label is quenched significantly.
III. Construct Preparation
Tile constructs were formed by mixing the constituent strands in the correct ratios
(1:1:1:1:1) and annealing slowly. The anneal process was very simple: Samples were
submerged in 1L of water at 90-95ºC, which was then placed in a Styrofoam box and left
to cool to room temperature, requiring approximately 48 hours. Nanotubes were annealed
Figure 2.2: A fluorescein label at the base of a sticky end allows observation of its meltingtransition. a) At low temperatures, the sticky end is bound by its complement, displacingfluorescein, which fluoresces strongly when surrounded by water. b) At high temperatures,the sticky end dissociates and fluorescein is able to stack on the strand to which it is attached.Stacking interactions quench the fluorescence significantly
a)
b)
8
in 44 μL of TAE-Mg 1X buffer (12.5 mM Mg2+, 40 mM Tris, 19 mM acetic acid, and 1
mM EDTA) with individual strands at a concentration of .9 μM each (4μL of 10μM
stock). Smaller anneal volumes led to samples that exhibited fluorescence fluctuations
during melting, possibly resulting from stoichiometry errors caused by small scale
pipetting (2μL per strand). To prepare a tetramer or ladder construct, two separate
samples were annealed and then combined at room temperature because the designs
require identical tile cores with different sticky end combinations.
IV. Analysis Protocols
Fluorescence microscopy: For nanotube visualization using fluorescence
microscopy, 1 μL of sample was placed on a clean glass slide and covered with a cover
slip, which was sealed to the slide with epoxy. Samples were observed with epi-
fluorescence using a 100x/1.4NA oil-immersion objective on an inverted microscope
(Olympus IX-70), a cooled CCD camera (Hamamatsu, Orca 2e), and a filter set
optimized for fluorescein dye (Omega Optical, XF100).
Optical measurements: Both absorbance and fluorescence measurements were
performed with a 100 μL quartz cuvette (Starna sub-micro) in a fiber optic temperature-
controlled holder (Quantum Northwest QPod). Spectra were measured with a multi-
purpose spectrometer (Ocean Optics QE 65000). For fluorescence measurements, the
sample was excited with light from a high powered Xenon arc lamp (Ocean Optics HPX-
2000) passed through a scanning monochromator (MonoScan 2000) set to 495 nm. 6-
second integrations averaging fluorescence intensity from 512-518 nm were recorded
continuously. For absorbance measurements, the source was a Deuterium lamp (Ocean
9
Optics D-2000) passed through a quartz neutral density filter (O.D. 2.0). Three 2-second
integrations recorded the average absorbance from 250-260 nm and were averaged to
form a data point every 6 seconds.
Melting protocol: For fluorescence measurements of nanotubes, 22 μL of annealed
solution was diluted to 160 μL with TAE-Mg 1X buffer. 5 μL was set aside for
microscopy and the rest was immediately transferred to the cuvette. A micro stir bar (VP
Scientific VP 774-2) was coated with Teflon tape and placed in the cuvette, providing a
nucleation site for dissolved gas and homogenizing the solution. 250 μL of mineral oil
was then added to prevent sample evaporation during the melt. The wrapped stir bar was
too large to enter the sample channel, so it remained at the oil-sample interface.
For fluorescence measurements of dimers, tetramers, and ladders, 11 μL of each
annealed solution were combined and diluted to 160 μL with TAE-Mg 1X buffer. 5 μL
was set aside for microscopy and the rest was immediately transferred to the cuvette. A
roughened Teflon disc was placed in the cuvette, touching the sample, to provide a
nucleation site for dissolved gas. 250 μL of mineral oil was then added to prevent sample
evaporation during the melt.
For absorbance measurements, 44 μL of annealed solution was diluted to 160 μL
with TAE-Mg 1X buffer. 5 μL was set aside for microscopy and the rest was immediately
transferred to the cuvette. For absorbance melts under mineral oil, a Teflon block was
added at the top of the solution to provide a nucleation site for dissolved gas, and the
sample was covered with 250 μL of mineral oil to prevent evaporation. For stirred
absorbance melts, the same stir bar used for fluorescence measurements was placed in the
10
cuvette before a Teflon plug was pressed firmly to the cuvette wall. Figure 3.1b provides
a detailed description of this process.
Temperature Ramps: A single temperature profile was used for all nanotube
melting curves. Temperature was initially held constant at 20ºC for one hour, then
increased linearly to 50ºC at a rate of .14 ºC/min. The ramp rate was then increased to .25
ºC/min and the temperature ramped linearly to 80ºC. The decreasing ramp followed the
same profile (.25 ºC/min to 50ºC and .14 ºC/min to 20ºC). The slower ramp rate at lower
temperatures aimed to provide highly accurate data for the cooperative nanotube melting
transition at ~38ºC. For dimers, tetramers, and ladders, a variety of similar melting
profiles were used in which the temperature was initially held constant at a low
temperature (below 15ºC) for one hour, followed by a melting ramp to 30 ºC, a re-
annealing ramp, and a re-melting ramp to 80ºC. The rate was .14 ºC /min for
temperatures below 50ºC and .25 ºC/min for temperatures above 50ºC. In some cases, the
re-annealing and re-melting ramps were skipped.
Cleaning Procedure: After a melt, the cuvette was cleaned with water, acetone,
and ethanol. The cuvette was then washed with chloroform and left standing for 15
minutes. Finally, the cuvette was filled with ethanol and heated to 65ºC for 30 minutes.
The hot ethanol was rinsed from the cuvette with acetone, ethanol, and finally water.
Tm Measurement: Melting transition regions were fit with a smooth function using
KaleidaGraph and numerically differentiated. The derivative curve was smoothed by
fitting to a weighted function, and the temperature corresponding to the minimum value
of the smoothed derivative was reported as the Tm of the sample.
11
Nearest Neighbor Computations: Sticky end hybridization characteristics were
computed using the program Mfold.15 Input parameters in addition to the sequence were:
Strand concentration = .062 μM, [Na+] = 40 mM, [Mg++] = 12 mM. Settings were:
[Model: Partition Function], [Temperature range: -35 ºC to 35 ºC], [Advanced Options:
Energy Only], [Exclude Species: A,B,AA,BB], [Enthalpy/Entropy for Single Strands:
Disabled].
12
3. Results
I. Technical Results
a) Evaporation Control
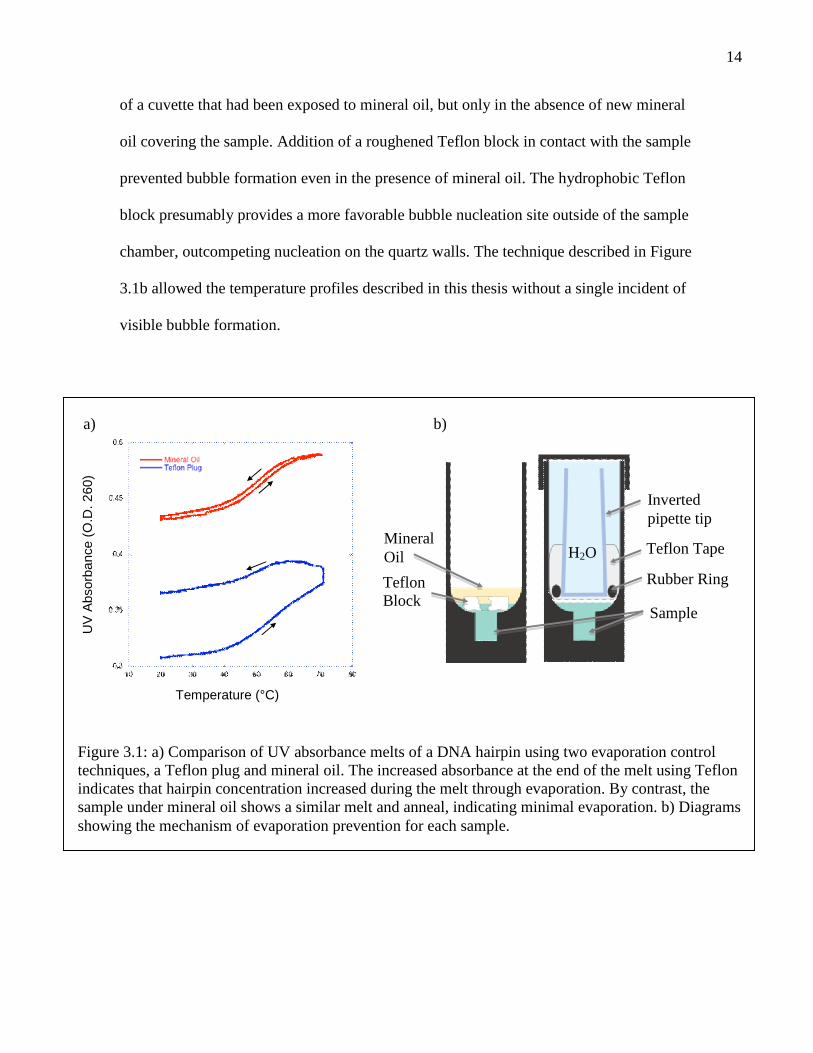
Controlling evaporation within the tolerance of these experiments (a few microliters
or less during an overnight ramp to 80C) proved challenging. A variety of evaporation
prevention schemes were attempted. Capping the sample with a Teflon plug covered by
a water reservoir did not prevent evaporation, as determined by monitoring UV
Absorbance (Figure 3.1). In this scheme, evaporation, indicated by a persistent increase
in O.D. 260, may result from water diffusing through the Teflon tape composing the plug
and condensing at the interfaces between layers of Teflon. This conjecture is supported
by an observed increase of 11.6 mg in the mass of a Teflon plug after a temperature ramp
in a similar environment. These experiments indicate that evaporation can occur even
when the sample is completely surrounded by water, probably as a result of temperature
gradients within the cuvette. Therefore, for most experiments a layer of mineral oil was
used to prevent evaporation. The Teflon cap technique was, however, effective at
temperatures below 50°C and was used for samples that required stirring during UV
absorbance measurements, which were sensitive to the presence of entrained oil.
Silicone oil was demonstrated to effectively prevent evaporation. Three cuvettes
were filled with water, capped with silicone oil, and incubated at 72°C for 18 hours.
Evaporation was monitored by measuring the position of the meniscus, and no change
was found to a sensitivity of ~4 μL (2 confidence level). However, cuvettes exposed to
silicone oil formed bubbles from dissolved gas at temperatures as low as 45°C. By
13
comparison, an identical cuvette that was never exposed to silicone oil did not nucleate
bubbles at temperatures as high as 80°C. Bubble formation persisted in silicone-
contaminated cuvettes even after the silicone oil was removed, suggesting that the
silicone oil formed a hydrophobic coating on the walls that resisted cleaning. A range of
solvents, including chloroform, tetrahydrofuran, hexane, dodecane, ethanol, acetone,
proprietary cuvette cleaning solution (Starna) and silicone oil monomers were all
ineffective at removing the hydrophobic coating. Attempts at degassing (magnetic
stirring, 30 min at < 300 Torr) before covering the sample with silicone oil were
unsuccessful at eliminating bubble formation.
Mineral oil, like silicone oil, was effective at preventing sample evaporation (Figure
3.1). In the melt shown in the figure, the UV absorbance after the temperature ramp was
only 0.6% higher than the absorbance before the ramp. Because absorbance is
proportional to the hairpin concentration, this indicates that the sample volume changed
by ≤ 0.9 μL. The inequality reflects the possibility that other technical effects caused the
increased UV absorbance. An absorbance measurement of a nanotube sample (Figure
3.4) placed a similar upper limit on the total evaporation during a nanotube melt despite
the nanotube melt’s longer duration. Although mineral oil prevented sample evaporation,
cuvettes exposed to mineral oil were susceptible to bubble nucleation, as in the case of
silicone oil. For example, one sample nucleated bubbles during a slow (.5°C/min) ramp
to 70°C. This problem persisted despite cleaning efforts using a variety of solvents
(water, acetone, chloroform and ethanol). However, an effective cleaning protocol was
discovered in which a cuvette is rinsed with chloroform for 15 minutes, then heated with
ethanol to 65°C for 30 minutes. This protocol eliminated bubble nucleation on the walls
14
of a cuvette that had been exposed to mineral oil, but only in the absence of new mineral
oil covering the sample. Addition of a roughened Teflon block in contact with the sample
prevented bubble formation even in the presence of mineral oil. The hydrophobic Teflon
block presumably provides a more favorable bubble nucleation site outside of the sample
chamber, outcompeting nucleation on the quartz walls. The technique described in Figure
3.1b allowed the temperature profiles described in this thesis without a single incident of
visible bubble formation.
MineralOil
Teflon Tape
Rubber Ring
Sample
Invertedpipette tip
Figure 3.1: a) Comparison of UV absorbance melts of a DNA hairpin using two evaporation controltechniques, a Teflon plug and mineral oil. The increased absorbance at the end of the melt using Teflonindicates that hairpin concentration increased during the melt through evaporation. By contrast, thesample under mineral oil shows a similar melt and anneal, indicating minimal evaporation. b) Diagramsshowing the mechanism of evaporation prevention for each sample.
TeflonBlock
Temperature (°C)
UV
Absorb
ance
(O.D
.2
60)
a) b)
H2O

15
b) Fluorescence Fluctuations
Large and apparently random fluctuations in fluorescence intensity were initially
observed during nanotube melts (Figure 3.2). Stirring samples during melting
measurements dramatically reduced the time scale of the fluctuations, from 240 s to 30 s.
This decrease in time scale upon stirring indicates that the fluctuations are related to
sample inhomogeneities. Fluctuations were observed only in nanotube solutions and only
at temperatures for which nanotubes were present, indicating a relationship between the
fluctuations and nanotubes. Surprisingly, fluorescence microscopy did not reveal a
qualitative difference between nanotubes in samples exhibiting large and small
fluctuations. Increasing the anneal volume from 22 to 44 μL eliminated the fluorescence
fluctuations in nearly all cases. Similar fluctuations were occasionally observed in
samples after re-annealing in the cuvette. Figure 3.2 also shows a unique case in which
large fluctuations were seen in the melting
profile of a sample that had lost considerable
volume, presumably through evaporation. The
relationship between the anneal volume,
evaporation, and appearance of fluctuations
indicates that the concentrations and ratios of
strands help determine whether fluctuations
will be observed. Improper strand
stoichiometry has been shown to cause
nanotube clumping, suggesting that the
fluctuations result from the movement of large
Figure 3.2: Comparison offluorescence oscillations for differentsample conditions.
Temperature (°C)
Flu
ore
scence
(A.U
.)
16
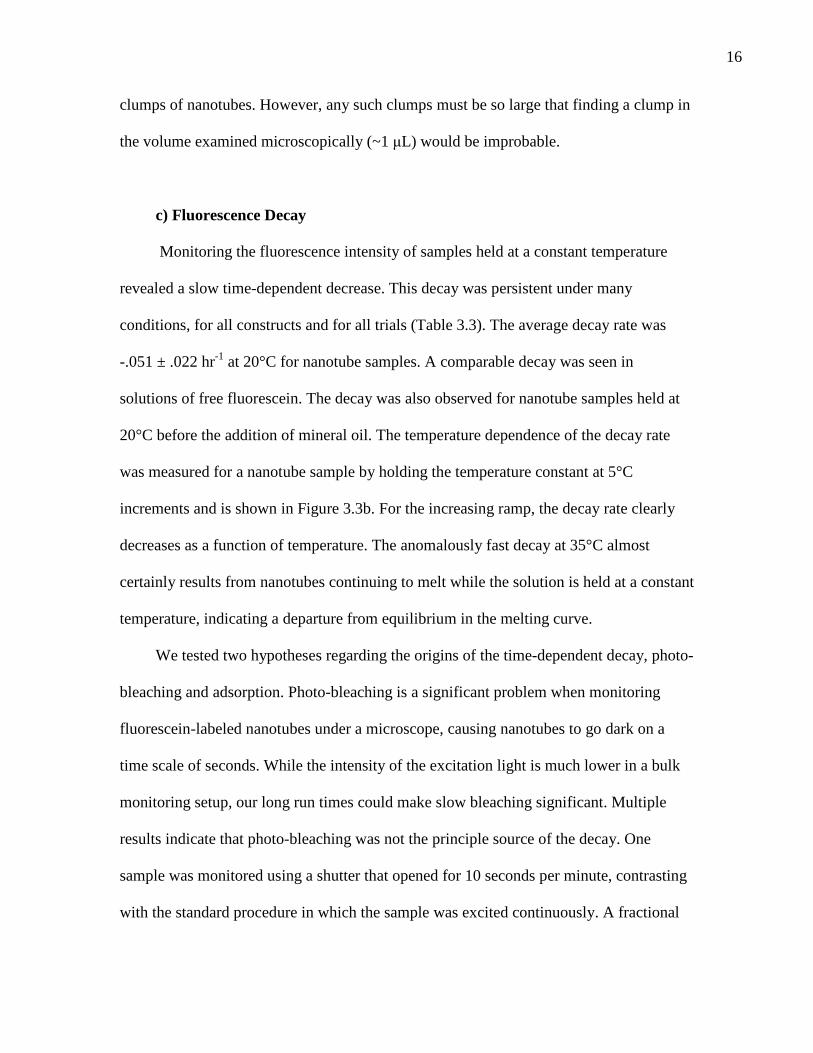
clumps of nanotubes. However, any such clumps must be so large that finding a clump in
the volume examined microscopically (~1 μL) would be improbable.
c) Fluorescence Decay
Monitoring the fluorescence intensity of samples held at a constant temperature
revealed a slow time-dependent decrease. This decay was persistent under many
conditions, for all constructs and for all trials (Table 3.3). The average decay rate was
-.051 ± .022 hr-1 at 20°C for nanotube samples. A comparable decay was seen in
solutions of free fluorescein. The decay was also observed for nanotube samples held at
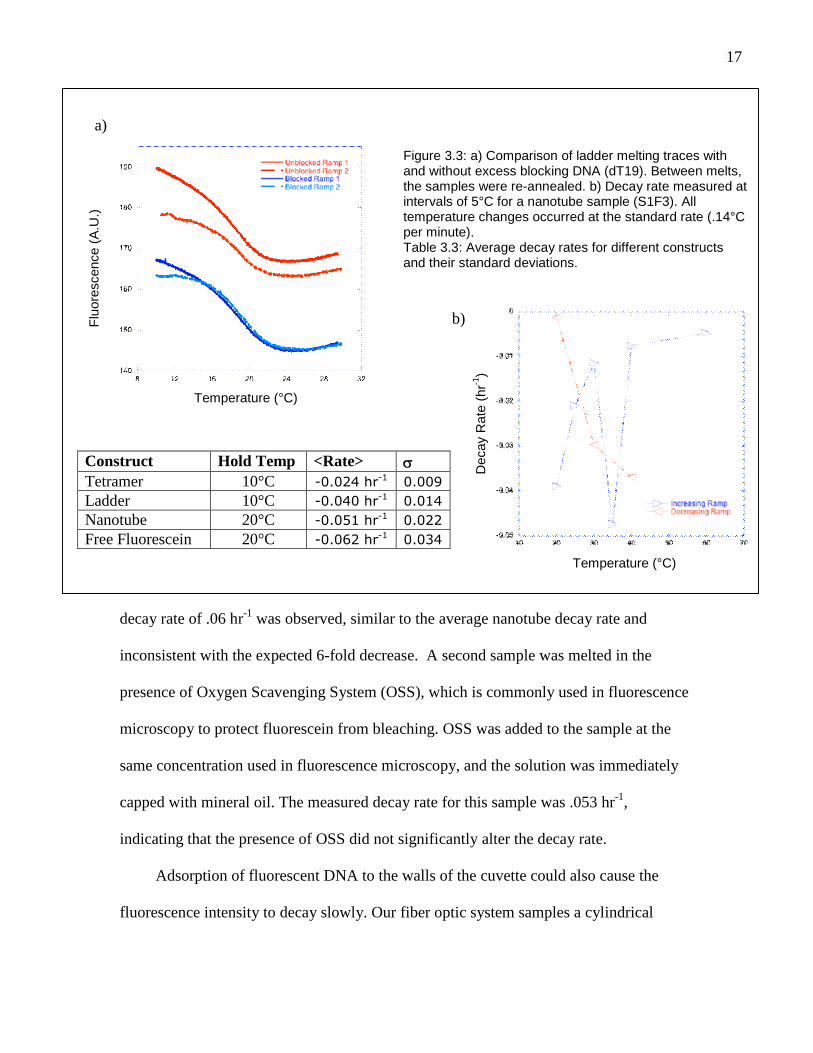
20°C before the addition of mineral oil. The temperature dependence of the decay rate
was measured for a nanotube sample by holding the temperature constant at 5°C
increments and is shown in Figure 3.3b. For the increasing ramp, the decay rate clearly
decreases as a function of temperature. The anomalously fast decay at 35°C almost
certainly results from nanotubes continuing to melt while the solution is held at a constant
temperature, indicating a departure from equilibrium in the melting curve.
We tested two hypotheses regarding the origins of the time-dependent decay, photo-
bleaching and adsorption. Photo-bleaching is a significant problem when monitoring
fluorescein-labeled nanotubes under a microscope, causing nanotubes to go dark on a
time scale of seconds. While the intensity of the excitation light is much lower in a bulk
monitoring setup, our long run times could make slow bleaching significant. Multiple
results indicate that photo-bleaching was not the principle source of the decay. One
sample was monitored using a shutter that opened for 10 seconds per minute, contrasting
with the standard procedure in which the sample was excited continuously. A fractional
17
decay rate of .06 hr-1 was observed, similar to the average nanotube decay rate and
inconsistent with the expected 6-fold decrease. A second sample was melted in the
presence of Oxygen Scavenging System (OSS), which is commonly used in fluorescence
microscopy to protect fluorescein from bleaching. OSS was added to the sample at the
same concentration used in fluorescence microscopy, and the solution was immediately
capped with mineral oil. The measured decay rate for this sample was .053 hr-1,
indicating that the presence of OSS did not significantly alter the decay rate.
Adsorption of fluorescent DNA to the walls of the cuvette could also cause the
fluorescence intensity to decay slowly. Our fiber optic system samples a cylindrical
Temperature (°C)
Flu
ore
scence
(A.U
.)
Figure 3.3: a) Comparison of ladder melting traces withand without excess blocking DNA (dT19). Between melts,the samples were re-annealed. b) Decay rate measured atintervals of 5°C for a nanotube sample (S1F3). Alltemperature changes occurred at the standard rate (.14°Cper minute).Table 3.3: Average decay rates for different constructsand their standard deviations.
Temperature (°C)
Decay
Rate
(hr-1
)U
.)Construct Hold Temp <Rate> Tetramer 10°C -0.024 hr-1 0.009
Ladder 10°C -0.040 hr-1 0.014
Nanotube 20°C -0.051 hr-1 0.022
Free Fluorescein 20°C -0.062 hr-1 0.034
a)
b)
18
section of the cuvette, which includes a larger fraction of the total volume than of the
total surface area (a 4:3 ratio), so material adsorbed to the surface is more likely to be
outside the sampled volume. Adsorption may also affect a given molecule’s fluorescence
intensity if the surface it adsorbs to is poorly illuminated or if surface interactions quench
fluorescein fluorescence.
To test the adsorption hypothesis, a high concentration of single stranded poly
Thymine (dT19) was added to a sample. This excess DNA was intended to out-compete
the fluoresceinated structures for binding to the cuvette surface. Figure 3.3a shows a
comparison of melting curves for two identical samples of a ladder construct, one of
which contains dT19. Although the presence of excess DNA did not significantly alter
the initial decay rate, the first and second melting profiles for the sample with dT 19 are
much more similar. This indicates that adsorption to cuvette walls is the principal, and
possibly only, cause of the observed fluorescence decay. The difference between the two
melting curves for the dT19 sample at low temperatures indicates that adsorption of
fluoresceinated DNA may still occur at temperatures near 10°C, but any such adsorbed
material apparently re-enters the solution at higher temperatures. By contrast, adsorption
in the absence of dT19 appears to be permanent.
d) Transition Identification
Several lines of evidence identify the large transitions occurring near 38.6°C for the
nanotubes and 19°C for the tetramer and ladder constructs with sticky end melting
transitions. First, the transition is absent in control melts of a nanotube with the
fluorescein label located on the 5’ end of the RE 3 strand, a position which is internal to
19
the tile (Figure 3.5). The stacking of fluorescein at this internal position should be
unaffected by sticky end dissociation, and the sticky end melting transition was absent
accordingly. Another control showed that the transition resulted from interactions
between tiles and not within a single tile. For this control, the tetramer was altered so as
to remove one sticky end from one of the unlabeled tiles. The melting profile of this
modified tetramer lacked a clear transition above 4°C (Figure 3.6). Further supporting
evidence comes from fluorescence microscopy of melting nanotubes, which shows that
visible nanotubes exhibit a melting transition near 35°C. 4
e) Comparing Absorbance and Fluorescence
Figure 3.4 presents a comparison between nanotube melting curves measured by
UV absorbance and fluorescein fluorescence. Sticky ends transition from double to single
stranded DNA upon melting, so UV absorbance changes can be used to monitor sticky
end melting. However, absorbance measurements are challenging for several reasons.
First, the absorbance change upon sticky end dissociation is a relatively small fraction of
the total absorbance signal. As a result, increasing sample concentration can only
improve signal strength up to a point because the signal to noise ratio decreases for
samples with a total absorbance significantly higher than 1. Second, our standard setup
did not allow for simultaneous evaporation prevention and sample homogenization while
monitoring absorbance because absorbance measurements are sensitive to stirring in the
presence of mineral oil. In most cases, samples melted without stirring exhibited
fluctuations in the absorbance signal that effectively masked the sticky end transition. As
20
a partial solution we used a stir bar covered with a Teflon plug instead of oil. However,
this setup did not prevent evaporation at temperatures > 45°C.
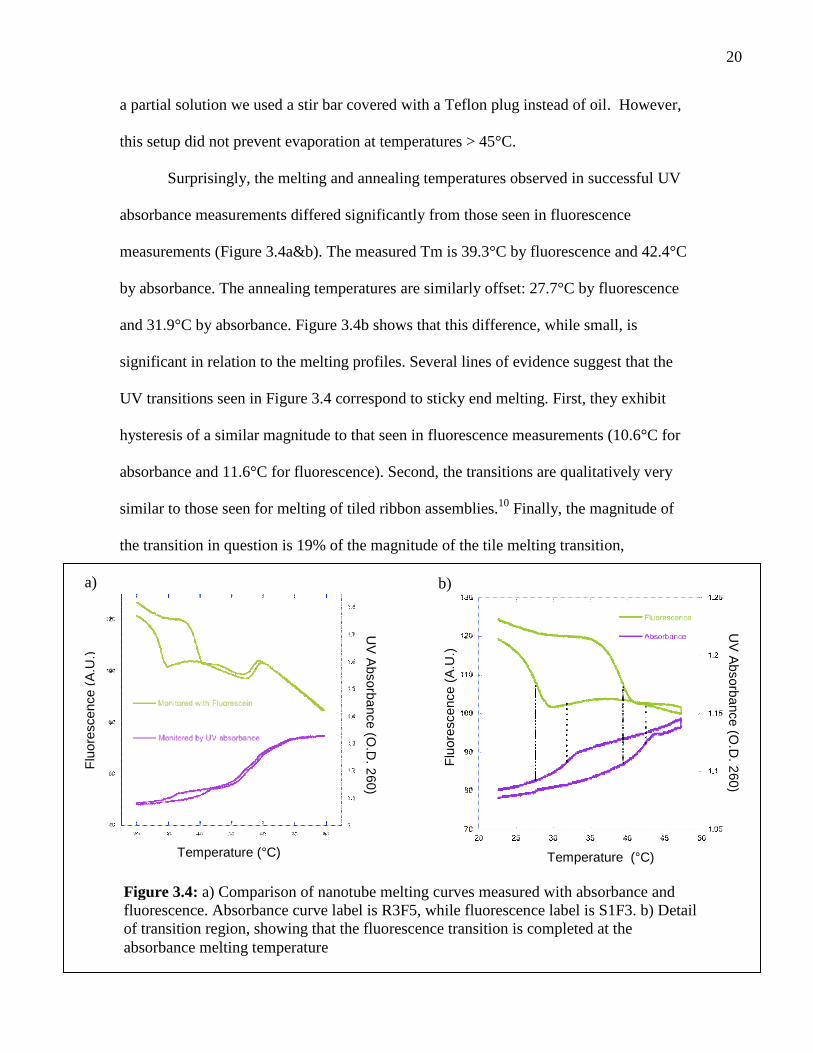
Surprisingly, the melting and annealing temperatures observed in successful UV
absorbance measurements differed significantly from those seen in fluorescence
measurements (Figure 3.4a&b). The measured Tm is 39.3°C by fluorescence and 42.4°C
by absorbance. The annealing temperatures are similarly offset: 27.7°C by fluorescence
and 31.9°C by absorbance. Figure 3.4b shows that this difference, while small, is
significant in relation to the melting profiles. Several lines of evidence suggest that the
UV transitions seen in Figure 3.4 correspond to sticky end melting. First, they exhibit
hysteresis of a similar magnitude to that seen in fluorescence measurements (10.6°C for
absorbance and 11.6°C for fluorescence). Second, the transitions are qualitatively very
similar to those seen for melting of tiled ribbon assemblies.10 Finally, the magnitude of
the transition in question is 19% of the magnitude of the tile melting transition,
Temperature (°C)
UV
Ab
so
rba
nce
(O.D
.2
60
)
Flu
ore
scence
(A.U
.)
Figure 3.4: a) Comparison of nanotube melting curves measured with absorbance andfluorescence. Absorbance curve label is R3F5, while fluorescence label is S1F3. b) Detailof transition region, showing that the fluorescence transition is completed at theabsorbance melting temperature
Temperature (°C)
UV
Ab
so
rba
nce
(O.D
.2
60
)
Flu
ore
scence
(A.U
.)
a) b)
21
comparable to the expected value of 15% (assuming the absorbance change upon melting
is uniform for all bases in a tile). The similarity in these values strongly supports the
identification of these transitions with sticky end melting. The origin of the discrepancy
in Tm as measured by the two techniques is not known, but will hopefully be elucidated
through further investigations.
II. Tile Construct Results
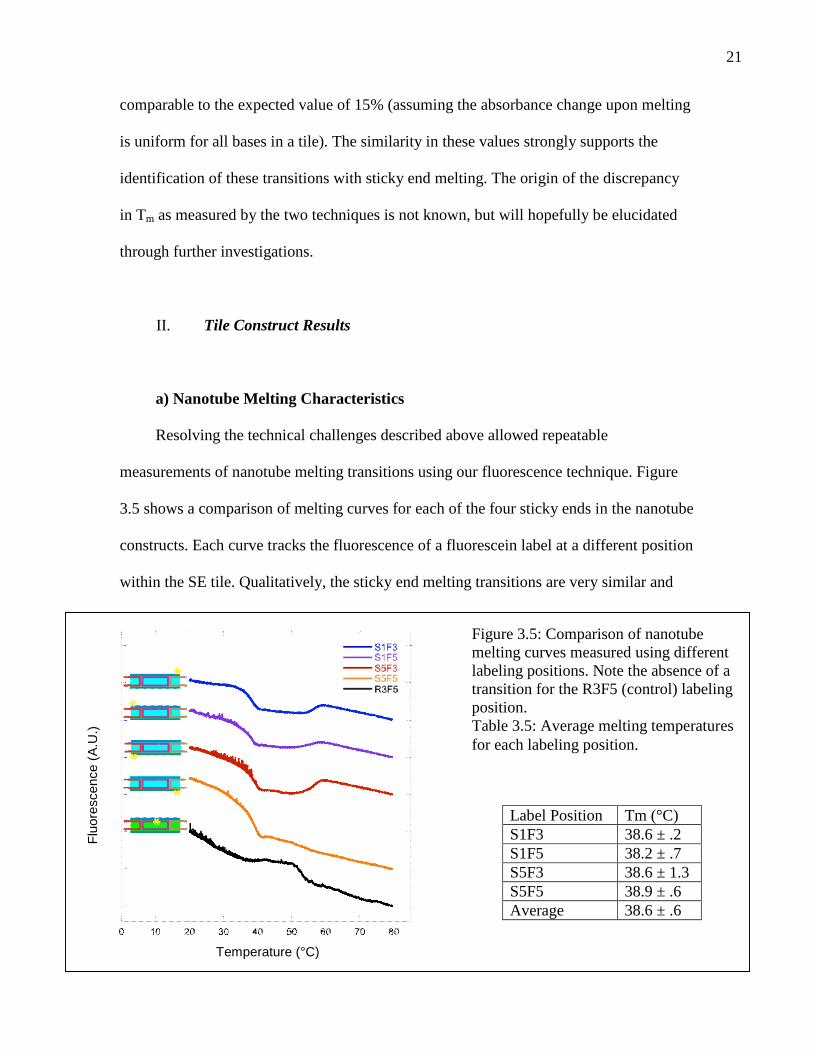
a) Nanotube Melting Characteristics
Resolving the technical challenges described above allowed repeatable
measurements of nanotube melting transitions using our fluorescence technique. Figure
3.5 shows a comparison of melting curves for each of the four sticky ends in the nanotube
constructs. Each curve tracks the fluorescence of a fluorescein label at a different position
within the SE tile. Qualitatively, the sticky end melting transitions are very similar and
Temperature (°C)
Flu
ore
scence
(A.U
.)
Figure 3.5: Comparison of nanotubemelting curves measured using differentlabeling positions. Note the absence of atransition for the R3F5 (control) labelingposition.Table 3.5: Average melting temperaturesfor each labeling position.
Label Position Tm (°C)S1F3 38.6 ± .2S1F5 38.2 ± .7S5F3 38.6 ± 1.3S5F5 38.9 ± .6Average 38.6 ± .6
22
asymmetric, with a sharp turning point just above the melting temperature where the
concentration of polymerized tiles goes rapidly to zero. A sharp transition is seen at
~57°C in three of the four melts. This transition may correspond to dissociation of the
strands comprising an individual tile. Dissociation of the sticky end strands (2 and 4)
would change the DNA structure near the fluorescein label from double stranded to
single stranded. This change could prevent fluorescein from stacking on the end of the
edge strand (1 or 5), forcing it once again into solution. The sticky end strands are held to
the tile by fewer base pairs than the central strand (strand 3), and would be expected to
dissociate first. However, comparison between absorbance and fluorescence
measurements (Figure 3.4a) suggests that the fluorescence transition corresponds to the
second tile melting transition in the absorbance data rather than the first. We conclude
that tile melting may proceed in an unexpected fashion, in which strand 3 dissociates
first, or another effect may cause the fluorescence transition. For example, an internal
transition within the edge strands may displace the fluorescein label. Neither of these
mechanisms provides an explanation for the striking absence of a tile melting transition
in nanotube melts monitoring the S5F5 labeling position.
Quantitatively, the melting temperatures for all label positions differ from the
global average by less than their individual errors, showing that the monitored sticky ends
are equivalent within experimental uncertainty (Table 3.5). The different positions are
therefore considered equivalent henceforth, giving the nanotubes a single well-defined
melting temperature. The equivalence of sticky ends within a nanotube indicates that
nanotube sticky ends are cooperative because the sticky ends each have different
sequences and would otherwise melt at different temperatures.
23
The re-annealing profile of nanotube melts varied considerably between samples. In
some cases, the fluorescence signal became extremely noisy, with large fluctuations on
time scales of 1.5 minutes. Nanotubes from a melt exhibiting these fluctuations were
observed by fluorescence microscopy, and no obvious difference (e.g., no massive
clumping) was observed between the original and re-annealed samples. In most re-
anneals, fluorescence intensity increased weakly at temperatures below 25ºC, without a
defined transition. In two cases (both S1F3), a clear transition was observed with an
annealing temperature of 25.5ºC. While this transition may be particularly sensitive to the
stoichiometry of strands in the sample, pipetting errors alone cannot be the culprit
because two samples from the same original anneal were analyzed and only one showed a
distinct re-anneal. In this case, the sample that showed a distinct re-annealing transition
had a stepwise ramping protocol that paused during the decreasing ramp at 40°C and
30°C, possibly contributing to the re-annealing process. A re-annealing transition was
also clearly visible in a S1F3 melt at double the standard concentration (Ta = 27.7) and in
an absorbance melt (Ta = 31.9), at the same concentration. These re-annealing transitions
are shown in Figure 3.4b.
b) Dimers, Tetramers and Ladders
Melting curves were measured for dimers, tetramers, and ladders in order to
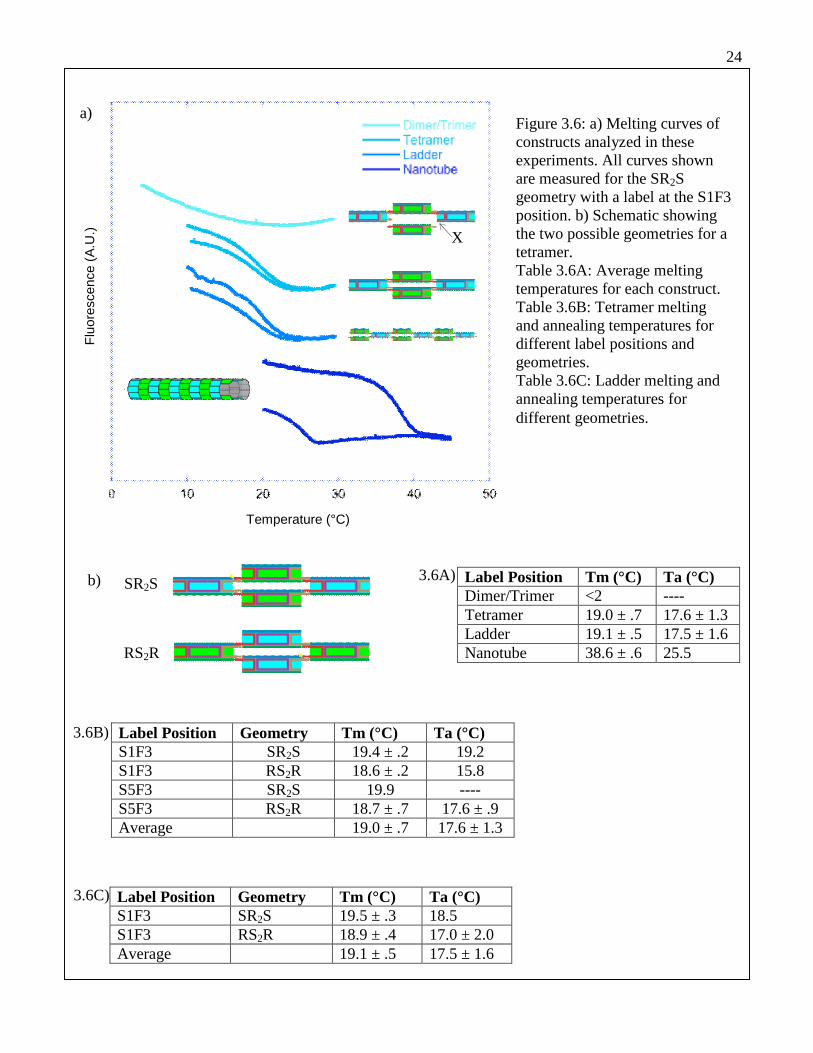
compare the characteristics of nanotubes with those of smaller assemblies (Figure 3.6a).
Table 3.6A presents their corresponding melting temperatures. These constructs are
formed from the RE and SE tile cores using modified sticky end strands to limit tile
association in predictable ways. Melting and annealing profiles were compared for two
24
Figure 3.6: a) Melting curves ofconstructs analyzed in theseexperiments. All curves shownare measured for the SR2Sgeometry with a label at the S1F3position. b) Schematic showingthe two possible geometries for atetramer.Table 3.6A: Average meltingtemperatures for each construct.Table 3.6B: Tetramer meltingand annealing temperatures fordifferent label positions andgeometries.Table 3.6C: Ladder melting andannealing temperatures fordifferent geometries.
Label Position Tm (°C) Ta (°C)Dimer/Trimer <2 ----Tetramer 19.0 ± .7 17.6 ± 1.3Ladder 19.1 ± .5 17.5 ± 1.6Nanotube 38.6 ± .6 25.5
Label Position Geometry Tm (°C) Ta (°C)S1F3 SR2S 19.4 ± .2 19.2S1F3 RS2R 18.6 ± .2 15.8S5F3 SR2S 19.9 ----S5F3 RS2R 18.7 ± .7 17.6 ± .9Average 19.0 ± .7 17.6 ± 1.3
Label Position Geometry Tm (°C) Ta (°C)S1F3 SR2S 19.5 ± .3 18.5S1F3 RS2R 18.9 ± .4 17.0 ± 2.0Average 19.1 ± .5 17.5 ± 1.6
SR2S
RS2R
X
Temperature (°C)
Flu
ore
scence
(A.U
.)
a)
b) 3.6A)
3.6B)
3.6C)
25
different labeling positions, as well as for the two possible tetramer geometries (Figure
3.6b). Labeling position and geometry affect the melting temperature of tetramers and
ladders by at most 1.3°C (Tables 3.6B and 3.6C), and possibly by much less.
In a tetramer or ladder, each tile core (RE or SE) forms two different tiles with
different sticky end configurations. This is possible for tiles that are annealed separately
and combined because the sticky ends remain kinetically trapped in the correct
combinations. At temperatures near the tile melting temperature (≥55°C as established
by UV absorbance measurements), the sticky end combinations become scrambled. Re-
annealing of constructs can therefore be observed only when the temperature remains
well below the melting temperature of tiles. We found that keeping the temperature of a
sample below 30°C, invariably ensured that the tetramer and ladder constructs would
show an obvious re-annealing transition.
Annealing temperatures for tetramers and ladders were always lower than melting
temperatures, and were much more variable. The annealing temperature for a ladder
sample increased by 2.8°C when adsorption to the cuvette walls was prevented using
non-specific DNA. This suggests that adsorption may be responsible for most of the
difference between melting and annealing profiles. In some cases, the annealing and
melting temperatures differed by only 0.4°C, showing that hysteresis is minimal under
optimal conditions.
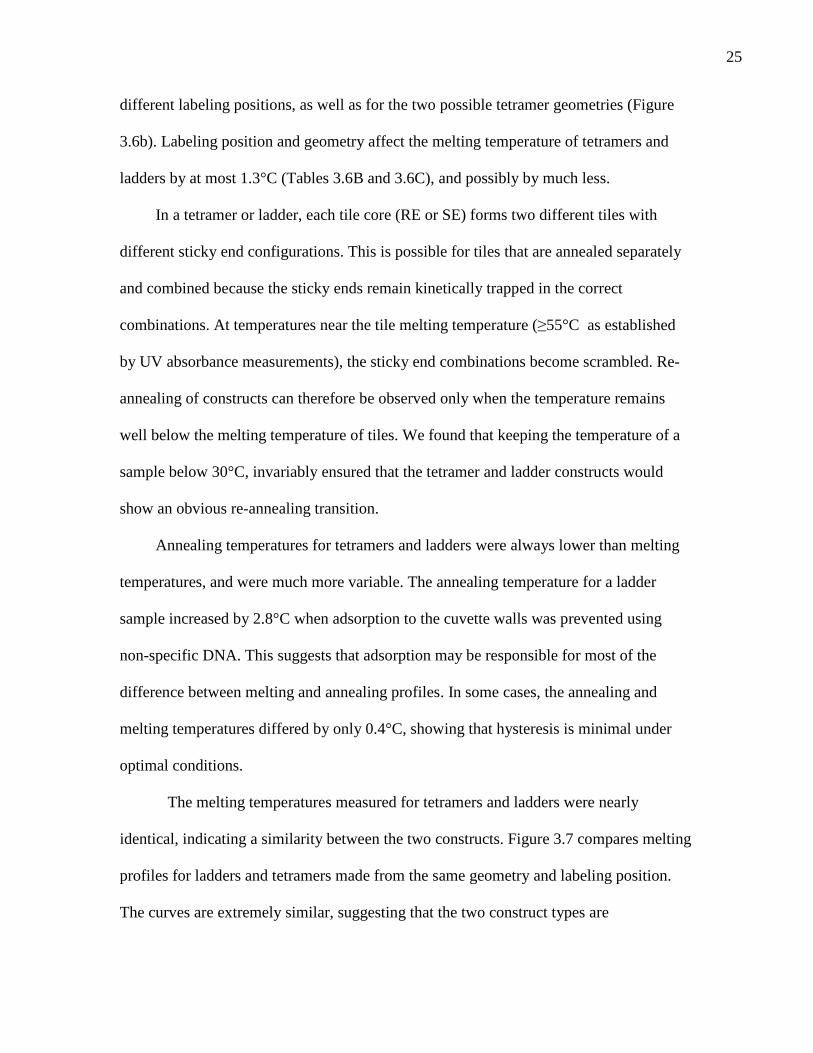
The melting temperatures measured for tetramers and ladders were nearly
identical, indicating a similarity between the two constructs. Figure 3.7 compares melting
profiles for ladders and tetramers made from the same geometry and labeling position.
The curves are extremely similar, suggesting that the two construct types are
26
thermodynamically equivalent. The near
identical appearance of the transitions
also indicates a high degree of
polymerization in the ladders. Otherwise,
the ladders would be expected to show a
smaller transition because the fluorescein
label on end tiles is already capable of
stacking (no complimentary sticky end is
bound). Alternatively, end tiles may be
eliminated by cyclization of the ladder
constructs.
The melting profiles for dimers and trimers contrasted sharply with those for
tetramers and ladders. Two samples, one of a dimer and the other of a tetramer with a
missing sticky end, able to form both dimers and trimers, were melted starting from 2°C
and 4°C, respectively. Derivative curve analysis showed that the slope continued
increasing at the lowest temperatures measured in each case. While the increasing slope
suggests a low temperature transition, the lack of a minimum in the derivative indicates
that the melting temperature is below the measured temperature range.
c) Van’t Hoff Analysis of Tetramers
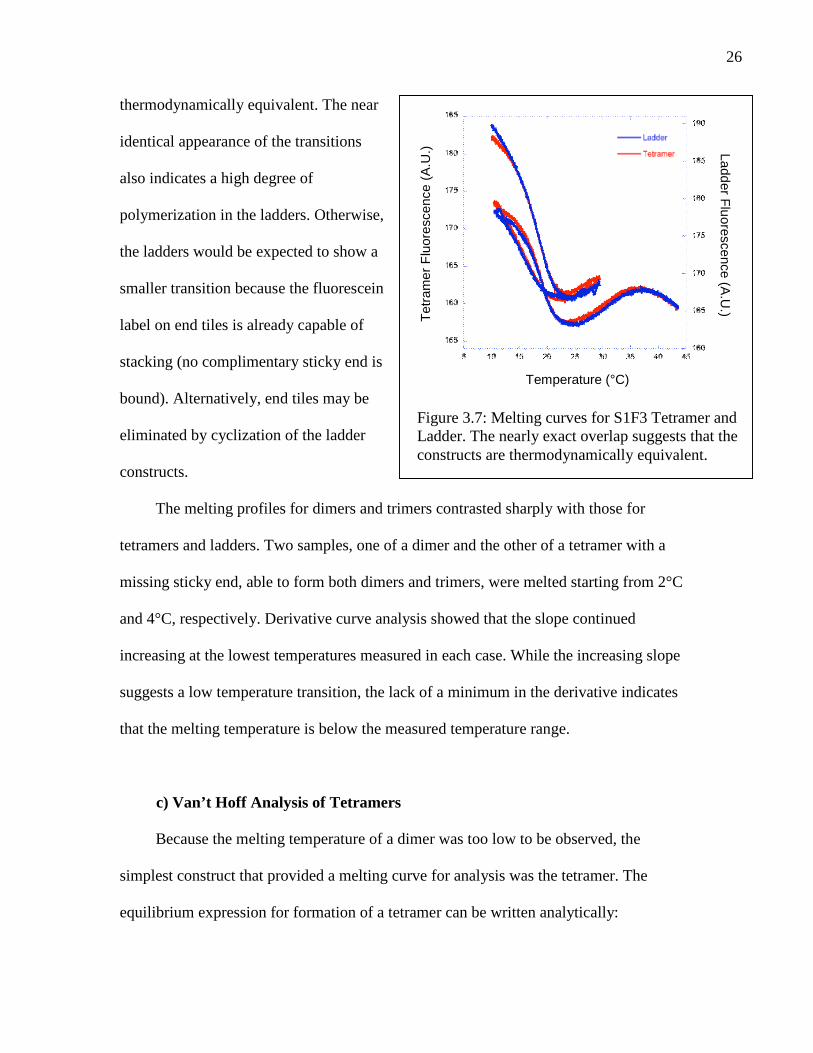
Because the melting temperature of a dimer was too low to be observed, the
simplest construct that provided a melting curve for analysis was the tetramer. The
equilibrium expression for formation of a tetramer can be written analytically:
La
dd
er
Flu
ore
sce
nce
(A.U
.)
Tetr
am
er
Flu
ore
scence
(A.U
.)Figure 3.7: Melting curves for S1F3 Tetramer andLadder. The nearly exact overlap suggests that theconstructs are thermodynamically equivalent.
Temperature (°C)
27
ta tb tc td Keq []
[t]4
where the concentration of all tiles is the same and given by [t]. The equilibrium
constant can be related to the observable , the fraction of tiles that are incorporated in a
tetramer:
C
][ , C = total concentration of tiles
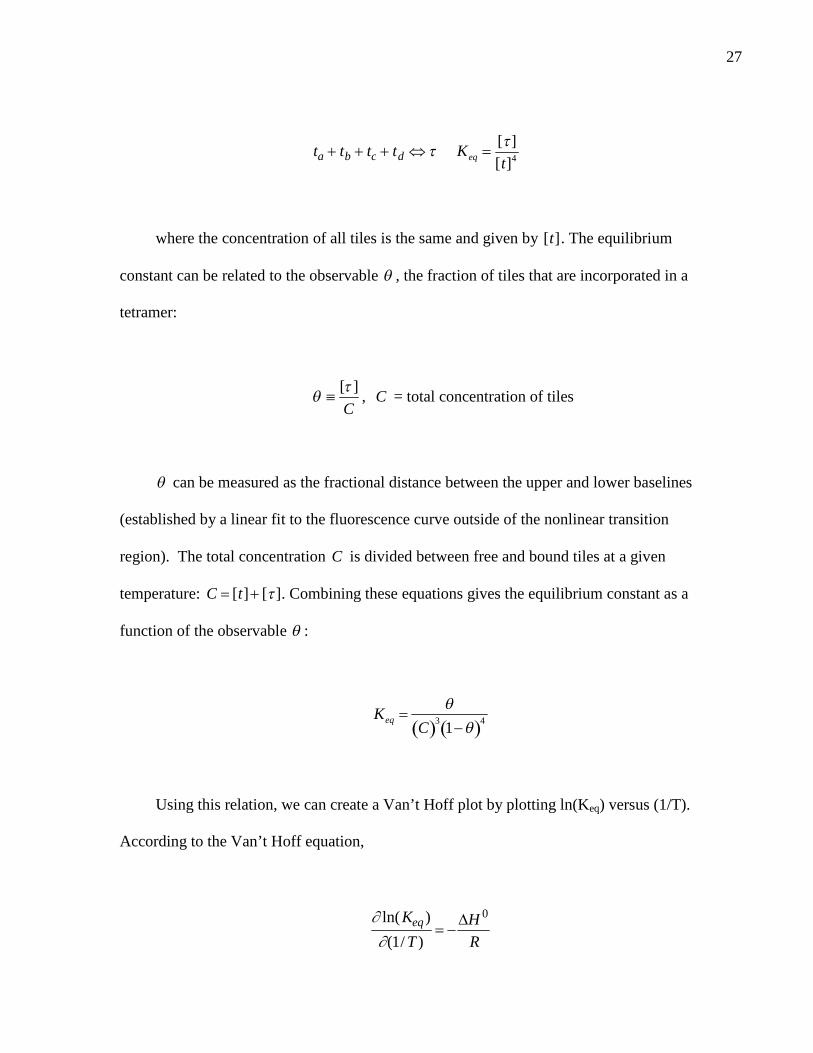
can be measured as the fractional distance between the upper and lower baselines
(established by a linear fit to the fluorescence curve outside of the nonlinear transition
region). The total concentration C is divided between free and bound tiles at a given
temperature: C [t] [ ]. Combining these equations gives the equilibrium constant as a
function of the observable :
Keq
C 3
1 4
Using this relation, we can create a Van’t Hoff plot by plotting ln(Keq) versus (1/T).
According to the Van’t Hoff equation,
ln(Keq )
(1/ T )
H 0
R
28
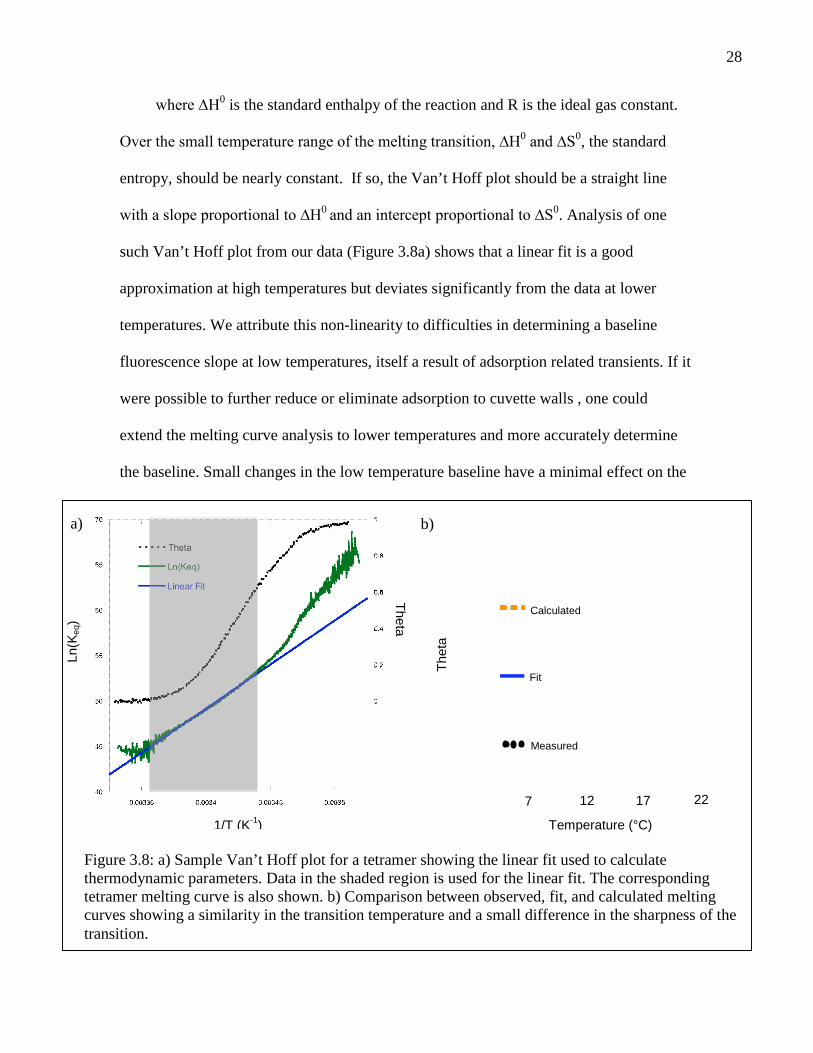
where ∆H0 is the standard enthalpy of the reaction and R is the ideal gas constant.
Over the small temperature range of the melting transition, ∆H0 and ∆S0, the standard
entropy, should be nearly constant. If so, the Van’t Hoff plot should be a straight line
with a slope proportional to ∆H0 and an intercept proportional to ∆S0. Analysis of one
such Van’t Hoff plot from our data (Figure 3.8a) shows that a linear fit is a good
approximation at high temperatures but deviates significantly from the data at lower
temperatures. We attribute this non-linearity to difficulties in determining a baseline
fluorescence slope at low temperatures, itself a result of adsorption related transients. If it
were possible to further reduce or eliminate adsorption to cuvette walls , one could
extend the melting curve analysis to lower temperatures and more accurately determine
the baseline. Small changes in the low temperature baseline have a minimal effect on the
Figure 3.8: a) Sample Van’t Hoff plot for a tetramer showing the linear fit used to calculatethermodynamic parameters. Data in the shaded region is used for the linear fit. The correspondingtetramer melting curve is also shown. b) Comparison between observed, fit, and calculated meltingcurves showing a similarity in the transition temperature and a small difference in the sharpness of thetransition.
Temperature (°C)
Theta
7 12 17 22 27
Calculated
Fit
b)
1/T (K-1
)
Ln(K
eq)
Th
eta
a)
Measured
29
plot at higher temperatures. We therefore restricted our analysis to temperatures above
17.5°C. At these temperatures all the Van’t Hoff plots we analyzed were well fit by a
line. For our analysis, we averaged the slope and intercept parameters from a set of eight
melting curves (some from multiple melts of a single sample) which included data for
both label positions and both geometries. The average thermodynamic parameters for a
tetramer are: ΔHº = -794 +- 86 (kJ/mol) and ΔSº = -2.31 +- .28 (kJ/mol*K).
d) Nearest Neighbor Thermodynamic Calculations
Because it was not possible to observe the melting of a single sticky end, the
program Mfold15 was used to calculate the expected ∆H0 and ∆S0 for the tetramer.
Thermodynamic parameters were calculated for each sticky end and summed to predict
the tetramer parameters. In an attempt to mimic the sticky end environment, in which the
end nucleotides are able to stack with nucleotides on the adjacent tiles, the two
nucleotides adjacent to each side of the sticky end were added to the sticky end sequence.
Watson-Crick interactions between the additional bases were eliminated by altering one
of the bases in each additional base pair. Stacking interactions were preserved as well as
possible by substituting purines for purines and pyrimidines for pyrimidines. Sequences
that formed alternative structures even when excluded by the program were not used.
Summing the calculated sticky end parameters gave predicted tetramer parameter values
of: ΔHº = -679 (kJ/mol) and ΔSº = -1.90 (kJ/mol*K), similar to those measured by Van’t
Hoff analysis. Figure 3.8b presents a superposition of the measured melting curve for a
tetramer, the curve generated using the best fit Van’t Hoff parameters, and another curve
generated using the computed parameters. The computed melting temperature is

30
strikingly similar to the observed melting temperature, while the calculated curve is
similar to the fit curve but slightly less steep. The similarity between the calculated and
observed transitions indicates that ΔHº and ΔSº for a sticky end within a tetramer are
similar to ΔHº and ΔSº for the isolated sticky end, a hypothesis that will be explored in
more detail in the discussion.
31
4. Discussion
I. Cooperativity
The sticky ends holding a tile assembly together are identical regardless of the
number of assembled tiles. The stability of a tile assembly is nevertheless a function of
its size. This size dependence can be considered in terms of cooperativity, or coupling
between sticky end binding energies. Figure 4.1 depicts the three possible cooperativity
scenarios for our assembly pathway. For positive cooperativity, each bound tile increases
the free energy released by binding the next tile. This type of cooperativity, typified by
the binding of oxygen to hemoglobin, often occurs when binding of one monomer
triggers a conformational change that allows subsequent monomers to bind more
favorably. In the case of negative cooperativity, the incremental free energy change
associated with adding each new tile decreases. This type of cooperativity could arise if,
for example, there were significant electrostatic repulsion between laterally associated
tiles (due to the negatively charged phosphate backbone of DNA), and the repulsion
increased as more tiles were added, causing each subsequent addition to become less
favorable. In an intermediate scenario, that of zero cooperativity, the free energy for
association of a sticky end is constant irrespective of assembly size. In general, the
cooperativity can be different for each step in an assembly process. For example, non-
local effects on melting temperature that result from vibrational modes within an entire
ladder or nanotube could cause the cooperativity of tile association to vary in a
complicated manner.
32
We limit our discussion to the simplest scenario, in which the physical
characteristics of a sticky end, described by the standard enthalpy and entropy, are
constant. This scenario will be referred to as the non-cooperative sticky end model. One
motivation for investigating a model based on non-cooperative sticky ends is provided by
the remarkable similarity between tetramer and ladder melts, shown in Figure 3.7.
Because ladders exist in a complicated equilibrium that includes many chain lengths, it is
not possible to model ladder melting with a single equilibrium expression. However, it
makes sense to compare the process of adding three tiles to extend the end of a ladder to
the process of adding three tiles to a single tile to form a tetramer. The fact that the
melting curves for the two constructs are identical indicates that the free energy change
for these two processes is equal. In the case of the ladder, the number of bound sticky
ends on one of the tiles increases from two to four, rather than from zero to two as in the
case of the tetramer. The standard free energy change for adding a tile therefore appears
to be independent of the number of sticky ends that are already bound, at least in the case
of ladders.
Theoretically, ladder melting curves could differ from tetramer melting curves
because of vibrational modes within the longer chain or because of an increased
electrostatic repulsion within the longer chain. Because no such differences are observed,
we conclude that vibrational mode effects and electrostatic repulsion do not significantly
affect ladder stability. The lack of significant electrostatic repulsion is unsurprising
because the high Mg++ concentration used should effectively neutralize the negative
phosphate backbone.
33
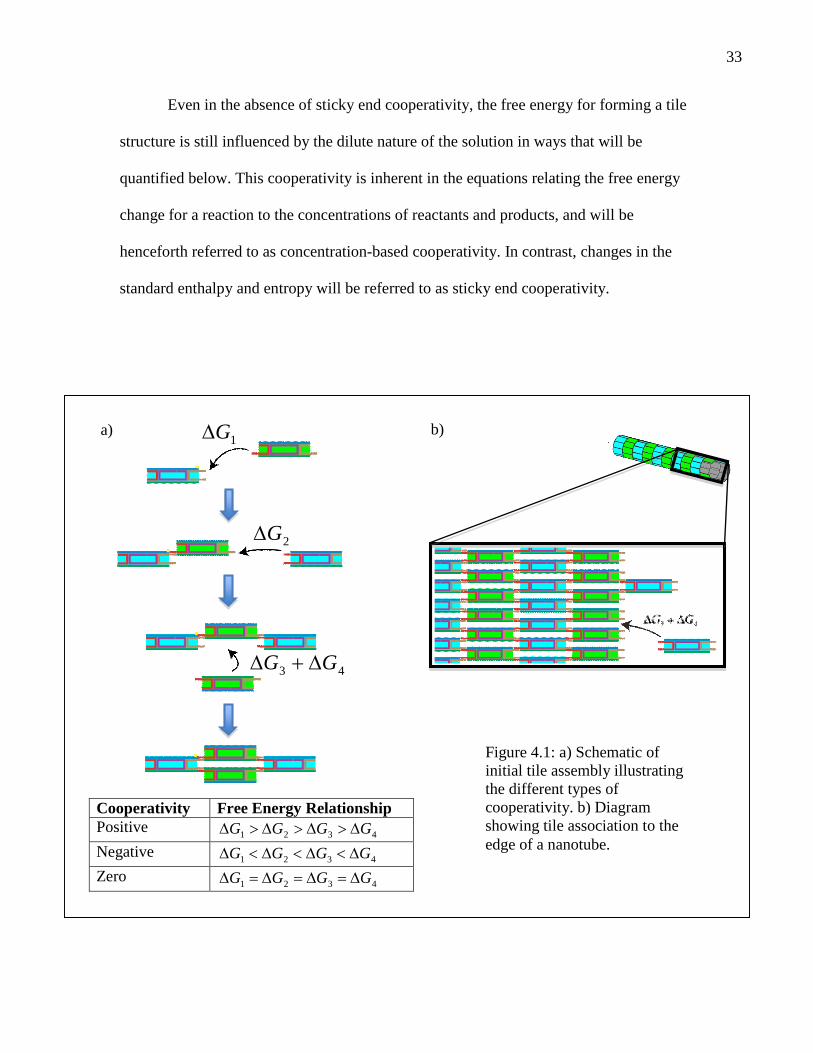
Even in the absence of sticky end cooperativity, the free energy for forming a tile
structure is still influenced by the dilute nature of the solution in ways that will be
quantified below. This cooperativity is inherent in the equations relating the free energy
change for a reaction to the concentrations of reactants and products, and will be
henceforth referred to as concentration-based cooperativity. In contrast, changes in the
standard enthalpy and entropy will be referred to as sticky end cooperativity.
1G
2G
43 GG
Cooperativity Free Energy RelationshipPositive
4321 GGGG
Negative4321 GGGG
Zero4321 GGGG
Figure 4.1: a) Schematic ofinitial tile assembly illustratingthe different types ofcooperativity. b) Diagramshowing tile association to theedge of a nanotube.
a) b)
34
II. Predicting Tm for Dimers and Nanotubes
A model in which sticky ends are non-cooperative predicts simple relationships
between the thermodynamic behaviors of tile assemblies of different sizes. If we assume
that the sticky ends are approximately equivalent energetically, then the standard
enthalpy and entropy for dissociation of a single sticky end are given by dividing the fit
parameters for a tetramer by four. That is, we assume the standard free energy for
association of N tiles forming n sticky ends is:
)( 000 STHnG (1)
The free energy at arbitrary concentrations of reactants and products can be written
as:
)ln(0 QRTGG (2)
where Q depends on the reaction equilibrium. For a general association of N tiles,
the reaction equation is:
NN Mtttt ...321 (3)
and at equilibrium:
N
NN
t
MQ
][
][ (4)
where the tiles }{ it may be either identical or distinguishable as long as they all
have equal concentrations ][][ tti . For these calculations, we evaluate the free energy at
the halfway point of dissociation:
CtM N 21][][ (5)
where C is the tile concentration when all complexes have melted. At the halfway
point, Q reduces to:
35
)1(
2
NC
Q (6)
When Q is chosen in this way, the free energy is zero at the melting temperature of
a construct NM . The free energy defined in this way provides an indication of the
stability of an assembly.
The preceding analysis imposes several implicit assumptions. First, the complex
being analyzed, NM , is assumed to be the dominant complex, meaning that, at Tm only
the complex being analyzed and the individual tiles are present at significant
concentrations. In reality, there may be other constructs present. If so, melting
temperature predictions may fail, but the analysis of the free energy of a given construct,
which is calculated for a hypothetical scenario in which the reactants and products are at
equal concentrations at a temperature where the equilibrium would favor one or the other,
still applies.
The simplest application of the above equations is predicting the melting
temperature for a dimer based on the average tetramer parameters. Combining (1), (2),
and (6),
0)ln(1)()( 00 CNRTSTHnTG mmm (7)
The predicted melting temperature of a dimer is 4.2±1.5 °C, where the error is
calculated using the error margins for the best fit tetramer parameters. This is just above
the lower limits set by experiments, which suggest a melting temperature below 2°C for
the dimer. This difference could result from destabilization of the observed sticky end by
the fluorescein label, from nonlinearity in the standard enthalpy and entropy, from
36
monitoring a particularly weak sticky end, or from sticky end cooperativity that would
stabilize the tetramer to a greater extent than is accounted for in this analysis.
Nanotubes can be analyzed using these principles and a simplifying approximation.
While nanotube melting is a complicated phenomenon, modeling the nanotubes as solid
objects and looking at the dissociation of a single tile gives a rough estimate of the
temperature at which nanotubes become unstable. In this approximation, dissociation of a
tile does not change the nanotube concentration, giving
1
2)(
][
1
][][
][
CTQ
tNanotubest
NanotubesQ m (8)
Figure 4.1 shows that two sticky ends are broken upon dissociation of a single tile
from a nanotube edge, so 2n . Inserting (8) into (7) gives a predicted Tm of 35±2°C,
similar to the observed Tm of 38.6°C. The difference between the observed and predicted
melting temperatures may result from the rough nature of our approximation, from the
temperature dependence of the standard enthalpy and entropy, or from a kinetic barrier to
nanotube dissociation that prevents nanotube melting from being an equilibrium process.
The data shown in Figure 3.3b indicates that nanotube melts do not reach equilibrium
because the fluorescence decay was anomalously rapid when the temperature was held
constant at 35°C, indicating that the nanotubes in this sample continued to dissociate at a
constant temperature. Based on our data, simple concentration effects account for 81% of
the difference between nanotube and tetramer melting temperatures.
III. Hysteresis and Cooperativity
The non-cooperative sticky end model also explains the pronounced hysteresis
present in nanotube melting curves. The presence of hysteresis implies the existence of a
37
kinetic barrier to tube formation at the nanotube formation temperature (25.5ºC) and
above, implying that the initial stages of nanotube formation are unfavorable. Hysteresis
is a common feature of cooperative supramolecular polymerization when the dynamics of
association are slow.2 For nanotubes, tile association to a growing complex is unfavorable
for small complexes and favorable for large complexes. The complex for which tile
association becomes favorable is known as the critical nucleus. Because the critical
nucleus is the most unstable species, its formation is the rate-limiting step in the
formation of long polymers such as nanotubes.
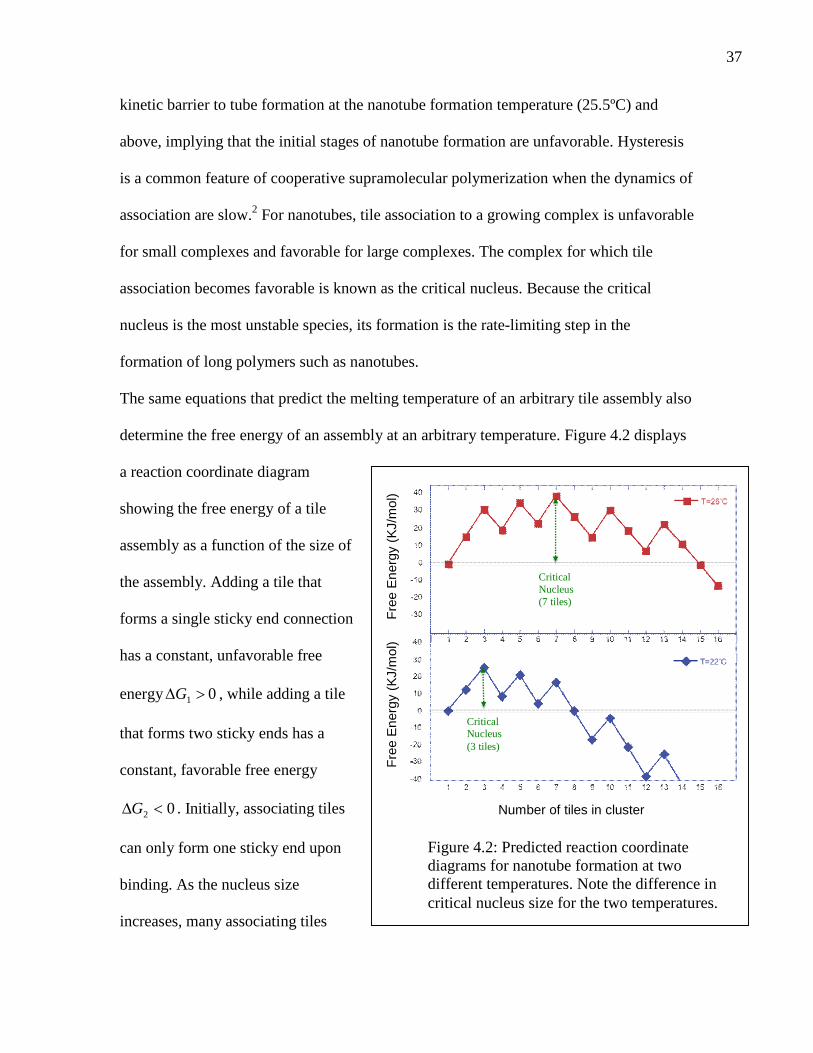
The same equations that predict the melting temperature of an arbitrary tile assembly also
determine the free energy of an assembly at an arbitrary temperature. Figure 4.2 displays
a reaction coordinate diagram
showing the free energy of a tile
assembly as a function of the size of
the assembly. Adding a tile that
forms a single sticky end connection
has a constant, unfavorable free
energy 01 G , while adding a tile
that forms two sticky ends has a
constant, favorable free energy
02 G . Initially, associating tiles
can only form one sticky end upon
binding. As the nucleus size
increases, many associating tiles
Figure 4.2: Predicted reaction coordinatediagrams for nanotube formation at twodifferent temperatures. Note the difference incritical nucleus size for the two temperatures.
Number of tiles in cluster
Fre
eE
nerg
y(K
J/m
ol)
Fre
eE
nerg
y(K
J/m
ol)
CriticalNucleus(7 tiles)
CriticalNucleus(3 tiles)
38
form two sticky end bonds. In most cases, several tile arrangements could lead to
maximal sticky end formation. The reaction coordinate diagram changes qualitatively at a
temperature at which . At this temperature, calculated to be 24ºC, the
predicted critical nucleus size changes abruptly from 7 to 3. Notably, the nanotubes are
observed to anneal at a similar temperature of 25.5ºC. Because formation of a critical
nucleus from seven tiles would be kinetically suppressed, the nanotube formation
temperature, at which the rate of nanotube formation becomes significant, might reflect
the predicted decrease in the size of the critical nucleus, resulting in a much more easily
formed nucleus.
In our analysis, and are assumed to be constant. A more accurate tetramer
melting curve could be used to measure the heat capacity change for a sticky end, which
determines the temperature dependence of the standard enthalpy and entropy. An
improved melting curve would result from improvements in adsorption prevention at
temperatures below 10ºC. Alternatively, lengthening all sticky ends by one base pair
would bring the tetramer transition to a higher temperature region, simplifying baseline
determination. Lengthening the sticky ends would also allow a melting temperature to be
measured for the dimer, allowing precise comparison with predictions.
IV. Directions for Further Research
Melting a set of tiles designed to form flat sheets or ribbons would provide a more
stringent test of the non-cooperative sticky end model. Since all effects in our simple
model are local, nanotubes would have the same melting temperature as large sheets in
which the vast majority of tiles form two sticky end bonds upon association. Although
021 GG
0H 0S
39
large tile sheets should be thermodynamically equivalent to nanotubes, fewer end tiles are
exposed in the latter geometry. The low concentration of edge tiles may result in a kinetic
barrier to nanotube dissociation that is not present for sheets
Nanotube nucleation could be investigated by seeding a solution with rigid artificial
critical nuclei, similar to the seeds used to initiate ribbon formation in (10). If the scheme
we propose is correct, adding a three-tile seed should hardly affect the temperature at
which nanotubes form. On the other hand, adding a seven tile seed should greatly reduce
or eliminate the observed hysteresis.
5. Conclusion
These results suggest both promise and caution for future attempts to elucidate the
principles of cooperative supramolecular polymerization for biological systems. Because
the behavior of tile-based DNA nanotubes appears to result from the simplest possible
thermodynamics, modeling them computationally, as was done for ribbons,10 should be
both feasible and accurate. Using this type of extended analysis, key features such as the
melting temperature and magnitude of hysteresis may also prove programmable.
Extrapolating results obtained for DNA nanotubes to biological systems requires caution
because there are important differences between nanotubes and biological polymers.
First, most supramolecular biopolymerization is entropically driven. The polymers
therefore dissociate at low temperatures, in contrast to DNA nanotubes, which melt at
high temperatures. Second, the origins of cooperativity may be quite different from the
origins of cooperative behavior in analogous biological systems, which often result from
physical changes in the nature of inter-molecular interactions2 rather than the simple
concentration-based effects that are so important for DNA nanotubes.
40
List of Figures
Chapter 1: Introduction
1.1 REp-SEp nanotube design…………………………………… 5
Chapter 2: Methods and Materials
2.1 Tetramer and Ladder Design………………………………….6
2.2 Fluorescein based melting curves…..…………………………7
Chapter 3: Results
3.1 Evaporation Prevention……………………………………….13
3.2 Fluorescence Noise………………………..…………………. 14
3.3 Fluorescence Decay………………………………………….. 16
3.4 Absorbance and Fluorescence Comparison…………………...19
3.5 Nanotube Melting Curves…………………...………………..20
3.6 Construct Melting Curves………………………...…………..23
3.7 Tetramer-Ladder Equivalence……………………………….. 25
3.8 Van’t Hoff Analysis………………………..…………………27
Chapter 4: Discussion
4.1 Cooperativity and Nanotube Formation Pathway……….……32
4.1 Nucleation and Hysteresis…………………………………….36
41
References
1. Aldaye, F.; Lo, Kwan.; Karam, P.; McLaughlin, C.; Cosa, G., Modular construction of DNAnanotubes of tunable geometry and single- or double stranded character. Nature Nanotechnology,4. 2009.
2. De Greef, T.; Maarten, M.; Smulders, M.; Wolffs, M.; Schenning. A.; Sijbesma, R.; Meijer,E.,Supramolecular Polymers. Chem. Rev. 109, 5687–5754. 2009.
3. Douglas, S.;Chou, J.; Shih, W.; DNA-nanotube-induced alignment of membraneproteins for NMR structure determination. PNAS, 104 (16), 6647. 2007.
4. Ekani-Nkodo, A.; Kumar, A.; Fygenson, D. K.; Joining and Scission in the Self-Assembly ofNanotubes from DNA Tiles. PRL 93, 268301. 2004.
5. Fygenson, D. K.; Flyvbjerg, H.; Sneppen, A.; Libchaber, A.; Leibler, S., SpontaneousNucleation of Microtubules. Phys. Review E, 51(5), 5058-5063. 1995.
6. Li, H.; Carter, J.; LaBean, T., Nanofabrication by DNA self-assembly. Materials Today, 12 (5),24-32. 2009.
7. Liu, H.; Chen, Y.; He, Y.; Ribbe, A.; Mao, C., Approaching The Limit: Can One DNAOligonucleotide Assemble into Large Nanostructures? Angew. Chem. Int. Ed., 45, 1942–1945.2006.
8. Nangreave, J.; Yan, H.; Liu, Y., Studies of Thermal Stability of Multivalent DNAHybridization in a Nanostructured System. Biophysical Journal, 97, 563-571. 2009.
9. Rothemund, P.; Ekani-Nkodo, A.; Papadakis, N.; Kumar, A.; Fygenson, D. K.; Winfree,E.,Design and Characterization of Programmable DNA Nanotubes. J. Am. Chem. Soc, 126, 16344.2004.
10. Schulman, R.; Winfree, E., Synthesis of crystals with a programmable kinetic barrier tonucleation. PNAS, 104(39), 15236-15241. 2007.
11. Sobey, T.; Renner, S.; Simmell, F., Assembly and melting of DNA nanotubes from single-sequence tiles. J. Phys.: Condens. Matter, 21, 034122. 2009.
12. Yan, H.; Park, S.; Finkelstein, G.; Reiv, J.; LaBean, T., DNA-Templated Self-Assembly ofProtein Arrays and Highly Conductive Nanowires Science, 301, 1882. 2003.
13. Yin, P.; Hariadi, F.; Sahu, S.; Choi, H.; Park, S.; LaBean, T.; Reif, J., Programming DNATube Circumferences. Science 321, 824. 2008.
14. Yonggang,K.; Liu, Y.; Zhang, J.; Yan, H., A Study of DNA Tube Formation MechanismsUsing 4-, 8-, and 12-Helix DNA Nanostructures. J. Am. Chem. Soc, 128 (13). 2006.
15. Zuker, M.,Mfold web server for nucleic acid folding and hybridization prediction. NucleicAcids Res, 31 (13), 3406-15. 2003.
42
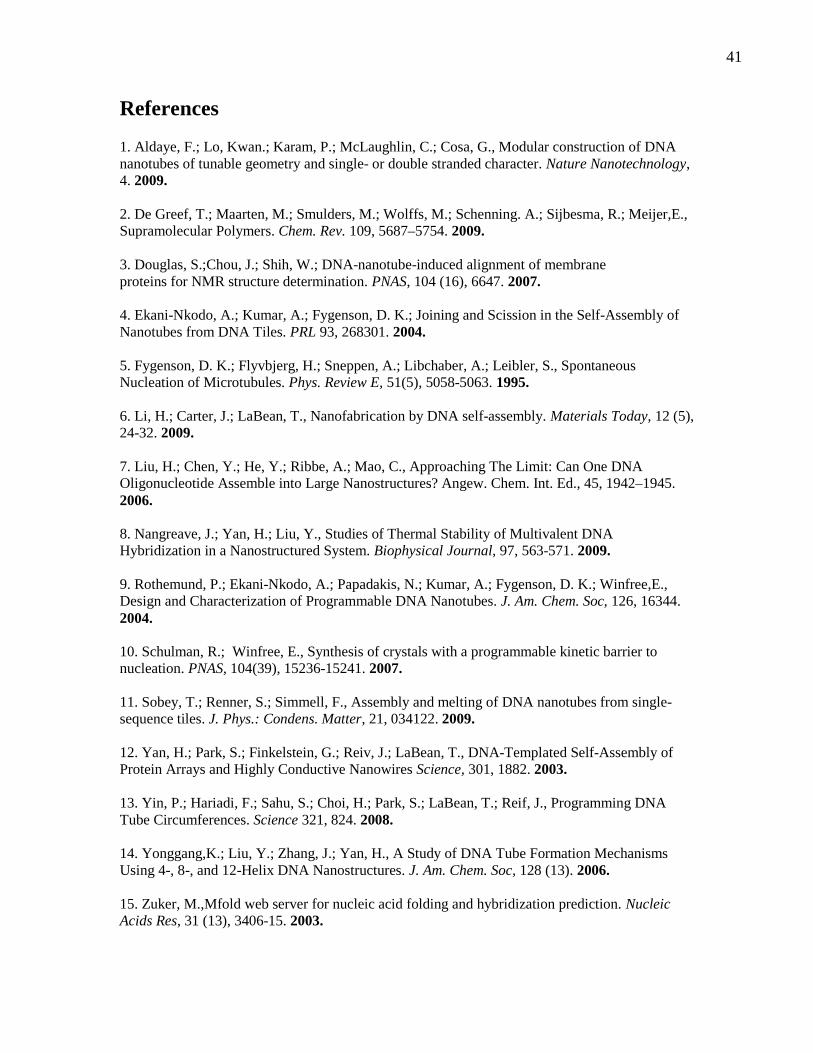
Appendix A1: Tile Strand Sequences
Basic strands for REp tile:RE1: CGTATTGGACATTTCCGTAGACCGACTGGACATCTTCRE2: CCTCACCTTCACACCAATACGAGGTARE3: TCTACGGAAATGTGGCAGAATCAATCATAAGACACCAGTCGGRE4: CAGACGAAGATGTGGTAGTGGAATGCRE5: CCACTACCTGTCTTATGATTGATTCTGCCTGTGAAGG
Basic strands for SEp tile:SE1: CTCAGTGGACAGCCGTTCTGGAGCGTTGGACGAAACTSE2: GTCTGGTAGAGCACCACTGAGGCATTSE3: CCAGAACGGCTGTGGCTAAACAGTAACCGAAGCACCAACGCTSE4: TGAGGAGTTTCGTGGTCATCGTACCTSE5: CGATGACCTGCTTCGGTTACTGTTTAGCCTGCTCTAC
Modified strands for Tetramers and Ladders*:
RE2pHSTK5: CCTCACCTTCACACCAATACGRE2pHSTK3: CCTTCACACCAATACGAGGTARE2pNSTK: CCTTCACACCAATACG
SE2pHSTK5: GTCTGGTAGAGCACCACTGAGSE2pHSTK3: GTAGAGCACCACTGAGGCATTSE2pNSTK: GTAGAGCACCACTGAG
RE4pHSTK5: CAGACGAAGATGTGGTAGTGGRE4pHSTK3: GAAGATGTGGTAGTGGAATGCRE4pNSTK: GAAGATGTGGTAGTGG
SE4pHSTK5: TGAGGAGTTTCGTGGTCATCGSE4pHSTK3: AGTTTCGTGGTCATCGTACCTSE4pNSTK: AGTTTCGTGGTCATCG
*Terminology Note: HSTK5 strands mean that only the 5’ sticky end is present on a strand.Similarly, HSTK3 means only the 3’ sticky end is present. NSTK means no sticky ends areincluded in a strand.