Thermochimica Acta 385 (2002) 127–142
16
Comparison of some methods for activation energy determination of thermal decomposition reactions by thermogravimetry R.R. Keuleers, J.F. Janssens, H.O. Desseyn * Chemistry Department, Antwerp University (RUCA), Groenenborgerlaan 171, B2020 Antwerp, Belgium Recei ved 29 Nove mber 2000; receiv ed in revised form 15 August 2001; accepted 15 Augus t 2001 Abstract The activation energy for the thermal decompostion of chemical compounds can be determined using isothermal or non- isothermal TGA measurements or by using the recently introduced modulated TGA method (MTGA, TA Instruments). In the course of our investigation on the decompostion of complexes, we started a comparative study of different measurement and calculation procedures for the thermal decompositon of Mn(Urea) 2 Cl 2 . As a reference, we did the same study on the sublimation of N -n-propyloxamide. The results of our comparative study on the determination of the activation energy for the decomposition/sublimation of these compounds are given. # 2002 Elsevier Science B.V. All rights reserved. Keywords: Activation energy; Isothermal TGA; Non-isothermal TGA; Modulated TGA 1. Intro duct ion Rea cti on kinet ics has always bee n a poin t of inte rest for chemists: as early as 1889 S. Arrhenius proposed his well-known formula for the temperature-depen- dence of the reaction rate, and the first Nobel Prize in chemistry (in 1901) was awarded to J.H. Van’t Hoff, who was doing research in reaction rates. Every year, several books and many articles about reaction rates and activation energy appear. Browsing through this vast amount of literature proves that up to now scien- ti st do not ag re e abou t w ha t is th e be st wa y to determine the acti va ti on energ y for the thermal decompositio n of soli ds. The calcula tio n and the meaning of activation energy is always a subject for animated dis cus sions at the rmal ana lysi s mee tings (ICTAC, ESTAC, . . .). All this interest lies in the fact that the value of the activation energy can give an idea about the opti mum rea ction conditio ns in proc ess chemistry, it gives an idea about the thermal stability and the expe ct ed life time of a comp oundto be kept ata certa in tempera tur e or it pro vides inf ormati on in quality researc h. In our research on the structure and stability of a number of ligands and their coordinatio n compounds, the activation energy of the thermal decomposition reactio n is an indication of the relati ve bond strengths within the molecules studied and can be related to vib rat ional fre que ncies determine d fro m IR and Raman spe ctr osco py . We the refore tested se ver al determination methods for the activation energy on one coordination compound (Mn(Urea) 2 )Cl 2 ) and on one ligand ( N -n-propyloxamide). Thermochimica Acta 385 (2002) 127–142 * Corresponding author. Tel.: þ32-321-80-365; fax: þ32-321-80-233. E-mail address: [email protected] (H.O. Desseyn). 0040-6 031/0 2/$ – see front matte r # 2002 Elsevier Science B.V. All rights reserved. PII: S0040-6031( 01)0 072 0-1
-
Upload
marcos-fabio-de-jesus -
Category
Documents
-
view
221 -
download
0
Transcript of Thermochimica Acta 385 (2002) 127–142

8/3/2019 Thermochimica Acta 385 (2002) 127–142
http://slidepdf.com/reader/full/thermochimica-acta-385-2002-127142 1/16
Comparison of some methods for activation energydetermination of thermal decomposition
reactions by thermogravimetry
R.R. Keuleers, J.F. Janssens, H.O. Desseyn*
Chemistry Department, Antwerp University (RUCA), Groenenborgerlaan 171, B2020 Antwerp, Belgium
Received 29 November 2000; received in revised form 15 August 2001; accepted 15 August 2001
Abstract
The activation energy for the thermal decompostion of chemical compounds can be determined using isothermal or non-
isothermal TGA measurements or by using the recently introduced modulated TGA method (MTGA, TA Instruments). In the
course of our investigation on the decompostion of complexes, we started a comparative study of different measurement
and calculation procedures for the thermal decompositon of Mn(Urea)2Cl2. As a reference, we did the same study on the
sublimation of N -n-propyloxamide. The results of our comparative study on the determination of the activation energy for the
decomposition/sublimation of these compounds are given. # 2002 Elsevier Science B.V. All rights reserved.
Keywords: Activation energy; Isothermal TGA; Non-isothermal TGA; Modulated TGA
1. Introduction
Reaction kinetics has always been a point of interest
for chemists: as early as 1889 S. Arrhenius proposed
his well-known formula for the temperature-depen-
dence of the reaction rate, and the first Nobel Prize in
chemistry (in 1901) was awarded to J.H. Van’t Hoff,
who was doing research in reaction rates. Every year,
several books and many articles about reaction ratesand activation energy appear. Browsing through this
vast amount of literature proves that up to now scien-
tist do not agree about what is the best way to
determine the activation energy for the thermal
decomposition of solids. The calculation and the
meaning of activation energy is always a subject for
animated discussions at thermal analysis meetings
(ICTAC, ESTAC, . . .). All this interest lies in the fact
that the value of the activation energy can give an idea
about the optimum reaction conditions in process
chemistry, it gives an idea about the thermal stability
and the expected lifetime of a compound to be kept at a
certain temperature or it provides information in
quality research.In our research on the structure and stability of a
number of ligands and their coordination compounds,
the activation energy of the thermal decomposition
reaction is an indication of the relative bond strengths
within the molecules studied and can be related to
vibrational frequencies determined from IR and
Raman spectroscopy. We therefore tested several
determination methods for the activation energy on
one coordination compound (Mn(Urea)2)Cl2) and on
one ligand ( N -n-propyloxamide).
Thermochimica Acta 385 (2002) 127–142
* Corresponding author. Tel.: þ32-321-80-365;
fax: þ32-321-80-233.
E-mail address: [email protected] (H.O. Desseyn).
0040-6031/02/$ – see front matter # 2002 Elsevier Science B.V. All rights reserved.
PII: S 0 0 4 0 - 6 0 3 1 ( 0 1 ) 0 0 7 2 0 - 1
8/3/2019 Thermochimica Acta 385 (2002) 127–142
http://slidepdf.com/reader/full/thermochimica-acta-385-2002-127142 2/16
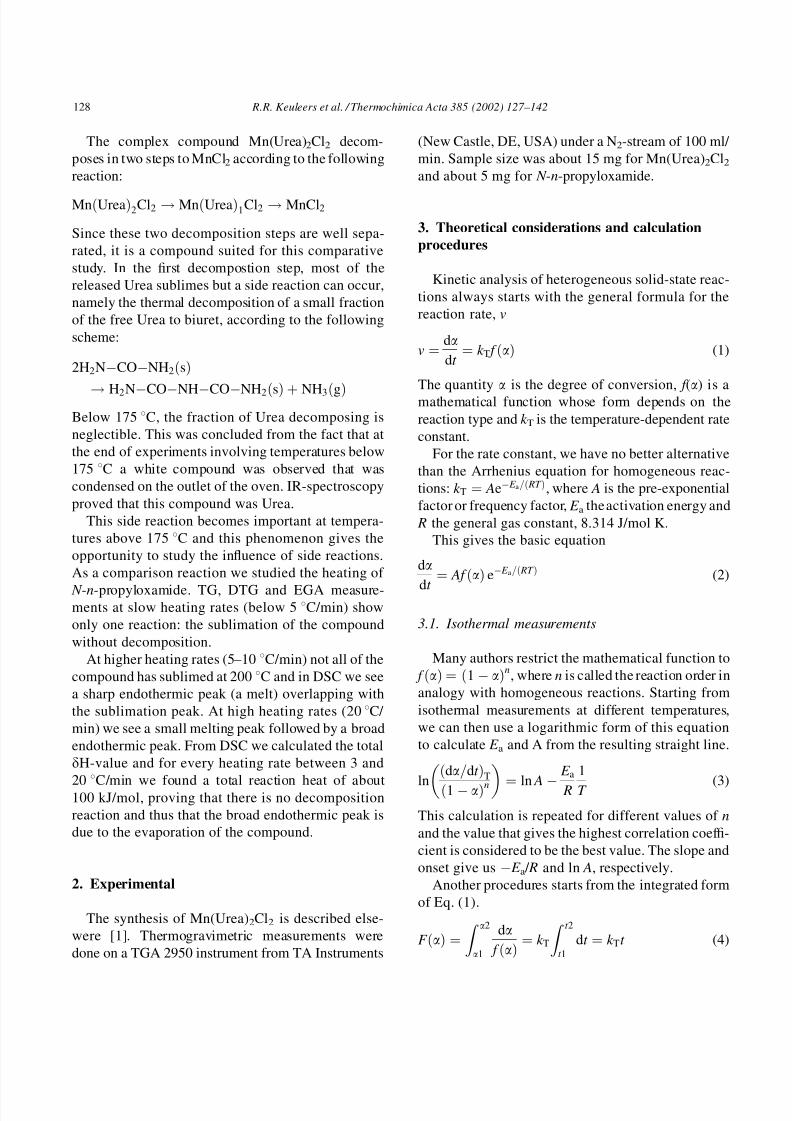
The complex compound Mn(Urea)2Cl2 decom-
poses in two steps to MnCl2 according to the following
reaction:
MnðUreaÞ2Cl2 ! MnðUreaÞ1Cl2 ! MnCl2
Since these two decomposition steps are well sepa-
rated, it is a compound suited for this comparative
study. In the first decompostion step, most of the
released Urea sublimes but a side reaction can occur,
namely the thermal decomposition of a small fraction
of the free Urea to biuret, according to the following
scheme:
2H2NÀCOÀNH2ðsÞ
! H2NÀCOÀNHÀCOÀNH2ðsÞ þ NH3ðgÞBelow 175 8C, the fraction of Urea decomposing is
neglectible. This was concluded from the fact that at
the end of experiments involving temperatures below
175 8C a white compound was observed that was
condensed on the outlet of the oven. IR-spectroscopy
proved that this compound was Urea.
This side reaction becomes important at tempera-
tures above 175 8C and this phenomenon gives the
opportunity to study the influence of side reactions.
As a comparison reaction we studied the heating of
N -n-propyloxamide. TG, DTG and EGA measure-ments at slow heating rates (below 5 8C/min) show
only one reaction: the sublimation of the compound
without decomposition.
At higher heating rates (5–10 8C/min) not all of the
compound has sublimed at 200 8C and in DSC we see
a sharp endothermic peak (a melt) overlapping with
the sublimation peak. At high heating rates (20 8C/
min) we see a small melting peak followed by a broad
endothermic peak. From DSC we calculated the total
dH-value and for every heating rate between 3 and
208
C/min we found a total reaction heat of about100 kJ/mol, proving that there is no decomposition
reaction and thus that the broad endothermic peak is
due to the evaporation of the compound.
2. Experimental
The synthesis of Mn(Urea)2Cl2 is described else-
were [1]. Thermogravimetric measurements were
done on a TGA 2950 instrument from TA Instruments
(New Castle, DE, USA) under a N2-stream of 100 ml/
min. Sample size was about 15 mg for Mn(Urea)2Cl2and about 5 mg for N -n-propyloxamide.
3. Theoretical considerations and calculation
procedures
Kinetic analysis of heterogeneous solid-state reac-
tions always starts with the general formula for the
reaction rate, v
v ¼da
dt ¼ k T f ðaÞ (1)
The quantity a is the degree of conversion, f (a) is a
mathematical function whose form depends on the
reaction type and k T is the temperature-dependent rate
constant.
For the rate constant, we have no better alternative
than the Arrhenius equation for homogeneous reac-
tions: k T ¼ AeÀE a=ð RT Þ, where A is the pre-exponential
factor or frequency factor, E a the activation energy and
R the general gas constant, 8.314 J/mol K.
This gives the basic equation
da
dt
¼ Af ðaÞ eÀE a=ð RT Þ (2)
3.1. Isothermal measurements
Many authors restrict the mathematical function to
f ðaÞ ¼ ð1 À aÞn, where n is called the reaction order in
analogy with homogeneous reactions. Starting from
isothermal measurements at different temperatures,
we can then use a logarithmic form of this equation
to calculate E a and A from the resulting straight line.
ln
ðda=dt ÞT
ð1 À aÞn
¼ ln A À
E a
R
1
T (3)
This calculation is repeated for different values of n
and the value that gives the highest correlation coef fi-
cient is considered to be the best value. The slope and
onset give us ÀE a / R and ln A, respectively.
Another procedures starts from the integrated form
of Eq. (1).
F ðaÞ ¼
Z a2
a1
da
f ðaÞ¼ k T
Z t 2
t 1
dt ¼ k Tt (4)
128 R.R. Keuleers et al. / Thermochimica Acta 385 (2002) 127–142

8/3/2019 Thermochimica Acta 385 (2002) 127–142
http://slidepdf.com/reader/full/thermochimica-acta-385-2002-127142 3/16
Plotting F (a)versus time with the right form of f (a)
will yield a straight line whose slope gives k T for that
temperature. If we repeat the measurement and the
calculation for other temperatures, we can plot ln k Tasa function of 1/ T . This will give us a straight line with
slope ÀE a / R and onset ln A, if we accept k T ¼ AeÀE a=ð RT Þ for like homogeneous reactions.
3.2. Non-isothermal measurements
3.2.1. Linear heating rates
If we perform non-isothermal measurements with a
linear heating rate b ¼ dT =dt , the basic Eq. (2) can be
written as
dadT
¼ Ab
f ðaÞ eÀE a=ð RT Þ
Restricting the function to f ðaÞ ¼ ð1 À aÞnand taking
logarithms, we get
lnda
dT
¼ n lnð1 À aÞ þ ln
A
b
À
E a
RT (5)
Kofstad [2] transforms this equation to
lnÀd ½lnð1 À aÞ
dT
þ ð1 À nÞ lnð1 À aÞ ¼ ln
A
bÀ
E a
R
1
T
From a single measurement (one value of b) we can,for each value of a, calculate the left hand side of the
equation for several values of n.
The value of n giving the best correlation coef ficient
for the resulting straight line is used, and from the
slope of that line E a is calculated.
Ingraham and Marrier [3] complicate the formulae
by suggesting that the frequency factor A is a linear
function of temperature ( A ¼ A0 Â T ), but they restrict
thevalue of n to zero. Eq. (5) can then be transformed to
lnb
T da
dT
¼ ln A0 ÀE a
RT If we do not restrict the reaction mechanism to zeroth
order, we get
lnb
T
da
dT À lnð1 À aÞ ¼ ln A0 À
E a
RT
Freeman and Carroll [4] start from Eq. (5) for two
values of a and obtain the following equation:
D lnðda=dT Þ
D lnð1 À aÞ¼ n À
E a
R
Dð1=T Þ
D lnð1 À aÞ
Again, we start from one non-isothermal run to cal-
culate the right hand side of the equation for a series of
values of a, T and plot them against the left-hand side.
The slope of the obtained straight line gives us E a / Rwhile the onset equals n.
The methods of Kofstad and of Ingraham and
Marrier give us a value of n, if we accept the corre-
lation coef ficient of the obtained straight line as
a valuable criterium. The method of Freeman and
Carroll gives us n as the onset of the line.
These three methods use one single measurement
and allow us to calculate E a from the slope of a straight
line, for a range of values of a. Here, it should be noted
that changing the heating rate and thus the temperature
at which the reaction takes place can change the
reaction mechanism and thus the activation energy.
Therefore methods based on only a single run (one
heating rate) are disapproved of by most researchers.
The whole procedure can be repeated for other
heating rates and in such a case a comparison of
values obtained at different heating rates can give
an indication if the values of E a are trustworthy.
Friedman [5] writes Eq. (5) as
ln bð Þda
dT ¼ ln A þ n lnð1 À aÞ À
E a
RT
This method starts from different runs (at different
heating rates) and let us calculate E a for a fixed value
of a, but from the onset we can not calculate A and
determine a ‘‘good’’ value for n at the same time.
We can write Eq. (5) in seven different forms,
always giving a straight line with 1/ T as independent
variable and ÀE a / R as slope. If we restrict the left hand
side to ln(da /dT ), ln b, or ln[b(da /dT )], we do not need
to know the form of f (a), but then we can calculate
only E a and not A.
In the case of the first possibility lnðda=dT Þ ¼lnð Af ðaÞ=bÞ À E a=ð RT Þ, we use data from one mea-
surement (one linear heating rate b) and plot the lefthand side of the equation as a function of 1/ T for
different values of a. Here too, we should remember
the above-mentioned disadvantages of methods based
on one measurement.
In the case of the second and third possibilities,
ln b ¼ lnA f ðaÞ
ðda=dT Þ
À
E a
RT and
lnb da
dT
¼ lnð A f ðaÞÞ À
E a
RT
R.R. Keuleers et al. / Thermochimica Acta 385 (2002) 127 – 142 129

8/3/2019 Thermochimica Acta 385 (2002) 127–142
http://slidepdf.com/reader/full/thermochimica-acta-385-2002-127142 4/16
we use data from measurements done at different heat-
ing rates and we calculate E a for a fixed value of a. We
can then repeat the calculation for other values of a.
3.2.2. Modulated heating rates
In a modulated heating rate method, a sinusoidal
temperature modulation is superimposed on top of a
conventional heating profile. This working method is
equivalent to temperature-modulated DSC, and as a
fact, both techniques were devised by Mike Reading,
whereby MTGA is based on earlier work on the jump
factor-method by Flynn [6] and Dickens [7]. The rate
of weight loss responds to the temperature oscillations
and the use of discrete Fourier transformation allows
to calculate the kinetic parameters E a and A on a
continuous basis, making possible the study of the
decomposition kinetics as a function of time, tem-
perature and conversion factor, without any assump-
tions about the reaction mechanism (model-free
calculations). The software calculates E a on the basis
of the following equation:
E a ¼RðT 2 À A02Þ L
2 A0
where E a, R and T have their normal meaning, A0 is the
temperature amplitude of the applied sinus profile and
L stands for ln(dap /dav), p and v depict the values on apeak and in a valley, respectively.
4. Results and discussions
4.1. Isothermal measurements
4.1.1. Mn(Urea)2Cl2Each of the two decomposition steps of Mn(Urea)2-
Cl2 were studied at six different temperatures: for the
first step, the temperatures were 145, 160, 165, 175,
185 and 190 8C. For the second decomposition step,
we used 210, 225, 235, 240, 245 and 250 8C.
Fig. 1 gives the calculated activation energy E a as a
function of a for the two decomposition steps, calcu-
lated from Eq. (2).
As can be seen in the Fig. 1, for both decomposition
steps we find a value for E a which is constant over the
entire a-range: 125 kJ/mol for the first step and 170 kJ/
mol for the second step. The only exception is near the
end of the process, where we see a small but clear
deviation from the average vaule for E a. This is
probably due to reading errors in this region of the
TGA curve, where it is very flat.
Table 1 gives the values of E a as a function of a,
calculated from Eq. (3). As can be seen, the values are
constant over the entire a-region, and the results show
the same values as those of Eq. (2).
It is clear that by using relative low temperatures
(compared to the critical temperature of 175 8C), theinterfering reactions are almost negligible.
Fig. 1. E a as a function of a for the first (bottom) and second (top) decomposition step of Mn(Urea)2Cl2.
130 R.R. Keuleers et al. / Thermochimica Acta 385 (2002) 127 – 142
8/3/2019 Thermochimica Acta 385 (2002) 127–142
http://slidepdf.com/reader/full/thermochimica-acta-385-2002-127142 5/16
4.1.2. N-n-propyloxamide
The thermal behaviour of N -n-propyloxamide was
studied at four different temperatures: 115, 120, 125
and 130 8C. Temperatures lower than 115 8C would
have resulted in measuring times of more than 24 h
and thus in relative large errors due to a very flat TGA
curve, for isothermal measurements at temperatures
higher than 130 8C a large fraction would have been
sublimed before that temperature is reached.
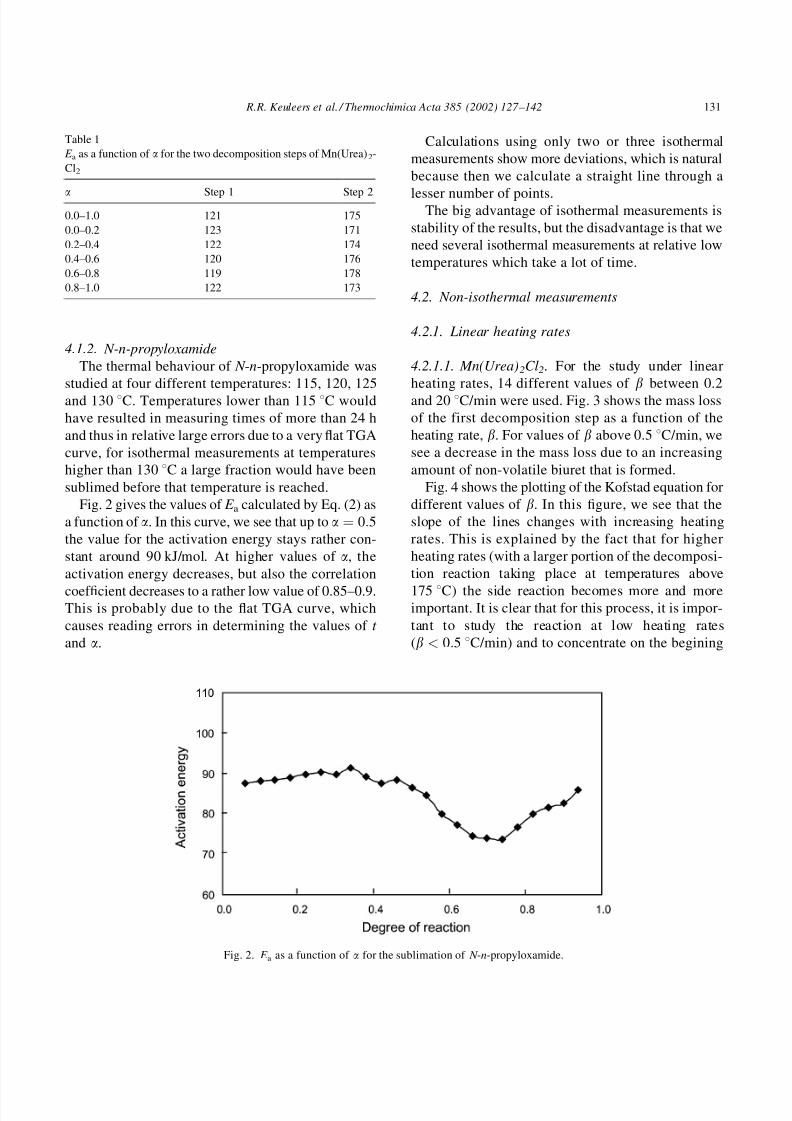
Fig. 2 gives the values of E a calculated by Eq. (2) as
a function of a. In this curve, we see that up to a ¼ 0:5the value for the activation energy stays rather con-
stant around 90 kJ/mol. At higher values of a, the
activation energy decreases, but also the correlation
coef ficient decreases to a rather low value of 0.85–0.9.This is probably due to the flat TGA curve, which
causes reading errors in determining the values of t
and a.
Calculations using only two or three isothermal
measurements show more deviations, which is natural
because then we calculate a straight line through a
lesser number of points.The big advantage of isothermal measurements is
stability of the results, but the disadvantage is that we
need several isothermal measurements at relative low
temperatures which take a lot of time.
4.2. Non-isothermal measurements
4.2.1. Linear heating rates
4.2.1.1. Mn(Urea)2Cl2. For the study under linear
heating rates, 14 different values of b between 0.2
and 20 8C/min were used. Fig. 3 shows the mass loss
of the first decomposition step as a function of the
heating rate, b. For values of b above 0.5 8C/min, we
see a decrease in the mass loss due to an increasing
amount of non-volatile biuret that is formed.
Fig. 4 shows the plotting of the Kofstad equation for
different values of b. In this figure, we see that the
slope of the lines changes with increasing heating
rates. This is explained by the fact that for higher
heating rates (with a larger portion of the decomposi-
tion reaction taking place at temperatures above
175 8C) the side reaction becomes more and moreimportant. It is clear that for this process, it is impor-
tant to study the reaction at low heating rates
(b < 0:5 8C/min) and to concentrate on the begining
Table 1
E a as a function of a for the two decomposition steps of Mn(Urea)2-
Cl2
a Step 1 Step 2
0.0–1.0 121 175
0.0–0.2 123 171
0.2–0.4 122 174
0.4–0.6 120 176
0.6–0.8 119 178
0.8–1.0 122 173
Fig. 2. E a as a function of a for the sublimation of N -n-propyloxamide.
R.R. Keuleers et al. / Thermochimica Acta 385 (2002) 127 – 142 131

8/3/2019 Thermochimica Acta 385 (2002) 127–142
http://slidepdf.com/reader/full/thermochimica-acta-385-2002-127142 6/16
of the reaction because for higher values of b and a a
large portion of the decomposition reaction takes
place at temperatures above 175 8C, and thus, the
calculated activation energy is not that of the pure
release of Urea.
Since, for b > 0:5 8C/min, the side reaction
becomes more and more important, we would expect
that the value of E a would increase between 130 kJ/
mol (the value for the pure decomposition reaction
calculated for very low a and very low b) and 375 kJ/
mol (the value for the side reaction) for increasing bs.Fig. 5 shows the activation energy for the first
decomposition reaction of the complex as a function
of b, calculated by the Kofstad method for the begin-
ning of the reaction (a < 0:2). We see that the experi-
mental values show a minimum. This can be explained
by the fact that the Kofstad equation was deduced for a
single process and is no longer valid if two processes
take place simultaneously.
Table 2 gives an overview of values for the activa-
tion energy of the first decomposition step of the
complex, calculated for the start of the reaction
(0 a 0:2) by the different calculation methods
based on one thermogravimetric measurement.
Comparing the results of the Kofstad method withthose of the Ingraham and Marrier method shows
almost identical values. This is an indication that
for this process, it is not necessary to represent the
Fig. 3. Mass loss of the first decomposition step as a function of b.
Fig. 4. The Kofstad equation as a function of b.
132 R.R. Keuleers et al. / Thermochimica Acta 385 (2002) 127 – 142

8/3/2019 Thermochimica Acta 385 (2002) 127–142
http://slidepdf.com/reader/full/thermochimica-acta-385-2002-127142 7/16
frequency factor A as a function of temperature as
suggested by Ingraham and Marrier. The results of the
Freeman and Carroll method show the same trend as
those of the previous two methods: an almost constant
value for low values of b, a minimum in the inter-
mediate phase and then an increasing value due to the
increasing contribution of the side reaction, but the
values calculated by the Freeman and Carroll method
are lower. We want to remark here that the calculationsfor this method seem to be sensitive to outliers which
influences the accuracy of the slope and, thus, of the
activation energy.
For these three methods, we should remember that
these are the methods in which the value for E a is
based on only one measurement (one heating rate).
Therefor, the dramatic increase of E a in going from
b ¼ 0:2 to 20 is due to a combination of the poor
methods and the influence of the side reaction.
For the general method (using the equation lnðda=dT Þ ¼ lnð Af ðaÞ=bÞ À E a=ð RT Þ by plotting ln(da /dT )
versus (1/ T ), we see that the resulting values have the
same order of magnitude as those found with the three
previous methods, except in the intermediate phase of
the process, and that we observe the expected evolu-
tion of the value of E a between the value of the first
decomposition and that of the side reaction. This can
be explained by the fact that the form of f (a) is
incorporated in the constant term and thus there is
no influence by the fact that the real f (a) is a combina-
tion of two reactions.The two general methods based on several mea-
surements done at different heating rates gave gen-
erally the same results, which is normal as they are just
mathematical rearrangements. As an example, Fig. 6
gives the activation energy of the first decomposition
step as a function of a, calculated from ln b ¼ln½ Af ðaÞ=ðda=dT Þ À E a=ð RT Þ using all the 14 heating
rates between 0.2 and 20 8C/min, while Fig. 7 gives
the values obtained using the five low heating rates
between 0.2 and 0.5 8C/min.
Fig. 5. E a as a function of b for the first decomposition step.
Table 2
E a as a function of b for the first decomposition step of Mn(Urea)2-
Cl2 for 0.0 a 0.2
b Kofstad Freeman
and Carroll
Ingraham
and Marrier
ln(da /dT ) ¼ f (1/ T )
0.2 131 123 127 133
0.25 135 102 132 120
0.3 141 100 138 1170.4 131 124 128 131
0.5 122 92 119 121
1.0 119 82 115 129
1.5 100 55 97 145
2.0 51 31 54 196
2.5 27 43 25 234
3.0 120 70 117 272
4.0 161 106 157 318
5.0 282 188 282 387
10.0 348 241 343 375
20.0 377 294 372 290
R.R. Keuleers et al. / Thermochimica Acta 385 (2002) 127 – 142 133

8/3/2019 Thermochimica Acta 385 (2002) 127–142
http://slidepdf.com/reader/full/thermochimica-acta-385-2002-127142 8/16
It can be clearly seen that, if we use all values of b,
the value of E a increases due to the known formation
of biuret, but if we restrict b to the low values, we find
a constant value of 120 kJ/mol up to a ¼ 0:4.
So again, we can conclude that it is important to
concentrate on the values of E a calculated for low
values of a and b, so that mainly measurements at
temperatures lower than 175 8C are considered and the
influence of the side reaction (the formation of biuret)
is minimized. This is the same conclusion as the onewe can draw from the calculations using one non-
isothermal measurement.
Calculation of the activation energy for the second
decomposition step, using methods based on one mea-
surement, give results with a rather large variation (as
expected). Values of E a, calculated with ln b ¼ln½ Af ðaÞ=ðda=dT Þ À E a=ð RT Þ using 12 heating rates
between 0.2 and 5 8C/min, are more stable and give an
almost constant value of 170 kJ/mol over the entire
a-range. The only deviations are seen at the beginning
and at the end of the process, probably due to the fact
that in the flattest parts of the (unsmoothed) curve it is
more dif ficult to determine the exact value of the mass.
So here too, we can conclude that calculations based ona single run give unreliable results.
We also see that, although the process occurs at
higher temperatures, the second decomposition step is
less influenced by the side reactions: the temperature
Fig. 6. E a as a function of a for the first decomposition step (0:2 b 20 8C/min).
Fig. 7. E a as a function of a for the first decomposition step (0:25 b 0:5 8C/min).
134 R.R. Keuleers et al. / Thermochimica Acta 385 (2002) 127 – 142

8/3/2019 Thermochimica Acta 385 (2002) 127–142
http://slidepdf.com/reader/full/thermochimica-acta-385-2002-127142 9/16
is too low to decompose the biuret formed in the first
step and high enough for the second released Urea to
escape before it can be decomposed.
4.2.1.2. N-n-propyloxamide. The sublimation of
N -n-propyloxamide was studied at nine heating rates
between 0.5 and 20 8C/min. Fig. 8 shows the results of
the Kofstad method for some of these heating rates.
We can clearly see that for low heating rates, we
obtain a straight line for almost the entire a-range,while for higher values of b there is a deviation near
the end of the process. Just like in the case of the
decomposition of the complex, this is caused by a side
reaction, in this case the evaporation of the molten
compound instead of the sublimation of the solid
compound.
If we use only the linear part of the obtained line
calculated by the Kofstad method (by limiting the
considered a-range so that the correlation coef ficient
has a minimum value of 0.999), we find the results
given in Table 3.From this table, it can be seen that the activation
energy of the sublimation process has a value of 90–
100 kJ/mol and gives slightly lower values for higher
heating rates. We also see that for higher heating rates,
the a-range giving a linear relation decreases because
the side reaction (the melting and evaporation)
becomes more and more important. This also shows
in the DTG curve, where for b > 5 8C/min the
shoulder at the high temperature side due to the side
reaction becomes more and more clear.
Fig. 9 gives the activation energy for the sublima-
tion of the amide as a function of the heating rate,
calculated from
lnda
dT
¼ ln
A f ðaÞ
b
À
E a
RT
Since this method seems to be rather sensitive to the
influence of side reactions, we restricted the a-range to
0 a 0:2. In that case, we find the values of 90–
95 kJ/mol with a decrease for higher heating rates.We did not use the mehod of Freeman and Carroll nor
that of Ingraham and Marrier for the sublimation of
N -n-propyloxamide,becausein the studyof Mn(Urea)2-
Cl2 we already saw that the first one is very sensitive
towards the side reactions and that the second one gives
values very close to those found with the method of
Kofstad.
Fig. 8. The Kofstad equation for several values of b.
Table 3
E a and the used a-range for the sublimation of N -n-propyloxamide
calculated by the Kofstad method
b a E a
0.5 0–0.80 89.0
1 0–0.80 102.3
2 0–0.80 91.4
3 0–0.80 95.3
5 0–0.80 102.7
7.5 0–0.76 102.2
10 0–0.76 93.8
15 0–0.72 91.4
20 0–0.20 84.1
R.R. Keuleers et al. / Thermochimica Acta 385 (2002) 127 – 142 135

8/3/2019 Thermochimica Acta 385 (2002) 127–142
http://slidepdf.com/reader/full/thermochimica-acta-385-2002-127142 10/16
Fig. 10 gives the activation energy for the sublima-
tion of the amide as a function of the degree of
conversion, calculated from lnb ¼ ln½ Af ðaÞ=ðda=dT ÞÀE a=ð RT Þ, using nine non-isothermal measurements.
We see that the value for E a decreases slowly for
increasing values of b. This can be explained by the
fact that the side reaction is melting and the molten
compound is evaporating. Since for evaporation no
lattice energy needs to be overcome, we expect a lower
activation energy for evaporation than for sublimation,and thus a lower total activation energy for the later
part of the process, where less sublimation and more
evaporation occurs. This process also explains the
lowering of the value for E a for higher heating
rates.
4.2.2. Temperature modulated heating rates
4.2.2.1. Mn(Urea)2Cl2. We started our investigations
with a temperature profile with an amplitude of 5 8C
and a period of 200 s, superimposed on linear heating
rates of 0.3, 0.5, 0.8, 1.0, 5.0 and 10.0 8C/min. We
noticed that for each of these cases the real obtained
amplitude was only 3.6 8C.
Fig. 11 shows E a as a function of a for both
decomposition steps, calculated from the measure-ment with an underlying linear heating rate of
0.3 8C/min. We see that for each step, three regions
can be seen: a high and steep side at the beginning and
at the end and a horizontal plateau in between. These
high values of E a at the beginning and at the end can be
Fig. 9. E a for the sublimation of N -n-propyloxamide as a function of a, calculated from lnðda=dT Þ ¼ lnð Af ðaÞ=bÞ À E a=ð RT Þ.
Fig. 10. Activation energy for the sublimation of N -n-propyloxamide as a function of b, calculated from lnb ¼ ln½ Af ðaÞ=ðda=dT Þ À E a=ð RT Þ.
136 R.R. Keuleers et al. / Thermochimica Acta 385 (2002) 127 – 142

8/3/2019 Thermochimica Acta 385 (2002) 127–142
http://slidepdf.com/reader/full/thermochimica-acta-385-2002-127142 11/16
explained by the fact that dav /dt is very low in these
regions. It is clear that the calculated values of E a are
not realistic and can not be used.
In Fig. 12 we compare E a as a function of a for the
first decomposition step, calculated from measure-
ments with three different underlying heating rates:
0.3, 1 and 5 8C/min. It can be seen that the higher the
heating rate, the smaller the horizontal part and thusthe smaller the a-region where meaningful values of
E a can be obtained. For the second decomposition step
we see the same effect, but there the value of b can be
as high as 10 8C/min before the plateau disappears.
This effect is understandable if we take in mind that
for this higher heating rates only one or two cylces of
the sinus are completed during the whole decomposi-
tion process, while it was stated [8] that at least fives
cylces should be completed in order to be able tocalculate meaningful values of E a. On top of that, we
Fig. 11. E a as a function of a for the decomposition of Mn(Urea)2Cl2 at 0.3 8C/min.
Fig. 12. E a as a function of a for the first decomposition step of Mn(Urea)2Cl2 at 0.3, 1 and 5 8C/min.
R.R. Keuleers et al. / Thermochimica Acta 385 (2002) 127 – 142 137

8/3/2019 Thermochimica Acta 385 (2002) 127–142
http://slidepdf.com/reader/full/thermochimica-acta-385-2002-127142 12/16
must realise that for heating rates of 1 and 5 8C/min,
part of the reaction takes places at temperatures above
175 8C so that the side reaction is no longer negligible.
Since (as mentioned above), the second decomposi-
tion step is less sensitive to the side reaction, the values
of E a for this step are less influenced by the underlying
heating rate.
Table 4 gives the calculated values of E a calculated
by modulated TGA (MTGA) with different underlying
heating rates. It shows that the values calculated by
MTGA are clearly higher than those calculated by
normal isothermal and non-isothermal methods. We
must remark that in these cases (normal isothermal
and non-isothermal methods), we could accept only
values calculated for low values of a (even for low bs),
while just in this region the MTGA curve of E a versus
a is still in the steep decreasing flank and thus thevalues can not be used. Therefore, comparison is not
evident.
To avoid the problems caused by the side reaction,
we decided to study the results of MTGA with an
underlying isothermal profile: 165, 175 and 185 8C for
the first decomposition step and 225, 235 and 250 8Cfor the second step, in each case with an amplitude of
5 8C and a period of 200 s. In all these cases, the
programmed amplitude of 5 8C was realised, in con-
trast with the cases of non-isothermal underlying
heating profiles, where the actual amplitude was about
3.6 8C for each run.
For the first step, we found 250 kJ/mol at 165 8C
and around 220 kJ/mol at 175 and 185 8C. The E a as a
function of a curve at 185 8C shows less noise than the
other measurements.
The results for the second step are given in Fig. 13.
Here too, like for the first step, the highest temperature
gives the lowest value for E a and shows least noise in
the E a versus a curve. Like for the measurements with
non-linear underlying profiles, we find higher values
with modulated than with non-modulated measure-
ments.
We also did a few tests with modulated high resolu-
tion TGA (Hi-Res TGA), hoping to suppress the side
reaction. In Hi-Res TGA, the programmed heating
rate is slowed down in order to slow down the mass
loss. The resolution factor (RF ¼ 0À8) determines
how soon the heating rate is slowed down while thesensitivity (S ¼ 1À6) determines how strong the
‘‘braking’’ is. We used heating rates of 0.3, 2 and
Table 4
E a for the two decomposition steps of Mn(Urea)2Cl2 for different
values of b
b Step 1 Step 2
0.3 202 215
0.5 185 207
0.8 194 202
1.0 186 191
5.0 186 149
Fig. 13. E a as a function of a for the second decomposition step of Mn(Urea)2Cl2.
138 R.R. Keuleers et al. / Thermochimica Acta 385 (2002) 127 – 142
8/3/2019 Thermochimica Acta 385 (2002) 127–142
http://slidepdf.com/reader/full/thermochimica-acta-385-2002-127142 13/16
5 8C/min, an amplitude of 5 8C and a period of 200 s
for the modulation with RF ¼ 6 and S ¼ 1. For the
heating rates of 0.3 and 5 8C/min, we also did a
measurement with RF ¼ 8. We found that, like for
the other modulations with non-isothermal underlying
profiles, the actual amplitude was only 3.6 instead of
the programmed 5 8C.
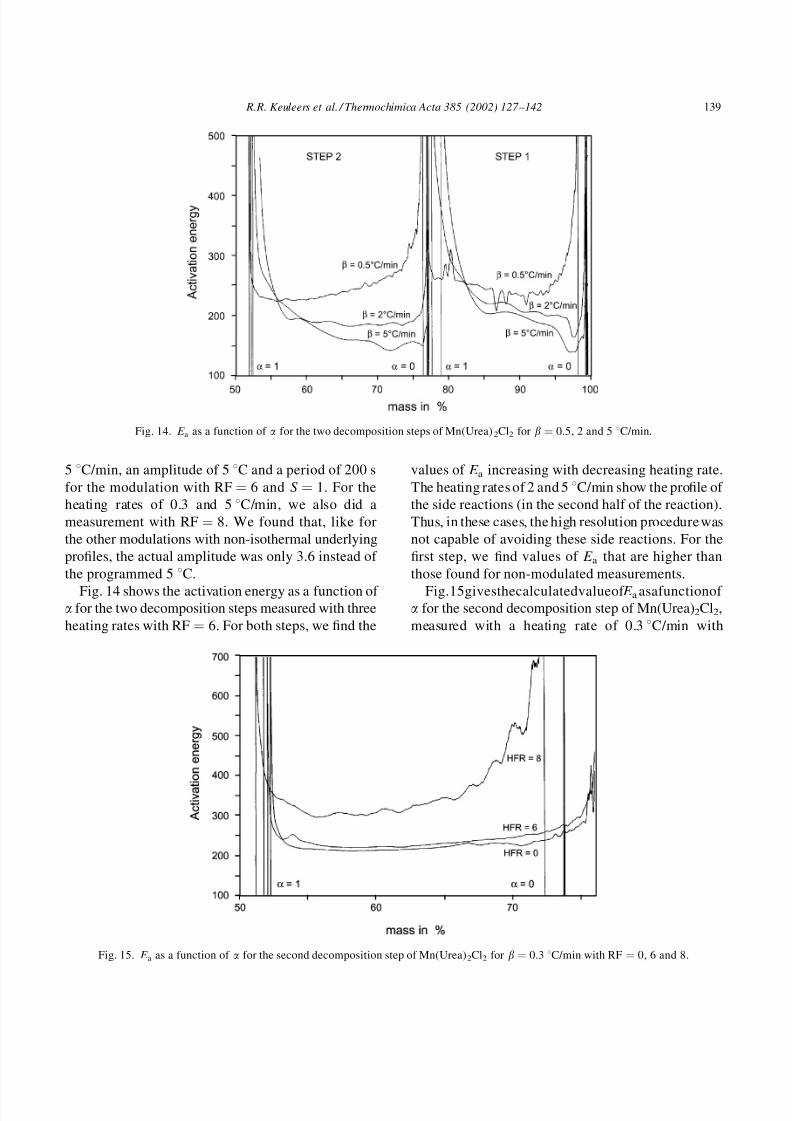
Fig. 14 shows the activation energy as a function of a for the two decomposition steps measured with three
heating rates with RF ¼ 6. For both steps, we find the
values of E a increasing with decreasing heating rate.
The heating rates of 2 and 5 8C/min show the profile of
the side reactions (in the second half of the reaction).
Thus, in these cases, the high resolution procedure was
not capable of avoiding these side reactions. For the
first step, we find values of E a that are higher than
those found for non-modulated measurements.
Fig.15givesthecalculatedvalueof E aasafunctionof a for the second decomposition step of Mn(Urea)2Cl2,
measured with a heating rate of 0.3 8C/min with
Fig. 14. E a as a function of a for the two decomposition steps of Mn(Urea)2Cl2 for b ¼ 0:5, 2 and 5 8C/min.
Fig. 15. E a as a function of a for the second decomposition step of Mn(Urea)2Cl2 for b ¼ 0:3 8C/min with RF ¼ 0, 6 and 8.
R.R. Keuleers et al. / Thermochimica Acta 385 (2002) 127 – 142 139

8/3/2019 Thermochimica Acta 385 (2002) 127–142
http://slidepdf.com/reader/full/thermochimica-acta-385-2002-127142 14/16
RF ¼ 0, 6 and 8 respectively. We can see that E aincreases with increasing RF, an effect that we saw
for the first step as well.
4.2.2.2. N-n-propyloxamide. We started with non-
isothermal underlying heating profiles of 0.5, 1, 3,
5, 10 and 15 8C/min.
Fig. 16 shows E a as a function of a for the sublimationof N -n-propyloxamide, with the different underlying
heating profiles. Like in the case of Mn(Urea)2Cl2 the
value of E a increases with decreasing heating rate. For
the highest heating rates (10 and 15 8C/min) we do not
obtain a flat plateau, probably because there are not
enough periods during the process (two and three
respectively).
Next, we used isothermal underlying profiles: 120,
125 and 130 8C. As in the case of Mn(Urea)2Cl2, the
actual amplitude was 5 8C like programmed, while forthe non-isothermal underlying profiles it was only
3.6 8C. The results are shown in Fig. 17, from which
Fig. 16. E a as a function of a for the sublimation of N -n-propyloxamide at different heating rates.
Fig. 17. E a as a function of a for the sublimation of N -n-propyloxamide at different temperatures.
140 R.R. Keuleers et al. / Thermochimica Acta 385 (2002) 127 – 142

8/3/2019 Thermochimica Acta 385 (2002) 127–142
http://slidepdf.com/reader/full/thermochimica-acta-385-2002-127142 15/16
it is clear that the value of E a increases with decreasing
underlying temperature.
In a final test MTGA was combined with Hi-Res
TGA in two runs: heating rate b ¼ 5 8C/min, ampli-
tude A ¼ 5 8C, period P ¼ 200 s, sensistivity factor
S ¼ 1 and high resolution factor (HRF) RF ¼ 6 and 8.
Fig. 18 shows the results of these two measurementscompared with RF ¼ 0 (no high resolution) and again
we see that E a increases with increasing RF.
4.2.3. Comparison of the results of the modulated
experiments
Table 5 gives an overview of the results of all our
modulated experiments. MTGA measurements with
non-isothermal underlying heating programme give a
E a versus a curve whose profile quality for the first
decomposition step decreases with increasing b, due
to the increasing influence of the side reactions. In allother measurements, E a is influenced by experimental
factors: E a increases with decreasing b. The heating
rate should not be too high, to make sure that enough
cycles are completed during the process.
For MTGA measurements with isothermal under-
lying profiles E a increases with decreasing tempera-
ture, as it does with increasing RF for modulated/high
resolution combinations.
Decreasing the heating rate, decreasing underlying
isothermal temperature and increasing RF all have as
result that a certain value of a is attained at a lower
temperature. Although some authors recently suggest
that E a could be dependent of temperature, most
researchers interprete E a in the same sense as Arrhenius
did: independent of T . And so, we feel that there
should not be such a clear dependence of the calcu-
lated values of E a as a function of these experimentalparameters.
Fig. 18. E a as a function of a for the sublimation of N -n-propyloxamide with b ¼ 5 8C/min and RF ¼ 0, 6 and 8.
Table 5
Overview of the results of the MTGA measurements
Non-isotherm
Mn(Urea)2Cl2Step 1 b # Better (E a versus a)
profile
Step 2 b # E a " N -n-propyloxamide b # E a "
IsothermMn(Urea)2Cl2
Step 1 T # E a "Step 2 T # E a "
N -n-propyloxamide T # E a "
High resolution
MnU2Cl2Step 1 b #, HRF ¼ E a "
b ¼, HRF " E a "Step 2 b #, HRF ¼ E a "
b ¼, HRF " E a " N -n-propyloxamide b ¼, HRF " E a "
R.R. Keuleers et al. / Thermochimica Acta 385 (2002) 127 – 142 141
8/3/2019 Thermochimica Acta 385 (2002) 127–142
http://slidepdf.com/reader/full/thermochimica-acta-385-2002-127142 16/16
5. General conclusions
In this article we compared several measuring
techniques and calculation methods in order to obtainthe activation energy of thermal decomposition reac-
tions. To do so, we compared the sublimation of N -n-
propyloxamide (a process disturbed by the melting
and evaporation of the compound only near the end of
the reaction and only for high heating rates or high
temperatures) with the two-step thermal decomposi-
tion of Mn(Urea)2Cl2 (a process in which the first step
is influenced by the decomposition of the released
Urea).
Our first conclusion is that it is important to fully
understand the process under study before trying to
calculate its activation energy. If for instance, we
would have calculated the activation energy for the
decomposition of Mn(Urea)2Cl2 based on the Kofstad
method for one heating rate (5 8C/min) without know-
ing the existence of the side reaction, we would have
published a value of 282 kJ/mol, while the real value is
about 120 kJ/mol.
A second conclusion is that for a single process, the
fastest way to calculate E a is from one non-isothermal
measurement, but this is not the most accurate value
obtained. Some researchers even insist to completely
abandon the single heating rate methods.If side reactions are known to occur, it is necessary
to search for experimental circumstances that mini-
mise these side reactions. In many case they can be
avoided by isothermal measurements at relatively low
temperatures. A very reliable value of E a versus a can
be calclulated by using enough temperatures (at least
four). However, this increases the measurement time.
This inconvenience (long measuring times) can be
solved by MTGA, but we showed that the accuracy islimited, since we found a temperature dependence
which is in contradiction with theory. Thus, the cal-
culation method of E a from MTGA measurements will
need some revision.
Acknowledgements
The authors thank the FWO-Vlaanderen (Flemish
Fund for Scientific Research) for the financial support
towards the purchase of the thermal analysis appara-
tus. R.R. Keuleers thanks the FWO-Vlaanderen for
his grant. The authors also would like to thank Mrs.
G. Thys for preparing the manuscript.
References
[1] R. Keuleers, G.S. Papaefstathiou, C.P. Raptopoulou, S.P.
Perlepes, H.O. Desseyn, J. Mol. Struc. 525 (2000) 173–183.
[2] P. Kofstad, Nature 179 (1957) 1362.
[3] T.R. Ingraham, P. Marrier, Can. J. Chem. Eng 42 (1964) 161.
[4] E.S. Freeman, B. Carroll, J. Phys. Chem. 62 (1958) 394.
[5] H.L. Friedman, J. Polym. Sci. C6 (1965) 183.
[6] J.H. Flynn, in: R.F. Schwenker, Jr., P.D. Garn (Eds.), Thermal
Analysis, Proceedings of ICTA 2, Worcester 1968, Academic
Press, 1969, pp. 1111–1126.
[7] B. Dickens, J. Pol. Sci.: Pol. Chem. Edition 20 (1982) 1065–
1087.
[8] R.L. Blaine, B.K. Hahn, J. Thermal Anal. 54 (1998) 695–704.
142 R.R. Keuleers et al. / Thermochimica Acta 385 (2002) 127 – 142