Thermal treatment of sludge - Högskolan i Borås treatment of... · Thermal treatment of sludge...
32
This thesis comprises 30 ECTS credits and is a compulsory part in the Master of Science with a Major in Resource Recovery – Sustainable Engineering, 120 ECTS credits No. 10/2011 Thermal treatment of sludge Narges Razmjoo Hamid Sefidari
Transcript of Thermal treatment of sludge - Högskolan i Borås treatment of... · Thermal treatment of sludge...
This thesis comprises 30 ECTS credits and is a compulsory part in the Master of Science
with a Major in Resource Recovery – Sustainable Engineering, 120 ECTS credits
No. 10/2011
Thermal treatment of sludge
Narges Razmjoo
Hamid Sefidari

Thermal treatment of sludge
NARGES RAZMJOO [email protected]
HAMID SEFIDARI [email protected]
Master thesis
Subject Category: Technology
University of Borås
School of Engineering
SE-501 90 BORÅS
Telephone +46 033 435 4640
Examiner: Professor Tobias Richards
Supervisor: Professor Tobias Richards
Supervisor address: Högskolan i Borås, S-501 90 Allégatan 1, Borås
Date: December 22, 2011
Keywords: Pyrolysis, organic sludge, Thermogravimetry, Kinetics, Non-isothermal
methods
Abstract
An experimental study of the thermal decomposition of organic sludge has been carried out.
Both isothermal and non-isothermal experiments at different heating rates have been performed
using the thermogravimetric analysis technique. The objective of this work was to calculate the
kinetic parameters of gasification reactions. Several heating rates were applied simulating
gasification reaction using carbon dioxide as gasifying agent. It was concluded that gasification
characteristics of the sludge samples were moderately dependent on the samples’ properties such
as ash and fixed carbon contents and the components present in the ash. Inherent alkaline and
alkaline earth carbonates and sulphates acted as catalysts.
Keywords: Pyrolysis, organic sludge, Thermogravimetry, Kinetics, Non-isothermal methods

Table of Contents
1. Introduction .............................................................................................................................1
2. Experimental ...........................................................................................................................4
2.1. Materials ...........................................................................................................................4
2.2. Thermogravimetric analysis (TGA)...................................................................................5
2.3. Kinetic methods ................................................................................................................7
3. Results and discussion ........................................................................................................... 10
3.1. Thermal analysis of the sludge heating process ............................................................... 11
3.1.1. Drying ...................................................................................................................... 11
3.1.2. Pyrolysis .................................................................................................................. 11
3.1.3. Non-isothermal gasification ...................................................................................... 11
3.1.4. Isothermal gasification reactions ............................................................................... 17
3.2. Non-isothermal gasification kinetics ............................................................................... 18
3.3. Isothermal gasification kinetics ....................................................................................... 21
4. Conclusion ............................................................................................................................ 23

1
1. Introduction
The ever increasing petroleum price has made many countries to seek clues for producing fuel
from bio-based materials. Accordingly, interest for such an alternative fuel has had an upsurge
during recent years since not only does biomass have the possibility of being generated locally, it
can also make any country self-sufficient and less reliant on foreign petroleum resources [1].
Above and beyond, due to the growing world population and incessantly improving living
standards, energy consumption and the output of wastes have been on the increase in recent
years. Municipal solid wastes (MSWs), sewage sludge and waste paper are being generated by
almost every activity of modern industrial society. Subsequently, the potential environmental and
human health impacts associated with the generation of waste are becoming matter of public
concern. Conventional disposal methods, such as ocean dumping and landfill disposal are not
viable solutions anymore, due to the restrictive environmental regulations, as well as limited
numbers of available sites. Given the above considerations, the thermal treatment of wastes has
attracted growing attention on an increasingly international scale by removing hazardous
components, reducing the size of wastes and providing opportunity for energy recovery which is
of crucial importance considering the global energy crisis [2].
Owing to its accessibility and useable energy content, the organic fraction of municipal solid
waste proves to be a wise choice as prospective feedstock for bioenergy production. Currently,
there are quite a number of processes through which biomass can be converted into fuel, for
instance, biological treatment, thermal treatment and so forth. The former produces ethanol or
methane, whereas the latter targets the production of a syngas which can be either upgraded to
fuels with high octane numbers or used in electricity generation.
As mentioned earlier, the focal point of the research has shifted towards thermal treatments, i.e.,
pyrolysis and gasification. While pyrolysis takes place in an inert atmosphere at moderate
temperatures, high temperature gasification is a thermochemical process by which any
carbonaceous fuel can be converted to gaseous products with useable heating value (above all
carbon monoxide and hydrogen in a controlled oxidizing atmosphere) [3].
As discussed previously, pyrolysis is a thermochemical decomposition of
a material or compound due to heat without the participation of oxygen or any other reagents. It
2
is worth mentioning that pyrolysis is most often used for organic materials. Furthermore,
Pyrolysis is an irreversible process involving the concurrent change of chemical composition and
physical phase. The term originates from the Greek-derived words "pyr" along with "lysis"
meaning "fire" and "breaking" respectively. On the whole, pyrolysis of organic matters produces
gaseous and liquid products and leaves a solid substance with a higher carbon content that is
char. Carbonization or extreme pyrolysis is a process where mostly carbon is left as the residue
of the process.
Pyrolysis is used far and wide in chemical industry, for instance, to produce charcoal, activated
carbon and other chemicals. Moreover, pyrolysis is employed in the process of
converting ethylene dichloride into vinyl chloride in order to produce PVC.
Aside from the abovementioned applications , there is a wide range of other specialized uses of
pyrolysis, e.g., producing coke from coal, converting biomass into syngas and biochar and
turning waste into safe-and-sound substances which can be safely disposed of [4].
Even though Pyrolysis seems to resemble other high-temperature processes such
as combustion and hydrolysis, it appears to be different from the foregoing processes since it
does not involve reactions with oxygen, steam, or any other reagents. Hypothetically, the
presumption of a completely oxygen-free atmosphere is possible whereas in reality since there is
some oxygen in any pyrolysis system, a small amount of oxidation is inevitable. In practice,
specifically, in industrial applications, pyrolysis is carried out under pressure and at temperatures
above 400 °C. For instance, for agricultural waste, usual temperatures are 450 to 550 °C.
Products might be addressed in two groups, intermediate and main products. For intermediate
products syngas and charcoal could be listed whereas final products (main products) include bio-
oil. Besides, electricity and thermal energy are perceived as byproducts for pyrolysis.
Gasification, however, is a process through which carbon-containing materials (either organic or
fossil based carbonaceous fuels) are converted into hydrogen, carbon dioxide, methane and
above all, carbon monoxide. Gasification is achievable at temperatures over 700°C while
subjecting the material to a controlled amount of oxygen and/or steam as reagents or gasifying
agents.
The resultant is a valuable gaseous mixture referred to as syngas or producer gas with
considerable energy content. In view of the foregoing, the power derived from gasification and
the following combustion of the resulting gas is regarded as a source of renewable energy. On
3
the contrary, the gasification of fossil-fuel derivatives, for example, plastic, is not considered to
be renewable energy. Gasification is gainful since it allows for producing a fuel with a higher
heating value than that of the original fuel. The aforesaid advantage makes gasification a better
option when compared to direct combustion. Another positive point attributed to gasification is
the possibility of using the resultant syngas in gas turbines which are of higher efficiency
compared to steam turbines. Moreover, gasification can be employed using material which
would otherwise have been disposed, for instance, biodegradable waste. Added to the above-
mentioned benefits, the high-temperature process purifies the system from corrosive ash particles
such as chloride and potassium, allowing clean gas production. Gasification of fossil fuels,
however, is most commonly used on industrial scales in order to generate electricity [5-10]
Thermogravimetric analysis (TGA) is one of the most frequently used techniques to study the
primary reactions of the decomposition of solids. TGA provides valuable information about char
reactivity under active atmospheres which makes it a useful method to study devolatilization of
biomass gasification. Moreover, quantitative methods can be applied to TGA curves in order to
find kinetic parameters of the thermal events. Knowledge of the kinetics for the thermal
decomposition of the material under study is required for the design of gasifiers and pyrolysis
reactors [11]. During the past few decades many researchers have studied pyrolysis and
gasification characteristics of various materials and established significant information on the
thermal behavior and reaction kinetics. Kumar et al. [1] studied the thermal characteristics of
corn stover using TGA and found that the second phase of pyrolysis was close to first order
reaction. Kasaoka et al. [12] also concluded that in an isothermal experiment, a long-winded
repetition of experimental runs is needed to obtain the kinetic parameters of the Arrhenius
equation. As discussed above, a particular knowledge of the kinetic characteristics of the
gasification process is necessary for comprehending and modeling gasification at industrial scale.
There are several studies on coal gasification kinetics and some on biomass gasification kinetics.
However, the gasification of the organic fraction of municipal solid waste has hardly been
studied at all. The aim of the present work was to study the CO2 gasification reactivity and
kinetic behavior of the so-called organic sludge.

4
2. Experimental
2.1. Materials
The samples used in the present study were obtained from Sobacken; a biogas plant located 8 km
west of Borås. Samples of organic sludge before the biological degradation process in the
fermentation chambers, were taken daily during a week since each day the incoming waste to the
plant was of a different composition. Source of organic waste is given by Sobacken and is
reported in Table 1. Samples of digested sludge, after degradation tank, were also collected three
weeks after the first sampling. Both samples contained a large amount of volatile material, a
significant quantity of ash and only a small amount of fixed carbon. Received materials were put
in to the oven for 48 hours at 105 °C to be dried due to their high water content. Subsequently,
the dried samples were broken into small particles, ground in a cutting mill and then passed
through a sieve with a mesh size of 0.5 mm to minimize mass or heat transfer effects during
pyrolysis and gasification processes. Sludge mixtures were prepared by weighing equal ratios of
samples taken in a week and mixed properly to obtain as homogenous sample as possible.
Therefore, the two sludge samples used in the current study were: mixture of organic sludge
collected during one week from Sobacken waste treatment plant before and after biological
treatment. Prior to the thermochemical characteristics analyses and TGA tests, the two prepared
samples were closely stored in bottles.
Table 1
Sobacken waste source
Waste (tones) Monday Tuesday Wednesday Thursday Friday
House hold 80 80 80 50 80
House hold waste-like, supermarket, large kitchen (schools, hospital)
25 25 - 30 -
Fish sludge 80 - 40 - -
Meat-industry (slaughter, animal foods) 10 25 20 15 20
Dry animal foods (pellet) 4 - - - 5
Representative samples were characterized in terms of proximate and ultimate analysis by ALS
Scandinavia AB. The higher heating values (HHV) of the two sludges were measured by C 200
bombcalorimeter according to the ASTM standards (ASTM D 240, ASTM D 5865).
Decomposition vessel was filled with pure oxygen at a pressure of 3 bar and 1 gram of the sludge
sample placed in a crucible to be ignited. Combustion was carried out inside the vessel and the
5
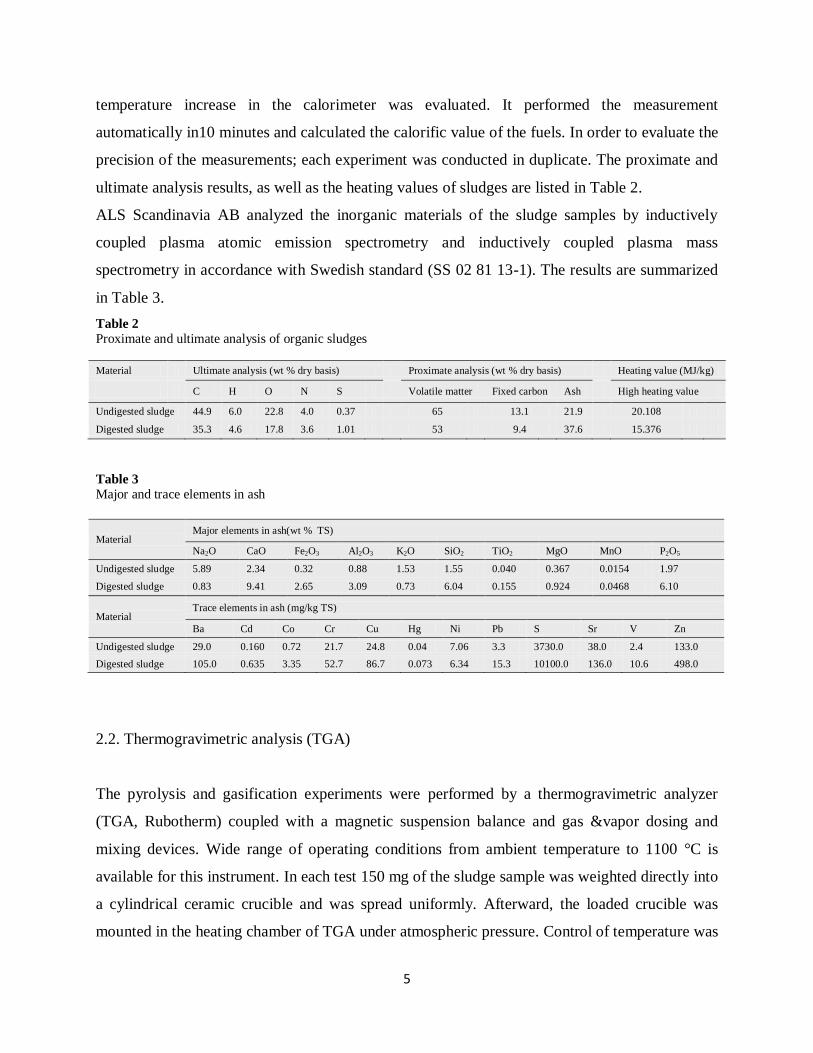
temperature increase in the calorimeter was evaluated. It performed the measurement
automatically in10 minutes and calculated the calorific value of the fuels. In order to evaluate the
precision of the measurements; each experiment was conducted in duplicate. The proximate and
ultimate analysis results, as well as the heating values of sludges are listed in Table 2.
ALS Scandinavia AB analyzed the inorganic materials of the sludge samples by inductively
coupled plasma atomic emission spectrometry and inductively coupled plasma mass
spectrometry in accordance with Swedish standard (SS 02 81 13-1). The results are summarized
in Table 3.
Table 2
Proximate and ultimate analysis of organic sludges
Material Ultimate analysis (wt % dry basis) Proximate analysis (wt % dry basis) Heating value (MJ/kg)
C H O N S Volatile matter Fixed carbon Ash High heating value
Undigested sludge 44.9 6.0 22.8 4.0 0.37 65 13.1 21.9 20.108
Digested sludge 35.3 4.6 17.8 3.6 1.01 53 9.4 37.6 15.376
Table 3
Major and trace elements in ash
Material Major elements in ash(wt % TS)
Na2O CaO Fe2O3 Al2O3 K2O SiO2 TiO2 MgO MnO P2O5
Undigested sludge 5.89 2.34 0.32 0.88 1.53 1.55 0.040 0.367 0.0154 1.97
Digested sludge 0.83 9.41 2.65 3.09 0.73 6.04 0.155 0.924 0.0468 6.10
Material Trace elements in ash (mg/kg TS)
Ba Cd Co Cr Cu Hg Ni Pb S Sr V Zn
Undigested sludge 29.0 0.160 0.72 21.7 24.8 0.04 7.06 3.3 3730.0 38.0 2.4 133.0
Digested sludge 105.0 0.635 3.35 52.7 86.7 0.073 6.34 15.3 10100.0 136.0 10.6 498.0
2.2. Thermogravimetric analysis (TGA)
The pyrolysis and gasification experiments were performed by a thermogravimetric analyzer
(TGA, Rubotherm) coupled with a magnetic suspension balance and gas &vapor dosing and
mixing devices. Wide range of operating conditions from ambient temperature to 1100 °C is
available for this instrument. In each test 150 mg of the sludge sample was weighted directly into
a cylindrical ceramic crucible and was spread uniformly. Afterward, the loaded crucible was
mounted in the heating chamber of TGA under atmospheric pressure. Control of temperature was
6
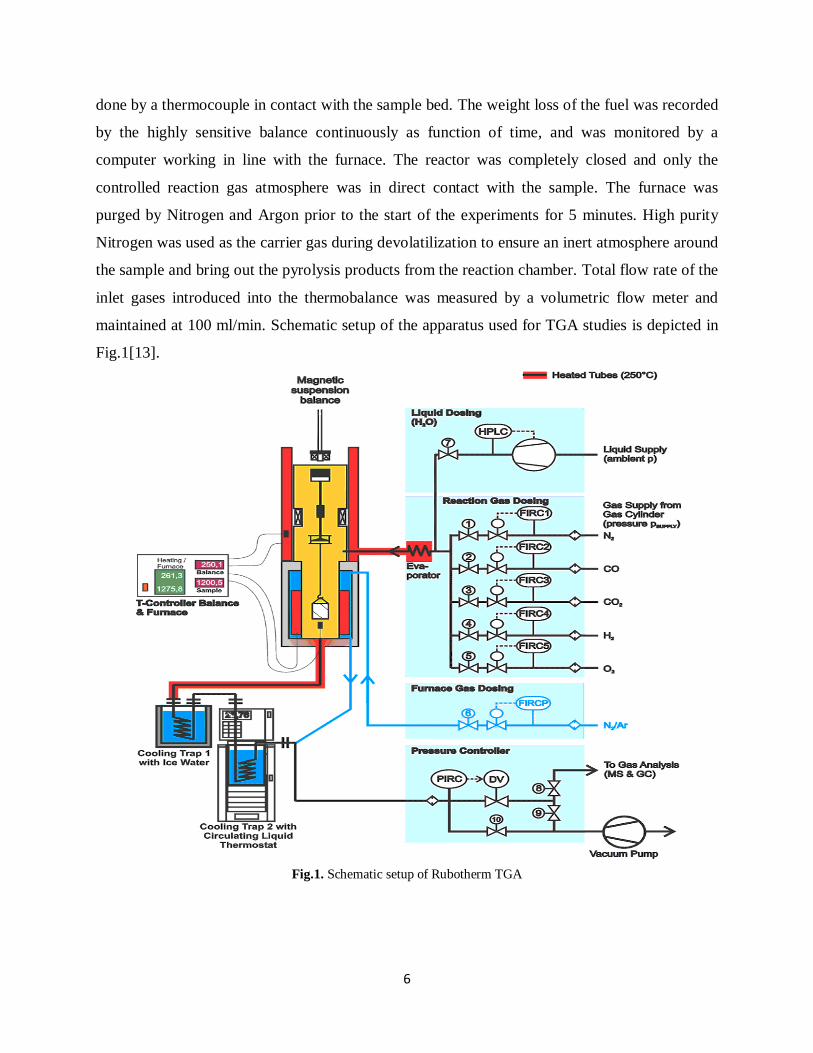
done by a thermocouple in contact with the sample bed. The weight loss of the fuel was recorded
by the highly sensitive balance continuously as function of time, and was monitored by a
computer working in line with the furnace. The reactor was completely closed and only the
controlled reaction gas atmosphere was in direct contact with the sample. The furnace was
purged by Nitrogen and Argon prior to the start of the experiments for 5 minutes. High purity
Nitrogen was used as the carrier gas during devolatilization to ensure an inert atmosphere around
the sample and bring out the pyrolysis products from the reaction chamber. Total flow rate of the
inlet gases introduced into the thermobalance was measured by a volumetric flow meter and
maintained at 100 ml/min. Schematic setup of the apparatus used for TGA studies is depicted in
Fig.1[13].
Fig.1. Schematic setup of Rubotherm TGA
7
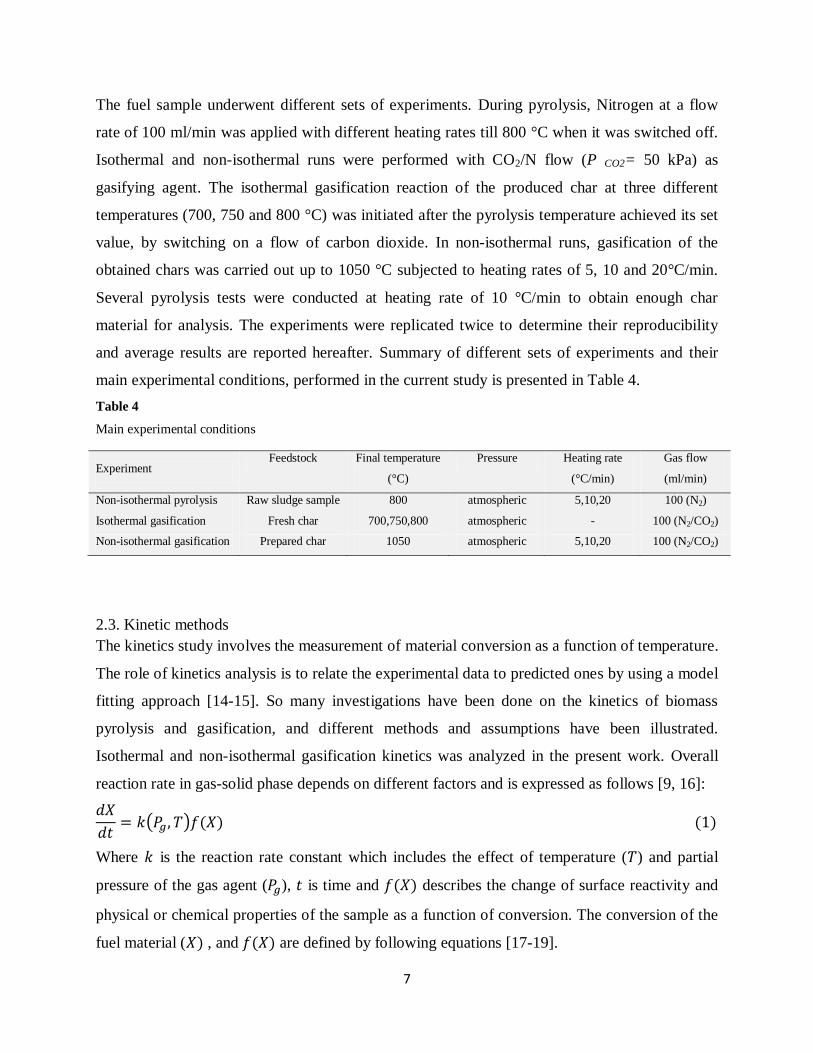
The fuel sample underwent different sets of experiments. During pyrolysis, Nitrogen at a flow
rate of 100 ml/min was applied with different heating rates till 800 °C when it was switched off.
Isothermal and non-isothermal runs were performed with CO2/N flow (P CO2= 50 kPa) as
gasifying agent. The isothermal gasification reaction of the produced char at three different
temperatures (700, 750 and 800 °C) was initiated after the pyrolysis temperature achieved its set
value, by switching on a flow of carbon dioxide. In non-isothermal runs, gasification of the
obtained chars was carried out up to 1050 °C subjected to heating rates of 5, 10 and 20°C/min.
Several pyrolysis tests were conducted at heating rate of 10 °C/min to obtain enough char
material for analysis. The experiments were replicated twice to determine their reproducibility
and average results are reported hereafter. Summary of different sets of experiments and their
main experimental conditions, performed in the current study is presented in Table 4.
Table 4
Main experimental conditions
2.3. Kinetic methods
The kinetics study involves the measurement of material conversion as a function of temperature.
The role of kinetics analysis is to relate the experimental data to predicted ones by using a model
fitting approach [14-15]. So many investigations have been done on the kinetics of biomass
pyrolysis and gasification, and different methods and assumptions have been illustrated.
Isothermal and non-isothermal gasification kinetics was analyzed in the present work. Overall
reaction rate in gas-solid phase depends on different factors and is expressed as follows [9, 16]:
Where is the reaction rate constant which includes the effect of temperature ( ) and partial
pressure of the gas agent ( ), is time and describes the change of surface reactivity and
physical or chemical properties of the sample as a function of conversion. The conversion of the
fuel material ( , and are defined by following equations [17-19].
Experiment Feedstock Final temperature
(°C)
Pressure Heating rate
(°C/min)
Gas flow
(ml/min)
Non-isothermal pyrolysis Raw sludge sample 800 atmospheric 5,10,20 100 (N2)
Isothermal gasification Fresh char 700,750,800 atmospheric - 100 (N2/CO2)
Non-isothermal gasification Prepared char 1050 atmospheric 5,10,20 100 (N2/CO2)
8
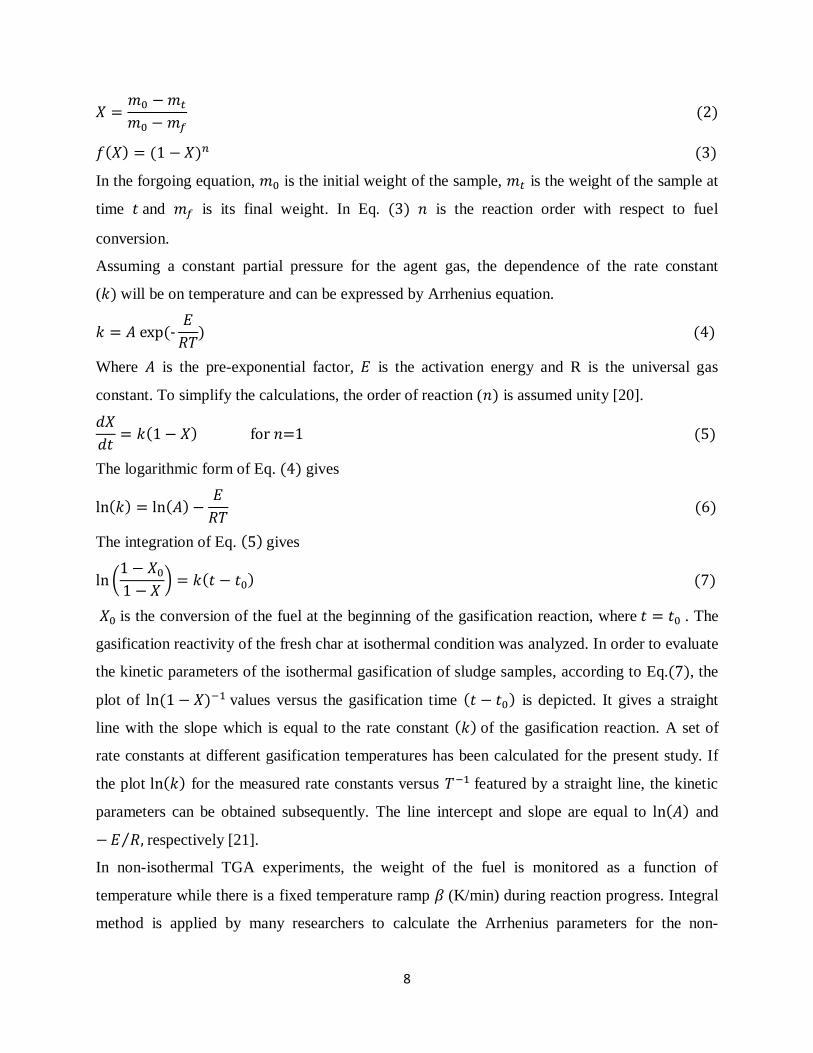
In the forgoing equation, is the initial weight of the sample, is the weight of the sample at
time and is its final weight. In Eq. is the reaction order with respect to fuel
conversion.
Assuming a constant partial pressure for the agent gas, the dependence of the rate constant
( will be on temperature and can be expressed by Arrhenius equation.
Where is the pre-exponential factor, is the activation energy and R is the universal gas
constant. To simplify the calculations, the order of reaction ( is assumed unity [20].
The logarithmic form of Eq. gives
The integration of Eq. gives
is the conversion of the fuel at the beginning of the gasification reaction, where . The
gasification reactivity of the fresh char at isothermal condition was analyzed. In order to evaluate
the kinetic parameters of the isothermal gasification of sludge samples, according to Eq. , the
plot of values versus the gasification time is depicted. It gives a straight
line with the slope which is equal to the rate constant of the gasification reaction. A set of
rate constants at different gasification temperatures has been calculated for the present study. If
the plot for the measured rate constants versus featured by a straight line, the kinetic
parameters can be obtained subsequently. The line intercept and slope are equal to and
respectively [21].
In non-isothermal TGA experiments, the weight of the fuel is monitored as a function of
temperature while there is a fixed temperature ramp (K/min) during reaction progress. Integral
method is applied by many researchers to calculate the Arrhenius parameters for the non-

9
isothermal pyrolysis or gasification of the fuels [22-27]. For a constant heating rate, , we can
write [28]
Conversion can be written as a function of temperature as follows [3]
Now, substituting Eq. and into , rearranging gives
Integration of Eq. with temperature limits from to and conversion limits from to
results in the following expression
Integration of left side of Eq. becomes
The right hand side of Eq. cannot be integrated directly. Several assumptions and
approximation solutions to the integral temperature term have been applied by Singh[29]. The
first assumption is to take therefore the right hand side of Eq. can be expressed as
following
Supposing
Integral method is based on the approximation of temperature integral made by Coats and
Redfern [30] which is widely accepted and used. They have used series of expansion to solve the
right hand side of the above integral. Taking only the first three terms of the approximation
results in the following equation
10
Substituting Eq. and in
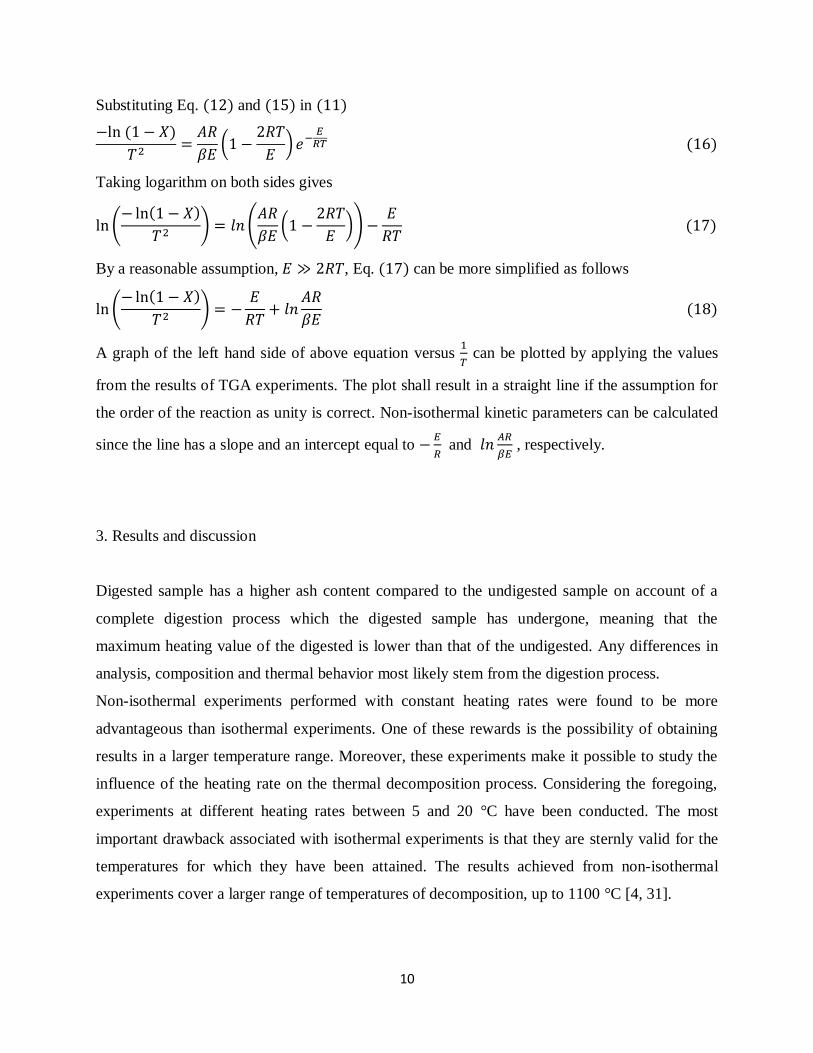
Taking logarithm on both sides gives
By a reasonable assumption, , Eq. can be more simplified as follows
A graph of the left hand side of above equation versus
can be plotted by applying the values
from the results of TGA experiments. The plot shall result in a straight line if the assumption for
the order of the reaction as unity is correct. Non-isothermal kinetic parameters can be calculated
since the line has a slope and an intercept equal to
and
, respectively.
3. Results and discussion
Digested sample has a higher ash content compared to the undigested sample on account of a
complete digestion process which the digested sample has undergone, meaning that the
maximum heating value of the digested is lower than that of the undigested. Any differences in
analysis, composition and thermal behavior most likely stem from the digestion process.
Non-isothermal experiments performed with constant heating rates were found to be more
advantageous than isothermal experiments. One of these rewards is the possibility of obtaining
results in a larger temperature range. Moreover, these experiments make it possible to study the
influence of the heating rate on the thermal decomposition process. Considering the foregoing,
experiments at different heating rates between 5 and 20 °C have been conducted. The most
important drawback associated with isothermal experiments is that they are sternly valid for the
temperatures for which they have been attained. The results achieved from non-isothermal
experiments cover a larger range of temperatures of decomposition, up to 1100 °C [4, 31].
11
3.1. Thermal analysis of the sludge heating process
3.1.1. Drying
This step can be observed in burning profiles representing a loss of mass between ambient
temperature at the outset of the experiment and about 140°C, corresponding to a loss of moisture
and the very light volatile matters. In most thermogravimetry analyses researchers often neglect
this stage since the moisture content of the sample is too low, so this stage will not be addressed
in this work. Samples in the present study had the moisture content of 2-3 wt%.
3.1.2. Pyrolysis
This stage starts at about 150 °C for the digested sample and about 180 °C for the undigested.
The digested sludge seems to decompose more easily compared to the other sample. TG curves
show that the decomposition rate starts to decrease at about 340°C for the undigested and about
310 °C for the digested. The aforementioned phenomenon can be justified considering the fact
that within the temperature ranges of 150-310 °C (for the digested) and 180-340 °C (for the
undigested) semi-volatile materials start to decompose and as decomposition proceeds organic
polymers begin to devolatilize as they need higher temperatures. Decomposition stops at 490 °C
for the digested and at 460 °C for the digested. As discussed earlier, the samples used in this
work are of high volatile materials constituting 53 wt% (dry basis) of the digested sample and
65 wt% (dry basis) of the undigested.
3.1.3. Non-isothermal gasification
The starting temperature for the gasification of the samples with carbon dioxide was determined
by non-isothermal thermogravimetric measurements. Gasification is the result of chemical
reaction between carbon in the char, carbon dioxide in the gasifier vessel as well as chemical
reaction between the resulting gases. In this study gasification reaction is carried out in the
absence of oxygen. By the above, the mass loss detected in non-isothermal thermogravimetric
curve is attributed to the reaction of fixed carbon present in the char with CO2 (g) to produce
CO (g) according to Boudouard reaction as follows [32]

12
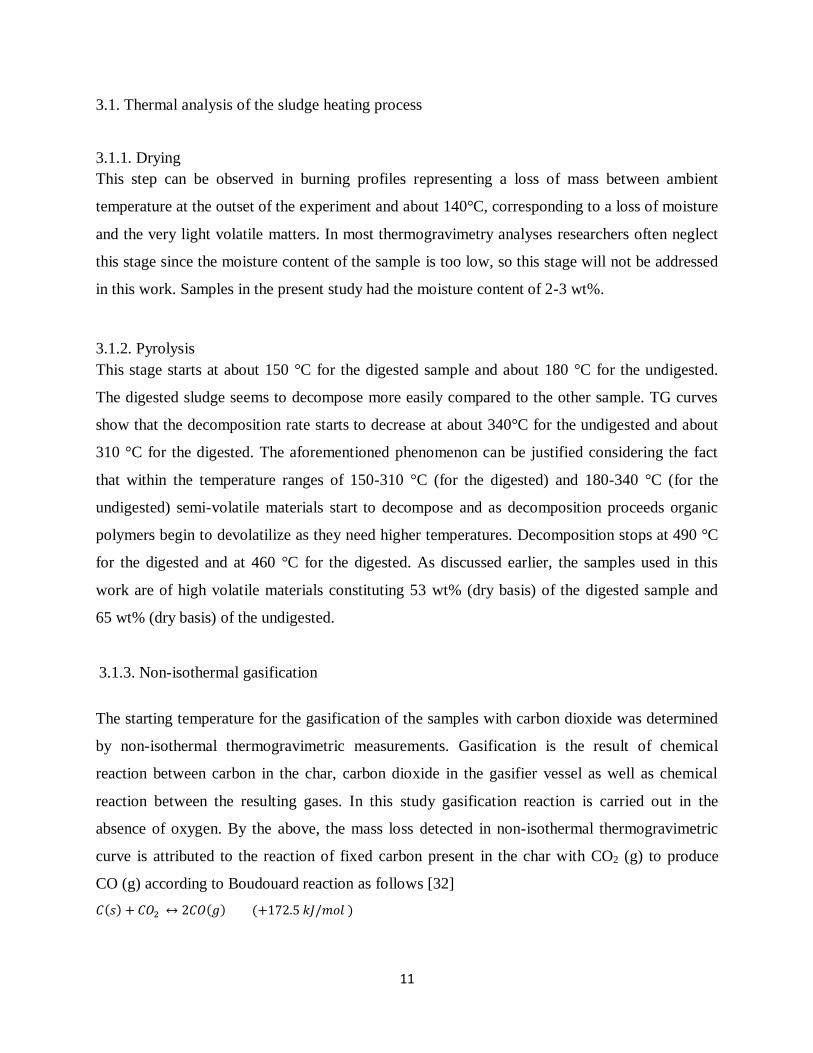
The effect of heating rate on the thermal behavior of the two sludges, digested and undigested,
during gasification process is illustrated in Table 5 and Fig. 2.
Fig.2 (a) which plots the mass loss of the digested sample versus temperature shows the mass
loss for both samples at different heating rates up to 1100°C. As illustrated in the figure, the total
mass is almost linearly decreasing as temperature increases. Moreover, it can also be found from
the figure that the main mass loss starts at around 630°C whereas we can hardly see any further
loss of mass at 780°C (for 5 and 10°C/min heating rates) and 850°C ( for 20°C/min heating rate).
It is noteworthy that the total mass loss for all heating rates is almost the same but distributed
over a different temperature range. (The highest mass loss is observed when the heating rate is
5 °C/min)
20
40
60
80
100
600 700 800 900 1000 1100
Wei
gh
t%
Temperature/°C
β= 5 °C/min
β= 10 °C/min
β= 20 °C/min
(a)
13
Fig. 2. Weight loss (%) of (a) digested and (b) undigested sludge.
As it can be seen from Fig.2 (b) there is a noticeable mass loss after the gasification region
which is equivalent to about 30 wt% of the original fresh char produced after pyrolysis. In order
to figure out what was happening, the ash samples taken at 850°C and 1050 °C, i.e. before and
after the phenomenon, were subjected to SEM analysis (area, spot and mapping). The results
showed that the amount of some elements, such as Na, K, Ca and Cl had decreased to a great
extent.
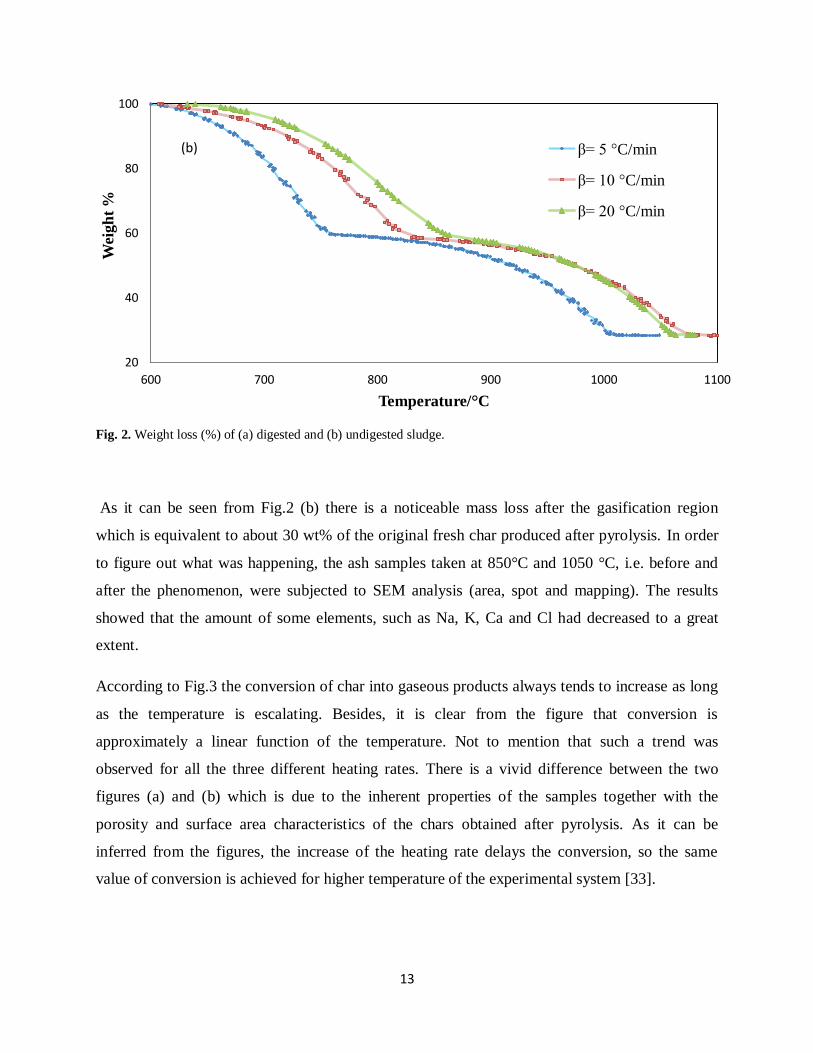
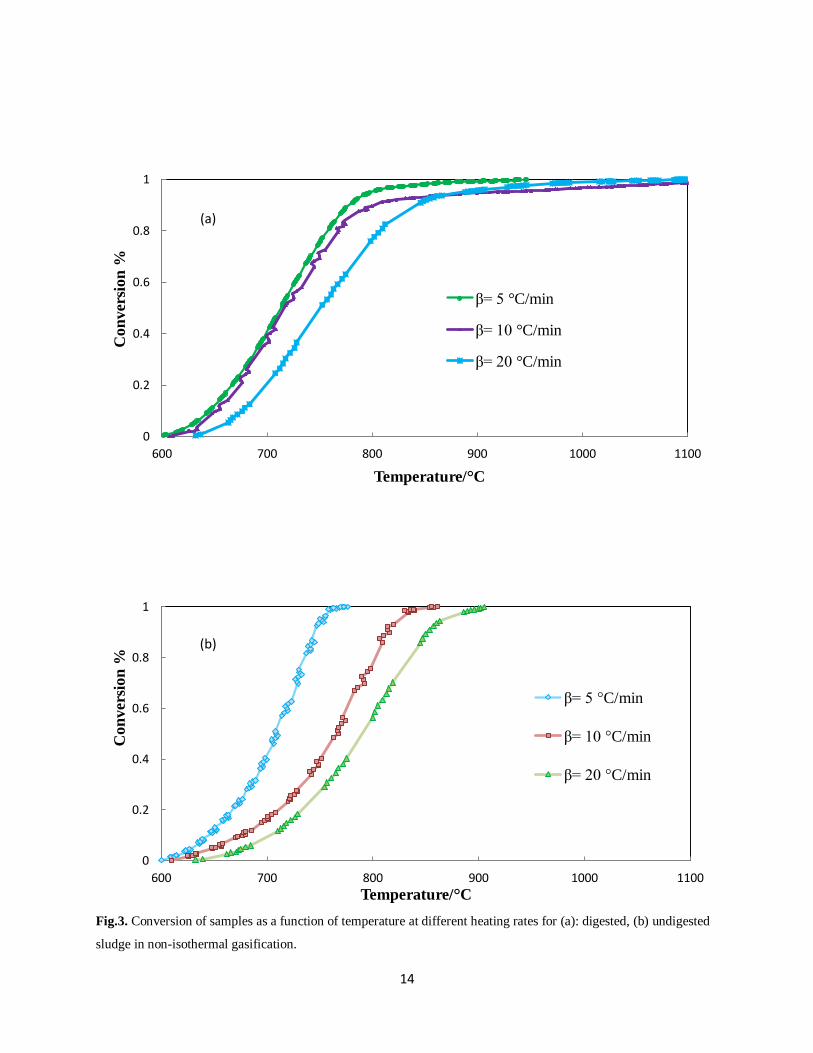
According to Fig.3 the conversion of char into gaseous products always tends to increase as long
as the temperature is escalating. Besides, it is clear from the figure that conversion is
approximately a linear function of the temperature. Not to mention that such a trend was
observed for all the three different heating rates. There is a vivid difference between the two
figures (a) and (b) which is due to the inherent properties of the samples together with the
porosity and surface area characteristics of the chars obtained after pyrolysis. As it can be
inferred from the figures, the increase of the heating rate delays the conversion, so the same
value of conversion is achieved for higher temperature of the experimental system [33].
20
40
60
80
100
600 700 800 900 1000 1100
Wei
gh
t %
Temperature/°C
β= 5 °C/min
β= 10 °C/min
β= 20 °C/min
(b)
14
Fig.3. Conversion of samples as a function of temperature at different heating rates for (a): digested, (b) undigested
sludge in non-isothermal gasification.
0
0.2
0.4
0.6
0.8
1
600 700 800 900 1000 1100
Con
ver
sion
%
Temperature/°C
β= 5 °C/min
β= 10 °C/min
β= 20 °C/min
0
0.2
0.4
0.6
0.8
1
600 700 800 900 1000 1100
Con
ver
sion
%
Temperature/°C
β= 5 °C/min
β= 10 °C/min
β= 20 °C/min
(a)
(b)

15
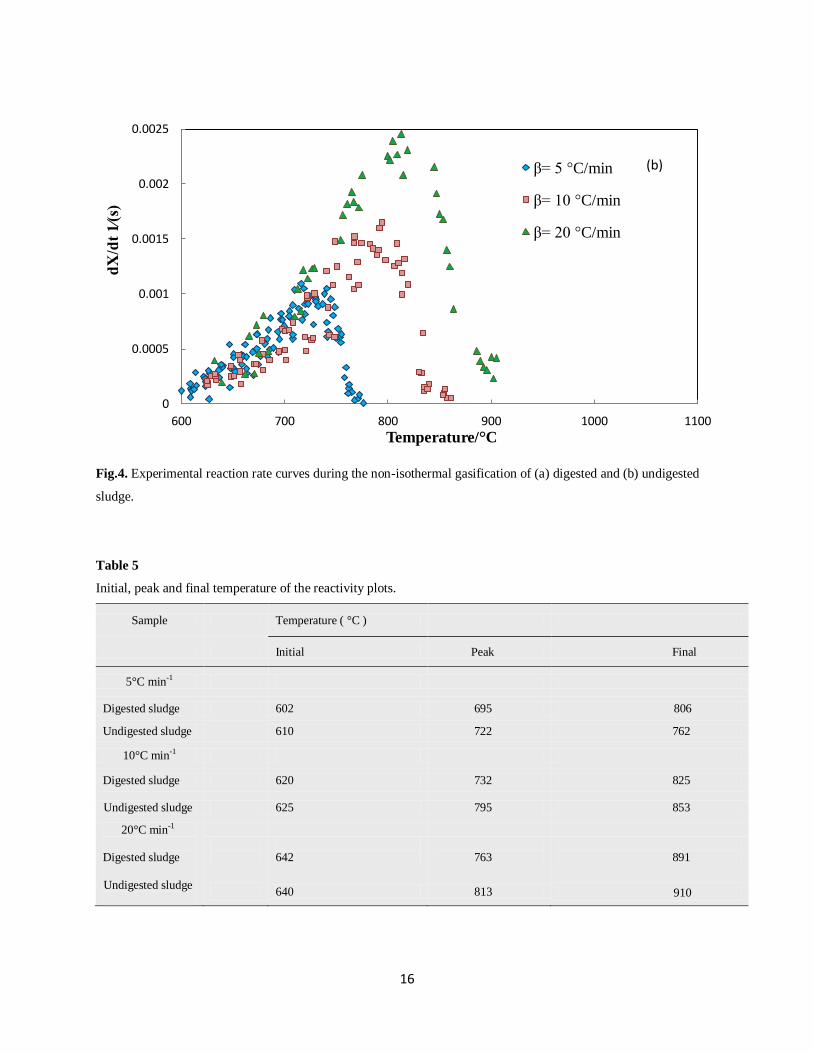
Fig.4 plots data (or conversion rate, calculated using the parameters obtained from the
data at the three heating rates), versus temperature for both samples. According to Fig.4.(a)
which shows the conversion rate for the digested sample, the temperature at which maximum
mass loss rate occurs (Tmax) is shifted upwards as a result of increased heating rates. 705, 730 and
760°C are Tmax’s corresponding to 5, 10 and 20°C/min heating rates respectively. The maximum
rate of mass loss for the digested sample increased by increasing the heating rate. The values of
for β = 5, 10 and 20 °C/min are 0.0008, 0.0014 and 0.0022 s-1
respectively.
For the undigested sample, however, a maximum of 0.002 s-1
is observed in for β = 20
°C/min and a minimum of 0.001 s-1
for β = 5 °C/min. Agrawal [34-35] believes that the values of
versus T calculated at different β’s can show if the process can be described as a simple
reaction. The width of the peak specifies the range of temperatures for which the reaction occurs,
and an increase of this range therefore shows a decrease in the activation energy [33].
0
0.0005
0.001
0.0015
0.002
0.0025
600 700 800 900 1000 1100
dX
/dt
1⁄(s)
Temperature/°C
β= 20 °C/min
β= 10 °C/min
β= 5 °C/min
(a)
16
Fig.4. Experimental reaction rate curves during the non-isothermal gasification of (a) digested and (b) undigested
sludge.
Table 5
Initial, peak and final temperature of the reactivity plots.
Sample Temperature ( °C )
Initial Peak Final
5°C min-1
Digested sludge 602 695 806
Undigested sludge
610 722 762
10°C min-1
Digested sludge 620 732 825
Undigested sludge 625 795 853
20°C min-1
Digested sludge
642
763
891
Undigested sludge
640 813 910
0
0.0005
0.001
0.0015
0.002
0.0025
600 700 800 900 1000 1100
dX
/dt
1⁄(
s)
Temperature/°C
β= 5 °C/min
β= 10 °C/min
β= 20 °C/min
(b)
17
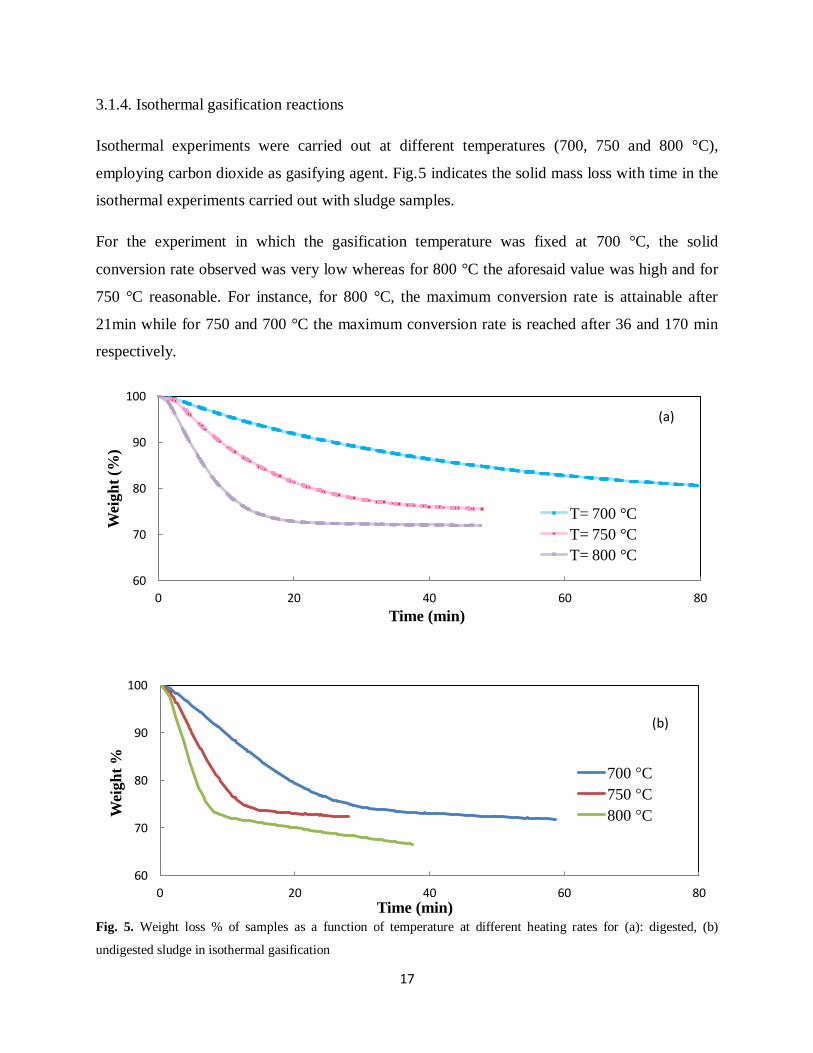
3.1.4. Isothermal gasification reactions
Isothermal experiments were carried out at different temperatures (700, 750 and 800 °C),
employing carbon dioxide as gasifying agent. Fig.5 indicates the solid mass loss with time in the
isothermal experiments carried out with sludge samples.
For the experiment in which the gasification temperature was fixed at 700 °C, the solid
conversion rate observed was very low whereas for 800 °C the aforesaid value was high and for
750 °C reasonable. For instance, for 800 °C, the maximum conversion rate is attainable after
21min while for 750 and 700 °C the maximum conversion rate is reached after 36 and 170 min
respectively.
Fig. 5. Weight loss % of samples as a function of temperature at different heating rates for (a): digested, (b)
undigested sludge in isothermal gasification
60
70
80
90
100
0 20 40 60 80
Wei
gh
t (%
)
Time (min)
T= 700 °C
T= 750 °C
T= 800 °C
60
70
80
90
100
0 20 40 60 80
Wei
gh
t %
Time (min)
700 °C
750 °C
800 °C
(a)
(b)
18
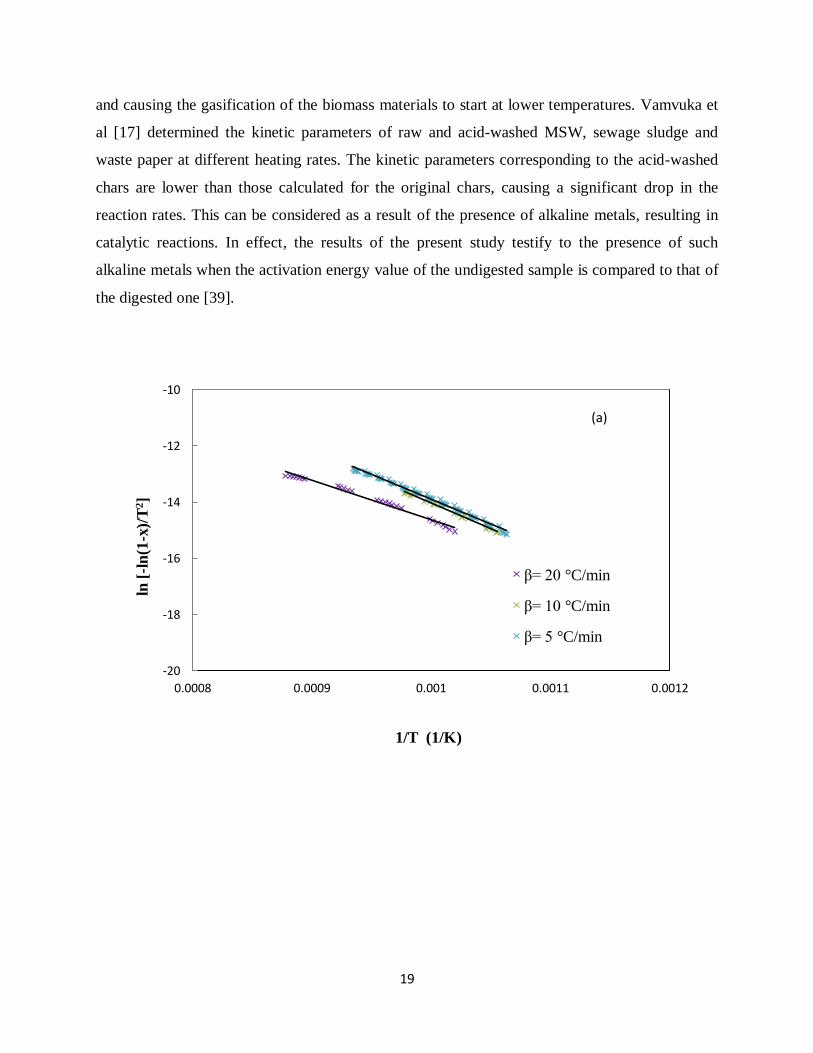
3.2. Non-isothermal gasification kinetics
The kinetic data of sludge samples for non-isothermal gasification were analyzed assuming first
order kinetics. Different temperature ranges were applied depending on the heating rate. Fig.6.
shows the plot of versus which indicates satisfactory correlation with
R2 coefficient ranging from 0.9903 to 0.9958 for undigested sludge and 0.9784 to 0.9917 for
digested sludge over the temperature range used, which supports the assumption of first order
kinetics mentioned earlier. It was found that each TG curve could be well described by the
integral method resulting in correlation coefficients close to the unity. The pre-exponential
factors and the corresponding activation energy values from the application of non-isothermal
gasification in the 10-90% conversion range are presented in Table 6. The activation energy
depends on the heating rate as shown in Table. 6. There is a negligible difference between the
activation energy values 147 kJ/mol and 150 kJ/mol (calculated for the digested sample)
corresponding to the heating rates 5 and 10°C/min, whereas the activation energy increases to
value 172 kJ/mol when the heating rate is 20°C/min. According to many other studies [36-37] it
is sensible to consider the following conclusion as a rule of thumb: The activation energy always
increases as the heating rate increases. The same rule also applies to pre-exponential factors
meaning that the pre-exponential factors will increase when the heating rate increases. This is
assigned to the effect of heat transfer at the different heating rates, resulting in delayed reaction.
To the authors’ best knowledge, no studies have been published regarding the gasification of the
sample under study (organic fraction of the municipal solid waste). Activation energy values for
the high temperature region varying between 180 and 370 kJ/ mol are typical of CO2 gasification
of biomass chars and show a chemically controlled process. However, the results of the present
work can be compared with available data for different types of comparable carbonaceous fuels.
Zhongsuo Liu et al [38] reported the activation energy values of 153.06 and 157.95 kJ/mol at 10
and 20 °C/min respectively for graphite non-isothermal gasification with CO2 as gasifying agent.
The values obtained in the present study are all in close agreement with those mentioned above.
The obtained activation energy values for undigested sludge are higher than those of the digested
one. In accordance with SEM analysis of the undigested sludge, the results imply that alkaline
(Na, K) and alkaline earth (Ca, Mg) metals present in carbonate and sulphate minerals, acted as
catalysts throughout the gasification process by enhancing the reactivity of undigested sludge
19
and causing the gasification of the biomass materials to start at lower temperatures. Vamvuka et
al [17] determined the kinetic parameters of raw and acid-washed MSW, sewage sludge and
waste paper at different heating rates. The kinetic parameters corresponding to the acid-washed
chars are lower than those calculated for the original chars, causing a significant drop in the
reaction rates. This can be considered as a result of the presence of alkaline metals, resulting in
catalytic reactions. In effect, the results of the present study testify to the presence of such
alkaline metals when the activation energy value of the undigested sample is compared to that of
the digested one [39].
-20
-18
-16
-14
-12
-10
0.0008 0.0009 0.001 0.0011 0.0012
ln [
-ln
(1-x
)/T
2]
1/T (1/K)
β= 20 °C/min
β= 10 °C/min
β= 5 °C/min
(a)

20
Fig .6. Arrhenius plot for non-isothermal gasification of (a) digested sludge and (b) undigested sludge.
Table 6
Calculated kinetic parameters of digested and undigested sludge for non-isothermal gasification.
Heating rate, °C/min Temp. range, °C E, kJ/mol A,min-1 R2
Undigested sludge
5 630-750 141 3.23E+05 0.9903
10 680-720 148 8.97E+05 0.9906
20 700-860 168 19.26E+05 0.9958
Digested sludge
5 625-790 147 1.05E+05 0.9917
10 645-795 150 5.52E+05 0.9802
20 660-710 172 2.65E+06 0.9784
-20
-18
-16
-14
-12
-10
0.0008 0.0009 0.001 0.0011 0.0012
ln [
-ln
(1-x
)/T
2]
1/T (1/K)
β= 20 °C/min
β= 5 °C/min
β= 10 °C/min
(a)
(b)

21
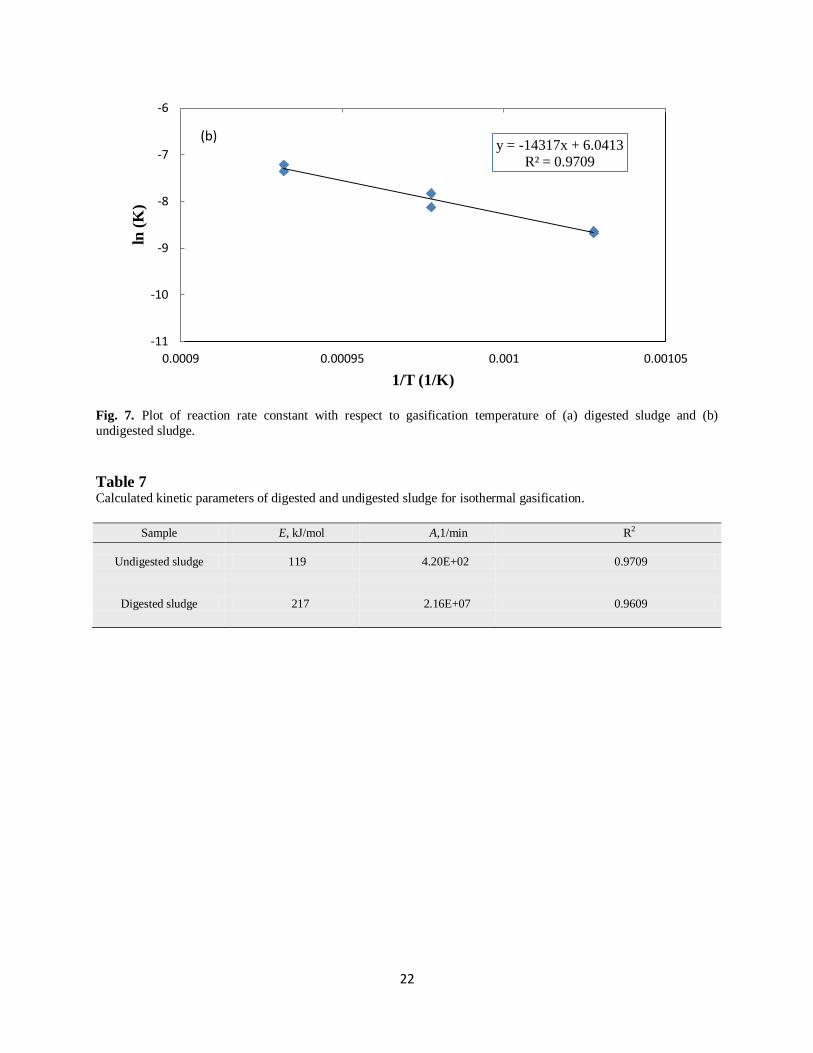
3.3. Isothermal gasification kinetics
A kinetic analysis of the CO2 gasification of the two samples was carried out at constant
temperature. The values of were calculated from the TG experiments and plotted against
for different temperatures (700,750 and 800°C). The plots gave a straight line with the slope
equal to the rate constant . The distributions indicate that the values of R2
of the regression
lines are always larger than 0.97, reflecting that n=1 is an appropriate value to approach the rate
constant of organic sludge. Three rate constants corresponding to the three gasification
temperatures were obtained from Fig. 7. Consequently, the activation energy values of the
isothermal gasification of digested and undigested sludge were 217 and 119 kJ/mol respectively.
The values of activation energy, pre-exponential factor and the correlation coefficient in the
chemical kinetics of the two samples from the present study are tabulated in Table7. Similar to
what was discussed earlier regarding the non-isothermal gasification; the activation energy for
the digested sample turns out to be higher than that of the undigested sample which is due to the
catalytic effect of mineral content incorporated in the undigested sludge.
y = -26136x + 16.889
R² = 0.9609
-11
-10
-9
-8
-7
-6
0.0009 0.00095 0.001 0.00105
ln (
K)
1/T (1/K)
(a)
22
Fig. 7. Plot of reaction rate constant with respect to gasification temperature of (a) digested sludge and (b)
undigested sludge.
Table 7 Calculated kinetic parameters of digested and undigested sludge for isothermal gasification.
Sample E, kJ/mol A,1/min R2
Undigested sludge 119 4.20E+02 0.9709
Digested sludge 217 2.16E+07 0.9609
y = -14317x + 6.0413 R² = 0.9709
-11
-10
-9
-8
-7
-6
0.0009 0.00095 0.001 0.00105
ln (
K)
1/T (1/K)
(b)
23
4. Conclusion
The thermogravimetry experiments were interpreted regarding the reactivity of the samples.
Isothermal and non-isothermal data were used to evaluate the kinetic parameters. The
determination of the Arrhenius parameters (activation energy and pre-exponential factor) of the
gasification of two types of sludge, namely digested and undigested, was analyzed by isothermal
and non-isothermal thermogravimetry. The activation energy values of the gasification of both
samples by carbon dioxide were determined by integral method, which required analytical data
taken from a sequence of experiments at different heating rates. The calculated activation
energies were found to increase with the increase of heating rate due to heat and mass transfer
effects. The obtained values of the activation energy are in close agreement with a first order
reaction. In reality, deviations of the experimental data from the straight line trend indicate the
degree of inaccuracy of the assumption of a first-order reaction. In this study, plots of
were prepared for the samples, and the activation energies were
determined from the best-fit lines. The assumption of a first-order reaction appears reasonable:
the regression correlation factor exceeded 0.97.
There is a raise in reaction temperatures corresponding with the maximum mass loss with
increasing heating rate. The temperature at which the maximum mass rate occurs (in non-
isothermal gasification) is higher for the undigested sludge in about 40°C, compared to that of
the digested sample, which confirms the catalytic effect of mineral content. It is apparent that
mineral content of the undigested sludge plays a fundamental role in carbon evolution and
reactions. The activation energies of the non-isothermal gasification of digested and undigested
sludge were 147-172 and 141-168kJ/mol, respectively.

24
Acknowledgement
The special thank goes to our supportive supervisor Prof. Dr. T. Richards whose help,
stimulating suggestions and encouragement helped us throughout the thesis whilst allowing us
the room to work in our own way. One simply could not wish for a better or friendlier
supervisor. Our deepest appreciation is to Dr. Anita Pettersson and our program director Peter
Therning for their support and guidance during the project. In our daily work we have been
blessed with a friendly and cheerful group of fellow students, Abas Mohsenzadeh and Farzad
Moradian who indeed helped us.
We also offer our sincerest gratitude to our parents for their never-ending support and the fact
that they have always had to bear the burden of our frustration and rages against the world and
intractable TGA apparatus with composure and friendship.
25
References
1. Kumar, A., et al., Thermogravimetric characterization of corn stover as gasification and
pyrolysis feedstock. Biomass and Bioenergy, 2008. 32(5): p. 460-467.
2. Lv, D., et al., Effect of cellulose, lignin, alkali and alkaline earth metallic species on
biomass pyrolysis and gasification. Fuel Processing Technology, 2010. 91(8): p. 903-
909.
3. Brems, A., et al., Thermogravimetric pyrolysis of waste polyethylene-terephthalate and
polystyrene: A critical assessment of kinetics modelling. Resources, Conservation and
Recycling, 2011. 55(8): p. 772-781.
4. Calvo, L.F., et al., Heating process characteristics and kinetics of sewage sludge in
different atmospheres. Thermochimica Acta, 2004. 409(2): p. 127-135.
5. Park, Y.-H., et al., Pyrolysis characteristics and kinetics of oak trees using
thermogravimetric analyzer and micro-tubing reactor. Bioresource Technology, 2009.
100(1): p. 400-405.
6. Cetin, E., R. Gupta, and B. Moghtaderi, Effect of pyrolysis pressure and heating rate on
radiata pine char structure and apparent gasification reactivity. Fuel, 2005. 84(10): p.
1328-1334.
7. Mani, T., N. Mahinpey, and P. Murugan, Reaction kinetics and mass transfer studies of
biomass char gasification with CO2. Chemical Engineering Science, 2011. 66(1): p. 36-
41.
8. Min, F., et al., An experimental investigation into the gasification reactivity and structure
of agricultural waste chars. Journal of Analytical and Applied Pyrolysis, 2011. 92(1): p.
250-257.
9. Fermoso, J., et al., Kinetic models comparison for non-isothermal steam gasification of
coal–biomass blend chars. Chemical Engineering Journal, 2010. 161(1-2): p. 276-284.
10. Zhu, W., W. Song, and W. Lin, Catalytic gasification of char from co-pyrolysis of coal
and biomass. Fuel Processing Technology, 2008. 89(9): p. 890-896.
11. Reverte, C., J.-L. Dirion, and M. Cabassud, Kinetic model identification and parameters
estimation from TGA experiments. Journal of Analytical and Applied Pyrolysis, 2007.
79(1-2): p. 297-305.

26
12. Kasaoka, S., Y. Sakata, and M. Shimada, Effects of coal carbonization conditions on rate
of steam gasification of char. Fuel, 1987. 66(5): p. 697-701.
13. Merrow Scientific. 2011 [cited 2011 December 06]; Available from:
http://www.merrowscientific.com/laboratory-products/high-pressure-tga/.
14. Sharma, S. and A.K. Ghoshal, Study of kinetics of co-pyrolysis of coal and waste LDPE
blends under argon atmosphere. Fuel, 2010. 89(12): p. 3943-3951.
15. Brown, M.E., Introduction to Thermal Analysis: Techniques and Applications. 1988,
London: Chapman and Hall.
16. Lu, G.Q. and D.D. Do, Comparison of structural models for high-ash char gasification.
Carbon, 1994. 32(2): p. 247-263.
17. vamvuka, D., E. Karouki, and S. Sfakiotakis, Gasification of waste biomass chars by
carbon dioxide via thermogravimetry. Part I: Effect of mineral matter. Fuel, 2011. 90(3):
p. 1120-1127.
18. Huang, Y.F., et al., Pyrolysis of biomass by thermal analysis–mass spectrometry (TA–
MS). Bioresource Technology, 2011. 102(3): p. 3527-3534.
19. Murugan, P., et al., Pyrolysis and combustion kinetics of Fosterton oil using
thermogravimetric analysis. Fuel, 2009. 88(9): p. 1708-1713.
20. Syed, S., et al., Kinetics of pyrolysis and combustion of oil shale sample from
thermogravimetric data. Fuel, 2011. 90(4): p. 1631-1637.
21. Chen, W.-H. and P.-C. Kuo, Isothermal torrefaction kinetics of hemicellulose, cellulose,
lignin and xylan using thermogravimetric analysis. Energy, 2011. 36(11): p. 6451-6460.
22. Jaber, J.O. and S.D. Probert, Non-isothermal thermogravimetry and decomposition
kinetics of two Jordanian oil shales under different processing conditions. Fuel
Processing Technology, 2000. 63(1): p. 57-70.
23. Al-Harahsheh, M., et al., Effect of demineralization and heating rate on the pyrolysis
kinetics of Jordanian oil shales. Fuel Processing Technology, 2011. 92(9): p. 1805-1811.
24. Damartzis, T., et al., Thermal degradation studies and kinetic modeling of cardoon
(Cynara cardunculus) pyrolysis using thermogravimetric analysis (TGA). Bioresource
Technology, 2011. 102(10): p. 6230-6238.

27
25. Kantarelis, E., et al., Thermochemical treatment of E-waste from small household
appliances using highly pre-heated nitrogen-thermogravimetric investigation and
pyrolysis kinetics. Applied Energy, 2011. 88(3): p. 922-929.
26. Calvo, L.F., et al., Heating process characteristics and kinetics of rice straw in different
atmospheres. Fuel Processing Technology, 2004. 85(4): p. 279-291.
27. Shao, J., et al., Catalytic effect of metal oxides on pyrolysis of sewage sludge. Fuel
Processing Technology, 2010. 91(9): p. 1113-1118.
28. Luangkiattikhun, P., C. Tangsathitkulchai, and M. Tangsathitkulchai, Non-isothermal
thermogravimetric analysis of oil-palm solid wastes. Bioresource Technology, 2008.
99(5): p. 986-997.
29. Singh, A., A Study of Reaction Kinetics for Thermochemical Conversion of Rice Straw.
1996, University of California: Davis.
30. Coats, A.W. and J.P. Redfern, Kinetic Parameters from Thermogravimetric Data. Nature,
1964. 201(4914): p. 68-69.
31. Scott, S.A., et al., Thermogravimetric measurements of the kinetics of pyrolysis of dried
sewage sludge. Fuel, 2006. 85(9): p. 1248-1253.
32. Higman, c., van der burg,m., Gasification. 2003, Amesterdam.
33. Ceamanos, J., et al., Kinetics of pyrolysis of high density polyethylene. Comparison of
isothermal and dynamic experiments. Journal of Analytical and Applied Pyrolysis, 2002.
65(2): p. 93-110.
34. Ravindra K, A., Analysis of non-isothermal reaction kinetics: Part 2. Complex reactions.
Thermochimica Acta, 1992. 203(0): p. 111-125.
35. Ravindra K, A., Analysis of non-isothermal reaction kinetics: Part 1. Simple reactions.
Thermochimica Acta, 1992. 203(0): p. 93-110.
36. Ollero, P., et al., The CO2 gasification kinetics of olive residue. Biomass and Bioenergy,
2003. 24(2): p. 151-161.
37. Marquez-Montesinos, F., et al., CO2 and steam gasification of a grapefruit skin char.
Fuel, 2002. 81(4): p. 423-429.

28
38. Liu, Z., et al., Arrhenius parameters determination in non-isothermal conditions for the
uncatalyzed gasification of carbon by carbon dioxide. Thermochimica Acta, 2011. 512(1-
2): p. 1-4.
39. Haykiri-Acma, H., S. Yaman, and S. Kucukbayrak, Gasification of biomass chars in
steam–nitrogen mixture. Energy Conversion and Management, 2006. 47(7-8): p. 1004-
1013.