Thermal Simulations of Wire Profile Monitors in ISIS ... · THERMAL SIMULATIONS OF WIRE PROFILE...
3
THERMAL SIMULATIONS OF WIRE PROFILE MONITORS IN ISIS EXTRACTED PROTON BEAMLINE 1 D. W. Posthuma de Boer * , A. Pertica, ISIS, STFC, Rutherford Appleton Laboratory, Oxfordshire, OX11 0QX, UK Abstract Wire scanners and secondary emission (SEM) grids are used for measurements of transverse beam profile at the ISIS neutron and muon source. Silicon carbide-coated carbon fibre wires are used in profile monitors throughout the ISIS accelerator. One such SEM grid is currently installed close to the target in Extracted Proton Beamline 2 (EPB2) and is intercepted by the 800 MeV proton beam at a repetition rate of 10 Hz. Future profile measurements will require another of these monitors to be installed close to the target in EPB1; intercepted with a repetition rate of 40 Hz. Wires intercepting the ion beam are heated due to the de- position of beam-energy. Thermal simulations for the higher repetition rate were performed using ANSYS and a numeri- cal code. The numerical code was then expanded to include various beam, wire and material properties. Assumptions for temperature dependent material emissivities and heat capaci- ties were included in the simulation. Estimated temperatures due to the energy deposited by protons, and approximate values of deposited energy from the expected neutron flux are presented. The effects on wire-temperature of various beam and wire parameters are also discussed. INTRODUCTION Intercepting wires are used at accelerator facilities around the world to measure transverse and longitudinal beam prop- erties. Beam particles either knock electrons from the wire or deposit some charge, inducing a current which is propor- tional to the flux of the beam. By measuring the relative current at multiple transverse positions, a beam profile can be obtained [1]. The ISIS facility at the Rutherford Appleton Laboratory is a spallation neutron and muon source delivering an average of 0.2 MW of proton beam power to two target stations (TS1 & TS2). During acceleration and extraction wire-based mon- itors are used to measure the transverse beam profile. At ISIS the intercepting wires are silicon-carbide (SiC) coated carbon fibres with a diameter of 142 μm. A wire grid is currently installed in EPB2 close to the TS2 target, with the wires intercepting the beam at a rate of 10 Hz. Future profile measurements will require a second grid to be installed in EPB1 close to the TS1 target. These wires will intercept the 800 MeV proton pulses at a repetition rate of 40 Hz. Thermal simulations are required to verify that wires in EPB1 will be able to withstand temperatures resulting from this higher repetition rate. * [email protected] THEORY Charged Particles in Matter Energetic charged particles passing through a medium in- teract electromagnetically with atomic electrons, depositing energy by ionising constituent atoms. For a singly charged particle with a velocity v = β c, energy E and relativistic factor γ, passing through a material with atomic number Z and number density n, the energy deposited into the material per unit particle path length x ; the stopping power S ( E ) , follows the Bethe-Bloch equation S ( E ) = - dE d x ≈ 4π 2 α 2 nZ m e β 2 ln 2v 2 γ 2 m e I e - β 2 , (1) where α is the fine structure constant, I e is the effective ionisation potential, m e is the electron mass, c is the speed of light and is the Dirac constant [2]. An example of this for 800 MeV protons travelling in a tungsten medium is shown in Fig. 1. As the protons travel through the medium they lose kinetic energy to atomic electrons, increasing the value of S ( E ) [2]. A sharp increase in the stopping power; known as the Bragg peak, is seen towards the end of the range. Figure 1: Results of a SRIM simulation showing the stopping power for 800MeV protons in tungsten [3]. Thermal Effects From the definition of the constant-volume heat capacity it can be found that the change in temperature, ΔT , of an object is given by: ΔT = 1 Mc v dU, (2) where U is the internal energy of an object, M is the energy- absorbing-mass and c v is the constant-volume specific heat capacity of the material. Equation (2) shows that when energy is deposited into an object there is an associated increase in temperature [4]. Proceedings of IBIC2016, Barcelona, Spain WEPG59 Transverse Profile Monitors ISBN 978-3-95450-177-9 785 Copyright © 2016 CC-BY-3.0 and by the respective authors
Transcript of Thermal Simulations of Wire Profile Monitors in ISIS ... · THERMAL SIMULATIONS OF WIRE PROFILE...

THERMAL SIMULATIONS OF WIRE PROFILE MONITORS IN ISIS
EXTRACTED PROTON BEAMLINE 1
D. W. Posthuma de Boer∗, A. Pertica, ISIS, STFC, Rutherford Appleton Laboratory,
Oxfordshire, OX11 0QX, UK
Abstract
Wire scanners and secondary emission (SEM) grids are
used for measurements of transverse beam profile at the ISIS
neutron and muon source. Silicon carbide-coated carbon
fibre wires are used in profile monitors throughout the ISIS
accelerator. One such SEM grid is currently installed close
to the target in Extracted Proton Beamline 2 (EPB2) and is
intercepted by the 800 MeV proton beam at a repetition rate
of 10 Hz. Future profile measurements will require another
of these monitors to be installed close to the target in EPB1;
intercepted with a repetition rate of 40 Hz.
Wires intercepting the ion beam are heated due to the de-
position of beam-energy. Thermal simulations for the higher
repetition rate were performed using ANSYS and a numeri-
cal code. The numerical code was then expanded to include
various beam, wire and material properties. Assumptions for
temperature dependent material emissivities and heat capaci-
ties were included in the simulation. Estimated temperatures
due to the energy deposited by protons, and approximate
values of deposited energy from the expected neutron flux
are presented. The effects on wire-temperature of various
beam and wire parameters are also discussed.
INTRODUCTION
Intercepting wires are used at accelerator facilities around
the world to measure transverse and longitudinal beam prop-
erties. Beam particles either knock electrons from the wire
or deposit some charge, inducing a current which is propor-
tional to the flux of the beam. By measuring the relative
current at multiple transverse positions, a beam profile can
be obtained [1].
The ISIS facility at the Rutherford Appleton Laboratory is
a spallation neutron and muon source delivering an average
of 0.2 MW of proton beam power to two target stations (TS1
& TS2). During acceleration and extraction wire-based mon-
itors are used to measure the transverse beam profile. At
ISIS the intercepting wires are silicon-carbide (SiC) coated
carbon fibres with a diameter of 142 µm.
A wire grid is currently installed in EPB2 close to the TS2
target, with the wires intercepting the beam at a rate of 10 Hz.
Future profile measurements will require a second grid to be
installed in EPB1 close to the TS1 target. These wires will
intercept the 800 MeV proton pulses at a repetition rate of
40 Hz. Thermal simulations are required to verify that wires
in EPB1 will be able to withstand temperatures resulting
from this higher repetition rate.
THEORY
Charged Particles in Matter
Energetic charged particles passing through a medium in-
teract electromagnetically with atomic electrons, depositing
energy by ionising constituent atoms. For a singly charged
particle with a velocity v = βc, energy E and relativistic
factor γ, passing through a material with atomic number Z
and number density n, the energy deposited into the material
per unit particle path length x; the stopping power S(E),
follows the Bethe-Bloch equation
S(E) = −dE
dx≈
4π~2α2nZ
me β2
[
ln
(
2v2γ2me
Ie
)
− β2
]
, (1)
where α is the fine structure constant, Ie is the effective
ionisation potential, me is the electron mass, c is the speed
of light and ~ is the Dirac constant [2]. An example of this for
800 MeV protons travelling in a tungsten medium is shown
in Fig. 1. As the protons travel through the medium they
lose kinetic energy to atomic electrons, increasing the value
of S(E) [2]. A sharp increase in the stopping power; known
as the Bragg peak, is seen towards the end of the range.
Figure 1: Results of a SRIM simulation showing the stopping
power for 800 MeV protons in tungsten [3].
Thermal Effects
From the definition of the constant-volume heat capacity
it can be found that the change in temperature, ∆T , of an
object is given by:
∆T =
∫
1
McvdU, (2)
where U is the internal energy of an object, M is the energy-
absorbing-mass and cv is the constant-volume specific heat
capacity of the material. Equation (2) shows that when
energy is deposited into an object there is an associated
increase in temperature [4].
Proceedings of IBIC2016, Barcelona, Spain WEPG59
Transverse Profile Monitors
ISBN 978-3-95450-177-9
785 Cop
yrig
ht©
2016
CC
-BY-
3.0
and
byth
ere
spec
tive
auth
ors
Heat loss takes place by means of thermal conduction,
convection and radiation. As profile monitor wires are thin
and will be heated in vacuum, only radiation will be consid-
ered; the loss of energy by emission of photons. The total
radiated power is given by the Stefan-Boltzmann law:
Q̇ = ǫσA(T41 − T4
2 ), (3)
where Q is the heat energy, T1 is the temperature of the
radiating object, T2 is the ambient temperature, ǫ is the ma-
terial emissivity, A is the materials surface area and σ is the
Stefan-Boltzmann constant [4].
SIMULATION
Simulating the heating of wires as they intercept the pro-
ton beam will require that a calculation be made for the
energy deposited per proton. This is given by integrating
S(E) over the proton’s path through the wire. As a worst-
case approximation all protons will be assumed to traverse
the full wire diameter, d as indicated in Fig. 2; the largest di-
rect path. Since the wire thickness is on the order of 100 µm
and the range of 800 MeV protons in tungsten is approxi-
mately 20 cm; as shown in Fig. 1, the stopping power will
be assumed to be constant. The energy deposited per proton
was thus given by Eion = S(E) · d. Stopping powers were
obtained from PSTAR Tables [5] and SRIM [3].
Figure 2: Assumed wire cross section in relation to physical
dimensions; the assumed proton trajectory is also shown.
The assumed beam parameters are listed in Table 1. A
frequency of 50 rather than 40 Hz will be used to calculate
for the worst-case. Heating due to energy deposited by the
beam will be calculated using Eq. (2). Cooling towards
an ambient temperature of 300 K will be calculated using
Eq. (3). Simulations were performed with ANSYS® 15.0
and a custom numerical code written in python.
Table 1: Assumed Beam Parameters at the End of EPB1
Parameter Value
Beam σ 2.5 cm
Protons per bunch 1.5 × 10¹³
Bunch length 100 ns
Bunch spacing 250 ns
Bunches per pulse 2
Pulse frequency 50 Hz
Beam energy 800 MeV
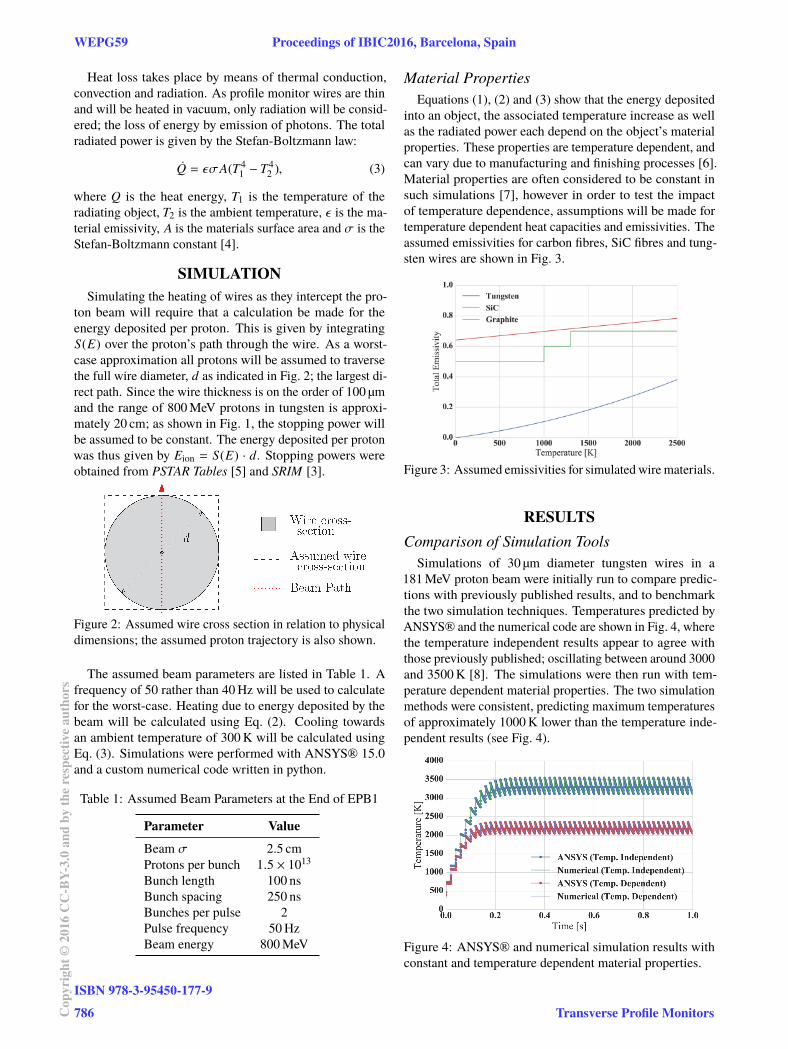
Material Properties
Equations (1), (2) and (3) show that the energy deposited
into an object, the associated temperature increase as well
as the radiated power each depend on the object’s material
properties. These properties are temperature dependent, and
can vary due to manufacturing and finishing processes [6].
Material properties are often considered to be constant in
such simulations [7], however in order to test the impact
of temperature dependence, assumptions will be made for
temperature dependent heat capacities and emissivities. The
assumed emissivities for carbon fibres, SiC fibres and tung-
sten wires are shown in Fig. 3.
Figure 3: Assumed emissivities for simulated wire materials.
RESULTS
Comparison of Simulation Tools
Simulations of 30 µm diameter tungsten wires in a
181 MeV proton beam were initially run to compare predic-
tions with previously published results, and to benchmark
the two simulation techniques. Temperatures predicted by
ANSYS® and the numerical code are shown in Fig. 4, where
the temperature independent results appear to agree with
those previously published; oscillating between around 3000
and 3500 K [8]. The simulations were then run with tem-
perature dependent material properties. The two simulation
methods were consistent, predicting maximum temperatures
of approximately 1000 K lower than the temperature inde-
pendent results (see Fig. 4).
Figure 4: ANSYS® and numerical simulation results with
constant and temperature dependent material properties.
WEPG59 Proceedings of IBIC2016, Barcelona, Spain
ISBN 978-3-95450-177-9
786Cop
yrig
ht©
2016
CC
-BY-
3.0
and
byth
ere
spec
tive
auth
ors
Transverse Profile Monitors
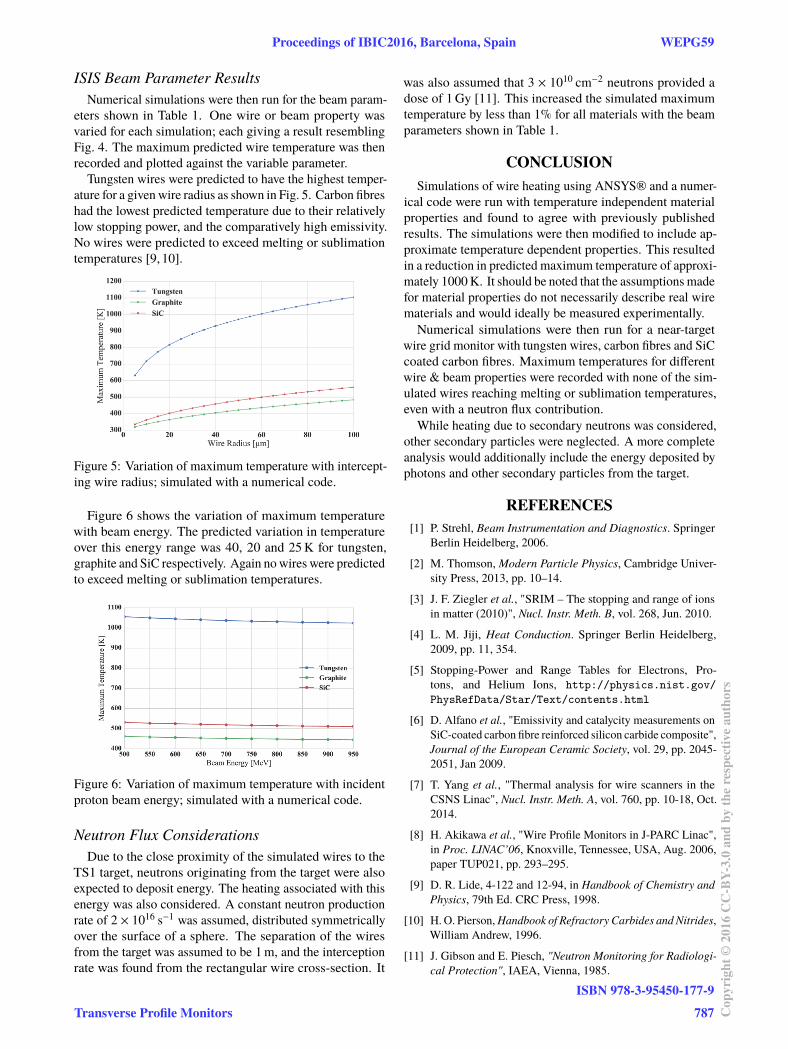
ISIS Beam Parameter Results
Numerical simulations were then run for the beam param-
eters shown in Table 1. One wire or beam property was
varied for each simulation; each giving a result resembling
Fig. 4. The maximum predicted wire temperature was then
recorded and plotted against the variable parameter.
Tungsten wires were predicted to have the highest temper-
ature for a given wire radius as shown in Fig. 5. Carbon fibres
had the lowest predicted temperature due to their relatively
low stopping power, and the comparatively high emissivity.
No wires were predicted to exceed melting or sublimation
temperatures [9, 10].
Figure 5: Variation of maximum temperature with intercept-
ing wire radius; simulated with a numerical code.
Figure 6 shows the variation of maximum temperature
with beam energy. The predicted variation in temperature
over this energy range was 40, 20 and 25 K for tungsten,
graphite and SiC respectively. Again no wires were predicted
to exceed melting or sublimation temperatures.
Figure 6: Variation of maximum temperature with incident
proton beam energy; simulated with a numerical code.
Neutron Flux Considerations
Due to the close proximity of the simulated wires to the
TS1 target, neutrons originating from the target were also
expected to deposit energy. The heating associated with this
energy was also considered. A constant neutron production
rate of 2 × 10¹⁶ s−1 was assumed, distributed symmetrically
over the surface of a sphere. The separation of the wires
from the target was assumed to be 1 m, and the interception
rate was found from the rectangular wire cross-section. It
was also assumed that 3 × 1010 cm−2 neutrons provided a
dose of 1 Gy [11]. This increased the simulated maximum
temperature by less than 1% for all materials with the beam
parameters shown in Table 1.
CONCLUSION
Simulations of wire heating using ANSYS® and a numer-
ical code were run with temperature independent material
properties and found to agree with previously published
results. The simulations were then modified to include ap-
proximate temperature dependent properties. This resulted
in a reduction in predicted maximum temperature of approxi-
mately 1000 K. It should be noted that the assumptions made
for material properties do not necessarily describe real wire
materials and would ideally be measured experimentally.
Numerical simulations were then run for a near-target
wire grid monitor with tungsten wires, carbon fibres and SiC
coated carbon fibres. Maximum temperatures for different
wire & beam properties were recorded with none of the sim-
ulated wires reaching melting or sublimation temperatures,
even with a neutron flux contribution.
While heating due to secondary neutrons was considered,
other secondary particles were neglected. A more complete
analysis would additionally include the energy deposited by
photons and other secondary particles from the target.
REFERENCES
[1] P. Strehl, Beam Instrumentation and Diagnostics. Springer
Berlin Heidelberg, 2006.
[2] M. Thomson, Modern Particle Physics, Cambridge Univer-
sity Press, 2013, pp. 10–14.
[3] J. F. Ziegler et al., "SRIM – The stopping and range of ions
in matter (2010)", Nucl. Instr. Meth. B, vol. 268, Jun. 2010.
[4] L. M. Jiji, Heat Conduction. Springer Berlin Heidelberg,
2009, pp. 11, 354.
[5] Stopping-Power and Range Tables for Electrons, Pro-
tons, and Helium Ions, http://physics.nist.gov/
PhysRefData/Star/Text/contents.html
[6] D. Alfano et al., "Emissivity and catalycity measurements on
SiC-coated carbon fibre reinforced silicon carbide composite",
Journal of the European Ceramic Society, vol. 29, pp. 2045-
2051, Jan 2009.
[7] T. Yang et al., "Thermal analysis for wire scanners in the
CSNS Linac", Nucl. Instr. Meth. A, vol. 760, pp. 10-18, Oct.
2014.
[8] H. Akikawa et al., "Wire Profile Monitors in J-PARC Linac",
in Proc. LINAC’06, Knoxville, Tennessee, USA, Aug. 2006,
paper TUP021, pp. 293–295.
[9] D. R. Lide, 4-122 and 12-94, in Handbook of Chemistry and
Physics, 79th Ed. CRC Press, 1998.
[10] H. O. Pierson, Handbook of Refractory Carbides and Nitrides,
William Andrew, 1996.
[11] J. Gibson and E. Piesch, "Neutron Monitoring for Radiologi-
cal Protection", IAEA, Vienna, 1985.
Proceedings of IBIC2016, Barcelona, Spain WEPG59
Transverse Profile Monitors
ISBN 978-3-95450-177-9
787 Cop
yrig
ht©
2016
CC
-BY-
3.0
and
byth
ere
spec
tive
auth
ors