THERMAL PROPERTIES -...
32
Chapter 4 THERMAL PROPERTIES Abstract This chapter deals with different thermal properties of the commingled composites. The thermal degradation behavior of banana fiber and polypropylene/banana fiber composites has been studied by thermogravimetric analysis. Banana fiber was found to be decomposing in two stages, first one around 320°C and the second one around 450°C. For chemically treated banana fiber, the decomposition process has been at a higher temperature, indicating thermal stability for the treated fiber. Activation energy for thermal degradation of banana fiber was estimated using Coats and Redfern method. Calorific value of the banana fiber was measured using a constant volume isothermal bomb calorimeter. Crystallization studies of the composites exhibited an increase in the crystallization temperature and crystallinity of polypropylene upon the addition of banana fiber. Investigation of the thermophysical properties of the composites revealed that thermal conductivity and diffusivity of the composites decreased with banana fiber loading. The chemically treated banana fiber caused an increase of the thermophysical properties of the composites. The use of a theoretical series conduction model allowed estimating the transverse thermal conductivity of banana fiber. A part of the results of this chapter have been published (on line) in Composites Part A (Article in press)
Transcript of THERMAL PROPERTIES -...

Chapter 4
THERMAL PROPERTIES
Abstract
This chapter deals with different thermal properties of the commingled
composites. The thermal degradation behavior of banana fiber and
polypropylene/banana fiber composites has been studied by
thermogravimetric analysis. Banana fiber was found to be decomposing
in two stages, first one around 320°C and the second one around 450°C.
For chemically treated banana fiber, the decomposition process has been
at a higher temperature, indicating thermal stability for the treated fiber.
Activation energy for thermal degradation of banana fiber was estimated
using Coats and Redfern method. Calorific value of the banana fiber was
measured using a constant volume isothermal bomb calorimeter.
Crystallization studies of the composites exhibited an increase in the
crystallization temperature and crystallinity of polypropylene upon the
addition of banana fiber. Investigation of the thermophysical properties of
the composites revealed that thermal conductivity and diffusivity of the
composites decreased with banana fiber loading. The chemically treated
banana fiber caused an increase of the thermophysical properties of the
composites. The use of a theoretical series conduction model allowed
estimating the transverse thermal conductivity of banana fiber.
A part of the results of this chapter have been published (on line) in Composites Part A (Article in press)

130 Chapter 4
4.1 Introduction
Thermal analysis is an important analytical method in understanding the
structure-property relationship and mastering the technology for
molecular design and industrial production of different polymeric
materials, especially fiber reinforced composites. Moreover, it is a useful
technique to determine the thermal stability of the materials. In addition, it
is possible to quantify the amount of moisture and volatiles present in the
composites that have a deteriorating effect.
An understanding of the thermal stability of the fibers and composites is
extremely important to assess the suitability of these materials in varied
applications. Thermal analysis can also help in evaluating the efficacy of
surface treatment and thermal decomposition kinetics. There have been
many studies on the thermal decomposition of biopolymers with special
emphasis to reaction kinetics [1-14]. Addition of fibers to a semicrystalline
polymer like polypropylene can affect the degree of crystallinity of the
polymer matrix which in turn can influence the eventual mechanical
properties of the composite. Thermal calorimetric techniques have been
used effectively as a tool to evaluate the crystallization of PP/biofiber
composites [6].
The interaction of thermal energy (i.e, heat) with the atoms which
constitute a material determines some of the most important physical
properties of the material. The properties describing this interaction at the
most fundamental level are often called thermophysical properties which
include heat capacity, thermal diffusivity, thermal conductivity etc. A
complete characterization of the thermal properties of materials requires
the determination of the thermal conductivity and thermal diffusivity.
Thermal conductivity is a property of materials that expresses the heat flux
that will flow through the material if a certain temperature gradient exists

Thermal Properties 131
over the material. Thermal diffusivity describes the time dependent non-
steady-state aspects of heat flow. Thermal conductivity is a bulk property
analogous to mechanical modulus. Moreover, it is well accepted that a
mathematical analogy exists between thermal conduction and elasticity of
fiber composites. Many theoretical and empirical models have been
proposed to predict the effective thermal conductivity of short fiber
composites [15-18]. In polymer composites, if the alignment of the fibers
are parallel to the direction of the thermal flux, the thermal conductivity will
be highest (parallel conduction) and if the alignment of the fibers are
perpendicular to the direction of the thermal flux, thermal conductivity will
be the lowest (series conduction). Fig. 4.1 shows the schematic
representation of parallel and series conduction.
Fig. 4.1 Schematic representation of parallel conduction and series conduction
Several studies have been reported in literature about the thermal conductivity
of fiber filled polymer composites. Kim et al. [19] studied the thermal
conductivity of thermoplastic composites composing of 50% PP and 50%
natural fiber irradiated by the electron beam (energy: 0.5 MeV, dose:
0–20 kGy). The results showed that the thermal conductivity became

132 Chapter 4
minimum when the dose of electron beam is 10 kGy. Li et al. [20]
investigated the thermal conductivity, thermal diffusivity, and specific heat
of flax fiber/high density polyethylene biocomposites in the temperature
range of 170–200°C. The fiber contents in the composites were 10%,
20%, and 30% by mass. It was found that the thermal conductivity,
thermal diffusivity, and specific heat decreased with increasing fiber
content, but thermal conductivity and thermal diffusivity did not change
significantly with temperature in the range studied. Agrawal et al. [21]
measured the thermal conductivity and thermal diffusivity of oil-palm-fiber
reinforced untreated and differently treated composites with the transient
plane source technique at room temperature and under atmospheric
pressure. The thermal conductivity of the treated fibers as well as of the
untreated fibers was calculated theoretically. The model results showed that
the thermal conductivity of untreated fiber was lower than the thermal
conductivity of the treated fibers. Idicula et al. [22] investigated the thermal
conductivity, diffusivity and specific heat of polyester/natural fiber
(banana/sisal) composites as a function of filler concentration and for several
fiber surface treatments. The thermophysical behaviour of hybrid pineapple
leaf fiber (PALF) and glass fiber reinforced polyester composites has been
also evaluated for a constant total fiber loading of 0.40 Vf by varying the ratio
of PALF and glass. The results showed that chemical treatment of the fibers
reduces the composite thermal contact resistance. Hybridisation of natural
fiber with glass allows a significantly better heat transport ability of the
composite.
During manufacturing of natural fiber plastic composites, heat transfer is
involved, but information about the thermal conductivity and thermal
diffusivity is not available. In this study, the thermal conductivity, thermal
diffusivity, and specific heat of PP/BF composites were determined in the
temperature range of 170–200°C. Processing method will have an

Thermal Properties 133
influence on the thermophysical, thermal degradation behaviour and
crystallization properties of the composites. No studies have reported in
literature where the above properties of the PP/BF commingled
composites were analyzed. In the present chapter, we report the thermal
degradation behavior, crystallization studies and thermophysical
properties of the PP/BF commingled composites.
4.2 Results and Discussion 4.2.1 Thermogravimetric analysis 4.2.1.1 Thermal degradation of banana fiber The thermograms from TG and DTA studies for BF are shown in Fig. 4.2.
Fig. 4.2 TG and DTA thermograms of banana fiber
It can be seen from the TG curve that the BF shows a weight loss of
around 6% before 100°C, due to moisture loss. However DTA does not
show any endotherm corresponding to evaporation of water during this
temperature range. Instead a broad, yet small exothermic peak beginning
around 60°C was observed in DTA. Similar observations have been
reported for sisal fibers which have similar chemical composition [4]. On
134 Chapter 4
the other hand, water volatilization has also been reported as a distinct
endothermic reaction in biopolymers in thyme [8]. On further heating the
thermal decomposition of the fiber was found to take place in two
successive stages. A weight loss of around 55% was observed in the first
stage (230-330°C) of the decomposition which was followed immediately
by the second stage (330-440°C). The DTA showed an exothermic peak
starting around 230oC with a peak temperature around 320°C
corresponding to the first stage decomposition. The second stage
decomposition following the first stage started around 340oC and
continued till around 450°C with a weight loss amounting to around 30%.
The DTA showed a sharp exotherm with a peak temperature of 450°C
corresponding to this stage of decomposition. The average weight of the
solid residue at 500°C from various trials on BF was in the range 6-8%.
Previous studies have shown that biomass (mainly consisting of cellulose,
hemicellulose and lignin) pyrolysis takes place in four stages. These
stages that take place in sequence while heating are moisture loss,
decomposition of hemicellulose, cellulose and lignin [8,19]. The first stage
decomposition observed after the moisture loss can be attributed to
hemicellulose decomposition which is reported to take place in the
temperature range 220-320°C. Hemicellulose mainly consists of various
saccharides and has a random amorphous structure, rich in branches
which can degrade to low molecular weight products at low temperature.
Cellulose, on the other hand, has a higher thermal stability as it is strong
and stable due to its polymeric chain consisting of thousands of glucose
units. The hemicellulose percentage in the BF under study is around 19%.
However, the average weight loss observed in the temperature range 220-
320°C, was more than 50% in the present studies. This suggests complex
reactions other than hemicellulose decomposition taking place at low
temperatures. Though cellulose pyrolysis is reported to takes place at a

Thermal Properties 135
higher temperature range 315-400°C with the evolution of various gases
and high boiling products, depolymerization and other degradation process
are likely to be initiated at temperatures as low as 250°C [4,9,24].
Obviously there is a strong overlap of thermal degradation of individual
constituents of the fiber. It must be remembered that the nature of thermal
decomposition of cellulose depends also on factors such as texture and
crystallinity which make thermal decomposition of biopolymer even more
complex. The second stage decomposition observed in the temperature
range 340-450°C is primarily due to cellulose decomposition and char
combustion [8,9,24]. It has been reported [4,8,9] from thermal studies on
cellulose decomposition that cellulose decomposition shows an endotherm
around 340°C due to depolymerization of cellulose with formation of
levoglucosan and its evaporation followed by an exotherm corresponding
to char formation. The endothermic decomposition process could have
been masked significantly by the exothermic reaction in the present case.
The sharp exothermic peak obtained around 450°C in the present studies
could hence be attributed to the char formation.
The decomposition of lignin, the third major component in the fiber
composition, is reported to be difficult and takes place slowly over a broad
range of temperature with decomposition starting from as low as 100oC.
Lignin is also reported to start decomposing only at 250°C [10, 25]. Since
content of lignin in the BF being less and the thermal decomposition is
believed to take place in a broad temperature range, it was difficult to
identify any particular stage to lignin decomposition. The overall thermal
behaviour of BF appears to be similar to that of other biopolymers [4,8]. In
general cellulose degrade to gases, primarily water and carbon dioxide,
high boiling products and char. In order to gain more insight into the
thermal decomposition mechanism of BF, pyrolyzed samples of fiber were
analyzed using FTIR spectroscopy. The IR spectra of BF, a sample that

136 Chapter 4
was heated upto 150°C and another sample that was heated upto 350°C
are shown in Fig.4.3-4.5 respectively. The IR spectrum of BF shows
characteristic absorptions of its constituents namely cellulose,
hemicellulose, lignin and moisture. The IR absorption peaks and its
relation to various functional groups in the constituents of the fiber are
shown in Table. 4.1
Fig.4.3 IR Spectrum of banana fiber
The IR spectra of the samples heated to different temperatures
(10°C/min heating rate) look more or less identical except for the
sharpening of some of the peaks in the spectra of the pyrolyzed samples.
While the peaks at 1738 (carbonyl group) and 1630 cm-1 (double bond)
became prominent, characteristic absorptions of the glucosidic structure,
(1169 cm-1, glucopyranose ring) decreased in intensity in the pyrolyzed
samples. It has been suggested that a cross linked unsaturated aliphatic

Thermal Properties 137
carbonylic structure is formed prior to charring. The charring of this
precursor is reported to take
Fig. 4.4 IR spectrum of banana fiber heated upto 150oC
place at 325-420°C. This explains the prominence of peaks at 1738 cm-1 in
pyrolyzed samples and exothermic peak in the temperature range 325 to
450oC in DTA thermograms. Besides, the characteristic absorptions of
aliphatic structures (3000-2800 and 1436 cm-1) became more
prominent in samples heated up to 350°C. The new band at 1515 cm-1
observed in pyrolyzed samples can been attributed to aromatic
semicircle stretching. Absorption at 1131 cm-1 in these samples may be
due to levoglucosan (C-O-C stretching), an intermediate product in the
138 Chapter 4
cellulose degradation. Similar observations have been made earlier in
studies on cellulose degradation [9]. Further analysis of the residue at still
higher temperatures was not attempted in this study. Comparing the
pyrolysis results with those reported in a recent study [10] wherein BF
thermal degradation have been studied at higher temperatures, it can be
inferred that the mechanism of thermal degradation may vary to some
extent depending upon the constitution of the biopolymer though the
general trend is the same. However, a more elaborate study involving
analysis of evolved gases, high boiling products and char is necessary
to elucidate a proper mechanism of decomposition. The thermogravimetric
data was used to calculate kinetic parameters like activation energy of
banana fiber decomposition.
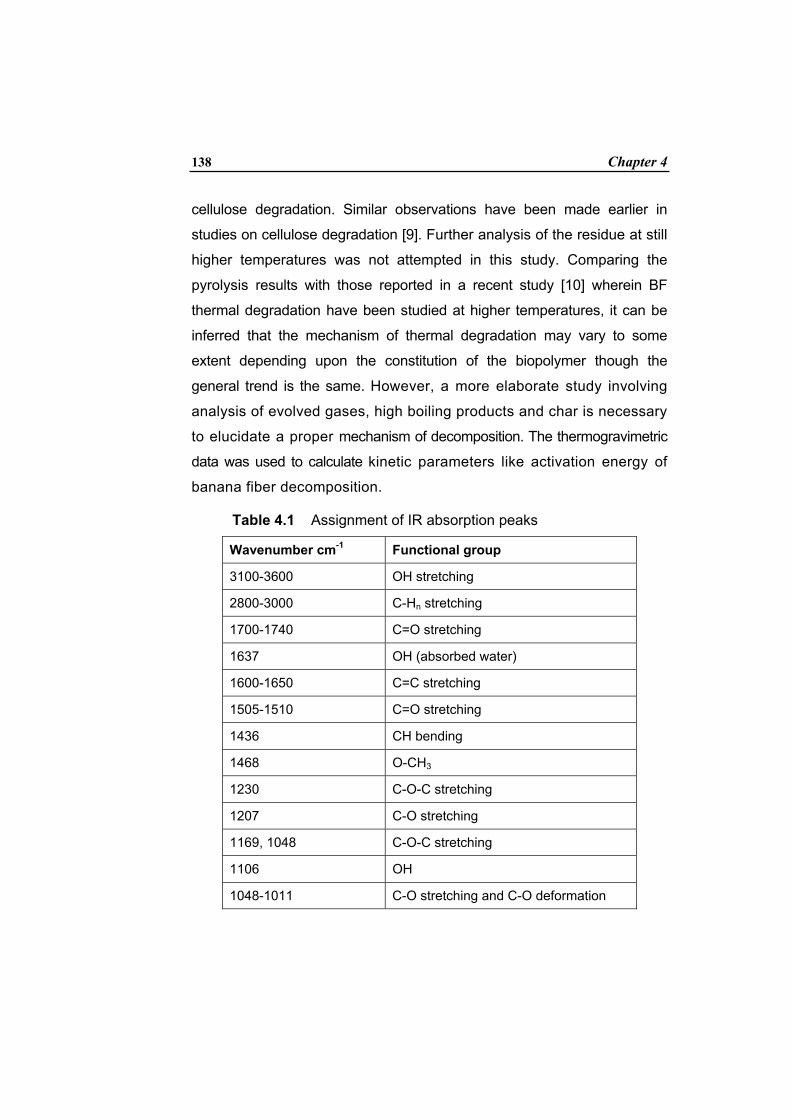
Table 4.1 Assignment of IR absorption peaks
Wavenumber cm-1 Functional group
3100-3600 OH stretching
2800-3000 C-Hn stretching
1700-1740 C=O stretching
1637 OH (absorbed water)
1600-1650 C=C stretching
1505-1510 C=O stretching
1436 CH bending
1468 O-CH3
1230 C-O-C stretching
1207 C-O stretching
1169, 1048 C-O-C stretching
1106 OH
1048-1011 C-O stretching and C-O deformation

Thermal Properties 139
The method adopted by Coats and Redfern has been used in the present
study to calculate the activation energies of fiber degradation [26-27]. It
has been reported recently that among the various integral methods,
Coats and Redfern approximation may be preferred over other
approximations because the resulting errors are much smaller for the
entire range of E/RT [28]. According to Coats-Redfern (CR equation),
( ) ( )2In g / T = In AR/ E 1-2RT/E E/RTα ϕ − (4.1)
where g(α) = 1 – (1- α )1-n / 1-n for all values of n = 1 except for which g(α)
= -ln (1- α) α is the fraction decomposed, n is the order of reaction, T is the
temperature, R is the universal gas constant, φ is the heating rate. Linear
plots of ln g(α)/T2 vs 1/T are drawn for different values on n . The value of
n which gives the best fit with correlation coefficient nearest to unity is
chosen as the order of the reaction. The value of E can be obtained from
the slope of this line.
Fig. 4.5 IR spectrum of banana fiber residue heated upto 350°C
140 Chapter 4
The degradation kinetics of cellulose have been studied in detail in the
past and is generally accepted to be a first order reaction [1,8]. Unlike
cellulose and hemicellulose, lignin decomposition does not follow a first
order kinetics [8]. Since lignin percentage is not much compared to the
other two constituents of the fiber, first order kinetics have been followed
in the calculations involving determination of activation energy. Besides
the correlation coefficient calculated for the best fit curve was found to be
closest to the one for n =1.
Decomposition of a biopolymer is a continuous process. However, the
first two stages during the decomposition being somewhat distinct in
TG curves, activation energy was calculated separately for each
stage. Such calculations also have been reported for biopolymers [3].
The activation energy for the first stage and second stage
decomposition of banana fibers were calculated to be 132kJ/mol and
163kJ/mol respectively. The higher activation energy for the second
stage is because of the char formation. Though the values obtained are
in the range reported in the literature for cellulose decomposition in
general, it is difficult to compare the values as the constituents of the
fiber under study vary from other bio cellulose based samples and
decomposition mechanism itself is complex [14].
Thermal decomposition behaviour of BF at different heating rates (5,10,
15,20oC/min) was also carried out. Activation energy for the first stage
decomposition was calculated based on Flynn method [29]. This method
involves reading the temperature at a constant weight loss from several
integral thermograms at different heating rates. From the slope of log (β
heating rate) vs. 1/T, the activation energy may be closely approximated
by means of the equation
E ~ - 4.35 d log β /d 1/T (4.2)

Thermal Properties 141
The activation energy calculated (approximate) was 113 kJ/mol. Calorific
value of the BF was estimated based on heat of combustion. The heat of
combustion value is important to assess the combustion property of the
fiber. Heat of combustion usually expressed in cal/gm is the number of
heat units liberated by a unit mass of the substance when burnt in a
sealed enclosure of constant volume in an atmosphere of pure oxygen
gas. If W is the water equivalent of the calorimeter assembly, ∆T is the
rise in temperature, and ∆H is the heat of combustion of the material and
M is the mass of the sample burnt, then
W∆T = ∆HM (4.3)
From the water equivalent of the calorimeter (calculated using a standard
material, such as benzoic acid whose heat of combustion is known) and
rise in temperature, the heat of combustion can be calculated. Complete
combustion was ensured by the absence of solid residue in the bomb
after every measurement. The heat of combustion (∆H) was found to be
17.52 kJ/gm. This is almost equal to the heat of combustion of cellulose.
Heat of combustion of water bamboo husks, another biopolymer is
reported [3] to be slightly less than this value (15.69 kJ/mol).
Thermal analysis was carried out on different chemically treated BF. The
thermograms from TG and DTA studies are shown in Fig. 4.6. The
treated fibers were found to start decomposing around 240-260°C which
is around 10-30°C higher than the untreated fiber indicating a higher
thermal stability for the treated fibers. The alkali treated fiber seems to
have a slightly higher moisture loss below 100°C compared to BF. A
related observation was made in a separate study wherein the effect of
humidity on chemically treated fibers was carried out. The increase in
moisture content of alkali treated fibers was more pronounced than other
treated fibers when exposed to humidity. The alkali treatment effectively
142 Chapter 4
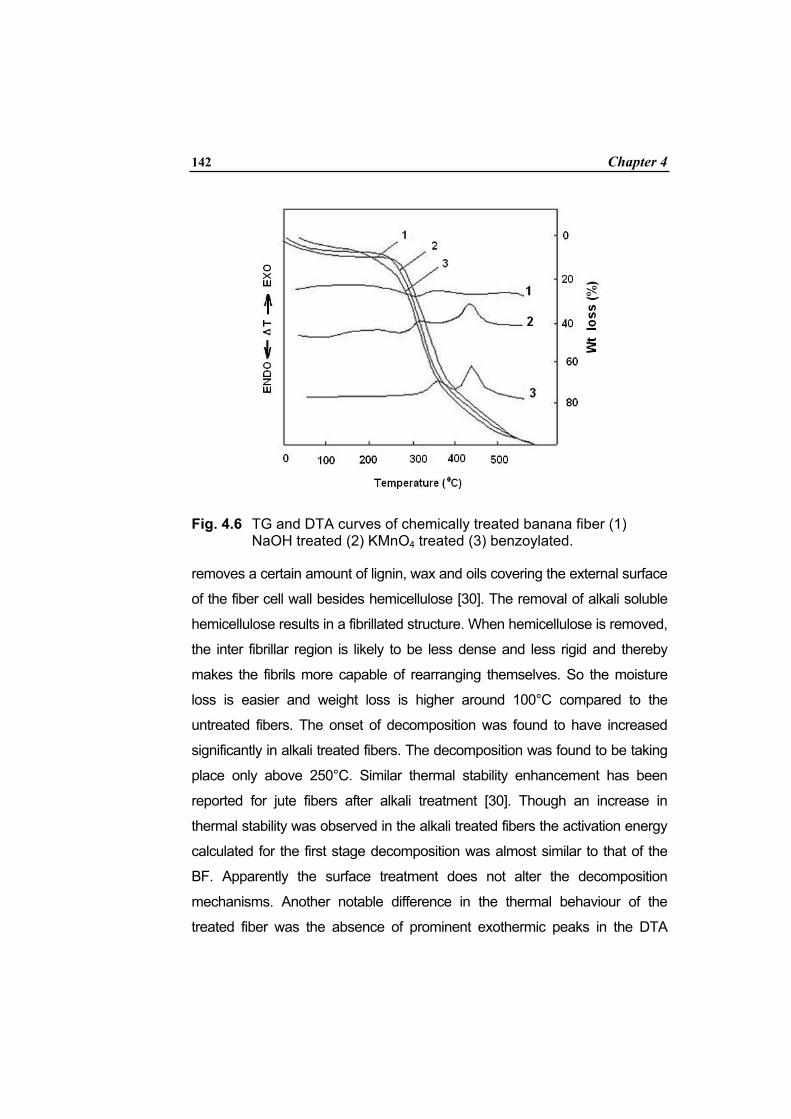
Fig. 4.6 TG and DTA curves of chemically treated banana fiber (1)
NaOH treated (2) KMnO4 treated (3) benzoylated.
removes a certain amount of lignin, wax and oils covering the external surface
of the fiber cell wall besides hemicellulose [30]. The removal of alkali soluble
hemicellulose results in a fibrillated structure. When hemicellulose is removed,
the inter fibrillar region is likely to be less dense and less rigid and thereby
makes the fibrils more capable of rearranging themselves. So the moisture
loss is easier and weight loss is higher around 100°C compared to the
untreated fibers. The onset of decomposition was found to have increased
significantly in alkali treated fibers. The decomposition was found to be taking
place only above 250°C. Similar thermal stability enhancement has been
reported for jute fibers after alkali treatment [30]. Though an increase in
thermal stability was observed in the alkali treated fibers the activation energy
calculated for the first stage decomposition was almost similar to that of the
BF. Apparently the surface treatment does not alter the decomposition
mechanisms. Another notable difference in the thermal behaviour of the
treated fiber was the absence of prominent exothermic peaks in the DTA
Thermal Properties 143
thermograms. Almost identical behaviour was observed for KMnO4 treated
fiber except that the decomposition temperature was slightly less than alkali
treated fibers and the exothermicity was visible in DTA thermograms.
Activation energy calculated for first stage decomposition was similar to that
obtained for alkali treated fiber. The formation of cellulose manganate
complex is believed to be responsible for the higher thermal stability of the
KMnO4 treated fiber. In benzoylated fiber, the weight loss at 100°C is found to
be lower indicating lower moisture content of the benzoylated fiber. This is due
to the presence of hydrophobic benzoyl groups, resulting from the
benzoylation reaction on the fiber surface. Lower moisture absorption was
observed for these fibers when exposed to different humidity levels. It is clear
from the thermogram that onset of degradation starts a bit early though
significant weight loss start taking place only above 240°C. The exothermicity
owing to the degradation also was evident in DTA thermograms. The
activation energy for first stage decomposition calculated for benzoylated
fibers however was higher (185 kJ/mol) when compared to BF. This is another
indication of higher thermal stability induced by chemical modification. A
similar observation including activation energy was made for stearic acid
treated fibers. However in this case the exothermicity in DTA thermograms
was completely missing. In general there is an increase in the onset of
decomposition temperature when the fibers are chemically modified; the
extent of increase depend upon the chemical treatment. The chemical
treatment induced by organic substrates also seems to enhance the activation
energy of the degradation of the biofiber.
4.2.1.2 PP/banana fiber composite Thermal degradation behaviour of polypropylene composites made
using (50%) BF was also studied. Typical TG and DTA curves of the
composites and PP are given in Figs.4.7 and 4.8 respectively. The DTA
of PP show an endotherm around 152°C corresponding to the melting of

144 Chapter 4
Fig. 4.7 TG curves of (1) Neat PP (2) PP/banana fiber composite (3)
banana fiber
Fig. 4.8 DTA thermograms of (1) Neat PP (2) PP/stearic acid treated
banana fiber composite (3) PP/benzoylated banana fiber composite (4) PP/ untreated banana fiber composite

Thermal Properties 145
polypropylene followed by another broad endotherm beginning around
340oC corresponding to the decomposition. No exothermic peaks were
found till the decomposition was over. The weight loss curve in TG studies
show a continuous weight reduction in the temperature range of 340 to
430°C. A complete weight loss was observed at 450°C. Activation energy of
decomposition was estimated to be 94 kJ/mol with an n value of 0.4 in this
temperature range using Coats-Redfern method. The thermal behavior of
PP observed in this study is similar to the reported results from thermal
studies on PP [31-32]. It can be seen from the thermograms of PP/BF
composites containing 50% fiber that there is no weight loss corresponding
to moisture, and decomposition sets in only above 250°C in composites.
Obviously the fiber decomposition which starts around 240°C initiates the
degradation of the composites. The thermograms from DTA studies of the
composite show endotherms corresponding to melting and degradation of
PP. Though fiber decomposition was exothermic in nature the composites
did not show any exothermic peak. The continuous weight loss pattern
observed in PP changed to a two stage decomposition, similar to fiber
decomposition, in composites. A 30% weight loss was observed in the first
stage in the temperature range 240 to 350°C. Unlike in the case of fiber
where the two stages of decomposition are somewhat distinct the
composites show a more or less merged weight loss stages. This could be
due to the fact that PP starts decomposing around 340°C where the second
stage of fiber decomposition begins. The weight of the final residue at 500°C
in each trial was around 10%. An activation energy estimation was carried
out for the decomposition in the temperature range 250-440°C and a value
of around 80-100 kJ/mol was obtained. This value was found to be more or
less same in all the fiber composites. Similar values of activation energy
have been reported for PP/sisal fiber composites [4]. The thermal
degradation kinetics of the composites apparently is guided by the PP matrix

146 Chapter 4
decomposition mechanism. It can also be seen from the Fig. 4.8 that the
surface treatment on the fiber does not have any significant influence in the
decomposition pattern of the composite. In general some of the notable
changes in the BF degradation behaviour with the incorporation of
polypropylene matrix are that the decomposition becomes endothermic,
moisture absorption becomes less and the decomposition kinetics shifts
more towards the PP decomposition pattern.
4.2.2 Crystallization studies For composites based on semicrystalline matrix polymers, the crystallinity is
an important factor that determines the stiffness and fracture behaviour of the
composite. The crystallinity depends on processing parameters; e.g.,
crystallisation temperature, cooling rate, nucleation density, and annealing
time [33]. It is known that a transcrystalline layer forms at the fiber/matrix
interface when fibers with high nucleating ability are employed [34-35].
Arbelaiz et al. [6] conducted the crystallization studies of short flax fiber
reinforced polypropylene composites and chemically treated flax fiber
composites. The results showed that addition of flax fiber increased
crystallization rate. Besides, depending on flax fiber surface treatment and
crystallization temperature, PP/flax fiber composites showed transcrystallinity.
In the present study, the effect of BF on the thermal properties of PP is
analysed by DSC. The thermal parameters such as crystallisation
temperature (Tc), melting temperature (Tm), crystallisation energy (∆Hc) and
melting enthalpy (∆Hm) of neat PP and PP/BF composites using both
untreated and treated BF are summarized in Table 4.2. The corresponding
DSC thermograms are shown in Figs. 4.9 and 4.10.
The crystallinity of PP component was determined using the relationship
Xc (% crystallinity) = f0
f
∆H ×100∆H ×W
(4.4)

Thermal Properties 147
where ∆ H0f is the heat of fusion of a hypothetical 100% crystalline PP
sample and W is the weight fraction of PP in the composite. A value of
∆H0f = 209 J/g was taken for calculations [6]. It can be seen from Table 4.2
that addition of BF has different effects on Tc and Tm. While Tm increased
marginally there is a relatively more pronounced increase in Tc with the
addition of fiber to the PP matrix. Tc increases with increase in BF loading
and is maximum for 50% BF composite. The addition of fibers results in a
decrease in the heat of reaction associated with both crystallization and
melting process. This could be primarily attributed to the dilution effect of PP
by the BF. All these observations are similar to what has been reported for
the PP/biofiber composites [6, 23]. It can be seen from the Table 4.2 that the
values increase significantly with the addition of fibers to PP matrix.
Obviously the fibers play a clear role in the nucleation and crystallization
50 100 150 200 250-35
-30
-25
-20
-15
-10
-5
0
5
exo down5
4
3
2
1
Hea
t flo
w (m
W)
Temperature (0C) Fig. 4.9 DSC curves for crystallisation of (1) neat PP (2) PP/banana fiber
(30%) composite (3) PP/banana fiber (50%) composite (4) PP/ NaOH treated banana fiber (50%) composite (5) PP/ benzoylated banana fiber (50%) composite
148 Chapter 4
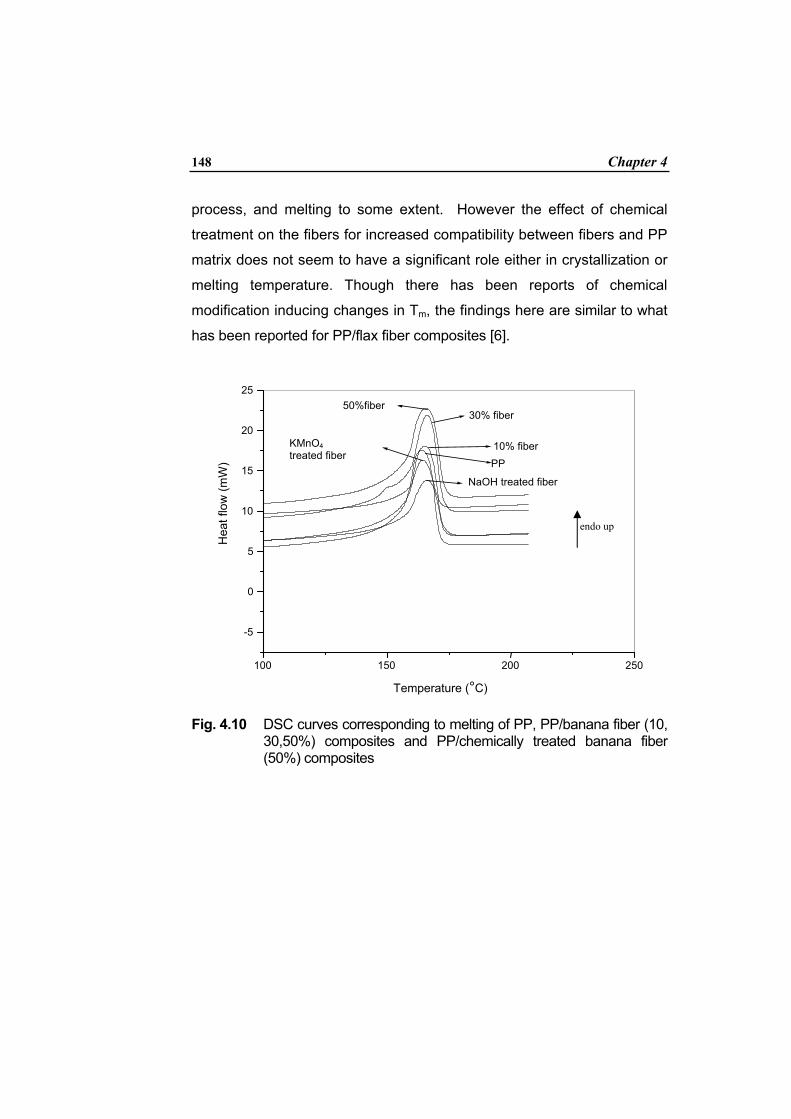
process, and melting to some extent. However the effect of chemical
treatment on the fibers for increased compatibility between fibers and PP
matrix does not seem to have a significant role either in crystallization or
melting temperature. Though there has been reports of chemical
modification inducing changes in Tm, the findings here are similar to what
has been reported for PP/flax fiber composites [6].
Fig. 4.10 DSC curves corresponding to melting of PP, PP/banana fiber (10,
30,50%) composites and PP/chemically treated banana fiber (50%) composites
Temperature (°C)
100 150 200 250
-5
0
5
10
15
20
25
KMnO4 treated fiber
NaOH treated fiber
50%fiber 30% fiber
10% fiber PP
Hea
t flo
w (m
W)
endo up
Thermal Properties 149
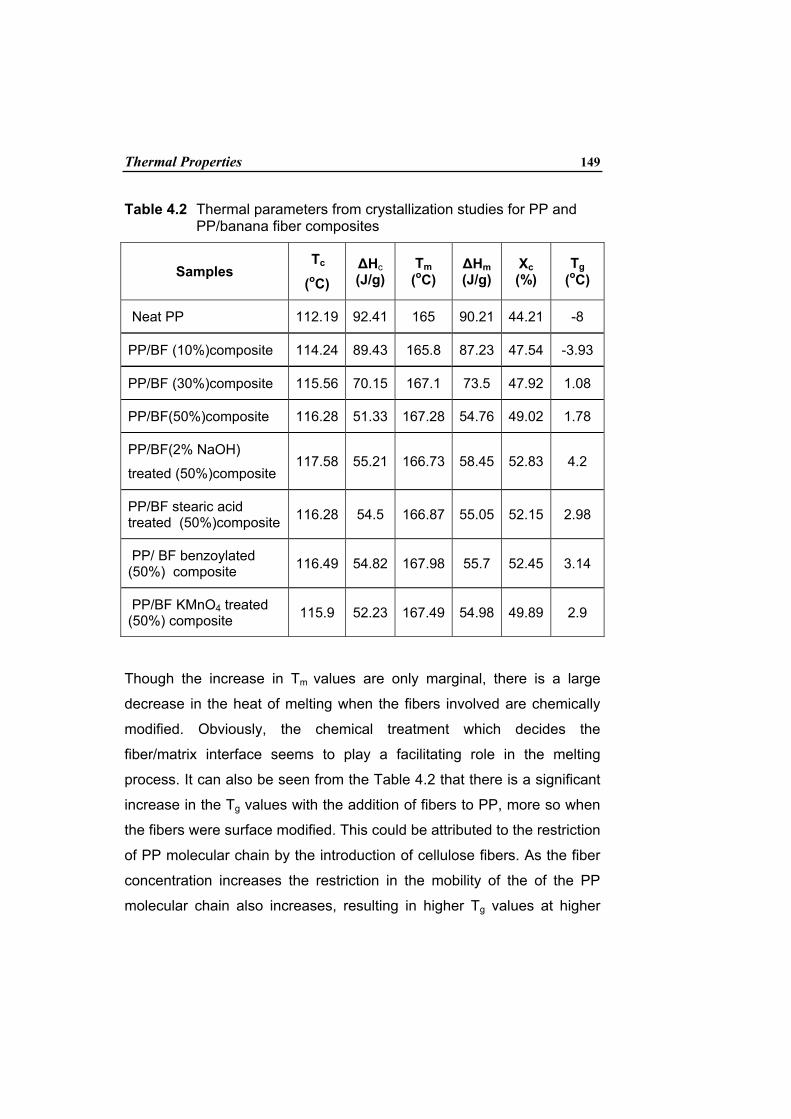
Table 4.2 Thermal parameters from crystallization studies for PP and PP/banana fiber composites
Samples Tc
(oC)
∆Hc (J/g)
Tm (oC)
∆Hm (J/g)
Χc (%)
Tg (oC)
Neat PP 112.19 92.41 165 90.21 44.21 -8
PP/BF (10%)composite 114.24 89.43 165.8 87.23 47.54 -3.93
PP/BF (30%)composite 115.56 70.15 167.1 73.5 47.92 1.08
PP/BF(50%)composite 116.28 51.33 167.28 54.76 49.02 1.78
PP/BF(2% NaOH)
treated (50%)composite 117.58 55.21 166.73 58.45 52.83 4.2
PP/BF stearic acid treated (50%)composite 116.28 54.5 166.87 55.05 52.15 2.98
PP/ BF benzoylated (50%) composite 116.49 54.82 167.98 55.7 52.45 3.14
PP/BF KMnO4 treated (50%) composite 115.9 52.23 167.49 54.98 49.89 2.9
Though the increase in Tm values are only marginal, there is a large
decrease in the heat of melting when the fibers involved are chemically
modified. Obviously, the chemical treatment which decides the
fiber/matrix interface seems to play a facilitating role in the melting
process. It can also be seen from the Table 4.2 that there is a significant
increase in the Tg values with the addition of fibers to PP, more so when
the fibers were surface modified. This could be attributed to the restriction
of PP molecular chain by the introduction of cellulose fibers. As the fiber
concentration increases the restriction in the mobility of the of the PP
molecular chain also increases, resulting in higher Tg values at higher
150 Chapter 4
loading densities. It is also clear from Table 4.2 that the crystallinity of
neat PP is increased by the addition of BF and further by the addition of
surface treated BF. As the amount of BF increases, crystallinity is also
found to increase because the fibers act as nucleation sites for the
crystallisation and partial crystalline growth of PP. It may be assumed
that the nucleating effect considerably contributes to the occurrence of
transcrystalline layers around the fibers when a specimen of the PP/BF
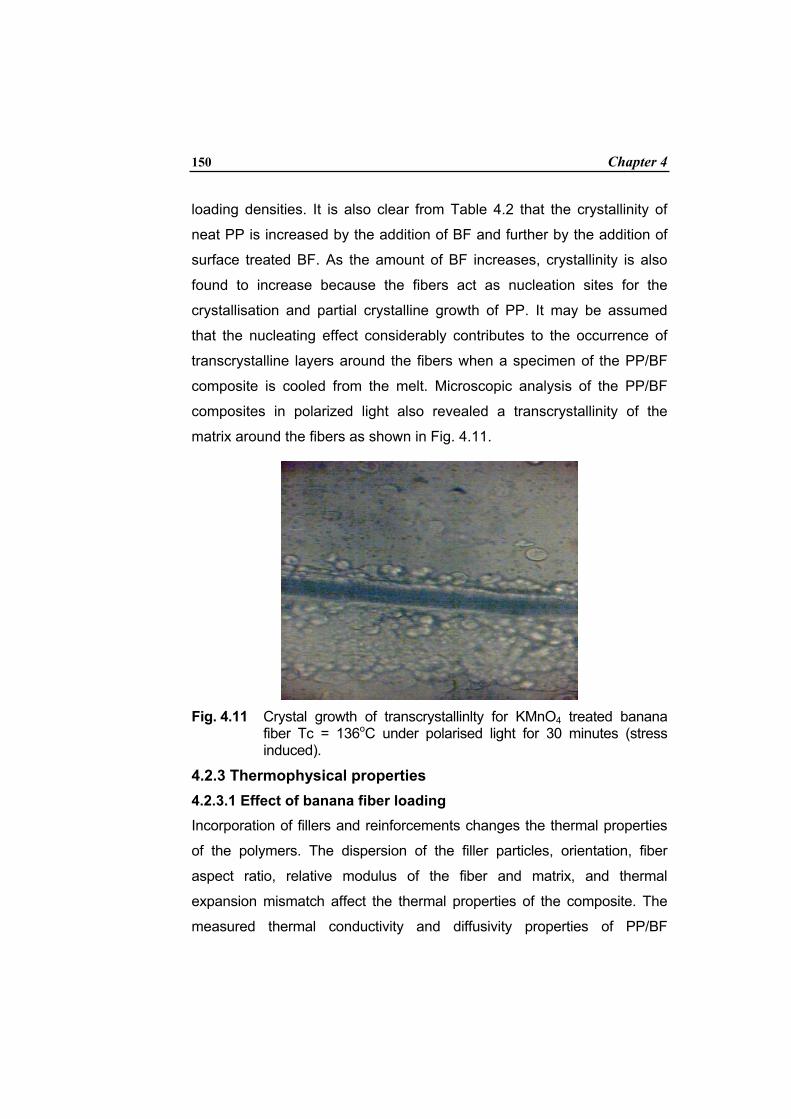
composite is cooled from the melt. Microscopic analysis of the PP/BF
composites in polarized light also revealed a transcrystallinity of the
matrix around the fibers as shown in Fig. 4.11.
Fig. 4.11 Crystal growth of transcrystallinlty for KMnO4 treated banana
fiber Tc = 136oC under polarised light for 30 minutes (stress induced).
4.2.3 Thermophysical properties 4.2.3.1 Effect of banana fiber loading Incorporation of fillers and reinforcements changes the thermal properties
of the polymers. The dispersion of the filler particles, orientation, fiber
aspect ratio, relative modulus of the fiber and matrix, and thermal
expansion mismatch affect the thermal properties of the composite. The
measured thermal conductivity and diffusivity properties of PP/BF

Thermal Properties 151
composites with their associated uncertainties under two different fiber
loadings are given in Table 4.3. The density measurements and specific
heat calculations are also given in the same table. It can be seen from the
table that when the BF loading is increased, there is a significant decrease
of both thermal diffusivity and thermal conductivity (i.e., from 0.24 Wm-1K-1
for neat polypropylene matrix to 0.217 and 0.157 Wm-1K-1 for 10% and
50% respectively) of composites. Similar behavior was reported by Idicula
et al. [22]. When the fiber loading increases, due to the hollow cellular
structure of the fibers, they act as insulators, which causes a decrease of
conductivity. Thus, the addition of BF in the PP matrix decreases the heat
transport in the composite. Moreover, the polar cellulosic –OH groups are
involved in inter and intra molecular hydrogen bonding making them less
available for conduction when compared to the PP matrix.
Table 4.3 Thermal conductivity, thermal diffusivity, density and specific heat of PP/banana fiber composites.
Samples k (W.m-1.K-1)
a (×10-7 m2.s-1)
Cp (J.kg-1.K-1)
p (kg.m-3)
Neat PP 0.240 ± 0.001 1.66 ± 0.04 1588 ± 42 910 ± 10
10% BF composites 0.217 ± 0.002 1.43 ± 0.07 1642 ± 104 924 ± 36
50% BF composites 0.157 ± 0.002 1.05 ± 0.03 1522 ± 72 982 ± 35
The specific heat values (Table 4.3) for 10% and 50% fiber composites do not
have significant change due to the high uncertainty bounds obtained for this
parameter. However, density increases with the increase in fiber loading while
the thermal diffusivity behavior is similar to that of the thermal conductivity i.e,
decreases with the increase of the fiber loading.

152 Chapter 4
The effective thermal conductivity of polymers filled with natural fibers
can be represented using simple theoretical models. In fact, when the
ratio between the thermal conductivity values of the matrix and the fibers
is lower than 10, a first-order model can be used to estimate the effective
thermal conductivity of the composite. The simplest alternative is to
represent the composite material using two components arranged in
either parallel or series with respect to the heat flow (Fig.4.12). This gives
the upper (ksup) and lower (klow) bounds of effective thermal conductivity:
( )supParallel model 1P fk k kϕ ϕ= − + (4.5)
( )inf
11Series model P fk k kϕ ϕ−
= + (4.6)
where kp and kf are the thermal conductivities of the polymeric matrix and
the fibers respectively and ϕ is the fiber volume fraction.
0 10 20 30 40 50 60 70 80 90 1000.10
0.12
0.14
0.16
0.18
0.20
0.22
0.24
0.26
k (W
.m-1.K
-1)
ϕvol. (%)
Experimental Data Series model
kf = 0.122 +/- 0.005 W.m-1.K-1
Fig.4.12 Comparison of PP/banana fiber composites thermal conductivity with series conduction model.

Thermal Properties 153
In Fig.4.12, experimental data of PP filled with BF is plotted as a function
of BF loading. The use of the series conduction model (Eq. 4.6) allowed
to estimate the transverse thermal conductivity of BF. The value obtained
was: kf = 0.1166 ± 0.0001 Wm-1K-1. The curve corresponding to this
model was added on Fg.4.12. A good agreement between experimental
data and the fitting model is observed. It can be seen that both thermal
4.2.3.2 Effect of chemical treatment of the banana fiber The effect of chemical treatment of the BF on the thermophysical
properties and density values of the composites can be understood from
the values given in Table 4.4 with their uncertainties.
Table 4.4 Thermal conductivity, thermal diffusivity, specific heat and density of PP/banana fiber (50%) composites
Samples k (W.m-1.K-1)
a (×10-7 m2.s-1)
Cp (J.kg-1.K-1)
p (kg.m-3)
Untreated BF composites 0.157 ± 0.002 1.05 ±0.03 1522 ± 72 982 ± 35
Benzoylated BF
composites 0.182 ± 0.002 1.31 ±0.07 1370 ± 91 1012 ± 38
KMnO4 treated BF composites 0.168 ± 0.002 1.22 ±0.06 1265 ± 77 1088 ± 37
2% NaOH treated BF composites 0.163 ± 0.003 1.19 ±0.05 1352 ± 77 1013 ± 34
10% NaOH treated BF composites 0.178 ± 0.003 1.31 ±0.10 1305 ±114 1041 ± 40
Triethoxy octyl silane treated composites
0.160 ± 0.005 1.13 ±0.09 1417 ±132 999 ± 36

154 Chapter 4
conductivity and diffusivity values of the chemically treated fiber
composites (50%) are higher than that of the BF composites. This
indicates that chemical treatment of the BF increases the thermophysical
properties irrespective of the nature of the treatment. Another observation
is that NaOH concentration has an influence on the thermophysical
properties of the composites. The 10% NaOH treated composites
showed higher thermal conductivity and diffusivity than 2% NaOH treated
composites. The efficiency of different treatments on thermal diffusivity is
found in the following order: benzoylated >10% NaOH treated >KMnO4
treated >2% NaOH treated >silane treated >untreated composites.
However, it is important to note that a significant increase of the thermal
conductivity is observed only for benzoylated and 10% NaOH treated
composites. In fact, for this case the thermal diffusivity and thermal
conductivity of benzoylated composite is higher than the one of untreated
composites by 25% and 16% respectively. As a result of benzoylation,
the hydrophilicity of the fiber is reduced. This makes the fiber more
compatible with hydrophobic PP matrix, thereby increasing the properties
of the composite. The sodium hydroxide pretreatment before
benzoylation results in partial removal of hydrogen bonding in cellulosic
chains and make the fiber surface more reactive for benzoylation [36].
The improved thermophysical properties of the composite is attributed to
the presence of -C6H5 groups in benzoylated BF which favours the way
for better interaction with PP. Scheme of the reaction of the benzoylation
process on the surface of the BF is shown in [Chapter 3, Fig.3.9]. Upon
benzoylation, the fiber diameter decreases and hence the aspect ratio
increases. This may be due to the dissolution of alkali soluble fractions
like waxy layer, lignin etc. during alkali treatment and benzoylation.
Moreover, the treatment provides a number of small voids on the surface

Thermal Properties 155
of fiber that promote mechanical interlocking between the fiber and the
PP matrix [37].
The thermal conductivity and diffusivity of NaOH treated fiber composites
are higher than that of BF composites because the NaOH treatment
removes a certain amount of lignin, wax and oils covering the external
surface of the fiber cell wall. The effect of alkali on BF is a swelling
reaction, during which the natural crystalline structure of the cellulose
relaxes. When hemicellulose is removed, the inter fibrillar region is likely
to be less dense and less rigid and thereby makes the fibrils more
capable of rearranging themselves [37]. The fiber surface shows more
fibrillation which can be attributed to the removal of hemicellulose and
lignin. This effect becomes more pronounced as the concentration of
NaOH increases. 10% NaOH treated fiber shows more fibrillation than
2% NaOH treated fiber which is evident from the SEM microphotograph
as shown in Fig 4.13. As the concentration of NaOH is increased from 2
to 10%, the thermal conductivity and diffusivity of the composite are
increased by 9% and 10% respectively.
a b
Fig. 4.13 Scanning electro micrographs of alkali treated banana fiber (a) 2%NaOH treated (b) 10% NaOH treated
Thermal diffusivity of silane treated composite is 8% higher than that of
untreated composites. When BF is immersed in the aqueous solution of

156 Chapter 4
silane, the chemical bonds (R1 –Si-O) as well as hydrogen bonds are
established between the –OH group of the fiber surface and R1-Si- (OH)3
molecules. The long hydrophobic polymer chain of polymerized silane
can adhere to the matrix by Vander Waals attractive forces. As a result,
silane coupling agents form a bridge at the interface of the BF and PP
matrix and act like a compatibilizer, which binds two incompatible
polymers [38-39]. Fig. 4.14 shows the interface of the silane treated fiber.
Fig.4.14 Schematic representation of interface of the silane treated fiber
In the case of permanganate treated fiber composite, thermal diffusivity is
increased by 13% compared to untreated fiber composites. This can be
explained in terms of permanganate induced grafting of PP on to BF as
shown in scheme 4.1.
Cellulose─ H + Mn (111) → Cellulose─ H ─ Mn (111) (Complex)
Cellulose─ H ─ Mn (111) (Complex) → Cellulose. + H + ++ Mn (11)
Cellulose. + PP → Cellulose PP.
Cellulose PP. + n PP → Cellulose PP. n+1
Cellulose PP. n+1 + Mn (111) → Cellulose PP
n+1+ Mn (11)+ H+
Scheme 4.1 Reaction of permanganate with banana fiber

Thermal Properties 157
The highly reactive Mn3+ ion is responsible for the grafting reaction. Thus
all the chemical treatments allow a better contact between the
components of the composite i.e, (fiber/matrix) and reduce considerably
the thermal contact resistance between the fibers and the polymeric
matrix.
4.3 Conclusions TG curve of BF showed weight loss of around 6% before 100oC due to
moisture loss. The DTA showed exothermic peaks starting around 230oC
and 450oC with a peak temperatures around 320oC and at 500oC
corresponding to hemicellulose and cellulose decomposition. The
average weight of the solid residue at 500oC was in the range 6-8%.The
activation energy for the first stage and second stage decomposition of
BF was calculated to be 132 kJ/mol and 163 kJ/mol respectively. The
higher activation energy for the second stage was because of the char
formation. The chemically treated BF decomposed at a higher temperature
than untreated fiber indicating higher thermal stability for the treated fiber.
Thermal stability was found higher for benzoylated fiber followed by NaOH
treated fiber and KMnO4 treated fiber. The thermal degradation behavior of
the composites has a two stage decomposition pattern. Crystallization
studies revealed an increase in the crystallinity and crystallization
temperature of neat PP by the incorporation of BF and further by the
addition of chemically treated BF. Microscopic analysis of the PP/BF
composites with polarized light revealed a transcrystallinity of the matrix
around the fibers. The incorporation of BF into PP matrix induced a
decrease of the effective thermal conductivity of the composite. All the
chemical treatments enhanced both thermal conductivity and diffusivity of
the composite considerably to varying degrees. This indicated that the
chemical treatment allowed a better contact between the fiber and the
matrix and reduced considerably the thermal contact resistance.

158 Chapter 4
References
1. S. Ouajai and R. A. Shanks. Polym. Degrad. Stab. 89, 327, 2005.
2. S. Panthapulakkal and M. Sain. Compos. Part A 38, 1445, 2007.
3. Y-F. Shih. Materi. Sci. Engineering: A 445-446, 289, 2007.
4. C. Albano, J. Gonzalez, M. Ichazo and D. Kaiser. Polym. Degra.
Stab. 66, 179, 1999.
5. E.S. Zainudin, S.M. Sapuan, K. Abdan, M.T.M. Mohamad.
Materials and Design Article in press xxx 2008.
6. A. Arbelaiz, B. Fern´andez, J.A. Ramos and I. Mondragon.
Thermochimi. Acta 440, 111, 2006.
7. N. Sgriccia and M.C. Hawley. Compos. Sci. Technol. 67,1986,
2006.
8. J. Kaloustian, T. F. El-Moselhy and H. Portugal. Thermochimi.
Acta 401, 77, 2003.
9. S. Soares, G. Camino and S. Levchik. Polym. Degra. Stab. 49,
275, 1995.
10. K. Bilba, M-A. Arsene and A.Ouensanga. Bioresource Techno.
98, 58, 2007.
11. Y. F. Shih. Bioresource Technol. 98, 819, 2007.
12. L. T. Vlaev, I. G. Markovska and L. A. Lyubchev. Thermochimi.
Acta 406, 1, 2003.
13. M. Jaffe, G. Collins and J. Menczel. Thermochimi. Acta 442,95,
2006.
14. Y. Wu and D. Dollimore. Thermochimi. Acta 324, 49, 1998.

Thermal Properties 159
15. J. R. Willis. J. Mech. Phys. Solids 25, 185, 1977.
16. S. Normura and T.W Chou. J. Compos. Mater. 14, 120, 1980.
17. H. Hatta and M. Taya. J. Appl. Phys. 58, 2478, 1985.
18. C.H. Chen and Y.C. Wang. Mech. Mater. 23, 217, 1996.
19. S. W. Kim, S. Oh and K. Lee. Radiation Phys. Chemi. 76, 1711, 2007.
20. X. Li, L. G. Tabil, I. N. Oguocha and S. Panigrahi. Compos. Sci.
Technol. 68, 1753, 2008.
21. R. Agrawal, N.S. Saxeena, M.S. Sreekala and S. Thomas. J.
Polym Sci Part B: Polym. Phy. 38, 916, 2000.
22. M. Idicula, A. Boudenne, L. Umadevi, L.Ibos, Y. Candau and S.
Thomas. Compos. Sci. Technol. 66, 2719, 2006.
23. P.V. Joseph, K. Joseph and S. Thomas, C.K.S. Pillai, V.S Prasad,
G. Groeninckx and M. Sarkissova. Compos. Part A 34, 253, 2003.
24. H. Yang, R. Yan, H.Chen, D. H. Lee, D.T. Liang and C. H.
Zheng. Fuel Process. Technol. 87, 935, 2006.
25. A. Ouensanga and C. Picard. Thermochimi. Acta 125, 89, 1988.
26. A. W. Coats and J.P. Redfern. Nature 201, 68, 1964.
27. A. W. Coats and J.P. Redfern. Polym Lett. 3, 91,1965.
28. L .A. P. Maqueda, P. E S-Jimenez and J. M. Criado. Polymer 46,
2950, 2005.
29. J.H. Fynn and L. A. Wall. J. Polym. Sci. Part B. Polymer Comm.
4, 323, 1966.
30. A. K. Saha, S. Das, R.K. Basak, D. Bhatta and B.C.Mitra. J Appl.
Polym. Sci. 78, 495, 2000.
160 Chapter 4
31. J.H. Chan and S. T. Balke. Polym. Degra. Stab. 57, 135, 1997.
32. J. Yang, R. Miranda and C. Roy. Polym. Degra. Stab. 73, 455,
2001.
33. E. Schulz, G. kalinka and W. Auersch. J. Macromole. Sci.Phys.B 35,
527, 1996.
34. C. Wang and L. M. Hwang. J. Polym. Sci.Part B: Polym. Phys. 34,
1435, 1996.
35. C. Wang and L.M.C. R. Liu. Polymer 38, 4715, 1997.
36. K.C.M. Nair, S.M. Diwan and S.Thomas. J. Appl. Polym. Sci. 60
1483, 1996.
37. S. H. Aziz and M.P. Ansell. Compos. Sci. Technol. 64, 1219,
2004.
38. M. N. Belgacem and A. Gandini. Compos. Interfaces 12, 41,
2005.
39. M. Bengtsson and K. Oksman. Compos. Part A 37, 752, 2006.