THERMAL PERFORMANCE OF FAÇADES - Payette · THERMAL PERFORMANCE OF FAÇADES 2012 AIA UPJOHN GRANT...
135
RESEARCH Final Report | November 2014 THERMAL PERFORMANCE OF FAÇADES 2012 AIA UPJOHN GRANT RESEARCH INITIATIVE
-
Upload
truongthien -
Category
Documents
-
view
226 -
download
4
Transcript of THERMAL PERFORMANCE OF FAÇADES - Payette · THERMAL PERFORMANCE OF FAÇADES 2012 AIA UPJOHN GRANT...

RESEARCH
Final Report | November 2014
THERMAL PERFORMANCE OF FAÇADES
2012 AIA UPJOHN GRANTRESEARCH INITIATIVE


THERMAL PERFORMANCE OF FAÇADES
2012 AIA UPJOHN GRANTRESEARCH INITIATIVE
PAYETTE290 Congress St., Fifth FloorBoston, MA 02210-1005617-895-1000payette.com
Primary Investigators:Charles Klee, AIA, LEED APAndrea Love, AIA, LEED AP BD+C
Researchers:Miep Keller, AIA, LEED AP Jeff Abramson, AIA, LEED APMarceli Botticelli, LEED APMatthew Fickett, AIA, LEED APWesley Schwartz, AIADaniel Gonzales Brenes, AIA, LEED AP BD+CRobert Carroll, AIA, LEED AP BD+CEdin KostovicNick Lavita, Assoc. AIA, LEED GAMollica Manandhar, AIA, LEED AP


1
THERMAL PERFORMANCE OF FAҪADES
Executive Summary
This investigation seeks to quantify the effects of thermal bridging in commercial facades and then propose alternative solutions to improve performance. Utilizing infrared images taken from targeted assemblies at 15 recently completed buildings; we have determined the actual performance and R-values of a range of façade types and conditions. We have compared these fi gures with the theoretical R-values calculated using materials specifi cations to quantify the discrepancy between theoretical design and actual performance. Although several insulation assemblies performed well without thermal bridging losses, complete assemblies were typically in the order of 50% less effective than the theoretical model. In certain complex assemblies, the research identifi ed facades with as much as a 70% reduction in effective R-value.
Having understood the magnitude of the problem that is faced by typical construction detailing, the purpose of this investigation is to study methods for improving typical details to bring the theoretical and actual performance into closer alignment. Based on thousands of images collected, we identifi ed 16 areas of thermal bridging that might commonly occur in commercial structures using industry standard details. Broken into two broad categories of façade systems and transitions/penetrations, they address systems such as curtain wall supports, rain screens, existing wall renovations and transitions such as parapets and foundation wall systems.
In order to test the benefi ts of proposed improvements, we developed 2-D heat transfer simulations of the observed conditions and calibrated these models to the data measured in the fi eld. The thermal modeling provided insight into the most infl uential paths of heat transfer which helped to direct the efforts of pursuing detailing improvements.
Not surprisingly, assemblies with external insulation or uninterrupted insulation performed quite well. Systems with complex façade anchoring structures as are often used for brick veneer or rain screens, on the other hand faired more poorly. The research suggests that continuous penetrations such as traditional shelf angles and z-girts have a signifi cant effect on thermal performance. The impacts of the assemblies can be substantially mitigated through discontinuous support that spans through the insulation. Improvements can be further reinforced by specifying low-conductivity materials avoiding aluminum and carbon steel.
Looking beyond the most typical façade details, the study also explores improvements to interfaces such as around windows and at roof and fl oor transitions. These assemblies tend to see comparatively high levels of thermal bridging and while they may not drive building heating and cooling loads, they can lead to performance concerns. In particular, the localized increased heat transfer associated with anomalous penetrations can lead to thermal comfort or condensation issues.
The study concludes that with relatively modest changes, typical façade detailing can be signifi cantly improved to ensure that the structures we build perform as anticipated. Awareness of thermal bridging has been elevated over the past few years and this has led to the development of new materials and products marketed to address the problems. Our research suggests however, that there are no easy solutions and careful detailing must be coupled with the selection of non-conductive materials that penetrate through insulation barriers intermittently.

2
Introduction
Over the past twenty years, we have seen renewed interest in reducing the energy demand of buildings. At the building code level, groups such as ASHRAE have been steadily raising the bar on performance criteria for building envelopes and systems. Initiatives such as the AIA 2030 Commitment and the Department of Energy Building Technologies Program’s energy saving goals go further to push the industry towards Net-Zero solutions within the next 15 to 20 years. The challenge faced by designers is to fi nd and implement the technologies and solutions that can practically and economically affect the energy demands of our buildings. While the past ten years has seen a sharp increase in the attention paid to solar gain and protecting windows from the sun, far less progress has been made into managing conductive losses through improved building insulation performance. Increasing the thickness of insulation materials will only go so far if we fail to consider how discontinuities such as thermal bridging affect the overall performance of the system.
Thermal bridging in building construction occurs when thermally conductive materials penetrate through the insulation creating areas of signifi cantly reduced resistance to heat transfer. These thermal bridges are most often caused by structural elements that are used to transfer loads from the building envelope back to the building superstructure. Though design professionals generally understand that thermal bridging is a concern, few can quantify the extent of its impact on building performance. With only a vague sense that this is a problem, it is unclear how aggressively we
should work to minimize and mitigate the inevitable presence of thermal bridges. General research that has been published suggests that thermal bridges in conventional construction may reduce insulation effectiveness by as much as 40% (Morrision Hershfi eld 2011).
Considering this, we can see that the energy impact associated with thermal bridges will quickly become the dominant source of conductive losses as we increase insulation thickness in our pursuit of higher R values. This fails to acknowledge, however, that in many climate zones, energy code and standards already mandate “continuous insulation” values which are intended to take thermal bridges into effect. It is defi ned as follows:
Continuous Insulation: Insulation that is continuous across all structural members without thermal bridges other than fasteners and service openings. It is installed on the interior or exterior or is integral to any opaque surface of the building envelope. (ASHRAE 2010)
Accepting that this is an issue, the challenge becomes trying to evaluate how our facades perform and what can be done to improve them. Up until fairly recently, building construction was relatively simple and envelopes were essentially monolithic or limited to one or two layers of dissimilar materials. Because of this, the performance of traditional masonry and residential wood frame construction are better understood. Modern commercial and more progressive residential construction, however, involves layered construction including rain screens, air barriers, vapor
Chart of heat fl ow through wall assembly and thermal bridgeInsulation Thickness
U-V
alue
Insulation Heat FlowThermal Bridge Heat Flow
Current Code Requirements
Diagram of current layered facade construction

3
retarders, and a multitude of insulation technologies. The variables and interactions of these systems are complex and no longer suited to the simple arithmetic analysis that formed the basis of heat loss calculations 30 years ago.
The intent of this research is to bring rigor to the investigation of thermal bridges in commercial construction, both by quantifying and understanding how built façades are actually performing, and also to investigate proposed improvements to common problem details. By using thermal imaging equipment to quantify actual performance of built installations, we are able to calibrate theoretical models and suggest quantifi ed performance improvements. Coupled with computer models of the assemblies in these images, we have investigated the impact of the thermal bridges and proposed improvements. Preliminary results suggest that it is possible to affect 50% or greater reductions in the impact of common thermal bridges by using careful detailing and products that are readily available on the market.
Process Overview
The research project comprised of a multistep approach, starting with fi eld observations of existing assemblies, followed by computer simulations of existing details and proposed thermal improvements.
Determining Design Intent R-values
Hand calculations of R-values based on the resistance of each layer of the envelope were based on shop drawings, construction documents, and/or Specifi cation information, as appropriate. The surface resistance for air fi lms, thermal resistances of plane air spaces, and material conductance when not known from manufacturer or project information, were taken from Chapter 26 of the 2009 ASHRAE Handbook Fundamentals. (ASHRAE 2009) Because these simplifi ed one-dimension calculations do not take into account any thermal bridging, these values were used as the “baseline R-value” in our research as the best case scenario. It follows, that assemblies whose observed and simulated R-values
were similar had minimal thermal bridges. If there was a larger discrepancy between the hand-calculated, simulated R-value and observed R-value, thermal bridging was generally found to be playing a signifi cant role in decreasing the thermal performance of the assembly.
In Field Observations
In order to understand how façades are performing in the fi eld, we used a thermal imaging camera to locate areas of reduced performance and then determine the actual R-value of the area in question. Because we had access to a wide variety of common commercial envelope types and would similarly have access to the as-built detailing and materials submittals, we limited our investigation to projects that had been designed by our fi rm.
Two-person teams were deployed to 15 buildings and were asked to assess the general envelope thermal performance as well as scan the building envelope for areas that appeared to be performing differently. Because errors in calculating the R-value with the camera are minimized when the outdoor-to-indoor temperature difference is the largest, the teams went out to take measurements on cold days where the average outdoor daytime temperatures were less than 40˚F. Care was taken to avoid façades that were currently, or had recently been, in direct sun or were subject to internal heat sources or other factors that would skew results.
23
24
25
26
27
28
29
9:56:05
10:01:05
10:06:05
10:11:05
10:16:05
10:21:05
10:26:05
10:31:05
10:36:05
10:41:05
10:46:05
10:51:05
10:56:05
11:01:05
11:06:05
11:11:05
11:16:05
11:21:05
11:26:05
11:31:05
11:36:05
11:41:05
11:46:05
Example of external temperature data logger
Tem
pera
ture
Time

4
After collecting all of the fi eld information, the research team reviewed more than 1,300 thermal images. These were considered relative to our Contract Documents in order to identify the conditions that were most directly tied to thermal bridging issues as opposed to construction defects. This process served to eliminate problem areas such as missing insulation or air infi ltration through discontinuities in air/vapor barriers (though it may be fair to say that infi ltration could also be a factor in decreasing the thermal performance).
Using the methodology tested by Madding (2008), we gathered the exterior air temperature, interior air temperature and the radiant temperature in order to calculate the as-built R-value of the assembly. The interior surface temperature of the façade was obtained from the infrared image, while simultaneously, a temperature data logger recorded the exterior air temperature. Using the time stamp on the thermal images, we were able to select the corresponding outdoor temperature with the infrared image.
To obtain the interior air temperature we fanned a piece of card stock for a few minutes, to bring it to air temperature, and then photographed it with the thermal imaging camera. Half of the card stock was covered in crumpled aluminum foil so that it would refl ect the radiant temperature as well. This is possible because aluminum foil has a very low emissivity; it acts as a heat mirror and refl ects the radiant temperature of the surface it is facing.
The air fi lm is based on convective and radiant heat fl ow, which can be determined from the exterior air temperature, interior air temperature, radiant temperature, wall surface temperature and interior wall emissivity. The thermal images we took gave us the surface temperature, and because the interior air temperature, radiant temperature, as well as the temperature change across the façade was also known, we could determine the temperature change across the interior air fi lm and the percentage of the total temperature change that represented. Because of this, the R-value of the entire assembly could then be determined. Our researchers used the R-Value Energy Savings Estimator spreadsheet provided by the camera manufacturer to calculate the R-values from the thermal images based on the collected temperatures. (Madding 2008) Using the camera software, we were able to hone in on areas within the thermal image that we were interested in to determine the average wall surface temperature, as well as the average indoor temperature and radiant temperatures from the cardboard and aluminum foil. These three temperatures, as well as the exterior temperature from the data logger and the wall emissivity that was determined by the surface material of the wall from ASHRAE, provided the inputs required for the R-value calculator.
The thousands of images from 15 recently completed buildings were collected and organized by assembly type and noted conditions that were likely to affect performance (i.e., the transition to a foundation wall or adjacency of a window). Having established a library of data that was primarily focused on thermal bridging issues, the research team was able to identify themes based on recurring problematic areas. We noted that they fell generally into two categories: one that is related to the structure that supports the façade and roof systems, and one that is more about material transitions and penetrations. Understanding these categories, we identifi ed a handful of typical conditions that were selected for further investigation and analysis.
Images of cardboard and aluminium foil tool used to determine air and radiant temperatures
Average 69.9°F
Average 71.5°F

5
Simulated Performance
Because we would not be able to physically alter the built conditions, our methodology proposed to use computer simulations to test possible improvements to various construction details. We selected the Lawrence Berkeley National Laboratory’s THERM program, a 2D heat fl ow simulator, to determine R-values of complete assemblies including thermal bridges. For each detail, the fi rst step in our process was to prepare THERM models of the constructed designs, which were then calibrated to the actual performance measured in the fi eld with the thermal imaging camera. Because neither THERM nor the camera are a perfect technology, the process of calibrating the simulations with the thermal images allowed us to ensure that the models were accurate representations of what was observed in the fi eld. With a validated THERM model in place, we were then comfortable trying design improvements and comparing the relative performance against the fi eld measured performance.
THERM is a two dimensional heat fl ow simulator where a plan or section of the envelope area is modeled by defi ning the conductivity of each material and the surface conductances and temperatures. (Lawrence Berkeley National Laboratory 2011) As with the hand calculations, the values from the 2009 ASHRAE Handbook Fundamentals were used when actual values were not known for various materials. The interior and exterior air temperatures were determined by the actual measurements made at the time of the relevant thermal image.
Because THERM is a two dimensional heat fl ow simulator, however, it is slightly limited in its ability to consider complex three-dimensional assemblies. It assumes that all modeled elements are continuous into and out of the screen. For discontinuous thermal bridges, such as bolts or clips, two methods were used to account for their three dimensional impact: the Parallel Path method and the Isothermal
Planes method. Because the Parallel Path method tends to underestimate the impact of the thermal bridge and the Isothermal Planes method tends to overestimate its impact (Griffi th, et al. 1998), the average of the two methods has been shown to be closest approximation. (Love 2011)
The Parallel Path method uses the weighted average of two simulations, one of the clear wall without the discontinuous
Measured Parallel Path Isothermal Planes Averaged°C °C % Different °C % Different °C % Different
Nylon, 229mm 12.4 11.5 -7.3% 11.5 -7.3% 11.5 -7.3%
Stainless, 457mm 11.0 11.3 +2.7% 10.5 -4.5% 10.9 -0.9%
Stainless, 305mm 10.8 11.2 +3.7% 10.1 -6.5% 10.7 -0.9%
Stainless, 229mm 10.7 11.1 +3.7% 9.8 -8.4% 10.5 -1.9%
Stainless, 152mm 10.5 10.9 +3.8% 9.2 -12.4% 10.1 -3.8%
Stainless, 76mm 9.4 10.3 +9.6% 7.9 -16.0% 9.1 -3.2%
Steel, 229mm 8.8 11.1 +26.1% 7.7 -12.5% 9.4 +6.8%
Average ±8.1% -9.7% ± 3.5%Average Surface Temperature Results Comparision of Measured and THERM Simulations (Griffi th 1997)
Three THERM Simulations for Discontinuous Thermal Bridges (R-8.7)
Isothermal Planes Simulation (R-6.2)
Parallel Path Simulation with Thermal Bridge (R-3.5)
Parallel Path Simulation without Thermal Bridge (R-11.8)

6
element, and the other with the bridging element. A weighted average based on the depth and spacing of the element in the dimension that is not drawn into and out of the screen, is taken of the results from the two simulations. The Isothermal Planes method is performed with one simulation, where a weighted average of the conductivities of the discontinuous bridging element and the clear wall material is used to create a new material with the new conductivity for the discontinuous thermal bridging element. The weighted average is based on the depth and spacing of the discontinuous element into and out of the screen, as with the Parallel Path method.
Once models of the existing conditions were established, we were able to better understand the thermal bridges inherent in the design, and develop alternative details that would improve thermal performance. Working from both the graphical and quantitative output from THERM, we strategically probed the models to identify the signifi cant heat transfer elements within a given detail, and ultimately predict the performance improvements that might result from changes in detailing. This was particularly benefi cial in the context of comparing different design options or the benefi ts of specialty products targeting thermal bridging performance.
Thermal Bridging Area of Investigation : Façade System
Our investigation fell into two categories: façade systems, and assembly transitions. After evaluating our fi eld data, we identifi ed fi ve basic façade types that would be generally applicable to modern commercial and institutional work and
appeared to refl ect slightly different challenges. These were: rainscreens, masonry veneer walls, insulated metal panels, curtain walls and the renovation of existing masonry façades.
Rainscreens
Rainscreens have become increasingly popular for commercial façades in the past few decades due to their ability to control air and moisture movement. Because the cladding is held off the wall structure to form a drainage cavity while accommodating insulation and a robust air and vapor barrier, these systems require a secondary structural system of rails, Z-girts, and/or clips to support the cladding. Typically made of highly conductive metals, these structural members penetrate through the insulation causing signifi cant thermal bridges. While insulation between steel studs has long been acknowledged in the industry to cause thermal bridging, these rainscreen supports have a similar impact thermally that until recently was widely overlooked.
In our thermal images of rainscreen façades, we observed a decrease in thermal performance that ranged from 20% to 60% less than the design intended performance, with the majority around a 45-55% decrease. The systems we selected for study all had between two to three inches of insulation. We looked at a rainscreen with horizontal Z-girts, vertical Z-girts, and a clip-based system. Not surprisingly, the continuous Z-girts, whether horizontal or vertical, performed similarly. In both orientations, Z-girts demonstrated an R.7.7 reduction in the assembly’s R-value or roughly a 45-55% reduction in performance depending on the insulation thickness.
The façade with the clip system for the rainscreen performed much better than those with continuous Z-girts. Because of the intermittent nature of the clips, these systems performed well both in thermal images and in the computer modeling. The clip support system had half of the heat fl ow of the Infrared Image of Z-girt supports at a Rainscreen
Examples of thermally broken rainscreen supports

7
Z-girts, or a 25% of the design intent. While the intermittent nature of the support system certainly improved the performance, we investigated ways to further improve the performance of rainscreen support systems.
A number of thermally broken Z-girt and rainscreen support systems currently exist on the market. As part of the research project, the team explored three of the thermally-broken options available. The fi rst removed the support through the insulation with horizontal and vertical tube supports on the exterior and allowed only the stainless steel bolts to penetrate the insulation. The second system investigated a fi ber glass clip system. This has the benefi t of being intermittent, similar to the previous clip, but also uses a material that is more than 200 times less conductive than steel. The third system investigated was a discontinuous steel bracket with isolator pads on both the warm and cold side of the insulation, in order to minimize heat fl ow through the brackets. All three of the tested systems performed well. In general the R-value of the assemblies was only reduced by 10-15% due to thermal bridging through their support systems and so they achieved a minimum of R-20 with four inches of insulation.
Masonry Veneer Walls
Masonry veneer wall systems are common for many building types in North America. Because they are rarely load bearing, they are dependent on shelf angles and a grid of tie-backs to structurally stabilize the assembly. Unfortunately, these supports and attachments form substantial thermal bridges that can dramatically decrease the overall thermal performance of the facades. In our observations with the thermal camera, we found masonry veneers generally performed at a 25-60% decrease in R-value when compared to theoretical calculations.
While masonry veneers can be supported without shelf angles by bearing on the foundation for limited heights, continuous shelf angles are typically required to support heights over two stories, and supporting every story is common in order to minimize defl ection joints. These shelf angles typically run from close to the face of the masonry back through to the
superstructure, passing through the insulation layer. Taken alone, these steel shelf angles account for an approximate 35% decrease in the R-value. That fi gure would be far worse if the steel was protected with highly conductive coated copper fl ashing as it may have been several years ago. Today, we might consider using a membrane fl ashing and making the entire angle out of stainless steel (which has 1/3 the conductivity of carbon steel). This sort of change could reduce the performance impact of the shelf angle from 35% down to 29%.
In order to truly minimize the thermal impact from the shelf angle, however, we investigated an option, advocated by Building Science Corporation (Lstiburek 2008), of supporting the shelf angle with evenly spaced blades or brackets that allow the shelf angle to remain entirely outboard of the insulation, thereby creating intermittent rather than continuous thermal bridges. Providing a thermal break between the brackets and the shelf angle and then conservatively assuming these brackets are spaced at 48” inches on center, results in a substantial improvement in performance. In this system we saw only a 12% decrease in the R-Value from the support structure. This could be reduced down to 3% if the blades were made of stainless steel.
In addition to the shelf angle, metal ties are typically required in masonry veneers to provide lateral support. Surprisingly though these installations are discontinuous, they occur so frequently that they can have a signifi cant impact on assembly R-values. With typical spacing somewhere between 16 and 24 inches on center, horizontally and vertically, ties can contribute up to a 15% decrease in the thermal performance. Because spacing, material conductance, and type of tie all impact the R-value for masonry walls, we looked at a matrix of three types of ties: a screw-on tie, a barrel tie, and a thermally-broken tie. We looked at these options at both 16- and 24-inch spacing in steel and stainless steel. The choice of steel or stainless steel proved to have the biggest impact on performance, with the R-values at an average of 6% improvement, whereas the larger spacing of the ties and the choice of tie type both showed an average of a 4%. Stainless steel ties spaced 24 inches on center, which have minimal
Traditional brick shelf angle Thermally broken brick shelf angle Metal Panel w/ Uninsulated Joints Metal Panel w/ Insulated Joints

8
diameter of material penetrating the insulation, were shown to have a negligible impact on the thermal performance, decreasing the R-value by only 2%. Combined with the shelf angle held off by the blades, the thermal performance of masonry veneer façades can be improved substantially from the traditional approach.
Metal Panel Wall Systems
Insulated metal wall panels are popular because they can be a simple and economic strategy for cladding a building. Because the insulation is integral to the cladding and is sandwiched between two metal skins, the cladding support structure does not act as a thermal bridge. However, we observed that the joints between the panels become critical to maintaining thermal integrity for the system. Due to different approaches to the joints, a large discrepancy was observed in the thermal images between the different options, with some at 60-70% less than the baseline R-value and others at only about 3% thermal degradation.
The joints were revealed to be the key difference between metal panels that perform poorly and those that performed well. In the poor performing options, the metal front of the panel wraps through the joint, providing a thermal bridge that greatly undermines performance. The option that performed well, in both the infrared image and the simulation, was backstopped at the gap between connecting panels. The backstop was made of insulation which was wide enough to make a continuous thermal barrier. The simplicity of this joint detail shows how careful detailing can lead to a dramatic improvement in thermal performance.
Curtain Walls
The mullions of curtain walls have long been understood to act as thermal bridges within vision glazing systems. Building codes and other energy standards provide maximum allowable U-values for the whole assembly, accounting for the
frame, the edge of the glass that has been de-rated by the frame and the center of glass performance. In most curtain wall buildings, however, this is only part of the installation. Areas between fl oors and sometimes across the façade are blanked off to create spandrel panels and these are insulated in a variety of ways. However, because the mullions are simply part of the system, few of us really consider the thermal impact the mullions can have circumventing the insulation. Our thermal images demonstrated that these areas are often substantial sources of heat transfer and the magnitude of the problem is amplifi ed by the density of the mullions and the conductivity of the pieces.
Because curtain wall frames are typically made of highly conductive aluminum, which is about four times more conductive than steel, and go from the exterior of the building through to the interior, they are signifi cant thermal bridges. To combat this, a thermal break in the assembly, which is usually ¼ of an inch to one inch thick and made of a less conductive polyester reinforced nylon, has become a typical component in modern curtain walls. The thermal break is located between the face plate and the structural part of the mullion, the rail, in-line with the glazing pocket. This creates a “cold” side for the portion of the frame in front of the glass, and a “warm” side with the structure on the backside. When insulation is added in a spandrel panel, it is most often added along the backside of the panel, between the innermost surfaces of the rails, and is often supported with a metal back pan. Unfortunately, the insulation creates a “warm” side and “cool” side of mullion rail and completely disconnects the thermal barrier of the insulation from the thermal break in the frame. Observed installations that used this detail, had a 70% decrease in thermal performance.
As the industry has progressed over the past few years, we have become savvier. We did have examples of projects where attempts were made to explore alternative approaches to thermal bridges at spandrel panels. The fi rst option that we looked at included spray foam inserted into the rail in
Insulation within MullionInsulation between Mullions Wrapped Mullion Insulation Glazed In

9
an attempt to create a more insulated structural part of the mullion and continuity between the insulation and the thermal break. As might be expected, this showed little improvement over the same rail fi lled with air, because the heat is conducted by the aluminum, which is unaffected by the insulation inside the frame. The resulting assembly still refl ected a 60% decrease in the thermal performance.
The second alternative added a two-inch thick by six-inch tall band of insulation along the back side of the curtain wall rails. This created the promise of a continuous thermal barrier on the backside of the assembly. However, because the rigid insulation is fl ammable and subject to damage, it included a metal backpan and that was wrapped around the sides and attached to mullion frame. Much like the case of the insulated mullion, the metal pan created a continuous path from warm to cold and though it was very thin, provided an effi cient path for heat loss. This too showed a 60% decrease in thermal performance. In our modeling we determined, however, that if the metal pan was removed from the assembly and the insulation could be held in place by a non-conductive material, the thermal performance decrease could be reduced to only 17%.
Though it involved a less conventional, and more expensive curtain wall, the last detail studied was a structurally glazed steel frame curtain wall with triple glazed insulating glass units. Because this system inherently keeps the mullions in-board of the glass, it restricted thermal bridges even for spandrel conditions. The spandrels saw an approximate 30% reduction in the R-value over theoretical calculations and the spandrels achieved an R-15 for the assembly.
Insulating Existing Buildings
Spray applied insulation is gaining popularity, particularly because of its ability to fi ll unseen voids and provide an integral vapor barrier. In the northeast, it is a particularly popular technology for renovating existing, uninsulated
masonry and cast in place concrete facades. Conventional details often call for metal studs to support interior gypsum board and these studs live in the same space as the insulation, creating discontinuities at 16” or 24” center spacing. While the web of the steel studs is quite slender, they are highly effective heat transfer devices because of the conductivity of the material and the fl anges, which provide signifi cant contact area to collect and disperse heat.
Thermal images of the renovation of three separate existing buildings revealed dramatically different results. The fi rst case, had applied 3” of insulation, the second employed just 2” of insulation, and third used 3.5”. While hand calculations of the thermal resistance would show the façade with the least insulation to be the weakest performer and the one with the most insulation to be the best, the thermal images revealed a different story. The 3” of insulation included steel
Studs directly attached to existing wall59% of baseline calculated R-value
Studs pulled 1” back from existing wall16% of baseline calculated R-value
Studs separated from insulation2% of baseline calculated R-value
Infrared Image showing studs directly attached to existing wall

10
studs fl ush against the exterior construction, resulting in an R-value that was 55% less than the calculated R-value. The second building pulled the studs back by 1”, allowing for half of the applied insulation to be continuous and decreasing the R-value by only 15%. Consequently, that façade was observed to have a higher R-value than one with the studs penetration through to the exterior, despite having less insulation. The third façade took the studs back even farther, completely separating them from the insulation and as a result the simulated R-value was nearly identical to the measured values.
Our study showed that the continuity of the fi rst inch is critical to the effi ciency of the spray foam insulation performance. By simply pulling the studs in-board, even by a small amount, to allow a percentage of the insulation to be uninterrupted, the assembly R-value can be increased by about 70%. In the event that the studs are required to support exterior sheathing, it should be possible to fasten the sheathing using discontinuous and non-conductive shims or spacers so that, once again, the majority of the insulation in that outer 1” layer remains continuous. Nevertheless, small changes in the design can still lead to dramatic improvement in performance.
Thermal Bridging Area of Investigation: Transitions
Where façade systems seem to be good candidates for systemic improvements that might be universally applicable, assembly transitions appear to be more project-specifi c. Our research did show, however, that certain themes seem to recur in the design of intersecting materials and knowledge of those themes will likely lead to improved detailing even in highly-customized scenarios. In our investigation we found the most thermally problematic conditions at window installations, foundation-to-wall transitions, changes in wall systems, soffi ts, roof-to-wall transitions, parapets,
roof penetrations, louver openings, existing buildings with embedded beams and slabs, and seismic and movement joints. As with the façade systems, we used thermal images and computer simulations to study these areas and seek potential paths for improvement.
Window Transitions
In terms of thermal performance, windows have long been known to have inferior thermal performance to walls, but it is not as widely known that thermal bridges associated with their installation also derate the performance of the surrounding wall systems. For this research, we focused on window transitions and how they impacted the adjacent thermal barrier. The loss that occurs around a window, typically through the structural components in the wall, is called fl anking loss (Lstiburek 2011). The poor performance of the area directly surrounding the window assembly was caused by both the structural requirements for supporting the window and the diffi cult transition of the various materials that create thermal, moisture, and air barriers. These problems are exacerbated when the design calls for the windows to move in and out of plane with the main thermal barrier of the wall system.
When a window assembly is set back from the thermal barrier, for example, an additional level of complexity is added to the detail. The thermal barrier must maintain continuity as it transitions to the mullion, but in many cases, when a window is recessed, the structure supporting the window and often the wall, gets in the way of continuous insulation. In our study we noted the façade area adjacent to a recessed window to have an approximate 60% loss in thermal performance and this was directly tied to steel angles and other miscellaneous metals that were used to transfer loads associated with the window and its opening.
The thermal performance of window assemblies that are
Window recessed from insulation Window proud of insulation Window inline with insulation

11
pushed towards the exterior of the envelope can be similarly complex because the thermal break in the frame typically sits toward the front of the assembly, and therefore requires complex horizontal connections. Because the whole assembly tends to be proud of the main insulation line of the building, there is a tendency to expose the sides of the window frame and induce fl anking loss directly through the mullions. Of course this can be mitigated by wrapping the frame with insulation, but this leads to a thick profi le around the glazing unit which is not usually consistent with the visual intent of the design.
Beyond the fl anking losses of the mullion, windows that are proud of the superstructure can be more challenging to support vertically. Generally the cantilevers associated with such an assembly are heavier and more complex than a more traditional installation and these lead to more frequent and heavier thermal bridges. Similar to the recessed windows, we saw an approximate 60% reduction in R-value of walls immediately adjacent to windows of this type.
When we consider the detailing complexities associated with moving insulation layers into and out of plane, it appears that keeping windows in line with the main insulation line of the building is the confi guration most likely to avoid diffi cult thermal bridges. Even so, however, we noted that conventional window installation can still fall prey to the challenges introduced by framing and support. In some tests we saw conventional installations that were still seeing a 45-60% decrease in the R-value in the vicinity of windows. These reductions were directly attributed to issues such as blocking, fl ashing, and other insulation interruptions at the window perimeter.
Understanding the challenges of these sorts of installations, we studied several approaches to mitigating fl anking losses while still trying to preserve minimal sight lines around window openings. The underlying goal of these approaches was to develop a continuous line of insulation that tracks to the thermal break within the window frame. In one promising concept, we proposed glazing an insulated metal panel into the mullion pocket around the perimeter of a recessed window. This resulted in a 20% reduction in heat fl ow through the assembly over the more traditional installation.
In addition, it is clear that whenever the façade requires structure to move in or out of plane with the main
superstructure, this will lead to substantial performance impact.
It is essential to avoid continuous support and assure that outriggers or brackets are used to create only the bare minimum number of thermal bridges. In one test case, we replaced a continuous section of tube steel with intermittent blades that cantilevered out to support a brick lintel and effected a 68% reduction in heat fl ow through the assembly. While our study was typically based on brackets spaced at 48” +/- on center, it should also be possible to increase spans well over 96” to realize far greater performance (at the expense of heavier structure).
Foundation to Wall Transitions
The wall transition above the foundation wall is consistently a problematic area for thermal performance. This transition has been observed to affect the wall R-value by as much as 70-75% for three factors. The transition of wall assemblies is usually necessary because most wall assemblies above grade are not able to withstand conditions below grade. The switch of wall assemblies usually results in an offset and discontinuity of the insulation. The second reason this is a diffi cult area to detail is that this offset typically occurs at the termination of waterproofi ng which results in the metal fl ashing spanning across the insulation, creating an additional thermal bridge. The third factor to take into account is that the transition often occurs where the slab on grade meets the foundation wall. The structural stability of the connection creates another discontinuity of the insulation that is hard to overcome.
To determine ways to improve the performance we looked at a number of options for improved details. The fi rst was a structural thermal break in the concrete slab where it connects
Infrared image of structural support at window proud of insulation

12
to the foundation wall for a foundation wall that was insulated on the interior. This allows for some thermal continuity between the slab insulation and the interior insulation. The most improved option was a concrete foundation wall built of a sandwich panel with insulation integral within the concrete. This allowed the insulation to be as continuous as possible with the above grade insulation, and minimizes the shelf condition at grade.
Transitions between Wall Systems
Just as thermal bridging was observed at the foundation wall transitions, when there are multiple façade systems employed thermal bridges have been observed at the interface between systems. Common sources of loss were observed because of the complexity introduced due to two systems coming together and the challenge of maintaining the thermal barrier across the transition. In these interfaces the decrease in the R-value was observed to range between 50-80%.
Improved details were developed with the goal of limiting the complexity, aligning the insulation between systems and the minimizing the amount of systems transitions were seen to improve performance. As with most façade systems, careful
attention should be paid to how systems are supported at the perimeter.
Soffi ts
Envelope transitions from vertical systems to horizontal ones and then back vertical again require complex support structures that are well known to complicate air and vapor barrier installations, and often lead to complex thermal bridges that are diffi cult to eliminate elegantly. When looking at comparatively small areas such as a soffi t, these complex assemblies take on a disproportionate role in the area of the assemblies in question and so when they are evaluated on their own, the R-value of the assembly adjusted for thermal bridges can be quite low. Beyond just the structural complications of beam to column interfaces, these sorts of assemblies usually include material transitions which will often require blocking or other accessory installations for anchorage and fastening. Considering soffi ts in particular, we observed R-values with a 35-70% reduction in performance over baseline.
To improve the performance of soffi ts, we studied a number of different potential improvements. As with other envelope conditions, we looked at minimizing continuous elements such as Z-girts with intermittent stand-off bolts, or using non-conductive materials such as fi berglass. These strategies were found to increase R-value of the soffi t by 65%. Additionally, while typically, we fi nd that structure is best when kept on the warm side of the insulation, soffi ts may prove to be an area where this is not quite as clear due to the complexity of holding up the exterior face of the soffi t. If the material is inherently insulative, such as a metal foam panel, this issue will not present itself, but otherwise, it can be advantageous to concentrate the structural thermal bridges in a few, carefully planned penetrations of the insulation system and then treat all of the soffi t construction in much the same way as we would a rainscreen.
Roof to Wall Transitions
Transitions from roofi ng systems to a wall systems, which occur when building massing steps back at upper fl oors, pose similar challenges. We found the continuity of the thermal barrier was often compromised in typical detailing due to fl ashing, blocking, and structural supports. In the infrared images taken, many were noted to have a 40-75% decrease
Infrared image looking at the foundation wall transition
THERM Simulation and detail of the foundation wall transition

13
in the R-value in areas where this transition occurred. Some of these installations demonstrated that more aggressive detailing readily addressed the problem. Because gravity assists in the performance of these systems (unlike soffi ts) the structural complexities associated with changes in direction can be mitigated easily and with careful attention, we can minimize blocking and control fastener placement, and select non-conductive fl ashing materials minimizing thermal bridges.
Parapets
Another location where the wall interfaces with the roof is at the top of the building where there is often a parapet. Using common construction techniques, these unique assemblies typically maximize envelope surface area near a complex interface which can have the impact of emphasizing the effect of a thermal bridge and increasing heat fl ow. Unfortunately, it is rarely possible to effectively photograph these conditions from the inside and quantify the assembly R-values in the fi eld with an infrared camera. Knowing this was an issue for heat loss, however, we were still able to perform simulations and study the impact of changes.
We found that the structure required to support the parapet, whether it is concrete or cold form metal framing, typically leads to a considerable gap between the façade insulation generally on the exterior of the parapet and the roof insulation which runs on the interior. Furthermore, wood nailers, cant strips and other roofi ng accessories tended to exaggerate these impacts.
One question we found intriguing was whether it was
better to insulate around the parapet thereby covering all structural interfaces, or underneath it by fi nding a way to design a structural connection that effectively attaches the parapet after installation of the insulation. Since there are many variables in the detailing of a parapet, we started with a sensitivity analysis of parapet height normalized to one construction type. Because the degree of impact of the assembly depends on how much of the building we are looking at in conjunction with the parapet, we also normalized on an extracted detail that includes 24” in height of inside wall surface and 48” in length of inside roof surface. These were based off the Morrison Hershfi eld (Morrision Hershfi eld 2011) report’s fi ndings on the effective length that a parapet affects the heat fl ow in these assemblies.
Starting with a well-insulated parapet, the study into the impact of height showed that there was about a 6% decrease in assembly R-value for every 15” increase in the parapet height. This is due simply because the additional surface area acts like a fi n that radiates. Considering these results, we concluded the best way to avoid a diminishing R-value is to insulate beneath the parapet, thus effectively eliminating the negative impact from the height of the parapet.
Moving into greater detail, we also studied typical construction methods for parapet systems. Considering cold formed metal framing parapets and cast-in-place concrete assemblies, we found that R-value were reduced from a theoretical system 63% and 50%, respectively. This decrease in thermal performance was largely due to the large gap in insulation that occurred at the parapet. We also studied a third case where a cold formed metal framing parapet had been installed
THERM Simulation of roof to wall transition with continuous insulationTHERM Simulation of roof to wall transition
14
over continuous insulation, however, that design had relied on metal kickers which we found virtually eliminated the performance gains.
We studied two systems for improving the typical details. The cold formed metal framing option had continuous insulation under the parapet to the façade insulation to create a continuous thermal barrier. To support the structure of the parapet, we added a metal framing structure and included intermittent connection back to structure using lower-conductivity materials such stainless steel bolts. This increased the R-value in the assembly by 25-65% when compared to the baseline system. For the concrete parapet, we tested a commercially available structural thermal break designed for concrete slabs (balconies) and installed this in a vertical orientation. This improvement decreased the heat fl ow through the assembly by 27%.
Roof Penetrations
By their very nature, roofs present a large number of challenges in terms of maintaining a continuous thermal boundary. While roof drains, plumbing vents, and the like may be unavoidable and largely immutable, the impacts of other penetrations can be minimized through careful detailing. As part of our exploration, we considered skylights, balcony railings and roof davits as common conditions.
Skylights are generally recognized to have inferior thermal performance, and this is demonstrated through the fact that energy codes allow signifi cantly higher U-values for skylights than windows. Because they frequently omit thermal breaks in the frame and larger openings typically require additional structure, there is signifi cant thermal loss around the perimeter of traditional skylight installations. Additionally, for drainage reasons the thermal barrier of the insulated glazing unit in a skylight typically protrudes above the roofi ng assembly, and just as with vertical windows that are proud
of the façade, this requires more complicated detailing to try to maintain a thermal barrier. Wrapping the skylight frame in an insulated metal panel and ensuring thermal continuity throughout the skylight support dramatically improves its thermal performance.
On roofs that require access, railings and the structure required to support them can create substantial thermal bridges. At one building that we studied, there was a continuous bottom rail of an all-glass railing that was supported by steel tubes down to the slab below. Because the tubing interrupted the insulation, this sort of installation duplicated the typical conditions we expect to see with a continuous relieving angle on a brick veneer wall. By changing the material of the bottom rail to stainless steel and introducing a thermal break between the rail and the steel supports, we were able to minimize thermal bridging. Our modeling showed that such an approach reduced the heat loss through the assembly over 50%.
Roof davits and other structural elements like roof dunnage present a similar challenge. These often penetrate through the roof to be connected directly to the building superstructure. While these individual occurrences may be so small that they have no signifi cant impact total heat loss, we found they are often worth considering in humidifi ed environments due to the threat of condensation. Looking specifi cally at davits, we considered several directions for improvement. To begin with, we proposed to cover the exterior of the davit with an insulated “sock” that could be removed when in use. However, because the steel of the davit is still penetrating from outside to inside the thermal barrier, the improvement in interior surface temperatures was minimal. Creating a structural thermal break with two steel plates (one on either side of the insulation) led to signifi cant improvements, however.
Mechanical Louvers
Another area in the exterior envelope system where the continuity of the thermal barrier can often be lost is around the opening for mechanical louvers. The thermal loss around louvers, though not as signifi cant as other thermal bridges studied, seem to primarily be a resultant of drawing coordination and construction sequencing. Because the insulation of the plenum is most often shown on the mechanical drawings and the wall system on the architectural
THERM Simulation of parapet: insulating around(left) versus insulating under the parapet(right)

15
drawings, details are frequently not coordinated to show the thermal continuity through the detail. The mechanical plenum drawings stop at the interior side of the wall, whereas the architectural drawing set most often shows the insulation remaining on the plane of the exterior, leaving a gap in the building envelope between the two systems. Coordinating drawings to show continuity of the thermal barrier from the envelope through to the mechanical plenum will improve the thermal performance around louvers.
In addition to the thermal bridges caused from the discontinuity between mechanical and architectural drawings, if a plenum is built sitting on the fl oor of the mechanical room, if often is uninsulated at this location. Louvers that can instead be supported intermittently to allow for the thermal barrier to pass across the envelope system with minimal thermal breaks will considerably improve thermal performance.
Beam Embeds in Existing Buildings
Since existing buildings are typically insulated from the interior during a renovation, the structural members can cause substantial thermal bridges. In load bearing masonry buildings, common in the Northeast, the bearing support for beams are often embedded in the exterior wall causing the steel beam to penetrate the insulation and causing a signifi cant thermal bridge. This was observed in thermal images to decrease the thermal performance of the adjacent wall by 72% in thermal images. In photographed details, Tefl on spacers had been used where the angles connected the embedded steel to the beam web. Because the beam was still extending through the insulation, the spacers which were intended to lessen the thermal bridge from the beam did not have a signifi cant impact.
While existing beams pose a diffi cult challenge to improving this condition, when new structural beams are added as part of the renovation, there is an opportunity to improve the façade’s thermal performance. An alternative option was investigated that employed a structural thermal break at the thermal barrier of the envelope. Many manufactures have thermal breaks for structural steel connections, however because structure typically needs to be fi re rated, careful review of the thermal break options is needed as only a few met both the thermal and fi re rating requirements for the connection. The thermal break can be coated in cementitious
Structural thermal break connection examples
Infrared image of beam connection at existing wall
fi re-proofi ng spray along with the rest of the steel and placed in-line with the insulation to reduce the heat fl ow around the surrounding assembly by 36%.
New Slabs in Existing Buildings
Similarly to the embed beams, a fl oor slab will cause a signifi cant thermal bridge since the renovation of existing buildings typically add insulation from the interior that spans from the top of the slab to the bottom of slab. The slabs decrease the R-value of the assemblies by approximately 45%. There may be little that can be done for existing slabs being insulated from the interior, however when a new slab is being added to an existing structure there is an opportunity to thermally improve the performance. By holding the edge of the new slab approximately 5” apart from the back of the existing wall a gap is created that can be infi lled with compressed mineral wool in an insulating fi re-stop detail. The bolts connecting the slab to the exterior wall are still thermal breaks, however this strategy did improve the R-value 31%.
Seismic & Movement Joints
Observations with the infrared camera revealed that seismic and movement joints present signifi cant thermal bridges. R-values of R-2 to R-6 were seen, a substantial decrease from the design intent and the rest of the envelope assembly.

16
By adding insulation to the front and sides of the joint, the R-value of the assembly was seen to be raised to an R-11.5, which is closer to the clear wall R-values for the adjacent assemblies.
Conclusion
Both the thermal images and simulations in our research reveal that thermal bridging is signifi cantly decreasing the thermal performance in commercial envelopes. While this study is by no means intended to be a comprehensive survey of all thermal bridges, it does illustrate some of the numerous thermal bridges that exist, both systematic ones repeated ubiquitously around the façade as well as more idiosyncratic conditions that further undermine thermal performance. The study also shows how careful detailing and attention to the issues of thermal bridging can dramatically improve the thermal performance.
When designing building envelopes, the continuity of a thermal barrier universally across the building envelope is the key to good thermal performance. When maintaining the continuity of insulation is not feasible, designers should evaluate options to minimize the impact of these thermal bridges. The fi rst priority should be to eliminate continuous conductive elements, such as Z-girts or masonry shelf angles, by pulling them out of the thermal barrier and using discontinuous supports to make required connections. Secondly, utilize available thermally broken products to disconnect the heat fl ow through the thermal barrier. For those discrete elements that need to puncture the insulation, employ less conductive materials to minimize heat fl ow through those elements. For example, stainless steel has 1/3 of the conductivity of regular steel and fi berglass’s conductivity is signifi cantly lower than stainless. Employing these simple principles can signifi cantly improve the thermal performance of our building envelopes.
More awareness and education is needed within the building industry on the impact of thermal bridging, so designers become aware of the necessity to focus on careful detailing and specifi cations to combat them. Additionally, there should be a shift in the discussion from the R-value of the insulation that is specifi ed to the R-value of the assembly as designed. Solely focusing on the number of inches of insulation does not give an accurate picture of the thermal performance of the envelope. Free and accessible tools, such as THERM, are
available to enable design teams to evaluate the performance of complex details that cannot be intuitively understood.
Small changes in designs can still lead to dramatic improvement in performance. With careful detailing and attention to the issues of thermal bridging, the design and construction industry can improve the performance of our building envelopes.

17
References
ASHRAE. 2009 ASHRAE Handbook Fundamentals. Atlanta, GA: American Society of Heating, Refrigerating and Air-Conditioning Engineers, Inc., 2009.
ASHRAE. ANSI/ASHRAE/IESNA Standard 90.1-2010 Energy Standard for Buildings Except Low-Rise Residential Buildings. Atlanta, GA: ASHRAE, 2010.
Griffi th, Brent, Elizabeth Finlayson, Mehrangiz Yaz, and Dariush Arasteh. “The Signifi cance of Bolts in the Thermal Performance of Curtain-Wall Frames for Glazed Facades.” 1998 ASHRAE Winter Meeting. San Francisco, CA: ASHRAE, 1998.
Lawrence Berkeley National Laboratory. THERM 2.0 for Analyzing Two-Dimensional Heat Transfer. Berkeley, CA: Regents of the University of California, 1998.
Lawrence Berkeley National Laboratory. THERM 6.3 / WINDOW 6.3 NFRC Simulation Manual. Berkeley, CA: Regents of the University of California, 2011.
Love, Andrea. Material Impacts on Operational Energy Usage. Masters Thesis, Cambridge, MA: Massachusetts Institute of Technology, 2011.
Lstiburek, Joseph. BSI-005: A Bridge Too Far. Building Science Insights, Building Science Corporation, 2008.
Lstiburek, Joseph. Thermal Bridges Redux. BSI-062, Building Science Corporation, 2011.
Madding, Robert. “Finding R-Values of Stud Frame Constructed Houses with IR Thermography.” Inframation 2008 Proceedings vol. 9. Reno, 2008.
Morrision Hershfi eld. Thermal Performance of Building Envelope Details for Mid- and High-Rise Buildings (ASHRAE 1365-RP). Atlanta: ASHRAE Technical Committee 4.4, 2011.
Image Credits
Cascadia Windows & Doors
Euda Wilde
Fabreeka
Knight Wall Systems
Payette
Schock
Thermomass
Warren Jagger


1a
APPENDIX
01 RAINSCREENS ......................................................... pg 2a a.) Vertical Z-Girts b.) Clips c.) Horizontal Z-Girts d.) Thermally Broken Support System e.) Thermally Broken Clip 02 MASONRY WALLS.................................................. pg 14a a.) Masonry Brick Tie Comparison b.) Masonry Shelf Angle Comparison c.) CMU Back Up Wall with Galvanized Ties d.) Stud Back Up Wall with Galvanized Ties e.) Stud Back Up Wall with Galvanized Ties 2
03 METAL PANEL WALL SYSTEMS............................ pg 24a a.) Metal Panel with Insulated Joints b.) Metal Panels with Uninsulated Joints c.) Metal Panels with Continuous Metal Clips
04 CURTAIN WALLS..................................................... pg 30a a.) Insulation Between Mullions (Typical) b.) Insulation within Mullion c.) Wrapped Mullion d.) Insulation Glazed In e.) Improved Option
05 INSULATING EXISTING BUILDINGS...................... pg 40a a.) Studs Directly Attached to Existing Wall b.) Studs Pulled 1” Back From Existing Wall c.) Studs Separated From Insulation
06 WINDOW TRANSITIONS......................................... pg 46a a.) Recessed Relationship with Thermal Barrier b.) Recessed Relationship with Thermal Barrier c.) Recessed Relationship with Thermal Barrier d.) Proud Relationship with Thermal Barrier e.) Proud Relationship with Thermal Barrier f.) Inline Relationship with Thermal Barrier g.) Inline Relationship with Thermal Barrier h.) Inline Relationship with Thermal Barrier
07 FOUNDATION TO WALL TRANSITIONS................ pg 62a a.) Foundation Wall Transition 1 b.) Foundation Wall Transition 2 c.) Foundation Wall Transition 3 d.) Foundation Wall Transition 4 e.) Foundation Wall Transition 5 f. ) Foundation Wall Sandwich Panel Study
08 TRANSITIONS BETWEEN WALL SYSTEMS.......... pg 74a a.) Curtain Wall to Stone Veneer Base b.) Stone Veneer to Curtain Wall
09 SOFFITS................................................................... pg 78a a.) Soffi t at Rain Screen Wall b.) Soffi t at Metal Panel Wall c.) Soffi t at Stone Cladding
10 ROOF TO WALL TRANSITIONS.............................. pg 84a a.) Stud Back Up Wall with Insulation and Blocking b.) Stud Back Up Wall with Continuous Insulation c.) CMU Back Up Wall with Continuous Insulation
11 PARAPETS............................................................... pg 90a a.) Parapet Height Study b.) Insulated Metal Panel Stud Wall c.) Concrete Wall d.) Masonry Cavity Wall
12 ROOF PENETRATIONS......................................... pg 98a a.) Roof Davits b.) Hand Rail
13 LOUVERS............................................................... pg 102a a.) Mechanical Louver at Grade b.) Mechanical Louver at Penthouse
14 EXISTING BUILDING BEAM EMBEDS.................. pg 106a a.) Thermal Break at Structural Connection
15 NEW SLABS IN EXISTING BUILDINGS................. pg 108a a.) Thermal Break at New Slab
16 SEISMIC & MOVEMENT JOINTS........................... pg 110a a.) Joint at Masonry Wall and Existing Building b.) Joint at Curtain Wall and Existing Building

2a
Project Conditions
Location:Date of Thermal Image:
Exterior Air Temperature:Interior Air Temperature:Radiant Temperature:Assumed Emissivity:
As-Built Condition
APPENDIX- 01a | RAINSCREENS: Vertical Z-Girts
Summary of Thermal Performance
Calculated Baseline R-Value:
As-Built ConditionThermal Image R-Value:Simulated (THERM) R-Value:Simulated (THERM) R-Value just support connection:
Thermally Improved ConditionSee 1c-1e
13.86
6.195.60
7.20
-
- 55%- 60%
- 48%
Eastern Massachusetts02/20/2012
37.7 ˚F69.9 ˚F71.5 ˚F
0.9
Calculated Baseline Clear Wall R-value
Material Width
in.
k
Btu·in/h·ft2·˚F
R-value
h·ft2·˚F/Btu
Material Width
in.
k
Btu·in/h·ft2·˚F
R-value
h·ft2·˚F/Btu
4 Air & Vapor Barrier - - -
1 FRC Panel - - - 5 Gypsum Board 0.625 1.10 0.57
2 Air Space - - - 6 Air Cavity 20 - 1.36
- Exterior Air Film - - 0.68 7 Gypsum Board 0.625 1.10 0.57
3 Rigid Insulation 2.00 0.20 10.00 - Interior Air Film - - 0.68
total 13.86
1
3
2
4
5
6
7

3a
Digital Image Infrared Image
APPENDIX- 01a | RAINSCREENS: Vertical Z-Girts
Detail sImulation with only rainscreen support connection
4a
Project Conditions
Location:Date of Thermal Image:
Exterior Air Temperature:Interior Air Temperature:Radiant Temperature:Assumed Emissivity:
As-Built Condition
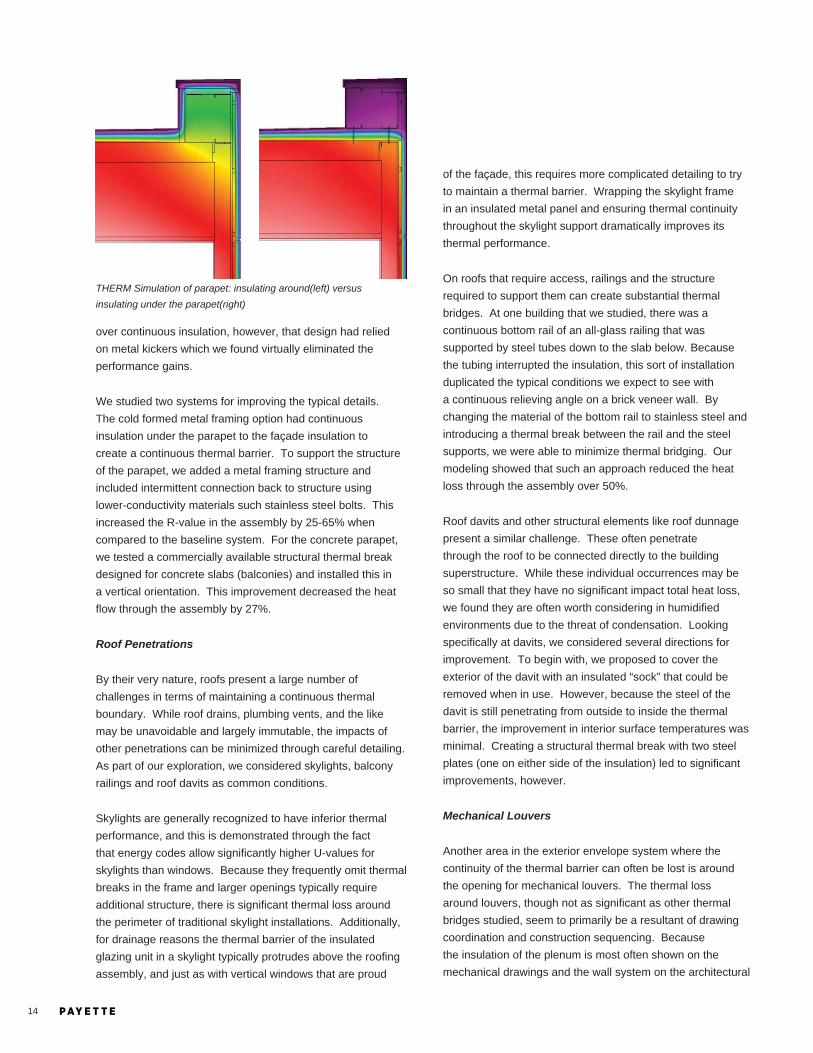
APPENDIX- 01b | RAINSCREENS: Clips
Summary of Thermal Performance
Calculated Baseline R-Value:
As-Built ConditionThermal Image R-Value:Simulated (THERM) R-Value:
Thermally Improved ConditionSee 1c-1e
13.86
9.708.66
-
- 30 %- 38 %
Eastern Massachusetts02/09/2012
34.8 ˚F73.8 ˚F72.3 ˚F
0.9
Calculated Baseline Clear Wall R-value
Material Width
in.
k
Btu·in/h·ft2·˚F
R-value
h·ft2·˚F/Btu
Material Width
in.
k
Btu·in/h·ft2·˚F
R-value
h·ft2·˚F/Btu
4 Air and Vapor Barrier - - -
1 Aluminum Spandrel - - - 5 Gypsum Board 0.625 1.10 0.57
2 Air Space - - - 6 Air Cavity 6 - 1.36
- Exterior Air Film - - 0.68 7 Gypsum Board 0.625 1.10 0.57
3 Rigid Insulation 2.00 0.20 10.0 - Interior Air Film - - 0.68
total 13.86
1
3
2
4
5
6
7
THERM
simulation in plan
5a
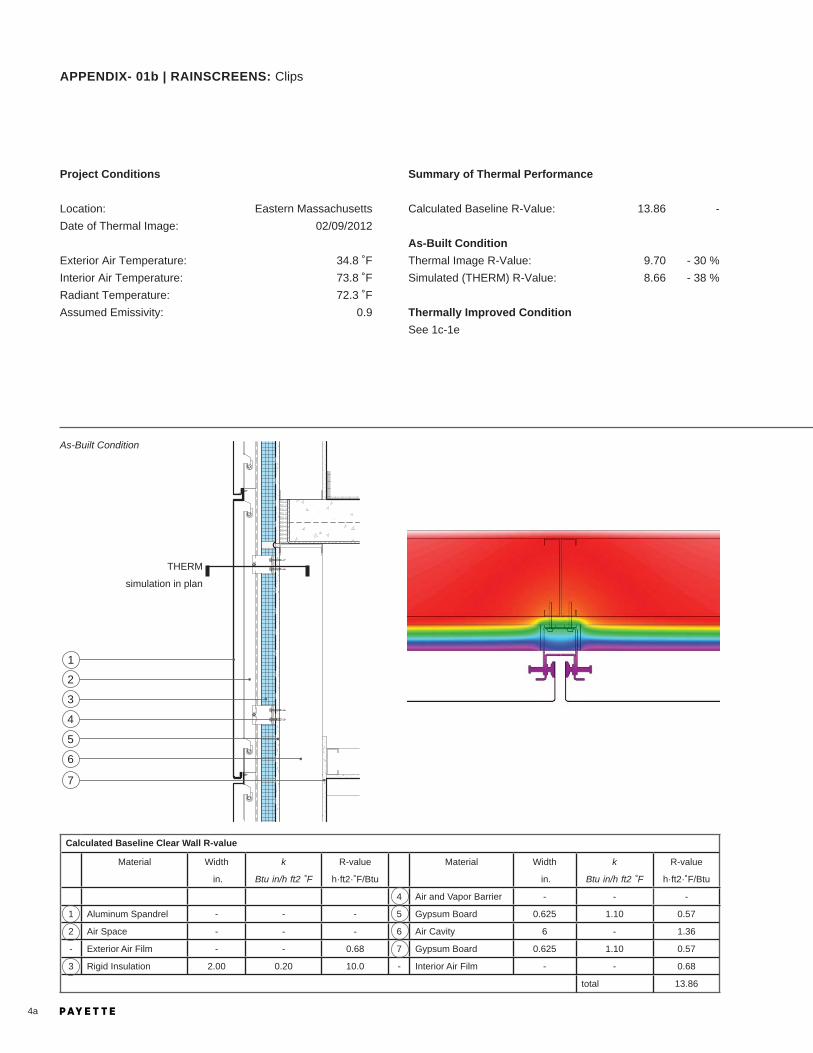
Digital Image Infrared Image
APPENDIX- 01b | RAINSCREENS: Clips
6a
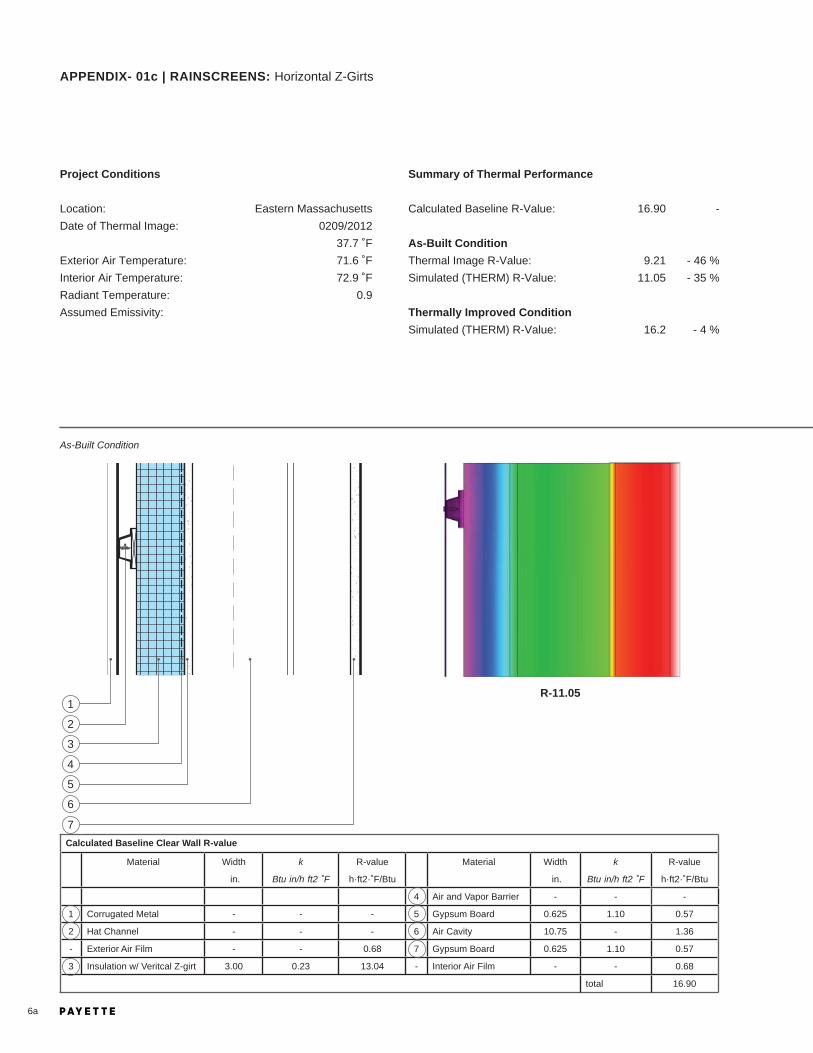
Summary of Thermal Performance
Calculated Baseline R-Value:
As-Built ConditionThermal Image R-Value:Simulated (THERM) R-Value:
Thermally Improved ConditionSimulated (THERM) R-Value:
16.90
9.2111.05
16.2
-
- 46 %- 35 %
- 4 %
Eastern Massachusetts0209/2012
37.7 ˚F71.6 ˚F72.9 ˚F
0.9
Project Conditions
Location:Date of Thermal Image:
Exterior Air Temperature:Interior Air Temperature:Radiant Temperature:Assumed Emissivity:
As-Built Condition
APPENDIX- 01c | RAINSCREENS: Horizontal Z-Girts
R-11.05
Calculated Baseline Clear Wall R-value
Material Width
in.
k
Btu·in/h·ft2·˚F
R-value
h·ft2·˚F/Btu
Material Width
in.
k
Btu·in/h·ft2·˚F
R-value
h·ft2·˚F/Btu
4 Air and Vapor Barrier - - -
1 Corrugated Metal - - - 5 Gypsum Board 0.625 1.10 0.57
2 Hat Channel - - - 6 Air Cavity 10.75 - 1.36
- Exterior Air Film - - 0.68 7 Gypsum Board 0.625 1.10 0.57
3 Insulation w/ Veritcal Z-girt 3.00 0.23 13.04 - Interior Air Film - - 0.68
total 16.90
4
1
5
2
6
3
7

7a
Digital Image Infrared Image
Thermally Improved Condition
APPENDIX- 01c | RAINSCREENS: Horizontal Z-Girts
R-16.2(-46.6%)
vertical Z-girt changed
to thermally broken
support system with
only bolts penetrating
insulation

Project Conditions
Location:Date of Thermal Image:
Exterior Air Temperature:Interior Air Temperature:Radiant Temperature:Assumed Emissivity:
As-Built Condition
8a
APPENDIX- 01c | RAINSCREENS: Horizontal Z-Girts with Fiberglass Clips
Summary of Thermal Performance
Calculated Baseline R-Value:
As-Built ConditionThermal Image R-Value:Simulated (THERM) R-Value:
Thermally Improved ConditionSimulated (THERM) R-Value:
20.86
N/A16.79
N/A
-
N/A-20 %
N/A
Eastern MassachusettsN/A
NANANANA
6
5
4
3
2
1

Thermally Improved Condition
9a
Calculated Baseline Clear Wall R-value
Material Width
in.
k
Btu·in/h·ft2·˚F
R-value
h·ft2·˚F/Btu
Material Width
in.
k
Btu·in/h·ft2·˚F
R-value
h·ft2·˚F/Btu
1 Aluminum metal panel - - - 4 Sheathing 0.625 1.10 0.57
2 Horizontal rail - - - 5 Air Cavity 6 - 1.36
- Exterior fi lm - - 0.68 6 Gypsum board 0.625 1.10 0.57
3 Insul w/ fi berglass clip 4 0.23 17 - Interior Air Film - - 0.68
total 20.86
Digital Image Infrared Image
APPENDIX- 01c | RAINSCREENS: Horizontal Z-Girts with Fiberglass Clips
fi berglass intermittant clip
system is 200 times less
conductive than steel

Project Conditions
Location:Date of Thermal Image:
Exterior Air Temperature:Interior Air Temperature:Radiant Temperature:Assumed Emissivity:
As-Built Condition
10a
APPENDIX- 01d | RAINSCREENS: Thermally Broken Support System
Summary of Thermal Performance
Calculated Baseline R-Value:
As-Built ConditionThermal Image R-Value:Simulated (THERM) R-Value:
Thermally Improved ConditionSimulated (THERM) R-Value:
23.86
N/A21.36
N/A
-
N/A- 10 %
N/A%
Eastern MassachusettsN/A
N/AN/AN/AN/A
9
7
4
8
6
3
5
2
1

Thermally Improved Condition
11a
Digital Image Infrared Image
APPENDIX- 01d | RAINSCREENS: Thermally Broken Support System
Calculated Baseline Clear Wall R-value
Material Width
in.
k
Btu·in/h·ft2·˚F
R-value
h·ft2·˚F/Btu
Material Width
in.
k
Btu·in/h·ft2·˚F
R-value
h·ft2·˚F/Btu
5 XPS Insulation 3.00 0.20 15
- Exterior Air Film - - 0.68 6 Sheathing 0.625 1.10 0.57
1 Metal Panel - - - 7 Polyiso Insulation 1.50 1.5 5.00
2 RS-Rail-Steel - - - 8 Air Space 6 - 1.36
3 RS-Rail-Steel - - - 9 Gypsum Board 0.625 1.10 0.57
4 Stainless Screw - - - - Interior Air Film - - 0.68
total 23.86
horizontal and vertical
supports on the exterior
face of insulation with
only stainless steel
bolts penetrating the
insulation

12a
APPENDIX- 01e | RAINSCREENS: Thermally Broken Clip
Summary of Thermal Performance
Calculated Baseline R-Value:
As-Built ConditionThermal Image R-Value:Simulated (THERM) R-Value:
Thermally Improved ConditionSimulated (THERM) R-Value:
29.86
N/A22.45
N/A
-
N/A -25 %
N/A
Eastern MassachusettsN/A
N/AN/AN/AN/A
Project Conditions
Location:Date of Thermal Image:
Exterior Air Temperature:Interior Air Temperature:Radiant Temperature:Assumed Emissivity:
As-Built Condition
9
6
3
8
7
5
2
4
1

13a
Digital Image Infrared Image
APPENDIX- 01e | RAINSCREENS: Thermally Broken Clip
Thermally Improved Condition
Calculated Baseline Clear Wall R-value
Material Width
in.
k
Btu·in/h·ft2·˚F
R-value
h·ft2·˚F/Btu
Material Width
in.
k
Btu·in/h·ft2·˚F
R-value
h·ft2·˚F/Btu
5 Exterior Sheathing 0.625 1.10 0.57
- Exterior Air Film - - 0.68 6 Air and Vapor Barrier - - -
1 Metal Panel - - - 7 Polyurethane Foam 1.50 0.1664 9
2 Steel Rail - - - 8 Air Cavity 4.5 - 1.36
3 Steel Clip - - - 9 Gypsum Board 0.625 1.10 0.57
4 Mineral Wool 4.00 0.23 17.00 - Interior Air Film - - 0.68
total 29.35
discontinuous steel
bracket with isolator
pads on both warm and
cold side of insulation

14a
APPENDIX- 02a | MASONRY WALLS: Masonry Brick Tie Comparison
16x16 Galvanized Barrel 16x16 Stainless Barrel
Brick Tie Study
This study works with limited variables to see how the spacing,type and material of brick ties affects the R value of the brickvenner wall. The back up assumed for this study is light gaugemetal framing.
R-13.72 (-7%)
R-12.54 (-15%)

15a
APPENDIX- 02a | MASONRY WALLS: Masonry Brick Tie Comparison
16x24 Galvanized Screw 16x24 Stainless Screw
GALVANIZED STAINLESS
R-14.46 (-2%)
R-13.72 (-7%)

16a
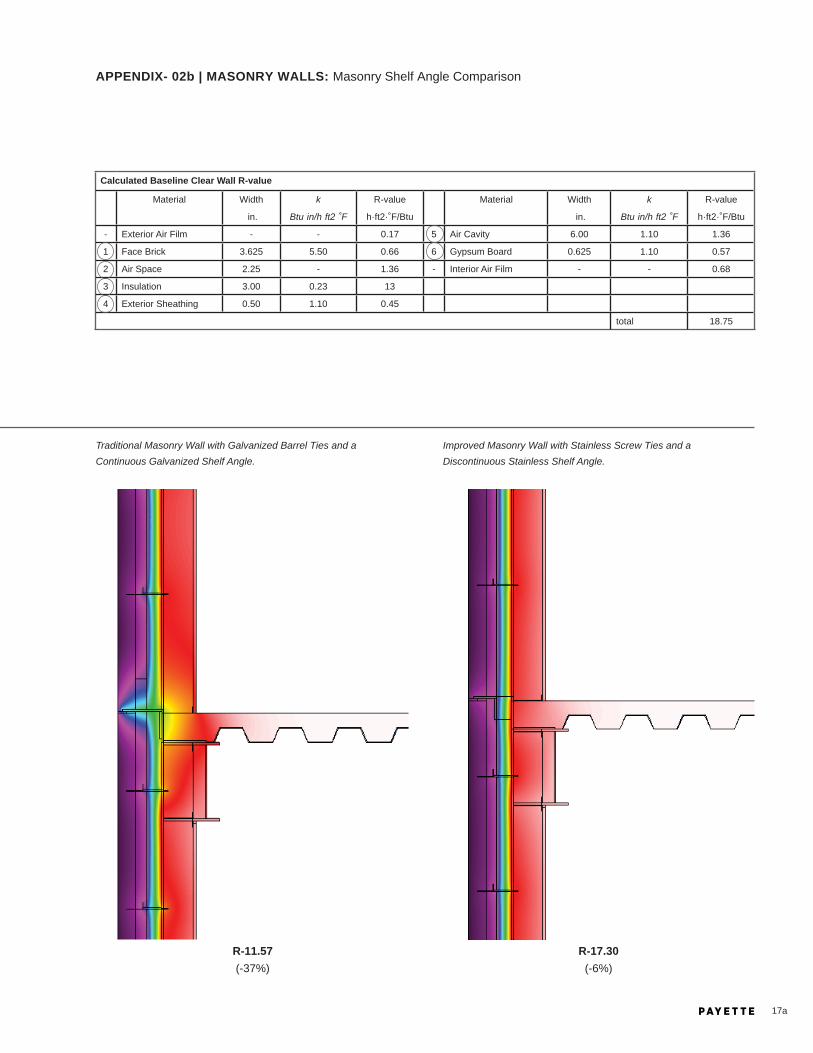
APPENDIX- 02b | MASONRY WALLS: Masonry Shelf Angle Comparison
Continuous Galvanized Shelf Angle Continuous Stainless Shelf Angle
Discontinuous Stainless Shelf AngleDiscontinuous Galvanized Shelf Angle
Shelf Angle Study
This study works with limited variables to see how the material and the continuity of shelf angles affects the R value of the brickvenner wall. The back up assumed for this study is light gaugemetal framing.
In addition this study looked at the tradiational and improved option combined with the brick tie study.
R-12.02 (-35%)
R-13.01 (-29%)
R-17.61 (-3%)
R-16.01 (-12%)
Summary of Thermal Performance
Calculated Baseline R-Value:
As-Built ConditionThermal Image R-Value:Simulated (THERM) R-Value:
Thermally Improved ConditionSimulated (THERM) R-Value:
18.75
N/A18.40
N/A
-
N/A
N/A
17a
APPENDIX- 02b | MASONRY WALLS: Masonry Shelf Angle Comparison
Traditional Masonry Wall with Galvanized Barrel Ties and a Continuous Galvanized Shelf Angle.
Improved Masonry Wall with Stainless Screw Ties and a Discontinuous Stainless Shelf Angle.
R-11.57 (-37%)
R-17.30 (-6%)
Calculated Baseline Clear Wall R-value
Material Width
in.
k
Btu·in/h·ft2·˚F
R-value
h·ft2·˚F/Btu
Material Width
in.
k
Btu·in/h·ft2·˚F
R-value
h·ft2·˚F/Btu
- Exterior Air Film - - 0.17 5 Air Cavity 6.00 1.10 1.36
1 Face Brick 3.625 5.50 0.66 6 Gypsum Board 0.625 1.10 0.57
2 Air Space 2.25 - 1.36 - Interior Air Film - - 0.68
3 Insulation 3.00 0.23 13
4 Exterior Sheathing 0.50 1.10 0.45
total 18.75

18a
APPENDIX- 02c | MASONRY WALLS: CMU Back Up Wall Galvanized Ties
Project Conditions
Location:Date of Thermal Image:
Exterior Air Temperature:Interior Air Temperature:Radiant Temperature:Assumed Emissivity:
As-Built Condition
Summary of Thermal Performance
Calculated Baseline R-Value:
As-Built ConditionThermal Image R-Value:Simulated (THERM) R-Value:
Thermally Improved ConditionSimulated (THERM) R-Value:
15.44
12.313.28
13.68
-
- 20 %- 14 %
- 11 %
Western Massachusetts2/27/2012
46 ˚F68.8 ˚F71.5 ˚F
0.9
Calculated Baseline Clear Wall R-value
Material Width
in.
k
Btu·in/
h·ft2·˚F
R-value
h·ft2·˚F/
Btu
- Exterior Air Film - - 0.17
1 Face Brick 3.625 5.50 0.66
2 Air Space 2.25 - 1
3 Extruded Polystyrene 2.00 0.20 10
4 Air and Vapor Barrier - - -
5 Concrete Block 7.625 8 1
6 Air Cavity 3.625 - 1.36
7 Gypsum Board 0.625 1.10 0.57
- Interior Air Film - - 0.68
total 15.441
3
2
4
5
6
7
R-13.28

19a
Thermally Improved Condition
Digital Image Infrared Image
APPENDIX- 02c | MASONRY WALLS: CMU Back Up Wall Galvanized Ties
both shelf angle and brick
ties changed to stainless
steel (brick shelf is also
discontinuous)
R-13.68 (+3%)
Project Conditions
Location:Date of Thermal Image:
Exterior Air Temperature:Interior Air Temperature:Radiant Temperature:Assumed Emissivity:
As-Built Condition
20a
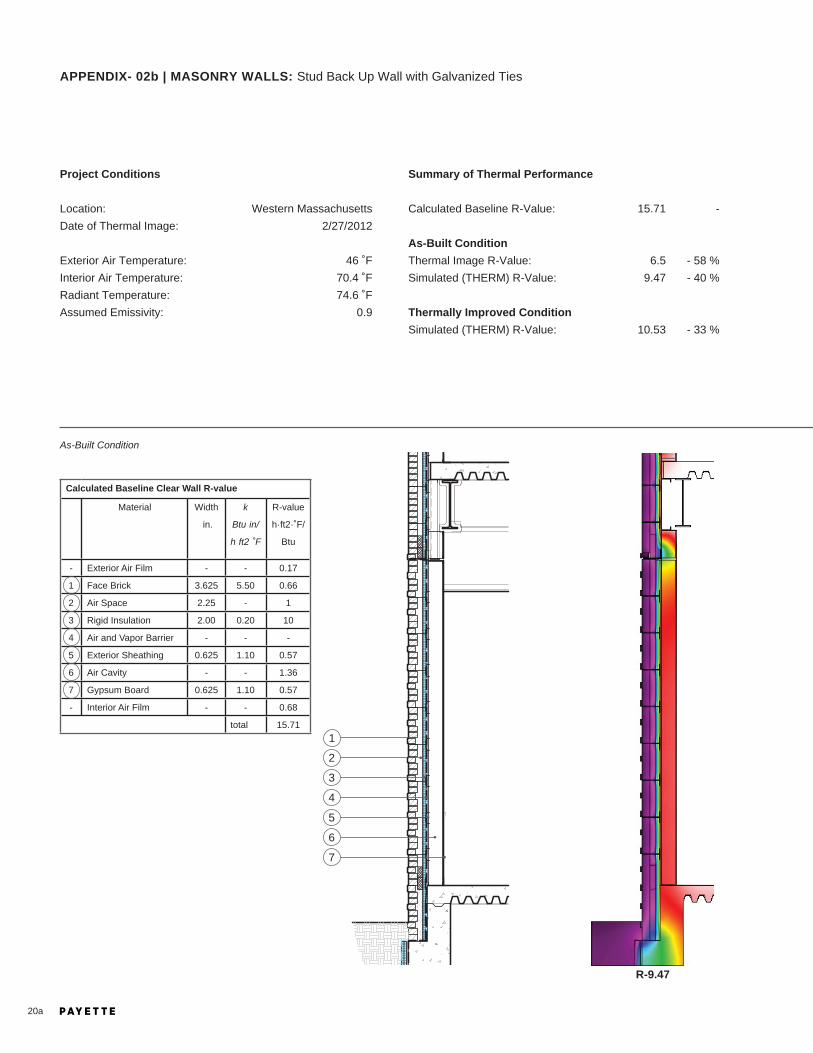
APPENDIX- 02b | MASONRY WALLS: Stud Back Up Wall with Galvanized Ties
Summary of Thermal Performance
Calculated Baseline R-Value:
As-Built ConditionThermal Image R-Value:Simulated (THERM) R-Value:
Thermally Improved ConditionSimulated (THERM) R-Value:
15.71
6.59.47
10.53
-
- 58 %- 40 %
- 33 %
Western Massachusetts2/27/2012
46 ˚F70.4 ˚F74.6 ˚F
0.9
Calculated Baseline Clear Wall R-value
Material Width
in.
k
Btu·in/
h·ft2·˚F
R-value
h·ft2·˚F/
Btu
- Exterior Air Film - - 0.17
1 Face Brick 3.625 5.50 0.66
2 Air Space 2.25 - 1
3 Rigid Insulation 2.00 0.20 10
4 Air and Vapor Barrier - - -
5 Exterior Sheathing 0.625 1.10 0.57
6 Air Cavity - - 1.36
7 Gypsum Board 0.625 1.10 0.57
- Interior Air Film - - 0.68
total 15.711
3
2
4
5
6
7
R-9.47

Thermally Improved Condition
21a
APPENDIX- 02b | MASONRY WALLS: Stud Back Up Wall with Galvanized Ties
Digital Image Infrared Image
both shelf angle and
brick ties changed to
stainless steel
R-10.53 (+11%)

Project Conditions
Location:Date of Thermal Image:
Exterior Air Temperature:Interior Air Temperature:Radiant Temperature:Assumed Emissivity:
As-Built Condition
22a
APPENDIX- 02c | MASONRY WALLS: Stud Back Up Wall with Galvanized Tie #2
Summary of Thermal Performance
Calculated Baseline R-Value:
As-Built ConditionThermal Image R-Value:Simulated (THERM) R-Value:
Thermally Improved ConditionSimulated (THERM) R-Value:
17.89
8.414.43
15.85
-
- 53 %- 19 %
- 11 %
Massachusetts2/9/2012
37 ˚F64.1 ˚F65.3 ˚F
0.9
Calculated Baseline Clear Wall R-value
Material Width
in.
k
Btu·in/
h·ft2·˚F
R-value
h·ft2·˚F/
Btu
- Exterior Air Film - - 0.17
1 Face Brick 3.625 5.50 0.66
2 Air Space 2.25 - 1
3 Mineral Wool 3.00 0.23 13
4 Air and Vapor Barrier - - -
5 Exterior Sheathing 0.50 - 0.45
6 Air Cavity 6 - 1.36
7 Gypsum Board 0.625 1.10 0.57
- Interior Air Film - - 0.68
total 17.891
3
2
4
5
6
7
R-14.43

Thermally Improved Condition
23a
APPENDIX- 02c | MASONRY WALLS: Stud Back Up Wall with Galvanized Tie #2
Digital Image Infrared Image
both shelf angle and
brick ties changed to
stainless steel
R-15.85 (+9.8%)

Project Conditions
Location:Date of Thermal Image:
Exterior Air Temperature:Interior Air Temperature:Radiant Temperature:Assumed Emissivity:
As-Built Condition
24a
APPENDIX- 03a | METAL PANEL WALL SYSTEMS: Metal Panels with Insulated JointsAPPENDIX- 03a | METAL PANEL WALL SYSTEMS: Metal Panels with Insulated Joints
Summary of Thermal Performance
Calculated Baseline R-Value:
As-Built ConditionThermal Image R-Value:Simulated (THERM) R-Value:
Thermally Improved ConditionSimulated (THERM) R-Value:
Calculated Baseline Clear Wall R-value
Material Width
in.
k
Btu·in/h·ft2·˚F
R-value
h·ft2·˚F/Btu
Material Width
in.
k
Btu·in/h·ft2·˚F
R-value
h·ft2·˚F/Btu
4 Air and Vapor Barrier - - -
- Exterior Air Film - - 0.17 5 Exterior Sheathing 0.625 1.10 0.56
1 Insulated Metal Panel 2 0.20 10 6 Air Cavity 15.24 - 1.36
2 Continuous Insulation
at Joint
1 0.20 5 7 Gypsum Board 0.625 1.10 0.56
3 Air Space 0.625 - 1 - Interior Air Film - - 0.68
total 19.33
1
3
2
4
5
6
7
19.34
18.6717.55
N/A
-
- 3 %- 9 %
-
Eastern New York2/20/2012
34.868.268.3
0.9

Thermally Improved Condition
25a
Digital Image Infrared Image
APPENDIX- 03a | METAL PANEL WALL SYSTEMS: Metal Panels with Insulated JointsAPPENDIX- 03a | METAL PANEL WALL SYSTEMS: Metal Panels with Insulated Joints
Digital Image Infrared Image

26a
Project Conditions
Location:Date of Thermal Image:
Exterior Air Temperature:Interior Air Temperature:Radiant Temperature:Assumed Emissivity:
As-Built Condition
APPENDIX- 03b | METAL PANEL WALL SYSTEMS: Metal Panels with Uninsulated Joints
Summary of Thermal Performance
Calculated Baseline R-Value:
As-Built ConditionThermal Image R-Value:Simulated (THERM) R-Value:
Thermally Improved ConditionSee 3a
Calculated Baseline Clear Wall R-value
Material Width
in.
k
Btu·in/h·ft2·˚F
R-value
h·ft2·˚F/Btu
Material Width
in.
k
Btu·in/h·ft2·˚F
R-value
h·ft2·˚F/Btu
2 Air Cavity 21.25 - 1.36
- Exterior Air Film - - 0.17 3 Shaft Wall 3.75 - 3.60
1 Insulated Metal Panel 3 0.20 15 - Interior Air Film - - 0.68
total 20.81
1
3
2
20.81
6.804.23
N/A
-
- 67 %- 80 %
-
Eastern Massachusetts02/12/2012
34.870.369.7
0.9
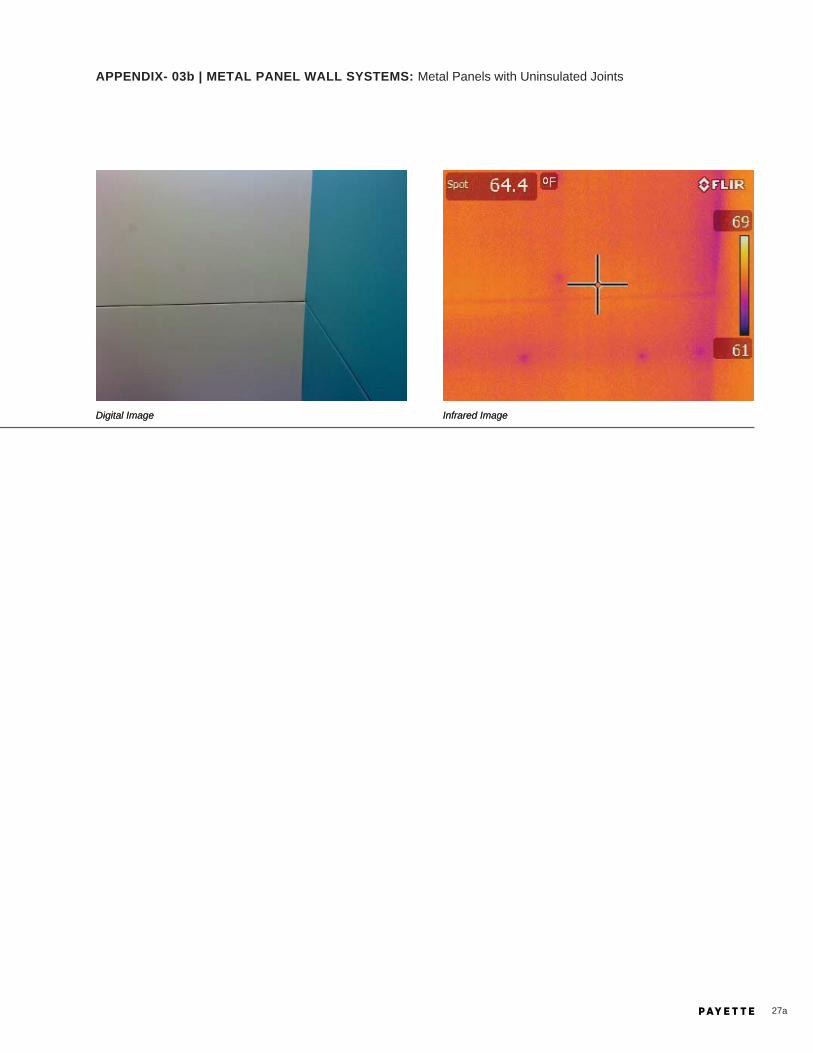
27a
Digital Image Infrared Image
APPENDIX- 03b | METAL PANEL WALL SYSTEMS: Metal Panels with Uninsulated Joints
Digital Image Infrared Image

Project Conditions
Location:Date of Thermal Image:
Exterior Air Temperature:Interior Air Temperature:Radiant Temperature:Assumed Emissivity:
As-Built Condition
28a
APPENDIX- 03c | METAL PANEL WALL SYSTEMS: Metal Panels with Continuous Metal Clips
Summary of Thermal Performance
Calculated Baseline R-Value:
As-Built ConditionThermal Image R-Value:Simulated (THERM) R-Value:
Thermally Improved ConditionSee 3a
Calculated Baseline Clear Wall R-value
Material Width
in.
k
Btu·in/h·ft2·˚F
R-value
h·ft2·˚F/Btu
Material Width
in.
k
Btu·in/h·ft2·˚F
R-value
h·ft2·˚F/Btu
4 Air and Vapor Barrier - - -
- Exterior Air Film - - 0.17 5 Exterior Sheathing 0.625 1.10 0.57
1 Metal Panel - - 0.06 6 Air Cavity 4 - 1.36
2 Air Cavity - - 1.36 7 Gypsum Board 0.625 1.10 0.57
3 Rigid Insulation 3.00 0.20 15 - Interior Air Film - - 0.68
total 19.77
7
5
6
4
3
2
1
19.77
5.959.70
N/A
-
- 70 %- 51 %
-
Eastern Massachusetts02/09/2012
36.363.464.2
0.9

Thermally Improved Condition
29a
APPENDIX- 03c | METAL PANEL WALL SYSTEMS: Metal Panels with Continuous Metal Clips
See 3a
Digital Image Infrared Image

Project Conditions
Location:Date of Thermal Image:
Exterior Air Temperature:Interior Air Temperature:Radiant Temperature:Assumed Emissivity:
As-Built Condition
30a
APPENDIX- 04a | CURTAIN WALLS: Insulation Between Mullions (Typical)
Summary of Thermal Performance
Calculated Baseline R-Value:
As-Built ConditionThermal Image R-Value:Simulated (THERM) R-Value:
Thermally Improved ConditionSimulated (THERM) R-Value:
20.42
5.756.17
NA
-
- 72 %- 70 %
Eastern Massachusetts03/26/2013
38.8 ˚F71.1 ˚F72.6 ˚F
0.9
Calculated Baseline Clear Wall R-value
Material Width
in.
k
Btu·in/h·ft2·˚F
R-value
h·ft2·˚F/Btu
Material Width
in.
k
Btu·in/h·ft2·˚F
R-value
h·ft2·˚F/Btu
- Exterior Air Film - - 0.17 4 Curtian Wall Insulation 4.00 0.29 13.74
1 Curtian Wall IGU 1.00 - 2.65 5 Air Cavity 7.625 - 1.36
2 Dead Load Anchor - - - 6 Gypsum Board 0.625 1.10 0.57
3 Air Cavity 1.25 - 1.23 - Interior Air Film - - 0.68
total 20.40
1
3
2
4
5
6

31a
Digital Image Infrared Image
APPENDIX- 04a | CURTAIN WALLS: Insulation Between Mullions (Typical)

Project Conditions
Location:Date of Thermal Image:
Exterior Air Temperature:Interior Air Temperature:Radiant Temperature:Assumed Emissivity:
As-Built Condition
32a
Calculated Baseline Clear Wall R-value
Material Width
in.
k
Btu·in/h·ft2·˚F
R-value
h·ft2·˚F/Btu
Material Width
in.
k
Btu·in/h·ft2·˚F
R-value
h·ft2·˚F/Btu
- Exterior Air Film - - 0.17 3 Insulated Metal Panel 1.50 0.16 9.44
1 Curtian Wall IGU 1.00 - 2.73 4 Mullion w/ Spray Foam 5.00 0.15 -
2 Air Space 3.60 - 1.14 - Interior Air Film - - 0.68
total 14.16
APPENDIX- 04b | CURTAIN WALLS: Insulation within Mullion
Summary of Thermal Performance
Calculated Baseline R-Value:
As-Built ConditionThermal Image R-Value:Simulated (THERM) R-Value:
Thermally Improved ConditionSimulated (THERM) R-Value:
14.16
6.184.92
NA
-
- 56 %- 62 %
Eastern Massachusetts02/09/2012
38.8 ˚F68.6 ˚F69.3 ˚F
0.5
1
3
2
4

Thermally Improved Condition
33a
Digital Image Infrared Image
APPENDIX- 04b | CURTAIN WALLS: Insulation within Mullion

Project Conditions
Location:Date of Thermal Image:
Exterior Air Temperature:Interior Air Temperature:Radiant Temperature:Assumed Emissivity:
As-Built Condition
34a
APPENDIX- 04c | CURTAIN WALL: Wrapped Mullion
Summary of Thermal Performance
Calculated Baseline R-Value:
As-Built ConditionThermal Image R-Value:Simulated (THERM) R-Value:
Thermally Improved ConditionSimulated (THERM) R-Value:
13.12
NA5.11
10.86
-
- 61 %
- 17 %
Central Pennsylvania02/13/2013
NANANA0.9
Calculated Baseline Clear Wall R-value
Material Width
in.
k
Btu·in/h·ft2·˚F
R-value
h·ft2·˚F/Btu
Material Width
in.
k
Btu·in/h·ft2·˚F
R-value
h·ft2·˚F/Btu
3 Mullion w/ Mineral Wool 2.00 0.23 -
- Exterior Air Film - - 0.17 4 Mineral Wool 2.00 0.23 8.69
1 Curtian Wall IGU 1.00 - 2.22 5 Aluminum Backpan 0.04 1643.23 0.00
2 Air Cavity 7.00 - 1.36 - Interior Air Film - - 0.68
total 13.12
1
3
2
4
5

Thermally Improved Condition
35a
Digital Image Infrared Image
APPENDIX- 04c | CURTAIN WALL: Wrapped Mullion
theoretical study where
the metal back pan has
been removed
R-10.86 (+113%)

Project Conditions
Location:Date of Thermal Image:
Exterior Air Temperature:Interior Air Temperature:Radiant Temperature:Assumed Emissivity:
As-Built Condition
36a
APPENDIX- 04d | CURTAIN WALL: Insulation Glazed In
Summary of Thermal Performance
Calculated Baseline R-Value:
As-Built ConditionThermal Image R-Value:Simulated (THERM) R-Value:
Thermally Improved ConditionSimulated (THERM) R-Value:
11.81
NA8.09
NA
-
- 31 %
Eastern Massachusetts 01/18/2013
NANANA0.9
1
3
2
4
Calculated Baseline Clear Wall R-value
Material Width
in.
k
Btu·in/
h·ft2·˚F
R-value
h·ft2·˚F/
Btu
- Exterior Air Film - - 0.17
1 Curtain Wall IGU 1.00 - 2.22
2 Air Gap 0.5 - 1.15
3 Glass Wool Insulation 2.00 0.26 7.59
4 Aluminum Back Pan 0.09 1109 0.00
- Interior Air Film - - 0.68
total 11.81

Thermally Improved Condition
37a
Digital Image Infrared Image
APPENDIX- 04d | CURTAIN WALL: Insulation Glazed In

Project Conditions
Location:Date of Thermal Image:
Exterior Air Temperature:Interior Air Temperature:Radiant Temperature:Assumed Emissivity:
As-Built Condition
38a
APPENDIX- 04e | CURTAIN WALL: Improved Option
Summary of Thermal Performance
Calculated Baseline R-Value:
As-Built ConditionThermal Image R-Value:Simulated (THERM) R-Value:
Thermally Improved ConditionSimulated (THERM) R-Value:
21.21
N/A15.14
N/A
-
N/A- 29 %
N/A
N/AN/A
25.3 ˚F71.6 ˚FN/A ˚F
0.9
1
3
2
4
Calculated Baseline Clear Wall R-value
Material Width
in.
k
Btu·in/
h·ft2·˚F
R-value
h·ft2·˚F/
Btu
- Exterior Air Film - - 0.17
1 Curtain Wall - - -
2 Insulation 5 0.2635 19
3 Air Cavity 4 - 1.36
4 Spandrel - - -
- Interior Air Film - - 0.68
total 21.21

Thermally Improved Condition
39a
APPENDIX- 04e | CURTAIN WALL: Improved Option

40a
Project Conditions
Location:Date of Thermal Image:
Exterior Air Temperature:Interior Air Temperature:Radiant Temperature:Assumed Emissivity:
As-Built Condition
APPENDIX- 05a | INSULATING EXISTING BUILDINGS: Studs Directly Attached to Existing Wall
Summary of Thermal Performance
Calculated Baseline R-Value:
As-Built ConditionThermal Image R-Value:Simulated (THERM) R-Value:
Thermally Improved ConditionSee 05b
19.63
4.158.05
-
-78.9 %-58.9 %
Eastern Massachusetts03/01/2012
40 ˚F72.6 ˚F72.1 ˚F
0.9
1
3
2
4
5
6
Calculated Baseline Clear Wall R-value
Material Width
in.
k
Btu·in/h·ft2·˚F
R-value
h·ft2·˚F/Btu
Material Width
in.
k
Btu·in/h·ft2·˚F
R-value
h·ft2·˚F/Btu
- Exterior Air Film - - 0.17 4 Sprayfoam Insulation 2.5 0.166 15.06
1 Existing Brick 3.625 6.2 0.58 5 Air Cavity 4.5 - 1.00
2 Existing Air Cavity 1.375 - 1.00 6 Gypsum Board 0.625 1.1 0.57
3 Existing Sheathing 0.625 1.1 0.57 - Interior Air Film - - 0.68
total 19.63

41a
Digital Image Infrared Image
APPENDIX- 05a | INSULATING EXISTING BUILDINGS: Studs Directly Attached to Existing Wall

42a
Project Conditions
Location:Date of Thermal Image:
Exterior Air Temperature:Interior Air Temperature:Radiant Temperature:Assumed Emissivity:
As-Built Condition
APPENDIX- 05b | INSULATING EXISTING BUILDINGS: Studs Pulled 1” Back From Existing Wall
Summary of Thermal Performance
Calculated Baseline R-Value:
As-Built ConditionThermal Image R-Value:Simulated (THERM) R-Value:
Thermally Improved ConditionSee 05c
16.84
12.4414.11
-
- 26 %- 16 %
Southern Connecticut03/14/2013
36 ˚F68.4 ˚F67.9 ˚F
0.9
1
3
2
4
Calculated Baseline Clear Wall R-value
Material Width
in.
k
Btu·in/h·ft2·˚F
R-value
h·ft2·˚F/Btu
Material Width
in.
k
Btu·in/h·ft2·˚F
R-value
h·ft2·˚F/Btu
- Exterior Air Film - - 0.17 3 Air Cavity 0.625 - 1.36
1 Stone 20 9.96 2.01 4 Gypsum Board 0.625 1.1 0.57
2 Sprayfoam Insulation 2 0.166 12.05 - Interior Air Film - - 0.68
total 16.84

43a
Digital Image Infrared Image
APPENDIX- 05b | INSULATING EXISTING BUILDINGS: Studs Pulled 1” Back From Existing Wall
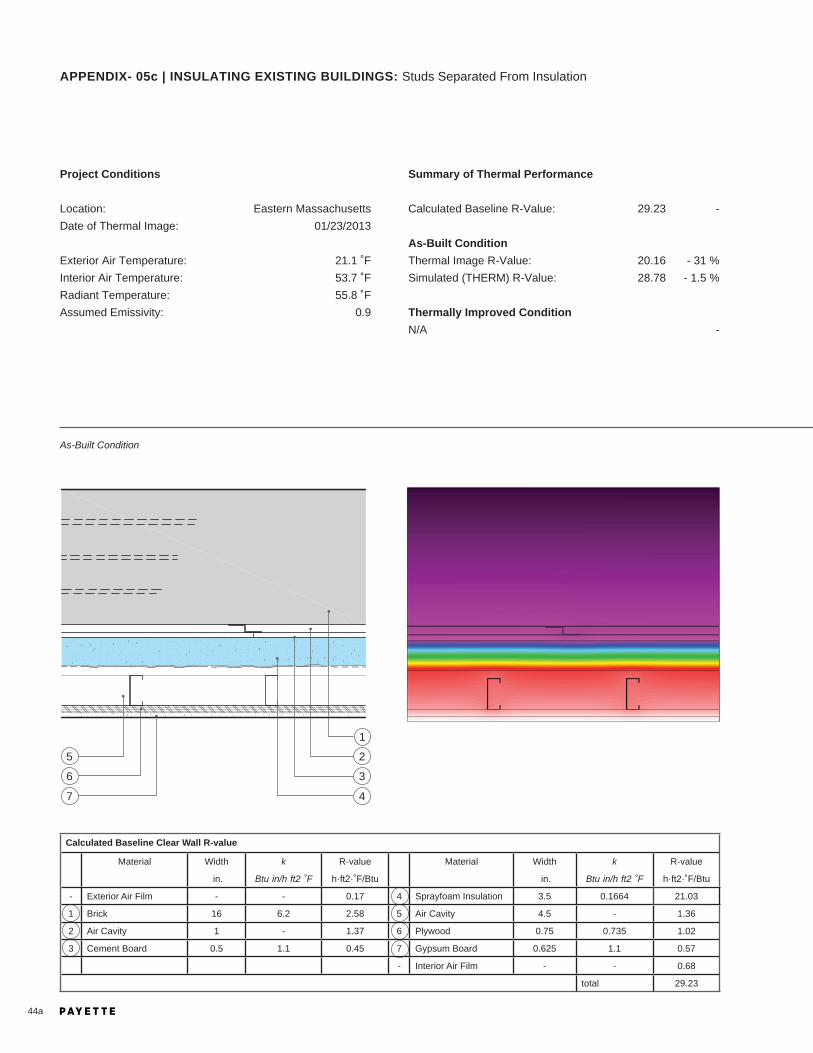
44a
Project Conditions
Location:Date of Thermal Image:
Exterior Air Temperature:Interior Air Temperature:Radiant Temperature:Assumed Emissivity:
As-Built Condition
APPENDIX- 05c | INSULATING EXISTING BUILDINGS: Studs Separated From Insulation
Summary of Thermal Performance
Calculated Baseline R-Value:
As-Built ConditionThermal Image R-Value:Simulated (THERM) R-Value:
Thermally Improved ConditionN/A
29.23
20.1628.78
-
- 31 %- 1.5 %
-
Eastern Massachusetts01/23/2013
21.1 ˚F53.7 ˚F55.8 ˚F
0.9
1
3
2
4
6
5
7
Calculated Baseline Clear Wall R-value
Material Width
in.
k
Btu·in/h·ft2·˚F
R-value
h·ft2·˚F/Btu
Material Width
in.
k
Btu·in/h·ft2·˚F
R-value
h·ft2·˚F/Btu
- Exterior Air Film - - 0.17 4 Sprayfoam Insulation 3.5 0.1664 21.03
1 Brick 16 6.2 2.58 5 Air Cavity 4.5 - 1.36
2 Air Cavity 1 - 1.37 6 Plywood 0.75 0.735 1.02
3 Cement Board 0.5 1.1 0.45 7 Gypsum Board 0.625 1.1 0.57
- Interior Air Film - - 0.68
total 29.23

45a
Digital Image Infrared Image
APPENDIX- 05c | INSULATING EXISTING BUILDINGS: Studs Separated From Insulation

46a
Summary of Thermal Performance
Calculated Baseline R-Value:
As-Built ConditionThermal Image R-Value:Simulated (THERM) R-Value:HeadJambSill
Project Conditions
Location:Date of Thermal Image:
Exterior Air Temperature:Interior Air Temperature:Radiant Temperature:Assumed Emissivity:
As-Built Condition
APPENDIX- 06a | WINDOW TRANSITIONS: Recessed Relationship with Thermal Barrier
15.39
6.58
6.466.584.60
-
- 57 %
- 58 %- 51 %- 70 %
Western Massachusetts02/27/2012
46.0 ˚F69.0 ˚F70.6 ˚F
0.9
Section Detail Plan Detail
1
3
6
2
5
4
Calculated Baseline Clear Wall R-value
Material Width
in.
k
Btu·in/h·ft2·˚F
R-value
h·ft2·˚F/Btu
Material Width
in.
k
Btu·in/h·ft2·˚F
R-value
h·ft2·˚F/Btu
- Exterior Air Film - - 0.17 4 CMU 7.625 8.00 .95
1 Brick (Common) 3.625 5.5 0.66 5 Air Cavity - - 1.36
2 Air Cavity - - 1.00 6 Gypsum Board 0.625 1.10 0.57
3 Rigid Insulation 2.00 0.20 10.00 - Interior Air Film - - 0.68
total 15.39
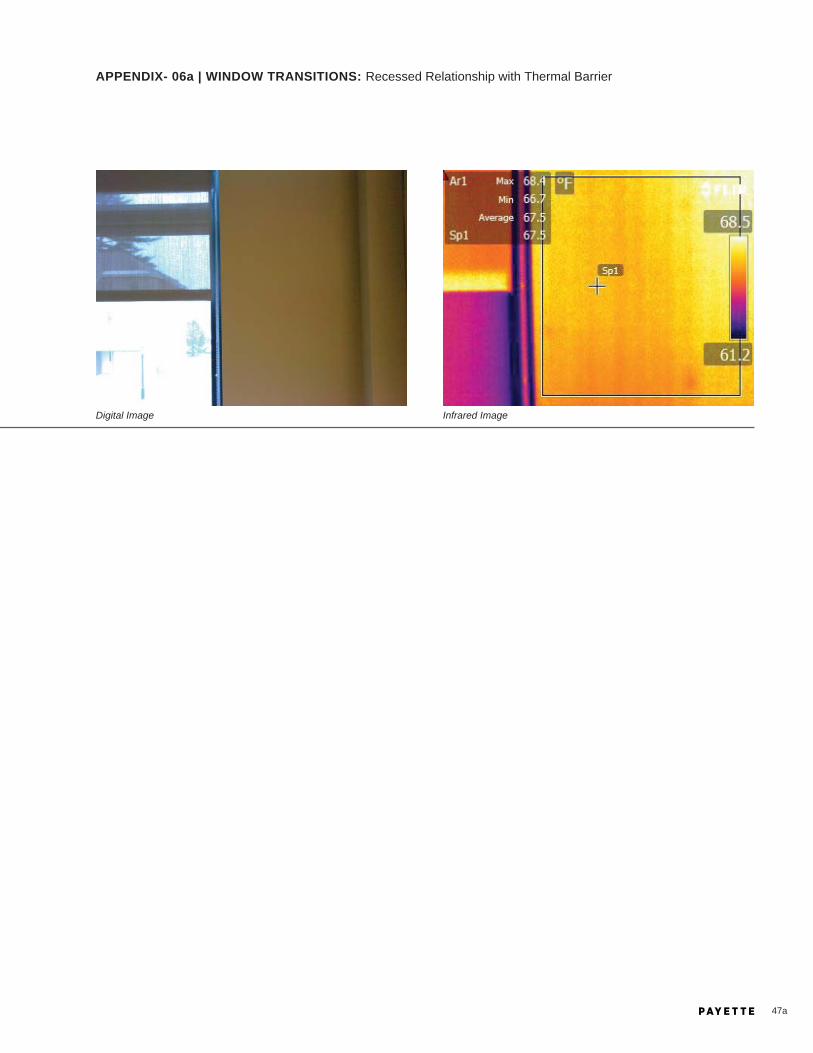
47a
Digital Image Infrared Image
APPENDIX- 06a | WINDOW TRANSITIONS: Recessed Relationship with Thermal Barrier
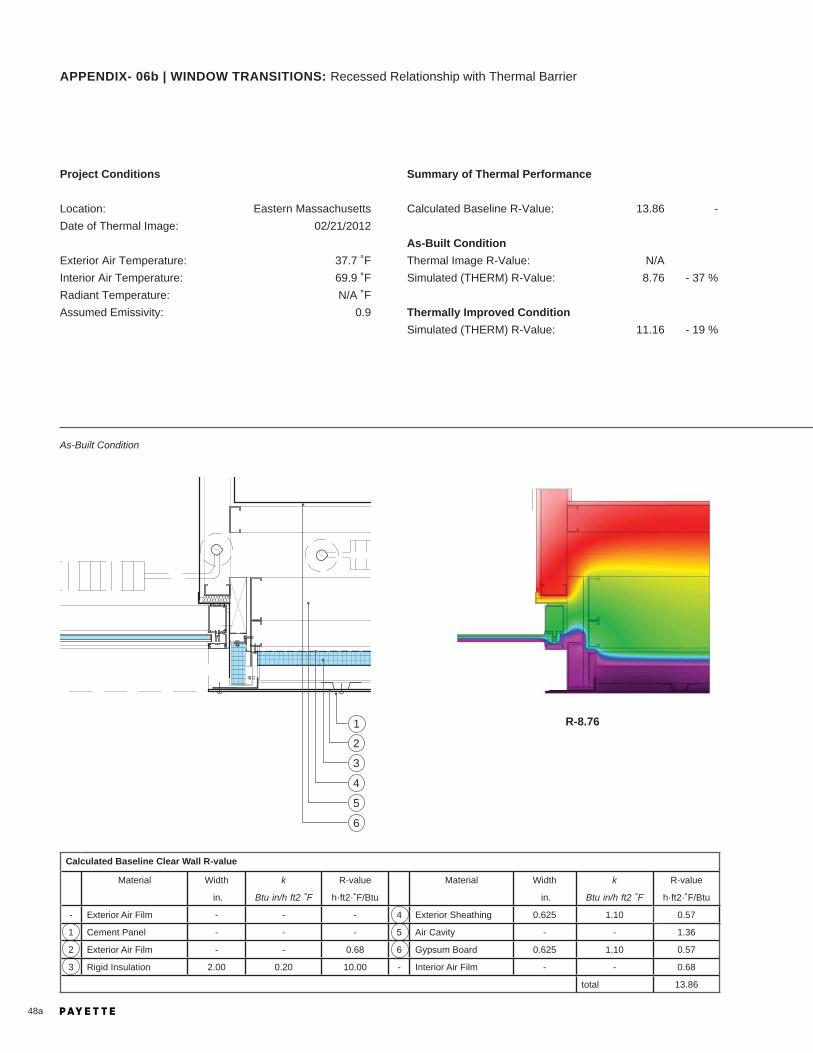
48a
Project Conditions
Location:Date of Thermal Image:
Exterior Air Temperature:Interior Air Temperature:Radiant Temperature:Assumed Emissivity:
As-Built Condition
APPENDIX- 06b | WINDOW TRANSITIONS: Recessed Relationship with Thermal Barrier
Summary of Thermal Performance
Calculated Baseline R-Value:
As-Built ConditionThermal Image R-Value:Simulated (THERM) R-Value:
Thermally Improved ConditionSimulated (THERM) R-Value:
13.86
N/A8.76
11.16
-
- 37 %
- 19 %
Eastern Massachusetts02/21/2012
37.7 ˚F69.9 ˚FN/A ˚F
0.9
1
3
2
4
5
6
Calculated Baseline Clear Wall R-value
Material Width
in.
k
Btu·in/h·ft2·˚F
R-value
h·ft2·˚F/Btu
Material Width
in.
k
Btu·in/h·ft2·˚F
R-value
h·ft2·˚F/Btu
- Exterior Air Film - - - 4 Exterior Sheathing 0.625 1.10 0.57
1 Cement Panel - - - 5 Air Cavity - - 1.36
2 Exterior Air Film - - 0.68 6 Gypsum Board 0.625 1.10 0.57
3 Rigid Insulation 2.00 0.20 10.00 - Interior Air Film - - 0.68
total 13.86
R-8.76

49a
Thermally Improved Condition
APPENDIX- 06b | WINDOW TRANSITIONS: Recessed Relationship with Thermal Barrier
insulated metal panel
glazed into mullion pocket
R-11.16(+27%)

50a
Project Conditions
Location:Date of Thermal Image:
Exterior Air Temperature:Interior Air Temperature:Radiant Temperature:Assumed Emissivity:
As-Built Condition
APPENDIX- 06c | WINDOW TRANSITIONS: Recessed Relationship with Thermal Barrier
Summary of Thermal Performance
Calculated Baseline R-Value:
As-Built ConditionThermal Image R-Value:Simulated (THERM) R-Value:
Thermally Improved ConditionSimulated (THERM) R-Value:
19.82
8.913.15
7.08
-
- 55 %- 84 %
- 64 %
Central Rhode Island02/21/2012
25.7 ˚F68.4 ˚F69.7 ˚F
0.9
1
3
2
4
5
6
Calculated Baseline Clear Wall R-value
Material Width
in.
k
Btu·in/h·ft2·˚F
R-value
h·ft2·˚F/Btu
Material Width
in.
k
Btu·in/h·ft2·˚F
R-value
h·ft2·˚F/Btu
- Exterior Air Film - - 0.17 4 Exterior Sheathing 0.50 1.10 0.45
1 Brick (Common) 3.625 6.19 0.59 5 Air Cavity - - 1.36
2 Air Cavity - - 1.00 6 Gypsum Board 0.625 1.10 0.57
3 Rigid Insulation 3.00 0.20 15.00 - Interior Air Film - - 0.68
total 19.82
R-3.15
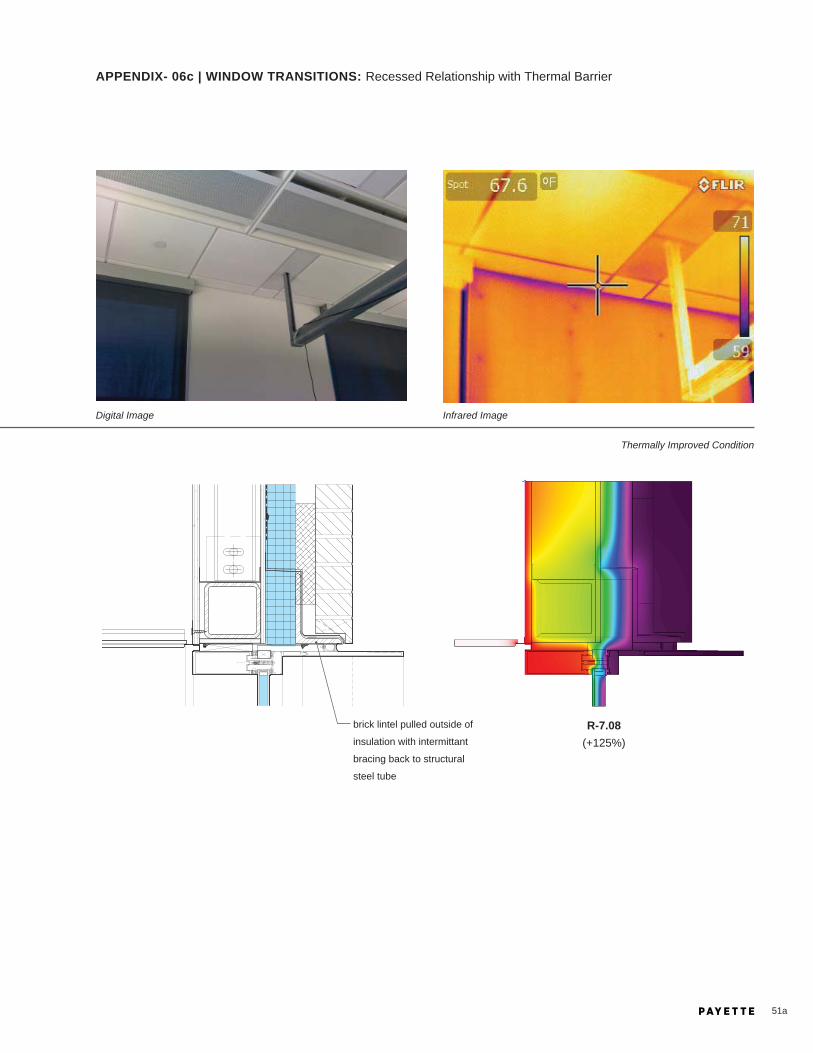
51a
Digital Image Infrared Image
Thermally Improved Condition
APPENDIX- 06c | WINDOW TRANSITIONS: Recessed Relationship with Thermal Barrier
brick lintel pulled outside of
insulation with intermittant
bracing back to structural
steel tube
R-7.08(+125%)

52a
Project Conditions
Location:Date of Thermal Image:
Exterior Air Temperature:Interior Air Temperature:Radiant Temperature:Assumed Emissivity:
As-Built Condition
APPENDIX- 06d | WINDOW TRANSITIONS: Proud Relationship with Thermal Barrier
Summary of Thermal Performance
Calculated Baseline R-Value:
As-Built ConditionThermal Image R-Value:Simulated (THERM) R-Value:see details below
Thermally Improved ConditionSimulated (THERM) R-Value:see details below
19.86
N/A
-Southeastern Massachusetts02/09/2012
37.7 ˚F71.7 ˚F72.9 ˚F
0.9
Section Detail Plan Detail
1
3
5
2
4
6
Calculated Baseline Clear Wall R-value
Material Width
in.
k
Btu·in/h·ft2·˚F
R-value
h·ft2·˚F/Btu
Material Width
in.
k
Btu·in/h·ft2·˚F
R-value
h·ft2·˚F/Btu
- Exterior Air Film - - 0.17 4 Exterior Sheathing 0.625 1.10 0.57
1 Brick (Common) 3.625 6.20 0.58 5 Air Cavity - - 1.36
2 Air Cavity - - 1.00 6 Gypsum Board 0.625 1.10 0.57
3 Rigid Insulation 3.00 0.20 14.93 - Interior Air Film - - 0.68
total 19.86
wall R-6.11frame R-2.15
wall R-10.27frame R-2.38
wall R-7.21frame R-2.39

53a
Thermally Improved Condition
APPENDIX- 06d | WINDOW TRANSITIONS: Proud Relationship with Thermal Barrier
Section Detail Plan Detail
frame R-3.46(+38%)
frame R-4.02(+41%)
frame R-4.28(+44%)
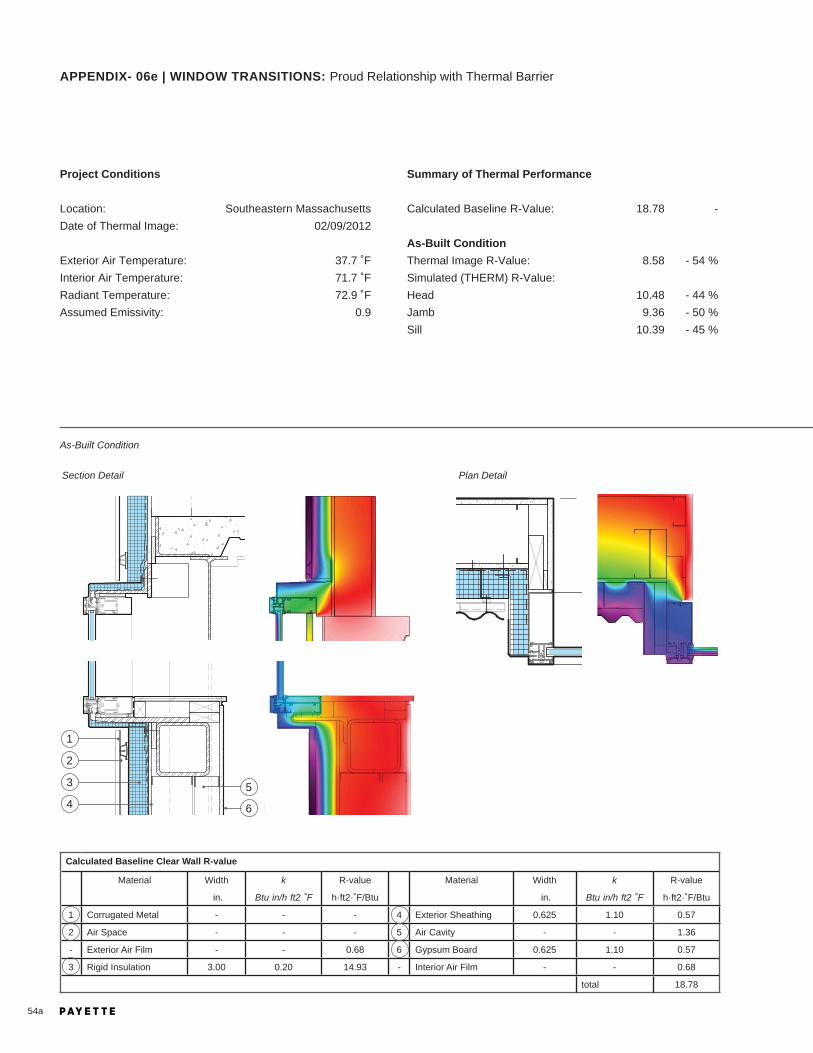
54a
Project Conditions
Location:Date of Thermal Image:
Exterior Air Temperature:Interior Air Temperature:Radiant Temperature:Assumed Emissivity:
As-Built Condition
APPENDIX- 06e | WINDOW TRANSITIONS: Proud Relationship with Thermal Barrier
Summary of Thermal Performance
Calculated Baseline R-Value:
As-Built ConditionThermal Image R-Value:Simulated (THERM) R-Value:HeadJambSill
18.78
8.58
10.489.36
10.39
-
- 54 %
- 44 %- 50 %- 45 %
Southeastern Massachusetts02/09/2012
37.7 ˚F71.7 ˚F72.9 ˚F
0.9
Section Detail Plan Detail
Calculated Baseline Clear Wall R-value
Material Width
in.
k
Btu·in/h·ft2·˚F
R-value
h·ft2·˚F/Btu
Material Width
in.
k
Btu·in/h·ft2·˚F
R-value
h·ft2·˚F/Btu
1 Corrugated Metal - - - 4 Exterior Sheathing 0.625 1.10 0.57
2 Air Space - - - 5 Air Cavity - - 1.36
- Exterior Air Film - - 0.68 6 Gypsum Board 0.625 1.10 0.57
3 Rigid Insulation 3.00 0.20 14.93 - Interior Air Film - - 0.68
total 18.78
1
3 5
2
4 6

55a
Digital Image Infrared Image
APPENDIX- 06e | WINDOW TRANSITIONS: Proud Relationship with Thermal Barrier

56a
Project Conditions
Location:Date of Thermal Image:
Exterior Air Temperature:Interior Air Temperature:Radiant Temperature:Assumed Emissivity:
As-Built Condition
APPENDIX- 06f | WINDOW TRANSITIONS: Inline Relationship with Thermal Barrier
Summary of Thermal Performance
Calculated Baseline R-Value:
As-Built ConditionThermal Image R-Value:Simulated (THERM) R-Value:HeadJambSill
13.86
7.50
6.467.656.46
-
- 46 %
- 53 %- 45 %- 53 %
Souther Massachusetts02/09/2012
32.3 ˚F71.0 ˚F71.5 ˚F
0.9
Section Detail Plan Detail
Calculated Baseline Clear Wall R-value
Material Width
in.
k
Btu·in/h·ft2·˚F
R-value
h·ft2·˚F/Btu
Material Width
in.
k
Btu·in/h·ft2·˚F
R-value
h·ft2·˚F/Btu
1 Terracotta Tile - - - 4 Exterior Sheathing 0.625 1.10 0.57
2 Air Cavity - - - 5 Air Cavity - - 1.36
- Exterior Air Film - - 0.68 6 Gypsum Board 0.625 1.10 0.57
3 Rigid Insulation 2.00 0.20 10.00 - Interior Air Film - - 0.68
total 13.86
6
4
2
5
3
1

57a
Digital Image Infrared Image
APPENDIX- 06f | WINDOW TRANSITIONS: Inline Relationship with Thermal Barrier

58a
Project Conditions
Location:Date of Thermal Image:
Exterior Air Temperature:Interior Air Temperature:Radiant Temperature:Assumed Emissivity:
As-Built Condition
APPENDIX- 06g | WINDOW TRANSITIONS: Inline Relationship with Thermal Barrier
Summary of Thermal Performance
Calculated Baseline R-Value:
As-Built ConditionThermal Image R-Value:Simulated (THERM) R-Value:
20.74
7.947.12
-
- 62 %- 66 %
Souther Connecticutt03/14/2013
36.0 ˚F67.3 ˚F68.4 ˚F
0.9
1
3
5
2
4
6
Calculated Baseline Clear Wall R-value
Material Width
in.
k
Btu·in/h·ft2·˚F
R-value
h·ft2·˚F/Btu
Material Width
in.
k
Btu·in/h·ft2·˚F
R-value
h·ft2·˚F/Btu
1 Terracotta Tile - - - 4 Exterior Sheathing 0.50 1.10 0.45
2 Air Cavity - - - 5 Air Cavity - - 1.36
- Exterior Air Film - - 0.68 6 Gypsum Board 0.625 1.10 0.57
3 Mineral Wool 4.00 0.23 17 - Interior Air Film - - 0.68
total 20.74

59a
Digital Image Infrared Image
APPENDIX- 06g | WINDOW TRANSITIONS: Inline Relationship with Thermal Barrier

60a
Project Conditions
Location:Date of Thermal Image:
Exterior Air Temperature:Interior Air Temperature:Radiant Temperature:Assumed Emissivity:
As-Built Condition
APPENDIX- 06h | WINDOW TRANSITIONS: Inline Relationship with Thermal Barrier
Summary of Thermal Performance
Calculated Baseline R-Value:
As-Built ConditionThermal Image R-Value:Simulated (THERM) R-Value:
22.85
9.149.57
-
- 60 %- 58 %
Western New Hampshire 03/21/2013
32.1 ˚F70.5 ˚F73.8 ˚F
0.9
1
Calculated Baseline Clear Wall R-value
Material Width
in.
k
Btu·in/h·ft2·˚F
R-value
h·ft2·˚F/Btu
Material Width
in.
k
Btu·in/h·ft2·˚F
R-value
h·ft2·˚F/Btu
- - - - - - - - - -
- - - - - - Exterior Air Film - - 0.17
- - - - - 1 Insulated Metal Panel 3.00 0.14 22.00
- - - - - - Interior Air Film - - 0.68
total 22.85

61a
Digital Image Infrared Image
APPENDIX- 06h | WINDOW TRANSITIONS: Inline Relationship with Thermal Barrier

Project Conditions
Location:Date of Thermal Image:
Exterior Air Temperature:Interior Air Temperature:Radiant Temperature:Assumed Emissivity:
As-Built Condition
62a
APPENDIX- 07a | FOUNDATION TO WALL TRANSITIONS: Foundation Wall Transition 1
Summary of Thermal Performance
Calculated Baseline R-Value:
As-Built ConditionThermal Image R-Value:Simulated (THERM) R-Value (wall):Simulated (THERM) R-Value (fl oor):
Thermally Improved ConditionSimulated (THERM) R-Value:
14.01
3.718.3926.8
N/A
-
- 74 %- 40 %
-
N/A
Western Massachusetts02/27/2012
46 ˚F69 ˚F
69.6 ˚F0.9
Calculated Baseline Clear Wall R-value
Material Width
in.
k
Btu·in/h·ft2·˚F
R-value
h·ft2·˚F/Btu
Material Width
in.
k
Btu·in/h·ft2·˚F
R-value
h·ft2·˚F/Btu
- Exterior Air Film - - 0.17 4 Concrete 10 12.5 0.80
1 Granite 4 30 0.13 5 Air Cavity 0.875 - 1.36
2 Grout 2 6.7 0.30 6 Gypsum Board 0.625 1.1 0.57
3 Extruded Polystyrene 2 0.20 10 - Interior Air Film - - 0.68
total 14.01
123
456

63a
APPENDIX- 07a | FOUNDATION TO WALL TRANSITION: Foundation Wall Transition 1

Project Conditions
Location:Date of Thermal Image:
Exterior Air Temperature:Interior Air Temperature:Radiant Temperature:Assumed Emissivity:
As-Built Condition
64a
APPENDIX- 07b | FOUNDATION TO WALL TRANSITIONS: Foundation Wall Transition 2
Summary of Thermal Performance
Calculated Baseline R-Value:
As-Built ConditionThermal Image R-Value:Simulated (THERM) R-Value (wall):Simulated (THERM) R-Value (fl oor):
Thermally Improved ConditionSimulated (THERM) R-Value (wall):Simulated (THERM) R-Value (fl oor):
13.74
3.55.83.2
6.15.85
-
- 74.5 %- 57.8 %
-
-55.6 %-
Western Massachusetts02/21/2012
37.3 ˚F71 ˚F
69.5 ˚F0.9
Calculated Baseline Clear Wall R-value
Material Width
in.
k
Btu·in/h·ft2·˚F
R-value
h·ft2·˚F/Btu
Material Width
in.
k
Btu·in/h·ft2·˚F
R-value
h·ft2·˚F/Btu
- Exterior Air Film - - 0.17 4 Gypsum Board 0.625 1.10 057
1 Architectural Concrete 12 12.5 0.96 - Interior Air Film - - 0.68
2 Extruded Polystyrene 2 0.20 10
3 Air Cavity - - 1.36
total 13.74
1
3
4
2
R-5.8 (wall), R-3.2 (fl oor)

Thermally Improved Condition
65a
APPENDIX- 07b | FOUNDATION TO WALL TRANSITIONS: Foundation Wall Transition 2
Digital Image Infrared Image
structural
thermal break
R-6.1 (wall), R-5.85 (fl oor)(+5% wall, +82.8% fl oor)

Project Conditions
Location:Date of Thermal Image:
Exterior Air Temperature:Interior Air Temperature:Radiant Temperature:Assumed Emissivity:
As-Built Condition
66a
APPENDIX- 07c | FOUNDATION TO WALL TRANSITIONS: Foundation Wall Transition 3
Summary of Thermal Performance
Calculated Baseline R-Value:
As-Built ConditionThermal Image R-Value:Simulated (THERM) R-Value (wall):Simulated (THERM) R-Value (fl oor):
Thermally Improved ConditionSimulated (THERM) R-Value:
13.86
4.135.945.01
N/A
-
- 70 %- 57 %
-
N/A
Massachusetts02/27/2012
43.8 ˚F70.4 ˚F70.8 ˚F
0.9
Calculated Baseline Clear Wall R-value
Material Width
in.
k
Btu·in/h·ft2·˚F
R-value
h·ft2·˚F/Btu
Material Width
in.
k
Btu·in/h·ft2·˚F
R-value
h·ft2·˚F/Btu
1 Terracotta Tile - - - 4 Exterior Sheathing 0.625 1.10 0.57
2 Air Cavity - - - 5 Air Cavity 15 - 1.36
- Exterior Air Film - - 0.68 6 Gypsum Board 0.625 1.10 0.57
3 Extruded Polystyrene 2 0.20 10.00 - Interior Air Film - - 0.68
total 13.86
1
3
5
2
4
6

67a
APPENDIX- 07c | FOUNDATION TO WALL TRANSITIONS: Foundation Wall Transition 3
Digital Image Infrared Image

68a
Project Conditions
Location:Date of Thermal Image:
Exterior Air Temperature:Interior Air Temperature:Radiant Temperature:Assumed Emissivity:
As-Built Condition
APPENDIX- 07d | FOUNDATION TO WALL TRANSITIONS: Foundation Wall Transition 4
Calculated Baseline Clear Wall R-value (at Metal Panel) Calculated Baseline Clear Wall R-value (at Concrete)
Material Width
in.
k
Btu·in/h·ft2·˚F
R-value
h·ft2·˚F/Btu
Material Width
in.
k
Btu·in/h·ft2·˚F
R-value
h·ft2·˚F/Btu
- Exterior Air Film - - 0.17 - Exterior Air Film - - 0.17
1 Insulated Metal Panel 3 .153 19.5 5 Concrete 8 12.5 .64
2 Air and Vapor Barrier - - - 6 Air and Vapor Barrier - - -
3 Air Cavity 12 - 7 Air Cavity 8 - -
4 Gypsum Board 0.625 1.1 0.57 8 Gypsum Board 0.625 1.1 0.57
- Interior Air Film - - .68 - Interior Air Film - - .68
total wall (MP) 20.92 total wall (C) 2.06
Composite wall value (.6*MP+.4*C) 13.38
As-Built Condition
Summary of Thermal Performance
Calculated Baseline R-Value:
As-Built ConditionSimulated (THERM) R-Value (wall):Simulated (THERM) R-Value (fl oor):
Thermally Improved ConditionSee 07e
13.38
4.1010.88
-
- 69 %-
New Hampshire3/21/2013
30 ˚F68 ˚F
67.5 ˚F0.9
1
3
2
5
4
6
7
8
R-4.52

69a
APPENDIX- 07d | FOUNDATION TO WALL TRANSITIONS: Foundation Wall Transition 4
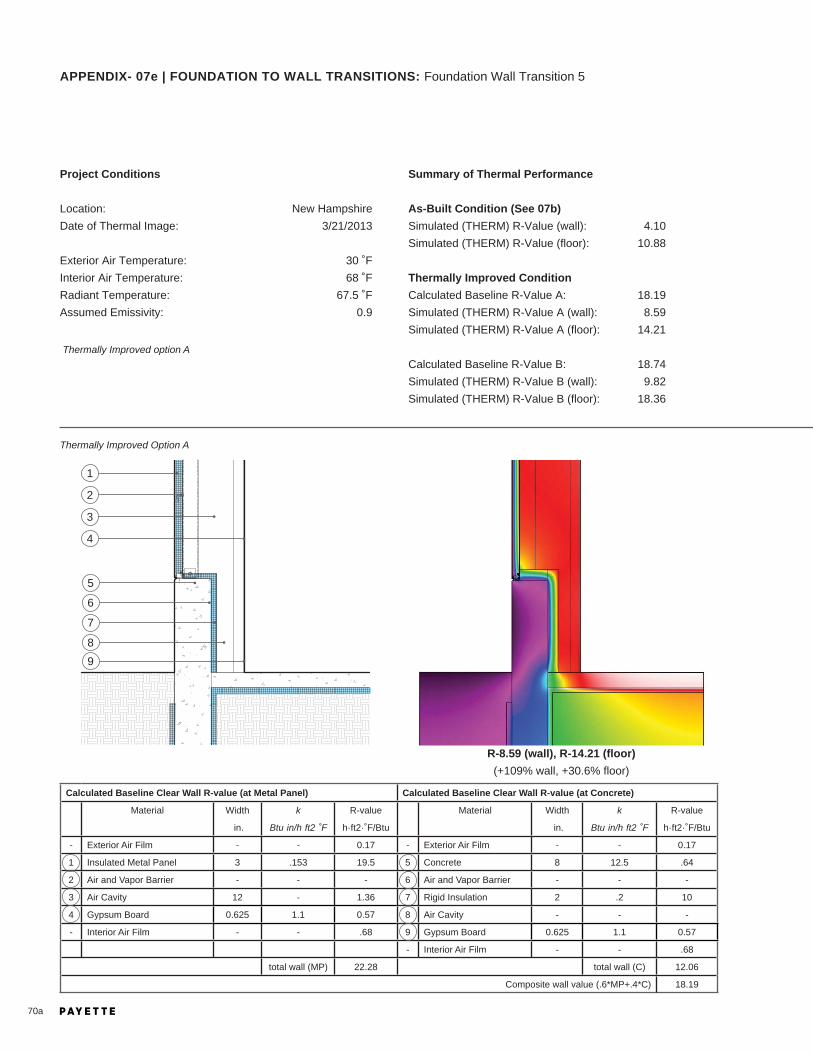
70a
APPENDIX- 07e | FOUNDATION TO WALL TRANSITIONS: Foundation Wall Transition 5
Thermally Improved option A
Summary of Thermal Performance
As-Built Condition (See 07b)Simulated (THERM) R-Value (wall):Simulated (THERM) R-Value (fl oor):
Thermally Improved ConditionCalculated Baseline R-Value A: Simulated (THERM) R-Value A (wall):Simulated (THERM) R-Value A (fl oor):
Calculated Baseline R-Value B: Simulated (THERM) R-Value B (wall):Simulated (THERM) R-Value B (fl oor):
4.1010.88
18.198.59
14.21
18.749.82
18.36
New Hampshire3/21/2013
30 ˚F68 ˚F
67.5 ˚F0.9
1
3
2
4
Project Conditions
Location:Date of Thermal Image:
Exterior Air Temperature:Interior Air Temperature:Radiant Temperature:Assumed Emissivity:
Thermally Improved Option A
Calculated Baseline Clear Wall R-value (at Metal Panel) Calculated Baseline Clear Wall R-value (at Concrete)
Material Width
in.
k
Btu·in/h·ft2·˚F
R-value
h·ft2·˚F/Btu
Material Width
in.
k
Btu·in/h·ft2·˚F
R-value
h·ft2·˚F/Btu
- Exterior Air Film - - 0.17 - Exterior Air Film - - 0.17
1 Insulated Metal Panel 3 .153 19.5 5 Concrete 8 12.5 .64
2 Air and Vapor Barrier - - - 6 Air and Vapor Barrier - - -
3 Air Cavity 12 - 1.36 7 Rigid Insulation 2 .2 10
4 Gypsum Board 0.625 1.1 0.57 8 Air Cavity - - -
- Interior Air Film - - .68 9 Gypsum Board 0.625 1.1 0.57
- Interior Air Film - - .68
total wall (MP) 22.28 total wall (C) 12.06
Composite wall value (.6*MP+.4*C) 18.19
5
6
7
89
R-8.59 (wall), R-14.21 (fl oor)(+109% wall, +30.6% fl oor)

71a
APPENDIX- 07e | FOUNDATION TO WALL TRANSITIONS: Foundation Wall Transition 5
Thermally Improved Option B
1
3
2
4
Calculated Baseline Clear Wall R-value (at Metal Panel) Calculated Baseline Clear Wall R-value (at Concrete)
Material Width
in.
k
Btu·in/h·ft2·˚F
R-value
h·ft2·˚F/Btu
Material Width
in.
k
Btu·in/h·ft2·˚F
R-value
h·ft2·˚F/Btu
- Exterior Air Film - - 0.17 - Exterior Air Film - - 0.17
1 Insulated Metal Panel 3 .153 19.5 5 Concrete 8 12.5 .64
2 Air and Vapor Barrier - 6 Air and Vapor Barrier -
3 Air Cavity 12 1.36 7 Rigid Insulation 2 .2 10
4 Gypsum Board 0.625 1.1 0.57 8 Air Cavity 1.36
- Interior Air Film - - .68 9 Gypsum Board 0.625 1.1 0.57
- Interior Air Film - - .68
total wall (MP) 22.28 total wall (C) 13.42
Composite wall value (.6*MP+.4*C) 18.74
5
6
7
89
insulation concrete sandwich panel
R-9.82 (wall), R-18.36 (fl oor)(+139% wall, +68.8% fl oor)

Parapet Height Study
This study works with limited variables to see whether the location of the insulation within the concrete sandwich panel would make a noticable difference thermally.
As-Built Condition
72a
APPENDIX- 07f | FOUNDATION TO WALL TRANSITIONS: Foundation Wall Sandwich Panel Study
Summary of Thermal Performance
Calculated Baseline R-Value A (wall):Simulated (THERM) R-Value A (wall):
Calculated Baseline R-Value B (wall):Simulated (THERM) R-Value B (wall):
23.923.5
23.9 23.15
-2 %
-3 %
Sandwich panel foundation wall (A)(4” Conc. + 4” Insul. + 10” Conc.)
Calculated Baseline Clear Wall R-value
Material Width
in.
k
Btu·in/h·ft2·˚F
R-value
h·ft2·˚F/Btu
Material Width
in.
k
Btu·in/h·ft2·˚F
R-value
h·ft2·˚F/Btu
- Exterior Air Film - - 0.17 5 Composite Ties - .25 -
1 Concrete 4 12.5 .32 6 Air Cavity - - 1.36
2 Rigid Insulation 4 .2 20 7 Gypsum Board 0.625 1.1 0.57
3 Air and Vapor Barrier - - - - Interior Air Film - - .68
4 Concrete 10 12.5 .80 total 23.9
2
1
3
4
5
6
7
insulation concrete sandwich panel
R-23.5 (wall)

73a
APPENDIX- 07f | FOUNDATION TO WALL TRANSITIONS: Foundation Wall Sandwich Panel Study
Sandwich panel foundation wall (B)(6” Conc. + 4” Insul. + 8” Conc.)
Calculated Baseline Clear Wall R-value
Material Width
in.
k
Btu·in/h·ft2·˚F
R-value
h·ft2·˚F/Btu
Material Width
in.
k
Btu·in/h·ft2·˚F
R-value
h·ft2·˚F/Btu
- Exterior Air Film - - 0.17 5 Composite Ties - .25 -
1 Concrete 6 12.5 .48 6 Air Cavity - - 1.36
2 Rigid Insulation 4 .2 20 7 Gypsum Board 0.625 1.1 0.57
3 Air and Vapor Barrier - - - - Interior Air Film - - .68
4 Concrete 8 12.5 .64 total 23.9
2
1
3
4
5
6
7
insulation concrete sandwich panel
R-23.20

74a
Project Conditions
Location:Date of Thermal Image:
Exterior Air Temperature:Interior Air Temperature:Radiant Temperature:Assumed Emissivity:
As-Built Condition
APPENDIX- 08a | TRANSITIONS BETWEEN WALL SYSTEMS: Curtain Wall to Stone Veneer Base
Summary of Thermal Performance
Calculated Baseline R-Value:
As-Built ConditionSimulated (THERM) R-Value:
17.53
5.33
-
- 69 %
Eastern Massachusetts03/26/2013
38.9 ˚F68.7 ˚FN/A ˚F
0.9
Calculated Baseline Clear Wall R-value (at Curtain Wall) Calculated Baseline Clear Wall R-value (at Foundation)
Material Width
in.
k
Btu·in/h·ft2·˚F
R-value
h·ft2·˚F/Btu
Material Width
in.
k
Btu·in/h·ft2·˚F
R-value
h·ft2·˚F/Btu
- Exterior Air Film - - 0.17 - Exterior Air Film - - 0.17
1 Curtain Wall 1 - 2.65 6 Stone Veneer 2.00 30.00 0.07
2 Air Space 1.23 7 Grouted Cavity 2.00 6.70 0.30
3 Curtain Wall Insulation 4.00 0.29 13.74 8 Rigid Insulation 2.00 0.20 10.00
4 Air Cavity - - 1.36 9 Concrete 30.00 12.5 2.4
5 Concrete 20 12.5 1.6 - Interior Air Film - - 0.68
- Interior Air Film - - 0.68
total wall (CW) 21.43 total wall (F) 13.62
Composite wall value (.5*CW+.5*F) 17.53
6
8
7
9
1
3
2
4
5

75a
APPENDIX- 08a | TRANSITIONS BETWEEN WALL SYSTEMS: Curtain Wall to Stone Veneer Base
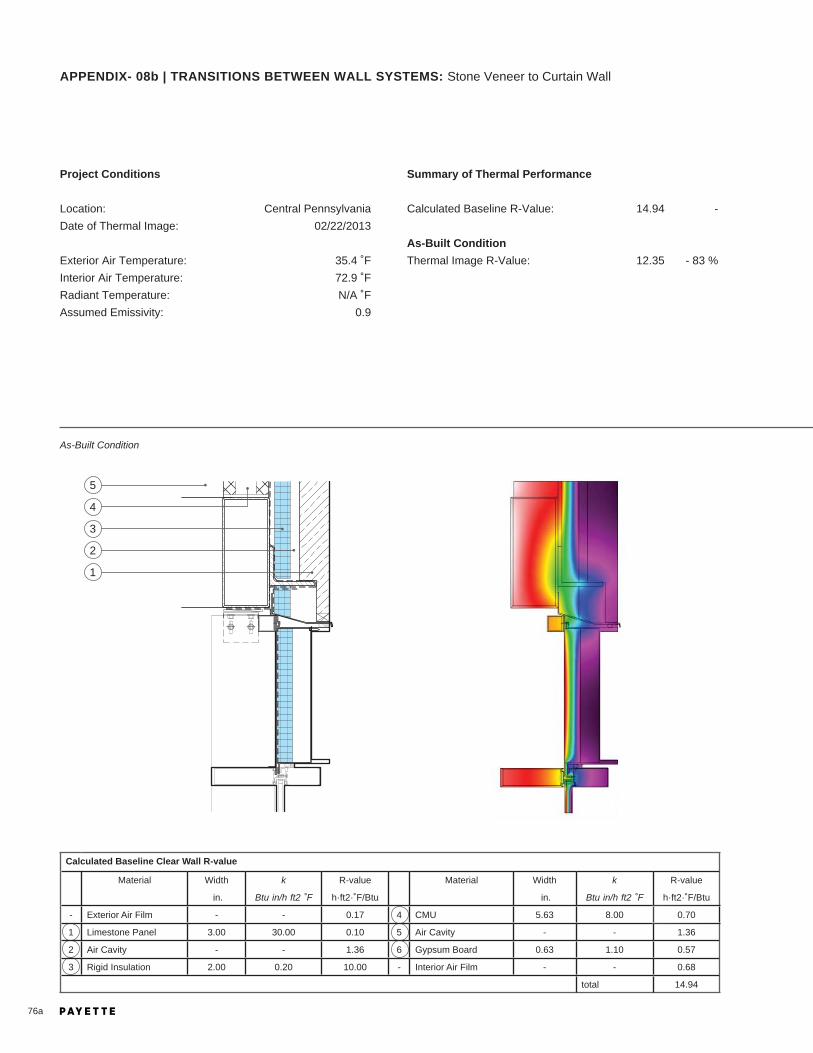
76a
Project Conditions
Location:Date of Thermal Image:
Exterior Air Temperature:Interior Air Temperature:Radiant Temperature:Assumed Emissivity:
As-Built Condition
APPENDIX- 08b | TRANSITIONS BETWEEN WALL SYSTEMS: Stone Veneer to Curtain Wall
Summary of Thermal Performance
Calculated Baseline R-Value:
As-Built ConditionThermal Image R-Value:
14.94
12.35
-
- 83 %
Central Pennsylvania02/22/2013
35.4 ˚F72.9 ˚FN/A ˚F
0.9
4
2
5
3
1
Calculated Baseline Clear Wall R-value
Material Width
in.
k
Btu·in/h·ft2·˚F
R-value
h·ft2·˚F/Btu
Material Width
in.
k
Btu·in/h·ft2·˚F
R-value
h·ft2·˚F/Btu
- Exterior Air Film - - 0.17 4 CMU 5.63 8.00 0.70
1 Limestone Panel 3.00 30.00 0.10 5 Air Cavity - - 1.36
2 Air Cavity - - 1.36 6 Gypsum Board 0.63 1.10 0.57
3 Rigid Insulation 2.00 0.20 10.00 - Interior Air Film - - 0.68
total 14.94

77a
APPENDIX- 08b | TRANSITIONS BETWEEN WALL SYSTEMS: Stone Veneer to Curtain Wall
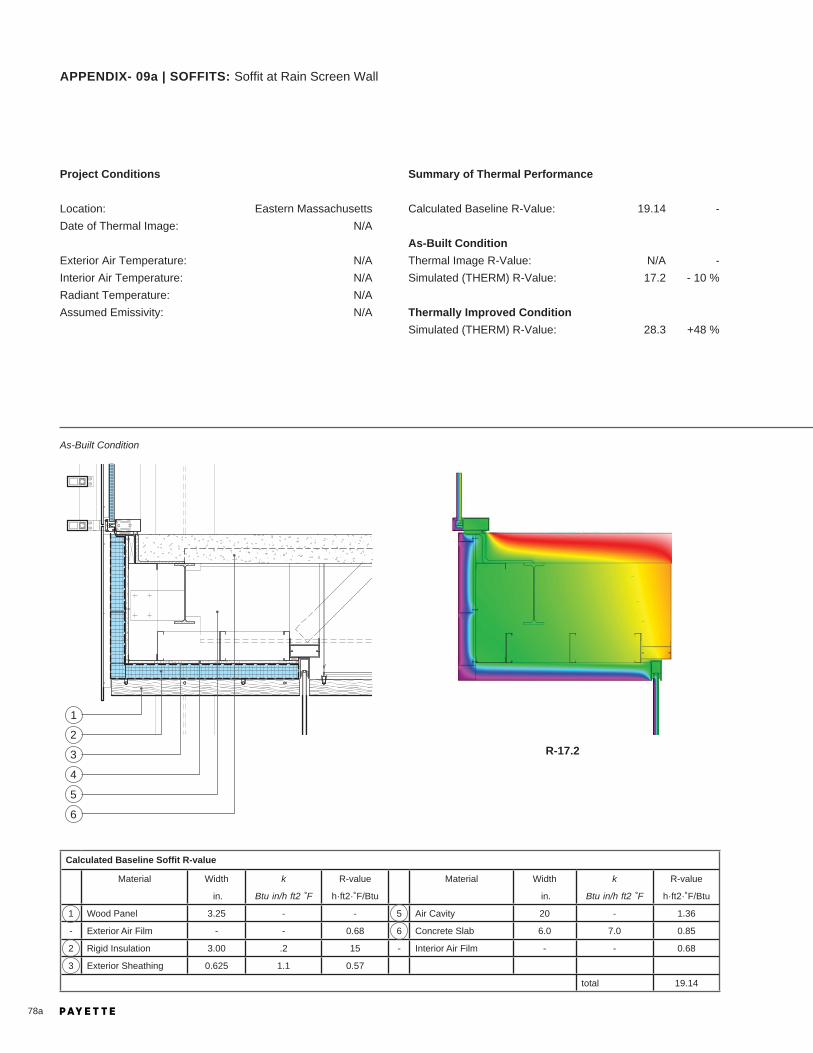
Project Conditions
Location:Date of Thermal Image:
Exterior Air Temperature:Interior Air Temperature:Radiant Temperature:Assumed Emissivity:
As-Built Condition
78a
APPENDIX- 09a | SOFFITS: Soffi t at Rain Screen Wall
R-17.2
Summary of Thermal Performance
Calculated Baseline R-Value:
As-Built ConditionThermal Image R-Value:Simulated (THERM) R-Value:
Thermally Improved ConditionSimulated (THERM) R-Value:
19.14
N/A17.2
28.3
-
-- 10 %
+48 %
Eastern MassachusettsN/A
N/AN/AN/A
N/A
Calculated Baseline Soffi t R-value
Material Width
in.
k
Btu·in/h·ft2·˚F
R-value
h·ft2·˚F/Btu
Material Width
in.
k
Btu·in/h·ft2·˚F
R-value
h·ft2·˚F/Btu
1 Wood Panel 3.25 - - 5 Air Cavity 20 - 1.36
- Exterior Air Film - - 0.68 6 Concrete Slab 6.0 7.0 0.85
2 Rigid Insulation 3.00 .2 15 - Interior Air Film - - 0.68
3 Exterior Sheathing 0.625 1.1 0.57
total 19.14
1
3
2
4
5
6

Thermally Improved Condition
79a
APPENDIX- 09a | SOFFITS: Soffi t at Rain Screen Wall
R-28.3 (+64.5%)
Digital Image Infrared Image
z-girts have been
replaced with stainless
steel bolts and plate out
of the plane of insulation

Project Conditions
Location:Date of Thermal Image:
Exterior Air Temperature:Interior Air Temperature:Radiant Temperature:Assumed Emissivity:
As-Built Condition
80a
APPENDIX- 09b | SOFFITS: Soffi t at Metal Panel Wall
Summary of Thermal Performance
Calculated Baseline R-Value:
As-Built ConditionThermal Image R-Value:Simulated (THERM) R-Value:
Thermally Improved ConditionSimulated (THERM) R-Value:
Calculated Baseline Clear Wall R-value
Material Width
in.
k
Btu·in/h·ft2·˚F
R-value
h·ft2·˚F/Btu
Material Width
in.
k
Btu·in/h·ft2·˚F
R-value
h·ft2·˚F/Btu
- Exterior Air Film - - 0.17 5 Air Cavity 19.125 - 1.36
1 Composite Panel - - 0.06 6 Concrete Slab 6 7.0 0.85
2 Air Cavity - - 1 - Interior Air Film - - 0.68
3 Rigid Insulation 2.00 0.20 10
4 Exterior Sheathing 0.625 1.10 0.57
total 14.69
4
6
5
3
2
1
1.84
2.2815.6
N/A
-
- 84 %+12.7 %
-
Eastern Massachusetts3/26/2013
38.860.262.8
0.9
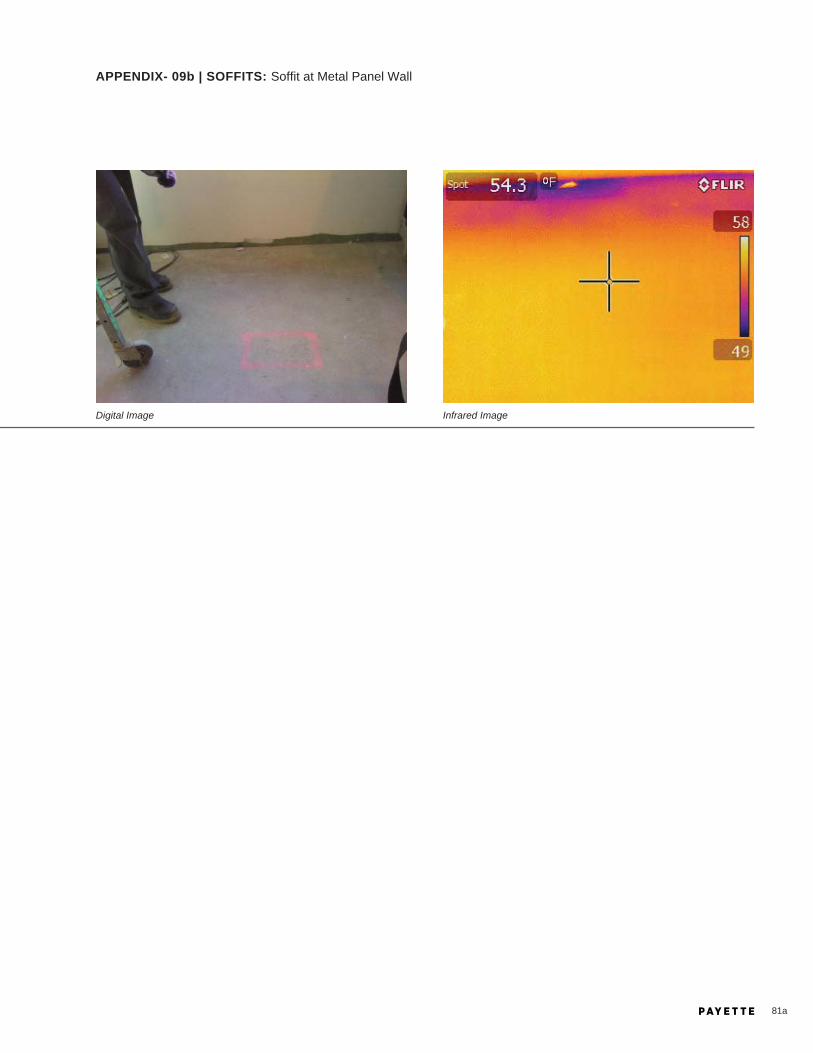
81a
APPENDIX- 09b | SOFFITS: Soffi t at Metal Panel Wall
Digital Image Infrared Image

Project Conditions
Location:Date of Thermal Image:
Exterior Air Temperature:Interior Air Temperature:Radiant Temperature:Assumed Emissivity:
As-Built Condition
82a
APPENDIX- 09c | SOFFITS: Soffi t at Stone Cladding
R-16.1
Summary of Thermal Performance
Calculated Baseline R-Value:
As-Built ConditionThermal Image R-Value:Simulated (THERM) R-Value:
Thermally Improved ConditionSimulated (THERM) R-Value:
15.34
N/A16.1
17.2
-
- +5 %
+12 %
Eastern PennsylvaniaN/A
N/AN/AN/AN/A
Calculated Baseline Clear Wall R-value
Material Width
in.
k
Btu·in/h·ft2·˚F
R-value
h·ft2·˚F/Btu
Material Width
in.
k
Btu·in/h·ft2·˚F
R-value
h·ft2·˚F/Btu
- Exterior Air Film - - 0.17 4 Exterior Sheathing 0.625 1.1 0.57
1 Limestone Panel 3.00 4 0.75 5 Air Cavity 57 - 1.36
2 Air Cavity 2.00 - 1.36 6 Concrete 6 13.49 0.45
3 Rigid Insulation 2.00 0.20 10 - Interior Air Film - - 0.68
total 15.34
1
3
2
4
5
6

Thermally Improved Condition
83a
APPENDIX- 09c | SOFFITS: Soffi t at Stone Cladding
R-17.2 (+6.8%)
fasteners and relieving
angle changed to
stainless steel
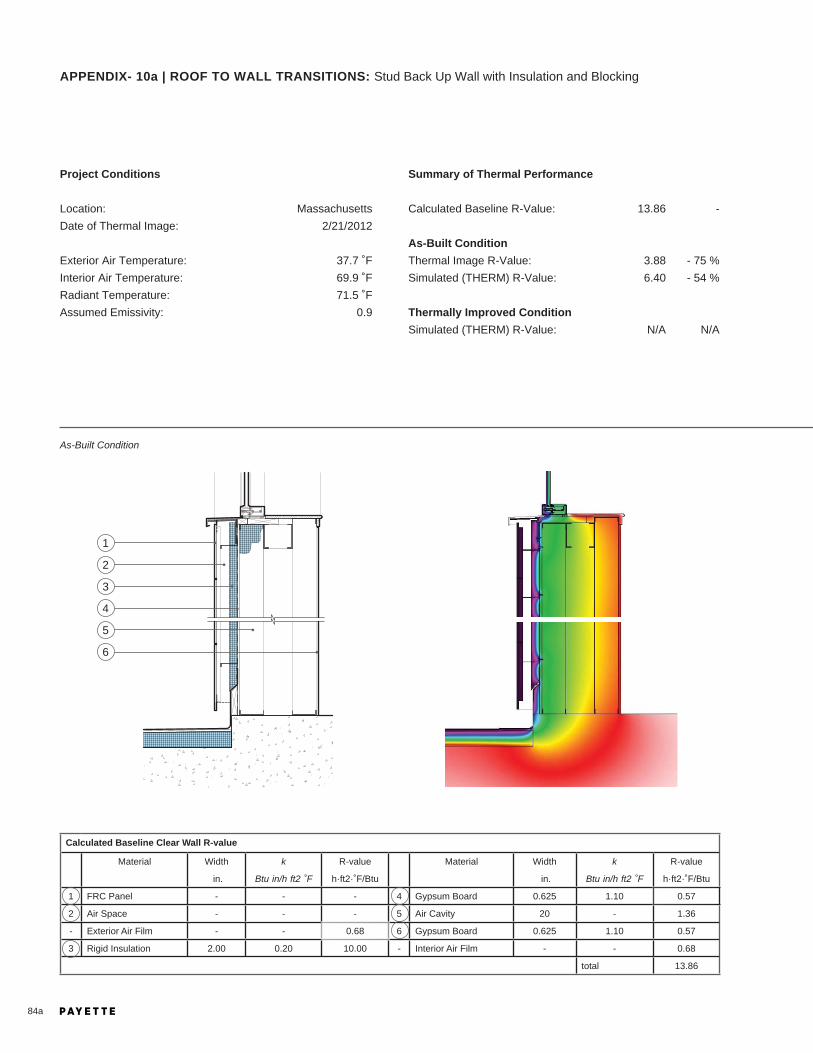
84a
Project Conditions
Location:Date of Thermal Image:
Exterior Air Temperature:Interior Air Temperature:Radiant Temperature:Assumed Emissivity:
As-Built Condition
APPENDIX- 10a | ROOF TO WALL TRANSITIONS: Stud Back Up Wall with Insulation and Blocking
Summary of Thermal Performance
Calculated Baseline R-Value:
As-Built ConditionThermal Image R-Value:Simulated (THERM) R-Value:
Thermally Improved ConditionSimulated (THERM) R-Value:
13.86
3.886.40
N/A
-
- 75 %- 54 %
N/A
Massachusetts2/21/2012
37.7 ˚F69.9 ˚F71.5 ˚F
0.9
1
3
5
2
4
6
Calculated Baseline Clear Wall R-value
Material Width
in.
k
Btu·in/h·ft2·˚F
R-value
h·ft2·˚F/Btu
Material Width
in.
k
Btu·in/h·ft2·˚F
R-value
h·ft2·˚F/Btu
1 FRC Panel - - - 4 Gypsum Board 0.625 1.10 0.57
2 Air Space - - - 5 Air Cavity 20 - 1.36
- Exterior Air Film - - 0.68 6 Gypsum Board 0.625 1.10 0.57
3 Rigid Insulation 2.00 0.20 10.00 - Interior Air Film - - 0.68
total 13.86

85a
APPENDIX- 10a | ROOF TO WALL TRANSITIONS: Stud Back Up Wall with Insulation and Blocking
Digital Image Infrared Image

86a
Project Conditions
Location:Date of Thermal Image:
Exterior Air Temperature:Interior Air Temperature:Radiant Temperature:Assumed Emissivity:
As-Built Condition
APPENDIX- 10b | ROOF TO WALL TRANSITIONS: Stud Back Up Wall with Continuous Insulation
Summary of Thermal Performance
Calculated Baseline R-Value:
As-Built ConditionThermal Image R-Value:Simulated (THERM) R-Value:
Thermally Improved ConditionSimulated (THERM) R-Value:
16.74
8.214
N/A
-
- 49 %- 14 %
-
Massachusetts2/9/2012
37.7 ˚F71.6 ˚F72.8 ˚F
0.9
Calculated Baseline Clear Wall R-value
Material Width
in.
k
Btu·in/h·ft2·˚F
R-value
h·ft2·˚F/Btu
Material Width
in.
k
Btu·in/h·ft2·˚F
R-value
h·ft2·˚F/Btu
1 Corrugated Metal - - - 5 Air Cavity 10 - 1.36
2 Air Space - - - 6 Gypsum Board 0.625 1.1 0.57
- Exterior Air Film - - 0.68 - Interior Air Film - - 0.68
3 Mineral Wool 3.00 0.23 13
4 Exterior Sheathing 0.50 1.1 0.45
total 16.74
1
3
4
2
5
6

87a
APPENDIX- 10b | ROOF TO WALL TRANSITIONS: Stud Back Up Wall with Continuous Insulation
Digital Image Infrared Image
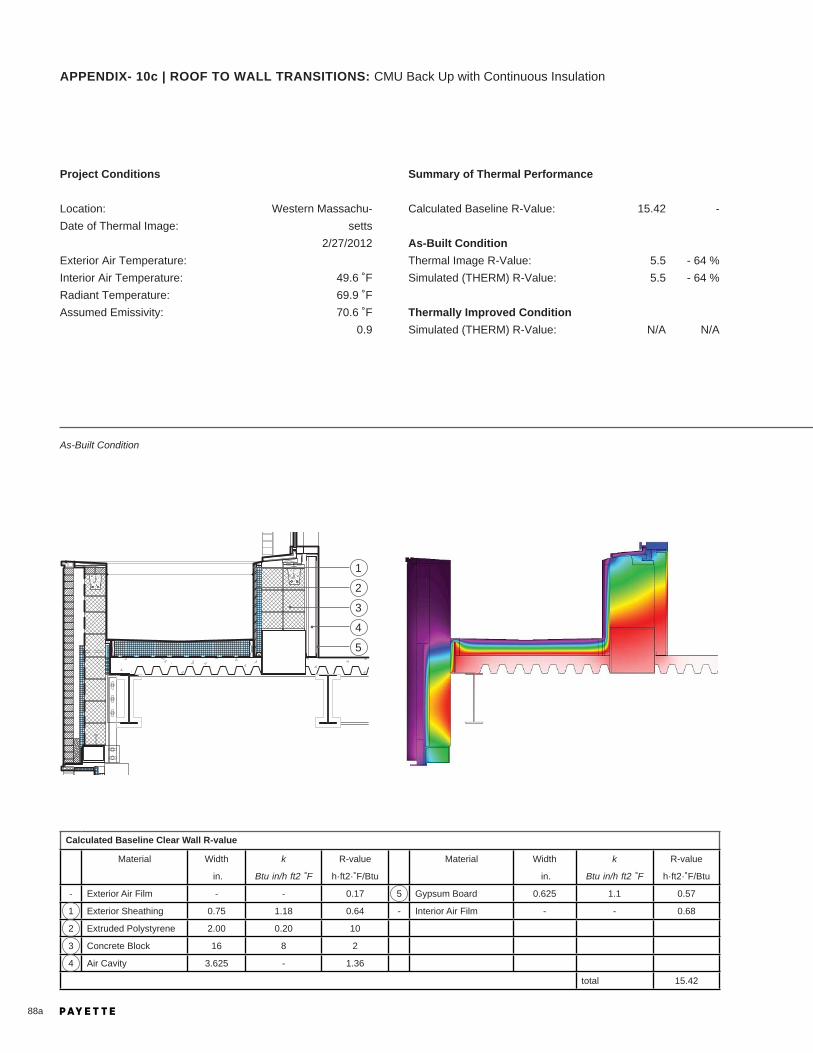
88a
Project Conditions
Location:Date of Thermal Image:
Exterior Air Temperature:Interior Air Temperature:Radiant Temperature:Assumed Emissivity:
As-Built Condition
APPENDIX- 10c | ROOF TO WALL TRANSITIONS: CMU Back Up with Continuous Insulation
Summary of Thermal Performance
Calculated Baseline R-Value:
As-Built ConditionThermal Image R-Value:Simulated (THERM) R-Value:
Thermally Improved ConditionSimulated (THERM) R-Value:
15.42
5.55.5
N/A
-
- 64 %- 64 %
N/A
Western Massachu-setts
2/27/2012
49.6 ˚F69.9 ˚F70.6 ˚F
0.9
Calculated Baseline Clear Wall R-value
Material Width
in.
k
Btu·in/h·ft2·˚F
R-value
h·ft2·˚F/Btu
Material Width
in.
k
Btu·in/h·ft2·˚F
R-value
h·ft2·˚F/Btu
- Exterior Air Film - - 0.17 5 Gypsum Board 0.625 1.1 0.57
1 Exterior Sheathing 0.75 1.18 0.64 - Interior Air Film - - 0.68
2 Extruded Polystyrene 2.00 0.20 10
3 Concrete Block 16 8 2
4 Air Cavity 3.625 - 1.36
total 15.42
1
2
3
4
5

89a
APPENDIX- 10c | ROOF TO WALL TRANSITIONS: CMU Back Up with Continuous Insulation
Digital Image Infrared Image

As-Built Condition
90a
Parapet Height Study
This study works with limited variables to see how the parapet height can have a negative impact on the thermal envelope.
APPENDIX- 11a | PARAPETS: Parapet Height Study
Summary of Thermal Performance
Simulated Baseline R-Value:(insulating beneath the parapet)
Simulated 1’-3” tall parapet R-Value:
Simulated 2’-6” tall parapet R-Value:
Simulated 5’-0” tall parapet R-Value:
15.33
13.42
12.25
11.27
-
- 12.5 %
- 20.1 %
- 26.5 %
R-15.33 Insulating beneath parapet
R-13.42 Insulating around 1’-3” tall parapet

Thermally Improved Condition
91a
APPENDIX- 11a | PARAPETS: Parapet Height Study
R-12.25 Insulating around 2’-6” tall parapet
R-11.27 Insulating around 5’-0” tall parapet

Project Conditions
Location:Date of Thermal Image:
Exterior Air Temperature:Interior Air Temperature:Radiant Temperature:Assumed Emissivity:
As-Built Condition
92a
APPENDIX- 11b | PARAPETS: Insulated Metal Panel Stud Wall
Summary of Thermal Performance
Calculated Baseline R-Value:
As-Built ConditionThermal Image R-Value:Simulated (THERM) R-Value:
Thermally Improved ConditionSimulated (THERM) R-Value:
22.34
N/A8.57
10.65
-
- -61.6 %
- 52.3 %
New York StateN/A
N/AN/AN/AN/A
R-8.57
7
6
8
4
3
5
2
1
10
9

Thermally Improved Condition
93a
APPENDIX- 11b | PARAPETS: Insulated Metal Panel Stud Wall
Calculated Wall Baseline R-value Calculated Roof Baseline R-value
Material Width
in.
k
Btu·in/h·ft2·˚F
R-value
h·ft2·˚F/Btu
Material Width
in.
k
Btu·in/h·ft2·˚F
R-value
h·ft2·˚F/Btu
- Exterior Air Film - - 0.17 - Exterior Air Film - - 0.17
1 Insulated Metal Panel (XPS) 2 0.20 10 6 Gypsum Board 0.625 1.10 0.57
2 Air Cavity 1 - 1 7 Extruded Polystyrene 4.5 0.20 22.5
3 Gypsum Board 0.625 1.10 0.57 8 Concrete Slab 7.5 13.5 0.56
4 Interior Air Film 6 - 1.36 9 Air Cavity 30 - 1.36
5 Gypsum Board 0.625 1.10 0.57 10 Gypsum Board 0.625 1.10 0.57
- Interior Air Film - - 0.68 - Interior Air Film - - 0.61
total wall 14.35 total roof 26.34
Sum of R-values (1/3 wall total+ 2/3 roof total) 22.34
R-10.65 (+24.3%)
continuous insulation
underneath parapet

Project Conditions
Location:Date of Thermal Image:
Exterior Air Temperature:Interior Air Temperature:Radiant Temperature:Assumed Emissivity:
As-Built Condition
94a
APPENDIX- 11c | PARAPETS: Concrete Wall
Summary of Thermal Performance
Calculated Baseline R-Value:
As-Built ConditionThermal Image R-Value:Simulated (THERM) R-Value:
Thermally Improved ConditionSimulated (THERM) R-Value:
23.15
N/A11.61
14.18
-
- - 49.8 %
- 38 %
Eastern MassachusettsN/A
N/AN/AN/AN/A
R-11.61
9
8
6
5
7
4
10
1
2
3

Thermally Improved Condition
95a
APPENDIX- 11c | PARAPETS: Concrete Wall
R-14.18 (+22%)
Calculated Wall Baseline R-value Calculated Roof Baseline R-value
Material Width
in.
k
Btu·in/h·ft2·˚F
R-value
h·ft2·˚F/Btu
Material Width
in.
k
Btu·in/h·ft2·˚F
R-value
h·ft2·˚F/Btu
1 Fiber Reinforced Cement Panel .5 - N/A - Exterior Air Film - - 0.68
2 Air Cavity (Ventilated) 1 - N/A 8 Substrate Board 0.625 1.10 0.57
- Exterior Air Film - - 0.17 9 Polyisocyanurate
Board Insulation
4 - 23.6
3 Extruded Polystyrene (XPS) 2 0.20 10
4 Gypsum Board 0.625 1.10 0.57 10 Concrete Slab 7.5 7.0 1.07
5 Concrete 10 13.5 0.74 - Interior Air Film - - 0.68
6 Air Cavity 11 - 1.37
7 Gypsum Board 0.625 1.10 0.57
- Interior Air Film - - 0.68
total wall 14.1 total roof 26.6
Comparable Sum of R-values (1/3 wall total+ 2/3 roof total) 23.15
structural
thermal break

Project Conditions
Location:Date of Thermal Image:
Exterior Air Temperature:Interior Air Temperature:Radiant Temperature:Assumed Emissivity:
As-Built Condition
96a
APPENDIX- 11d | PARAPETS: Masonry Cavity Wall
Summary of Thermal Performance
Calculated Baseline R-Value:
As-Built ConditionThermal Image R-Value:Simulated (THERM) R-Value:
Thermally Improved ConditionSimulated (THERM) R-Value:
26.1
N/A7.58
12.51
-
- - 70.9 %
- 52 %
Central MassachusettsN/A
N/AN/AN/AN/A
9
8
3
2
4
1
10
6
5
7
R-7.58

Thermally Improved Condition
97a
APPENDIX- 11d | PARAPETS: Masonry Cavity Wall
Calculated Wall Baseline R-value Calculated Roof Baseline R-value
Material Width
in.
k
Btu·in/h·ft2·˚F
R-value
h·ft2·˚F/Btu
Material Width
in.
k
Btu·in/h·ft2·˚F
R-value
h·ft2·˚F/Btu
- Exterior Air Film - - 0.17 - Exterior Air Film - - 0.17
1 Brick Masonry 3.625 5.50 0.66 7 Polyisocyanurate
Board Insulation
4.5 - 26.8
2 Air Cavity 11 - 1.00
3 Extruded Polystyrene (XPS) 2 0.20 10 8 Concrete Slab 7.625 7.0 1.09
4 Gypsum Board 0.625 1.10 0.57 9 Air Cavity 25 - 1.36
5 Air Cavity 6 - 1.36 10 Gypsum Board 0.625 1.10 0.57
6 Gypsum Board 0.625 1.10 0.57 - Interior Air Film - - 0.68
- Interior Air Film - - 0.68
total wall 15.90 total roof 31.2
Comparable Sum of R-values (1/3 wall total+ 2/3 roof total) 26.1
continuous insulation
below metal framing
R-12.51 (+65%)

Project Conditions
Location:Date of Thermal Image:
Exterior Air Temperature:Interior Air Temperature:Radiant Temperature:Assumed Emissivity:
As-Built Condition
98a
APPENDIX- 12a | ROOF PENETRATIONS: Roof Davits
Summary of Thermal Performance
Calculated Baseline R-Value:
As-Built ConditionThermal Image R-Value:Simulated (THERM) R-Value:
Thermally Improved ConditionSimulated (THERM) R-Value:
17.75
5.7610.07
N/A
-
- 67 %- 43 %
N/A
Eastern Massachusetts01/23/1013
11.4 ˚F59.7 ˚F59.4 ˚F
0.9
Calculated Baseline Clear Wall R-value
Material Width
in.
k
Btu·in/h·ft2·˚F
R-value
h·ft2·˚F/Btu
Material Width
in.
k
Btu·in/h·ft2·˚F
R-value
h·ft2·˚F/Btu
1 Thermally Broken
Davit (24’-0” o.c.)
- - - 5 Air and Vapor Barrier - - -
2 Roof Membrane - - - 6 Gypsum Board - - 0.57
- Exterior Air Film - - 0.17 7 Air Cavity - - 1.36
3 Exterior Sheathing - - - 8 Gypsum Board - - 0.57
4 Polyiso Insulation 2.5 - 14.4 - Interior Air Film - - 0.68
total 17.75
1
5
7
8
2
6
4
3
R-10.11
short stainless steel davit
with tefl on thermal break
between steel plates

99a
APPENDIX- 12a | ROOF PENETRATIONS: Roof Davits
Digital Image Infrared Image
Additional Davit Studies
base condition: galvanized
steel davit directly
attached to structure
BASE MODEL
davit attached through
a concrete slab with
thermal break
+ 23.5%
insulation added up
to top of davit
+ 30.9%
insulation added around
exterior of a shorter davit
+ 53.9%

Project Conditions
Location:Date of Thermal Image:
Exterior Air Temperature:Interior Air Temperature:Radiant Temperature:Assumed Emissivity:
As-Built Condition
100a
APPENDIX- 12b | ROOF PENETRATIONS: Hand Rail
Summary of Thermal Performance
Calculated Baseline R-Value:
As-Built ConditionThermal Image R-Value:Simulated (THERM) R-Value:
Thermally Improved ConditionSimulated (THERM) R-Value:
24.02
-4.75
7.75
-
--80 %
- 67.7 %
PennslyvaniaN/A
N/AN/AN/AN/A
Calculated Baseline Clear Wall R-value
Material Width
in.
k
Btu·in/h·ft2·˚F
R-value
h·ft2·˚F/Btu
Material Width
in.
k
Btu·in/h·ft2·˚F
R-value
h·ft2·˚F/Btu
3 Concrete 6.5 13.5 0.74
- Exterior Air Film - - 0.17 - Air Cavity - - 1.36
1 Gravel 6.00 12.00 0.50 - Gypsum Board 0.63 1.10 0.57
2 XPS 4 0.20 20 - Interior Air Film - - 0.68
total 24.02
1
3
2
glass railing
with continuous
bottom rail and
discontinuous
galvanized steel
tube supports
R-4.75

Thermally Improved Condition
101a
APPENDIX- 12b | ROOF PENETRATIONS: Hand Rail
R-7.3(+ 53.6%)
R-7.75(+ 63.2%)
bottom rail changed
to stainless steel
and thermal break
introduced between
rail and supports
bottom rail changed
to stainless steel and
thermal break intro-
duced between rail
and supports. Sup-
ports changed from
tubes to channels

102a
Project Conditions
Location:Date of Thermal Image:
Exterior Air Temperature:Interior Air Temperature:Radiant Temperature:Assumed Emissivity:
As-Built Condition
APPENDIX- 13a | LOUVERS: Mechanical Louver at Grade
Summary of Thermal Performance
Calculated Baseline R-Value:
As-Built ConditionSimulated (THERM) R-Value:
Thermally Improved ConditionSimulated (THERM) R-Value:
11.49
5.68
6.53
-
- 58 %
- 52 %
Southern Massachusetts02/09/2012
32.3 ˚F71.0 ˚FN/A ˚F
0.9
Calculated Baseline Clear Wall R-value
Material Width
in.
k
Btu·in/h·ft2·˚F
R-value
h·ft2·˚F/Btu
Material Width
in.
k
Btu·in/h·ft2·˚F
R-value
h·ft2·˚F/Btu
- Exterior Air Film - - 0.17 4 Concrete 6.5 13.5 0.48
1 Granite 3.00 30.00 0.10 - Interior Air Film - - 0.68
2 Grout 0.38 6.70 0.06
3 Rigid Insulation 2.00 0.20 10.00
total 11.49
1
3
2
4
R-5.68

103a
Thermally Improved Condition
APPENDIX- 13a | LOUVERS: Mechanical Louver at Grade
R-6.53 (+15%)
masonry opening in-
creased enough to allow
insulation below (and
around) louver.

104a
Project Conditions
Location:Date of Thermal Image:
Exterior Air Temperature:Interior Air Temperature:Radiant Temperature:Assumed Emissivity:
As-Built Condition
APPENDIX- 13b | LOUVERS: Mechanical Louver at Penthouse
Summary of Thermal Performance
Calculated Baseline R-Value:
As-Built ConditionSimulated (THERM) R-Value:
Thermally Improved ConditionSee continuous insulation at 13a
16.85
16.85
-Western Massachusetts02/27/2012
40.8 ˚F72.2 ˚FN/A ˚F
0.9
Calculated Baseline Clear Wall R-value
Material Width
in.
k
Btu·in/h·ft2·˚F
R-value
h·ft2·˚F/Btu
Material Width
in.
k
Btu·in/h·ft2·˚F
R-value
h·ft2·˚F/Btu
- - - - - 2 Aluminum Panel 0.13 136.94 0.00
- - - - - 3 Air Cavity - - 1.00
- - - - - 4 Rigid Insulation 3.00 0.20 15.00
1 Exterior Air Film - - 0.17 - Interior Air Film - - 0.68
total 16.85
1
3
2
4

105a
APPENDIX- 13b | LOUVERS: Mechanical Louver at Penthouse

Project Conditions
Location:Date of Thermal Image:
Exterior Air Temperature:Interior Air Temperature:Radiant Temperature:Assumed Emissivity:
As-Built Condition
106a
APPENDIX- 14a | EXISTING BUILDING BEAM EMBEDS: Thermal Break at Structural Connection
Summary of Thermal Performance
Calculated Baseline R-Value:
As-Built ConditionThermal Image R-Value:Simulated (THERM) R-Value:
Thermally Improved ConditionSimulated (THERM) R-Value:
29.17
8.4716.62
22.66
-
- 71 %- 43 %
- 22 %
Eastern Massachusetts01/23/2013
12.2 ˚F75.7 ˚F79.3 ˚F
0.9
3
7
2
6
4
1
5
Calculated Baseline Clear Wall R-value
Material Width
in.
k
Btu·in/h·ft2·˚F
R-value
h·ft2·˚F/Btu
Material Width
in.
k
Btu·in/h·ft2·˚F
R-value
h·ft2·˚F/Btu
- Exterior Air Film - - 0.17 4 Sprayfoam Insulation 3.5 0.1664 21.03
1 Brick 16 5.5 2.91 5 Air Cavity 4.5 - 1.36
2 Air Cavity 1 - 1.36 6 Plywood 0.75 1.1787 0.64
3 Cement Board 0.5 1.10 0.45 7 Gypsum Board 0.625 1.10 0.57
- Interior Air Film - - 0.68
total 29.17
edge of beam
fl ange above
R-16.62

Thermally Improved Condition
107a
Digital Image Infrared Image
APPENDIX- 14a | EXISTING BUILDING BEAM EMBEDS: Thermal Break at Structural Connection
structural
thermal break
R-22.66 (+36%)

Project Conditions
Location:Date of Thermal Image:
Exterior Air Temperature:Interior Air Temperature:Radiant Temperature:Assumed Emissivity:
As-Built Condition
108a
APPENDIX- 15a | NEW SLABS IN EXISTING BUILDINGS: Thermal Break at New Slab
Summary of Thermal Performance
Calculated Baseline R-Value:
As-Built ConditionThermal Image R-Value:Simulated (THERM) R-Value:
Thermally Improved ConditionSimulated (THERM) R-Value:
29.55
15.3316.14
21.10
-
- 48 % - 45 %
- 29 %
Calculated Baseline Clear Wall R-value
Material Width
in.
k
Btu·in/h·ft2·˚F
R-value
h·ft2·˚F/Btu
Material Width
in.
k
Btu·in/h·ft2·˚F
R-value
h·ft2·˚F/Btu
- Exterior Air Film - - 0.17 4 Sprayfoam Insulation 3.5 0.1664 21.03
1 Brick 16 5.5 2.91 5 Air Cavity 4.5 - 1.36
2 Air Cavity 1 - 1.36 6 Plywood 0.75 0.735 1.02
3 Cement Board 0.5 1.10 0.45 7 Gypsum Board 0.625 1.10 0.57
- Interior Air Film - - 0.68
total 29.55
R-16.14
Eastern Massachusetts01/23/2013
22.1 ˚F53.7 ˚F55.8 ˚F
0.9

Thermally Improved Condition
109a
Digital Image Infrared Image
APPENDIX- 15a | NEW SLABS IN EXISTING BUILDINGS: Thermal Break at New Slab
R-21.10 (+30.7%)
new slab installed 5” from
back of existing wall with
compressed mineral wool
insulation infi ll at gap

Project Conditions
Location:Date of Thermal Image:
Exterior Air Temperature:Interior Air Temperature:Radiant Temperature:Assumed Emissivity:
As-Built Condition
110a
APPENDIX- 16a | SEISMIC & MOVEMENT JOINTS: Joint at Masonry Wall and Existing Building
Summary of Thermal Performance
Calculated Baseline R-Value:
As-Built ConditionThermal Image R-Value:Simulated (THERM) R-Value:
Thermally Improved ConditionSimulated (THERM) R-Value:
17.69
6.777.88
13.72
-
- 62 %- 55.5%
- 22 %
Massachusetts2/5/2013
33.8 ˚F63.8 ˚F51.3 ˚F
0.9
Calculated Baseline Clear Wall R-value
Material Width
in.
k
Btu·in/h·ft2·˚F
R-value
h·ft2·˚F/Btu
Material Width
in.
k
Btu·in/h·ft2·˚F
R-value
h·ft2·˚F/Btu
- Exterior Air Film - - 0.17 5 Sheathing 0.50 1.10 0.45
1 Granite Veneer 3 30 0.10 6 Air Cavity 11 - 1.36
2 Air Cavity - - 1.36 7 Expansion Joint - - -
3 Mineral Wool 3 0.23 13 8 Gypsum Board 0.625 1.10 0.57
4 Air and Vapor Barrier - - - - Interior Air Film - - 0.68
total 17.69
5
1
6
2
4
7
8
3
R-7.88

Thermally Improved Condition
111a
APPENDIX- 16a | SEISMIC & MOVEMENT JOINTS: Joint at Masonry Wall and Existing Building
Digital Image Infrared Image
R-13.72 (+74%)
spray foam insulation
added to existing wall,
and at frame for joint

Project Conditions
Location:Date of Thermal Image:
Exterior Air Temperature:Interior Air Temperature:Radiant Temperature:Assumed Emissivity:
As-Built Condition
112a
APPENDIX- 16b | SEISMIC & MOVEMENT JOINTS: Joint at Curtain Wall and Existing Building
Summary of Thermal Performance
Calculated Baseline R-Value:
As-Built ConditionThermal Image R-Value:Simulated (THERM) R-Value:
Thermally Improved ConditionSimulated (THERM) R-Value:
11.85
N/A2.30
N/A
-
N/A- 81%
N/A
Massachusetts2/3/2013
33.8 ˚F72.7 ˚FN/A ˚F
0.9
Calculated Baseline Clear Wall R-value (at Expnsion Joint)
Material Width
in.
k
Btu·in/h·ft2·˚F
R-value
h·ft2·˚F/Btu
Material Width
in.
k
Btu·in/h·ft2·˚F
R-value
h·ft2·˚F/Btu
3 Expansion Joint 6 0.55 11
- Exterior Air Film - - 0.17 4 Wood Blocking - - -
1 Insulated Glazing - - - 5 Existing Masonry - - -
2 Curtain Wall Mullion - - - - Interior Air Film - - 0.68
total 11.85
1
4
2
3
5

113a
APPENDIX- 16b | SEISMIC & MOVEMENT JOINTS: Joint at Curtain Wall and Existing Building
Digital Image Infrared Image