Thermal Excitation System for Shearography (TESS) - … · Technical Report 5-33847 Contract No....
43
Technical Report 5-33847 Contract No. NAS8-38609 Delivery Order No. 142 .j////2L / Thermal Excitation System for Shearography (TESS) (5-33847) Final Technical Report for Period 26 April 1995 through 30 April 1996 July 1996 Prepared by Matthew D. Lansing Michael W. Bullock Research Institute The University of Alabama in Huntsville Huntsville, Alabama 35899 Prepared for George C. Marshall Space Flight Center National Aeronautics and Space Administration Marshall Space Flight Center, AL 35812 Attn.: EHI3 (Dr. Samuel S. Russell) https://ntrs.nasa.gov/search.jsp?R=19960054336 2018-06-01T05:52:48+00:00Z
Transcript of Thermal Excitation System for Shearography (TESS) - … · Technical Report 5-33847 Contract No....

Technical Report 5-33847Contract No. NAS8-38609
Delivery Order No. 142
.j////2L
/
Thermal Excitation System for Shearography (TESS)(5-33847)
Final Technical Report for Period
26 April 1995 through 30 April 1996
July 1996
Prepared by
Matthew D. Lansing
Michael W. Bullock
Research Institute
The University of Alabama in Huntsville
Huntsville, Alabama 35899
Prepared for
George C. Marshall Space Flight Center
National Aeronautics and Space Administration
Marshall Space Flight Center, AL 35812
Attn.: EHI3 (Dr. Samuel S. Russell)
https://ntrs.nasa.gov/search.jsp?R=19960054336 2018-06-01T05:52:48+00:00Z
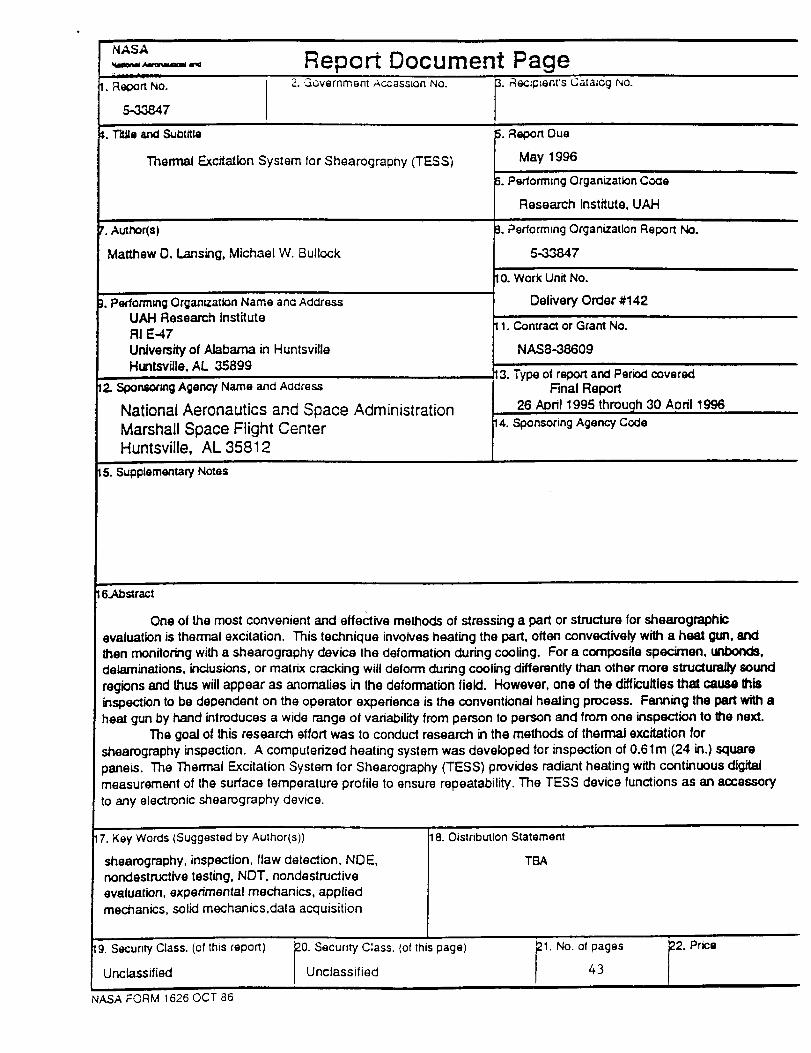
NASANmJm_II Am'o_R4n_i _ Report Document Page
2.Government ACCSSSIQR NO.
f,.T_e _ Subtitle
Thermal Excitation System for Shearograpny (TESS)
7. Autt',or(s)
Matthew D. lansing, Michael W. Bullock
]. Pedormmg Organization Name and AddressUAH Research Institute
RI E47
University of Alabama in HuntsvilleHuntsville, AL 35899
12. ,._x_n=ormgAgency Name and Address
National Aeronautics and Space Administration
Marshall Space Flight CenterHuntsville, AL 35812
3. r_eczl31en{'sCatalog No.
_. Report Due
May 1996
3. Performing Organization Cc_e
Research Institute, UAH
8. Pedorming Organization Report No.
5-33847
10. Work Unit No.
Delivery Order #142
11. Contract or Grant No.
NAS8-38609
13. Type of report ancl Period coveredFinal Report
26 Ap,n11995 through 30 Aoril 1996
14. Sponsoring Agency Code
15. Supplementary Notes
&Abstract
One o! the most convenient and effective methods of stressing a part or structure for sheatogmphio
evaluation is thermal excitation. This technique involves heating the part, often convectively with a heat gun, and
then monitoring with a shearography device the deformation during cooling. For a composite specimen, unbo;x_,
delaminations, inclusions, or matrix cracking will deform during cooling differently than other more structurally sound
regions and thus will appear as anomalies in the deformation field. However, one of the dilficultles that cause Ibis
inspection to be dependent on the operator experience is the conventional heating process. Fanning the part with a
heat gun by hand introduces a wide range of variability from person to person and from one inspection to Ihe next.
The goal of this research effort was to conduct research in the methods of thermal excitation for
shearography inspection. A computerized heating system was developed for inspection of 0.61m (24 in.) square
}anels. The Thermal Excitation System for Shearography (TESS) provides radiant heating with continuous digital
measurement of the surface temperature profile to ensure repeatability. The TESS device functions as an accessory
to any electronic shearography device.
7.Key Words (Suggested by Author(s))
shearography, inspection, flaw detection, NDE,nondestructive testing, NDT, nondestructive
evaluation, experimental mechanics, applied
mechanics, solid mechanics,data acquisition
18. Oistribution Statement
TBA
19. Security Class. (of this report)
Unclassified0. Security C;ass. (of this page)
Unclassified
NASA FORM 1626 OCT 86
l. No. of pages43

TABLE OF CONTENTS
I. INTRODUCTION
II. PRELIMINARY DESIGN
III. HEAT SOURCE SELECTION
IV. TESS HARDWARE 2
V. TESS SOFTWARE 2
VI° PROCEDURES
A. INSTALLATION AND SETUP
B. STANDARD OPERATION
C. CALIBRATION
4
4
4
6
VII. EXPERIMENTATION
A. HEAT FLUX TESTING
B. COOLING RATE
C. DEMONSTRATION
VIII. SYSTEM INTEGRATION 9
APPENDIX 10
A. 1. MATERIALS LIST 11
A.2. SOURCE CODE
A.2.1.
A.2.2.
A.2.3.
A.2.4.
A.2.5.
TESS PROJECT FILE
ABOUT TESS WINDOW
TESS CALIBRATION WINDOW
TESS MAIN WINDOW
TESS PROFILE WINDOW
12
12
12
15
21
32
A.3. MECHANICAL DRAWINGS 35
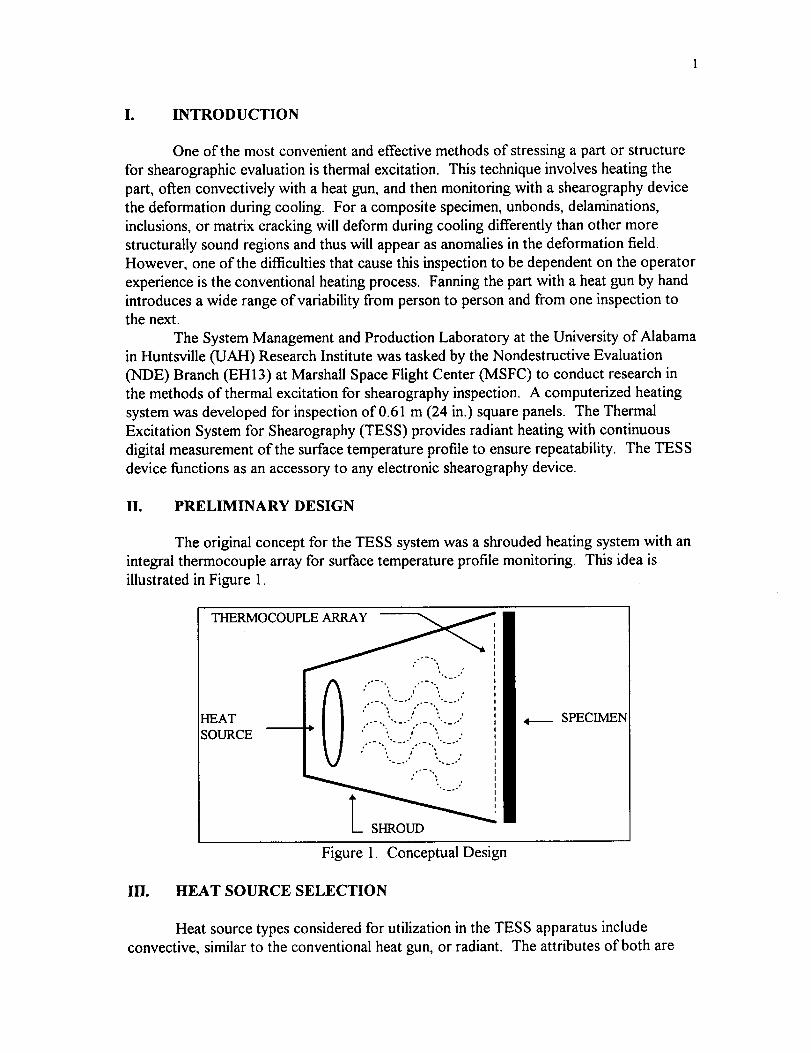
I. INTRODUCTION
One of the most convenient and effective methods of stressing a part or structure
for shearographic evaluation is thermal excitation. This technique involves heating the
part, often convectively with a heat gun, and then monitoring with a shearography device
the deformation during cooling. For a composite specimen, unbonds, delaminations,
inclusions, or matrix cracking will deform during cooling differently than other more
structurally sound regions and thus will appear as anomalies in the deformation field.
However, one of the difficulties that cause this inspection to be dependent on the operator
experience is the conventional heating process. Fanning the part with a heat gun by hand
introduces a wide range of variability from person to person and from one inspection to
the next.
The System Management and Production Laboratory at the University of Alabama
in Huntsville (UAH) Research Institute was tasked by the Nondestructive Evaluation
(NDE) Branch (EH 13) at Marshall Space Flight Center (MSFC) to conduct research in
the methods of thermal excitation for shearography inspection. A computerized heating
system was developed for inspection of 0.61 m (24 in.) square panels. The Thermal
Excitation System for Shearography (TESS) provides radiant heating with continuous
digital measurement of the surface temperature profile to ensure repeatability. The TESS
device functions as an accessory to any electronic shearography device.
H. PRELIMINARY DESIGN
The original concept for the TESS system was a shrouded heating system with an
integral thermocouple array for surface temperature profile monitoring. This idea is
illustrated in Figure 1.
HEATSOURCE
o._ ..
_ s
-._.*
• "-'"..I.._. , ..,
SPECIMEN
Figure 1. Conceptual Design
HI. HEAT SOURCE SELECTION
Heat source types considered for utilization in the TESS apparatus include
convective, similar to the conventional heat gun, or radiant. The attributes of both are
showninTable 1. Theconvectivemodelisbaseduponmountingoneor morecommerciallyavailableheatgunsin thebackof theTESSshroud. Theradiantmodelisbaseduponmountingoneor morecommerciallyavailableheatlampsin thebackof theTESSshroud.Radiantheatingwasselectedasthebestmethodfor thisapplication.
Table1. HeatSourceTradeOffPROPERTY
easeof mountingCONVECTIVE
requiresdesignandfabricationof bracket
RADIANTscrewmount
noise loud silentheatinguniformity hotspotsmayrequire hot spotsmaybe lessened
bafflesor avery longshroud by areflectiveshroudinterior
geometryconsiderations compactandsymmetricallowancesmustbemadefor theangledshapeof theheatsunhandleandoutlet
loadonshroud air currentsonshroudsidesandmotorrotationmay
causevibrationandrequirestiffening
thermalloadonly
IV. TESS HARDWARE
The TESS materials list is included in Appendix A. 1. and a schematic of the device
is shown in Figure 2. The shroud is formed from aluminum sheet sheared and broken to
the drawing dimensions in Appendix A.2. Pop rivets fasten the shroud components for
assembly. A balsa wood frame with 24" internal dimensions is held together with wood
glue and wire nails and supports an aluminum screen. The screen serves as a diffuser and
has an array of 13 thermocouples interwoven as shown in Figure 3. A thermocouple
extension cable connects the thermocouple array to a screw terminal board. During
heating the thermocouple voltages on the screw terminal board are measured by a data
acquisition board in a personal computer.
V. TESS SOFTWARE
The TESS software controls the heating system data acquisition. This software
was written in Microsoft Visual Basic 3.0 Professional and executes in a Microsoft
Windows 3.1 or later environment. Temperatures for the 13 thermocouples on the TESS
shroud are measured throughout the heating process with user definable frequency and
duration. These temperatures are displayed graphically in real time and stored to a comma
delimited ASCII text file. Thus, temperature profiles over time may be compared from
one experiment to the next to ensure repeatability.

Figure2. TESS Hardware
Figure 3. Thermocouple Array Arrangement

VI. PROCEDURES
A. INSTALLATION AND SETUP
1. Install the data acquisition board and drivers as indicated in the manufacturer's manual
(National Instruments AT-MIO-6 Hardware Guide)'.
2. Connect the ribbon cable to the back of the data acquisition board in its expansion slot.
3. Remove the four screws fastening the top on the screw terminal board (STB)enclosure.
4. Connect the ribbon cable to the STB.
5. Replace the top to the STB enclosure and the four screws which hold it in place.
6. Connect the D-shell connectors on the thermocouple extension cable (TEC) to the
corresponding connectors on the STB enclosure.
7. Plug in the heat lamp power cords from the back of the TESS shroud to the power
strip.
8. Plug the power strip into a standard 120 VAC outlet and make sure the power strip isturned OFF.
9. Insert the TESS software disk and from the Windows File Manager execute the
setup, exe file.
B. STANDARD OPERATION
1. From the Windows Program Manager select the TESS program group.
2. From the TESS program group double click on the TESS icon.
3. When the About TESS window appears click on the OK button.
4. When the Welcome to TESS window appears enter the appropriate user identification.
This can be any combination of alphanumeric characters which may later be used to
identify the test operator. The user ID will be included in calibration and data files for
future reference. When the user ID has been entered, click on the OK button. Clicking on
the CANCEL button will discontinue execution of the TESS program.
It is recommended that computer power be turned offwhile inserting boards or making any electricalconnections in the TESS hardware.

5. When the Load TESS Calibration window appears, select the appropriate calibration
file then click on the OK button. An example calibration file named tess_cal, t×t is
provided. If a new calibration is desired, click on the CANCEL button.
6. When the TESS Calibration window appears it will display the calibration data from
the previously selected calibration file or remains blank if no file was loaded. Click on the
FINISHED button to use this calibration or follow the procedure outlined in section
VI.C.3. through VI.C.13 to recalibrate.
7. When the TESS main window appears select the appropriate scale units, Fahrenheit or
Celsius degrees, by clicking on either the F or C radio button.
8. Place the specimen to be inspected in the desired position in view of the shearography
camera.
9. Start up the shearography apparatus as for any other inspection.
10. Place the TESS shroud in front of the specimen with the diffuser screen frame against
the specimen surface to be inspected.
11. On the TESS main window select the desired duration and sampling period to be used
during heating the specimen.
12. Turn ON the heat lamp power strip and click on the ACQUIRE button. The TESS
software will begin data acquisition. The TESS main window will plot the thermocouple
array temperature values in real time. The TESS Profile window will display the
temperature distribution over the thermocouple positions as each data series is acquired.
This display is color indexed with increasing temperature from blue to yellow, orange, and
red. The relative position of each indicator corresponds to the thermocouple arrangement
as viewed from the diffuser screen toward the heat lamps.
13. When the selected duration has expired, the TESS software will beep an alarm. Turn
OFF the heat lamp power strip.
14. Remove the TESS shroud from the specimen and place it outside the shearographycamera field of view.
15. Conduct shearography inspections, acquiring reference images and monitoring
deformation as the specimen cools.
16. As prompted by the TESS software Save TESS Log window, enter the file name for
the temperature log to be saved, then click on the OK button.
17. If the TESS computer is connected to a printer the temperature profile plot on the
TESS main window may be printed by clicking on the PRINT button. The graph will be

sentto the defaultprinterselectedin the Windows Print Manager. A color printer is
suggested as it may be difficult to interpret which line on the graph corresponds to which
channel on a black and white printer.
18. When TESS operation is completed, click on the EXIT button on the TESS main
window to terminate program execution.
C. CALIBRATION
1. Click on the CALIBRATE button.
2. As requested, enter the number of calibration points desired. This is the number of
different temperatures which will be used for calibration. More calibration points result in
higher accuracy for subsequent measurements.
3. When the TESS Calibration window appears enter the number of samples per
calibration temperature. The TESS software will acquire this number of measurements at
each calibration temperature and average the results. A typical value is 20.
4. The TESS Calibration window features a spreadsheet grid in the center. Each row
corresponds to a different calibration temperature. The first column corresponds to the
standard or true temperature. The second column will contain the uncalibrated measured
value for the corresponding temperature. The third column will contain the calibrated
measured value for the corresponding temperature. Select the first column in the first
rOW.
5. Expose the center thermocouple in the TESS thermocouple array to the first standard
temperature such as the output from a heat gun.
6. Enter the value for the first standard temperature. A thermometer or hand held
thermocouple and readout may be used as a reference. Editing of the standard
temperature value input occurs in the text box labeled DATA which is just above the
spreadsheet grid and has green numbers on a black background. The spreadsheet grid is
updated as the data is entered.
7. Click on the SAMPLE button. As mentioned in VI.C.3. above, the TESS software will
automatically acquire the selected number of samples and average the results to determine
the uncalibrated measured value. This value will appear in the second column of the first
rOW.
8. Expose the center thermocouple in the TESS thermocouple array to the subsequent
standard temperatures and repeat steps VI.C.6. and VI.C.7. until measurements have been
acquired for all remaining calibration temperatures. For example allow the center
thermocouple to return from the heat gun temperature to room temperature, enter the

standardtemperaturevalueindicated by the reference hand held thermocouple readout,
and sample the uncalibrated measured value.
9. When all calibration temperature values have been sampled the first two columns of all
rows in the calibration spreadsheet grid should contain values. Click on the
CALCULATE button. The TESS software will calculate the appropriate calibration
coefficients and fill in the third column of the calibration spreadsheet grid with calibrated
measured values. The calibration algorithm is essentially a curve fit. The uncalibrated
measured values may be plotted against the standard temperature values as discrete
values. The calibration curve is a continuous function fit to these points by linear
regression. The calibrated measured values correspond to points on the calibration curve
at the standard temperature values. The closer these calibrated measured values are to the
standard temperature values the closer the calibration curve lies to the discrete points atthe measured uncalibrated values and the better the curve fit.
10. Click on the SAVE button.
11. When the Save Calibration window appears enter the file name and click on the OK
button.
12. When the TESS Calibration window reappears click on the FINISHED button to
return to the TESS main window.
13. The TESS sotlware is now fully calibrated and will not need to be recalibrated unless
the sottware is exited or closed, or if ambient conditions vary considerably. If the TESS
application is shut down or restarted the LOAD button on the TESS Calibration window
may be used to recall a saved calibration file and avoid recalibration.
VII. EXPERIMENTATION
A. HEAT FLUX MEASUREMENT
The heat flux during thermal stressing with a heat gun for a graphite-epoxy panel
was investigated by instrumenting the panel with thermocouples. The convective heat flux
into the specimen was measured by comparing the temperature of the heat gun, 399°C
(750°F), with the surface temperature of the panel, 104°C (220°F). The convective heat
transfer may be expressed as q/A = h(T_-T0) where q/A is the heat flux, h is the convective
heat transfer coefficient, To is the heat gun temperature, and T_ is the panel front surface
temperature. The convective heat flux is thus proportional to the temperature difference
of 295°C (563°F). The conductive heat flux through the specimen was measured by
comparing the temperatures of the panel front, 104°C (220°F), and back, 29°C (84°F).
The conductive heat transfer may be approximated as q/A = k(T_-T2)/t where k is the
conductive heat transfer coefficient, and T2 is the panel back surface temperature. The
conductive heat flux is thus proportional to the temperature difference of 75°C (167°F).

8
B. COOLING RATE
The same graphite-epoxy panel was heated again for five minutes with the TESS
apparatus. Cooling was then allowed in ambient conditions, 23°C (73°F), as would be
done during shearography inspection. A thermocouple on the front of the panel was used
to record the surface temperature during the cooling process. The panel temperature
dropped from 30°C (86°F) to 23°C (74°F) in 6 minutes, resulting in a cooling rate of
1.2°C (2°F) per minute.
C. DEMONSTRATION
To demonstrate the effectiveness of the TESS apparatus and methods, the system
was used for the inspection of a segment from a composite nose cone. This test article
was produced in the development of a composite nose cone for the space shuttle external
fuel tank. The segment represents a radial wedge of the nose cone including a rectangular
cutout with rounded corners. Heat was applied for a duration of 6 minutes, during which
the maximum surface temperature was 49°C (120°F). The shearogram shown in Figure 4.
was obtained during subsequent cooling with a horizontal image shearing distance of 2.5
cm (1 inch). The white rectangular region is the background showing through the cutout.
The uniform dark appearance of the specimen in the shearogram indicates that no
anomalies in the deformation pattern were produced by heating. This result demonstrates
that the TESS apparatus is not likely to produce false calls during shearography
inspection.
Figure 4. Shearography inspection of a composite nose cone wedge using TESS heating.
VII. SYSTEM INTEGRATION
Integration of the TESS methodology is outlined in the procedures of section VI.
The electronic shearography system in use at the MSFC NDE laboratory operates in a
DOS environment, and thus is not multi-tasking. If the system was updated from the

current80386seriesprocessorandprovidedmorememorythanthecurrent4 MB RAMand30MB harddrive,thenit wouldbepossibleto executetheshearographysot_wareinaDOSwindow in aWindowsenvironment.ThiswouldallowTESSoperationon theshearographysystem'scorePC. Operationwouldbeenhancedbya Windowsbasedsot_warepackageincorporatingbothshearographyandTESSfunctions.Currently,TESSoperationsareconductedonaPCseparatefrom theshearographysystem.While thisstandaloneoperationis notoptimumfor mobilityandeaseof use,it is quiteacceptableanddoesoffer theadvantageof TESSapplicationwith anyshearographysystemor otherNDE technologysuchasthermography.

10
APPENDIX

11
A.I. MATERIALS LIST
ITEM # DESCRIPTION QUANTITY
1 1
9
10
11
12
13
14
15
16
Aluminum Sheet, 6061-T6 (4' x 8' x 0.025")
Aluminum Pop Rivets
Balsa Wood (0.5" x 0.5" x 36")
Wire Nails (17 x 1)
Aluminum Window Screen (25" x 25")
Data Acquisition Board, 12 bit, 16 single end
channels [National Instmlments A T-MIO-6]Screw Terminal Board
[National Instruments SC- 2 0 7X]
Steel Enclosure (3 1/16" x 8 1/4" x 6 1/8")
[Radio Shack 2 70-2 74]
Barrier Strip, 8 Position, Dual Row
[Radio Shack 274-670]
Thermocouples (Type J) 36" x 36 AWG
[Omega 5 TC- TT-J- 3 6- 3 6]
D-Shell Thermocouple Connector Set (15 pin)
[Omega SMTC-15MF]
Thermocouple Pins (Iron)
[Omega SMTC-IR-P]
Thermocouple Sockets (Iron)
[Omega SMTC-IR-S]
Thermocouple Pins (Constantan)
[Omega SMTC-CO-P]
Thermocouple Sockets (Constantan)
[Omega SMTC-CO-S]
Multipair Thermocouple Extension Cable (Type J)
16 twisted pairs, 20 AWG x 12'
[Omega 16-JX-20-PP]
8
28
2
13
2
15
15
15
15
1
12
A.2. SOURCE CODE
A.2.1. TESS PROJECT FILE
Filename: tess. mak
ABT TESS. FRM
C :\NI DAQWIN\VB_EX\WDAQ_VB. BAS
TESS. BAS
C :\NIDAQWINkVB EXkNIDAQCNS. INC
C :\WINDOWS\ SYSTEM\ GRAPH .VBX
C :\WINDOWS \ SYSTEM\ GRID. VBX
C :\WINDOWS \ SYSTEM\ CMDIALOG .VBX
TES SMAIN. FRM
TESS CAL. FRMTESS--PRO. FRM
ProjWinSize=189,809,179,566
ProjWinShow=2I conForm=" Frm Tess"
Title="TESS"
ExeName="TESS. EXE"
Path=".. "
A.2.2. ABOUT TESS WINDOW
Filename: abt tess. frm
Begin Form Frm About
BorderStyle = 3 'Fixed Double
Caption = "About TESS"
ClientHeight = 3075
ClientLeft = 5220
ClientTop = 4305
ClientWidth = 4920
Height = 3480
Icon = ABT TESS.FRX:0000
Left = 5160
LinkTopic = "Form2"
ScaleHeight = 205ScaleMode = 3 'Pixel
ScaleWidth = 328
Top = 3960Width = 5040
Begin PictureBox Picturel
AutoSize = -i 'True
BorderStyle = 0 'None
Height = 480
Left = 960
Picture = ABT TESS.FRX:0302
ScaleHeight = 480ScaleWidth = 480
TabIndex = 8
Top = 600Width = 480
End
13
Begin CommandButtonBtn OKAboutCaption = "OK"
Height = 375Left = 1920
TabIndex = 6
Top = 2640
Width = 1215
End
Begin Label Label7
Alignment =
Caption =
Height =Left =
TabIndex =
Top =Width =
End
2 'Center
"Property of"255
0
7
2040
4935
Begin Label Label6
Alignment =
Caption =FontBold =
FontItalic =
FontName =
FontSize =
FontStrikethru =
FontUnderline =
Height =Left =
TabIndex =
Top =Width =
End
2 'Center
"Thermal Excitation System for Shearography"
-i 'True
0 'False
"MS Sans Serif"
9.75
0 'False
0 'False
255
0
5
1200
4935
Begin Label Label5
Alignment =
Caption =FontBold =
FontItalic =
FontName =
FontSize =
FontStrikethru =
FontUnderline =
Height =Left =
TabIndex =
Top =
Width =
End
2 'Center
"TESS"
-i 'True
0 'False
"Arial"
24
0 'False
0 'False
615
0
4
6O0
4935
Begin Label Label4
Alignment
Caption
HeightLeft
TabIndex
TopWidth
End
= 2 'Center
= "Research Institute"
= 255
= 0
= 3
= 360
= 4935
14
Begin Label Label3
Alignment
Caption
Height
Left
TabIndex
Top
Width
End
= 2 'Center
= "Version 1.0
= 255
= 0
= 2
= 1560
= 4935
i0 May 1996"
Begin Label Label2
Alignment =
Caption =
Height =
Left =
TabIndex =
Top =
Width =
End
2 'Center
"University of Alabama in Huntsville"
255
0
1
120
4935
Begin Label Labell
Alignment =
Caption =
Height =
Left =
TabIndex =
Top =
Width =
End
End
2 'Center
"NASA Marshall Space Flight Center"
255
0
0
2280
4935
Sub Btn OK About Click ()
UserS = Inpu_Box("Please enter user ID ...., Welcome to TESS",
"Lansing")
If Users = "" Then
End
Else
Frm About.Visible = False
Frm--Calib.Visible = True
Frm--Calib. CMD Save. Filename = "TESS CAL.TXT"
'Frm Calib. CMD Save. Index = 1
Frm Calib. CMD _oad. Filename = "C:\TESS\TESS CAL.TXT"
'Frm Calib. CMD Load. Filetitle = "TESS CAL.TXT"
NumC_l% = 4 --
Frm Calib. Grd Calib. ColWidth(0) = 500
Frm--Calib. Grd--Calib. ColWidth(1) = 1500
Frm--Calib. Grd--Calib. ColWidth(2) = 1500
Frm--Calib. Grd-Calib. ColWidth(3) = 1500
Frm--Calib. Grd--Calib. Rows= NumCal% + 1
Frm--Calib. Grd--Calib. Row= 0
Frm--Calib. Grd--Calib. Col= 3
Frm--Calib. Grd--Calib. Text= "Adjusted"
Frm--Calib. Grd--Calib. Col= 2
Frm--Calib. Grd--Calib. Text= "Measured"
Frm--Calib. Grd--Calib. Col= 1
Frm--Calib. Grd--Calib. Text= "Standard"
Frm--Calib. Grd--Calib. Col= 0
Frm--Calib. Grd--Calib. Text= ""
For--i% = 1 To--NumCal%

15
Frm Calib. Grd Calib. Row= i%
Frm--Calib. Grd--Calib. Text= Str$(i%)
Next i%
'Grd Calib. Refresh
Frm Calib. SetFocus
Frm--Calib. Btn LoadCalib.Value = True
End I f
End Sub
Sub Form Click ()Labell.Visible = True
Label2.Visible = True
Label3.Visible = True
Label4.Visible = True
Label5.Visible = True
Label6.Visible = True
Frm About. Picture = LoadPicture(none)End Sub
Sub Label5 DblClick ()Labe_l Visible = False
Label2 Visible = False
Label3 Visible = False
Label4 Visible = False
Label5 Visible = False
Label6 Visible = False
Frm About. Picture = LoadPicture("c:\do-142\tess\about.bmp")End Sub
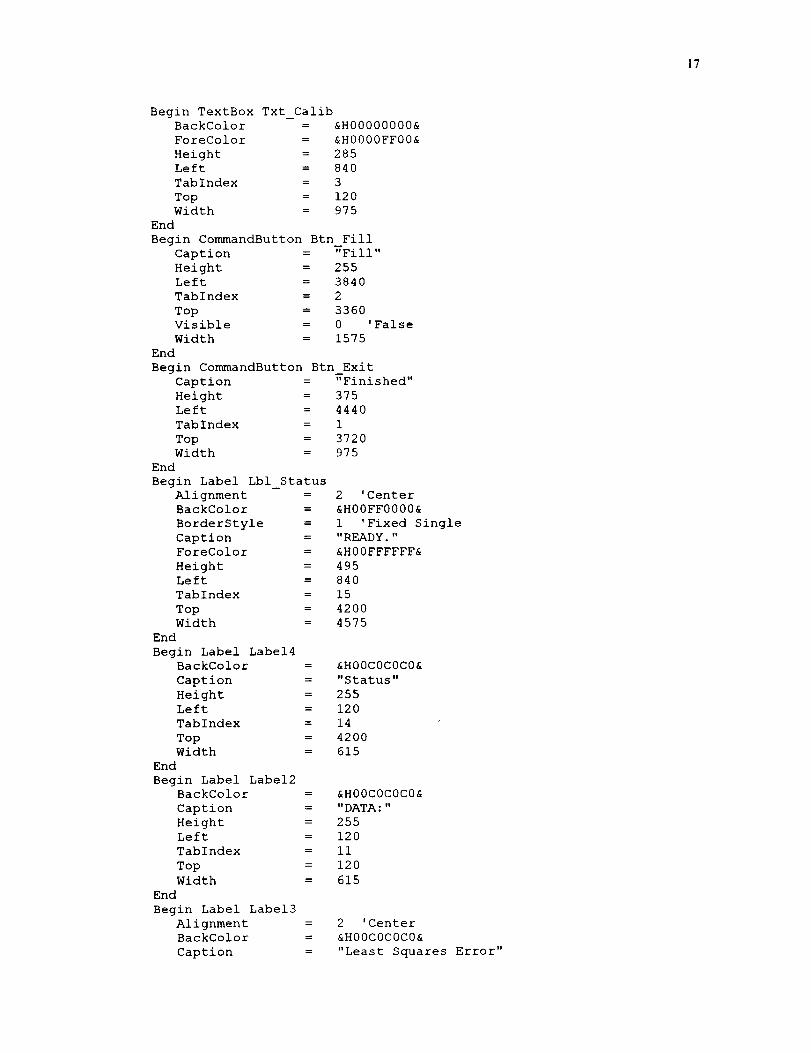
A.2.3. TESS CALIBRATION WINDOW
Filename: tess cal. txt
Begin Form Frm Calib
BackColor =
BorderStyle =
Caption =
ClientHeight =ClientLeft =
ClientTop =ClientWidth =
Height =Icon =
Left =
LinkTopic =
MaxButton =
ScaleHeight =
ScaleWidth =
Top =Width =
&H00COCOC0&
3 'Fixed Double
"TESS Calibration"
4785
4905
3195
5535
5190
TESS CAL.FRX:00004845--
"Forml"
0 'False
4785
5535
2850
5655
Begin CommonDialog CMD Load
DefaultExt = "txt"
DialogTitle =Filename =
Filter =
Left =
Top =End
"Load TESS Calibration"
"C:\TESS\TESS CAL.TXT"
"*. TXT"
3960
1920

16
Begin CommonDialogCMDSaveDefaultExt =
DialogTitle =
Filename =
Filter =
InitDir =
Left =
Top =End
Begin CommandButton Btn LoadCalib
Caption = _Load"
--"txt"
"Save TESS Calibration"
"C:\TESS\TESS CAL.TXT"
"*. txt"
"c: \tess"
3240
1920
Begin CommandButton Btn SaveCalib
Caption = "Save"
Height = 375
Left = 2280
TabIndex = 12
Top = 3720
Width = 975
End
Begin HScrollBar Scr_SampleSize
Height = 255Left = 1920
Max = i00
Min = 1
TabIndex = 8
Top = 3360Value = 20
Width = 1575
End
Begin CommandButton Btn Calib
Caption = _Calculate"
Height = 375
Left = 1200
TabIndex = 5
Top = 3720Width = 975
End
Begin CommandButton Btn_Sample
Caption = "Sample"
Height = 375Left = 120
TabIndex = 4
Top = 3720Width = 975
End
Begin Grid Grd CalibCols = 4
Height = 2775Left = 120
Rows = i0
TabIndex = 0
Top = 480
Width = 5295
End
Height = 375Left = 3360
TabIndex = 13
Top = 3720Width = 975
End
17
Begin TextBox Txt CalibBackColor = &H00000000&ForeColor = &H0000FF00&Height = 285Left = 840TabIndex = 3Top = 120Width = 975
EndBegin CommandButtonBtn Fill
Caption = "Fill"Height = 255Left = 3840TabIndex = 2Top = 3360Visible = 0Width = 1575
End
'False
Height = 375
Left = 4440
TabIndex = 1
Top = 3720
Width = 975
End
Begin Label Lbl Status
Alignment = 2 'CenterBackColor = &H00FF0000&
BorderStyle = 1 'Fixed Single
Caption = "READY."ForeColor = &H00FFFFFF&
Height = 495
Left = 840
TabIndex = 15
Top = 4200
Width = 4575
End
Begin Label Label4
BackColor = &H00COCOC0&
Caption = "Status"
Height = 255Left = 120
TabIndex = 14
Top = 4200Width = 615
End
Begin Label Label2BackColor = &H00COCOC0&
Caption = "DATA:"
Height = 255Left = 120
TabIndex = ii
Top = 120
Width = 615
End
Begin Label Label3
Alignment = 2 'CenterBackColor = &H00COCOC0&
Caption = "Least Squares Error"
Begin CommandButton Btn Exit
Caption = "Finished"

18
Height = 255Left = 2760TabIndex = I0Top = 120Width = 1695
EndBegin Label LbI_LSE
Alignment = 2 'CenterBackColor = &H00000000&ForeColor = &H000000FF&
Height = 255Left = 4560
TabIndex = 9
Top = 120Width = 855
End
Begin Label Lbl_SampleSize
Alignment
BorderStyle
Caption
HeightLeft
TabIndex
TopWidth
End
Begin Label LabellBackColor
Caption
HeightLeft
TabIndex
TopWidth
End
End
= 2
= 1
= "20"
= 255
= 1320
= 7
= 3360
= 495
'Center
'Fixed Single
= &H00COCOC0&
= "Sample Size"
= 255
= 120
= 6
= 3360
= 1095
Dim z! (3)
Sub Btn Calib Click ()
Lbl--Status. Caption= "Calculating Calibration Coefficients..."sun_! = 0!
SumY! = 0!
SumX2! = 0!
SumXY! = 0!
For i% = 1 To NumCal%
Grd Calib. Row= i%
Grd--Calib. Col= 2
x! = Val(Grd Calib. Text)
Grd Calib. Col= 1
y! = Val(Grd Calib.Text)SumX! = SumX! + x!
SumY! = SumY! + y!
SumXY! = SumXY! + (x! * y!)
SumX2! = SumX2! + (x! * x!)
Next i%
mXY! = (NumCal% * SumXY!) - (SumX! * SumY!)
mXY! = mXY! / ((NumCal% * SumX2!) - (SumX! * SumX!))
bXY! = (SumY! - (mXY! * SumX!)) / NumCal%
ff! = 0!

19
For i% = 1 To NumCal%
Grd Calib. Row= i%
Grd--Calib. Col= 2
x! = Val(Grd Calib. Text)
Grd Calib. Co_ = 1
y! = Val(Grd Calib. Text)Grd Calib. Co[= 3
y0! -= bXY! + (mXY! * x!)
Grd Calib. Text= y0!
ff!--= ff! + ((y! - y0!) ^ 2)
Next i%
Lbl LSE.Caption = Left$(Str$(Sqr(ff!)), 6)
Lbl--Status.Caption = "Calibration Coefficients Calculated.
MsgBox "m =" + Str$(mXY!) + ", b =" + Str$(bXY!)
End Sub
READY. "
Sub Btn Exit Click ()
'Me[s$ =--"End Calibration and Return to TESS?"
'Query% = MsgBox(Mess$, 4, "Confirm Completed Calibration")
'If Query% = 6 Then
Frm Calib.Visible = False
Frm Tess.Visible = True
Frm Tess. SetFocus
'End If--
End Sub
Sub Btn Fill Click (}
For--i% =--i To 2
Grd Calib. Col= i%
For--j% = 1 To NumCal%
Grd Calib. Row= j%Grd--Calib. Text= Str$(Int(100 * Rnd))
Next j%--
Next i%
End Sub
Sub Btn LoadCalib Click ()
Lbl--Status.Caption = "Loading Calibration Log..."
CMD--Load. DialogTitle = "Load TESS Calibration"
CMD--Load. Filename = ""
CMD--Load. Filter= "*.txtl*.txt"
CMD--Load.Action = 1
If _MD Load. Filename <> ....Then
Open CMD Load. Filename For Input As #2
Input #2_ Dummy$
'MsgBox Dummy$, 0, "Header"
Input #2, CalibDate$
'MsgBox CalibDate$, 0, "CalibDate"
Input #2, OldUser$
'MsgBox OldUser$, 0, "OldUser"
Input #2, Dummy$
Input #2, bXY!, mXY!
'MsgBox Str$(bXY!) + " +" + Str$(mXY!) + " * X", 0, "Least Squares"
Input #2, Dummy$
Input #2, NumCal%, SSize%, TScale$
If TScale$ = "F" Then
Frm Tess. Rdo TScale(1).Value = True
Else
Frm Tess. Rdo TScale(0).Value = True
End If
2O
'MsgBoxStr$(NumCal%), 0, "NumCal"'MsgBoxStr$(SSize%), 0, "SampleSize"
Scr_SampleSize.Value = SSize%Grd Calib. Rows= NumCal%+ 1Input #2, Dummy$Input #2, Dummy$For i% = 1 To NumCal%
Grd Calib. Row= i%Input #2, z!(1), z!(2), z!(3)For j% = 1 To 3
Grd Calib. Col= 9%Grd--Calib.Text= Str$(z!(j%))
Next j%Next i%Input #2, Dummy$Input #2, Dummy$Lbl LSE.Caption = Dummy$Clo_e #2
Lbl Status.Caption = "Calibration Log (" + CalibDate$ + ",
CalibTime$ + ") Loaded. READY."
Else
Lbl Status. Caption = "Calibration Log NOT Loaded. READY."
End If
End Sub
,, +
Sub Btn_Sample_Click ()'Read Channel #9
VSTemp# = 0#
For j% = 1 To Scr_SampleSize.Valueer% = AI VRead(DevNum%, 9, gain%, vv#)
If er% <> 0 Then
DAQmess er%End If
VSTemp# = VSTemp# + vv#
Next j%
VTemp# = VSTemp# / CDbl(Scr_SampleSize.Value)
TTemp# = Tcon#(VTemp#)If Frm Tess.Rdo TScale(1).Value = True Then TTemp# = 1.8 * TTemp# +
32
Grd Calib. Col= 2
Grd--Calib.Text = Str$(Int(.5 + TTemp#))End Sub--
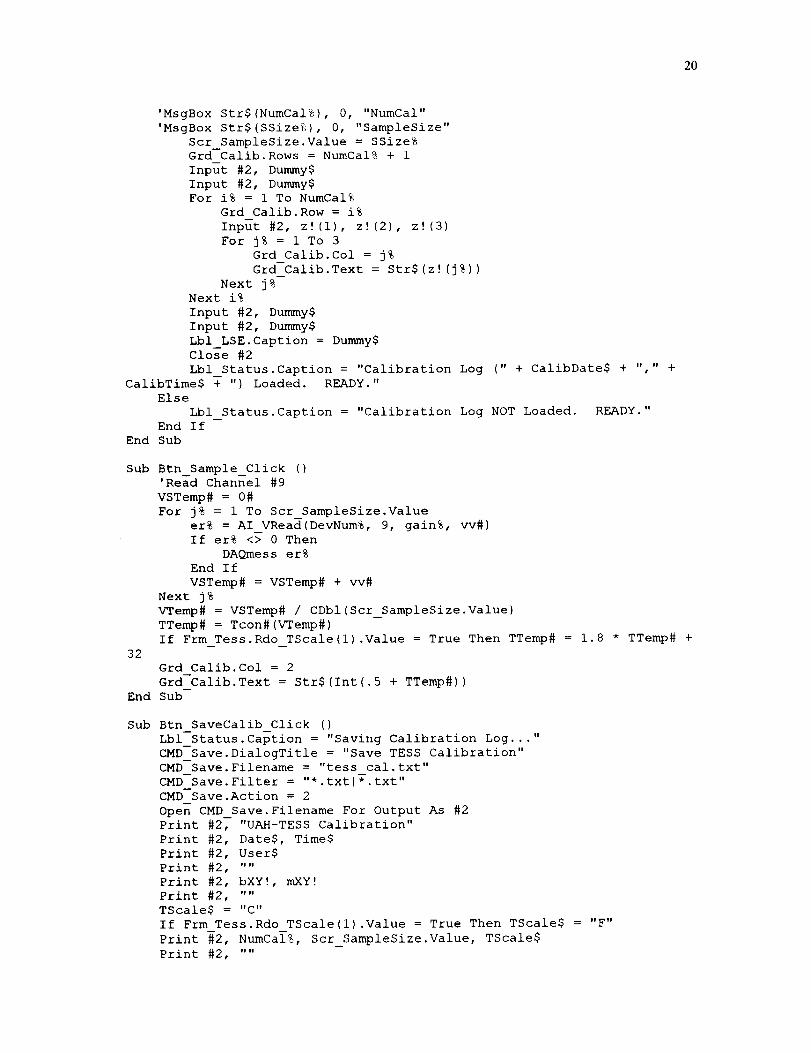
Sub Btn SaveCalib Click ()
Lbl--Status. Caption= "Saving Calibration Log..."
CMD--Save. DialogTitle = "Save TESS Calibration"
CMD--Save. Filename = "tess cal.txt"
CMD--Save. Filter= "*.txt1_.txt ''
CMD Save.Action = 2
Ope_ CMD Save. Filename For Output As #2
Print #2_ "UAH-TESS Calibration"
Print #2, DateS, Times
Print #2, Users
Print #2, ""
Print #2, bXY!, mXY!
Print #2, ....
TScale$ = "C"
If Frm Tess. Rdo TScale(1).Value = True Then TScale$ = "F"
Print #2, NumCa_%, Scr_SampleSize.Value, TScale$
Print #2, ....
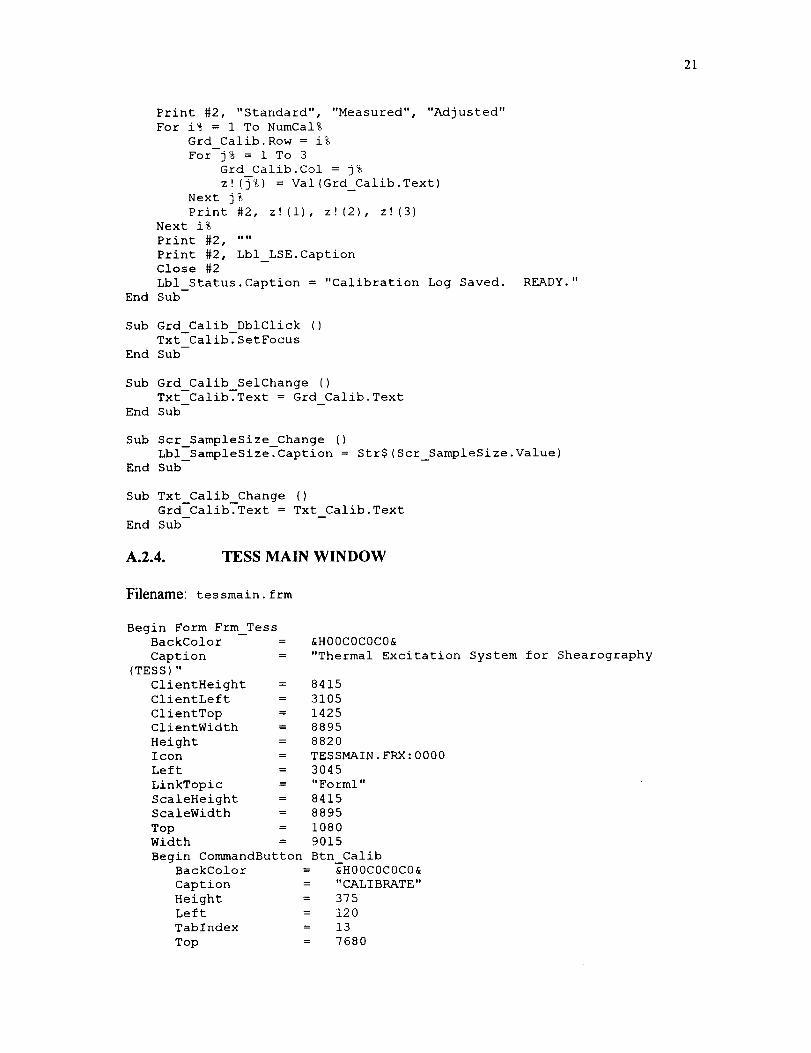
21
Print #2, "Standard", "Measured", "Adjusted"For i% = 1 To NumCal%
Grd Calib. Row= i%For--j% = 1 To 3
Grd Calib. Col= j%
z! (_%) = Val(Grd Calib. Text)
Next j%
Print #2, z! (i), z! (2), z! (3)
Next i%
Print #2, ....
Print #2, Lbl LSE.CaptionClose #2
= Callbration Log Saved.Lbl Status. Caption " '
End Sub
READY. "
Sub Grd Calib DblClick ()
Txt--Calib?SetFocus
End Sub
Sub Grd Calib_SelChange ()Txt Calib. Text= Grd Calib.Text
End Sub
Sub Scr_SampleSize_Change ()
Lbl_SampleSize. Caption= Str$(Scr_SampleSize.Value)End Sub
Sub Txt_Calib_Change ()Grd Calib. Text= Txt Calib. Text
End Sub
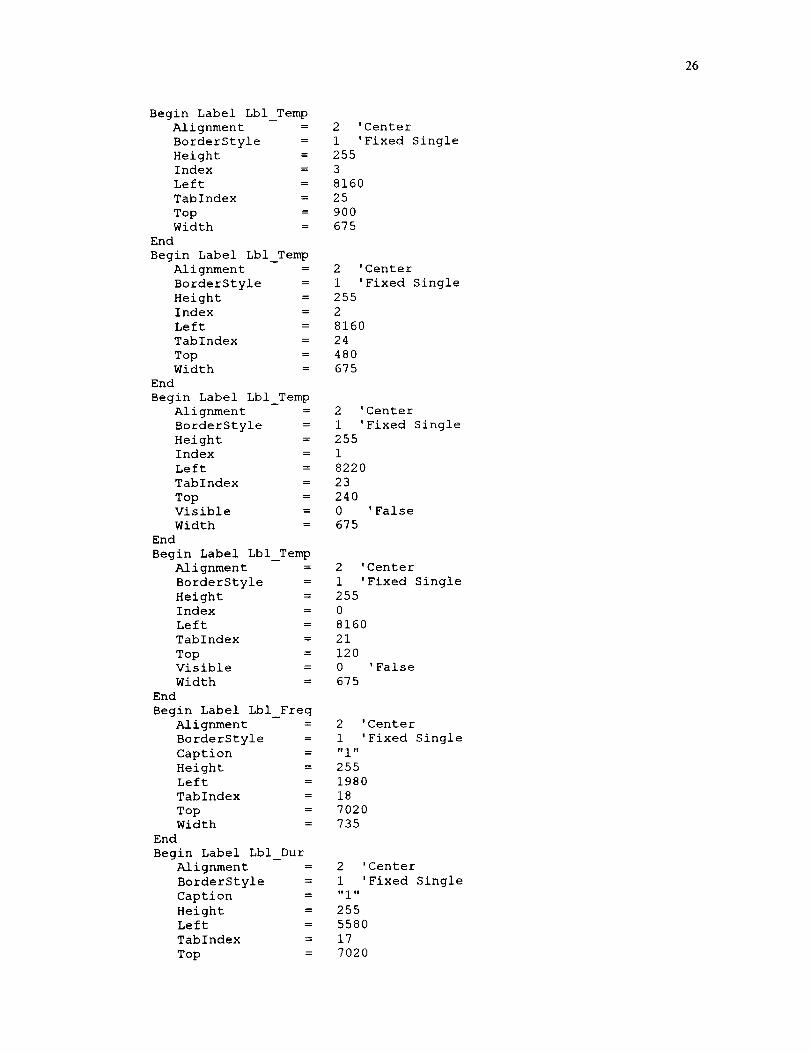
A.2.4. TESS MAIN WINDOW
Filename: tessmain, frm
Begin Form Frm TessBackColor =
Caption =
(TESS)"
ClientHeight = 8415
ClientLeft = 3105
ClientTop = 1425ClientWidth = 8895
Height = 8820Icon = TESSMAIN.FRX:0000
Left = 3045
LinkTopic = "Forml"
ScaleHeight = 8415
ScaleWidth = 8895
Top = 1080Width = 9015
&H00COCOC0&
"Thermal Excitation System for Shearography
Begin CommandButton Btn CalibBackColor = _H00COCOC0&
Caption = "CALIBRATE"
Height = 375
Left = 120
TabIndex = 13
Top = 7680

22
Width = 1455EndBegin OptionButton Rdo TScale
BackColorCaptionEnabledForeColorHeightIndexLeftTabIndexTopWidth
End
w
= &H00COCOC0&
trEe,
= 0 'False
= &H00000000&
= 255
= 1
= 7440
= 12
= 7320
= 495
Begin OptionButton Rdo TScaleBackColor
Caption
ForeColor
HeightIndex
Left
TabIndex
TopValue
Width
End
D
= &H00COCOC0&
ImCff
= &H00000000&
= 255
= 0
= 8160
= 20
= 7320
= -i 'True
= 495
Begin CommandButton Btn GraPrintBackColor = &H00COCOC0&
Caption = "PRINT GRAPH"
Height = 375Left = 5520
TabIndex = 19
Top = 7680Width = 1455
End
Begin HScrollBar Scr_Freq
Height = 255
LargeChange = 5Left = 60
Max = 60
Min = 1
TabIndex = 9
Top = 7320Value = 1
Width = 3495
End
Begin HScrollBar Scr Dur
Height = 255
LargeChange = 5Left = 3660
Max = 30
Min = 1
TabIndex = 7
Top = 7320Value = 1
Width = 3495
End
Begin CommandButton Btn ExitBackColor = _H00COCOC0&
Caption = "EXIT"

23
Height = 375Left = 7320
TabIndex = 3
Top = 7680Width = 1455
End
Begin CommandButton Btn PauseBackColor = &H00COCOC0&
Caption = "PAUSE"
Enabled = 0 'False
Height = 375Left = 3720
TabIndex = 2
Top = 7680Width = 1455
End
Begin CommandButton Btn_AcquireBackColor
Caption
HeightLeft
TabIndex
Top
Width
End
Begin GRAPH Gra_TempAsciiFFamily =
AsciiFSize
AsciiFStyleBottomTitle
DrawMode
GraphStyle
GraphType
GridStyle
Height
LabelEveryLeft
LeftTitle
NumPoints
PrintStyleRandomData
TabIndex
ThickLines
TickEvery
Top
Width
YAxisMax
YAxisStyle
YAxisTicks
End
Begin Label Labell
AlignmentBackColor
Caption
HeightLeft
TabIndex
Top
Width
End
= &H00COCOC0&
= "ACQUIRE"
= 375
= 1920
= 1
= 7680
= 1455
I, 0 "
= "100~150~100~100"
I! 0 "
= "pts"
= 3 'Blit
= 4
= 6 'Line
= 3 'Horizontal and Vertical
= 6855
= i0
= 60
= "T"
= I00
= 3 'Color with Border
= 0 'Off
= 0
= 0 'Off
= i0
= 60
= 8055
= 50
= 2 'User-defined
= I0
= 2 'Center
= &H00COCOC0&
= "SCALE UNITS"
= 255
= 7320
= 34
= 7080
= 1455

24
Begin Label Lbl_TempAlignment =BorderStyle =Height =
Index =
Left =
TabIndex =
Top =
Width =
End
Begin Label Lbl_Temp
Alignment =
BorderStyle =
Height =
Index =
Left =
TabIndex =
Top =
Width =
End
Begin Label Lbl_Temp
Alignment =
BorderStyle =
Height =
Index =
Left =
TabIndex =
Top =Width =
End
Begin Label Lbl_Temp
Alignment =
BorderStyle =
Height =Index =
Left =
TabIndex =
Top =Width =
End
Begin Label Lbl_Temp
Alignment =
BorderStyle =
Height =Index =
Left =
TabIndex =
Top =Width =
End
Begin Label Lbl_Temp
Alignment =
BorderStyle =
Height =Index =
Left =
TabIndex =
Top =Width =
End
2 'Center
1 'Fixed Single
255
15
8160
33
6165
675
2 'Center
1 'Fixed Single
255
14
8145
14
5730
675
2 'Center
1 'Fixed Single
255
13
8160
4
5295
675
2 'Center
1 'Fixed Single
255
12
8160
5
4860
675
2 'Center
1 'Fixed Single
255
Ii
8160
22
4425
675
2 'Center
1 'Fixed Single
255
i0
8145
32
4005
675
25
Begin Label Lbl_TempAlignment = 2 'Center
BorderStyle = 1 'Fixed Single
Height = 255Index = 9
Left = 8160
TabIndex = 31
Top = 3555Width = 675
End
Begin Label Lbl_Temp
Alignment = 2 'Center
BorderStyle = 1 'Fixed Single
Height = 255Index = 8
Left = 8160
TabIndex = 30
Top = 3105Width = 675
End
Begin Label Lbl_Temp
Alignment = 2 'Center
BorderStyle = 1 'Fixed Single
Height = 255
Index = 7
Left = 8160
TabIndex = 29
Top = 2700Width = 675
End
Begin Label Lbl_Temp
Alignment = 2 'Center
BorderStyle = 1 'Fixed Single
Height = 255Index = 6
Left = 8160
TabIndex = 28
Top = 2250Width = 675
End
Begin Label Lbl_Temp
Alignment = 2 'Center
BorderStyle = 1 'Fixed Single
Height = 255Index = 5
Left = 8160
TabIndex = 27
Top = 1800Width = 675
End
Begin Label Lbl_Temp
Alignment = 2 'Center
BorderStyle = 1 'Fixed Single
Height = 255Index = 4
Left = 8145
TabIndex = 26
Top = 1350Width = 675
End
26
Begin Label Lbl_TempAlignment =BorderStyle =Height =Index =Left =
TabIndex =
Top =
Width =
End
Begin Label Lbl_Temp
Alignment =
BorderStyle =
Height =Index =
Left =
TabIndex =
Top =Width =
End
Begin Label Lbl_Temp
Alignment =
BorderStyle =
Height =
Index =
Left =
TabIndex =
Top =Visible =
Width =
End
Begin Label Lbl_Temp
Alignment =
BorderStyle =
Height =
Index =
Left =
TabIndex =
Top =Visible =
Width =
End
Begin Label Lbl_Freq
Alignment =
BorderStyle =
Caption =
Height =Left =
TabIndex =
Top =Width =
End
Begin Label Lbl_Dur
Alignment =
BorderStyle =
Caption =
Height =
Left =
TabIndex =
Top =
2 'Center
1 'Fixed Single
255
3
8160
25
9OO
675
2 'Center
1 'Fixed Single
255
2
8160
24
48O
675
2 'Center
1 'Fixed Single255
1
8220
23
240
0 'False
675
2 'Center
1 'Fixed Single255
0
8160
21
120
0 'False
675
2 'Center
1 'Fixed Single
"19'
255
1980
18
7020
735
2 'Center
1 'Fixed Single'1 1 '!
255
5580
17
7020
27
Width =EndBegin Label Lbl Status
Alignment =BackColor =BorderStyle =Caption =ForeColor =Height =Left =TabIndex =Top =Width =
EndBegin Label Label8
BackColor =Caption =Height =Left =TabIndex =Top =Width =
EndBegin Label Label5
BackColor =Caption =Height =Left =TabIndex =
Top =Width =
End
Begin Label Label4BackColor =
Caption =
Height =Left =
TabIndex =
Top =Width =
End
Begin Label Label3BackColor =
Caption =
Height =Left =
TabIndex =
Top =
Width =
End
Begin Label Label2BackColor =
Caption =
Height =Left =
Tablndex =
Top =Width =
End
End
735
2 'Center
&H00FF0000&
1 'Fixed Single"READY."
&H00FFFFFF&
255
9O0
16
8100
7935
&H00COCOC0&
"STATUS"
195
6O
15
8100
750
&H00COCOC0&
"minutes"
255
6360
Ii
7020
735
&H00COCOC0&
"sec/pt"
255
2820
I0
7020
735
&H00COCOC0&
"SAMPLE PERIOD"
255
60
8
7020
1815
&H00COCOC0&
"SAMPLE DURATION"
255
3660
6
7020
1875

28
Dim z!(3)
Sub Btn_Acquire_Click ()'Initialize Controls
Btn Pause. Enabled = True
Frm--Profile.Visible = True
Frm--Tess. SetFocus
'LastChann% = NumChann% - 1
Lbl Status.Caption = "Initializing..."
Lbl Status.Refresh
Btn_Acquire. Enabled= FalseBtn GraPrint. Enabled= False
Rdo--TScale(0).Enabled = False
Rdo--TScale(1).Enabled = False
Scr Dur. Enabled= False
Scr_Freq. Enabled= False
Gra_Temp. GraphTitle = ""
Gra_Temp.NumSets = 14
Gra_Temp.AutoInc = 1 'TrueFor i% = 2 To 15
Gra_Temp. LegendText = Str$(i%)Next i%
Gra_Temp.AutoInc = False
Gra_Temp. DrawMode = 3
'DEAD 8
NumPts% = 1 + Int(Scr Dur.Value * 60 / Scr_Freq. Value)
Gra_Temp.NumPoints = NumPts%
'Clear Graph DataFor i% = 2 To 15
If i% <> 8 Then 'DEAD 8
'Chann%(i%) = i%
Gra_Temp. ThisSet = i% - 1
For j% = 1 To NumPts%
Gra_Temp. ThisPoint = j%
Gra_Temp. GraphData = 0
Next j%
End If
Next i%
Gra_Temp. TickEvery = Int(NumPts% / I0)
Gra_Temp. LabelEvery = Int(NumPts% / 10)If Rdo TScale(0) = True Then
Gra Temp. Y._isMax = 100
Gra Temp. LeftTitle = "C"
TScale$ = "C"
Else
Gra_Temp. YAxisMax = 200
Gra_Temp. LeftTitle = "F"TScale$ = "F"
End If
'Initialize Output Log
Open LogFileName$ For Output As #i
Print #I, "UAH-TESS Data Log"
Print #i, DateS, TimeS, TScale$
Print #i, Users
Print #i, ....
Print #i, "Time";For i% = 2 To 15
If i% <> 8 Then Print #i, ","; i%; 'DEAD 8
Next i%
Print #i, ....
'Begin DAQ Loop

29
Gra_Temp.DrawMode= 3
Gra Temp. RefreshSta_tTime$ = TimeS
OldTime# = Timer
FirstTime# = OldTime#
NewTime# = 0#
For i% = 1 To NumPts%
Lbl Status.Caption = "Acquiring (" + Str$(i%) + "/" +
Str$(NumPts%) + ") ..."
If PauseFlag% = True Theni% = i% - 1
Else
min% = i00
max% = -I00
While (NewTime# < (CDbl(Int(OldTime#) + Scr_Freq. Value)))
NewTime# = Timer 'Wait Loop
Wend
For k% = 2 To 15 'Step Through Channels
If k% <> 8 Then 'DEAD 8
VoltSum#(k%) = 0#
For j% = 1 To NumAve% 'Average Several
Readings
Temp#(k%) + 32
er% = AI VRead(DevNum%, k%, gain%, v#) 'DAQIf er% <5 0 Then
DAQmess er%
End If
VoltSum#(k%) = VoltSum#(k%) + v#
Next j%
Volts#(k%) = VoltSum#(k%) / CDbl(NumAve%)
Temp#(k%) = bXY! + mXY! * Tcon#(Volts#(k%))
If Rdo TScale(1).Value = True Then Temp#(k%) = 1.8 *
End If
Next k%
Gra_Temp. ThisPoint = i%For k% = 2 To 15
If k% <> 8 Then 'DEAD 8
Gra_Temp.ThisSet = k% - 1
Gra_Temp. GraphData = Temp#(k%)CurVal% = Int(Temp#(k%) + .5)
Lbl_Temp(k%).Caption = Str$(CurVal%)
Frm Profile. Lbl Profile(k% - 2).Caption =
Str$(CurVal%)
If CurVal% > max% Then max% = CurVal%
If CurVal% < min% Then min% = CurVal%
End If
Next k%
Print #I, ....
Gra_Temp. DrawMode = 3OldTime# = NewTime#
If i% = 1 Then FirstTime# = OldTime#
Print #I, ((NewTime# - FirstTime#)); ",";For k% = 2 To 15
If k% <> 8 Then Print #I, Temp#(k%); ",";
Next k%
Print ""
delta% = max% - min%
For ii% = 0 To 13
Select Case (Int(3 *
(Val(Frm Profile. Lbl Profile(ii%).Caption) - min%) / delta% + .5))
'DEAD 8
3O
0, 255)
RGB(255, 255, 0)
RGB(255, 128, 0)
RGB(255, 0, 0)
Case 0
Frm Profile. Lbl Profile(ii%).BackColor = RGB(0,
Case 1
Frm Profile. Lbl Profile(ii%).BackColor =
Case 2
Frm Profile. Lbl Profile(ii%).BackColor =
Case 3
Frm Profile. Lbl Profile(ii%).BackColor =
Case 4
Frm Profile. Lbl Profile(ii%).BackColor =
RGB(255, 255, 255)
End Select
Next ii%
Frm Tess.Refresh
Frm--Profile. Refresh
End If
DoEvents
Next i%
'End DAQ Loop
Close #I
Gra_Temp. GraphTitle = DateS + "
Gra_Temp. DrawMode = 3
Lbl Status. Caption = "Data Acquisition Complete. READY."
Rdo--TScale(0).Enabled = True
Rdo--TScale(1).Enabled = True
Btn_Acquire. Enabled= True
Btn GraPrint. Enabled= True
Scr--Dur. Enabled= True
Scr_Freq. Enabled= True
" + StartTime$ + " to " + TimeS
Beep
Frm Calib. CMD Save. DialogTitle = "Save TESS Data Log"
Frm--Calib. CMD--Save. Filename = LogFileName$
Frm--Calib. CMD--Save. Filter= "*.csvt*.csv"
Frm--Calib. CMD--Save. DefaultExt = "csv"
Frm--Calib. CMD--Save.Action = 2 'cancel crashes
'MsgBox "LOG:" + LogFileName$ + " FORM:" +
Frm Calib. CMD Save. Filename, 0, "FileName Difference?"
--If ((Len(Frm Calib. CMD Save. Filename) > 0) And
(Frm_Calib. CMD_Save. Filename <> LogFileName$)) Then
FileCopy LogFileName$, Frm_Calib. CMD_Save. Filename
End If
End Sub
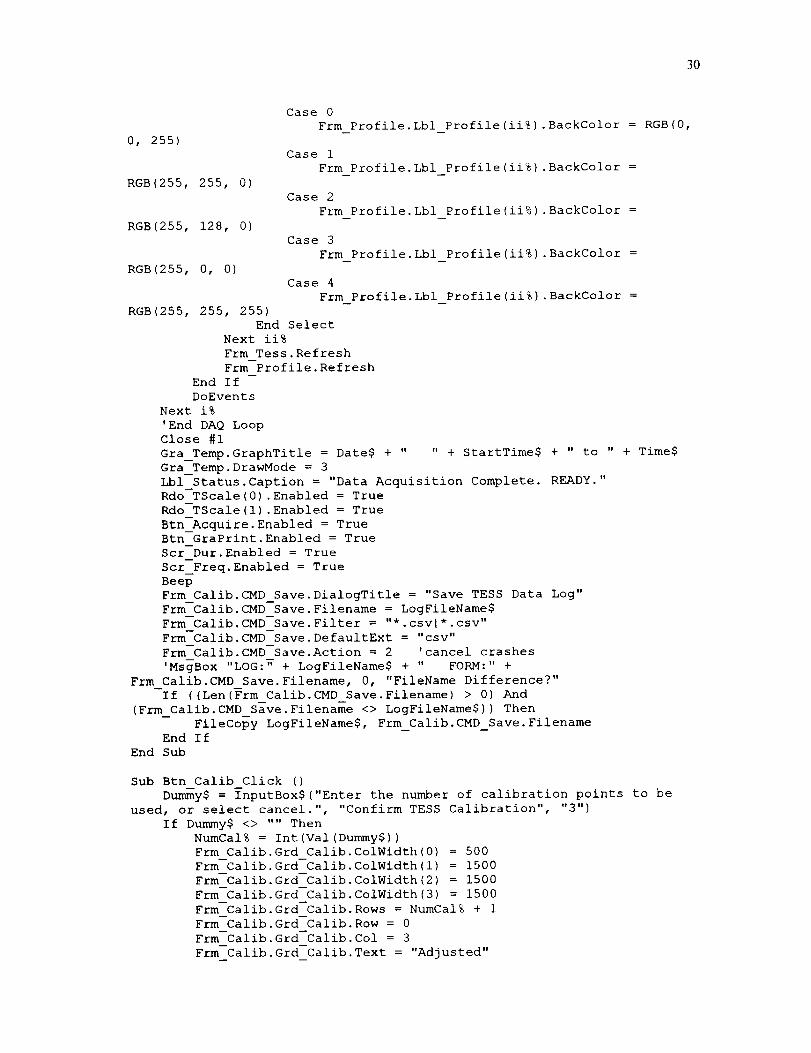
Sub Btn Calib Click ()
Dummy$ = [nputBox$("Enter the number of calibration points to be
used, or select cancel.", "Confirm TESS Calibration", "3")
If Dummy$ <> .... Then
NumCal% = Int(Val(Dummy$))
Frm Calib. Grd Calib. ColWidth(0) = 500
Frm--Calib. Grd--Calib. ColWidth(1) = 1500
Frm--Calib. Grd--Calib. ColWidth(2) = 1500
Frm-Calib.Grd--Calib. ColWidth(3) = 1500
Frm--Calib. Grd--Calib. Rows= NumCal% + 1
Frm--Calib. Grd--Calib. Row= 0
Frm--Calib. Grd--Calib. Col= 3
Frm--Calib. Grd--Calib.Text = "Adjusted"

3!
Frm Calib. Grd Calib. Col= 2Frm--Calib.Grd--Calib.Text= "Measured"Frm--Calib.Grd--Calib.Col= 1Frm--Calib.Grd--Calib.Text = "Standard"Frm--Calib.Grd--Calib.Col= 0Frm--Calib.Grd--Calib.Text= ""For--i% = 1 To--NumCal%
Frm Calib. Grd Calib. Row= i%Frm Calib. Grd Calib. Text= Str$(i%)
Next i%
'Grd Calib. Refresh
Frm _alib.Visible = True
Frm--Calib. SetFocus
End If
End Sub
Sub Btn Exit Click ()
Clo_e --
er% = DAQ_Clear(DevNum%)
If (er% <> 0) And (er% <> -74) Then
DAQmess er%
End If
End
End Sub
Sub Btn GraPrint Click ()
GraZTemp. DrawMode = 5
Gra_Temp. DrawMode = 3
End Sub
Sub Btn Pause Click ()
If PauseF[ag% = False Then
Btn Pause. Caption = "RESUME"
Pau_eFlag% = True
ElseIf PauseFlag% = True Then
Btn Pause. Caption = "PAUSE"
PauseFlag% = False
End If
End Sub
Sub Form Load ()
PauseFlag% = False
'bXY! = 0!
'mXY! = i!
'For i% = 27 To -118 Step -i
' DAQmess i%
'Next i%
Lbl_Temp(8).Visible = False
End Sub
Sub Gra_Temp_DblClick ()
Gra_Temp. Refresh
End Sub
Sub Scr_Dur_Change ()
Lbl_Dur. Caption= Str$(Scr_Dur.Value)
Gra_Temp. NumPoints = Int(Scr_Dur.Value * Scr_Freq. Value)
End Sub
Sub Scr_Freq_Change ()

32
Lbl_Freq. Caption= Str$(Scr_Freq. Value)End Sub
A.2.5. TESS PROFILE WINDOW
Filename: tess_pro, frm
Begin Form Frm_ProfileBackColor =
BorderStyle =
Caption =
ClientHeight =
ClientLeft =
ClientTop =
ClientWidth =
Height =Left =
LinkTopic =
ScaleHeight =ScaleWidth =
Top =
Width =
&H00COCOC0&
3 'Fixed Double
"TESS Profile"
2535
12135
1425
2535
2940
12075
"Forml"
2535
2535
1080
2655
Begin Label Lbl_ProfileBackColor = &H00000000&
BorderStyle = 1 'Fixed Single
ForeColor = &H00000000&
Height = 375
Index = 13
Left = 2040
TabIndex = 1
Top = 2040Width = 375
End
Begin Label Lbl_ProfileBackColor = &H00000000&
BorderStyle = 1 'Fixed Single
ForeColor = &H00000000&
Height = 375Index = 1
Left = 1080
TabIndex = 2
Top = 120
Width = 375
End
Begin Label Lbl_ProfileBackColor = &H00000000&
BorderStyle = 1 'Fixed Single
ForeColor = &H00000000&
Height = 375Index = 12
Left = 1080
TabIndex = 3
Top = 2040
Width = 375
End
Begin Label Lbl_ProfileBackColor = &H00000000&
BorderStyle = 1 'Fixed Single

33
ForeColorHeightIndexLeftTabIndexTopWidth
End
= &H00000000&= 375= ii= 120= 4= 2040= 375
Begin Label Lbl ProfileBackColor = &H00000000&
BorderStyle = 1 'Fixed SingleForeColor = &H00000000&
Height = 375
Index = 10
Left = 1560
TabIndex = 13
Top = 1560
Width = 375
End
Begin Label Lbl Profile
BackColor = &H00000000&
BorderStyle = 1 'Fixed SingleForeColor = &H00000000&
Height = 375Index = 9
Left = 600
TabIndex = 12
Top = 1560Width = 375
End
Begin Label Lbl ProfileBackColor = &H00000000&
BorderStyle = 1 'Fixed SingleForeColor = &H00000000&
Height = 375
Index = 8
Left = 2040
TabIndex = ii
Top = 1080Width = 375
End
Begin Label Lbl ProfileBackColor = &H00000000&
BorderStyle = 1 'Fixed SingleForeColor = &H00000000&
Height = 375
Index = 7
Left = 1080
TabIndex = i0
Top = 1080Width = 375
End
Begin Label Lbl ProfileBackColor = &H00000000&
BorderStyle = 1 'Fixed SingleForeColor = &H00000000&
Height = 375Index = 6
Left = 600
TabIndex = 9
34
Top = 1080Visible = 0 'FalseWidth = 375
EndBegin Label Lbl Profile
BackColor = &H00000000&
BorderStyle = 1 'Fixed SingleForeColor = &H00000000&
Height = 375
Index = 5
Left = 120
TabIndex = 8
Top = 1080Width = 375
End
Begin Label Lbl Profile
BackColor = &H00000000&
BorderStyle = 1 'Fixed SingleForeColor = &H00000000&
Height = 375
Index = 4
Left = 1560
TabIndex = 7
Top = 600Width = 375
End
Begin Label Lbl ProfileBackColor = &H00000000&
BorderStyle = 1 'Fixed Single
ForeColor = &H00000000&
Height = 375Index = 3
Left = 600
TabIndex = 6
Top = 600
Width = 375
End
Begin Label Lbl ProfileBackColor = &H00000000&
BorderStyle = 1 'Fixed Single
ForeColor = &H00000000&
Height = 375Index = 2
Left = 2040
TabIndex = 5
Top = 120
Width = 375
End
Begin Label Lbl Profile
BackColor = &H00000000&
BorderStyle = 1 'Fixed SingleForeColor = &H00000000&
Height = 375
Index = 0
Left = 120
TabIndex = 0
Top = 120Width = 375
End
End

35
A.3. MECHANICAL DRAWINGS

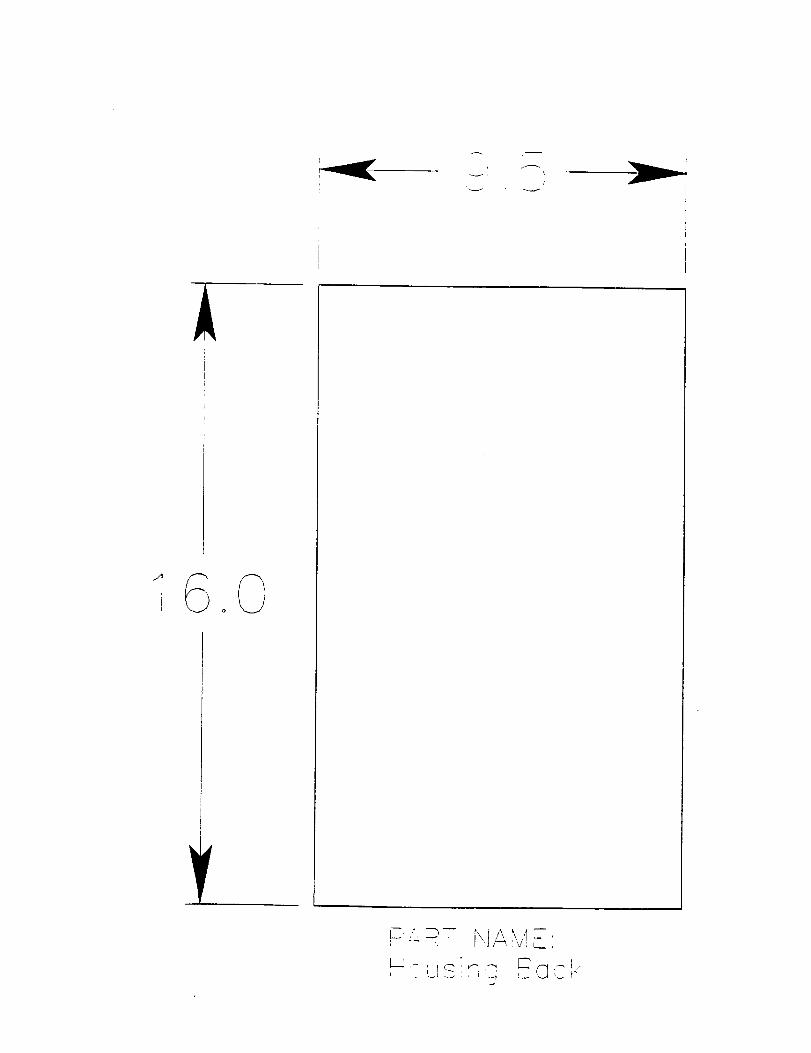
v _
v' v
L_
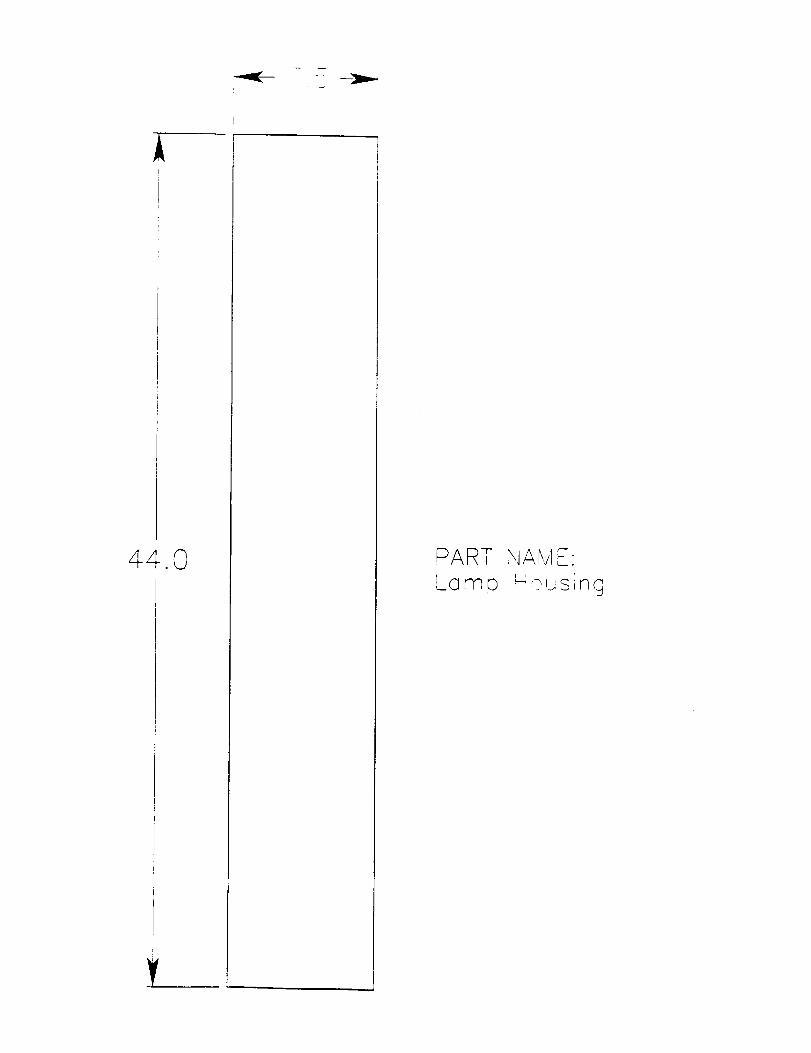
44.0 PART
Lamp
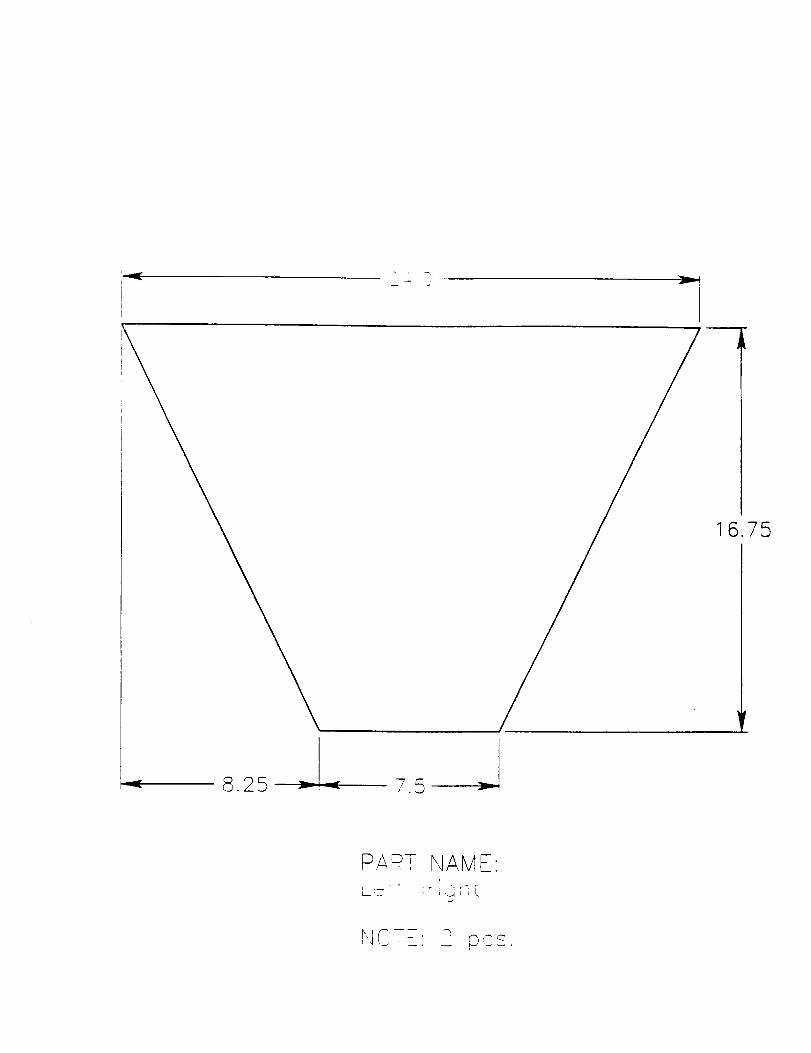
IrI
I
8.?_5 7.5
16.75
P ART
L_;_-
NAMEI .
t,_ C:l >- __ p_: t_ ,

18.0
I
!
I
"_- 5.0 .,,.- ; _..r 16.0 ,.._!r:
T,-__ "__,_o t t o na
NJ--_ _ o, Dcc