Thermal equilibrium state of the ocean Abstract
25
1 Thermal equilibrium state of the ocean Rui Xin Huang Department of Physical Oceanography Woods Hole Oceanographic Institution Woods Hole, MA 02543, USA April 24, 2010 Abstract The ocean is in a non-equilibrium state under the external forcing, such as the mechanical energy from wind stress and tidal dissipation, plus the huge amount of thermal energy from the air-sea interface and the freshwater flux associated with evaporation and precipitation. In the study of energetics of the oceanic circulation it is desirable to examine how much energy in the ocean is available. In order to calculate the so-called available energy, a reference state should be defined. One of such reference state is the thermal equilibrium state defined in this study. 1. Introduction Chemical potential is a part of the internal energy. Thermodynamics of a multiple component system can be established from the definition of specific entropy η . Two other crucial variables of a system, including temperature and specific chemical potential, can be defined as follows , 1 i vm T e η ∂ ⎛ ⎞ = ⎜ ⎟ ∂ ⎝ ⎠ , , , 1,2,..., i i ev T i n m η μ ⎛ ⎞ ∂ =− = ⎜ ⎟ ∂ ⎝ ⎠ , (1) where e is the specific internal energy, v is the specific volume, i m and i μ are the mass fraction and chemical potential for the i-th component. For a multiple component system, the change in total chemical potential is the sum of each component, i i i dc μ ∑ , where i c is the mass fraction of each component. The mass fractions satisfy the constraint 1 i i c = ∑ . Thus, the mass fraction of water in sea water satisfies w i i w dc c ≠ =− ∑ , and the total chemical potential for sea water is ( ) 1 N i w i i dc μ μ − − ∑ . For most applications in dynamical oceanography, the common practice is to assume that the distribution of different kinds of salt is globally uniform, and their sole effect to dynamics is considered by combining them into a single component, the salinity. Thus, we have 1 w s c c + = , and w s dc dc =− ; therefore, the commonly used formula for the changes in chemical potential is ( ) s w ds ds μ μ μ = − . (2a) Using the Gibbs function, chemical potential can be calculated from standard subroutine, and our calculation here is based on the Matlab code by Feistel (2005). The chemical potential (or the relative chemical potential) can be defined in terms of the Gibbs function as follows
Transcript of Thermal equilibrium state of the ocean Abstract

1
Thermal equilibrium state of the ocean Rui Xin Huang
Department of Physical Oceanography Woods Hole Oceanographic Institution
Woods Hole, MA 02543, USA
April 24, 2010
Abstract The ocean is in a non-equilibrium state under the external forcing, such as the
mechanical energy from wind stress and tidal dissipation, plus the huge amount of thermal energy from the air-sea interface and the freshwater flux associated with evaporation and precipitation. In the study of energetics of the oceanic circulation it is desirable to examine how much energy in the ocean is available. In order to calculate the so-called available energy, a reference state should be defined. One of such reference state is the thermal equilibrium state defined in this study.
1. Introduction
Chemical potential is a part of the internal energy. Thermodynamics of a multiple component system can be established from the definition of specific entropy η . Two other crucial variables of a system, including temperature and specific chemical potential, can be defined as follows
,
1
iv mT eη∂⎛ ⎞= ⎜ ⎟∂⎝ ⎠
, ,
, 1,2,...,ii e v
T i nmημ
⎛ ⎞∂= − =⎜ ⎟∂⎝ ⎠ , (1)
where e is the specific internal energy, v is the specific volume, im and iμ are the mass fraction and chemical potential for the i-th component.
For a multiple component system, the change in total chemical potential is the sum of each component, i ii
dcμ∑ , where ic is the mass fraction of each component. The
mass fractions satisfy the constraint 1iic =∑ . Thus, the mass fraction of water in sea
water satisfies w ii wdc c
≠= −∑ , and the total chemical potential for sea water is
( )1N
i w ii
dcμ μ−
−∑ .
For most applications in dynamical oceanography, the common practice is to assume that the distribution of different kinds of salt is globally uniform, and their sole effect to dynamics is considered by combining them into a single component, the salinity. Thus, we have 1w sc c+ = , and w sdc dc= − ; therefore, the commonly used formula for the changes in chemical potential is
( )s wds dsμ μ μ= − . (2a) Using the Gibbs function, chemical potential can be calculated from standard
subroutine, and our calculation here is based on the Matlab code by Feistel (2005). The chemical potential (or the relative chemical potential) can be defined in terms of the Gibbs function as follows

2
s w Sμ μ μ ∂= − =
∂g , w S
Sμ ∂= −
∂gg . (2b)
1. Meaning of chemical potential Chemical potential is a measure for the potential of change/mixing of a system
possesses multiple phases or components. Comparison between temperature and chemical potential: a. Thermal energy flows from place with high temperature to place with low
temperature b. Salt flows from place with high (relative) chemical potential to place with low
relative chemical potential.
a) Heat flows from hightemperature to low temperature
b) salt flows from highconcentration to low concentration
c) Salt flows from highchemical potential to low chemical potential
Fig. 1. Similarity between temperature, salinity and chemical potential.
2. Chemical potential for sea water Chemical potential depends on thermodynamic variables, as shown in Figs. 1 and
2. It is clear that chemical potential increases as both salinity and temperature are increased, Fig. 2a. In particular, chemical potential depends on salinity with a nearly linear relation; although at high salinity the slope is slightly reduced.
In addition, the contour of .constμ = in the T-S space is concave. In particular, it is a concave function of salinity at a fixed temperature. Therefore, if two water parcels with different T and S, but with the same chemical potential is mixed, the resulting water parcel will have a value of chemical potential which is slightly lower that before mixing, Fig. 2a.

3
Fig. 2. Chemical potential as a function of temperature and salinity.
However, if two water parcels have the same temperature and different salinity is mixed, the total amount of chemical potential is increased after mixing, Fig. 3a. However, if two parcels of same temperature, but different salinity, are mixed, the new parcel will have a chemical potential higher than the mean of the original parcels, Fig. 3b.
Fig. 3. Chemical potential as (a) a function of temperature for fixed salinity; (b) a function of salinity with fixed temperature. Chemical potential declines as the pressure is increased, Fig. 4a. Thus, in order to maintain a constant chemical potential with depth, the corresponding salinity of water

4
parcels should be increased downward, and this will be discussed shortly in connection to the equilibrium state of sea water.
Fig. 4. Chemical potential as a function of pressure and salinity.
3. The equilibrium state of sea water According to the maximum entropy theory, the entropy of an isolated system at
equilibrium should be maximal. The variational principle is used to find the corresponding conditions as follows (Kamenkovich, 1977).
The total amount of entropy for a control volume V is
VdvρηΗ = ∫∫∫ (3)
For an isolated system at equilibrium, it should satisfy the following conservation constraints:
1) The total momentum is conserved .
Vvdv constρ =∫∫∫ (4)
2) The total moment of momentum is conserved .
Vr vdv constρ× =∫∫∫ (5)
3) The total energy of the system should be conserved ( )2 / 2 .
Vv e gz dv constρ + + =∫∫∫ (6)
4) The masses of the system should be conserved .wV
dv constρ =∫∫∫ .sVdv constρ =∫∫∫ (7)
The maximal condition of the total entropy subject to these constraints can be found by the method of Lagrangian multipliers. In order to do so, we introduce the function

5
2
2w w s sV V V V
V V
vG dv dv dv e gz dv
a vdv b r vdv
ρη λ ρ λ ρ λ ρ
ρ ρ
⎛ ⎞= + + + + + +⎜ ⎟
⎝ ⎠
⋅ + ⋅ ×
∫∫∫ ∫∫∫ ∫∫∫ ∫∫∫
∫∫∫ ∫∫∫ (8)
where V , λ , wλ , sλ , a , and b are constant, which will be determined through the variational principle. First, we have the simple differential relation Td de Pdv dsη μ= + − , (9) which can be rewritten in the following form
( ) ( ) ( )w w s sTd d e d dρη ρ μ ρ μ ρ= − + . (10) Taking the first variation of G and using Eq. (8) leads to
( )
( ) ( )
2
2
12
2
ss s
Vw
w w
ve gzT T
G dvvgz v a b r v
T
μλ δ ρ λ λ λ δρδ
μ λ λ λ δρ λ δ ρ
⎡ ⎤⎛ ⎞⎛ ⎞+ + − + + − +⎢ ⎥⎜ ⎟ ⎜ ⎟⎝ ⎠ ⎝ ⎠⎢ ⎥= ⎢ ⎥⎛ ⎞⎢ ⎥− + + − + + + ×⎜ ⎟⎢ ⎥⎝ ⎠⎣ ⎦
∫∫∫ (11)
Since G is extreme, its first variation must be zero for all possible variations of ( )eδ ρ ,
sδρ , wδρ , and ( )vδ ρ ; thus, the coefficients of these variations must equal to zero: 1 /T λ= − (12)
2/ / 2s sgz vμ λ λ= − − + (13) 2/ / 2w wgz vμ λ λ= − − + (14)
( )/ /v a b rλ λ= − − × (15)
Thus, in an equilibrium state, the system should satisfy 1) Temperature is homogeneous 2) Chemical potential .s w constμ μ μ= − = 3) Velocity should be a pure translation, plus a rigid body rotation.
Using the Gibbs-Duhem equation 0wdT vdP sd dη μ μ− + + = (16)
and the condition of homogeneous temperature and chemical potential, we obtain
( )1wp gz gkμ
ρ∇ = ∇ = −∇ = − , (17)
i.e., the equilibrium state should be in hydrostatic equilibrium. It is worthwhile to emphasize that in the final equilibrium state, the in-situ temperature, instead of the potential temperature, is homogenized. The choice of in-situ temperature, rather than the potential temperature, is due to the fact that we are dealing with molecular diffusion, not the turbulent diffusion, so that in-situ temperature homogenization is expected at the final equilibrium. If we are concerned with the equilibrium state of a turbulent ocean, then what homogenized should be the potential temperature. However, a turbulent ocean requires a continuous supply of mechanical energy from outside, so that such a system cannot be an isolated system; thus, our discussion above does not apply.

6
In the ocean, due to the increase of water mass, pressure increases with depth; thus, in an equilibrium ocean, salinity should also changes with depth in such a way that the chemical potential is vertically constant. As shown in Fig. 4, in an equilibrium ocean the relation between pressure and salinity should follow the contours of constant chemical potential. For example, if the chemical potential is kept a constant 30 /J kgμ = , then the salinity should increase from a low value of 21 to a high value of 38 at the depth of 6,500 db. The exactly shape of salinity profile can be calculated as follows.
( )( )
.
.
//
const
const
pdS dpdz S dz
μ
μ
μμ
=
=
∂ ∂=
∂ ∂ (18)
Using the hydrostatic approximation, this is reduced to
( )( )
/ln/
pd S gdz S S
μρ
μ∂ ∂
= −∂ ∂
(19)
Since sea water is a dilute solution, with the salt concentration on the order of 10% of the saturation concentration, it can be shown that the fact in the denominator of (19) is nearly a constant (Andrews, F. C., 1972; Kamenkovich, 1977; Levenspiel and Nevers, 1974). As shown in Fig. 5, both the nominator and the denominator on the right-hand side of (19) are nearly constant; thus, the logarithm of salinity is a linear function of depth. Using the mean value of / 7pμ∂ ∂ − (J/kg/1000db) and ( )/ 73S Sμ∂ ∂ (J/kg), we have the approximate salinity profile
( )0exp /ssS S z z= (20) where 0 10,000z (m) is the scale depth of the salinity profile for an ocean in chemical equilibrium.
Fig. 5. Chemical potential and its derivatives with respect to salinity and pressure.
The world ocean is far away from the state of thermal and chemical equilibrium. In the typical case, water is warm and saline in the upper ocean, but water in the deep ocean comes from primarily high latitudes, where cold and relatively fresh deep/bottom water is formed. As an example, the T-S properties from the A05 Section (approximately along 24.5 oN in the North Atlantic) from WOCE are shown in Fig. 6, and the corresponding chemical potential and potential density maps are shown in Fig. 7.

7
The most outstanding feature is the high salinity in the upper ocean. In addition, there is a sign of high salinity water mixed with the environment at depth between 1000 to 1500 m. The high salinity and temperature in the upper ocean provide a condition favorable for salt fingering and this ocean regime has been explored for salt fingering over the past, .e.g., Schmitt et al. (2005). The commonly used formulae for salt fingering are based on the vertical gradient of salinity and temperature (Schmitt et al., 2005). As discussed above, however, in the equilibrium state, salinity is not vertically uniform.
Fig. 6. Temperature and salinity for the A05 section.
Fig. 7. Chemical potential and potential density for the upper ocean through A05 section.

8
4. The equilibrium state for a water column in the world oceans We begin with the analysis for a station at (29.5oW, 13.5oS) taken from WOA01 data, and this station data includes 33 boxes in the vertical direction. There is warm and relatively salty water in the upper part of the water column, black lines in Figs. 8a and 9a.
A. The search of the thermodynamic equilibrium state We separate the procedure of finding the thermodynamic equilibrium state into three
steps. We begin with the search of the thermal equilibrium state, leaving the salinity in each box unchanged. Therefore, mass of each box remains the same, so is the pressure in center of each water parcel. As a result, we can use the same pressure distribution for the calculation.
The search of the thermal equilibrium state is further separated into two sub-steps. First, we will calculate the mass-weighted mean of the vertical temperature.
( )33
1
1 , ,i i i i i ii
T S T P T dzH
ρρ =
= ∑ (21)
This calculation is simple and straightforward. If the specific heat under constant pressure were constant, this will give us an exact solution of the thermal equilibrium state. However, the specific heat under constant pressure is not really constant.
In the second sub-step, the exact temperature of the thermal equilibrium state is found by a more accurate statement of conservation of the total energy, i.e., the sum of mass-weighted enthalpy and the total gravitational potential energy must be conserved during the thermal adjustment.
( ) ( )33 33
,, ,
1 1
, , , ,new new thermal newi i i i c i i i i i c i i
i i
h S T P gz dm h S T P gz dm= =
⎡ ⎤+ = +⎡ ⎤⎣ ⎦ ⎣ ⎦∑ ∑ (22)
where ,, , , ,i i i i c iT S h zρ are the temperature, salinity, density, enthalpy and the position of
the center of mass of each box in the initial state, and , ,,, , , ,new thermal new thermal new new
i i i c iT S h zρ are the corresponding values after thermal mixing. Since there is no mass exchange during thermal mixing, the total mass of each box remains unchanged, i.e.,
( ) ( ), ,, , , ,new thermal new thermal newi i i i i i i i i idm T S P dz S T P dzρ ρ= = (23)
The thermal equilibrium state is defined as a state with the salinity profile unchanged. As discussed above, this is not a thermodynamic equilibrium state, so that we move to the second step in which we find the exact equilibrium state as follows.
Using the new mean temperature, we adjust salinity profile in such a way that it satisfies the following three constraints:
a) The chemical potential is vertically homogeneous b) The total amount of salt is conserved c) The total energy conservation is conserved This is an iterative process. Although we begin with using the temperature
obtained from the thermal equilibrium state calculation. After the salinity adjustment, large amount of gravitational potential energy is released. Since we are dealing with an isolated system, the total energy must be conserved. Thus, we assume that all released gravitation potential energy is kept in the system and converted into the internal energy, thus, increasing the mean temperature of the system.
For simplicity of the calculation, we made use of another assumption: the total mass of each box remains the same as before. Since salt diffusion takes place during the

9
salt adjustment, mass exchange between boxes is expected. Thus, the original boundary between boxes becomes meaningless, and our assumption is a technique to render the calculation relatively easy, without changing the essential feature of the final solution. Under our assumption, pressure in each box remains the same as before, thus, the thermodynamic properties of each box can be calculated easily. Using the superscript chemical to label the new thermodynamic variables, the corresponding energy conservation statement is
( ) ( )33 33
, ,1 1
, , , ,chemical chemical chemical chemicali i i i c i i i i i c i i
i i
h S T P gz dm h S T P gz dm= =
⎡ ⎤+ = +⎡ ⎤⎣ ⎦ ⎣ ⎦∑ ∑ ; (24)
and the total salt conservation statement is 33 33
1 1
chemicali i i i
i i
S dm S dm= =
=∑ ∑ (25)
B. The thermal equilibrium state As discussed above, to find out the final state of equilibrium we separate the search in
two steps. For a station at (29.5oW, 13.5oS) the temperature profiles in the initial state is shown by the black curve in Fig. 8a, and the corresponding uniform temperature profiles after adjustment is indicated by the red line. In fact, this seemingly a single vertical line represents three solutions, which appears in clear separation with higher resolution of the horizontal temperature axis, Fig. 8b. The distance between the red and black lines indicates the temperature correction due to the non-constant specific heat, and the blue line indicates the temperature after the complete thermodynamic equilibrium state is reached, which will be discussed in the next section.
Fig. 8. Temperature and salinity profile for a station at 29.5oW, and 13.5oS, taken from WOA01.
C. The chemical equilibrium state

10
The search of the complete thermodynamic equilibrium state follows the steps described above. Starting with a given initial guess of salinity at the sea surface, say
20ssS = , we can find a salinity profile with salinity increases with pressure in such a way that the corresponding chemical potential is vertically constant. Such an initial guess of salinity profile does not guarantee the conservation of total salt in the water column. Thus, the sea surface salinity value is adjusted to satisfy the conservation of the total amount of salt.
With this new salinity profile, the total amount of enthalpy and gravitational potential energy of this water column changes; thus, the conservation of the total energy is applied again in order to find a final state of equilibrium with uniform temperature,
3.69452ofinalT C= , shown by the blue line in Fig. 8b, whereas the initial salinity profile
is indicated by the black curve in Fig. 9a. The solution described here satisfies all three constraints described above, i.e., the total energy conservation, the total salt conservation and the vertically uniform in-situ temperature and chemical potential.
The major feature of this final equilibrium state is characterized by piling up of salt in the deep ocean, as shown by the red line in Fig. 9a. Sinking of salt in the water column leads to the shifting of water mass, i.e., density increases in the deep ocean, but it declines in the upper ocean as shown by the red line in Fig. 9b.
Although the initial state is stable (the black line in Fig. 9b), the state with temperature adjustment alone is not stable, as indicated by the red line in Fig. 9b. This gravitational unstable situation is due to the fact that salinity in the upper ocean is higher than that in the subsurface ocean. However, after the complete thermodynamic equilibrium state is reached the system is very stable, as indicated by the strong density stratification, the blue line in Fig. 9b.
Fig. 9. a) Change in density at thermal/chemical equilibrium state; b) accumulated change in vertical position at thermal/chemical equilibrium.
In comparison, during the first step of reaching the thermal equilibrium state, the gravitational potential energy of the water column increases, as shown by the red line in

11
Fig. 10b. The increase of gravitational potential energy is due to the warming and expansion of deep water. As a result, the mass center of the deep boxes moves upward, as indicated by the red line in Fig. 10a. On the other hand, the upper boxes are cooled down and their thickness is reduced. As a result, the accumulated vertical migration of mass centers declines for the upper part of the water column, as indicated by the upper part of the red line in Fig. 10a.
This case gives us a good example for demonstrating the meaning of the energy conservation constraint. The initial guess of the temperature after thermal diffusion is the vertically mass-weighted mean temperature, 0 3.61357oT C= , as shown by the black line in Fig. 8b. However, this is not an accurate value because the heat capacity of sea water depends on temperature, salinity and pressure. In order to find out the exact temperature at thermal equilibrium, we need to apply the first law of thermodynamics, i.e., we should determine the equilibrium temperature from the conservation of total energy of the water column.
The first choice is to assume that the total enthalpy of the water column should be conserved. The idea that enthalpy is a better choice of conservation during mixing in the ocean has been used by McDougall (2003) in postulating the so-called potential enthalpy. However, in the present case, after thermal mixing the lower part of the water column is warmed up and moves upward, shown as the red line in Fig. 10a. The warming of the deep ocean induces an increase of the total gravitational potential energy of the water column, the red line in Fig. 10b
Fig. 10. Vertical displacement for the thermal/chemical equilibrium relative to the initial state; b) accumulated change is gravitational potential energy (relative to the sea floor) for the thermal/chemical equilibrium state. Thus, change in the total energy of the water column must include the contribution of gravitational potential energy because oceanic circulation takes place in the environment of the gravitational field, which is one of the most important dynamical constraints of the oceanic general circulation. The equilibrium temperature of the water
12
column at the thermal equilibrium state is obtained by slightly adjusting the temperature to guarantee that the total amount of energy, including both enthalpy and gravitational potential energy, is conserved after mixing. The corresponding temperature profile is shown as the red line in Fig. 9b, which includes a small increase of 0.03046oC from the initial guess by vertically mass-weighted average of the water column depicted by the black line in Fig. 9b; thus, the mean temperature should be
1 3.61357 0.03046 3.64403T = + = . These two lines are so close to each other, so that they appear as a single red line in Figs. 9a, 10a and 10b. During the adjustment towards the complete thermodynamic equilibrium state salt is moved towards the deep ocean. The corresponding density increase in the deep ocean leads to the shrinking of deep boxes. Due to the mass exchange across box interfaces, the original box boundaries become meaningless. As stated above, we postulate a new set of box boundaries, which are so defined that the amount of mass in each box remains unchanged. As a result, the box interfaces moves down in the deep ocean. On the other hand, the boxes in the upper ocean lose their salt and become light and expand. As a result, the vertically accumulated interface migration in the upper part of the ocean recovers and eventually overshoots, blue curve in Fig. 10a.
There is a downward shift of gravity center of the water column, blue line in Fig. 10b. As a result, the total amount of gravitational potential energy for the water column is greatly reduced. The reduction of gravitational potential energy is about 60,120 J/m3, which is enough for warming up the water column approximately 0.05oC. This increase of temperature leads to primarily the increase of enthalpy, so that the total amount of energy of the system remains the same as in the initial state.
Another important point to be explored is that in currently used formulae in the study of salt fingering, the vertical salinity gradient, in combination of vertical temperature gradient, is used for parameterization. However, the chemical equilibrium state in the ocean requests a large downward increase of salinity gradient. For example, over the depth of 500-1000 m, the salinity increases from 26.895 to 28.388, i.e., an increase of salinity 1.493. Thus, the gravitational field imposes a rather strong constraint to the vertical salinity gradient in the equilibrium state, which has not been included in the traditional salt fingering study. The implication of the equilibrium salinity gradient and the criterion used in salt fingering study remains to be explored in the near future,
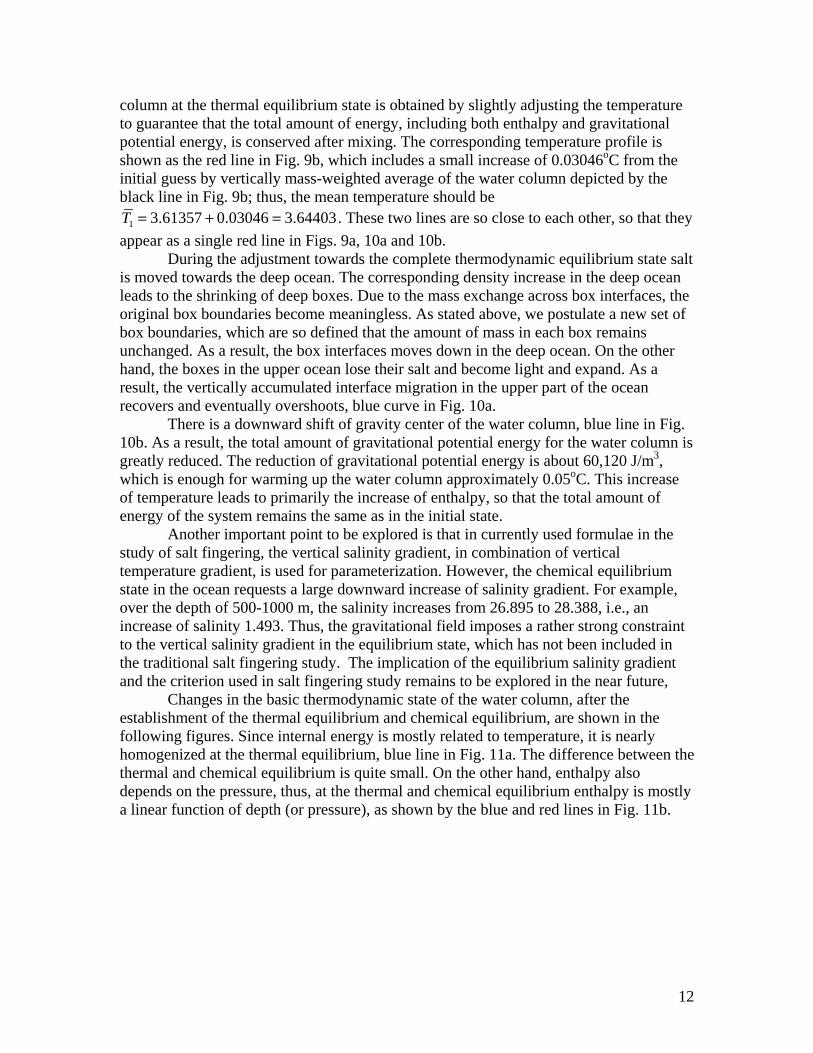
Changes in the basic thermodynamic state of the water column, after the establishment of the thermal equilibrium and chemical equilibrium, are shown in the following figures. Since internal energy is mostly related to temperature, it is nearly homogenized at the thermal equilibrium, blue line in Fig. 11a. The difference between the thermal and chemical equilibrium is quite small. On the other hand, enthalpy also depends on the pressure, thus, at the thermal and chemical equilibrium enthalpy is mostly a linear function of depth (or pressure), as shown by the blue and red lines in Fig. 11b.
13
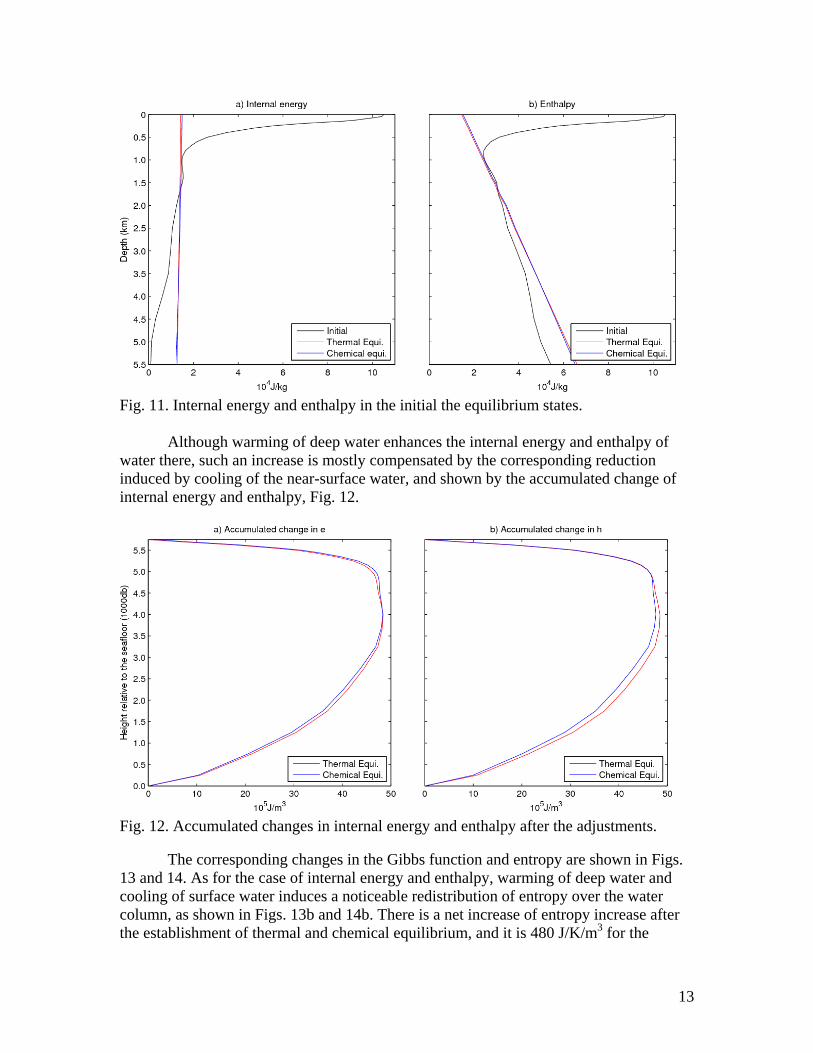
Fig. 11. Internal energy and enthalpy in the initial the equilibrium states. Although warming of deep water enhances the internal energy and enthalpy of water there, such an increase is mostly compensated by the corresponding reduction induced by cooling of the near-surface water, and shown by the accumulated change of internal energy and enthalpy, Fig. 12.
Fig. 12. Accumulated changes in internal energy and enthalpy after the adjustments.
The corresponding changes in the Gibbs function and entropy are shown in Figs. 13 and 14. As for the case of internal energy and enthalpy, warming of deep water and cooling of surface water induces a noticeable redistribution of entropy over the water column, as shown in Figs. 13b and 14b. There is a net increase of entropy increase after the establishment of thermal and chemical equilibrium, and it is 480 J/K/m3 for the

14
thermal equilibrium and 870 J/K/m3 for the chemical equilibrium; however, the values are small for the scale used for plotting the Fig. 14b. Such an increase of entropy is consistent with the basic thermodynamic principle that entropy should be increase due to thermal diffusion which leads to the thermal equilibrium state. Most importantly, entropy should be maximal at the chemical equilibrium, and the transition from the non-chemical equilibrium state to the thermodynamic equilibrium state should be accomplished by the increase of entropy in the system.
Fig. 13. Gibbs function and entropy distribution at the initial state, the thermal equilibrium and chemical equilibrium state.
Fig. 14. Accumulated changes in Gibbs function and entropy at the thermal equilibrium and chemical equilibrium state.

15
On the other hand, the corresponding change in the Gibbs function poses a puzzle. Since the Gibbs function is often called the free enthalpy, this name implies that its value should be reduced during the transition to the thermodynamic equilibrium state. As shown above, the entropy of the system does increase during these transitions; however, the total amount of Gibbs function is increased during the transition from the initial state to the thermal equilibrium state, shown as the red line in Fig. 14a. At the second stage, i.e., during the transition from the thermal equilibrium to the chemical equilibrium, the Gibbs function is reduced, as shown by the blue line in Fig. 14a. The contribution due to the gravitational potential energy may not be negligible; thus, we also examined the corresponding change of the total energy, which is defined as h gz Tη+ − and the chemical potential, as shown in Figs. 15 and 16. In comparison, the contribution associated with the gravitational potential energy is small, so that changes in the total energy are quite similar to that of the Gibbs function. The distribution of the chemical potential confirms that the final state is indeed in chemical equilibrium, shown as the blue line in Fig. 15.
Fig. 15. Total energy and chemical potential distribution at the initial state, the thermal equilibrium and chemical equilibrium state.

16
Fig. 16. Accumulated changes in total energy and the chemical potential at the thermal equilibrium and chemical equilibrium state.
The corresponding changes brought about during the transition from the thermal equilibrium to the chemical equilibrium state are shown in Fig. 17. As discussed above, both the total amount of internal energy and enthalpy increase during the transition, Fig. 17a. The total amount of entropy also increases, the red line in Fig. 17b. On the other hand, the total amount of free enthalpy is reduced during this transition, green line in Fig. 17a. In addition, we also include an conceptual case in which the salt is allowed to sink to the deep ocean, but the system is maintained at the vertically weighted mean temperature
0T . The accumulated change in entropy of the water column for such a case is plotted as the blue line in Fig. 17b. Thus, it is clear that without the corresponding adjustment in temperature, the total entropy of the water column could be slightly reduced.
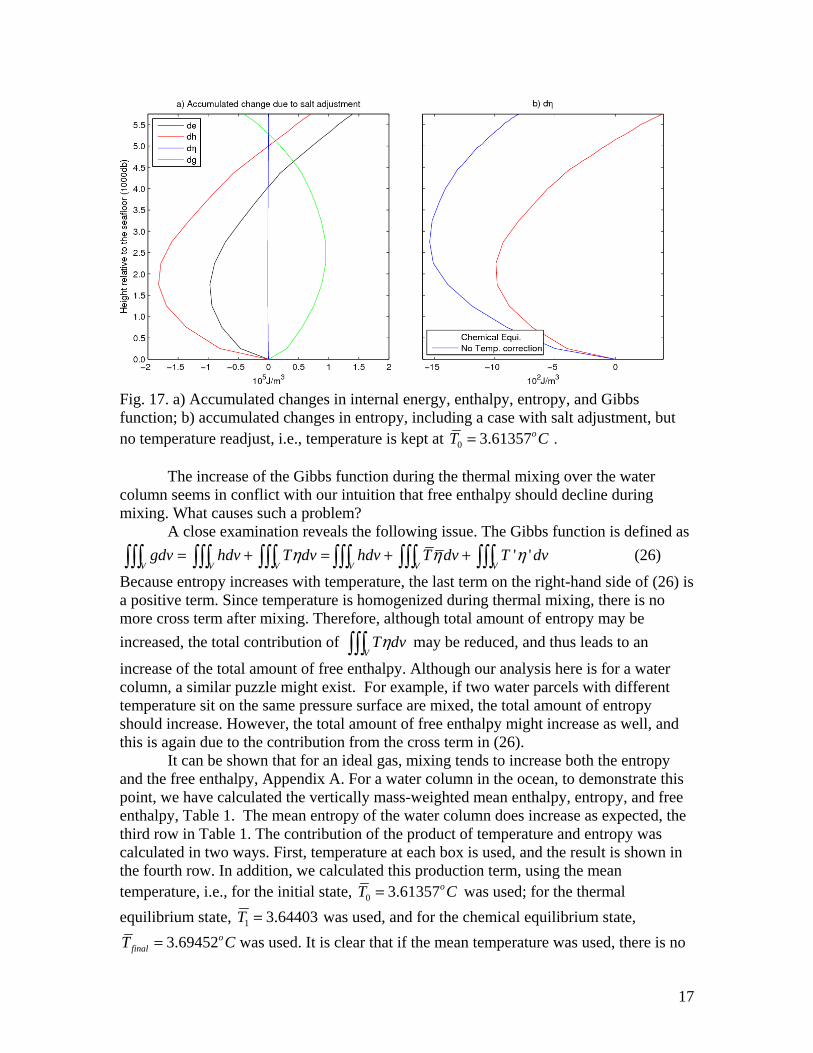
17
Fig. 17. a) Accumulated changes in internal energy, enthalpy, entropy, and Gibbs function; b) accumulated changes in entropy, including a case with salt adjustment, but no temperature readjust, i.e., temperature is kept at 0 3.61357oT C= .
The increase of the Gibbs function during the thermal mixing over the water column seems in conflict with our intuition that free enthalpy should decline during mixing. What causes such a problem?
A close examination reveals the following issue. The Gibbs function is defined as ' '
V V V V V Vgdv hdv T dv hdv T dv T dvη η η= + = + +∫∫∫ ∫∫∫ ∫∫∫ ∫∫∫ ∫∫∫ ∫∫∫ (26)
Because entropy increases with temperature, the last term on the right-hand side of (26) is a positive term. Since temperature is homogenized during thermal mixing, there is no more cross term after mixing. Therefore, although total amount of entropy may be increased, the total contribution of
VT dvη∫∫∫ may be reduced, and thus leads to an
increase of the total amount of free enthalpy. Although our analysis here is for a water column, a similar puzzle might exist. For example, if two water parcels with different temperature sit on the same pressure surface are mixed, the total amount of entropy should increase. However, the total amount of free enthalpy might increase as well, and this is again due to the contribution from the cross term in (26).
It can be shown that for an ideal gas, mixing tends to increase both the entropy and the free enthalpy, Appendix A. For a water column in the ocean, to demonstrate this point, we have calculated the vertically mass-weighted mean enthalpy, entropy, and free enthalpy, Table 1. The mean entropy of the water column does increase as expected, the third row in Table 1. The contribution of the product of temperature and entropy was calculated in two ways. First, temperature at each box is used, and the result is shown in the fourth row. In addition, we calculated this production term, using the mean temperature, i.e., for the initial state, 0 3.61357oT C= was used; for the thermal equilibrium state, 1 3.64403T = was used, and for the chemical equilibrium state,
3.69452ofinalT C= was used. It is clear that if the mean temperature was used, there is no

18
contribution from the cross term. As a result, the equivalent free enthalpy would be reduced after thermal mixing. However, the increase of free enthalpy remains unexplainable.
State Initial Thermal equilibrium
Chemical equilibrium
1V
h dvV
ρ∫∫∫ 43.45386 43.44425 43.51398
1V
dvV
ηρ∫∫∫ (106J/K/m3)0.05040 0.05089 0.05128
1V
T dvV
ηρ∫∫∫ 14.24636 14.08525 14.19566
V
T dvV
η∫∫∫ 13.94986 14.08525 14.19566
( )V
h T hdvη ρ= −∫∫∫g 29.20751 29.35900 29.31832
( )1'V
h T dvV
η ρ= −∫∫∫g 29.50400 29.35900 29.31832
Table 1: Vertically mass-weighted enthalpy, entropy and free enthalpy for three states. All quantities, except the entropy
Vdvη∫∫∫ , in unit of 106J/m3. The value of T is
discussed in detail in the main text. 5. The equilibrium state for the world oceans In order to find out the thermodynamic equilibrium state in the world oceans we need to consider a huge number of water parcels. Since this is a state after thermal and haline adjustment, heat and salt in each water parcel are no longer conserved, and we can treat the world oceans as a single water column. First, we realize that in the final equilibrium state the temperature and chemical potential must be globally uniform. Thus, we will first compose a global mean vertical profile of temperature and salinity. Using this profile, we will adjust temperature and salinity to satisfy the equilibrium conditions. Using WOA01 data and averaging over each horizontal level, we obtain the global mean vertical profiles of temperature, salinity, horizontal area and mass, Fig. 18.

19
Fig. 18. Vertical mean profiles for the world oceans, the vertical axis is depth (km).
It is to emphasize that during the horizontal average, water parcels with different
temperature and salinity are mixed to produce a large water mass of single value of temperature and salinity on each vertical level. Due to the nonlinearity of the equation of the state of sea water, mixing of water parcels can lead to cabbeling. Cabbeling was first introduced in the study of deep water mass formation in 1930. For a long time, people’s interest related to cabbeling was mostly confined to water properties at middle and deep parts of the ocean; however, a close examination reveals that cabbeling can play an important role in the upper ocean as well.
To demonstrate this point, we can do the following calculation in the (T,S) space. For each point in the (T,S) space, we define two water parcels with properties: ( ),T T S Sδ δ+ + and ( ),T T S Sδ δ− − , where 1oT Cδ = and 0.25Sδ = , and the difference in the density of the mixed parcel and the mean density of the original parcels is shown in Fig. 19. It is clear that the effect of cabbeling is large for shallow part of the ocean, assuming the same temperature and salinity difference. Cabbeling effect is large for cold and fresh water than warm and salty water; thus, cabbeling is more important to high latitude ocean than the low latitude ocean.

20
Fig. 19. Cabbeling induced density increament of sea water at two pressure levels.
With large difference of temperature and salinity in the upper ocean, the
cabbeling effect during horizontal mixing of water parcels, in the conceptual mixing discussed above, is much more prominent than the corresponding part in the deep ocean, as shown in Fig. 20.
Fig. 20. Cabbeling induced change of properties: a) density increament; b) vertical migration of center of mass; c) vertically accumulated change of total gravitational potential energy. After obtaining this single water column for the world oceans, we can carry out the conceptual thermal and chemical adjustments for the single station discussed above. The corresponding results are presented below. First, the corresponding temperature profiles before and after adjustment are shown in Fig. 21.

21
Fig. 21. Temperature profiles for the world oceans, before and after thermal and chemical adjustments.
The corresponding salinity profiles before and after chemical adjustment are shown in Fig. 22a, and the corresponding potential density profiles are shown in Fig. 22b.
Fig. 22. a) Salinity profiles for the world oceans, before and after chemical adjustment; b) potential density profiles before and after chemical adjustment.
The accumulated vertical displacements of the center of mass of each box after the thermal adjustment and the complete thermodynamic adjustment are shown in Fig. 23a, and the corresponding potential energy changes profiles are shown in Fig. 23b.

22
Fig. 23. a) Accumulated vertical displacement of center of mass of the water column after adjustment; b) accumulated change of gravitational potential energy after adjustment.
Fig. 24. a) Accumulated changes in Gibbs function after adjustment; b) accumulated change of entropy after adjustment. The total amount of GPE released through the salt adjustment is 5 31.13 10 /J m× . Since the total volume of the world ocean (according to the WOA01 data) is about
18 31.47 10 m× , the total amount of GPE released is estimated at 231.66 10 J× , Table 2. The total amount of GPE in the world ocean, using the mean depth as the reference level, is about 252.1 10 J× ; thus the GPE stored in the salt distribution is about 1% of the total GPE. In comparison, the available gravitational potential energy in the world oceans, is about 31474 /J m (Huang, 2005). Thus, the gravitational potential energy associated with the non-equilibrium distribution of salt is 100 times larger than that associated with the spatial non-uniform distribution of stratification.
23
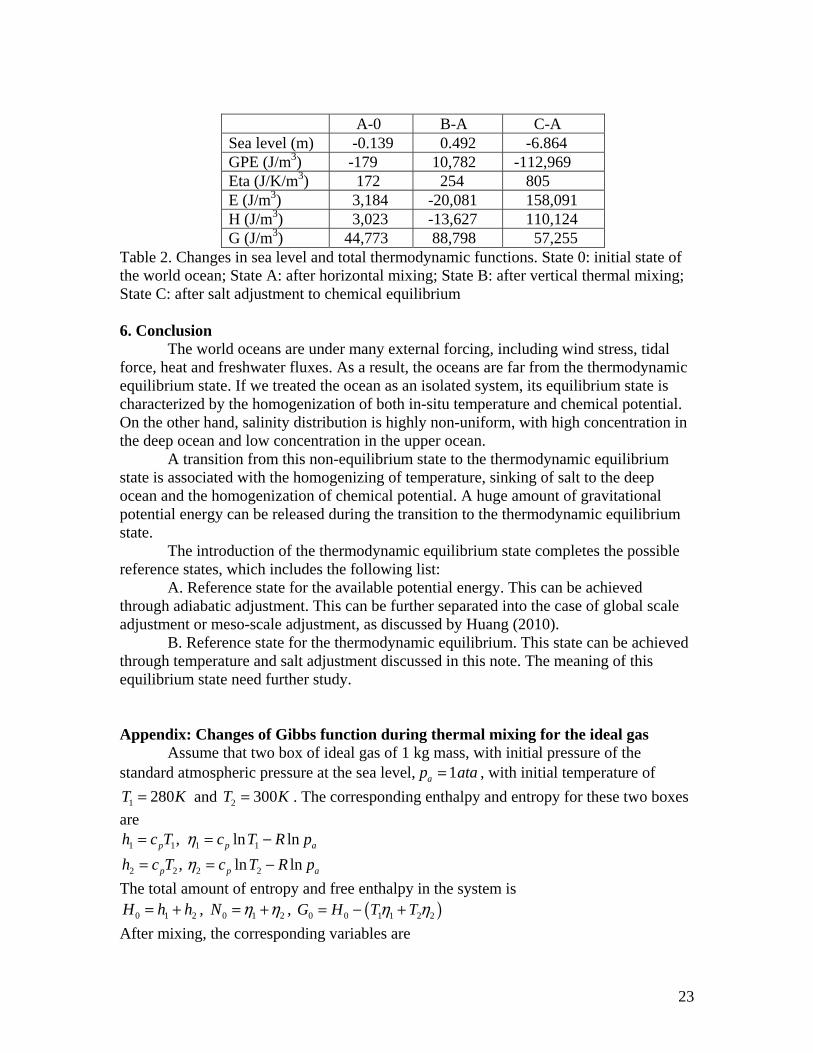
A-0 B-A C-A Sea level (m) -0.139 0.492 -6.864 GPE (J/m3) -179 10,782 -112,969 Eta (J/K/m3) 172 254 805 E (J/m3) 3,184 -20,081 158,091 H (J/m3) 3,023 -13,627 110,124 G (J/m3) 44,773 88,798 57,255
Table 2. Changes in sea level and total thermodynamic functions. State 0: initial state of the world ocean; State A: after horizontal mixing; State B: after vertical thermal mixing; State C: after salt adjustment to chemical equilibrium 6. Conclusion The world oceans are under many external forcing, including wind stress, tidal force, heat and freshwater fluxes. As a result, the oceans are far from the thermodynamic equilibrium state. If we treated the ocean as an isolated system, its equilibrium state is characterized by the homogenization of both in-situ temperature and chemical potential. On the other hand, salinity distribution is highly non-uniform, with high concentration in the deep ocean and low concentration in the upper ocean. A transition from this non-equilibrium state to the thermodynamic equilibrium state is associated with the homogenizing of temperature, sinking of salt to the deep ocean and the homogenization of chemical potential. A huge amount of gravitational potential energy can be released during the transition to the thermodynamic equilibrium state. The introduction of the thermodynamic equilibrium state completes the possible reference states, which includes the following list:
A. Reference state for the available potential energy. This can be achieved through adiabatic adjustment. This can be further separated into the case of global scale adjustment or meso-scale adjustment, as discussed by Huang (2010).
B. Reference state for the thermodynamic equilibrium. This state can be achieved through temperature and salt adjustment discussed in this note. The meaning of this equilibrium state need further study.
Appendix: Changes of Gibbs function during thermal mixing for the ideal gas Assume that two box of ideal gas of 1 kg mass, with initial pressure of the standard atmospheric pressure at the sea level, 1ap ata= , with initial temperature of
1 280T K= and 2 300T K= . The corresponding enthalpy and entropy for these two boxes are
1 1 1 1, ln lnp p ah c T c T R pη= = −
2 2 2 2, ln lnp p ah c T c T R pη= = − The total amount of entropy and free enthalpy in the system is
0 1 2H h h= + , 0 1 2N η η= + , ( )0 0 1 1 2 2G H T Tη η= − + After mixing, the corresponding variables are

24
( )1 2 / 2, , ln lnp p aT T T h c T c T R pη= + = = − Thus, the total amount of entropy and free enthalpy are
1 22 pH c T h h= = + ; 2 2 ln 2 lnp aN c T R pη= = − ;
G H TN= − . First , it is readily to see that total amount of entropy is increased
1 22 ln ln ln 0N T T TΔ = − − > . (A1) This can be shown as follows. First, for any positive temperature 1T and 2T we have
( )2 2 21 2 1 2 1 2 1 20 2 4T T T T T T T T− ≥ ⇒ + + >
Thus, 1 21 22
T T T T+ > ; so that ( )1 21 2exp exp
2T T T T+⎛ ⎞ >⎜ ⎟
⎝ ⎠. This leads to (A1).
Second, for changes in the free enthalpy, we will show that it is increased after mixing. Since the amount of enthalpy in the system remains unchanged, all we have to do is to prove that the sum of temperature multiplied by entropy is reduced after mixing, i.e.,
( )1 1 2 2ln ln 2 ln 0pG c T T T T T TΔ = + − > (A2)
Denote the temperature variables as ( )1 1T T ε= − , ( )2 1T T ε= + , we have
( ) ( ) ( ) ( )( ) ( )
1 1 2 2
1 1
2
ln ln 2 ln
1 ln 1 1 ln 1 2 ln
ln 1 1
1ln (1 ) .1
T T T T T T
T T T T T T
T
T
ε ε
ε
ε ε ε ε
ε ε
εεε
− +
+ −
= − − + + + −⎡ ⎤ ⎡ ⎤⎣ ⎦ ⎣ ⎦⎡ ⎤= − +⎣ ⎦⎡ ⎤+⎛ ⎞= −⎢ ⎥⎜ ⎟−⎝ ⎠⎢ ⎥⎣ ⎦
(A3)
Assume the 1ε , we have the following Taylor expansion
( ) ( ) ( )2 3 2 31 1 1 .. 1 2 2 2 ...1
ε ε εε ε ε ε εε
+ + + + + = + + + +−
Thus,
( ) ( ) ( ) ( )2 2 2 211 1 1 2 .. 1 .. 11
εεε ε ε εε
+⎛ ⎞− − + + + + >⎜ ⎟−⎝ ⎠ (A4)
Combining (A3) and (A4) leads to (A2). Therefore, the total amount of free enthalpy increases after thermal mixing.
This analysis can be shown graphically. Denote 1T T Tδ= − , 2T T Tδ= + , and / pG cΔ in (A2) as ( ) ( ) ( ) ( )ln ln 2 lnD T T T T T T T T T Tδ δ δ δ= + + + − − − . Setting
300T K= , we have the relation between Tδ and Δ as shown in Fig. A1. It is clear that Δ is always positive, so that GΔ is always positive, and the Gibbs function is increased after thermal mixing.

25
Fig. A1. Decrease of the Tη term after mixing, see the main text above.
Reference:
Andrews, F. C., 1972. Gravitational effect on concentrations and partial pressure in solutions: A thermodynamic analysis, Science, 178, 1199-1202.
Feistel, R. (2005). Numerical Implementation and Oceanographic Application of the Gibbs Thermodynamic Potential of Seawater. Ocean Science Discussion, 1 (2004), 1-19, http://www.ocean-science.net/osd/1/1, Ocean Science 1 (2005), 9-16, http://www.ocean-science.net/os/1/9
Huang, R. X. (2005a). Available Potential Energy in the World Oceans. J. Mar. Res., 63, 141-158.
Kamenkovich, V. M., 1977. Fundamentals of ocean dynamics, Elsevier, New York, 249pp. Levenspiel, O. and N. de Nevers, 1974. The osmotic pump, Science, 183, 157-160. McDougall, T. J., 2003: Potential Enthalpy: A conservative oceanic variable for evaluating heat
content and heat fluxes. J. Phys. Oceanogr., 33, 945-963. Schmitt, R. W., J. R. Ledwell, E. T. Montgomery, K. L. Polzin and J. M. Toole. 2005. Enhanced
diapycnal mixing by salt fingers in the thermocline of the tropical Atlantic. Science, 308, 685-688.