Thermal Diffusivity, Moisture Diffusivity, and Color ...
14
Research Article Thermal Diffusivity, Moisture Diffusivity, and Color Change of Codonopsis javanica with the Support of the Ultrasound for Drying Xuan-Quang Nguyen , 1 Anh-Duc Le, 2 Ngoc-Phuong Nguyen, 1 and Hay Nguyen 2 1 Faculty of Mechanical Engineering, Ho Chi Minh City University of Technology and Education, Ho Chi Minh City, Vietnam 2 Faculty of Engineering and Technology, Nong Lam University, Ho Chi Minh City, Vietnam Correspondence should be addressed to Hay Nguyen; [email protected] Received 25 July 2019; Revised 23 September 2019; Accepted 8 October 2019; Published 3 November 2019 Academic Editor: Vera Lavelli Copyright © 2019 Xuan-Quang Nguyen et al. is is an open access article distributed under the Creative Commons Attribution License, which permits unrestricted use, distribution, and reproduction in any medium, provided the original work is properly cited. In this study, drying kinetics, including thermal and moisture, of Codonopsis javanica with the support of ultrasonic technology in the drying process were investigated. Experimental processes were carried out at drying air temperatures of 40 ° C, 45 ° C, and 50 ° C with and without ultrasound at a frequency of 20 kHz and three levels of intensity: 1.3 kW/m 2 , 1.8 kW/m 2 , and 2.2 kW/m 2 . Based on theoretical calculations, experimental data, and the particle swarm optimization (PSO) algorithm, the coefficient of thermal diffusion was determined in the range of 1.01–1.36 × 10 - 7 m 2 /s, and the coefficient of moisture diffusion is in the range of 3.2–6.7 × 10 - 10 m 2 /s. In addition, the color parameters (L * , a * , and b * ) of the drying materials were also considered. Results showed the overall color differences (∆E) of dried products change in the range of 8.0–12.9 compared with the fresh ones. In this work, the multiple boundary conditions were considered to determine the moisture and thermal diffusion coefficients; the results obtained prove that the quality of dried products in terms of color change is also improved. 1. Introduction Codonopsis javanica is an agricultural product of high economic value in Vietnam, used for food and medicine. So, its moisture content reduction is necessary for preservation. C. javanica is a heat-sensitive material; therefore, drying air temperature and drying time affect the nutrient composi- tion, herbal medicine, and product color. Ultrasound-assisted drying is a high-energy mechanical wave (its frequencies range between 18 kHz and 100 kHz [1, 2]) and considered a hybrid drying technique to reduce drying time, save energy, and maintain the nutrient com- position of the products [3]. e energy of ultrasound re- duces the internal and external resistances to moisture transfer in the material. In addition, microstreaming at the surface of the drying material, caused by ultrasound, de- creases the diffusion boundary layer and enhances drying kinetics and diffusivity [4]. is affects the drying kinetics of the material whose characteristic quantity is the effective diffusion coefficient (D e ). With no external resistance fac- tors, the effective diffusion coefficient was calculated from the diffusion equation based on Fick’s second law [4]. As- suming that deformation of objects during drying is neg- ligible, using the initial conditions and the reasonable constraints, Crank [5] determined the solutions of the diffusion equations in different geometrical conditions. Applying Fick’s second law and Crank’s results, the re- searchers determined the moisture diffusion coefficients of orange peel [6], salted cod [7], honeysuckle [8], and apple slabs [9]. Considering the external resistance factors, the conditions of moisture exchange at the surface of the drying materials and drying air are investigated, and the effective diffusion coefficient (D e ) and moisture transfer coefficients (h m ) at the surface would be determined simultaneously. Previous studies [6, 10–12] accomplished this by combining theoretical calculations, experimental data, and the optimal algorithm with the appropriate objective function, to find parameters of orange, apple, strawberry, and passion fruit Hindawi Journal of Food Quality Volume 2019, Article ID 2623404, 13 pages https://doi.org/10.1155/2019/2623404
Transcript of Thermal Diffusivity, Moisture Diffusivity, and Color ...

Research ArticleThermal Diffusivity Moisture Diffusivity and Color Change ofCodonopsis javanica with the Support of theUltrasound for Drying
Xuan-Quang Nguyen 1 Anh-Duc Le2 Ngoc-Phuong Nguyen1 and Hay Nguyen 2
1Faculty of Mechanical Engineering Ho Chi Minh City University of Technology and Education Ho Chi Minh City Vietnam2Faculty of Engineering and Technology Nong Lam University Ho Chi Minh City Vietnam
Correspondence should be addressed to Hay Nguyen nghayhcmuafeduvn
Received 25 July 2019 Revised 23 September 2019 Accepted 8 October 2019 Published 3 November 2019
Academic Editor Vera Lavelli
Copyright copy 2019 Xuan-Quang Nguyen et al is is an open access article distributed under the Creative Commons AttributionLicense which permits unrestricted use distribution and reproduction in any medium provided the original work is properly cited
In this study drying kinetics including thermal andmoisture of Codonopsis javanicawith the support of ultrasonic technology inthe drying process were investigated Experimental processes were carried out at drying air temperatures of 40degC 45degC and 50degCwith and without ultrasound at a frequency of 20 kHz and three levels of intensity 13 kWm2 18 kWm2 and 22 kWm2 Basedon theoretical calculations experimental data and the particle swarm optimization (PSO) algorithm the coecient of thermaldiusion was determined in the range of 101ndash136times10minus 7m2s and the coecient of moisture diusion is in the range of32ndash67times10minus 10m2s In addition the color parameters (Llowast alowast and blowast) of the drying materials were also considered Resultsshowed the overall color dierences (∆E) of dried products change in the range of 80ndash129 compared with the fresh ones In thiswork the multiple boundary conditions were considered to determine the moisture and thermal diusion coecients the resultsobtained prove that the quality of dried products in terms of color change is also improved
1 Introduction
Codonopsis javanica is an agricultural product of higheconomic value in Vietnam used for food and medicine Soits moisture content reduction is necessary for preservationC javanica is a heat-sensitive material therefore drying airtemperature and drying time aect the nutrient composi-tion herbal medicine and product color
Ultrasound-assisted drying is a high-energy mechanicalwave (its frequencies range between 18 kHz and 100 kHz[1 2]) and considered a hybrid drying technique to reducedrying time save energy and maintain the nutrient com-position of the products [3] e energy of ultrasound re-duces the internal and external resistances to moisturetransfer in the material In addition microstreaming at thesurface of the drying material caused by ultrasound de-creases the diusion boundary layer and enhances dryingkinetics and diusivity [4] is aects the drying kinetics ofthe material whose characteristic quantity is the eective
diusion coecient (De) With no external resistance fac-tors the eective diusion coecient was calculated fromthe diusion equation based on Fickrsquos second law [4] As-suming that deformation of objects during drying is neg-ligible using the initial conditions and the reasonableconstraints Crank [5] determined the solutions of thediusion equations in dierent geometrical conditionsApplying Fickrsquos second law and Crankrsquos results the re-searchers determined the moisture diusion coecients oforange peel [6] salted cod [7] honeysuckle [8] and appleslabs [9] Considering the external resistance factors theconditions of moisture exchange at the surface of the dryingmaterials and drying air are investigated and the eectivediusion coecient (De) and moisture transfer coecients(hm) at the surface would be determined simultaneouslyPrevious studies [6 10ndash12] accomplished this by combiningtheoretical calculations experimental data and the optimalalgorithm with the appropriate objective function to sectndparameters of orange apple strawberry and passion fruit
HindawiJournal of Food QualityVolume 2019 Article ID 2623404 13 pageshttpsdoiorg10115520192623404
peel Rodrıguez et al suggested a heat and mass transfermodel and solved the optimization problem to obtain thethermal and mass transfer coefficients for thyme leaves [13]e differences of the moisture content of materials betweenthe experimental data and theoretical calculations whenconsidering external resistance factors are less than thedifferences of those when no external resistance factors apply[6 12] It can be seen that in order to reduce the error of thecalculated and experimental moisture content in dryingprocesses with the support of ultrasound one shouldconsider the external resistance factors In this papertherefore the well-known PSO algorithm is employed todetermine the appropriate parameters related to the dryingkinetics
When Bantle et al used ultrasound-assisted drying thetemperature in salt fish was higher than 5degC compared withdrying without ultrasound [14 15] When drying wassupported by ultrasound the temperature at the surface ofapples was higher from 10degC to 15degC [16] Evidently ul-trasound-assisted drying affects not only moisture diffusionbut also thermal diffusion in drying materials heat andmoisture transfer between drying materials and drying air
Musielak et al published a review of research on ul-trasound-assisted drying [1] influencing many scholars toperform testing on a variety of agricultural products andfoods ese studies focus mostly on moisture diffusivityanalysis of drying kinetics We realized that studying Cjavanica has not yet been done and the study of moistureand thermal diffusion using the multiple parameters con-sidered at the boundary conditions is still limited In thepresent study therefore moisture and thermal diffusioncoefficients were determined and a comparison of colorchange of the products with ultrasound was performed
2 Materials and Methods
21 Materials Fresh four-year-old C javanica sampleswere cultivated in Lam Dong province Vietnam eiraverage diameters were approximately 20ndash25mm Afterharvesting they were stored in refrigerator conditions at5degC Before conducting the experiments they were slicedto a thickness of 5 plusmn 05 mm e initial temperature was25ndash27degC and the initial moisture content was 64ndash77 (kgWkg DM (dry matter)) e moisture content of thesamples was determined by using a moisture analyzer(DBS 60-3)
22 Drying Experiments and Procedures e experimentsystem consisted of a heat pump dryer integrated with anultrasonic transducer in the drying chamber (Figure 1(a))e drying air was created by the dryer system with atemperature range of 28ndash50degC relative humidity between12ndash58 and air velocity from 01 to 25ms High-energyultrasound was emitted from a transmitter which was de-veloped previously [17] its frequency and intensity were20plusmn 073 kHz and in the range of 0ndash30 kWm2 respectivelye samples were weighed online with respect to time by anelectronic weight scale (GX-200) with an accuracy of
plusmn0001 g e temperature of the drying air and samples wasmeasured by sensors (Fluke 5622-10-s) with an accuracy ofplusmn009degC and 1mm diameter e system and material pa-rameters were updated and stored automatically in acomputer
221 Experimental Procedures to Determine the UltrasonicAbsorption Coefficient of C javanica Material slices with5mm thickness and 25mm diameter were placed on the trayat the distance of 85mm to the emitter Two temperaturesensors were used for each slice (a sensor in the center (pointB) the other was close to the surface inside the material(point A) Figure 1(b)) To determine the temperature dif-ferences in the drying material with and without ultrasound(i) the material was placed in the drying chamber(Figure 1(a)) the temperature in the chamber was main-tained at 40degC and the ultrasound was emitted continuously(ii) After approximately 60 minutes when the systemreached a steady state the ultrasound was turned off for 10minutes thereafter the ultrasound was emitted every 5minutes and the data were recorded at the beginning andthe end of the cycle e experiments were repeated threetimes per sample
222 Experimental Procedures to Determine Drying Kineticsof C javanica Each batch of drying consisted of 100 gmaterials e original colors of fresh materials were mea-sured before putting them on the sample tray Twelve cases(cases 1ndash12) were investigated corresponding to 12 differentexperimental conditions where temperatures were 40degC45degC and 50degC with an accuracy of plusmn05degC the air velocitywas fixed at 05ms with and without the support of ul-trasound at three levels of intensity Iu1 13 kWm2Iu2 18 kWm2 and Iu3 22 kWm2 e experiment wasterminated when the moisture content of the materialreached an equilibrium state Each test case was repeatedthree times the final data were averaged of the three rep-etitionse weight and temperature at points A and B of thedried samples were updated and stored automatically in acomputer at a sampling time of 10 minutes To minimize theerror in each sample the ultrasonic sound was stopped andthe air was not blown into the drying chamber for 10seconds
23 Modeling e thickness of the material was lowcompared with its diameter thus it is reasonable to assumethat heat and moisture transfer is only considered in thethickness direction (z-axis)emathematical model used tocalculate the drying process was the one-dimensionalFourierrsquos law of heat which is described by the followingequation
zt
zτ αt
z2t
zz2(1)
Moisture transfer in the drying material is also describedby the following diffusion equation [6 7 11 12]
2 Journal of Food Quality
zM
zτ De
z2M
zz2 (2)
where τ time (s) z coordinate (m) M moisture content ofmaterials (kg Wkg DM) t temperature (degC) at thermaldiusivity (m2s) andDe eectivemoisture diusivity (m2s)
e initial conditions of temperature and moisture(τ 0) of the drying material were uniform (equation (3))heat and moisture transfer at both sides of the material wasidentical (geometric symmetry) (equation (4))
τ 0 t(z 0) t0 M(z 0) M0 (3)
z 0 τ ne 0zt(0 τ)
zz 0
zM(0 τ)zz
0 (4)
Assuming that the heat ordfux absorbed into the materialincluded the convective heat transfer from the drying air andthe dierence between the absorption heat by the ultrasoundand the evaporation heat e boundary conditions of theconvective heat transfer at the surface of the drying materialwith the support of ultrasound were determined by thefollowing equation
z δ τ gt 0 minus kpzt(δ τ)
zz ht ta minus t(δ τ)[ ] + μuIu
minus DeρshfgzM(δ τ)
zz
(5)
To consider the eect of ultrasound on convectivemoisture transfer at the surface of the drying material the
boundary conditions (equation (6)) were used to solve theequations of moisture transfer [6 11 12]
z δ τ gt 0 minus DeρszM(δ τ)
zz hm φe(δ t) minus φa[ ] (6)
where hm convective moisture transfer coecient (kgm2s)hfg latent heat of vaporization (Jkg) φe water activity (aw)at the surface of the dryingmaterial (0ndash1) φa moisture of thedrying air (0ndash1) ht convective heat transfer coecient at thesurface of the drying material (Wm2 K) ta temperature ofthe drying air (degC) ρs and ρp density of the dry solid and thematerial (kgm3) kp thermal conductivity of the material(Wm K) microu ultrasonic absorption coecient and Iu ul-trasound intensity (kWm2)
24 Determination of Moisture Content e moisturecontent of the material (dry basis) was determined by thefollowing equation
M mt minus ms
ms (7)
where M moisture content mt weight of the material andms weight of the dry solid
25 Determination of Ultrasonic Absorption Coecient ofMaterial When the ultrasound propagates a material partof its energy is absorbed by the material and converted intothermal energy increasing the temperature of the material[16] To evaluate the absorbing capability of the material for
PID
17PLC
13
1612
9
10
8
11
6
53 12
4
1
32
15
7
14
(a)
ta va rha
L=
000
85m
Material
z2δ
AB
tB tA
Ultrasonic radiator
Tray
(b)
Figure 1 e experiment setup of the drying process (a) e drying system using a heat pump method and ultrasound (b)e position ofthe material in the drying chamber and its two points of temperature measurement (A and B) (1) Drying fan (2) evaporator (31) (32)condenser (4) compressor (5) auxiliary air heater (6) temperature and humidity sensors (7) valve (8) ultrasonic transducer (9) (11) traysfor samples (10) drying chamber with ultrasound (12) drying chamber without ultrasound (13) high-power ultrasonic generator (14) (15)electronic weight scale (16) unit controller (17) computer
Journal of Food Quality 3
ultrasonic energy the parameter μu is presented [16] In thisstudy assuming that the energy absorbed by the materialfrom the ultrasound is converted into thermal energy weapplied the law of energy conservation to derive the pa-rameter μu in the following equation
μu 2δρpcpΔtavΔτIu
(8)
where ∆tav is the average increased temperature in the periodof time ∆τ which is calculated in the following equation
Δtav ΔtA + ΔtB
2 (9)
where ∆tA and ∆tB are the temperature differences in thedrying material with and without ultrasound at points A andB respectively
It can be considered that the components of C jav-anica are similar to Korean Ginseng Hence heat capacityand density of this material can be determined fromKorean Ginseng which are cp 2605492 Jkg K andρp 13616 kgm3 respectively [18]
26 Determination of Equilibrium Moisture Content ofMaterial At certain conditions of temperature and wateractivity (aw) after a period of time the moisture in thematerial reaches an equilibrium state (Me) (a necessaryparameter to calculate the diffusion coefficient) e staticgravimetric method using a saturated salt solution wasapplied to determine the equilibrium moisture content in Cjavanica samples e experiments were carried out at threelevels of temperature 30degC 45degC and 50degC and 21 levels ofwater activity from 0111 to 0923 created by seven types ofsalts lithium chloride potassium fluoride magnesiumchloride sodium bromide potassium chloride sodiumchloride and potassium nitrate [11 19] e mathematicalmodels proposed by Henderson ChungndashPfost Halsey [19]and Oswin [18] were adopted to predict the equilibriummoisture content of C javanica e nonlinear regressionmethod was used to obtain the parameters of the regressionequations e suitable model was chosen based on somecriteria of coefficient of determination (R2) root meansquare error (RMSE) and mean relative percentage error(MRE)
27 Determination of Drying Kinetics To study thermal andmoisture diffusion of the materials all parameters inequations (1) and (2) must be determined e parameterswith the physical thermal property kp ρp and ρs can beobtained from experiments However ht and hm values aredifficult to determine for the effects of ultrasound and os-cillation of gas molecules around the drying material withthe properties being in flux In addition when consideringthe external resistance effect and support of ultrasoundmore parameters are needed In this study theoreticalcalculations together with the experimental results and theparticle swarm optimization (PSO) algorithm were utilizedto determine necessary parameters including thermal
diffusivity (αt) effective moisture diffusivity (De) convectiveheat and moisture transfer coefficients (ht and hm)
Heat and moisture transfer equations (equations (1) and(2)) were solved by the explicit finite difference approxi-mation method with a number of nodes with respect tothickness direction (N 15) Equation (10) shows the size ofa step distance equation (11) shows the size of a step time
Δz 2δ
N minus 1 (10)
Δτ 04[2δN minus 1]2
αt (11)
e average moisture and temperature of the volume atthe time (m) were determined by the following equations
Mmav
(Δz2)Mm1 + 1113936
(Nminus 3)2i2 ΔzMm
i +(Δz2)Mm(Nminus 1)2
(Δz2)[N minus 1]
(12)
tmav
(Δz2)tm1 + 1113936
(Nminus 3)2i2 Δztm
i +(Δz2)tm(Nminus 1)2
(Δz2)[N minus 1] (13)
e search algorithm would determine the values of Deαt hm and ht in the predefined constraints Differentialequations (1) and (2) which are subject to the initial andboundary conditions (equations (3)ndash(6)) were solved todetermine the moisture and temperature profile in thematerial e average moisture in the volume of the dryingmaterial (Mav) and the average temperature of the dryingmaterial (tav) were determined as well (equations (12) and(13)) e objective function equation (16) is defined as thedifferences between theoretical calculations and experi-mental data of moisture and temperature of the dryingmateriale algorithmwould determine the values ofDe αthm and ht and their constraints to minimize the objectivefunction equation (17) is algorithm is illustrated inFigure 2
e PSO algorithm was used in this study as the searchalgorithm its multi-objective optimization technique giveshigh-precision results for linear and nonlinear models [20]Its concept is based on the behavior of looking for foodswithin a swarm [21] Each particle has a position in thesearch space that represents a parameter value and a velocityvector used to update a new positione particles start withrandom values in a predefined space and are modified to findthe best variation At each step all particles are updated withthe best two solution values Pbest personal best position sofar and Gbest global best position up to now e positionand velocity of each particle are accelerated toward theglobal best and its own personal best based on the followingequations [21]
vi(m + 1) ωvi(m + 1) + c1w1 xPbestminus xi(m)1113960 1113961
+ c2w2 xGbestminus xi(m)1113960 1113961
(14)
xi(m + 1) xi(m) + vi(m + 1) (15)
4 Journal of Food Quality
e objective equations (16) and (17) are defined as
MREi αMREMi +(1 minus α)MREti (16)
Min MREi1113864 1113865 (17)
where MRE (mean relative percentage error) is the relativedifference between the values of calculations and experimentaldata e MREMi is MRE of moisture content MREti is MREof temperature and α is a weight (0-1) in this study α 05
A calculation program based on the PSO algorithm andother programs were performed by MATLAB 2015
28 Color Change of the Drying Products e product coloris the quality evaluation criteria for dried ginseng roots [22]the CIE Lab color parameters (Llowast alowast and blowast) were adopted
to describe color change during our drying process evalues of Llowast alowast and blowast were measured by the color mea-surement machine from X-Rite Inc Grand Rapids MI(RM200) e data validity was confirmed by taking theaverage of three repeated measurements e color changeindex (∆E) was calculated by using the color parameters ofthe dried product as described by the following equation[23]
ΔE
Llowast minus Llowastref( 11138572
+ alowast minus alowastref1113872 11138732
+ blowast minus blowastref( 11138572
1113970
(18)
where Llowastref alowastref and blowastref are the standard values and in thisstudy were values of the fresh material (before drying)
29 Statistical Analysis To evaluate the fitness of themathematical model these following equations (19)ndash(21)
Start
Set the constraints for De αt hm ht
Set the physical parameters of the materialSet the initial conditions of the material theair temperature and the ultrasound
Set the number of particles and the iteration k
(i)(ii)
(iii)
(iv)
Initialize the random values of De αt hm ht
Calculate the average moisture and temperature Mav tav
Solve the moisture and heat transfer equations withpredefined constraints to obtain the nodes oftemperature and moisture of the material
(i)
(ii)
Evaluate the objective function and update MREThe experimental data
moisture and temperatureof the drying material
Obtain the best parameters ofDe αt hm ht
End
Update position andvelocity of the particles
(update Pbest Gbest)
Iteration = k orMRE = 0001
N
Y
Figure 2 Flowchart for determining the values of De αt hm and ht
Journal of Food Quality 5
including R2 (coefficient of determination) RMSE (rootmean square error) and MRE (mean relative percentageerror) were considered [19]
R2
1 minus1113936
Ni1 yexp i minus yprei1113872 1113873
2
1113936Ni1 yexp i minus yav1113872 1113873
2 (19)
RMSE
1N
1113944
N
i1yexp i minus yprei1113872 1113873
2
11139741113972
(20)
MRE 1001113936
Ni1(|yexp i minus yprei|)yexp i
N (21)
where yexpi yprei yav and N are the measured data from theexperiment the predicted values the average experimentalvalues and the number of experiments respectively
Experiments were conducted in triplicate All valueswere obtained in the averageplusmn standard deviation (n 3)
Regression analysis was performed by statistical softwareSAS 91
3 Results and Discussion
31 Ae Ultrasonic Absorption Coefficient of C javanicaFigure 3 shows the average temperature of C javanica withand without ultrasound e temperature difference at thepoint A (∆tA) point B (∆tB) and the average temperaturedifference of the material (∆tav) with and without ultrasoundare the average values of three repetitions e standarderrors in Figure 3 are relatively small indicating good re-peatability of experiments e experimental results are il-lustrated in Table 1
Figure 3 shows that the temperature inside the dryingmaterial when using ultrasound was higher than the tem-perature without ultrasound e increased temperatures atthe alternate positions of the drying material are differente increased temperature (∆t) in the presence of ultra-sound calculated by equation (9) is the average valuemeasured at points A and B Here the ultrasound intensity isin the range of 13ndash22 kWm2 and the values of ∆t arehigher without ultrasound which are from 06 to 15degCLinear regression analysis was performed by using thesoftware SAS 91 with the data from Table 1 giving an ul-trasonic absorption coefficient (μu) of C javanica of 1192(R2 098)
32 Ae Equilibrium Moisture Content of C javanicaFrom the experimental data at three levels of temperature30degC 40degC and 50degC the nonlinear regression analysisdetermined the relationship between the equilibriummoisture content of C javanica the temperature and wateractivity Among the four chosen mathematical models themodified ChungndashPfost model showed the worst indices theleast coefficient of determination (R2 095) the largestvalues of RMSE (013) and MRE (1471) In contrastthe Oswin model gave the best values of R2 099
RMSE 0001 andMRE 122e experimental data andpredictions from the Oswin model (equation (22)) areshown in Figure 4
Me (0120438 minus 00005t)aw
1 minus aw1113890 1113891
(04+0001958t)
(22)
Equation (22) was chosen to calculate the water activityof C javanica and was applied at the boundary conditions(equation (6)) when solving the equations (1) and (2) of heatand moisture transfer
33 Drying Kinetics of C javanica
331 Experimental Drying Data Experiments were carriedout at three levels of temperature with and without ultra-sound at three different values of intensity e weight andtemperature at points A and B are updated and stored on acomputer with respect to drying time e moisture contentof C javanica was calculated using equation (7) e averagetemperature at a certain time is the average temperaturemeasured at points A and B at that time e drying curve(moisture of the drying material) and temperature inside thesample of 12 different experiments along with the standarderror bars are illustrated in Figures 5ndash7 and show that the
0 20 40 60 80 10015
20
25
30
35
40
45
Time (min)
Tem
pera
ture
(degC)
ta0kWm2
18kWm2
Figure 3 e average temperature (averageplusmn SD n 3) of thedrying material at the conditions ta 40degC va 05msφa 22ndash23 ultrasonic intensity Iu 18 kWm2
Table 1e difference temperatures (averageplusmn SD n 3) with andwithout ultrasound for 5 minutes
Cases Ultrasound intensity(kWm2)
Difference temperature (degC)∆tA ∆tB ∆tav
1 13 08plusmn 0014 04plusmn 0014 06plusmn 00302 18 14plusmn 0066 09plusmn 0008 12plusmn 00223 22 19plusmn 0113 11plusmn 0084 15plusmn 0080
6 Journal of Food Quality
experiment had good repeatability as indicated by the lowvalues of the standard error
To prove the eectiveness of the ultrasound during thedrying process the drying time to reduce the moisture (∆τ)of C javanica from 70 to 044 (kg Wkg DM) and theincreased temperature for the sectrst 30 minutes (∆t) with andwithout ultrasound are considered e experimental dataare shown in Table 2
e experimental data show that with the support ofultrasound the drying time decreases especially at thehigher ultrasound intensityWhen air temperature was 45degCand the highest intensity was used (22 kWm2) the dryingtime reduces up to 45 compared with no ultrasoundHowever higher air temperature is less eective with ul-trasound on the drying time such as at 50degC the drying timeis reduced to 28 at the highest intensity compared withwithout ultrasound use
In addition based on the experimental data we con-cluded that when using ultrasound the temperature in thedrying material increased faster Considering the air tem-perature at 40degC in the sectrst 30 minutes the temperature inthe drying material increased by 07degC without ultrasoundand by 14degC 16degC and 28degC with ultrasound at intensitiesof 13 kWm2 18 kWm2 and 22 kWm2 respectivelyMoreover part of the energy was absorbed and convertedinto thermal energy making the temperature in the dryingmaterial greater than the temperature of the air 06ndash21degC
332 Parameters of Drying Kinetics Based on the theo-retical calculations the experimental data and the PSOalgorithm the four parameters (De at hm and ht) related tothe drying kinetics of C javanica were obtained Figure 8shows a typical result of the average moisture content andthe average temperature of the drying material at the airtemperature of 45degC and intensity of 18 kWm2 e resultsof 12 cases including moisture and thermal diusivity
convective heat and moisture transfer coecient at thesurface of thematerial and the value of the objective function(MRE index) are shown in Table 3
Table 3 shows that the average dierences (MRE) be-tween the calculations of equations (12) and (13) and theexperiments are from 22 to 68 erefore the pa-rameters of the drying kinetics can be accepted as stated inthe literature [19] (the MRE value must be less than 10)
(1) e Eects of the Ultrasound on the Eective MoistureDiusivity and Convective Moisture Transfer at the Surface ofthe Material Table 3 shows that De and hm values depend onthe air temperature and the intensity of ultrasound highervalues of temperature and intensity results in higher valuesof De and hm In the air temperature range 40ndash50degC and theultrasound intensity of 0 to 22 kWm2 (0ndash100W) the Deand hm values are from 32times10minus 10 to 67times10minus 10m2s and23times10minus 3 to 41times 10minus 3 kgm2s respectively e values ofDein this study are in the range of the eective moisturediusivity of food between 10minus 11 and 10minus 9m2s as stated in[11] Also similar to previously stated orange peel [6] valuesDe is between 088times10minus 9 and 172times10minus 9m2s and hm isbetween 117times10minus 3 and 243times10minus 3 kgm2s at an air tem-perature and moisture of 40degC and 265 respectively thepower of the ultrasound was in the range 0ndash90W Other likeexamples include values of De between 014times10minus 10 and074times10minus 10m2s for salted codsectsh [7] and between0763times10minus 10 and 2293times10minus 10m2s for strawberries [11] evalues of hm for strawberries are also between 1380times10minus 5 and3387times10minus 5 kgm2s at the air temperature of 40ndash70degC and withan ultrasound power between 0 and 60W [11]
In this study with use of ultrasound the increase inDe isinversely proportional to the air temperature (25ndash75 at40degC 26ndash64 at 45degC and 18ndash28 at 50degC)is is similar tohm (22ndash56 at 40degC 12ndash37 at 45degC and 11ndash26 at 50degC)erefore we concluded that the ultrasound has a profoundeect on the eective moisture diusivity in the dryingmaterial and convective moisture transfer at surface of thematerial at lower air temperature ese eects decrease asthe air temperature increases
A nonlinear model was proposed by Rodrıguez et al [4]as in equations (23) and (24) for eective moisture diusivityand external mass transfer coecients respectively
De d1eminus d2 27315+ta( )( )minus d3Pminus d4P 27315+ta( )2( )+d5 27315+ta( )( )
(23)
hm h1 minush2
27315 + ta( )minus h3P
minush4P
27315 + ta( )2+
h527315 + ta( )
(24)
In this study a nonlinear model was developed based onequations (23) and (24) and nonlinear regression analysis inthe form of a second-order function e relationshipsbetween the identisected parameters (De hm the air temper-ature and the ultrasound intensity) are shown in Figure 9and in the following equations
01 02 03 04 05 06 07 08 09 10
005
01
015
02
025
03
035
aw
Me (
kg W
kg
DM
)
exp 40degCexp 50degC
preexp 30degC
Figure 4 Experimental (exp) (averageplusmn SD n 3) and predicted(pre) moisture content of C javanica at 30degC 40degC and 50degC
Journal of Food Quality 7
De 305 times 10minus 4e minus 428696 27315+ta( )( )+2202967Iuminus 212275Iu 27315+ta( )2( )+244188I2u 27315+ta( )minus 3710120I2u 27315+ta( )2( )minus 4004I2u( ) (25)
where R2 099 RMSE 0010 and MRE 096
0 05 1 15 2 25times104
0
1
2
3
4
5
6
7
8
Drying time (s)
Moi
sture
cont
ent (
kg W
kg
DM
)
40 degC0kWm2
13kWm218kWm2
22kWm2
(a)
times1040 05 1 15 2 25
15
20
25
30
35
40
45
50
Drying time (s)
Tem
pera
ture
(degC)
40 degC0kWm2
13kWm218kWm2
22kWm2
(b)
Figure 5 Drying kinetics at drying air parameters 40degC 05ms and 20ndash23 air relative humidity (a) Drying curves (b) increasingtemperatures (averageplusmn SD n 3)
times1040 05 1 15 2 25
0
1
2
3
4
5
6
7
8
Drying time (s)
Moi
sture
cont
ent (
kg W
kg
DM
)
45 degC0kWm2
13kWm218kWm2
22kWm2
(a)
times1040 05 1 15 2 25
15
20
25
30
35
40
45
50
Drying time (s)
Tem
pera
ture
(degC)
45 degC0kWm2
13kWm218kWm2
22kWm2
(b)
Figure 6 Drying kinetics at drying air parameters 45degC 05ms and 18ndash20 air relative humidity (a) Drying curves (b) increasingtemperatures (averageplusmn SD n 3)
8 Journal of Food Quality
times1040 05 1 15 2 25
0
1
2
3
4
5
6
7
8
Drying time (s)
Moi
sture
cont
ent (
kg W
kg
DM
)
50 degC0kWm2
13kWm218kWm2
22kWm2
(a)
times1040 05 1 15 2 25
15
20
25
30
35
40
45
50
Drying time (s)
Tem
pera
ture
(degC)
50 degC0kWm2
13kWm218kWm2
22kWm2
(b)
Figure 7 Drying kinetics at drying air parameters 50degC 05ms and 15ndash17 air relative humidity (a) Drying curves (b) increasingtemperatures (averageplusmn SD n 3)
Table 2 e drying time of Codonopsis javanica with and without the ultrasound
Cases Ultrasound intensity Iu (kWm2) Air temperature ta (degC) Drying time τ (s) e reduced drying time ∆τ ()1 0
40
23900 mdash2 13 19000 203 17 16700 304 22 14000 415 0
45
21900 mdash6 13 16500 257 18 13800 378 22 12100 459 0
50
16700 mdash10 13 12900 2311 18 12600 2412 22 12000 28
Table 3 Parameters (De at hm and ht) of Codonopsis javanica at dierent conditions
Cases Iu (kWm2) ta (degC) Detimes 10minus 10 (m2s) αttimes 10minus 7 (m2s) hmtimes 10minus 3 (kgm2s) ht (Wm2K) MRE ()1 0
40
32 101 23 292 332 13 4 113 28 398 313 18 46 127 32 488 344 22 56 132 38 601 685 0
45
39 116 29 307 306 13 49 130 32 407 277 18 57 135 36 512 298 22 64 137 40 624 449 0
50
49 127 34 332 2710 13 59 135 36 416 2211 18 64 137 39 536 5212 22 67 138 41 636 26
Journal of Food Quality 9
hm 0010032 minus041659ta
minus 00031Iu minus53856Iu
t2a
+0256727Iu
ta+0515849I2u
t2a+4285627
t2a
(26)
where R2 099 RMSE 0008 and MRE 063
(2) e Eects of the Ultrasound on the ermal Diusivity(αt) and Convective Heat Transfer Coecients (ht) at theSurface of the Drying Material e ultrasound propagatingthrough the air aects the temperature kinetics of the dryingmaterial via the parameters αt and ht According to theexperimental results shown in Table 3 the values of αt and htare in the range of 101times 10minus 7 and 138times10minus 7m2s and 292
times1040 05 1 15 2 25
0
1
2
3
4
5
6
7
8
Time (s)
Moi
sture
cont
ent (
kg W
kg
DM
)
45 degC 18kWm2
CalculationExperiment
(a)
times1040 05 1 15 2 25
0
5
10
15
20
25
30
35
40
45
50
55
Time (s)
Tem
pera
ture
(degC)
45 degC 18kWm2
CalculationExperiment
(b)
Figure 8 Calculation and experiment drying curves and temperature curves of Codonopsis javanica at 45degC air temperature and 18 kWm2
intensity (a) change of moisture content (b) temperature inside the sample
35 40 45 50 5525
3
35
4
45
5
55
6
65
7
75
times10ndash10
Temperature (degC)
De (
m2 s
)
PreExp 0kWm2
Exp 13kWm2
Exp 18kWm2
Exp 22kWm2
(a)
35 40 45 50 551
15
2
25
3
35
4
45
5times10ndash3
Temperature (degC)
h m (k
g W
m2 s)
PreExp 0kWm2
Exp 13kWm2
Exp 18kWm2
Exp 22kWm2
(b)
Figure 9 Inordfuence of temperature on eective moisture diusivity and convective moisture transfer coecient at dierent ultrasoundintensities (a) the moisture diusion coecients and (b) the external moisture transfer coecients of Codonopsis javanica
10 Journal of Food Quality
and 636Wm2 K respectively In another research withother drying materials the ht of salted codsectsh is between210 and 275Wm2 K [14] αt and ht of potato are131 times 10minus 7 m2s and 25ndash250Wm2 K respectively [24]
Based on Table 3 data the relationships between αt htthe air temperature and ultrasound intensity are illustratedin Figure 10 and in the following equations
αt 1014 times 10minus 7 +6553 times 10minus 6
taminus 653 times 10minus 8Iu
minus13 times 10minus 4Iu
t2a+6242 times 10minus 6Iu
ta+
17 times 10minus 5I2ut2a
minus26 times 10minus 4
t2aminus 716 times 10minus 9I2u
(27)
where R2 098 RMSE 0013 and MRE 097
ht 5664 + 220ta minus3454Iu
+4taI2uminus563taIu
withU
1303 + 04ta withNU
(28)
where with ultrasound-assisted (with U) R2 099RMSE 0010 and MRE 083 Without ultrasound-assisted (with NU) Iu 0 kWm2 R2 097 RMSE 0020and MRE 091
34 Color Change of C javanica e color parameters of theproducts at the dierent drying conditions were measuredand shown in Table 4
Table 4 shows that when air temperature increases thevalue of Llowast (lightness) decreases but the values of alowast(rednessgreenness) and blowast (yellownessblueness) increase
35 40 45 50 5509
1
11
12
13
14
15times10-7
Temperature (degC)
a t (m
2 s)
PreExp 0kWm2
Exp 13kWm2
Exp 18kWm2
Exp 22kWm2
(a)
35 40 45 50 5510
20
30
40
50
60
70
Temperature (degC)
h t (W
m2 s)
PreExp 0kWm2
Exp 13kWm2
Exp 18kWm2
Exp 22kWm2
(b)
Figure 10 Inordfuence of temperature on the thermal diusivity and convective heat transfer coecients (a) the thermal diusion coecientsand (b) the heat transfer coecients of Codonopsis javanica
Table 4 Color of the dried Codonopsis javanica (averageplusmn SD n 3)
Cases Iu (kWm2) ta (degC) Llowast alowast blowast ΔEMaterial 718plusmn 226 2plusmn 005 316plusmn 1311 0
40
792plusmn 108 27plusmn 013 214plusmn 069 126plusmn 0422 13 786plusmn 107 33plusmn 006 239plusmn 057 104plusmn 0203 18 785plusmn 142 34plusmn 004 255plusmn 039 92plusmn 0114 22 768plusmn 112 42plusmn 011 225plusmn 036 106plusmn 0325 0
45
751plusmn 146 58plusmn 010 216plusmn 050 112plusmn 0236 13 784plusmn 131 45plusmn 010 262plusmn 043 88plusmn 0187 18 782plusmn 666 54plusmn 019 273plusmn 245 84plusmn 0828 22 726plusmn 193 59plusmn 019 237plusmn 131 88plusmn 0569 0
50
596plusmn 174 61plusmn 018 308plusmn 074 129plusmn 01910 13 616plusmn 097 61plusmn 013 308plusmn 075 110plusmn 01811 18 616plusmn 113 68plusmn 062 331plusmn 076 114plusmn 02412 22 601plusmn 22 71plusmn 030 328plusmn 096 128plusmn 051
Journal of Food Quality 11
proportionally along with the ultrasound intensity at issimilar to the results reported by Wei et al for AmericanGinseng [22] e value of ∆E changes of C javanica isbetween 112 and 129 without ultrasound and between 84and 128 with ultrasound at the intensity of 13ndash22 kWm2We concluded that the color of the dried samples changesslightly compared with the fresh samples when using theultrasound-assisted drying process is can be explained asusing ultrasound makes drying times shorter causing lessinfluence on the color of the product
4 Conclusions
e thermal diffusion and moisture diffusion coefficients of Cjavanica at air temperature 40ndash50degC with and without ultra-sound at the intensity of 13ndash22 kWm2 were investigated inthis study e results show that the values of thermal andmoisture diffusivity are in the range of 101ndash138times10minus 7m2sand 32ndash67times10minus 10m2s respectively e convective heat andmoisture transfer coefficients at the surface of the dryingmaterial were between 23times10minus 3ndash41times 10minus 3 kgm2s and292ndash636Wm2 K respectively In this study the overall colordifferences considered the effectiveness of ultrasound as a wayto preserve the quality of the product
Data Availability
e data used to support the findings of this study are in-cluded within the article and are available from the corre-sponding author upon request
Conflicts of Interest
e authors declare they have no conflicts of interest in thisstudy
Acknowledgments
e authors thank Nong Lam University Ho Chi Minh Cityand Ho Chi Minh City University of Technology and Ed-ucation for supporting this study
References
[1] G Musielak D Mierzwa and J Kroehnke ldquoFood dryingenhancement by ultrasoundmdasha reviewrdquo Trends in Food Sci-ence amp Technology vol 56 pp 126ndash141 2016
[2] P Li and Z Chen ldquoExperiment study on porous fiber dryingenhancement with application of power ultrasoundfiberdrying enhancement with application of power ultrasoundrdquoApplied Acoustics vol 127 pp 169ndash174 2017
[3] R M S C Morais A M M B Morais I Dammak et alldquoFunctional dehydrated foods for health preservationrdquoJournal of Food Quality vol 2018 Article ID 173963629 pages 2018
[4] O Rodrıguez J V Santacatalina S Simal J V Garcia-PerezA Femenia and C Rossello ldquoInfluence of power ultrasoundapplication on drying kinetics of apple and its antioxidant andmicrostructural propertiesrdquo Journal of Food Engineeringvol 129 pp 21ndash29 2014
[5] J Crank Ae Mathematics of Diffusion Clarendon PressOxford UK 2nd edition 1975
[6] J V Garcia-Perez C Ortuntildeo A Puig J A Carcel andI Perez-Munuera ldquoEnhancement of water transport andmicrostructural changes induced by high-intensity ultrasoundapplication on orange peel dryingrdquo Food and BioprocessTechnology vol 5 no 6 pp 2256ndash2265 2012
[7] C Ozuna J A Carcel P M Walde and J V Garcia-PerezldquoLow-temperature drying of salted cod (Gadus morhua)assisted by high power ultrasound kinetics and physicalpropertiesrdquo Innovative Food Science amp Emerging Technologiesvol 23 pp 146ndash155 2014
[8] Y Liu Y Sun S Miao F Li and D Luo ldquoDrying charac-teristics of ultrasound assisted hot air drying of Flos loni-ceraerdquo Journal of Food Science and Technology vol 52 no 8pp 4955ndash4964 2015
[9] J V Santacatalina O Rodrıguez S Simal J A CarcelA Mulet and J V Garcıa-Perez ldquoUltrasonically enhancedlow-temperature drying of apple influence on drying kineticsand antioxidant potentialrdquo Journal of Food Engineeringvol 138 pp 35ndash44 2014
[10] C Brines A Mulet J V Garcıa-Perez E Riera andJ A Carcel ldquoInfluence of the ultrasonic power applied onfreeze drying kineticsrdquo Physics Procedia vol 70 pp 850ndash8532015
[11] J Gamboa-Santos A Montilla J A Carcel M Villamiel andJ V Garcia-Perez ldquoAir-borne ultrasound application in theconvective drying of strawberryrdquo Journal of Food Engineeringvol 128 pp 132ndash139 2014
[12] E M G C D Nascimento A Mulet J L R AscheriC W P D Carvalho and J A Carcel ldquoEffects of high-in-tensity ultrasound on drying kinetics and antioxidant prop-erties of passion fruit peelrdquo Journal of Food Engineeringvol 170 pp 108ndash118 2016
[13] J Rodrıguez A Mulet and J Bon ldquoInfluence of high-in-tensity ultrasound on drying kinetics in fixed beds of highporosityrdquo Journal of Food Engineering vol 127 pp 93ndash1022014
[14] M Bantle and J Hanssler ldquoUltrasonic convective dryingkinetics of clipfish during the initial drying periodrdquo DryingTechnology vol 31 no 11 pp 1307ndash1316 2013
[15] M Bantle and T M Eikevik ldquoA study of the energy efficiencyof convective drying systems assisted by ultrasound in theproduction of clipfishrdquo Journal of Cleaner Production vol 65pp 217ndash223 2014
[16] S J Kowalski and A Pawłowski ldquoIntensification of appledrying due to ultrasound enhancementrdquo Journal of FoodEngineering vol 156 pp 1ndash9 2015
[17] P H Tuan N V T Duong and N X Quang ldquoComputa-tional modeling and design of a high-intensity ultrasonictransducer with extensive radiator for food dehydrationrdquo inProceedings of the 2nd International Conference on GreenTechnology and Sustainable Development (GTSD2014) vol 2pp 234ndash239 Ho Chi Minh City Vietnam October 2014
[18] Y J Cho S J Park and C H Lee ldquoLatent heat of Koreanginsengrdquo Journal of Food Engineering vol 30 no 3-4pp 245ndash432 1996
[19] P Yogendrarajah S Samapundo F Devlieghere S De Saegerand B De Meulenaer ldquoMoisture sorption isotherms andthermodynamic properties of whole black peppercorns (Pipernigrum L)rdquo LWTmdashFood Science and Technology vol 64no 1 pp 177ndash188 2015
[20] X Hu and R Eberhart ldquoSolving constrained nonlinear op-timization problems with particle swarm optimizationrdquo in
12 Journal of Food Quality
Proceedings of the Sixth World Multi Conference on SystemicsCybernetics and Informatics pp 203ndash206 Orlando FL USAJuly 2002
[21] D P Rini S M Shamsuddin and S S Yuhaniz ldquoParticleswarm optimization technique system and challengesrdquo In-ternational Journal of Computer Applications vol 14 no 1pp 19ndash27 2011
[22] X H Wei L C Lim S D Wen and G Z Jiang ldquoColorchange kinetics of American ginseng (Panax quinquefolium)slices during air impingement dryingrdquo Drying Technologyvol 32 no 4 pp 418ndash247 2014
[23] A W Deshmukh M N Varma C K Yoo andK L Wasewar ldquoInvestigation of solar drying of ginger(zingiberofficinale) empirical modelling drying characteris-tics and quality studyrdquo Chinese Journal of Engineeringvol 2014 Article ID 305823 7 pages 2014
[24] M M Hussain and I Dincer ldquoAnalysis of two-dimensionalheat andmoisture transfer during drying of spherical objectsrdquoInternational Journal of Energy Research vol 27 no 21pp 703ndash713 2003
Journal of Food Quality 13
Hindawiwwwhindawicom
International Journal of
Volume 2018
Zoology
Hindawiwwwhindawicom Volume 2018
Anatomy Research International
PeptidesInternational Journal of
Hindawiwwwhindawicom Volume 2018
Hindawiwwwhindawicom Volume 2018
Journal of Parasitology Research
GenomicsInternational Journal of
Hindawiwwwhindawicom Volume 2018
Hindawi Publishing Corporation httpwwwhindawicom Volume 2013Hindawiwwwhindawicom
The Scientific World Journal
Volume 2018
Hindawiwwwhindawicom Volume 2018
BioinformaticsAdvances in
Marine BiologyJournal of
Hindawiwwwhindawicom Volume 2018
Hindawiwwwhindawicom Volume 2018
Neuroscience Journal
Hindawiwwwhindawicom Volume 2018
BioMed Research International
Cell BiologyInternational Journal of
Hindawiwwwhindawicom Volume 2018
Hindawiwwwhindawicom Volume 2018
Biochemistry Research International
ArchaeaHindawiwwwhindawicom Volume 2018
Hindawiwwwhindawicom Volume 2018
Genetics Research International
Hindawiwwwhindawicom Volume 2018
Advances in
Virolog y Stem Cells International
Hindawiwwwhindawicom Volume 2018
Hindawiwwwhindawicom Volume 2018
Enzyme Research
Hindawiwwwhindawicom Volume 2018
International Journal of
MicrobiologyHindawiwwwhindawicom
Nucleic AcidsJournal of
Volume 2018
Submit your manuscripts atwwwhindawicom

times1040 05 1 15 2 25
0
1
2
3
4
5
6
7
8
Drying time (s)
Moi
sture
cont
ent (
kg W
kg
DM
)
50 degC0kWm2
13kWm218kWm2
22kWm2
(a)
times1040 05 1 15 2 25
15
20
25
30
35
40
45
50
Drying time (s)
Tem
pera
ture
(degC)
50 degC0kWm2
13kWm218kWm2
22kWm2
(b)
Figure 7 Drying kinetics at drying air parameters 50degC 05ms and 15ndash17 air relative humidity (a) Drying curves (b) increasingtemperatures (averageplusmn SD n 3)
Table 2 e drying time of Codonopsis javanica with and without the ultrasound
Cases Ultrasound intensity Iu (kWm2) Air temperature ta (degC) Drying time τ (s) e reduced drying time ∆τ ()1 0
40
23900 mdash2 13 19000 203 17 16700 304 22 14000 415 0
45
21900 mdash6 13 16500 257 18 13800 378 22 12100 459 0
50
16700 mdash10 13 12900 2311 18 12600 2412 22 12000 28
Table 3 Parameters (De at hm and ht) of Codonopsis javanica at dierent conditions
Cases Iu (kWm2) ta (degC) Detimes 10minus 10 (m2s) αttimes 10minus 7 (m2s) hmtimes 10minus 3 (kgm2s) ht (Wm2K) MRE ()1 0
40
32 101 23 292 332 13 4 113 28 398 313 18 46 127 32 488 344 22 56 132 38 601 685 0
45
39 116 29 307 306 13 49 130 32 407 277 18 57 135 36 512 298 22 64 137 40 624 449 0
50
49 127 34 332 2710 13 59 135 36 416 2211 18 64 137 39 536 5212 22 67 138 41 636 26
Journal of Food Quality 9
hm 0010032 minus041659ta
minus 00031Iu minus53856Iu
t2a
+0256727Iu
ta+0515849I2u
t2a+4285627
t2a
(26)
where R2 099 RMSE 0008 and MRE 063
(2) e Eects of the Ultrasound on the ermal Diusivity(αt) and Convective Heat Transfer Coecients (ht) at theSurface of the Drying Material e ultrasound propagatingthrough the air aects the temperature kinetics of the dryingmaterial via the parameters αt and ht According to theexperimental results shown in Table 3 the values of αt and htare in the range of 101times 10minus 7 and 138times10minus 7m2s and 292
times1040 05 1 15 2 25
0
1
2
3
4
5
6
7
8
Time (s)
Moi
sture
cont
ent (
kg W
kg
DM
)
45 degC 18kWm2
CalculationExperiment
(a)
times1040 05 1 15 2 25
0
5
10
15
20
25
30
35
40
45
50
55
Time (s)
Tem
pera
ture
(degC)
45 degC 18kWm2
CalculationExperiment
(b)
Figure 8 Calculation and experiment drying curves and temperature curves of Codonopsis javanica at 45degC air temperature and 18 kWm2
intensity (a) change of moisture content (b) temperature inside the sample
35 40 45 50 5525
3
35
4
45
5
55
6
65
7
75
times10ndash10
Temperature (degC)
De (
m2 s
)
PreExp 0kWm2
Exp 13kWm2
Exp 18kWm2
Exp 22kWm2
(a)
35 40 45 50 551
15
2
25
3
35
4
45
5times10ndash3
Temperature (degC)
h m (k
g W
m2 s)
PreExp 0kWm2
Exp 13kWm2
Exp 18kWm2
Exp 22kWm2
(b)
Figure 9 Inordfuence of temperature on eective moisture diusivity and convective moisture transfer coecient at dierent ultrasoundintensities (a) the moisture diusion coecients and (b) the external moisture transfer coecients of Codonopsis javanica
10 Journal of Food Quality
and 636Wm2 K respectively In another research withother drying materials the ht of salted codsectsh is between210 and 275Wm2 K [14] αt and ht of potato are131 times 10minus 7 m2s and 25ndash250Wm2 K respectively [24]
Based on Table 3 data the relationships between αt htthe air temperature and ultrasound intensity are illustratedin Figure 10 and in the following equations
αt 1014 times 10minus 7 +6553 times 10minus 6
taminus 653 times 10minus 8Iu
minus13 times 10minus 4Iu
t2a+6242 times 10minus 6Iu
ta+
17 times 10minus 5I2ut2a
minus26 times 10minus 4
t2aminus 716 times 10minus 9I2u
(27)
where R2 098 RMSE 0013 and MRE 097
ht 5664 + 220ta minus3454Iu
+4taI2uminus563taIu
withU
1303 + 04ta withNU
(28)
where with ultrasound-assisted (with U) R2 099RMSE 0010 and MRE 083 Without ultrasound-assisted (with NU) Iu 0 kWm2 R2 097 RMSE 0020and MRE 091
34 Color Change of C javanica e color parameters of theproducts at the dierent drying conditions were measuredand shown in Table 4
Table 4 shows that when air temperature increases thevalue of Llowast (lightness) decreases but the values of alowast(rednessgreenness) and blowast (yellownessblueness) increase
35 40 45 50 5509
1
11
12
13
14
15times10-7
Temperature (degC)
a t (m
2 s)
PreExp 0kWm2
Exp 13kWm2
Exp 18kWm2
Exp 22kWm2
(a)
35 40 45 50 5510
20
30
40
50
60
70
Temperature (degC)
h t (W
m2 s)
PreExp 0kWm2
Exp 13kWm2
Exp 18kWm2
Exp 22kWm2
(b)
Figure 10 Inordfuence of temperature on the thermal diusivity and convective heat transfer coecients (a) the thermal diusion coecientsand (b) the heat transfer coecients of Codonopsis javanica
Table 4 Color of the dried Codonopsis javanica (averageplusmn SD n 3)
Cases Iu (kWm2) ta (degC) Llowast alowast blowast ΔEMaterial 718plusmn 226 2plusmn 005 316plusmn 1311 0
40
792plusmn 108 27plusmn 013 214plusmn 069 126plusmn 0422 13 786plusmn 107 33plusmn 006 239plusmn 057 104plusmn 0203 18 785plusmn 142 34plusmn 004 255plusmn 039 92plusmn 0114 22 768plusmn 112 42plusmn 011 225plusmn 036 106plusmn 0325 0
45
751plusmn 146 58plusmn 010 216plusmn 050 112plusmn 0236 13 784plusmn 131 45plusmn 010 262plusmn 043 88plusmn 0187 18 782plusmn 666 54plusmn 019 273plusmn 245 84plusmn 0828 22 726plusmn 193 59plusmn 019 237plusmn 131 88plusmn 0569 0
50
596plusmn 174 61plusmn 018 308plusmn 074 129plusmn 01910 13 616plusmn 097 61plusmn 013 308plusmn 075 110plusmn 01811 18 616plusmn 113 68plusmn 062 331plusmn 076 114plusmn 02412 22 601plusmn 22 71plusmn 030 328plusmn 096 128plusmn 051
Journal of Food Quality 11
proportionally along with the ultrasound intensity at issimilar to the results reported by Wei et al for AmericanGinseng [22] e value of ∆E changes of C javanica isbetween 112 and 129 without ultrasound and between 84and 128 with ultrasound at the intensity of 13ndash22 kWm2We concluded that the color of the dried samples changesslightly compared with the fresh samples when using theultrasound-assisted drying process is can be explained asusing ultrasound makes drying times shorter causing lessinfluence on the color of the product
4 Conclusions
e thermal diffusion and moisture diffusion coefficients of Cjavanica at air temperature 40ndash50degC with and without ultra-sound at the intensity of 13ndash22 kWm2 were investigated inthis study e results show that the values of thermal andmoisture diffusivity are in the range of 101ndash138times10minus 7m2sand 32ndash67times10minus 10m2s respectively e convective heat andmoisture transfer coefficients at the surface of the dryingmaterial were between 23times10minus 3ndash41times 10minus 3 kgm2s and292ndash636Wm2 K respectively In this study the overall colordifferences considered the effectiveness of ultrasound as a wayto preserve the quality of the product
Data Availability
e data used to support the findings of this study are in-cluded within the article and are available from the corre-sponding author upon request
Conflicts of Interest
e authors declare they have no conflicts of interest in thisstudy
Acknowledgments
e authors thank Nong Lam University Ho Chi Minh Cityand Ho Chi Minh City University of Technology and Ed-ucation for supporting this study
References
[1] G Musielak D Mierzwa and J Kroehnke ldquoFood dryingenhancement by ultrasoundmdasha reviewrdquo Trends in Food Sci-ence amp Technology vol 56 pp 126ndash141 2016
[2] P Li and Z Chen ldquoExperiment study on porous fiber dryingenhancement with application of power ultrasoundfiberdrying enhancement with application of power ultrasoundrdquoApplied Acoustics vol 127 pp 169ndash174 2017
[3] R M S C Morais A M M B Morais I Dammak et alldquoFunctional dehydrated foods for health preservationrdquoJournal of Food Quality vol 2018 Article ID 173963629 pages 2018
[4] O Rodrıguez J V Santacatalina S Simal J V Garcia-PerezA Femenia and C Rossello ldquoInfluence of power ultrasoundapplication on drying kinetics of apple and its antioxidant andmicrostructural propertiesrdquo Journal of Food Engineeringvol 129 pp 21ndash29 2014
[5] J Crank Ae Mathematics of Diffusion Clarendon PressOxford UK 2nd edition 1975
[6] J V Garcia-Perez C Ortuntildeo A Puig J A Carcel andI Perez-Munuera ldquoEnhancement of water transport andmicrostructural changes induced by high-intensity ultrasoundapplication on orange peel dryingrdquo Food and BioprocessTechnology vol 5 no 6 pp 2256ndash2265 2012
[7] C Ozuna J A Carcel P M Walde and J V Garcia-PerezldquoLow-temperature drying of salted cod (Gadus morhua)assisted by high power ultrasound kinetics and physicalpropertiesrdquo Innovative Food Science amp Emerging Technologiesvol 23 pp 146ndash155 2014
[8] Y Liu Y Sun S Miao F Li and D Luo ldquoDrying charac-teristics of ultrasound assisted hot air drying of Flos loni-ceraerdquo Journal of Food Science and Technology vol 52 no 8pp 4955ndash4964 2015
[9] J V Santacatalina O Rodrıguez S Simal J A CarcelA Mulet and J V Garcıa-Perez ldquoUltrasonically enhancedlow-temperature drying of apple influence on drying kineticsand antioxidant potentialrdquo Journal of Food Engineeringvol 138 pp 35ndash44 2014
[10] C Brines A Mulet J V Garcıa-Perez E Riera andJ A Carcel ldquoInfluence of the ultrasonic power applied onfreeze drying kineticsrdquo Physics Procedia vol 70 pp 850ndash8532015
[11] J Gamboa-Santos A Montilla J A Carcel M Villamiel andJ V Garcia-Perez ldquoAir-borne ultrasound application in theconvective drying of strawberryrdquo Journal of Food Engineeringvol 128 pp 132ndash139 2014
[12] E M G C D Nascimento A Mulet J L R AscheriC W P D Carvalho and J A Carcel ldquoEffects of high-in-tensity ultrasound on drying kinetics and antioxidant prop-erties of passion fruit peelrdquo Journal of Food Engineeringvol 170 pp 108ndash118 2016
[13] J Rodrıguez A Mulet and J Bon ldquoInfluence of high-in-tensity ultrasound on drying kinetics in fixed beds of highporosityrdquo Journal of Food Engineering vol 127 pp 93ndash1022014
[14] M Bantle and J Hanssler ldquoUltrasonic convective dryingkinetics of clipfish during the initial drying periodrdquo DryingTechnology vol 31 no 11 pp 1307ndash1316 2013
[15] M Bantle and T M Eikevik ldquoA study of the energy efficiencyof convective drying systems assisted by ultrasound in theproduction of clipfishrdquo Journal of Cleaner Production vol 65pp 217ndash223 2014
[16] S J Kowalski and A Pawłowski ldquoIntensification of appledrying due to ultrasound enhancementrdquo Journal of FoodEngineering vol 156 pp 1ndash9 2015
[17] P H Tuan N V T Duong and N X Quang ldquoComputa-tional modeling and design of a high-intensity ultrasonictransducer with extensive radiator for food dehydrationrdquo inProceedings of the 2nd International Conference on GreenTechnology and Sustainable Development (GTSD2014) vol 2pp 234ndash239 Ho Chi Minh City Vietnam October 2014
[18] Y J Cho S J Park and C H Lee ldquoLatent heat of Koreanginsengrdquo Journal of Food Engineering vol 30 no 3-4pp 245ndash432 1996
[19] P Yogendrarajah S Samapundo F Devlieghere S De Saegerand B De Meulenaer ldquoMoisture sorption isotherms andthermodynamic properties of whole black peppercorns (Pipernigrum L)rdquo LWTmdashFood Science and Technology vol 64no 1 pp 177ndash188 2015
[20] X Hu and R Eberhart ldquoSolving constrained nonlinear op-timization problems with particle swarm optimizationrdquo in
12 Journal of Food Quality
Proceedings of the Sixth World Multi Conference on SystemicsCybernetics and Informatics pp 203ndash206 Orlando FL USAJuly 2002
[21] D P Rini S M Shamsuddin and S S Yuhaniz ldquoParticleswarm optimization technique system and challengesrdquo In-ternational Journal of Computer Applications vol 14 no 1pp 19ndash27 2011
[22] X H Wei L C Lim S D Wen and G Z Jiang ldquoColorchange kinetics of American ginseng (Panax quinquefolium)slices during air impingement dryingrdquo Drying Technologyvol 32 no 4 pp 418ndash247 2014
[23] A W Deshmukh M N Varma C K Yoo andK L Wasewar ldquoInvestigation of solar drying of ginger(zingiberofficinale) empirical modelling drying characteris-tics and quality studyrdquo Chinese Journal of Engineeringvol 2014 Article ID 305823 7 pages 2014
[24] M M Hussain and I Dincer ldquoAnalysis of two-dimensionalheat andmoisture transfer during drying of spherical objectsrdquoInternational Journal of Energy Research vol 27 no 21pp 703ndash713 2003
Journal of Food Quality 13
Hindawiwwwhindawicom
International Journal of
Volume 2018
Zoology
Hindawiwwwhindawicom Volume 2018
Anatomy Research International
PeptidesInternational Journal of
Hindawiwwwhindawicom Volume 2018
Hindawiwwwhindawicom Volume 2018
Journal of Parasitology Research
GenomicsInternational Journal of
Hindawiwwwhindawicom Volume 2018
Hindawi Publishing Corporation httpwwwhindawicom Volume 2013Hindawiwwwhindawicom
The Scientific World Journal
Volume 2018
Hindawiwwwhindawicom Volume 2018
BioinformaticsAdvances in
Marine BiologyJournal of
Hindawiwwwhindawicom Volume 2018
Hindawiwwwhindawicom Volume 2018
Neuroscience Journal
Hindawiwwwhindawicom Volume 2018
BioMed Research International
Cell BiologyInternational Journal of
Hindawiwwwhindawicom Volume 2018
Hindawiwwwhindawicom Volume 2018
Biochemistry Research International
ArchaeaHindawiwwwhindawicom Volume 2018
Hindawiwwwhindawicom Volume 2018
Genetics Research International
Hindawiwwwhindawicom Volume 2018
Advances in
Virolog y Stem Cells International
Hindawiwwwhindawicom Volume 2018
Hindawiwwwhindawicom Volume 2018
Enzyme Research
Hindawiwwwhindawicom Volume 2018
International Journal of
MicrobiologyHindawiwwwhindawicom
Nucleic AcidsJournal of
Volume 2018
Submit your manuscripts atwwwhindawicom
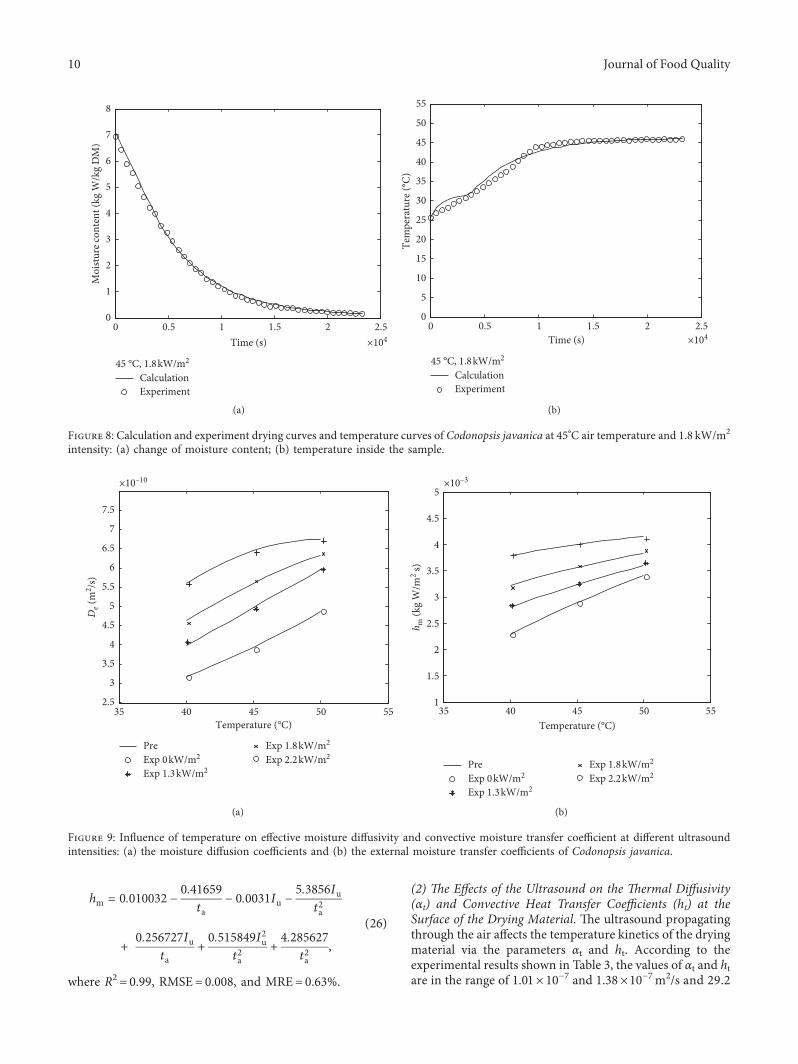