Thermal characterization of vegetable oils by means of ... · Thermal characterization of vegetable...
5
SOLAR ENERGY Revista Mexicana de F´ ısica S 59 (1) 168–172 FEBRUARY 2013 Thermal characterization of vegetable oils by means of photoacoustic techniques J. A. Balderas L ´ opez a,* , T. Monsivais Alvarado a , G. G´ alvez Coyt a , A. Mu ˜ noz Diosdado a , and J. D´ ıaz Reyes b a Unidad Profesional Interdisciplinaria de Biotecnolog´ ıa del Instituto Polit´ ecnico Nacional, Av. Acueducto S/N, col. Barrio la Laguna, Del. Gustavo A. Madero, M´ exico, 07340, D. F., M´ exico, Tel. 57296000 ext. 56358 * e-mail: [email protected] b Centro de Investigaci´ on en Biotecnolog´ ıa Aplicada del Instituto Polit´ ecnico Nacional, Ex-Hacienda San Juan Molino, Tepetitla de Lardiz´ abal, Tlaxcala, M´ exico. Received 30 de junio de 2011; accepted 25 de agosto de 2011 Thermal characterization of vegetable oils was carried out; two photoacoustic methodologies for the direct measurement of thermal diffusivity and effusivity for liquids were used for this goal. The thermal conductivity and specific heat were obtained based on their definition in terms of thermal diffusivity and effusivity. This study was carried out for a set of 13 commercial vegetable oils finding not significant difference among their thermal properties. The usefulness of photoacoustic techniques for thermal characterization of this kind of substance of great importance in food industry was shown. Keywords: Photoacoustic; thermal; oils. Se llev´ o a cabo la caracterizaci´ on t´ ermica de aceites vegetales; se utilizaron para ´ este fin dos metodolog´ ıas fotoac´ usticas para la medici´ on directa de la difusividad t´ ermica y efusividad t´ ermica de l´ ıquidos. Este estudio se llev´ o a cabo para un conjunto de 13 aceites vegetales no hall´ andose diferencia significativa entre sus propiedades t´ ermicas. Se demostr´ o as´ ı la utilidad de las t´ ecnicas fotoac´ usticas para la caracteri- zaci´ on t´ ermica de ´ este tipo de sustancias de gran importancia en la industria de alimentos. Descriptores: Fotoac´ ustica; t´ ermicas; aceites. PACS: 65.20.+w; 07.20.-n 1. Introduction Vegetable oils are substances widely used in our day-life. They are among the three main food sources for human be- ings, making important supplies to our energy daily con- sumption. They also play fundamental role in industry, es- pecially in snack industry. For this last reason is important to known their thermal properties since this knowledge makes possible the designing and improving of industrial processes. Photoacoustic techniques are among the experimental tech- niques of growing use for thermal characterization of sub- stances in liquid phase [1-2], these methodologies involve modulated radiation as a mechanism for heat generation. In this work, photoacoustic techniques for the measurement of thermal diffusivity and effusivity, for vegetable oils are de- scribed. This study (carried out for 13 commercial vegetable oils bought in Mexico City’s market) shows that, no matter the origin of the vegetable oil, the values of thermal proper- ties are very close to each other, so is very difficult to estab- lish any difference between them based only on comparison between these ones. 2. Theory Photoacoustic methods are particular cases of experimental techniques, involving modulated radiation as heat source, for the measurement of thermal and optical properties for sub- stances in condensed phase, and for which signal detection is carried out by means of a microphone coupled to a closed cell called photoacoustic cavity. In particular, two important ther- mal properties are able to be measured with these methodolo- gies, thermal effusivity and diffusivity. Thermal Effusivity. Figure 1 shows a cross section of the mathematical model for thermal effusivity measurements by means of a photoacoustic technique. In this, modulated radi- ation striking the upper surface of a high optically absorbing material, generates heat which travels across the material and to the substance of interest. Rosencswaig-Gersho model for photoacoustic signal generation [3] establishes that photoacoustic signal is propor- tional to temperature fluctuations at the interface of media 2 y 3 in Fig. 1. Analytical solution of the system of differential equations FIGURE 1. Mathematical model for heat diffusion through a high light absorbing single layered material.
Transcript of Thermal characterization of vegetable oils by means of ... · Thermal characterization of vegetable...
SOLAR ENERGY Revista Mexicana de Fısica S59 (1) 168–172 FEBRUARY 2013
Thermal characterization of vegetable oils by means of photoacoustic techniques
J. A. Balderas Lopeza,∗, T. Monsivais Alvaradoa, G. Galvez Coyta, A. Munoz Diosdadoa, and J. Dıaz Reyesba Unidad Profesional Interdisciplinaria de Biotecnologıa del Instituto Politecnico Nacional,
Av. Acueducto S/N, col. Barrio la Laguna, Del. Gustavo A. Madero, Mexico, 07340, D. F., Mexico,Tel. 57296000 ext. 56358
∗e-mail: [email protected] Centro de Investigacion en Biotecnologıa Aplicada del Instituto Politecnico Nacional,
Ex-Hacienda San Juan Molino, Tepetitla de Lardizabal, Tlaxcala, Mexico.
Received 30 de junio de 2011; accepted 25 de agosto de 2011
Thermal characterization of vegetable oils was carried out; two photoacoustic methodologies for the direct measurement of thermal diffusivityand effusivity for liquids were used for this goal. The thermal conductivity and specific heat were obtained based on their definition in termsof thermal diffusivity and effusivity. This study was carried out for a set of 13 commercial vegetable oils finding not significant differenceamong their thermal properties. The usefulness of photoacoustic techniques for thermal characterization of this kind of substance of greatimportance in food industry was shown.
Keywords: Photoacoustic; thermal; oils.
Se llevo a cabo la caracterizacion termica de aceites vegetales; se utilizaron paraeste fin dos metodologıas fotoacusticas para la mediciondirecta de la difusividad termica y efusividad termica de lıquidos. Este estudio se llevo a cabo para un conjunto de 13 aceites vegetales nohallandose diferencia significativa entre sus propiedades termicas. Se demostro ası la utilidad de las tecnicas fotoacusticas para la caracteri-zacion termica deeste tipo de sustancias de gran importancia en la industria de alimentos.
Descriptores: Fotoacustica; termicas; aceites.
PACS: 65.20.+w; 07.20.-n
1. Introduction
Vegetable oils are substances widely used in our day-life.They are among the three main food sources for human be-ings, making important supplies to our energy daily con-sumption. They also play fundamental role in industry, es-pecially in snack industry. For this last reason is important toknown their thermal properties since this knowledge makespossible the designing and improving of industrial processes.Photoacoustic techniques are among the experimental tech-niques of growing use for thermal characterization of sub-stances in liquid phase [1-2], these methodologies involvemodulated radiation as a mechanism for heat generation. Inthis work, photoacoustic techniques for the measurement ofthermal diffusivity and effusivity, for vegetable oils are de-scribed. This study (carried out for 13 commercial vegetableoils bought in Mexico City’s market) shows that, no matterthe origin of the vegetable oil, the values of thermal proper-ties are very close to each other, so is very difficult to estab-lish any difference between them based only on comparisonbetween these ones.
2. Theory
Photoacoustic methods are particular cases of experimentaltechniques, involving modulated radiation as heat source, forthe measurement of thermal and optical properties for sub-stances in condensed phase, and for which signal detection is
carried out by means of a microphone coupled to a closed cellcalled photoacoustic cavity. In particular, two important ther-mal properties are able to be measured with these methodolo-gies, thermal effusivity and diffusivity.
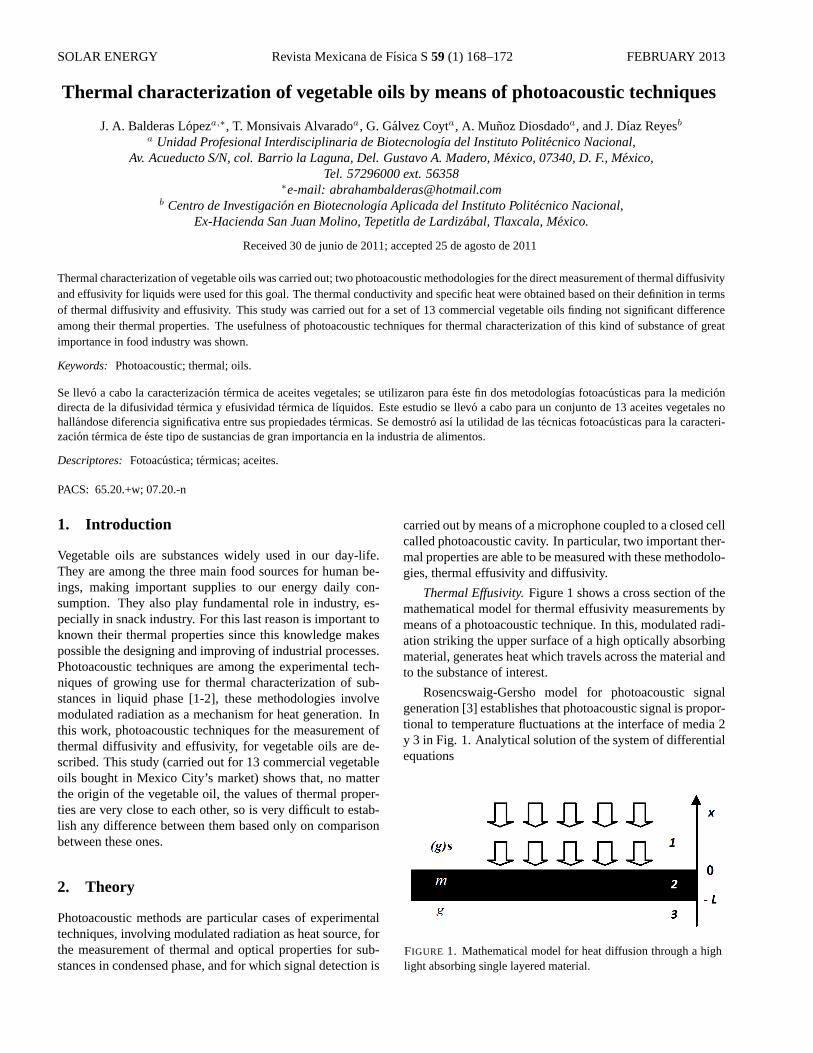
Thermal Effusivity.Figure 1 shows a cross section of themathematical model for thermal effusivity measurements bymeans of a photoacoustic technique. In this, modulated radi-ation striking the upper surface of a high optically absorbingmaterial, generates heat which travels across the material andto the substance of interest.
Rosencswaig-Gersho model for photoacoustic signalgeneration [3] establishes that photoacoustic signal is propor-tional to temperature fluctuations at the interface of media 2y 3 in Fig. 1. Analytical solution of the system of differentialequations
FIGURE 1. Mathematical model for heat diffusion through a highlight absorbing single layered material.
THERMAL CHARACTERIZATION OF VEGETABLE OILS BY MEANS OF PHOTOACOUSTIC TECHNIQUES 169
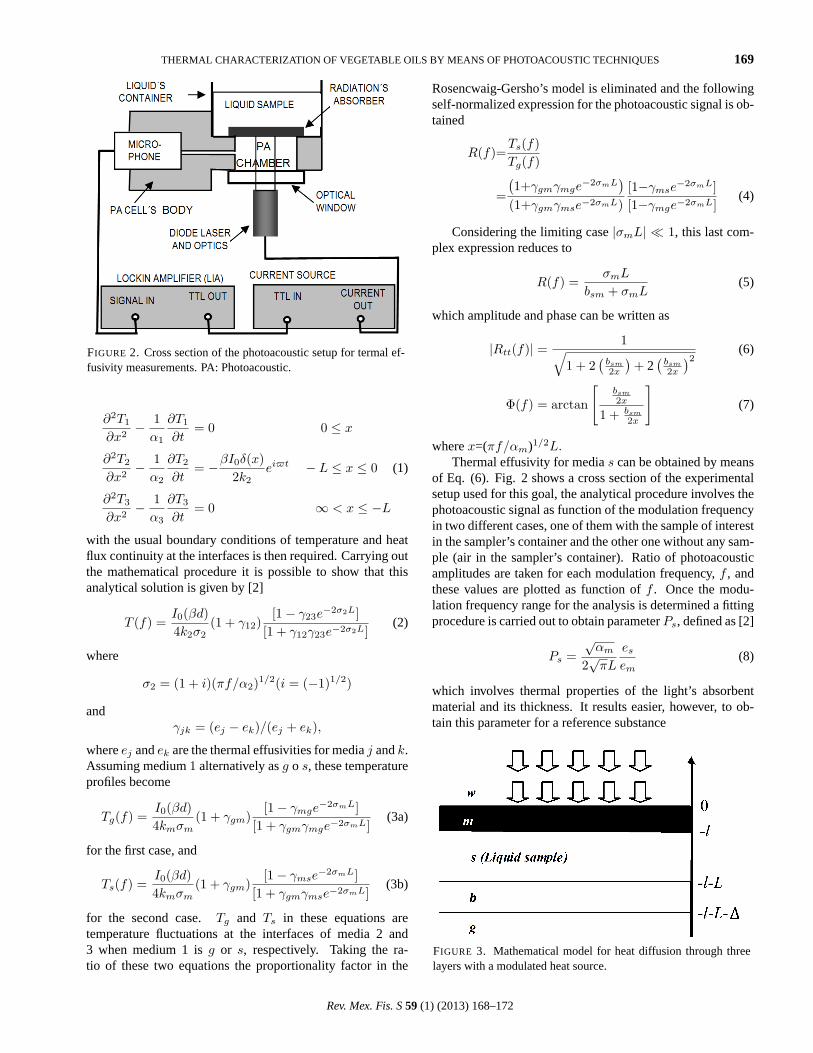
FIGURE 2. Cross section of the photoacoustic setup for termal ef-fusivity measurements. PA: Photoacoustic.
∂2T1
∂x2− 1
α1
∂T1
∂t= 0 0 ≤ x
∂2T2
∂x2− 1
α2
∂T2
∂t= −βI0δ(x)
2k2ei$t − L ≤ x ≤ 0 (1)
∂2T3
∂x2− 1
α3
∂T3
∂t= 0 ∞ < x ≤ −L
with the usual boundary conditions of temperature and heatflux continuity at the interfaces is then required. Carrying outthe mathematical procedure it is possible to show that thisanalytical solution is given by [2]
T (f) =I0(βd)4k2σ2
(1 + γ12)[1− γ23e
−2σ2L][1 + γ12γ23e−2σ2L]
(2)
where
σ2 = (1 + i)(πf/α2)1/2(i = (−1)1/2)
andγjk = (ej − ek)/(ej + ek),
whereej andek are the thermal effusivities for mediaj andk.Assuming medium1 alternatively asg o s, these temperatureprofiles become
Tg(f) =I0(βd)4kmσm
(1 + γgm)[1− γmge
−2σmL][1 + γgmγmge−2σmL]
(3a)
for the first case, and
Ts(f) =I0(βd)4kmσm
(1 + γgm)[1− γmse
−2σmL][1 + γgmγmse−2σmL]
(3b)
for the second case.Tg and Ts in these equations aretemperature fluctuations at the interfaces of media 2 and3 when medium 1 isg or s, respectively. Taking the ra-tio of these two equations the proportionality factor in the
Rosencwaig-Gersho’s model is eliminated and the followingself-normalized expression for the photoacoustic signal is ob-tained
R(f)=Ts(f)Tg(f)
=
(1+γgmγmge
−2σmL)
(1+γgmγmse−2σmL)[1−γmse
−2σmL][1−γmge−2σmL]
(4)
Considering the limiting case|σmL| ¿ 1, this last com-plex expression reduces to
R(f) =σmL
bsm + σmL(5)
which amplitude and phase can be written as
|Rtt(f)| = 1√1 + 2
(bsm
2x
)+ 2
(bsm
2x
)2(6)
Φ(f) = arctan
[bsm
2x
1 + bsm
2x
](7)
wherex=(πf/αm)1/2L.Thermal effusivity for medias can be obtained by means
of Eq. (6). Fig. 2 shows a cross section of the experimentalsetup used for this goal, the analytical procedure involves thephotoacoustic signal as function of the modulation frequencyin two different cases, one of them with the sample of interestin the sampler’s container and the other one without any sam-ple (air in the sampler’s container). Ratio of photoacousticamplitudes are taken for each modulation frequency,f , andthese values are plotted as function off . Once the modu-lation frequency range for the analysis is determined a fittingprocedure is carried out to obtain parameterPs, defined as [2]
Ps =√
αm
2√
πL
es
em(8)
which involves thermal properties of the light’s absorbentmaterial and its thickness. It results easier, however, to ob-tain this parameter for a reference substance
FIGURE 3. Mathematical model for heat diffusion through threelayers with a modulated heat source.
Rev. Mex. Fis. S59 (1) (2013) 168–172
170 J. A. BALDERAS LOPEZet al.
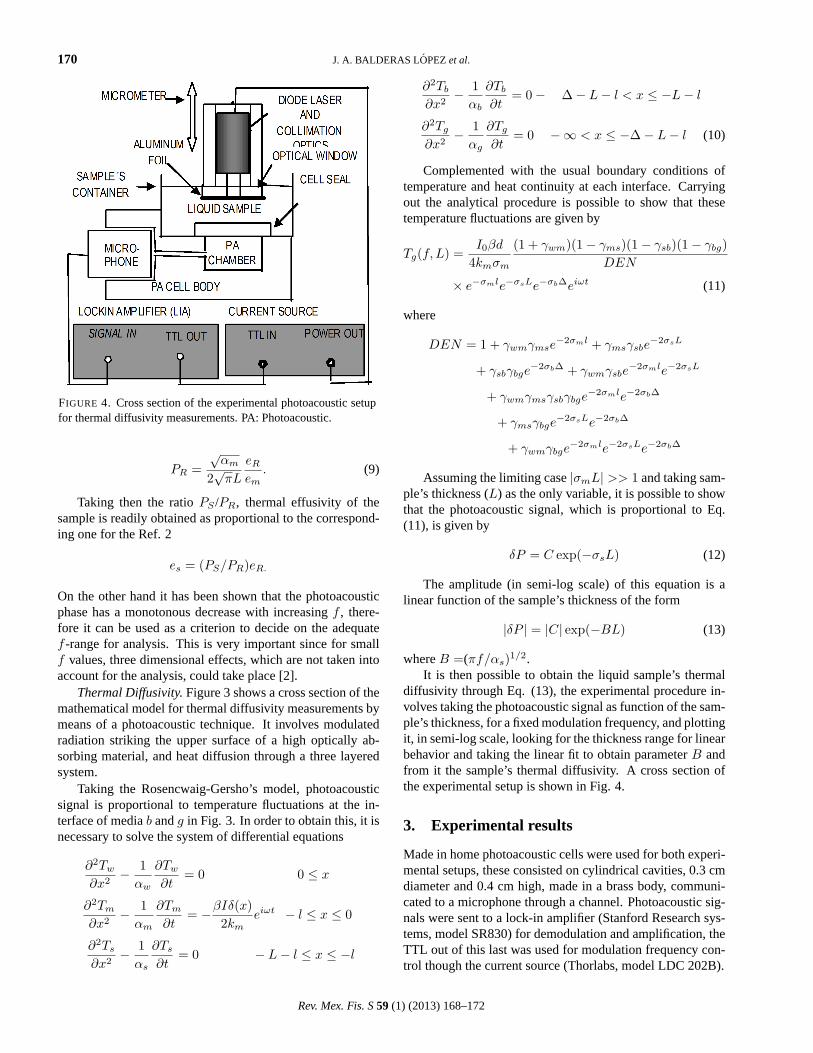
FIGURE 4. Cross section of the experimental photoacoustic setupfor thermal diffusivity measurements. PA: Photoacoustic.
PR =√
αm
2√
πL
eR
em. (9)
Taking then the ratioPS /PR, thermal effusivity of thesample is readily obtained as proportional to the correspond-ing one for the Ref. 2
es = (PS/PR)eR.
On the other hand it has been shown that the photoacousticphase has a monotonous decrease with increasingf , there-fore it can be used as a criterion to decide on the adequatef -range for analysis. This is very important since for smallf values, three dimensional effects, which are not taken intoaccount for the analysis, could take place [2].
Thermal Diffusivity.Figure 3 shows a cross section of themathematical model for thermal diffusivity measurements bymeans of a photoacoustic technique. It involves modulatedradiation striking the upper surface of a high optically ab-sorbing material, and heat diffusion through a three layeredsystem.
Taking the Rosencwaig-Gersho’s model, photoacousticsignal is proportional to temperature fluctuations at the in-terface of mediab andg in Fig. 3. In order to obtain this, it isnecessary to solve the system of differential equations
∂2Tw
∂x2− 1
αw
∂Tw
∂t= 0 0 ≤ x
∂2Tm
∂x2− 1
αm
∂Tm
∂t= −βIδ(x)
2kmeiωt − l ≤ x ≤ 0
∂2Ts
∂x2− 1
αs
∂Ts
∂t= 0 − L− l ≤ x ≤ −l
∂2Tb
∂x2− 1
αb
∂Tb
∂t= 0− ∆− L− l < x ≤ −L− l
∂2Tg
∂x2− 1
αg
∂Tg
∂t= 0 −∞ < x ≤ −∆− L− l (10)
Complemented with the usual boundary conditions oftemperature and heat continuity at each interface. Carryingout the analytical procedure is possible to show that thesetemperature fluctuations are given by
Tg(f, L) =I0βd
4kmσm
(1 + γwm)(1− γms)(1− γsb)(1− γbg)DEN
× e−σmle−σsLe−σb∆eiωt (11)
where
DEN = 1 + γwmγmse−2σml + γmsγsbe
−2σsL
+ γsbγbge−2σb∆ + γwmγsbe
−2σmle−2σsL
+ γwmγmsγsbγbge−2σmle−2σb∆
+ γmsγbge−2σsLe−2σb∆
+ γwmγbge−2σmle−2σsLe−2σb∆
Assuming the limiting case|σmL| >> 1 and taking sam-ple’s thickness (L) as the only variable, it is possible to showthat the photoacoustic signal, which is proportional to Eq.(11), is given by
δP = C exp(−σsL) (12)
The amplitude (in semi-log scale) of this equation is alinear function of the sample’s thickness of the form
|δP | = |C| exp(−BL) (13)
whereB =(πf/αs)1/2.It is then possible to obtain the liquid sample’s thermal
diffusivity through Eq. (13), the experimental procedure in-volves taking the photoacoustic signal as function of the sam-ple’s thickness, for a fixed modulation frequency, and plottingit, in semi-log scale, looking for the thickness range for linearbehavior and taking the linear fit to obtain parameterB andfrom it the sample’s thermal diffusivity. A cross section ofthe experimental setup is shown in Fig. 4.
3. Experimental results
Made in home photoacoustic cells were used for both experi-mental setups, these consisted on cylindrical cavities, 0.3 cmdiameter and 0.4 cm high, made in a brass body, communi-cated to a microphone through a channel. Photoacoustic sig-nals were sent to a lock-in amplifier (Stanford Research sys-tems, model SR830) for demodulation and amplification, theTTL out of this last was used for modulation frequency con-trol though the current source (Thorlabs, model LDC 202B).
Rev. Mex. Fis. S59 (1) (2013) 168–172
THERMAL CHARACTERIZATION OF VEGETABLE OILS BY MEANS OF PHOTOACOUSTIC TECHNIQUES 171
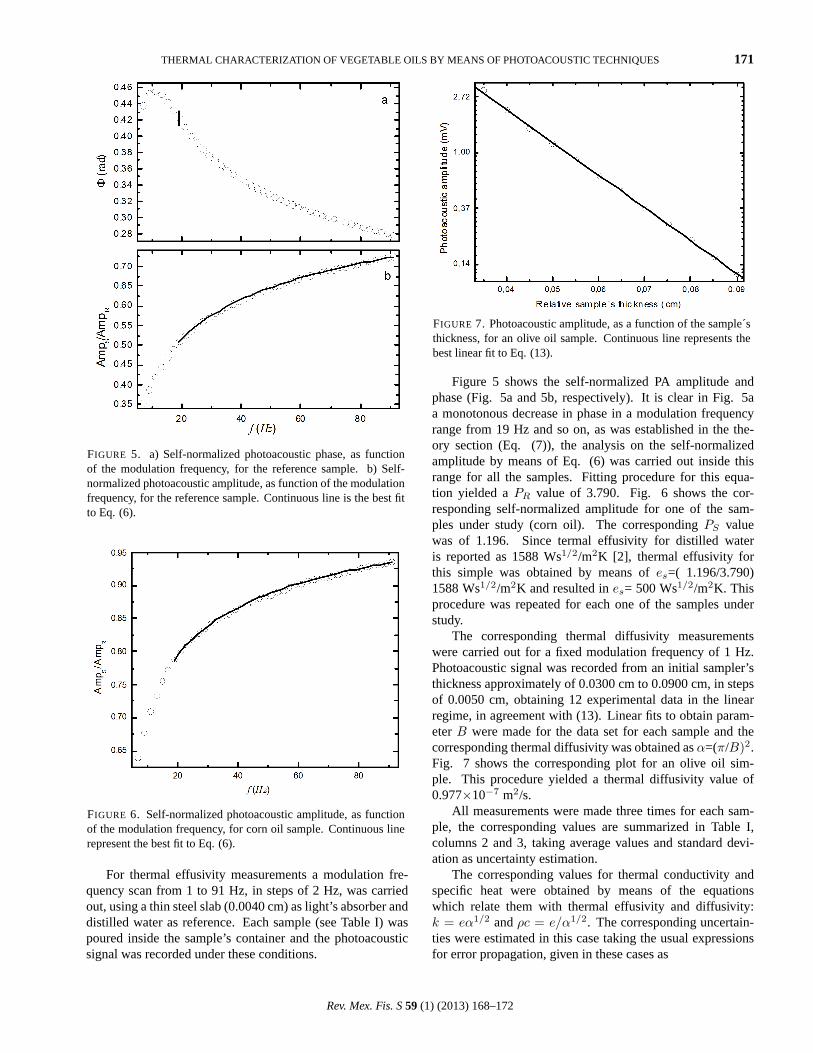
FIGURE 5. a) Self-normalized photoacoustic phase, as functionof the modulation frequency, for the reference sample. b) Self-normalized photoacoustic amplitude, as function of the modulationfrequency, for the reference sample. Continuous line is the best fitto Eq. (6).
FIGURE 6. Self-normalized photoacoustic amplitude, as functionof the modulation frequency, for corn oil sample. Continuous linerepresent the best fit to Eq. (6).
For thermal effusivity measurements a modulation fre-quency scan from 1 to 91 Hz, in steps of 2 Hz, was carriedout, using a thin steel slab (0.0040 cm) as light’s absorber anddistilled water as reference. Each sample (see Table I) waspoured inside the sample’s container and the photoacousticsignal was recorded under these conditions.
FIGURE 7. Photoacoustic amplitude, as a function of the sample´sthickness, for an olive oil sample. Continuous line represents thebest linear fit to Eq. (13).
Figure 5 shows the self-normalized PA amplitude andphase (Fig. 5a and 5b, respectively). It is clear in Fig. 5aa monotonous decrease in phase in a modulation frequencyrange from 19 Hz and so on, as was established in the the-ory section (Eq. (7)), the analysis on the self-normalizedamplitude by means of Eq. (6) was carried out inside thisrange for all the samples. Fitting procedure for this equa-tion yielded aPR value of 3.790. Fig. 6 shows the cor-responding self-normalized amplitude for one of the sam-ples under study (corn oil). The correspondingPS valuewas of 1.196. Since termal effusivity for distilled wateris reported as 1588 Ws1/2/m2K [2], thermal effusivity forthis simple was obtained by means ofes=( 1.196/3.790)1588 Ws1/2/m2K and resulted ines= 500 Ws1/2/m2K. Thisprocedure was repeated for each one of the samples understudy.
The corresponding thermal diffusivity measurementswere carried out for a fixed modulation frequency of 1 Hz.Photoacoustic signal was recorded from an initial sampler’sthickness approximately of 0.0300 cm to 0.0900 cm, in stepsof 0.0050 cm, obtaining 12 experimental data in the linearregime, in agreement with (13). Linear fits to obtain param-eterB were made for the data set for each sample and thecorresponding thermal diffusivity was obtained asα=(π/B)2.Fig. 7 shows the corresponding plot for an olive oil sim-ple. This procedure yielded a thermal diffusivity value of0.977×10−7 m2/s.
All measurements were made three times for each sam-ple, the corresponding values are summarized in Table I,columns 2 and 3, taking average values and standard devi-ation as uncertainty estimation.
The corresponding values for thermal conductivity andspecific heat were obtained by means of the equationswhich relate them with thermal effusivity and diffusivity:k = eα1/2 andρc = e/α1/2. The corresponding uncertain-ties were estimated in this case taking the usual expressionsfor error propagation, given in these cases as
Rev. Mex. Fis. S59 (1) (2013) 168–172
172 J. A. BALDERAS LOPEZet al.
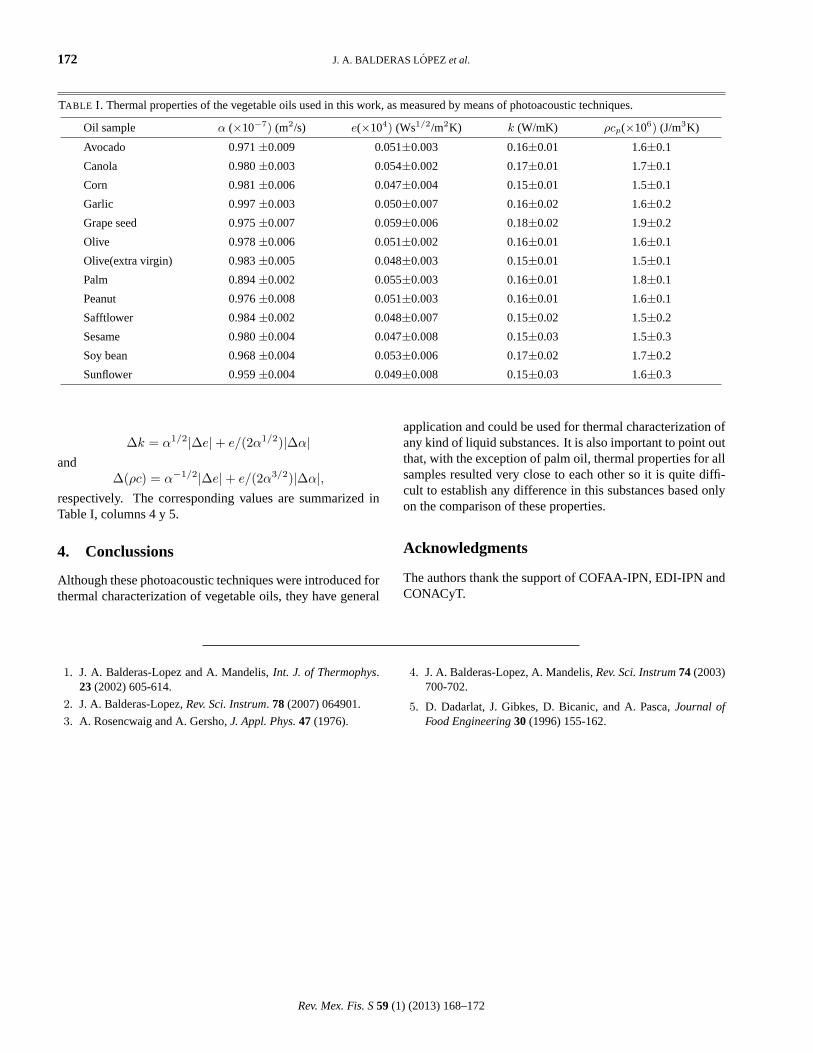
TABLE I. Thermal properties of the vegetable oils used in this work, as measured by means of photoacoustic techniques.
Oil sample α (×10−7) (m2/s) e(×104) (Ws1/2/m2K) k (W/mK) ρcp(×106) (J/m3K)
Avocado 0.971±0.009 0.051±0.003 0.16±0.01 1.6±0.1
Canola 0.980±0.003 0.054±0.002 0.17±0.01 1.7±0.1
Corn 0.981±0.006 0.047±0.004 0.15±0.01 1.5±0.1
Garlic 0.997±0.003 0.050±0.007 0.16±0.02 1.6±0.2
Grape seed 0.975±0.007 0.059±0.006 0.18±0.02 1.9±0.2
Olive 0.978±0.006 0.051±0.002 0.16±0.01 1.6±0.1
Olive(extra virgin) 0.983±0.005 0.048±0.003 0.15±0.01 1.5±0.1
Palm 0.894±0.002 0.055±0.003 0.16±0.01 1.8±0.1
Peanut 0.976±0.008 0.051±0.003 0.16±0.01 1.6±0.1
Safftlower 0.984±0.002 0.048±0.007 0.15±0.02 1.5±0.2
Sesame 0.980±0.004 0.047±0.008 0.15±0.03 1.5±0.3
Soy bean 0.968±0.004 0.053±0.006 0.17±0.02 1.7±0.2
Sunflower 0.959±0.004 0.049±0.008 0.15±0.03 1.6±0.3
∆k = α1/2|∆e|+ e/(2α1/2)|∆α|and
∆(ρc) = α−1/2|∆e|+ e/(2α3/2)|∆α|,respectively. The corresponding values are summarized inTable I, columns 4 y 5.
4. Conclussions
Although these photoacoustic techniques were introduced forthermal characterization of vegetable oils, they have general
application and could be used for thermal characterization ofany kind of liquid substances. It is also important to point outthat, with the exception of palm oil, thermal properties for allsamples resulted very close to each other so it is quite diffi-cult to establish any difference in this substances based onlyon the comparison of these properties.
Acknowledgments
The authors thank the support of COFAA-IPN, EDI-IPN andCONACyT.
1. J. A. Balderas-Lopez and A. Mandelis,Int. J. of Thermophys.23 (2002) 605-614.
2. J. A. Balderas-Lopez,Rev. Sci. Instrum. 78 (2007) 064901.
3. A. Rosencwaig and A. Gersho,J. Appl. Phys.47 (1976).
4. J. A. Balderas-Lopez, A. Mandelis,Rev. Sci. Instrum74 (2003)700-702.
5. D. Dadarlat, J. Gibkes, D. Bicanic, and A. Pasca,Journal ofFood Engineering30 (1996) 155-162.
Rev. Mex. Fis. S59 (1) (2013) 168–172