THERMAL BEHAVIOR IN THE TRADITIONAL COURTYARD HOUSES...
49
THERMAL BEHAVIOR IN THE TRADITIONAL COURTYARD HOUSES OF YEMEN MANSOOR MOHAMMED ABDULLA BINTHABET UNIVERSITI SAINS MALAYSIA 2007
Transcript of THERMAL BEHAVIOR IN THE TRADITIONAL COURTYARD HOUSES...

THERMAL BEHAVIOR IN THE TRADITIONAL COURTYARD HOUSES OF YEMEN
MANSOOR MOHAMMED ABDULLA BINTHABET
UNIVERSITI SAINS MALAYSIA
2007
THERMAL BEHAVIOR IN THE TRADITIONAL COURTYARD HOUSES OF YEMEN
by
MANSOOR MOHAMMED ABDULLA BINTHABET
Thesis submitted in fulfillment of the requirements for the degree of
Doctor of Philosophy
July 2007

ii
ACKNOWLEDGEMENTS
In the name of Allah, the Most Gracious and the Most Merciful.
With deep appreciation, I would like to express my sincere gratitude to
my supervisor Assoc. Prof. Dr Abdul Majid Ismail for his guidance and counsel,
I am extremely grateful for the understanding, support and encouragement that
he has given me, throughout the period of my study. I would also like to thank
my co-supervisor Dr. Mohd Rodzi Ismail for his invaluable and sound guidance,
continued encouragement that he has given me, both academically and
personally.
Special thanks to Hadhramout University of Science and Technology,
and Yemeni Embassy in Kuala Lumpur for providing financial support and for
allowing me the chance to complete this thesis. The same goes to all the staff at
the School of Housing, Building and Planning, Universiti Sains Malaysia for their
cooperation and help to me throughout my study. Great thanks to all my friends
and relatives who have given me their assistance and advice.
Finally, I extend my heartfelt thanks to my parents for their inexhaustible
love, sacrifice and prayers. Also my heartiest thanks go to my brother and
sisters, and my uncle Mr. Ahmed and my cousins Aqail and Fahmi for showing
me the way and for their support and unfailing patience. Sincere thank are also
to my wife and daughters, to whom this work has been dedicated, for their
continuous support through the period of this work.

iii
TABLE OF CONTENTS
Page ACKNOWLEDGEMENTS ii
TABLE OF CONTENTS iii
LIST OF TABLES ix
LIST OF FIGURES xi
LIST OF PLATES xv
LIST OF ABBREVIATION LIST OF APPENDICES LIST OF PUBLICATIONS & SEMINARS
xvii
xviii
xix
ABSTRAK xx
ABSTRACT CHAPTER ONE : INTRODUCTION
xxii
1
1.1 Background 1
1.2 Issues and Problem 2
1.3
1.4
1.5
Aim
Objectives
Significant of the Study
4
4
5
1.6 Limitations of the Study 5
1.7 Research Questions 6
1.8
1.9
Working Conceptual Model
Outline of Thesis
7
8
CHAPTER TWO: BACKGROUND STUDY OF YEMEN 10
2.1 Climate and Comfort Zone
2.1.1 Location of Yemen
10
10
2.1.2 Regions and the Topography of Yemen 11
2.1.2.1 The Coastal Region
2.1.2.2 The Plateaus Region
2.1.2.3 The Mountainous Region
2.1.2.4 The Desert Region
2.1.2.5 The Islands
12
13
13
13
14
iv
2.1.3 General Climate of Yemen 14
2.1.4 Climate in Hadhramout 18
2.1.4.1 Sunshine and Solar Radiation
2.1.4.2 Temperature
2.1.4.3 Relative Humidity
2.1.4.4 Wind
2.1.4.5 Precipitation
19
19
21
22
23
2.1.5 Thermal Comfort Requirements
2.1.6 Comfort Zone in Hadhramout
24
26
2.2
Review of Traditional houses
2.2.1 Introduction
2.2.2 Type of Traditional Houses
2.2.3 Traditional House and its Adaptation to the Region
29
29
30
31
2.2.4 Mud Traditional Houses 34
2.2.4.1 Foundations
2.2.4.2 Mud Walls
2.2.4.3 Ceiling Construction
35
36
37
2.2.5 Typical Houses in the Coastal Region
2.2.5.1 Traditional Houses
2.2.5.2 Traditional Courtyard House
2.2.6 Typical Houses in the Plateaus Region
37
39
39
41
2.2.7 Stone Traditional Houses 43
2.2.7.1 Foundations
2.2.7.2 Stone Walls
2.2.7.3 Ceiling Construction
43
44
45
2.3
2.2.8 Type of Stone Houses
2.2.9 Stone Houses in the Mountainous Region
2.2.10 Reed Houses
2.2.11 Tent
2.2.12 Summary
Conclusion
45
46
48
49
51
52

v
CHAPTER THREE: THERMAL BEHAVIOR IN HOUSES OF YEMEN 54
3.1
3.2
3.3
3.4
3.5
Previous Housing Studies in Yemen
Orientation of the City Plan in Hadhramout
Design of the Courtyard Houses in Hadhramout
Benefit of Courtyard in Traditional Houses in Hadhramout
3.4.1 Social Benefits
3.4.2 Religion Benefits
3.4.3 Climate Benefits
Thermal Behaving in Houses
3.5.1 Introduction
3.5.2 Effect of Heat on Houses
3.5.3 Passive Control of Heat Flow
54
57
58
59
60
60
61
61
61
62
63
3.5.4 Effect of Design Variables on Houses 65
3.5.4.1 Shape
3.5.4.2 Fabric
3.5.4.3 Ventilation
3.5.4.4 Fenestration
66
67
68
70
3.6 Thermal Response Simulation 72
3.6.1 COMIS
3.6.2 DOE-2
3.6.3 Energy Plus
3.6.4 eQUEST
3.6.5 ESPr
3.6.6 FLOVENT
73
74
74
74
75
75
3.6.7 HTB2
3.6.8 TRNSYS
76
77
3.7
Conclusion
77
CHAPTER FOUR: METHODOLOGY 79
4.1 Introduction 79
4.2 Method Questionnaire Survey 80
4.2.1 Pilot Study 81
4.2.2 The Main Study 81

vi
4.3 Method of Case Study in Hadhramout 82
4.3.1 Location of the Study 82
4.3.2 Type of Courtyard 85
4.3.3 Experimental Equipment 86
4.3.4 Experimental Method 88
4.3.5 Limitation of Data Collection 88
4.4 CFD Simulation Using FloVent 89
4.3.1 Model Setup in FloVent 91
4.4.2 Wind Flow Simulation 93
4.4.3 Temperature 95
4.4.4 Material Properties 95
4.4.5 Solar Radiation 96
4.4.6 Pilot Test 97
4.5 Summary
98
CHAPTER FIVE: A STUDY OF RESIDENTS ATTITUDE TOWARDS REDUCING ENERGY CONSUMPTION
99
5.1 Questionnaire 99
5.2 Results – Section One 101
5.2.1 Question 1 - Type of Dwelling
5.2.2 Question 2 - Wall Material
5.2.3 Question 3 - Roof Material
5.2.4 Question 4 - Type of Ventilation Systems
5.2.5 Question 5 - Number of Rooms
5.2.6 Question 6 - The Electricity Bill (YR) 5.2.7 Question 7 - The Electricity Sources
101
102
103
104
105
106
107
5.3 Finding – Section Two 108
5.3.1 Statement 1 - How Natural C.H.L.V Systems Work
5.3.2 Statement 2 - Can Natural C.H.L.V System Reducing Energy
5.3.3 Statement 3 - The Important of Energy Consumption
5.3.4 Statement 4 - The Use of Air Conditioner in Summer
5.3.5 Statement 5 - The Use of Thermal Insulation in Reducing Air
Conditioning Use
108
109
110
111
112

vii
5.3.6 Statement 6 - The Use of Courtyards in Modern Houses
5.3.7 Statement 7 - The Courtyards Waste of Space
5.3.8 Statement 8 - The Feasibility of Traditional House System in Hadhramout 5.3.9 Statement 9 - The Feasibility of Local Material in Hadhramout
5.3.10 Statement 10 - The Possible Avoidance of Foreign Designs
Use in Hadhramout
113
114
115
116
117
5.4
5.5
Summary
Conclusion
118
120
CHAPTER SIX : CASE STUDY OF TRADITIONAL HOUSE IN THE COASTAL AREA OF HADHRAMOUT
121
6.1 Introduction 121
6.2 Case Study No. 1 122
6.2.1 Location and Description of the House
6.2.2 Test Courtyards and Living Room
6.2.3 Data Collection
122
123
126
6.3 Case Study No. 2 127
6.3.1 Location and Description of the House
6.3.2 Test Courtyards and Living Room
6.3.3 Data Collection
127
128
131
6.4 Case Study No. 3 132
6.4.1 Location and Description of the House
6.4.2 Test Courtyards and Living Room
6.4.3 Data Collection
132
133
136
6.5 Case Study No. 4 137
6.5.1 Location and Description of the House
6.5.2 Test Courtyards and Living Room
6.5.3 Data Collection
137
138
141
6.6 Case Study No. 5 142
6.6.1 Location and Description of the House
6.6.2 Test Courtyards and Living Room
6.6.3 Data Collection
142
143
146

viii
6.7 Case Study No. 6 147
6.7.1 Location and Description of the House
6.7.2 Test Courtyards and Living Room
6.7.3 Data Collection
147
148
151
6.8 Case Study No. 7 152
6.8.1 Location and Description of the House
6.8.2 Test Courtyards and Living Room
6.8.3 Data Collection
152
153
156
6.9 Case Study No. 8 157
6.9.1 Location and Description of the House
6.9.2 Test Courtyards and Living Room
6.9.3 Data Collection
157
158
161
6.10 Case Study No. 9 162
6.11
6.10.1 Location and Description of the House
6.10.2 Test Courtyards and Living Room
6.10.3 Data Collection
Data Analysis
162
163
166
167
6.12
6.13
6.11.1 Actual Condition and Comfort Requirement
Summary
Conclusion
167
171
173
CHAPTER SEVEN : COMPUTATIONAL FLUID DYNAMIC (CFD) SIMULATION USING THE SOFTWARE FLOVENT
175
7.1
7.2
Introduction
Simulation Results and Discussion
175
176
7.2.1 Case Study No. 1
7.2.2 Case Study No. 2
7.2.3 Case Study No. 3
7.2.4 Case Study No. 4
7.2.5 Case Study No. 5
7.2.6 Case Study No. 6
7.2.7 Case Study No. 7
7.2.8 Case Study No. 8
177
179
181
183
185
186
187
189

ix
7.2.9 Case Study No. 9 191
7.3
7.4
7.5
Effect of Airflow and Temperature
Comparison of Air Temperatures
Conclusion
193
193
196
CHAPTER EIGHT : CONCLUSIONS AND RECOMMENDATIONS
198
8.1 Introduction 198
8.2
8.3
8.4
8.5
Summary
Conclusion
Future Research
Recommendations
198
201
202
203

x
LIST OF TABLES Page
Table 2.1 Temperatures and Rainfall at Different Altitude
16
Table 2.2 Minimum, Maximum and Mean Temperature ºC 16
Table 2.3 The Angles of the Sun in Summer and Winter over the Major Cites of Yemen
17
Table 2.4 Wind Speed and Directions 18
Table 2.5 Rainfall (mm) 18
Table 2.6 Wind Speed and Directions in Al-Mukalla City 23
Table 2.7 Rainfall (mm) in Al-Mukalla City in 1999 to 2003 24
Table 2.8
Summary of Traditional Mud and Design of Houses in the Regions
51
Table 4.1
Data Type Equipment, Data Interval, Location of Measurement
87
Table 4.2 Specification and Properties of House Materials 96
Table 4.3 Table 4.4
Main Parameters Data for all Case Studies Main Variables Data for Case Study No. 1
98
98
Table 5.1 Frequency Analysis on Type of Dwelling (Question 1) 101
Table 5.2 Frequency Analysis on Wall Material (Question 2) 102
Table 5.3 Frequency Analysis on Roof Material (Question 3) 103
Table 5.4 Frequency Analysis on Type of Ventilation Systems (Question 4)
104
Table 5.5 Table 5.6 Table 5.7
Frequency Analysis on Number of Rooms (Question 5) Frequency Analysis on Electricity Bill (YR) (Question 6) Frequency Analysis on Electricity Sources (Question 7)
105
106
107
Table 6.1 Table 6.2 Table 6.3
Summary of Air Temperatures for Case Study No. 1 Summary of Air Temperatures for Case Study No. 2 Summary of Air Temperatures for Case Study No. 3
126
131
136
xi
Table 6.4 Table 6.5 Table 6.6
Summary of Air Temperatures for Case Study No. 4 Summary of Air Temperatures for Case Study No. 5 Summary of Air Temperatures for Case Study No. 6
141
146
151
Table 6.7 Table 6.8 Table 6.9
Summary of Air Temperatures for Case Study No. 7 Summary of Air Temperatures for Case Study No. 8 Summary of Air Temperatures for Case Study No. 9
156
161
166
Table 6.10 Summary of the Analyses of Air Temperature in All Cases
171
Table 7.1 Shows Computation of Root Mean Square Percent Error (RMSPE)
194
xii
LIST OF FIGURES
Page
Figure 1.1 Model View of Traditional House with Deep and Shallow Courtyards
2
Figure 1.2 Figure 1.3 Figure 1.4
Electricity Consumption in Residential of Coastal Hadhramout Electricity Consumption in Yemen from 1991 to 2005 The Working Conceptual Model
3
4
7
Figure 2.1 Location of Yemen in the Arabian Peninsula
10
Figure 2.2 Figure 2.3
Map of Republic of Yemen Showing Each Region Map of Governorates in Yemen
11
16
Figure 2.4 Maximum Daily Temperatures for Al-Mukalla City
20
Figure 2.5 Minimum Daily Temperatures for Al-Mukalla City
20
Figure 2.6 Mean Daily Temperatures for Al-Mukalla City
21
Figure 2.7 Mean Relative Humidity for Al-Mukalla City
22
Figure 2.8 Comfort Zone for Al-Mukalla City (1980-1990) as Recommended by ASHRAE
25
Figure 2.9 Psychrometric Chart for Al-Mukalla City (2000) Bio-climatic Recommended Comfort Zone
26
Figure 2.10 Figure 2.11 Figure 2.12 Figure 2.13 Figure 2.14 Figure 2.15
Winter and Summer Comfort Zones for Hadhramout Construction Details of Mud Houses Function Distribution Diagram for Ground Floor Distribution of Function Parts in the Traditional Houses Typical Plan of Traditional Houses in Coastal Hadhramout Section and Ground Floor Mud House in the Town of Shibam
28
36
38
40
40
42
Figure 2.16 Figure 2.17
Construction Details of Stone Houses Plans of Stone and Brick House in the Old City of Sana’a
44
47

xiii
Figure 3.1 Figure 3.2
Concept the Shallow and Deep Courtyards with Environment Heat Exchange Processes with Environment in House
59
63
Figure 4.1 Traditional House with Deep, Shallow Courtyards and Living Room
85
Figure 4.2 Shapes of the Aspect Ratio of the Two Courtyards 86
Figure 4.3 A 3D Grid in Single Space with 11 x 8 x 5 = 440 Cells 91
Figure 4.4 Figure 4.5
The Monitor Points Approach for Temperature Constant when Residuals Converge Vertical Profile of Wind and the House Model with its Surroundings
93
94
Figure 5.1 Frequency Distribution of the Type of Dwelling
101
Figure 5.2 Frequency Distribution of Wall Material
102
Figure 5.3 Frequency Distribution of Roof Material
103
Figure 5.4 Frequency Distribution of Ventilation Systems
104
Figure 5.5 Frequency Distribution of the Number of Rooms
105
Figure 5.6 Frequency Distribution of the Electricity Bill (YR)
106
Figure 5.7 Frequency Distribution of the Electricity Sources
107
Figure 5.8 Results of Frequency Analysis of the How of Natural C.H.L.V Systems Work
108
Figure 5.9
Results of Frequency Analysis of the Can Natural C.H.L.V System Reducing Energy
109
Figure 5.10 Results of Frequency Analysis of the Important of Energy Consumption
110
Figure 5.11 Results of Frequency Analysis of the Use of Air Conditioner in Summer
111
Figure 5.12 Results of Frequency Analysis of the Use of Thermal Insulation in Reducing Air Conditioning Use
112
Figure 5.13 Results of Frequency Analysis of the Use of Courtyards in Modern Houses
113
xiv
Figure 5.14 Results of Frequency Analysis of the Courtyards Waste of Space
114
Figure 5.15 Results of Frequency Analysis of the Feasibility of Traditional House System in Hadhramout
115
Figure 5.16
Results of Frequency Analysis of the Feasibility of Traditional House System in Hadhramout
116
Figure 5.17 Results of Frequency Analysis of the Possible Avoidance of Foreign Designs Use in Hadhramout
117
Figure 6.1
Ground Floor Plan and Section for the Case Study No.1
123
Figure 6.2 Air Temperature in SCH1,LRH1,DCH1 and Outside
126
Figure 6.3 Ground Floor Plan and Section for the Case Study No.2
128
Figure 6.4 Air Temperature in SCH2, LRH2, DCH2 and Outside
131
Figure 6.5 Ground Floor Plan and Section for the Case Study No.3
133
Figure 6.6 Air Temperature in SCH3, LRH3, DCH3 and Outside
136
Figure 6.7 Ground Floor Plan and Section for the Case Study No.4
138
Figure 6.8 Air Temperature in SCH4, LRH4, DCH4 and Outside
141
Figure 6.9 Ground Floor Plan and Section for the Case Study No.5
143
Figure 6.10 Air Temperature in SCH5, LRH5, DCH5 and Outside
146
Figure 6.11 Ground Floor Plan and Section for the Case Study No.6
148
Figure 6.12 Air Temperature in SCH6, LRH6, DCH6 and Outside
151
Figure 6.13 Ground Floor Plan and Section for the Case Study No.7
152
Figure 6.14 Air Temperature in SCH7, LRH7, DCH7 and Outside
156
Figure 6.15 Ground Floor Plan and Section for the Case Study No.8
158
Figure 6.16 Air Temperature in SCH8, LRH8, DCH8 and Outside
161
Figure 6.17 Ground Floor Plan and Section for the Case Study No.9
163
Figure 6.18 Air Temperature in SCH9, LRH9, DCH9 and Outside
166
xv
Figure 6.19 Figure 6.20 Figure 6.21 Figure 6.22 Figure 6.23
Interior Climatic Condition for Case Study No. 6 Interior Climatic Condition for Case Study No. 7 Interior Climatic Condition for Case Study No. 3 Interior Climatic Condition for Case Study No. 5 Difference Between Air Temperature and Aspect Ratio in Each Courtyard
167
168
169
170
172
Figure 6.24 Aspect Ratio and Mean Difference Air Temperature Correlation
172
Figure 7.1 Distribution of Airflow Patterns in Case Study No. 1
177
Figure 7.2 Air Temperatures in Case Study No. 1
178
Figure 7.3 Distribution of Airflow Patterns in Case Study No. 2
179
Figure 7.4 Air Temperatures in Case Study No. 2
180
Figure 7.5 Distribution of Airflow Patterns in Case Study No. 3
181
Figure 7.6 Air Temperatures in Case Study No. 3
182
Figure 7.7 Distribution of Airflow Patterns in Case Study No. 4
183
Figure 7.8 Air Temperatures in Case Study No. 4
184
Figure 7.9 Distribution of Airflow Patterns in Case Study No. 5
185
Figure 7.10 Air Temperatures in Case Study No. 5
186
Figure 7.11 Distribution of Airflow Patterns in Case Study No. 7
187
Figure 7.12 Air Temperatures in Case Study No. 7
188
Figure 7.13 Distribution of Airflow Patterns in Case Study No. 8
189
Figure 7.14 ِ◌◌ِ◌ِ◌ِ◌ِ◌ِAir Temperatures in Case Study No. 8
190
Figure 7.15 Distribution of Airflow Patterns in Case Study No. 9
191
Figure 7.16 Air Temperatures in Case Study No. 9
192
Figure 7.17 Comparison of Mean Air Temperature at 12:00 noon
194
Figure 7.18 Percentage Error in the Case Studies
195

xvi
LIST OF PLATES
Page
Plate 2.1 Plate 2.2
Fanlight on the Elevation of a Traditional house in Sana’a Mud and Hay are Mixed to Form Adobe Bricks
33
35
Plate 2.3 Trunks of Tamarisk was Laid to Form the Roof
37
Plate 2.4 A Mud Houses in Coastal Hadhramout
39
Plate 2.5 A Mud House in the Town of Shibam
41
Plate 2.6 Facade of Stone and Brick House in the Old City of Sana’a
46
Plate 2.7
Reed House in the Tihama
48
Plate 2.8 Plate 3.1 Plate 4.1
Tent in the Desert Part of the City Plan of Ashshihr, Showing the Entrances of Men and Women Satellite Image of the Coastal Hadhramout
49
58
84
Plate 4.2 Sensors to Measure the Surface Temperature of the Inner Walls
87
Plate 4.3 Wind Measured Device
87
Plate 4.4 Relative Humidity Measuring Device
87
Plate 6.1 View of the Neighborhood Around the Property of Bin Thabet's (Case Study No. 1)
122
Plate 6.2 Shallow Courtyard in Case Study No. 1
124
Plate 6.3 Deep Courtyard in Case Study No. 1
125
Plate 6.4 A View of the Neighborhood Surrounding Al-kamel’s Property (Case Study No. 2)
127
Plate 6.5 Shallow Courtyard in Case Study No. 2
129
Plate 6.6 Deep Courtyard in Case Study No. 2
130
Plate 6.7 View of the Neighborhood Around the Property of Al-Mashap’s (Case study No. 3)
132
Plate 6.8
Shallow Courtyard in Case Study No. 3 134

xvii
Plate 6.9
Deep Courtyard in Case Study No. 3 135
Plate 6.10
A View of the Neighborhood Surrounding Al-Yazedy’s Property (Case Study No. 4)
137
Plate 6.11 Shallow Courtyard in Case Study No. 4
139
Plate 6.12 Deep Courtyard in Case Study No. 4
140
Plate 6.13 View of the Neighborhood around the Property of Al-Shatri’s (Case Study No. 5)
142
Plate 6.14 Shallow Courtyard in Case Study No. 5
144
Plate 6.15 Deep Courtyard in Case Study No. 5
145
Plate 6.16 A View of Neighborhood Surrounding Baslama’s Property (Case Study No. 6)
147
Plate 6.17 Shallow Courtyard in Case Study No. 6
149
Plate 6.18 Deep Courtyard in Case Study No. 6
150
Plate 6.19 View of the Neighborhood Around the Property of Bamatraf’s (Case Study No. 7)
152
Plate 6.20 Shallow Courtyard in Case Study No. 7
154
Plate 6.21 Deep Courtyard in Case Study No. 7
155
Plate 6.22 A View of Neighborhood Surrounding Bawadi’s Property (Case Study No. 8)
157
Plate 6.23
Shallow Courtyard in Case Study No. 8 159
Plate 6.24
Deep Courtyard in Case Study No. 8 160
Plate 6.25
View of the Neighborhood Around the Property of Al-Ateshe’s (Case Study No. 9)
162
Plate 6.26
Shallow Courtyard in Case Study No. 9 164
Plate 6.27
Deep Courtyard in Case Study No. 9 165

xviii
LIST OF ABBREVIATION
∆T Temperature difference ∆S Change in heat store 3D Three Dimensions A Area (m²) ASHRAE American Society of Heating, Refrigerating and Air-Conditioning
Engineers CFD Computational Fluid Dynamic CLEAR Comfortable Low Energy ARchitecture DCHn Deep Courtyard House Number of case g/kg G.W/H
Grams of Moisture Per Kilogram of Dry Air Gig Watt per Hour
H Height K Thermal Conductivity (W/M°C) K Kelvin (unit of temperature) Kg/m³ Density ( Unit energy flow rate through unit area) Kj/K°c Specific heat ( Energy required by substance for unit temperature
increase “per unit mass or unit volume”) K-ε Turbulent kinetic energy dissipation model L Thickness (m) L Length L,V,H,C Lighting, Ventilation, Heating, Cooling LRHn Living Room House Number of case m²k/w Resistance N Number of air changes per hour ºC Celsius or Centigrade Q Heat flow Qc Conduction heat gain or loss Qe Evaporation heat loss Qi Internal heat gain Qs Solar heat gain Qv Ventilation heat gain or loss qv Ventilation rate (m³) R Thermal resistance (m²k/w) RMSPE Root Mean Square Percent Error SCHn SET
Shallow Courtyard House Number of case Standard Effective Temperature
xix
SPSS Statistical Package for the Social sciences Tair Air temperature Tair dp Dew point temperature tc Temperature of the cold side (°C) th Temperature of the hot side (°C) Ti
Tn Inside air temperature (°C) Neutrality Temperature (°C)
To
To.av Outside air temperature (°C) Average Outside air temperature (°C)
Tsky Sky temperature U Heat transfer (w/m²k) Vg Mean wind speed reference height Zg Vr Volume room or building (m³) Vz Mean wind speed height Z W Width W/M°C Conductivity ( heat flow rate through unit area of unit thickness of
substance with unit temperature difference between the two faces) W/M²K Heat transfer ( heat flow rate through unit area of body with unit
difference in temperature of air on the two side) X,Y,Z Coordinate directions YR Yemeni Riyal Yta Actual values Ytb Base simulated values Z Height above ground level Zg Reference roughness
REFERENCES
204
APPENDICES
Appendix A : Weather Data from Fieldwork and Riyan Station 213
Appendix B : Approach of Monitor Points 230
Appendix C : Simulation 234
Appendix D : Questionnaire
Appendix E : Surface Temperatures, Relative Humidity and Frequency Analysis Appendix F : Climatic Condition
239
245
254
xx
LIST OF PUBLICATIONS & SEMINARS
1. Thabet, M. M., Ismail, A. M and Ismail, M. R. (2006). Analysis of the Thermal Behaviour in the Traditional Courtyard Houses of Yemen. Proceeding of the International Conference on Sustainable Housing (ICSH) 18-19 September, 2006. Malaysia. 2. Thabet, M. M., Ismail, A. M and Ismail, M. R. (2006). Comparison Recording Air Temperature with Computational Fluid Dynamics “FLOVENT”. Proceeding of Post—Graduate Research Colloquium 27-28 Feb. 2006, H, B and P. USM. Penang, Malaysia.

xxi
TINGKAH-LAKU TERMA DI DALAM RUMAH-RUMAH TRADISI BERLAMAN DALAM DI YEMEN
ABSTRAK
Perkembangan pesat dalam suhu global, populasi, penggunaan tenaga
dan pencemaran telah menjadi isu penting yang kian membimbangkan. Isu-isu
ini telah memaksa kerajaan Yemen untuk mengurangkan penggunaan tenaga
dalam semua sektor khususnya dalam sektor perumahan. Pengurangan
penggunaan tenaga memerlukan pengunaan teknik-teknik pasif dan bahan
tempatan untuk mengawal perlakuan terma normal seperti mana lazimnya
dalam bangunan rekacipta tradisi. Jenis rumah di Yemen berbeza dari kawasan
ke kawasan bergantung kepada bahan binaan yang ada, iklim dan teknik pasif
pengawalan terma yang khusus untuk setiap kawasan. Kajian ini meneroka
teknik-teknik pasif yang diguna pakai oleh rumah-rumah tradisional di kawasan
pantai Hadhramout yang panas terik dan berbahang itu. Ciri utama rumah-
rumah tradisional di kawasan ini ialah penggunaan ruang legar bertanah liat.
Soalselidik juga telah dijalankan di Hadhramout untuk menentukan sikap
penghuni terhadap pengurangan penggunaan tenaga melalui penggunaan
bahan tempatan dan teknik-teknik pasif kawalan terma. Kajian menunjukkan
bahawa kebanyakan responden merasakan bahawa penggunaan teknik
kawalan terma semulajadi dan bahan tempatan dalam pembinaan merupakan
salah satu cara mengurangkan penggunaan tenaga di Yemen. Menerusi kajian
lapangan di kawasan pantai Hadhramout, kajian bermatlamat menyiasat kesan
dua nisbah aspek yang berlainan dalam sebuah rumah yakni bagi ruang legar
yang cetek dan yang dalam. Keputusan menunjukkan bahawa, pada umumnya,
suhu udara adalah kurang di dalam rumah tradisional berbanding dengan
xxii
persekitaran luar. Perbandingan bacaan suhu udara di dalam ruang legar
menunujukkan bahawa tatkala nisbah aspek ruang legar meningkat suhu udara
turut meningkat. Data dari lapangan kemudiannya dibandingkan dengan data
dari Komputasi Aliran Dinamik (CFD) perisian FloVent. Keputusan
menunjukkan bahawa terdapat korelasi yang baik, r²=0.85, di antara model
skala yang disimulasi (ramalan) dan model sebenar di lapangan (diukur).
Analisa statistik untuk ralat peratus antara nilai yang diukur dan nilai yang
diramal dalam semua kes menghasilkan markah, -1.53%. Daripada kerja
lapangan dan simulasi komputer, laman tersebut di anggap sebagai teknik
penyejukkan yang paling sesuai untuk menangani kesan iklim kawasan pantai
di Hadhramout.

xxiii
THERMAL BEHAVIOR IN THE TRADITIONAL COURTYARD HOUSES OF YEMEN
ABSTRACT
The rapid increases in global air temperature, population, energy
consumption and pollution have become vital issues of concern. These issues
have compelled the government of Yemen to reduce energy consumption in all
sectors especially in the residential sector. To reduce energy consumption
requires the use of passive techniques and local material to control natural
thermal behavior as was the case in traditionally designed buildings. The types
of traditional houses in Yemen vary from region to region, depending on the
available material, climate and passive technique of thermal control peculiar to
each area. This research explores the passive techniques used by traditional
houses in the hot and humid coastal regions of Hadhramout. The main
characteristic traditional houses in this area are the use of mud courtyards. A
survey was carried out in Hadhramout to determine resident’s attitudes about
reducing energy consumption through the use of local material and passive
techniques of thermal control. The study shows that most respondents felt that
the use of natural thermal control technique and local materials in construction
constituted one way of reducing energy consumption in Yemen. Through field
studies in coastal Hadhramout, the study aims at investigating the effects of two
different aspect ratios of courtyards in one house namely that of the shallow and
the deep courtyard. The results show that in general there is lower air
temperatures in the traditional houses compared to the external air temperature
and in some cases the air temperature is within the thermal comfort zone of
Hadhramout. Comparing the results of the air temperature within the courtyards
xxiv
indicate that, as the aspect ratio of the courtyard increases the air temperatures
also increases. Data collections from field work were then compared with data
generated from Computational Fluid Dynamics (CFD) used software FloVent.
The results indicate good correlation of r²=0.85 between the simulation scale
model (predicted) and the actual model in the fieldwork (measured). Statistical
analyses on the percentage error between the measured and the predicted
values in all cases yielded a score of -1.53%. From the fieldwork and computer
simulation the courtyard is considered to be the most suitable cooling technique
designed to alleviate the effects of the coastal climate of Hadhramout.
1
CHAPTER ONE
INTRODUCTION
1.1 Background
In the past Yemenis used to live in the same regions that they live in
today, with the same climate but without electricity. They also depended on
natural resources from their immediate environment to be used as building
materials for their houses.
Now large artificial cooling systems such as air-conditioning fed by huge
amounts of electricity are used in preference to natural techniques of cooling.
Thus, natural resources like oil will be heavily utilized and eventually depleted.
In confronting this scenario, Fathy (1986) advises architects “to renew
traditional architecture from the moment when it was abandoned; and try to
bridge the existing gap in its development by analyzing the element of change
and, applying modern techniques to modify the valid methods established by
our ancestors, before developing new solutions that satisfy modern needs”.
There have been many studies regarding passive thermal control
through the use of wind towers and courtyards as natural ventilation devices. Al-
Bakri (1997) notes that the two architectural elements used for natural
ventilation in traditional houses were the courtyard and the triangular openings
which could not be found in a typical modern house. Thus, losing the most
important element in the process i.e., the courtyard, will limit the ability of the
existing modern houses to apply passive thermal control in the same way as
traditional houses do. Nevertheless, there has been no study as yet on the

2
system used in the traditional houses that have two courtyards i.e., the shallow
and deep courtyards. The design of these traditional houses that are made of
mud is as illustrated in Figure 1.1.
Figure1.1: Model View of Traditional House with Deep and Shallow Courtyards
1.2 Issues and Problem
In the last few years many countries of the world have made repeated
calls for the conservation of energy, one of them being Yemen. Before
independence, the people in Yemen built their houses according to their real
needs in harmony with the environment as well as with extensive and optimal
utilization of the available local building materials. In fact, Yemenis endeavored
to make full use of nature in the design of their houses. One of which was the
extensive use of natural systems in lighting, ventilation, heating and cooling
(LVHC).
After independence in 1967, especially after the unification of northern
and southern Yemen as the Republic of Yemen in 1990; and the discovery of
Shallow Courtyard
Deep Courtyard

3
oil, the country witnessed rapid development in all aspects, particularly in
construction (Ahmet, 1994). Factors, such as the return of Yemeni immigrants,
in 1991 after the second Gulf war and the influx of the population into cities in
search of better incomes, have led to serious problems within the ancient walled
cities that dot the Yemeni landscape. Consequently, mass housing projects
have been built on city outskirts to relieve some of the pressures on the inner
city areas. These new neighborhood projects have been implemented by
companies influenced by European architecture and technology, i.e., current
designs have used many ideas and building materials from the West without
careful consideration for the Yemeni climate (Al-Guhi, 2000).
Houses built in Yemen in the last two decades have given much attention
to building regulations but have neglected the climatic aspects and the
utilization of local materials. Given this trend, the use of modern mechanical
systems in these homes has increased electricity consumption as shown in
Figure 1.2.
0250005000075000
100000125000150000175000200000225000
1990
1991
1992
1993
1994
1995
1996
1997
1998
1999
2000
2001
2002
M.W
/H
Distributed Electric Power Consumed Electric Power
Figure 1.2: Electricity Consumption in Residential of Coastal Hadhramout Source: Branch Ministry of Electricity in Hadhramout Governorate

4
This increase in energy consumption inevitably leads to more natural
resources (oil) being consumed as shows in Figure1.3: apart from causing air
pollution and thus affecting the quality of indoor air. This will not only have
harmful effects on the health of households but also influence strategies and
plans to promote economic growth in the Republic of Yemen.
0500
100015002000250030003500400045005000
1991
1992
1993
1994
1995
1996
1997
1998
1999
2000
2001
2002
2003
2004
2005
G.W
/H
Distributed Electric Power Consumed Electric Power
Figure 1.3: Electricity Consumption in Yemen from 1991 to 2005 Source: Central Statistical Organization, Yemen (2005)
1.3 Aim
The main aim of this study is to investigate the natural thermal control in
the internal environment of traditional houses in Yemen.
1.4 Objectives
The objectives of this study are:
1. To identify the types of passive design elements present in traditional
houses in Yemen.
5
2. To conduct a questionnaire survey to assess individual attitudes
towards the use of passive thermal control so as to reduce energy
consumption.
3. To study and investigate the thermal behavior of the traditional
courtyard houses and their adjoining spaces (room) from the actual field
measurements.
4. To confirm the field measurement results against results from
model houses simulated using the computational fluid dynamic (CFD)
software FloVent.
1.5 Significant of the Study
This study is initially significance as a knowledge contribution to the field
of academic. The study enhances the importance of passive technique applied
in the traditional courtyard houses in Yemen. It would give an idea to the
Yemeni the effect of courtyards on indoor environment. The study could also
benefit the Yemeni’s professionals in the construction companies, architects as
well as students and other individuals for them to aware and understand the
advantages of traditional architecture in Yemen.
1.6 Limitations of the Study
The study was concentrated and limited only to the coastal area of
Hadhramout where mud double courtyard houses can be found. Traditional
houses in this part of country are formed by a compact layout in which the only
open spaces are the inner courtyards. In this region, modern houses with
mechanical ventilation systems can be found. Therefore, the study had
conducted an inventory in the fieldwork and confirmative data collection

6
between traditional houses and modelled scale houses in the same climatic
condition in the coastal area of Hadhramout.
The mud courtyard houses in this area are standard structures. The
combination of two courtyards houses in this area and their relationship to the
surrounding rooms is the main concern of this study of mud houses.
1.7 Research Question
The research questions of the study are as follows:
1. What are the types of passive design elements present in traditional
houses in Hadhramout, Yemen?
2. What is the thermal behavior of the traditional courtyard houses and
their adjoining spaces (room) from the actual field measurements?
3. Does the field measurements confirmed against similar measurements
from model houses simulated by the FloVent software?
4. What are the individual attitudes towards the use of passive thermal
control so as to reduce energy consumption?
7
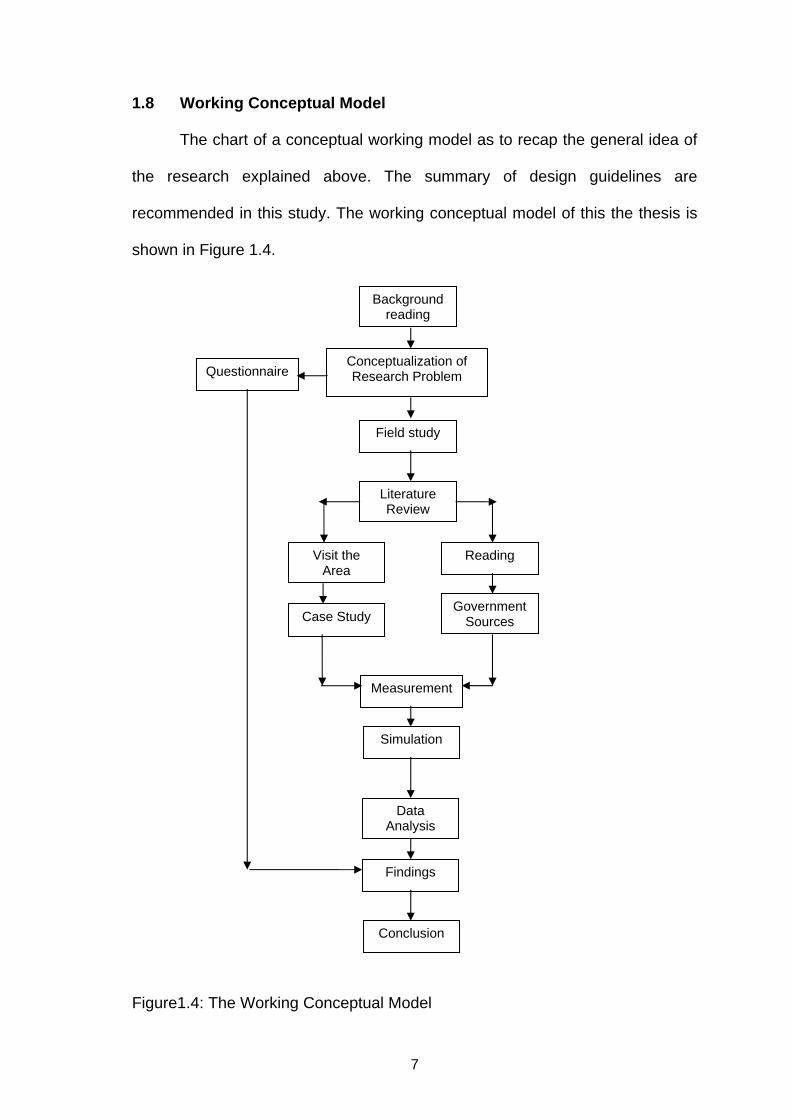
1.8 Working Conceptual Model
The chart of a conceptual working model as to recap the general idea of
the research explained above. The summary of design guidelines are
recommended in this study. The working conceptual model of this the thesis is
shown in Figure 1.4.
Figure1.4: The Working Conceptual Model
Conceptualization of Research Problem
Background reading
Field study
Literature Review
Reading Visit the Area
Government Sources Case Study
Measurement
Simulation
Data Analysis
Findings
Conclusion
Questionnaire

8
1.9 Outline of Thesis
The thesis is organized into eight chapters. These are summarized as
below:
Chapter One: Introduction
The first chapter forms the introduction of the thesis that focuses on the
background, problem, aim and objectives of the research, its limitations,
research questions as well as the working conceptual model.
Chapter Two: Background Study of Yemen
The second chapter gives information on the Republic of Yemen, its
location in Asia, its regions and topography and its climate. This chapter also
provides an overview of traditional houses in Yemen, describing the
construction and materials of each type of house in each region.
Chapter Three: Thermal Behavior in Houses of Yemen
Chapter three outlines how the orientation system used in the city and in
the houses that are suited to its environment and its benefit to the occupants.
The theory of thermal behavior in houses and the influence of climate on the
design of building are also included.
Chapter Four: Methodology
Chapter four describes the methodology used in this research which
includes the questionnaire survey, fieldwork measurement and simulation using
a CFD program (FloVent).
9
Chapter Five: Survey
This chapter discuses a questionnaire survey undertaken in Yemen to
assess individual attitudes towards the use of passive thermal control so as to
reduce energy consumption.
Chapter Six: Case Study
This chapter describes the analysis of the fieldwork data which was
taken in the selected traditional houses to identify the thermal performance in
courtyards and living rooms.
Chapter Seven: Simulation
This chapter looks into the use of computational fluid dynamics software
to simulate the thermal performance of both traditional and model houses these
to confirm the data collected from the fieldwork in chapter five.
Chapter Eight: Conclusion
This is the final part of the research which concludes the overall findings
of the research as well as laying down some recommendations for future
studies.

10
CHAPTER TWO
BACKGROUND STUDY OF YEMEN
2.1 Climate and Comfort Zones
2.1.1 Location of Yemen
The Republic of Yemen is located in the southwest of Asia, in the
southern part of the Arabian Peninsula. Its neighbors are the Sultanate of Oman
in the east and Saudi Arabia to the north. On the western border is the Red Sea
while in the south lie the Indian Ocean. Yemen is located between latitude 12°
to 20°N and between longitudes 42° to 54°E. The total area of the country is
approximately 523,000 km². The southern coast of Yemen extends a distance
of more than 1200 km in length while the western coast is about 700 km long.
There are numerous islands of Yemen’s coast, the biggest of which is Socotra,
situated south of Yemen. Figure 2.1 represents the map of Yemen.
Figure 2.1: Location of Yemen in the Arabian Peninsula Resources: Country profile: Asia

11
2.1.2 Regions and the Topography of Yemen
Yemen was formed through the multi-combination of trans-formable
rocks. The topography varies from high mountains, desert areas, long coastal
areas and deep valleys. There is a great difference in elevation as the Yemeni
landscape rises from sea level to nearly 3700 m. The nation is divided into five
geographical regions i.e. Figure 2.2 shows these regions in Yemen the Coastal
region, the Plateau region, the Mountainous region, the Desert region and the
Islands. (Statistical Year-Book 2003)
Figure 2.2: Map of Republic of Yemen Showing Each Region Resources: World Atlas
Desert Region
Plateau Region Mountainous
Region
Coastal Region
12
Geographically Hadhramout governorate is situated between latitude 14°
to 20°N and between longitude 47° to 51°E. Hadhramout is situated almost
halfway between Aden and eastern borders with Oman. The southern part of
the Hadhramout lies on the coastal region covered to the west with sand dunes,
the middle part of Hadhramout lies on the plateaus region and the northern part
of the Hadhramout lies on the desert region.
The history of Hadhramout as a trading centre dated back over 3000
years. Marco Polo and Ibn Batuta visited Al-Mukalla city in the 11th and 12th
centuries. Al-Mukalla was often visited by traders and as a stop over from China
and India. In the 1800's Al-Mukalla grew as a ship fuelling port, holding stocks
of coal and water supplies for the early steamers.
Al-Mukalla is the capital of Hadhramout governorate now, located off the
southeast tip of Yemen and at the south of the Arab Peninsula. Al-Mukalla is
one of the Yemeni ports on the Arabian Sea. Fishermen were the first to settle
in Al-Mukalla having emigrated from adjacent regions. Al-Mukalla is the capital
of the Qua’iti Sultanate in 1877. The economy of Al-Mukalla is based on fishing
industry.
2.1.2.1 The Coastal Region
The coastal strip lies between the Red Sea and the Arabian Sea and is
1900 km long. It includes the western plain (Zabid, Rima) and the Southern
plain (Ahwar, Hajer and Mayfa'a). The western plain lies between the Red Sea
and the Western Escapement with an altitude of up to 300 m. It is 420 km long

13
and has a width of between 20 to 40 km. The southern plain lies between the
Arabian Sea and the southern escapement with the altitude rising to about 200
to 500 m high. It is between 10 to 60 km wide.
2.1.2.2 The Plateaus Region
The eastern plateaus are dissected in particular by, the north
Hadhramout and its tributaries. The climate in general is hot and dry; with
annual rainfall below 10 mm. The eastern plateaus include both low and high
mountains ranges. Altitude varies between 1000 m to 1700 m above sea level.
2.1.2.3 The Mountainous Region
The High lands tower up to 1800 m above the plains of Saada and
Sana'a. This area lies to the east and north of the mountainous region, which
has hills in parallel with the hills facing the Rub Al-Khali (Desert of Empty
Quarter). The altitude ranges from 1800 to 3760 m above sea level. The climate
varies from hot at lower elevations to cool at the highest altitudes and average
rainfall is from 300 to 1000 mm.
2.1.2.4 The Desert Region
The desert region covers large areas of Al-Jawf, Mareb, Shabuwa and
part of Hadhramout and elevation drops gradually from 1000 m towards the
north east to less than 500 m in the desert. Rainfall and vegetation are nearly
absent. In the north, lies the Empty Quarter Desert (Rub’ Al-Khali), which
extends into Saudi Arabia and is approximately 500,000 km² in area. This sandy
desert is one of the most desolate regions of the world.

14
2.1.2.5 The Islands
The Republic of Yemen has more than 120 islands. The most important
of all is Socotra with its unique biodiversity of flora and fauna unlike that of any
other region in Yemen. Socotra is the biggest island in Yemen. It is situated
south of Yemen and has an area of 3100 km².
The physical and geographical barriers of high mountains, large deserts,
deep valleys and extensive coastal areas have naturally divided the country into
three urban zones. Each zone has a different climate and traditional heritage.
The zones are: the Coastal Region, the Plateau Region and the Mountainous
Region. (Leipzig, 1996)
2.1.3 General Climate of Yemen
The climate in Yemen varies according to its different topography. The
country could be divided into three urbanized zones, each of which has very
different climatic conditions. There are no distinct variations between the
seasons. Generally, there are two main seasons, namely, summer and winter.
The climate of the coastal region during the summer is hot with the air
temperature of about 35 °C and humidity as high as 80 %. The mean
temperature in winter is around 22 °C. The average annual rainfall varies from
less than 50 mm to 255 mm. The coastal region includes the low coastal plains
facing the Red Sea, the Gulf of Aden and the Arabian Sea. It consist a coastal
strip extending from the Omani border in the east towards the Gulf of Aden in
the southwest and towards the Saudi border in the north.

15
The plateau region covers the northern boundary of Yemen. The
mountains zone to the west, the coastal plains to the south and the Empty
Quarter desert to the north border of this region. The climate here is generally
whether air temperature at about 32 °C and humidity at about 30 %. The
average rainfall in this region is generally below 200 mm. This region is
subdivided into the northern zone, the southern zone, Hadhramout and the Al-
Ghadydah basin. It contains basin expanses of sand desert and dissected
plateaus with altitudes ranging from 500 m to 800 m in the north and south.
The Mountainous region of this area consists of the western mountain
range that dominates a large part of the country. Elevation rises from 500 m at
the foothills at its southern sections to 3700 m in the western section. Rainfall is
related to elevation and generally ranges between 300 - 1000mm. This region is
divided into three main catchments zones i.e., the western zone sloping towards
the Red Sea, the southern zone sloping towards the Gulf of Aden and the north
eastern zone sloping towards the desert of Empty Quarter. Temperate is
moderate in summer 24.7 °C and cool in winter 4.6 °C. Tables 2.1 to 2.5 show
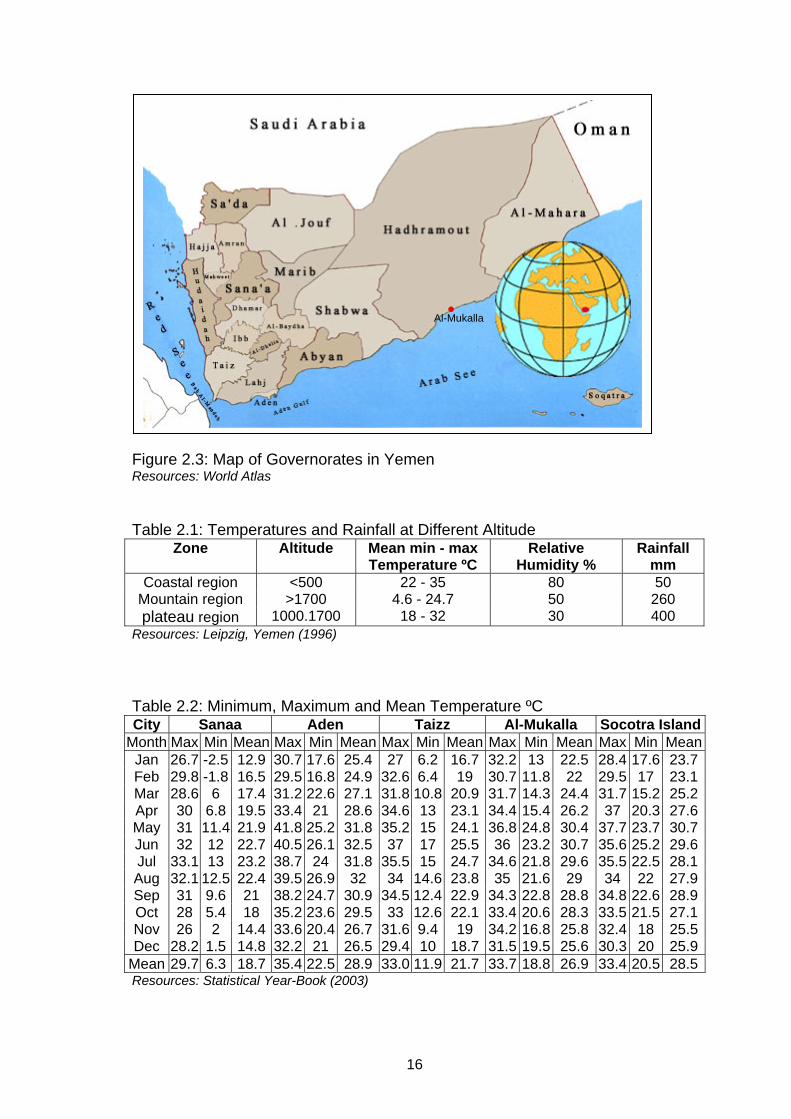
the air temperatures, wind direction, rainfall and sun path in the major cities of
all regions. The location of these major cities is shown in Figure 2.3. These
tables provide details of the maximum and minimum temperatures, the angle of
the sun, the mean speed and direction of wind during each month as well as
monthly rainfall levels.
16
Figure 2.3: Map of Governorates in Yemen Resources: World Atlas
Table 2.1: Temperatures and Rainfall at Different Altitude Zone Altitude Mean min - max
Temperature ºC Relative
Humidity % Rainfall
mm Coastal region <500 22 - 35 80 50
Mountain region >1700 4.6 - 24.7 50 260 plateau region 1000.1700 18 - 32 30 400
Resources: Leipzig, Yemen (1996) Table 2.2: Minimum, Maximum and Mean Temperature ºC City Sanaa Aden Taizz Al-Mukalla Socotra Island
Month Max Min Mean Max Min Mean Max Min Mean Max Min Mean Max Min MeanJan 26.7 -2.5 12.9 30.7 17.6 25.4 27 6.2 16.7 32.2 13 22.5 28.4 17.6 23.7Feb 29.8 -1.8 16.5 29.5 16.8 24.9 32.6 6.4 19 30.7 11.8 22 29.5 17 23.1Mar 28.6 6 17.4 31.2 22.6 27.1 31.8 10.8 20.9 31.7 14.3 24.4 31.7 15.2 25.2Apr 30 6.8 19.5 33.4 21 28.6 34.6 13 23.1 34.4 15.4 26.2 37 20.3 27.6May 31 11.4 21.9 41.8 25.2 31.8 35.2 15 24.1 36.8 24.8 30.4 37.7 23.7 30.7Jun 32 12 22.7 40.5 26.1 32.5 37 17 25.5 36 23.2 30.7 35.6 25.2 29.6Jul 33.1 13 23.2 38.7 24 31.8 35.5 15 24.7 34.6 21.8 29.6 35.5 22.5 28.1Aug 32.1 12.5 22.4 39.5 26.9 32 34 14.6 23.8 35 21.6 29 34 22 27.9Sep 31 9.6 21 38.2 24.7 30.9 34.5 12.4 22.9 34.3 22.8 28.8 34.8 22.6 28.9Oct 28 5.4 18 35.2 23.6 29.5 33 12.6 22.1 33.4 20.6 28.3 33.5 21.5 27.1Nov 26 2 14.4 33.6 20.4 26.7 31.6 9.4 19 34.2 16.8 25.8 32.4 18 25.5Dec 28.2 1.5 14.8 32.2 21 26.5 29.4 10 18.7 31.5 19.5 25.6 30.3 20 25.9
Mean 29.7 6.3 18.7 35.4 22.5 28.9 33.0 11.9 21.7 33.7 18.8 26.9 33.4 20.5 28.5Resources: Statistical Year-Book (2003)
Al-Mukalla
17
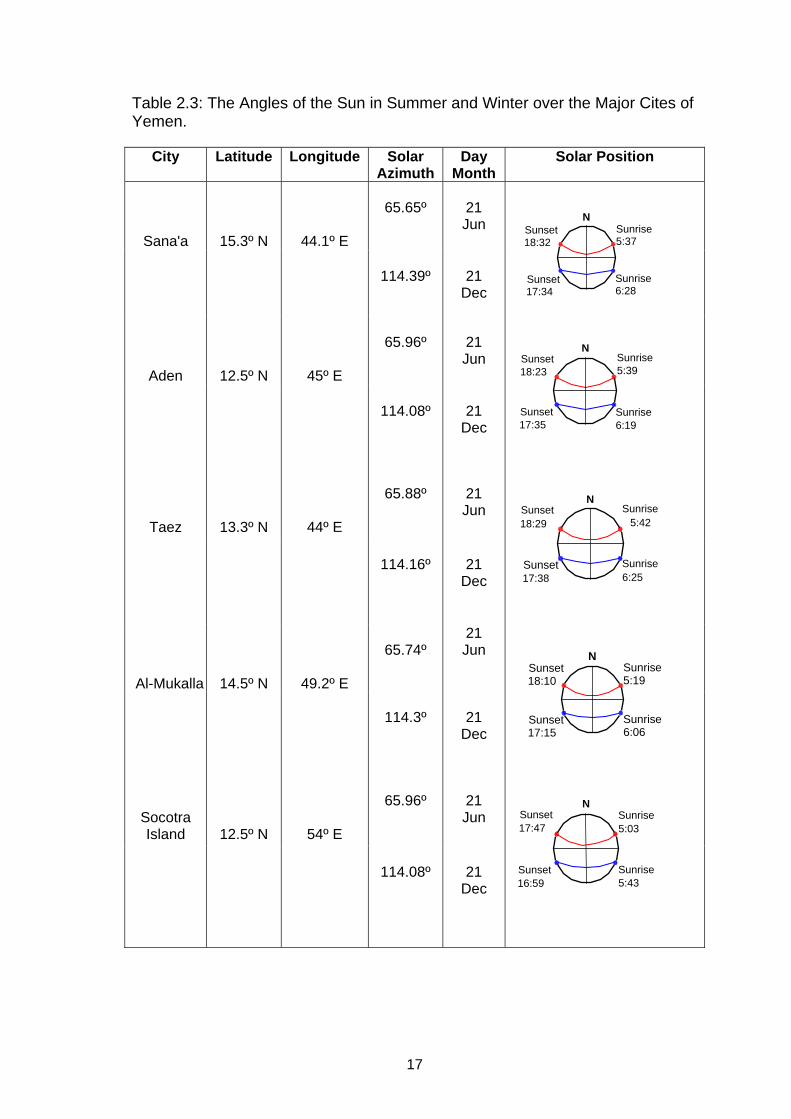
Table 2.3: The Angles of the Sun in Summer and Winter over the Major Cites of Yemen.
City Latitude Longitude Solar Azimuth
Day Month
Solar Position
Sana'a
15.3º N
44.1º E
65.65º
21 Jun
114.39º
21
Dec
Aden
12.5º N
45º E
65.96º
21 Jun
114.08º
21
Dec
Taez
13.3º N
44º E
65.88º
21 Jun
114.16º
21
Dec
Al-Mukalla
14.5º N
49.2º E
65.74º
21 Jun
114.3º
21
Dec
Socotra Island
12.5º N
54º E
65.96º
21 Jun
114.08º
21
Dec
N Sunrise 5:37
Sunrise6:28
Sunset18:32
Sunset 17:34
NSunrise5:39
Sunrise 6:19
Sunset18:23
Sunset17:35
N Sunrise
5:42
Sunrise6:25
Sunset18:29
Sunset17:38
NSunrise5:19
Sunrise6:06
Sunset 18:10
Sunset 17:15
N Sunrise5:03
Sunrise5:43
Sunset17:47
Sunset16:59
18
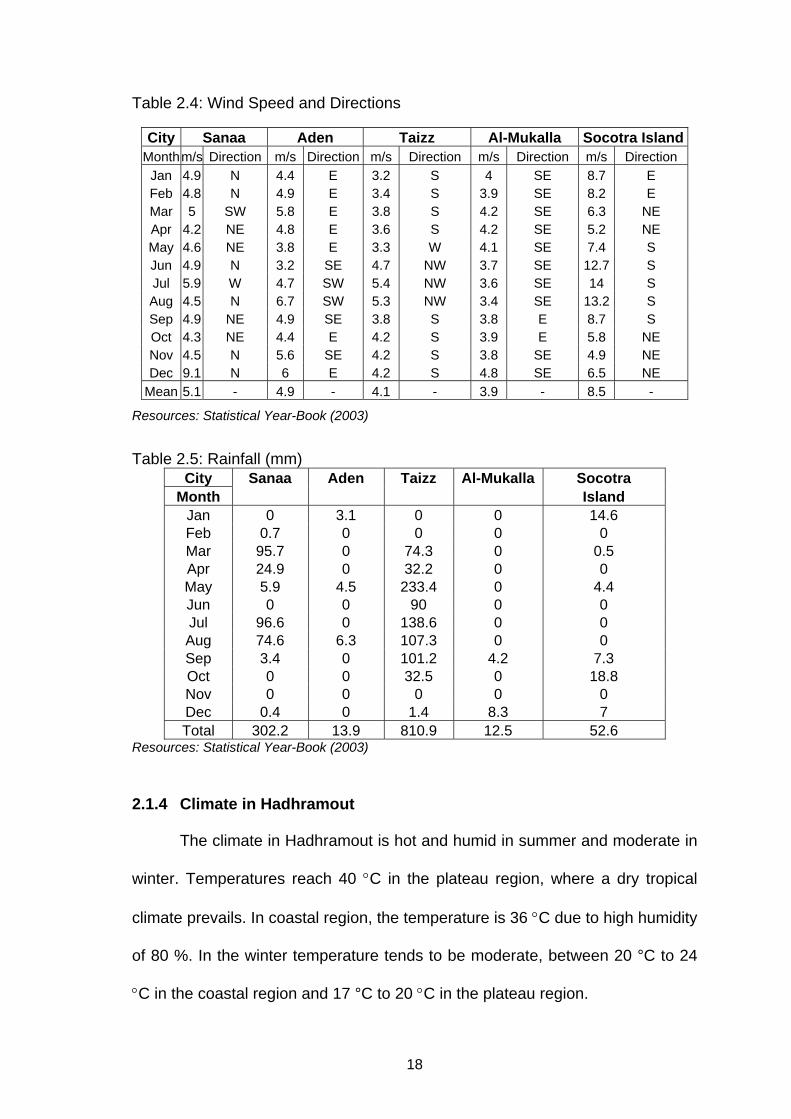
Table 2.4: Wind Speed and Directions
City Sanaa Aden Taizz Al-Mukalla Socotra IslandMonth m/s Direction m/s Direction m/s Direction m/s Direction m/s Direction
Jan 4.9 N 4.4 E 3.2 S 4 SE 8.7 E Feb 4.8 N 4.9 E 3.4 S 3.9 SE 8.2 E Mar 5 SW 5.8 E 3.8 S 4.2 SE 6.3 NE Apr 4.2 NE 4.8 E 3.6 S 4.2 SE 5.2 NE May 4.6 NE 3.8 E 3.3 W 4.1 SE 7.4 S Jun 4.9 N 3.2 SE 4.7 NW 3.7 SE 12.7 S Jul 5.9 W 4.7 SW 5.4 NW 3.6 SE 14 S Aug 4.5 N 6.7 SW 5.3 NW 3.4 SE 13.2 S Sep 4.9 NE 4.9 SE 3.8 S 3.8 E 8.7 S Oct 4.3 NE 4.4 E 4.2 S 3.9 E 5.8 NE Nov 4.5 N 5.6 SE 4.2 S 3.8 SE 4.9 NE Dec 9.1 N 6 E 4.2 S 4.8 SE 6.5 NE
Mean 5.1 - 4.9 - 4.1 - 3.9 - 8.5 -
Resources: Statistical Year-Book (2003) Table 2.5: Rainfall (mm)
City Sanaa Aden Taizz Al-Mukalla Socotra Month Island
Jan 0 3.1 0 0 14.6 Feb 0.7 0 0 0 0 Mar 95.7 0 74.3 0 0.5 Apr 24.9 0 32.2 0 0 May 5.9 4.5 233.4 0 4.4 Jun 0 0 90 0 0 Jul 96.6 0 138.6 0 0 Aug 74.6 6.3 107.3 0 0 Sep 3.4 0 101.2 4.2 7.3 Oct 0 0 32.5 0 18.8 Nov 0 0 0 0 0 Dec 0.4 0 1.4 8.3 7 Total 302.2 13.9 810.9 12.5 52.6
Resources: Statistical Year-Book (2003)
2.1.4 Climate in Hadhramout
The climate in Hadhramout is hot and humid in summer and moderate in
winter. Temperatures reach 40 °C in the plateau region, where a dry tropical
climate prevails. In coastal region, the temperature is 36 °C due to high humidity
of 80 %. In the winter temperature tends to be moderate, between 20 °C to 24
°C in the coastal region and 17 °C to 20 °C in the plateau region.

19
2.1.4.1 Sunshine and Solar Radiation
The sun is the source of all forms of energy on earth and is the
fundamental source of global weather patterns. It is also the most important
element for heat gains in a building as its orientation and global position will
determine a building’s exposure to solar heat. The city of Al-Mukalla is located
in the coastal region, at an altitude of 14° 5′ north and a longitude of 49° 20′
east. The Sun Path Diagram for given latitude can be used to determine the
sun’s position in terms of altitude and azimuth for any hour of the year.
The Sun Path diagram for the city of Al-Mukalla is presented in Table
2.3. This table shows the position of sun in the summer months as of June 21
and in the winter months as of December 21. Based on its location, Al-Mukalla
receives 8 to 10 hours of sunshine for eight months from October to May and 5
to 6 hours during the remaining four months. It should be noted that solar
radiation intensity is closely related to the duration of sunshine hours.
2.1.4.2 Temperature
As coastal Hadhramout is bordered by the eastern plateau in the north
and the Arabian Sea in the south, with no lakes or rivers, its local day
temperatures tend to be high with a very high humidity. In the summer months,
the day temperature reaches 40 °C and the relative humidity may increase to
more than 90 %. The air temperature and relative humidity values from 1999 to
2004 are plotted in Figures 2.4, 2.5 and 2.6.

20
29
31
33
35
37
39
41
Jan Feb Mar Apr May Jun Jul Aug Sep Oct Nov DecMonth
Max
imum
Tem
pera
ture
1999 2000 2001 2002 2003 2004
Figure 2.4: Maximum Daily Temperatures for Al-Mukalla City Resources: Statistical Year-Book (1999-2004)
10
12
14
16
18
20
22
24
26
Jan Feb Mar Apr May Jun Jul Aug Sep Oct Nov DecMonth
Min
imum
Tem
pera
ture
1999 2000 2001 2002 2003 2004
Figure 2.5: Minimum Daily Temperatures for Al-Mukalla City Resources: Statistical Year-Book (1999-2004)

21
20
22
24
26
28
30
32
Jan Feb Mar Apr May Jun Jul Aug Sep Oct Nov DecMonth
Mea
n Te
mpe
ratu
re
1999 2000 2001 2002 2003 2004
Figure 2.6: Mean Daily Temperatures for Al-Mukalla City Resources: Statistical Year-Book (1999-2004)
2.1.4.3 Relative Humidity
Almost all regions in Yemen are situated at a considerable height above
sea level. Thus relative humidity generally varies from region to region on a
monthly basis except for the coastal region where high relative humidity is
common. The mean monthly relative humidity in coastal Hadhramout is about
60 to 80 % Figure 2.7. In the most humid month, relative humidity ranges
between 78 to 82 %. Generally in this region, humidity increases in April just
before the southwest monsoon starts and drops in the cooler months of
November and December. The relative humidity is normally at its minimum
values from November to January and at its maximum values from May to
September. Therefore, the summer weather in the coastal region can be
considered to be very hot.

22
55
60
65
70
75
80
85
Jan Feb Mar Apr May Jun Jul Aug Sep Oct Nov DecMonth
Rel
ativ
e H
umid
ity
1999 2000 2001 2002 2003 2004
Figure 2.7: Mean Relative Humidity for Al-Mukalla City Resources: Statistical Year-Book (1999-2004)
2.1.4.4 Wind
Wind speed is used to control thermal comfort but it is a very unstable
parameter. The direction of wind constantly fluctuates due to driving sand
storms and dust or rain in the region. Generally, the wind direction is dictated by
temperature differences during daytime and nighttime. The prevailing wind
directions in coastal Hadhramout are southeast with speeds of between 2 to 4
m/s. From Table 2.6, it is clear that most of the wind in Al-Mukalla throughout
the year comes from the southeast direction.
23
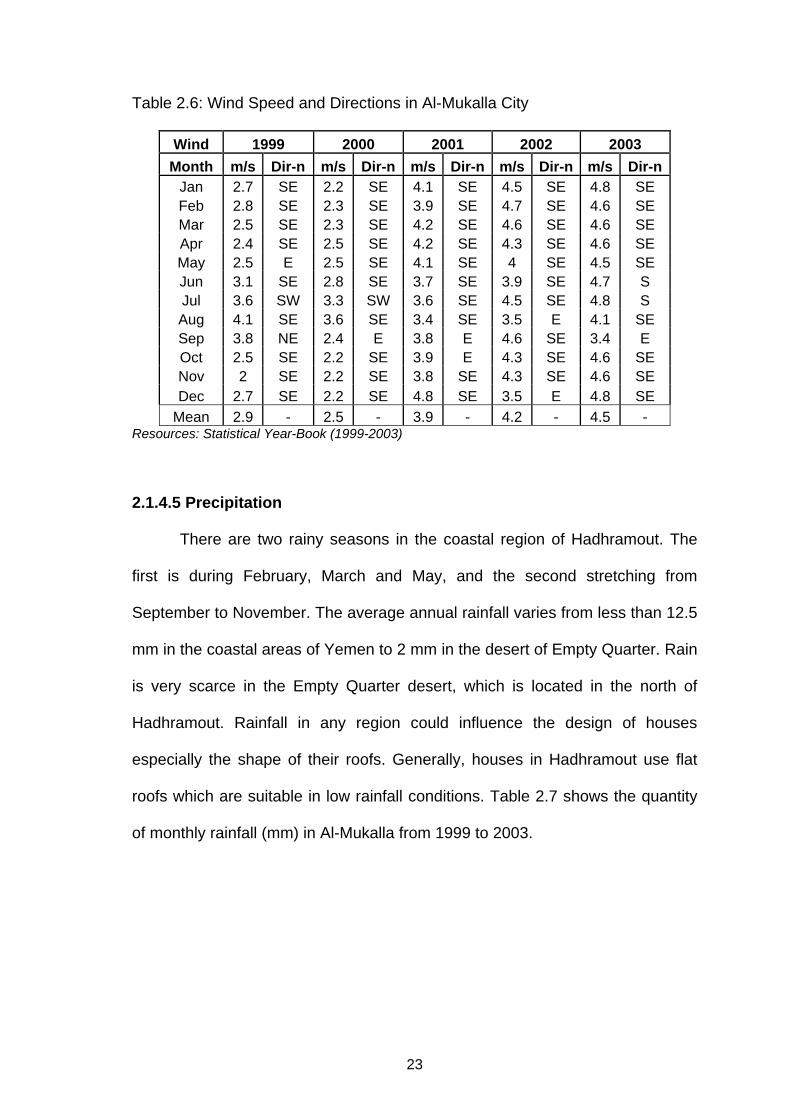
Table 2.6: Wind Speed and Directions in Al-Mukalla City
Wind 1999 2000 2001 2002 2003 Month m/s Dir-n m/s Dir-n m/s Dir-n m/s Dir-n m/s Dir-n
Jan 2.7 SE 2.2 SE 4.1 SE 4.5 SE 4.8 SE Feb 2.8 SE 2.3 SE 3.9 SE 4.7 SE 4.6 SE Mar 2.5 SE 2.3 SE 4.2 SE 4.6 SE 4.6 SE Apr 2.4 SE 2.5 SE 4.2 SE 4.3 SE 4.6 SE May 2.5 E 2.5 SE 4.1 SE 4 SE 4.5 SE Jun 3.1 SE 2.8 SE 3.7 SE 3.9 SE 4.7 S Jul 3.6 SW 3.3 SW 3.6 SE 4.5 SE 4.8 S Aug 4.1 SE 3.6 SE 3.4 SE 3.5 E 4.1 SE Sep 3.8 NE 2.4 E 3.8 E 4.6 SE 3.4 E Oct 2.5 SE 2.2 SE 3.9 E 4.3 SE 4.6 SE Nov 2 SE 2.2 SE 3.8 SE 4.3 SE 4.6 SE Dec 2.7 SE 2.2 SE 4.8 SE 3.5 E 4.8 SE
Mean 2.9 - 2.5 - 3.9 - 4.2 - 4.5 - Resources: Statistical Year-Book (1999-2003)
2.1.4.5 Precipitation
There are two rainy seasons in the coastal region of Hadhramout. The
first is during February, March and May, and the second stretching from
September to November. The average annual rainfall varies from less than 12.5
mm in the coastal areas of Yemen to 2 mm in the desert of Empty Quarter. Rain
is very scarce in the Empty Quarter desert, which is located in the north of
Hadhramout. Rainfall in any region could influence the design of houses
especially the shape of their roofs. Generally, houses in Hadhramout use flat
roofs which are suitable in low rainfall conditions. Table 2.7 shows the quantity
of monthly rainfall (mm) in Al-Mukalla from 1999 to 2003.
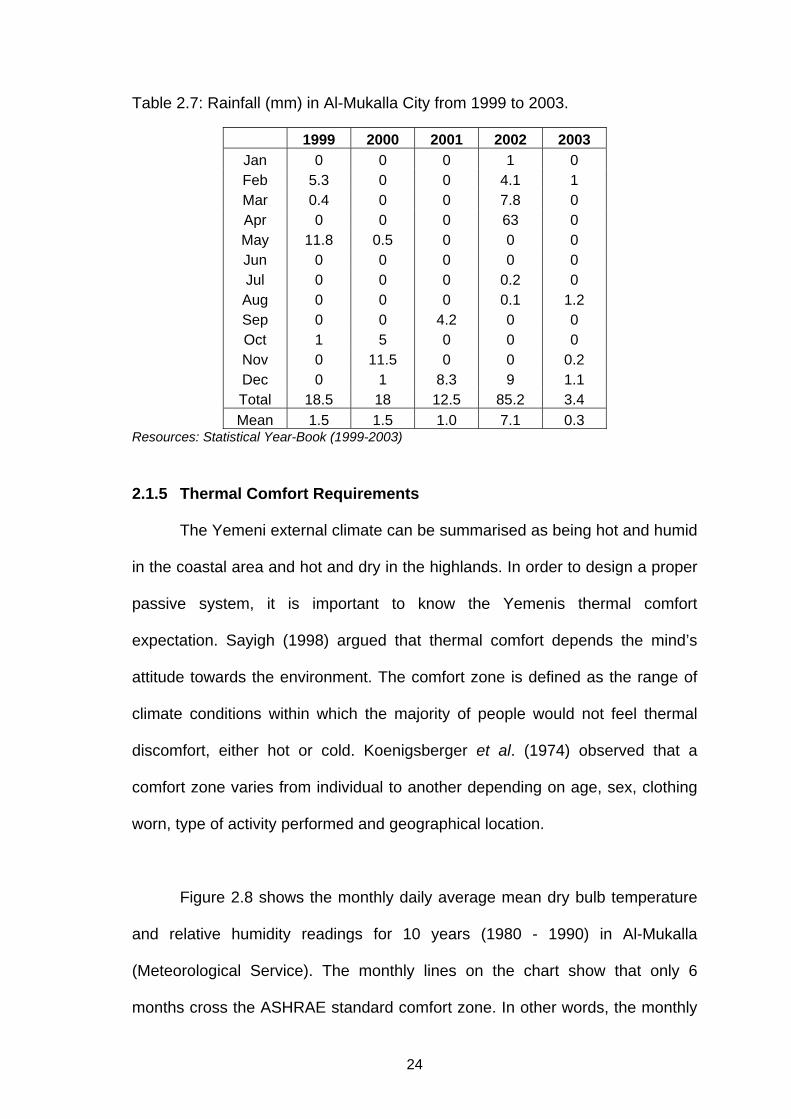
24
Table 2.7: Rainfall (mm) in Al-Mukalla City from 1999 to 2003.
1999 2000 2001 2002 2003 Jan 0 0 0 1 0 Feb 5.3 0 0 4.1 1 Mar 0.4 0 0 7.8 0 Apr 0 0 0 63 0 May 11.8 0.5 0 0 0 Jun 0 0 0 0 0 Jul 0 0 0 0.2 0 Aug 0 0 0 0.1 1.2 Sep 0 0 4.2 0 0 Oct 1 5 0 0 0 Nov 0 11.5 0 0 0.2 Dec 0 1 8.3 9 1.1 Total 18.5 18 12.5 85.2 3.4 Mean 1.5 1.5 1.0 7.1 0.3
Resources: Statistical Year-Book (1999-2003)
2.1.5 Thermal Comfort Requirements
The Yemeni external climate can be summarised as being hot and humid
in the coastal area and hot and dry in the highlands. In order to design a proper
passive system, it is important to know the Yemenis thermal comfort
expectation. Sayigh (1998) argued that thermal comfort depends the mind’s
attitude towards the environment. The comfort zone is defined as the range of
climate conditions within which the majority of people would not feel thermal
discomfort, either hot or cold. Koenigsberger et al. (1974) observed that a
comfort zone varies from individual to another depending on age, sex, clothing
worn, type of activity performed and geographical location.
Figure 2.8 shows the monthly daily average mean dry bulb temperature
and relative humidity readings for 10 years (1980 - 1990) in Al-Mukalla
(Meteorological Service). The monthly lines on the chart show that only 6
months cross the ASHRAE standard comfort zone. In other words, the monthly