
Thermal Analysis of Rubbers and Elastomers - TA Instruments · Thermal Analysis of Rubbers and...
65
TAINSTRUMENTS.COM TAINSTRUMENTS.COM Thermal Analysis of Rubbers and Elastomers Mackenzie Geiger Applications Scientist September 6, 2017
Transcript of Thermal Analysis of Rubbers and Elastomers - TA Instruments · Thermal Analysis of Rubbers and...
TAINSTRUMENTS.COMTAINSTRUMENTS.COM
Thermal Analysis of
Rubbers and Elastomers
Mackenzie Geiger
Applications Scientist
September 6, 2017
TAINSTRUMENTS.COMTAINSTRUMENTS.COM
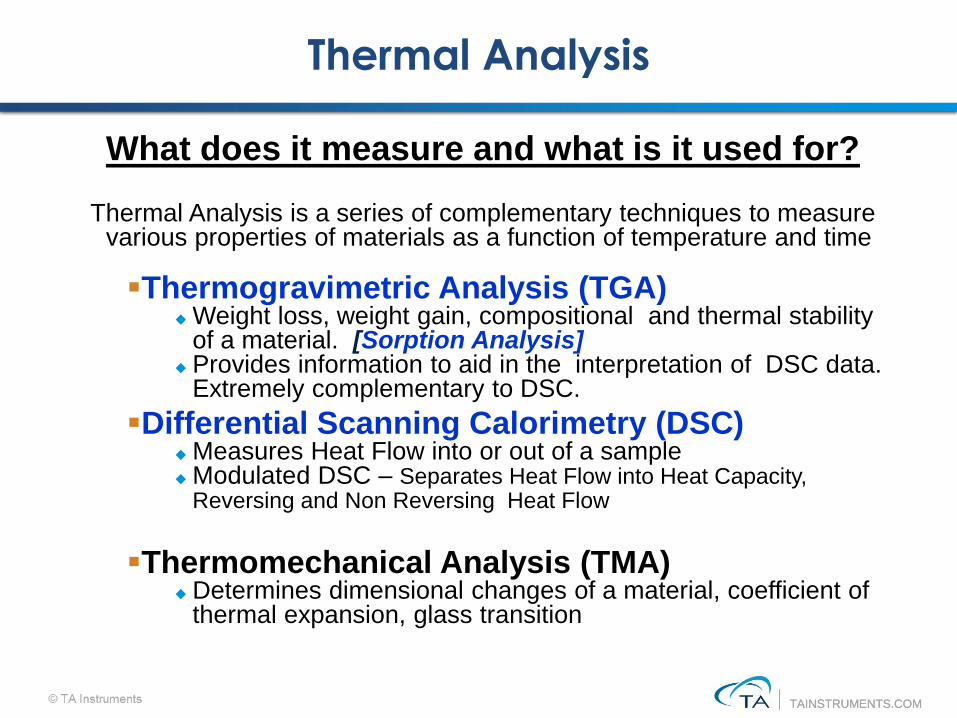
What does it measure and what is it used for?
Thermal Analysis is a series of complementary techniques to measure various properties of materials as a function of temperature and time
▪Thermogravimetric Analysis (TGA) Weight loss, weight gain, compositional and thermal stability
of a material. [Sorption Analysis] Provides information to aid in the interpretation of DSC data.
Extremely complementary to DSC.
▪Differential Scanning Calorimetry (DSC) Measures Heat Flow into or out of a sample Modulated DSC – Separates Heat Flow into Heat Capacity,
Reversing and Non Reversing Heat Flow
▪Thermomechanical Analysis (TMA) Determines dimensional changes of a material, coefficient of
thermal expansion, glass transition
Thermal Analysis
TAINSTRUMENTS.COMTAINSTRUMENTS.COM
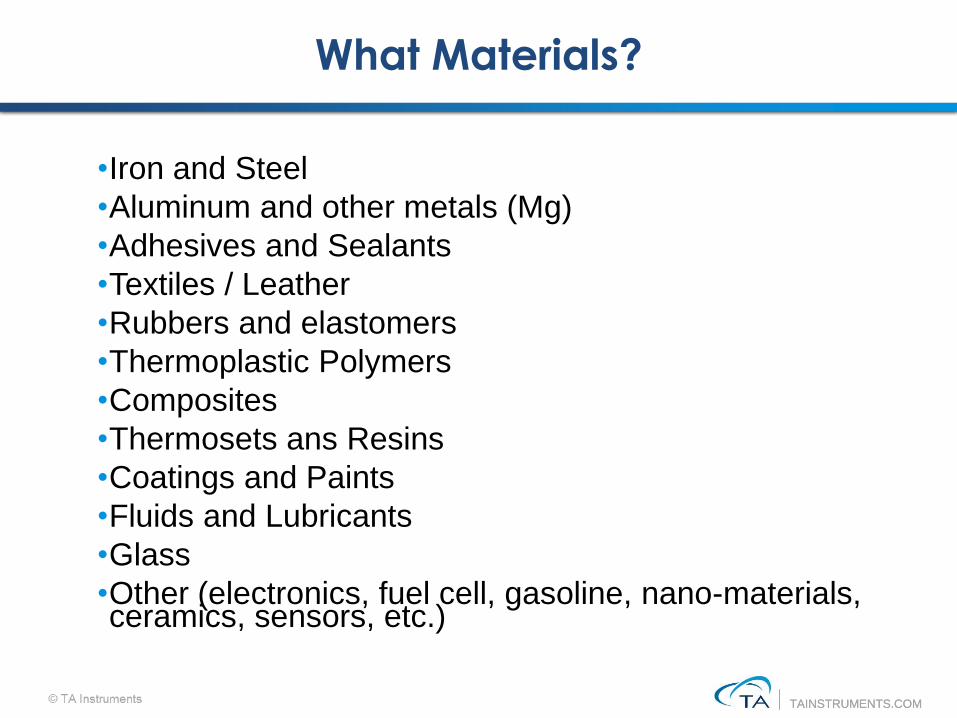
What Materials?
•Iron and Steel
•Aluminum and other metals (Mg)
•Adhesives and Sealants
•Textiles / Leather
•Rubbers and elastomers
•Thermoplastic Polymers
•Composites
•Thermosets ans Resins
•Coatings and Paints
•Fluids and Lubricants
•Glass
•Other (electronics, fuel cell, gasoline, nano-materials, ceramics, sensors, etc.)
TAINSTRUMENTS.COMTAINSTRUMENTS.COM
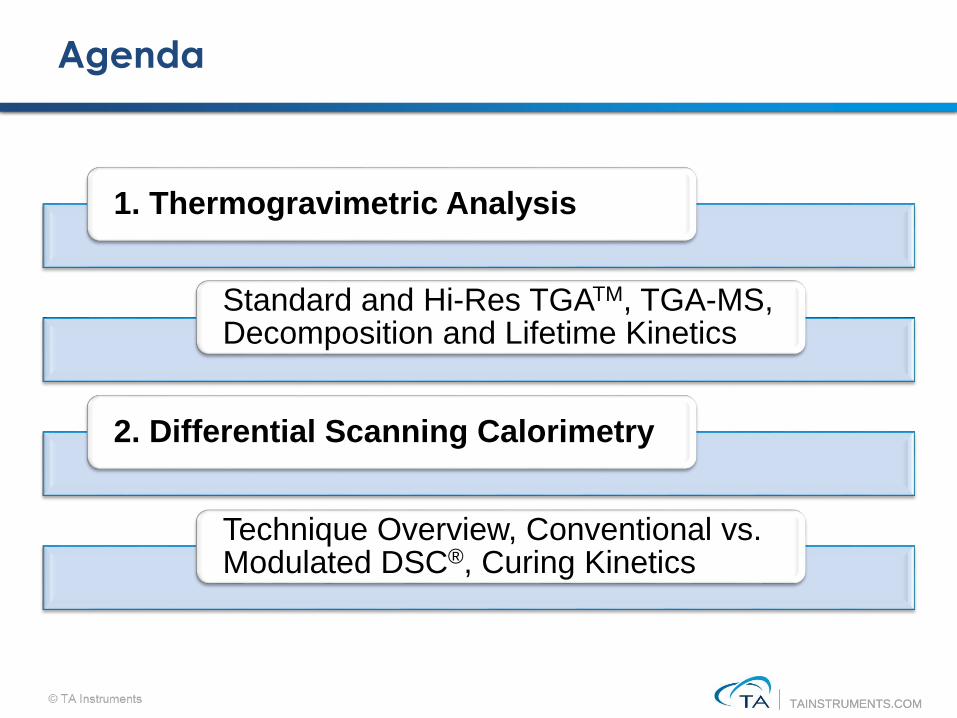
Agenda
1. Thermogravimetric Analysis
Standard and Hi-Res TGATM, TGA-MS, Decomposition and Lifetime Kinetics
2. Differential Scanning Calorimetry
Technique Overview, Conventional vs. Modulated DSC®, Curing Kinetics
TAINSTRUMENTS.COMTAINSTRUMENTS.COM
Thermogravimetric Analysis
(TGA)
TAINSTRUMENTS.COMTAINSTRUMENTS.COM
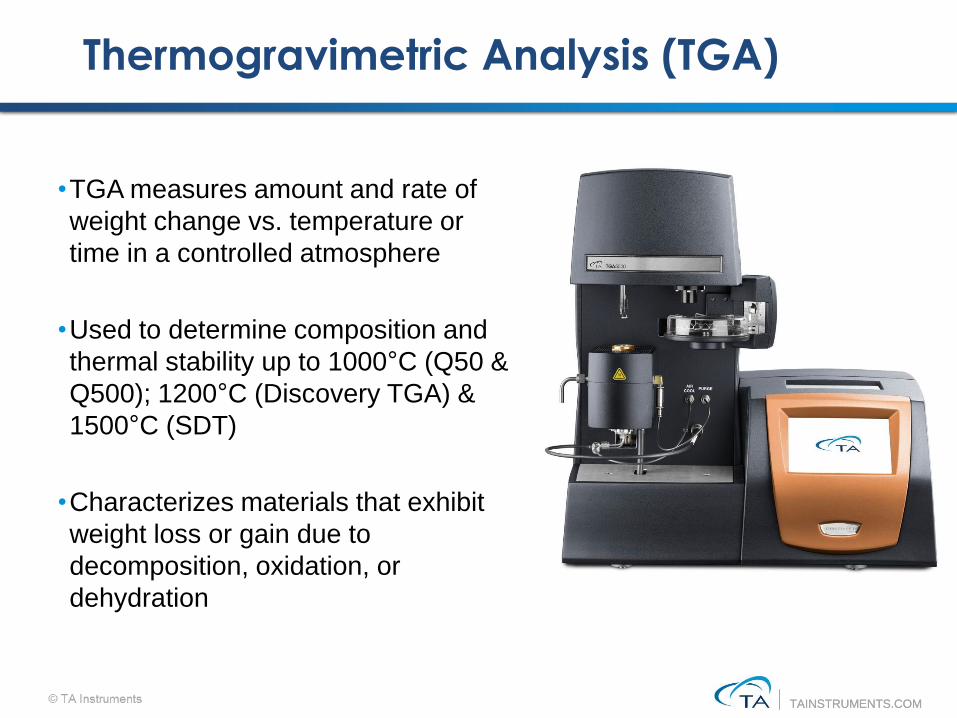
Thermogravimetric Analysis (TGA)
•TGA measures amount and rate of
weight change vs. temperature or
time in a controlled atmosphere
•Used to determine composition and
thermal stability up to 1000°C (Q50 &
Q500); 1200°C (Discovery TGA) &
1500°C (SDT)
•Characterizes materials that exhibit
weight loss or gain due to
decomposition, oxidation, or
dehydration
TAINSTRUMENTS.COMTAINSTRUMENTS.COM
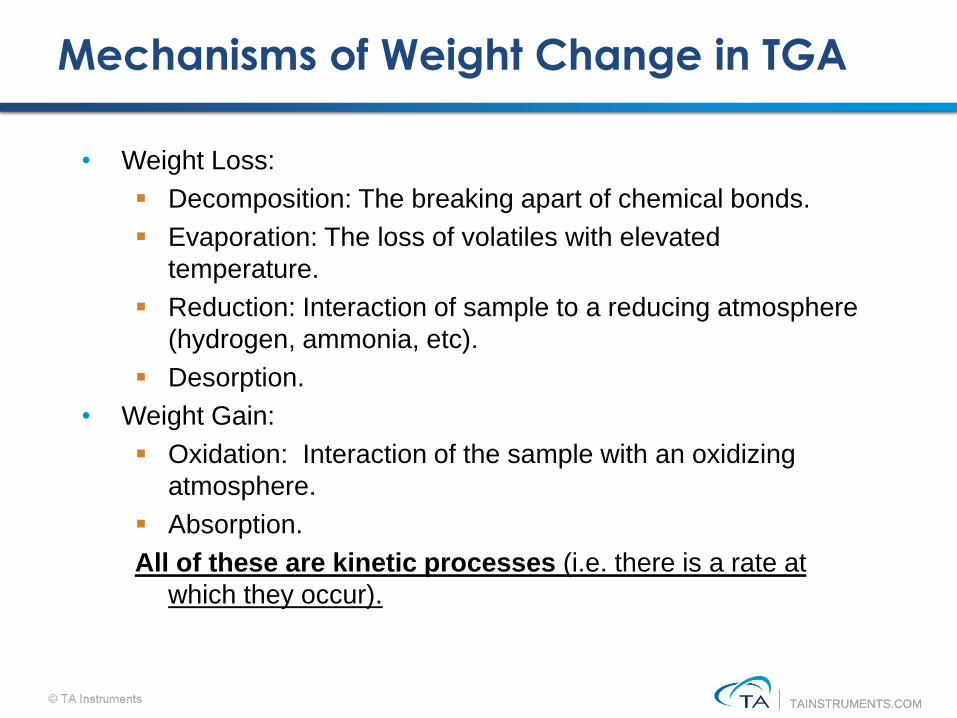
Mechanisms of Weight Change in TGA
• Weight Loss:
▪ Decomposition: The breaking apart of chemical bonds.
▪ Evaporation: The loss of volatiles with elevated
temperature.
▪ Reduction: Interaction of sample to a reducing atmosphere
(hydrogen, ammonia, etc).
▪ Desorption.
• Weight Gain:
▪ Oxidation: Interaction of the sample with an oxidizing
atmosphere.
▪ Absorption.
All of these are kinetic processes (i.e. there is a rate at
which they occur).
TAINSTRUMENTS.COMTAINSTRUMENTS.COM
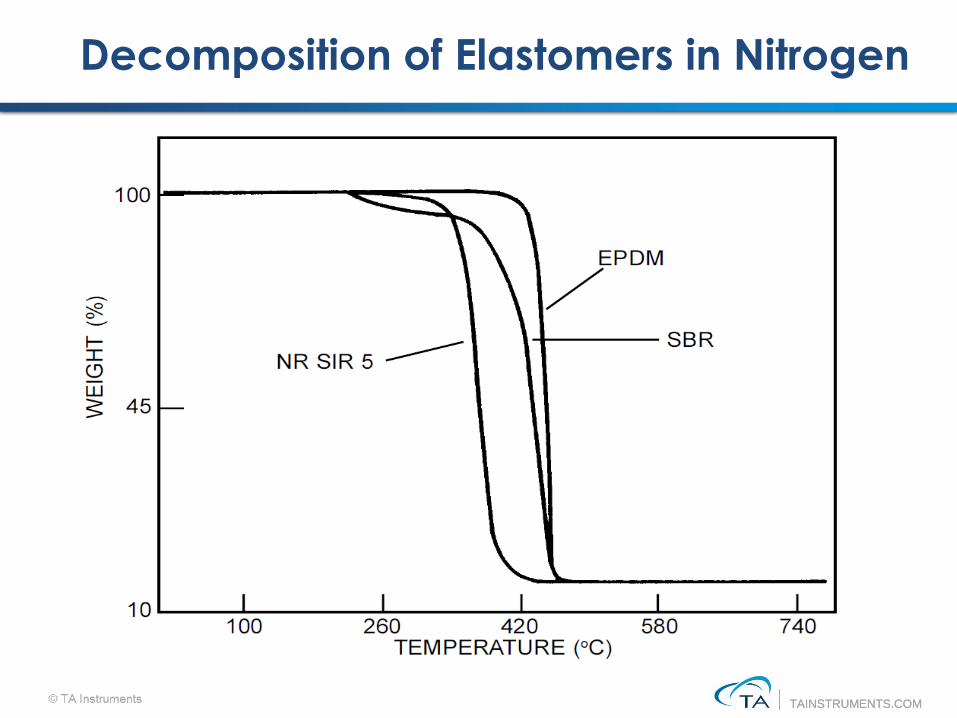
Decomposition of Elastomers in Nitrogen
TAINSTRUMENTS.COMTAINSTRUMENTS.COM
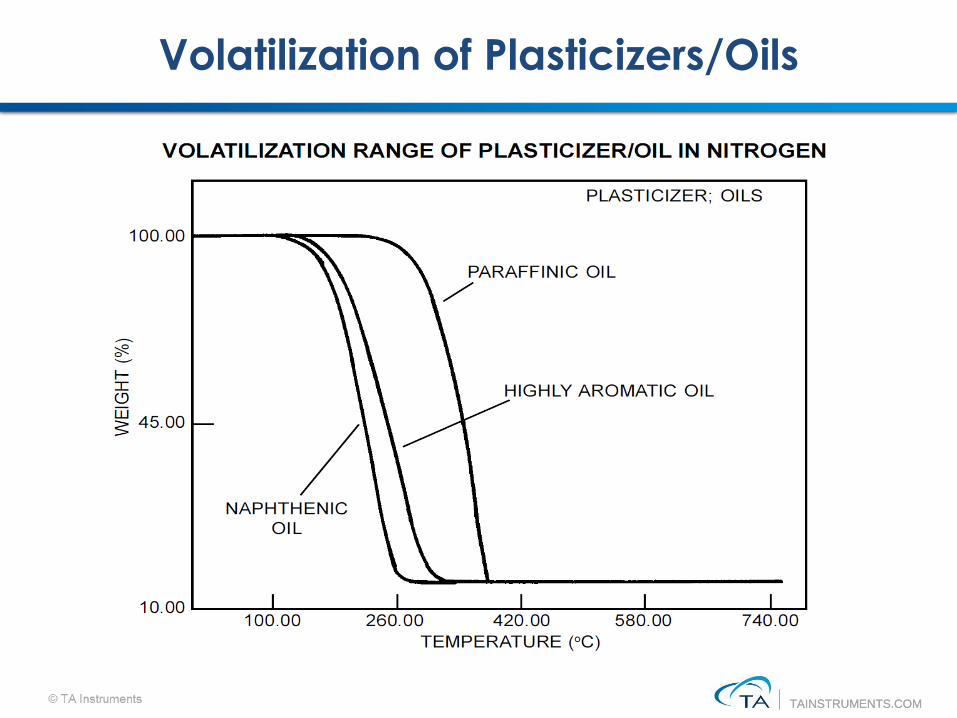
Volatilization of Plasticizers/Oils
TAINSTRUMENTS.COMTAINSTRUMENTS.COM
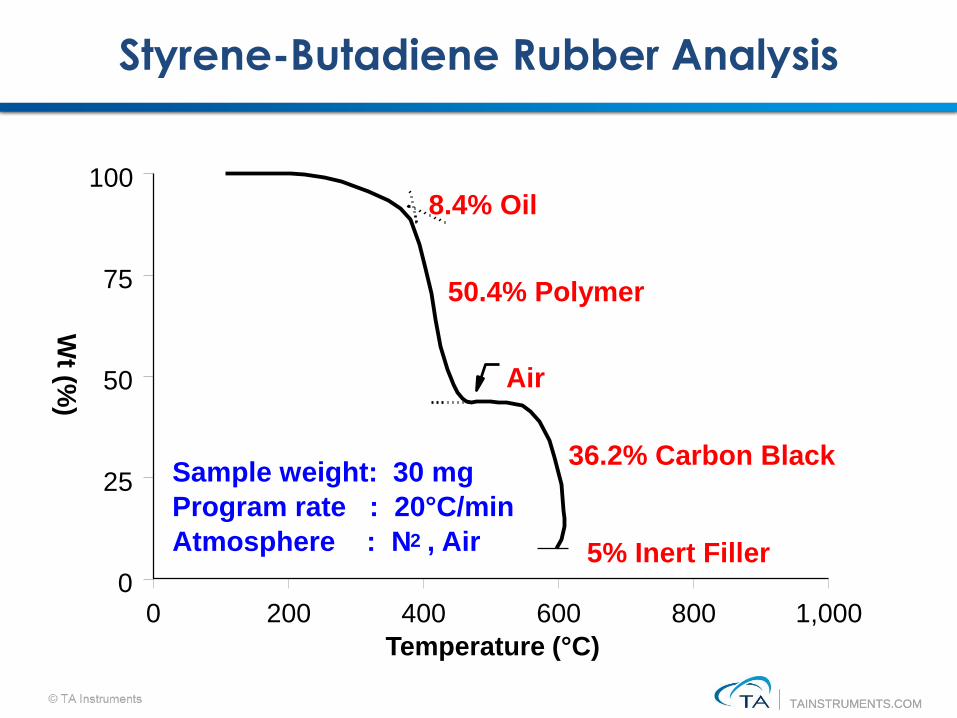
Styrene-Butadiene Rubber Analysis
0 200 400 600 800 1,0000
25
50
75
100
Temperature (°C)
Wt (%
)
8.4% Oil
50.4% Polymer
Air
36.2% Carbon Black
5% Inert Filler
Sample weight: 30 mg
Program rate : 20°C/min
Atmosphere : N , Air2
TAINSTRUMENTS.COMTAINSTRUMENTS.COM
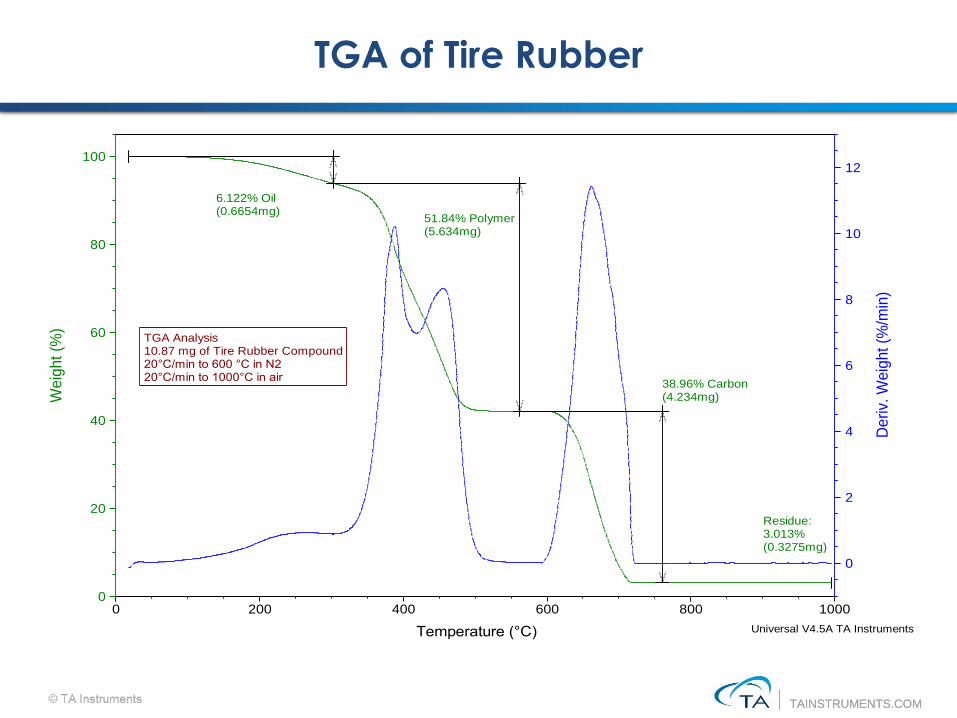
TGA of Tire Rubber
6.122% Oil(0.6654mg)
51.84% Polymer(5.634mg)
38.96% Carbon(4.234mg)
Residue:3.013%(0.3275mg)
TGA Analysis10.87 mg of Tire Rubber Compound20°C/min to 600 °C in N220°C/min to 1000°C in air
0
2
4
6
8
10
12
Deriv.
Weig
ht (%
/min
)
0
20
40
60
80
100
Weig
ht (%
)
0 200 400 600 800 1000
Temperature (°C)
Sample: Cured Tire Tread Rubber CompounSize: 10.8690 mg
File: CURED TIRE TREAD RUBBER COMPOUND.001Run Date: 18-Nov-2005 12:06
Universal V4.5A TA Instruments
TAINSTRUMENTS.COMTAINSTRUMENTS.COM
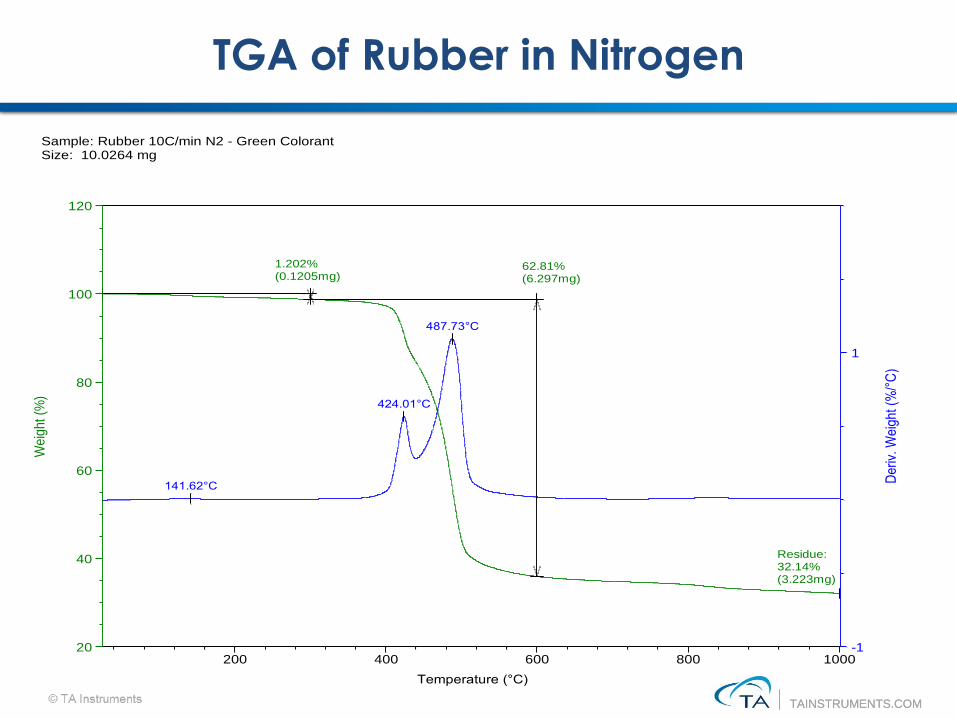
TGA of Rubber in Nitrogen
424.01°C
487.73°C
141.62°C
1.202%(0.1205mg)
62.81%(6.297mg)
Residue:32.14%(3.223mg)
-1
1
De
riv.
Weig
ht (%
/°C
)
20
40
60
80
100
120
Weig
ht (%
)
200 400 600 800 1000
Temperature (°C)
Sample: Rubber 10C/min N2 - Green ColorantSize: 10.0264 mg
TAINSTRUMENTS.COMTAINSTRUMENTS.COM
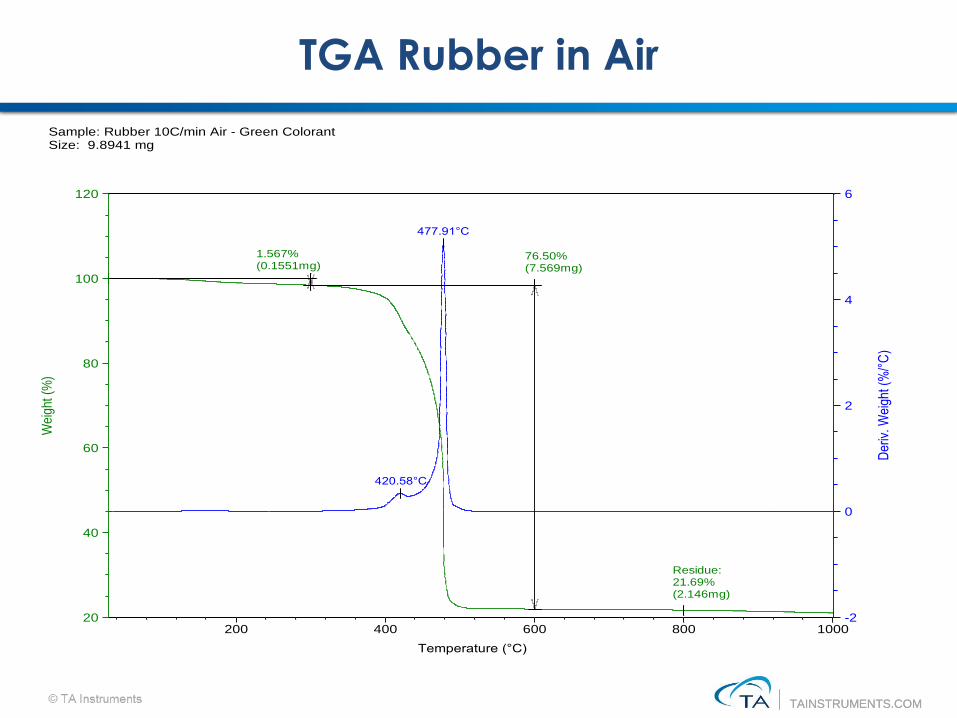
TGA Rubber in Air
420.58°C
477.91°C
1.567%(0.1551mg)
76.50%(7.569mg)
Residue:21.69%(2.146mg)
-2
0
2
4
6
Der
iv. W
eigh
t (%
/°C
)
20
40
60
80
100
120
Wei
ght (
%)
200 400 600 800 1000
Temperature (°C)
Sample: Rubber 10C/min Air - Green ColorantSize: 9.8941 mg
TAINSTRUMENTS.COMTAINSTRUMENTS.COM
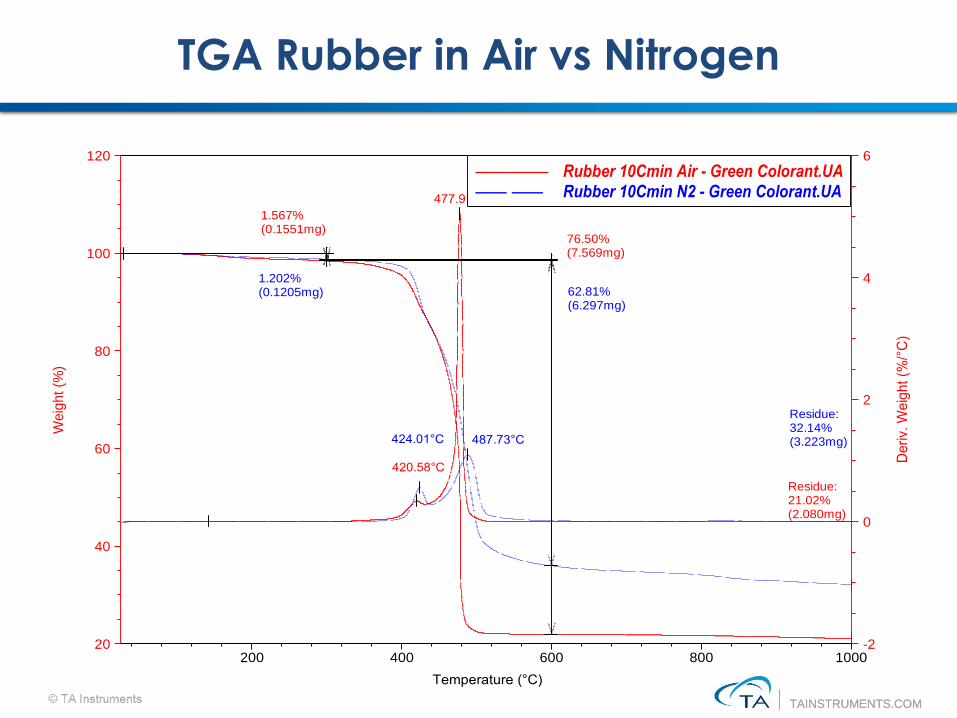
TGA Rubber in Air vs Nitrogen
1.567%(0.1551mg)
76.50%(7.569mg)
Residue:21.02%(2.080mg)
1.202%(0.1205mg) 62.81%
(6.297mg)
Residue:32.14%(3.223mg)
420.58°C
477.91°C
424.01°C 487.73°C
-2
0
2
4
6
Deriv. W
eig
ht (%
/°C
)
20
40
60
80
100
120
Weig
ht (%
)
200 400 600 800 1000
Temperature (°C)
Rubber 10Cmin Air - Green Colorant.UA––––––– Rubber 10Cmin N2 - Green Colorant.UA––– –––
TAINSTRUMENTS.COMTAINSTRUMENTS.COM
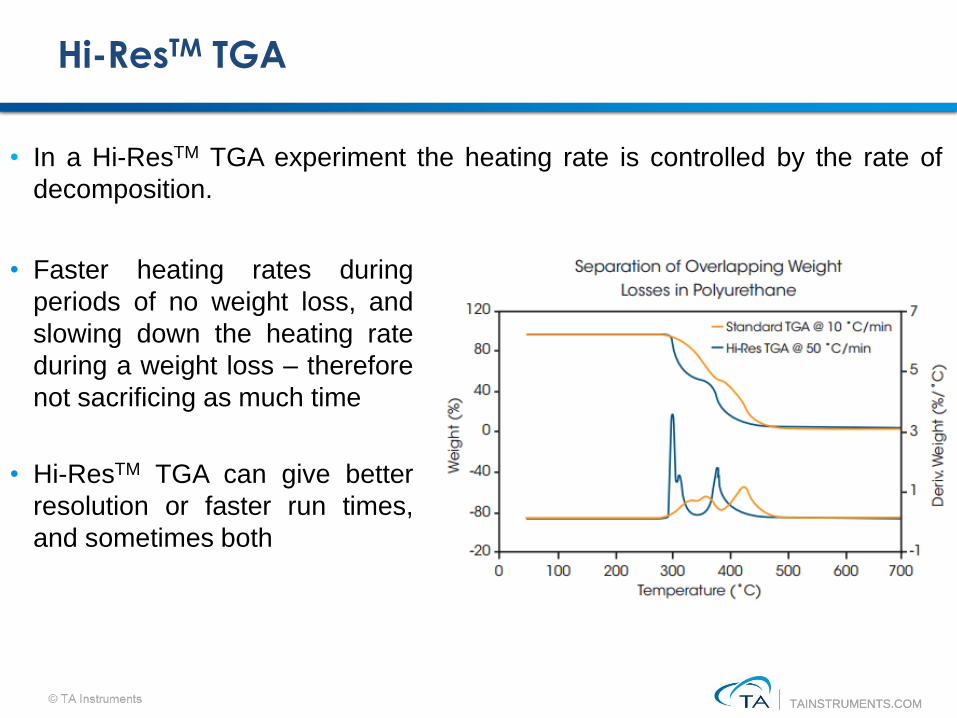
Hi-ResTM TGA
• Faster heating rates during
periods of no weight loss, and
slowing down the heating rate
during a weight loss – therefore
not sacrificing as much time
• Hi-ResTM TGA can give better
resolution or faster run times,
and sometimes both
• In a Hi-ResTM TGA experiment the heating rate is controlled by the rate of
decomposition.
TAINSTRUMENTS.COMTAINSTRUMENTS.COM
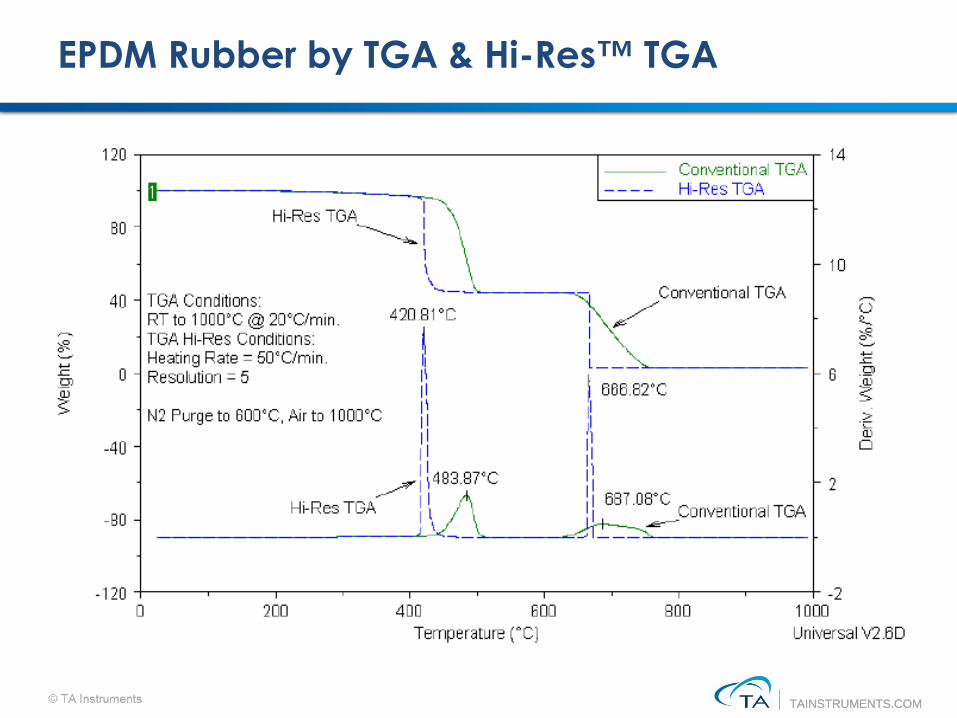
EPDM Rubber by TGA & Hi-Res™ TGA
TAINSTRUMENTS.COMTAINSTRUMENTS.COM
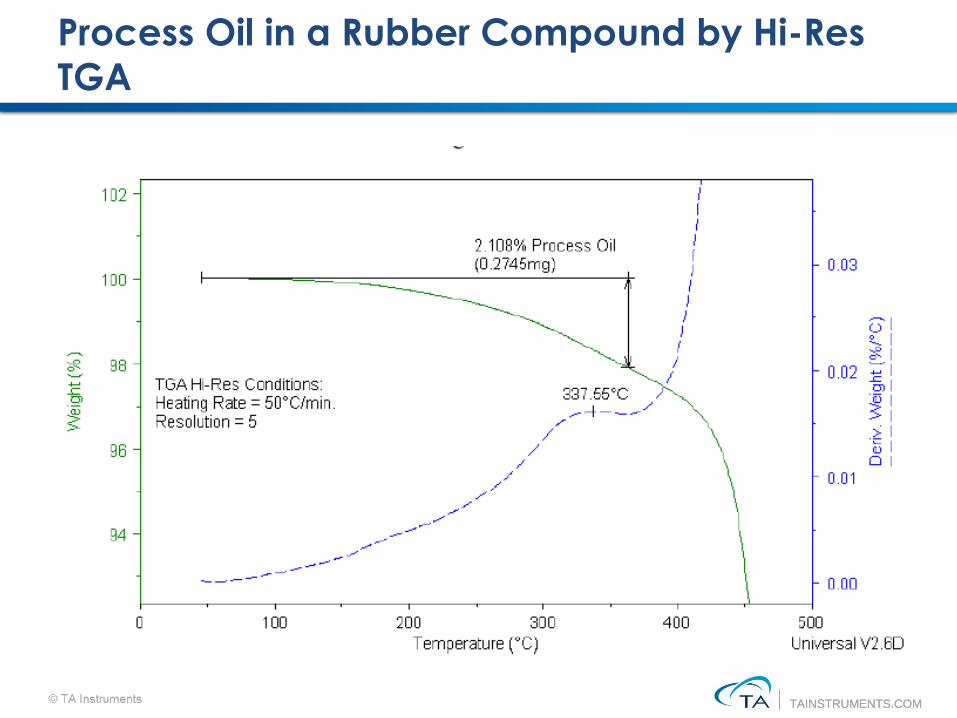
Process Oil in a Rubber Compound by Hi-Res
TGA
TAINSTRUMENTS.COMTAINSTRUMENTS.COM
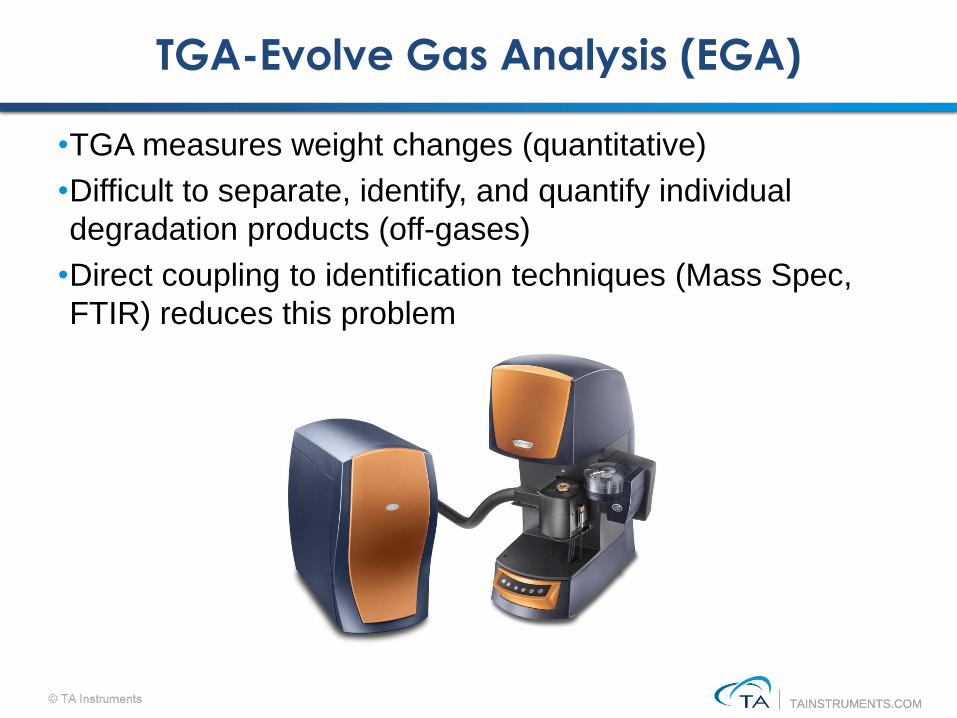
TGA-Evolve Gas Analysis (EGA)
•TGA measures weight changes (quantitative)
•Difficult to separate, identify, and quantify individual
degradation products (off-gases)
•Direct coupling to identification techniques (Mass Spec,
FTIR) reduces this problem
TAINSTRUMENTS.COMTAINSTRUMENTS.COM
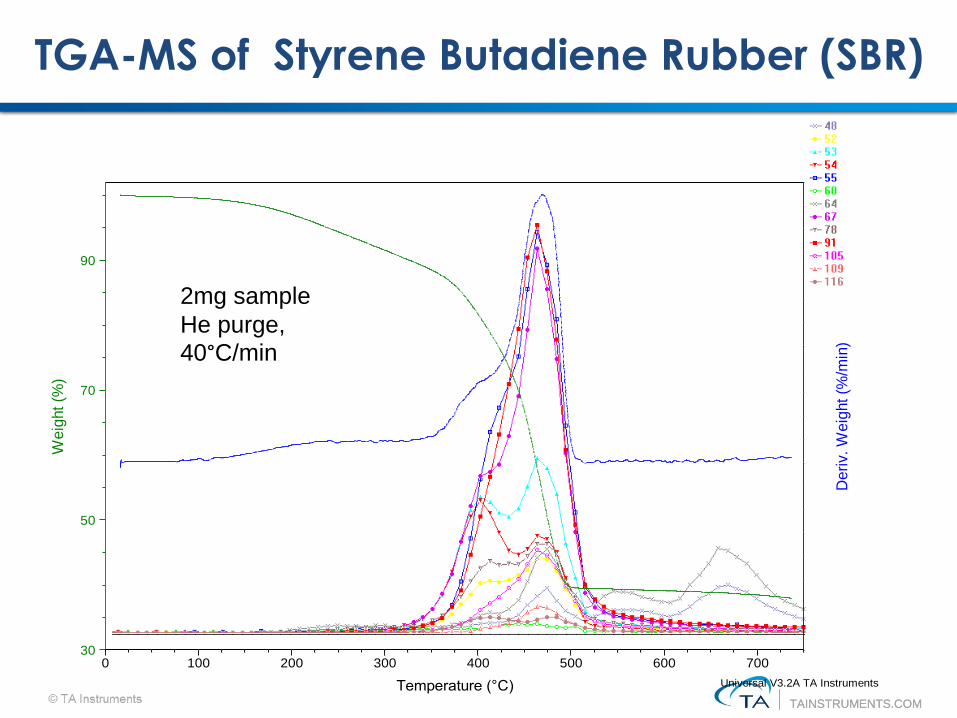
TGA-MS of Styrene Butadiene Rubber (SBR)
Deri
v. W
eig
ht (%
/min
)
30
50
70
90
Weig
ht (%
)
0 100 200 300 400 500 600 700
Temperature (°C)
Sample: SBRSize: 1.8030 mg
Comment: Helium
TGAFile: C:...\Bnl\Rubber\tga\SBR\Sbr1.001Operator: Daniel ROEDOLFRun Date: 31-Dec-01 16:31Instrument: AutoTGA 2950HR V5.4A
Universal V3.2A TA Instruments
2mg sample
He purge,
40°C/min
TAINSTRUMENTS.COMTAINSTRUMENTS.COM
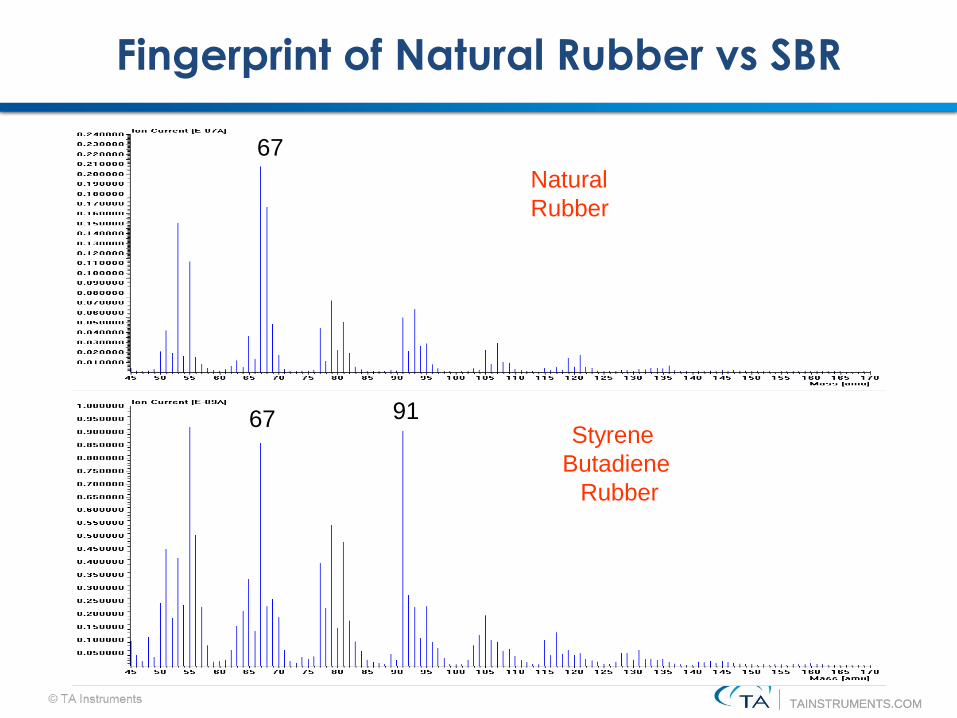
Fingerprint of Natural Rubber vs SBR
Natural
Rubber
Styrene
Butadiene
Rubber
9167
67
TAINSTRUMENTS.COMTAINSTRUMENTS.COM
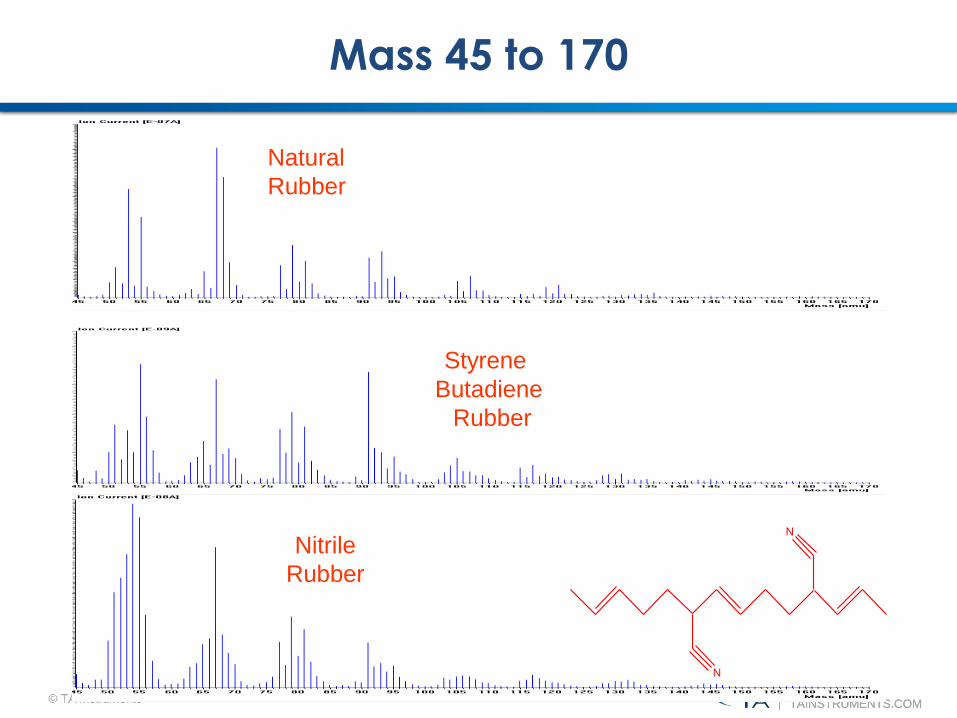
Mass 45 to 170
Natural
Rubber
Styrene
Butadiene
Rubber
Nitrile
Rubber
N
N
TAINSTRUMENTS.COMTAINSTRUMENTS.COM
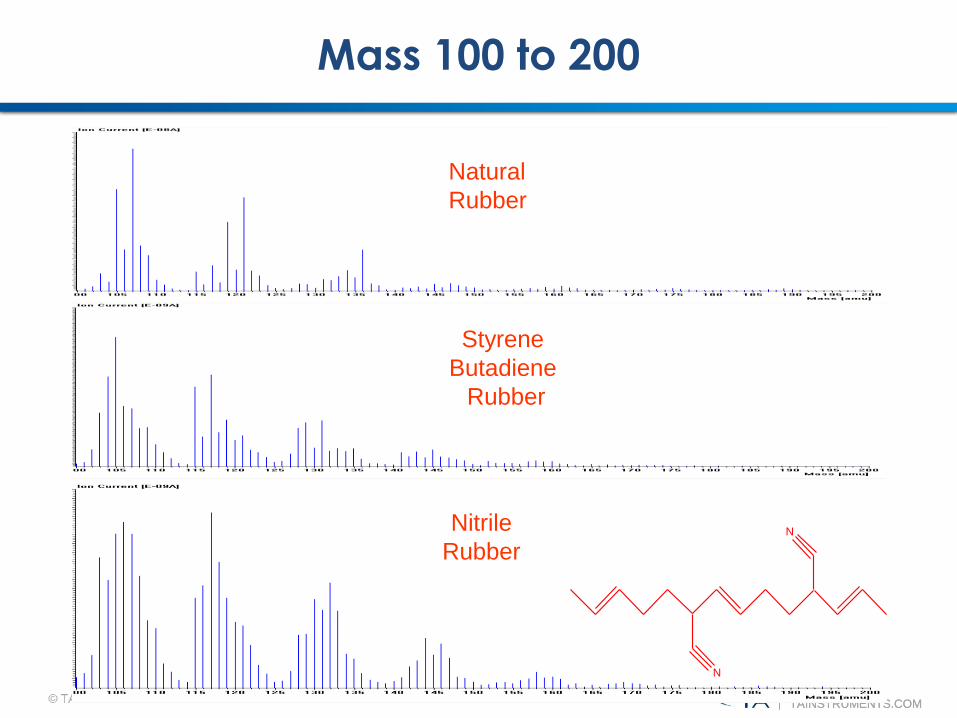
Mass 100 to 200
Natural
Rubber
Styrene
Butadiene
Rubber
Nitrile
Rubber
N
N
TAINSTRUMENTS.COMTAINSTRUMENTS.COM
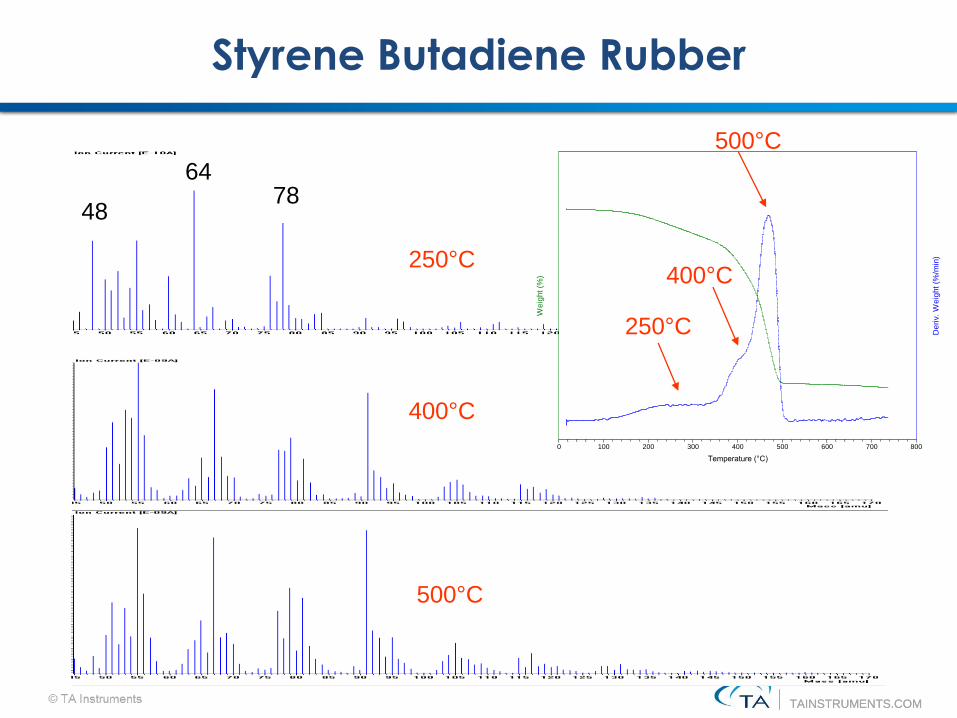
Styrene Butadiene Rubber
SBR
250°C
400°C
500°C
Deri
v. W
eig
ht (%
/min
)
Weig
ht (%
)
0 100 200 300 400 500 600 700 800
Temperature (°C)
64
4878
250°C
400°C
500°C
TAINSTRUMENTS.COMTAINSTRUMENTS.COM
Decomposition and Lifetime
Kinetics
TAINSTRUMENTS.COMTAINSTRUMENTS.COM
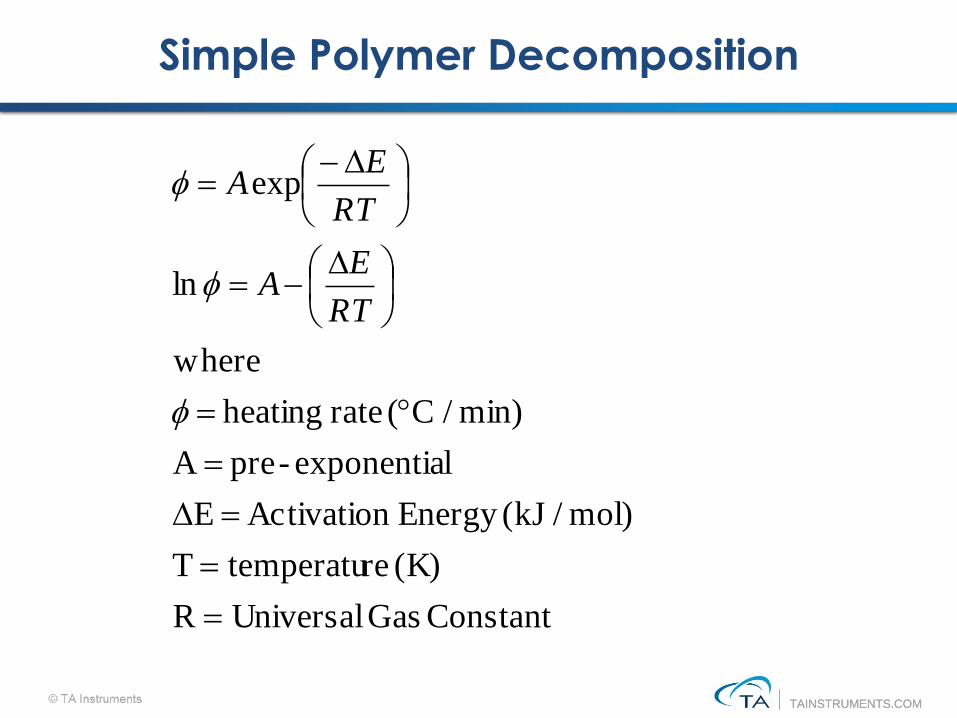
Simple Polymer Decomposition
Constant Gas Universal R
(K) re temperatu T
mol) / (kJEnergy Activation E
lexponentia-pre A
min) / C( rate heating
where
ln
exp
RT
EA
RT
EA
TAINSTRUMENTS.COMTAINSTRUMENTS.COM
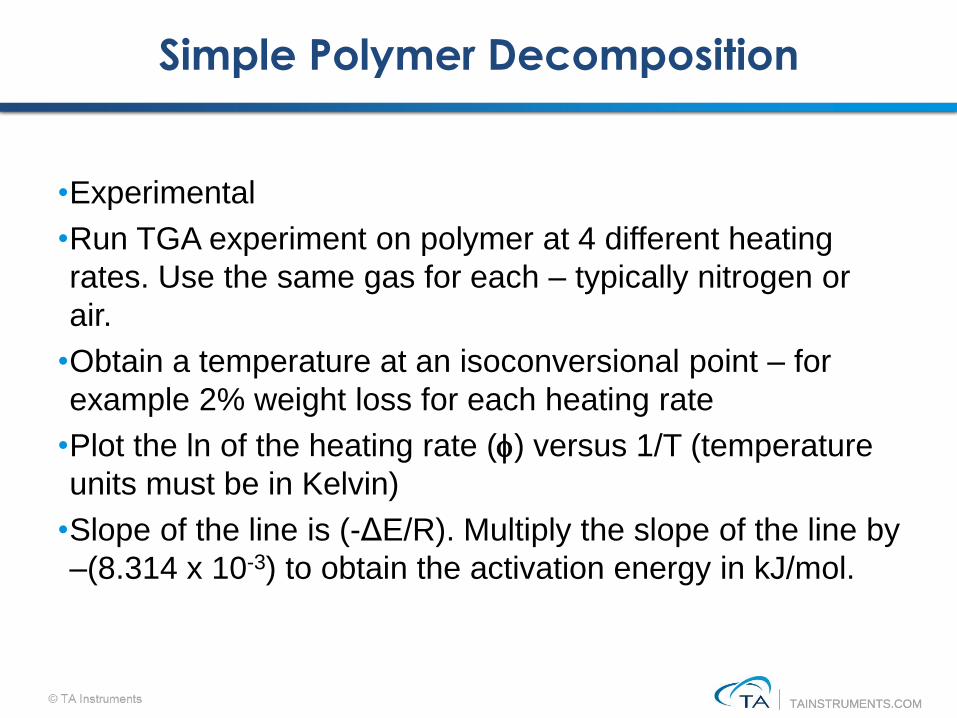
Simple Polymer Decomposition
•Experimental
•Run TGA experiment on polymer at 4 different heating
rates. Use the same gas for each – typically nitrogen or
air.
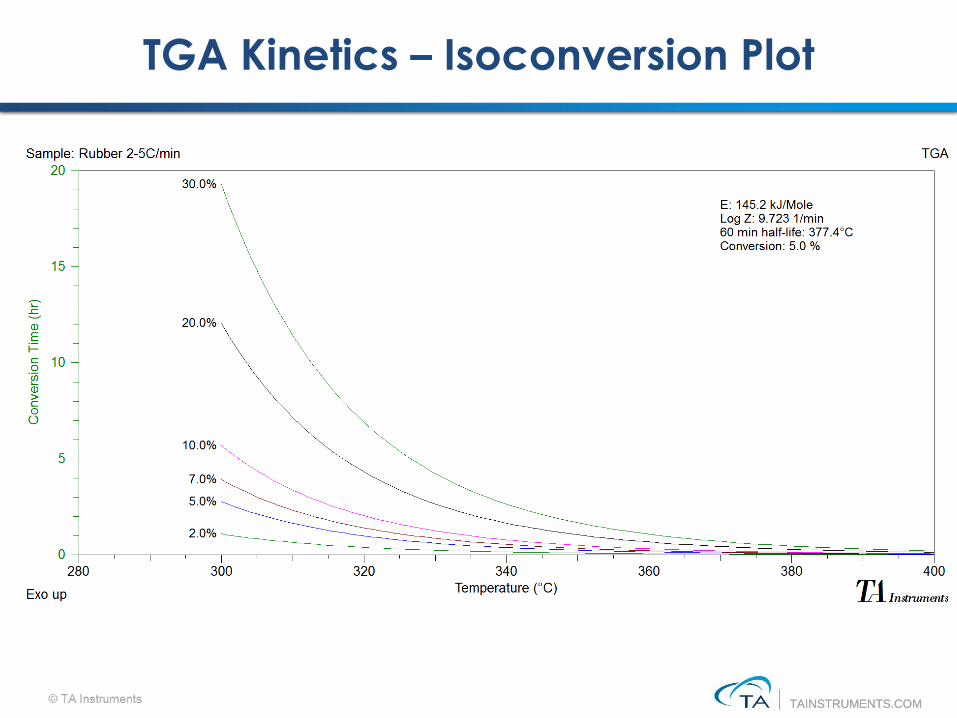
•Obtain a temperature at an isoconversional point – for
example 2% weight loss for each heating rate
•Plot the ln of the heating rate () versus 1/T (temperature
units must be in Kelvin)
•Slope of the line is (-ΔE/R). Multiply the slope of the line by
–(8.314 x 10⁻³) to obtain the activation energy in kJ/mol.
TAINSTRUMENTS.COMTAINSTRUMENTS.COM
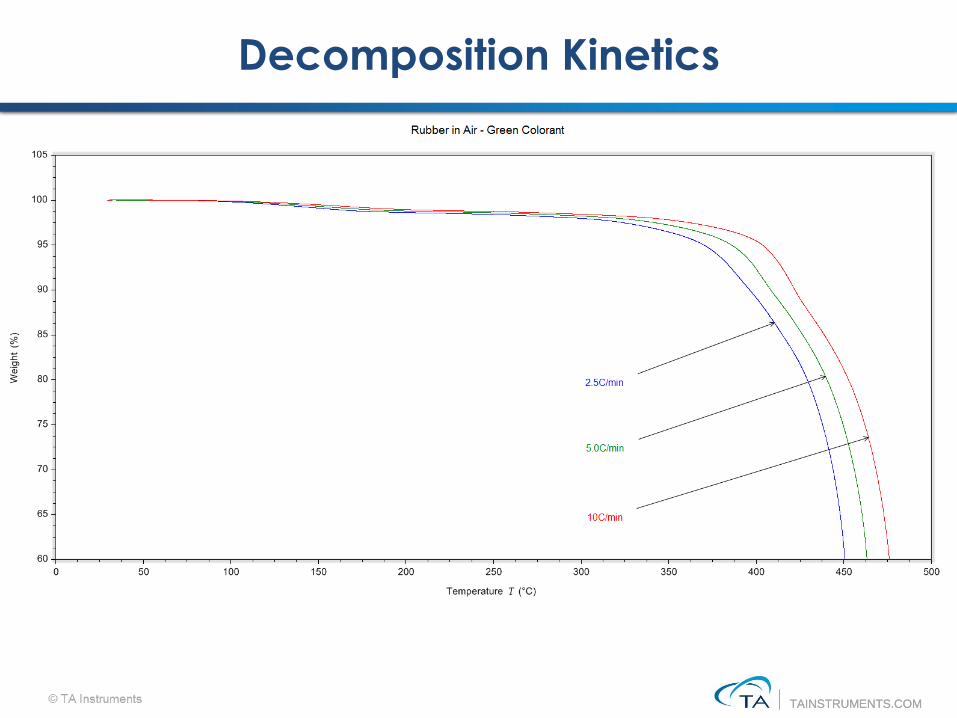
Decomposition Kinetics
TAINSTRUMENTS.COMTAINSTRUMENTS.COM
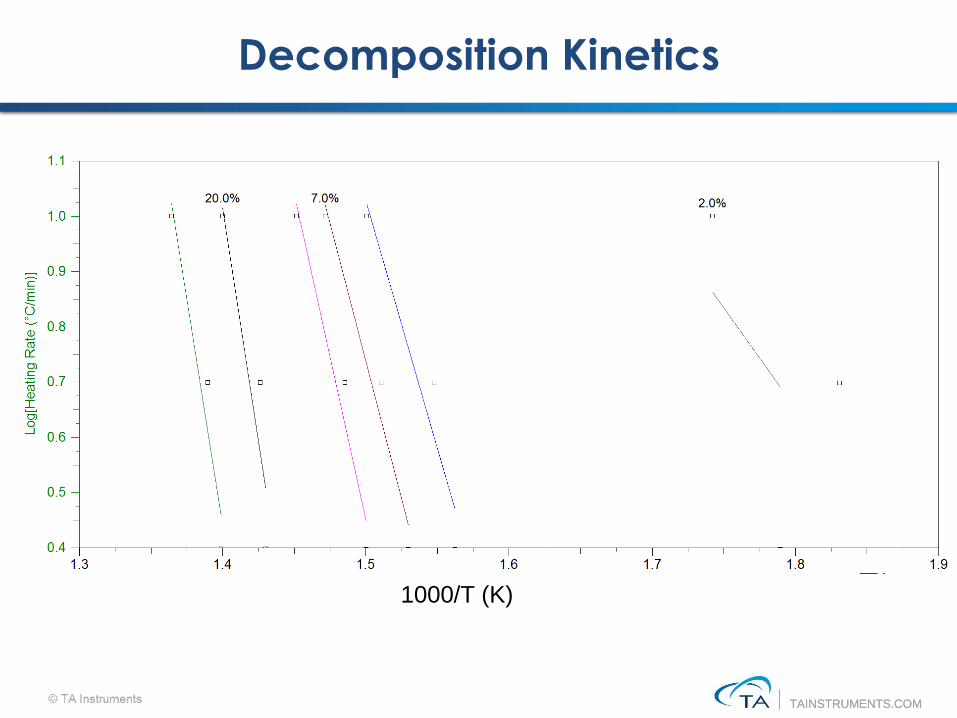
Decomposition Kinetics
1000/T (K)
TAINSTRUMENTS.COMTAINSTRUMENTS.COM
TGA Kinetics – Isoconversion Plot
TAINSTRUMENTS.COMTAINSTRUMENTS.COM
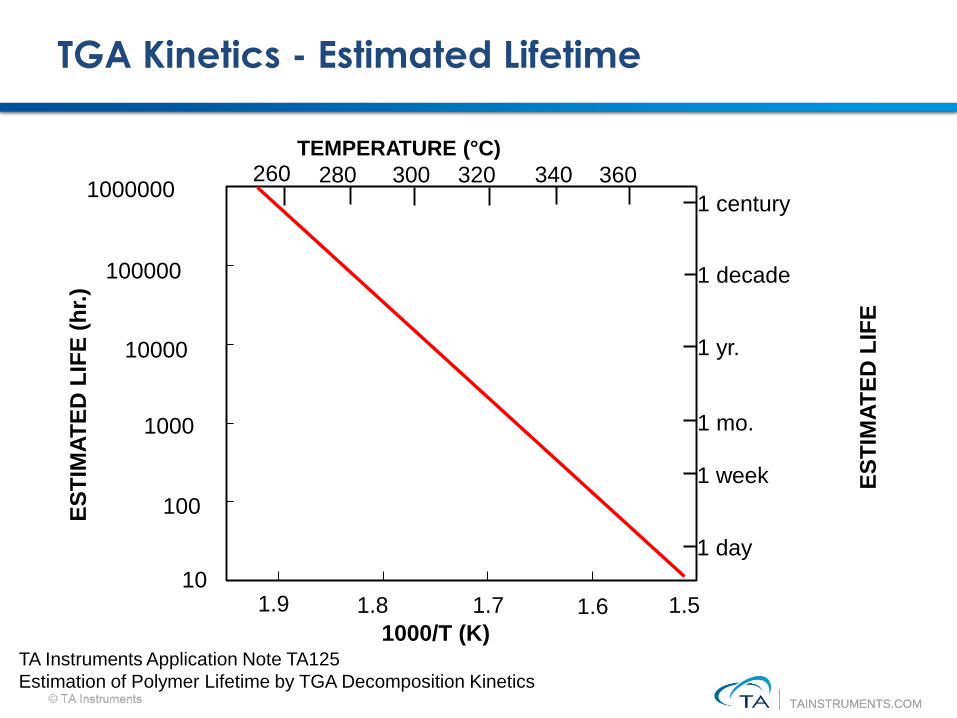
TGA Kinetics - Estimated Lifetime
TEMPERATURE (°C)
1.51.61.71.81.910
100
1000
10000
100000
1000000
1000/T (K)
ES
TIM
AT
ED
LIF
E (
hr.
)
260 280 300 320 340 360
1 century
1 decade
1 yr.
1 mo.
1 week
1 day
ES
TIM
AT
ED
LIF
E
TA Instruments Application Note TA125
Estimation of Polymer Lifetime by TGA Decomposition Kinetics
TAINSTRUMENTS.COMTAINSTRUMENTS.COM
Differential Scanning Calorimetry
(DSC) and Modulated DSC® (MDSC)
Overview
TAINSTRUMENTS.COMTAINSTRUMENTS.COM
Differential Scanning Calorimetry (DSC)
•Differential Scanning Calorimetry (DSC) is most popular
thermal analysis technique
•DSC measures endothermic and exothermic transitions as
a function of temperature
▪Endothermic heat flows into a sample
▪Exothermic heat flows out of the sample
•Used to characterize polymers (thermosets,
thermoplastics, elastomers)
•Also used with pharmaceuticals, foods/biologicals, organic
chemicals and inorganics
•Transitions measured include Tg, melting, crystallization,
curing and cure kinetics, onset of oxidation and heat
capacity
TAINSTRUMENTS.COMTAINSTRUMENTS.COM
What is Differential Scanning Calorimetry?
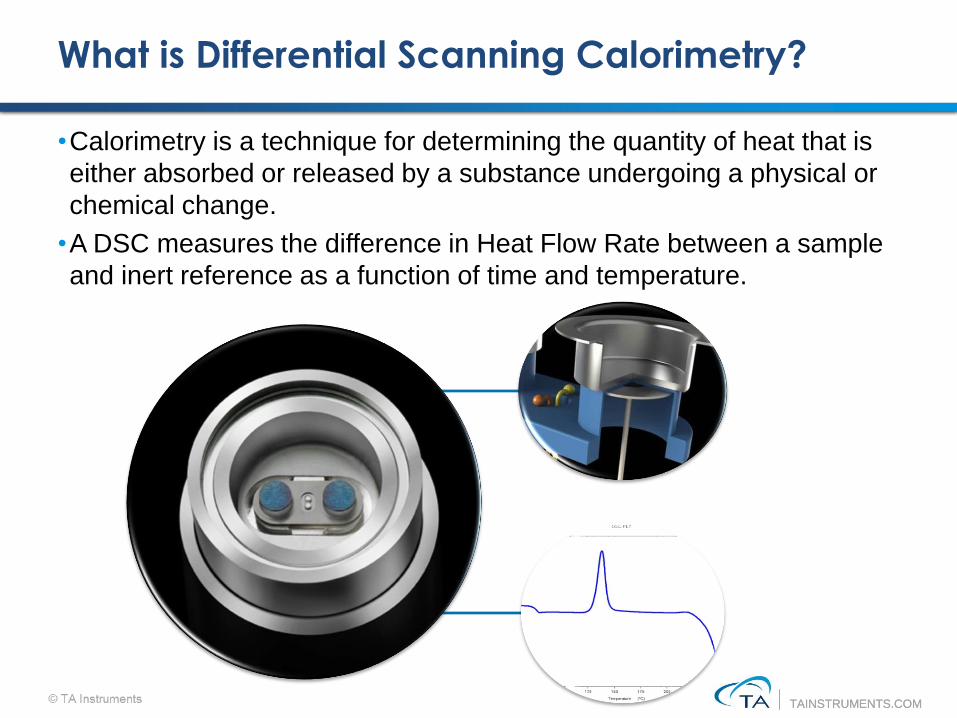
•Calorimetry is a technique for determining the quantity of heat that is
either absorbed or released by a substance undergoing a physical or
chemical change.
•A DSC measures the difference in Heat Flow Rate between a sample
and inert reference as a function of time and temperature.
TAINSTRUMENTS.COMTAINSTRUMENTS.COM
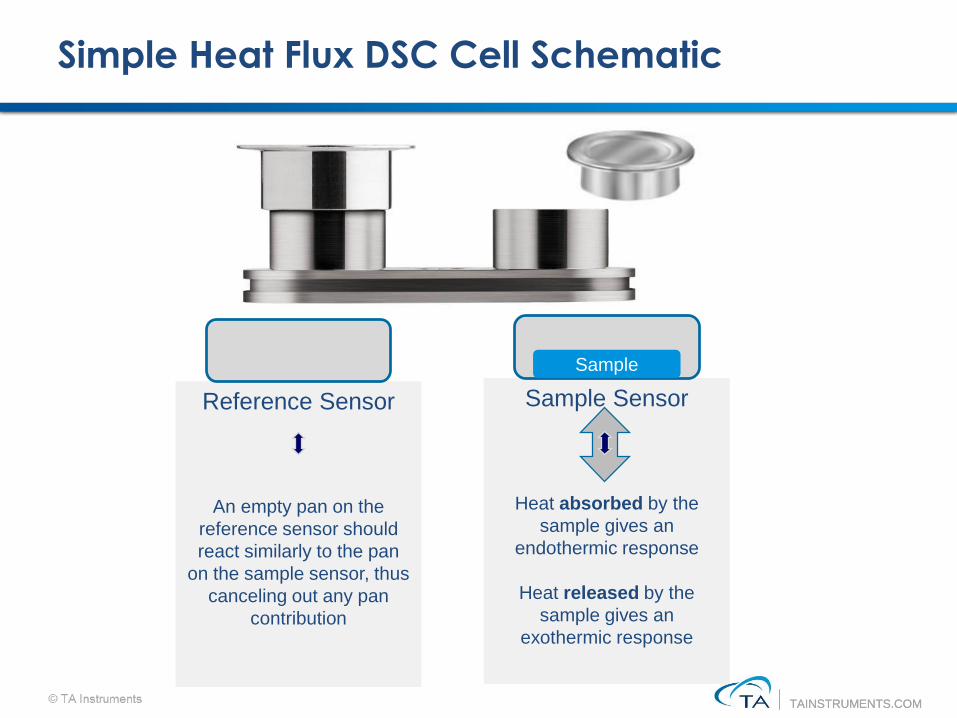
Simple Heat Flux DSC Cell Schematic
Reference Sensor
An empty pan on the
reference sensor should
react similarly to the pan
on the sample sensor, thus
canceling out any pan
contribution
Sample Sensor
Heat absorbed by the
sample gives an
endothermic response
Heat released by the
sample gives an
exothermic response
Sample
TAINSTRUMENTS.COMTAINSTRUMENTS.COM
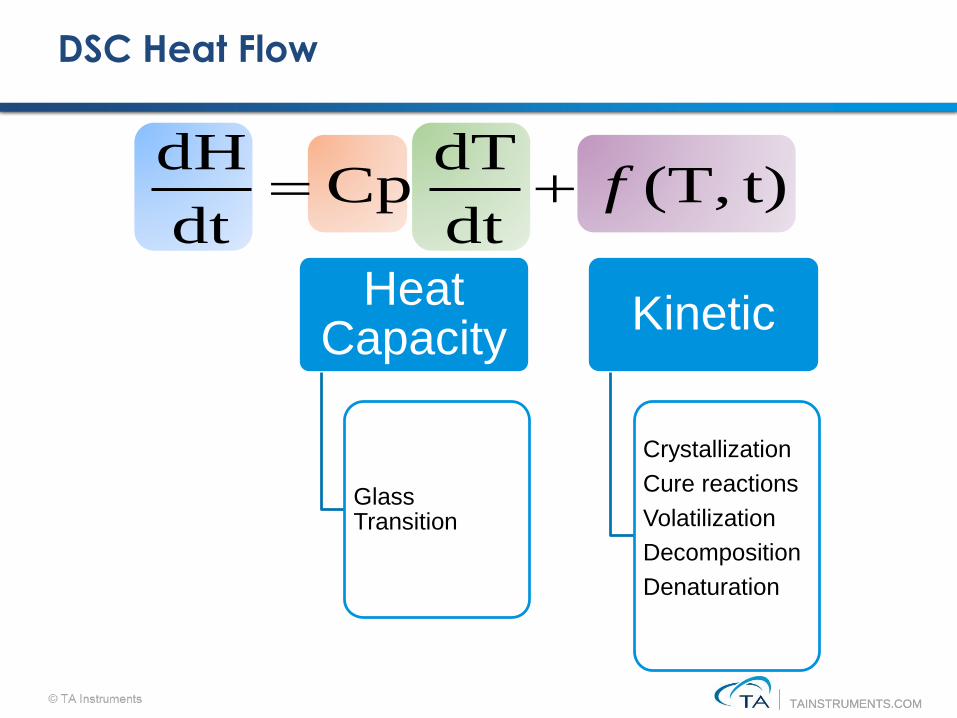
DSC Heat Flow
t)(T,dt
dT Cp
dt
dHf
Heat Capacity
Glass Transition
Kinetic
Crystallization
Cure reactions
Volatilization
Decomposition
Denaturation
TAINSTRUMENTS.COMTAINSTRUMENTS.COM
Exo Up
Exo Up
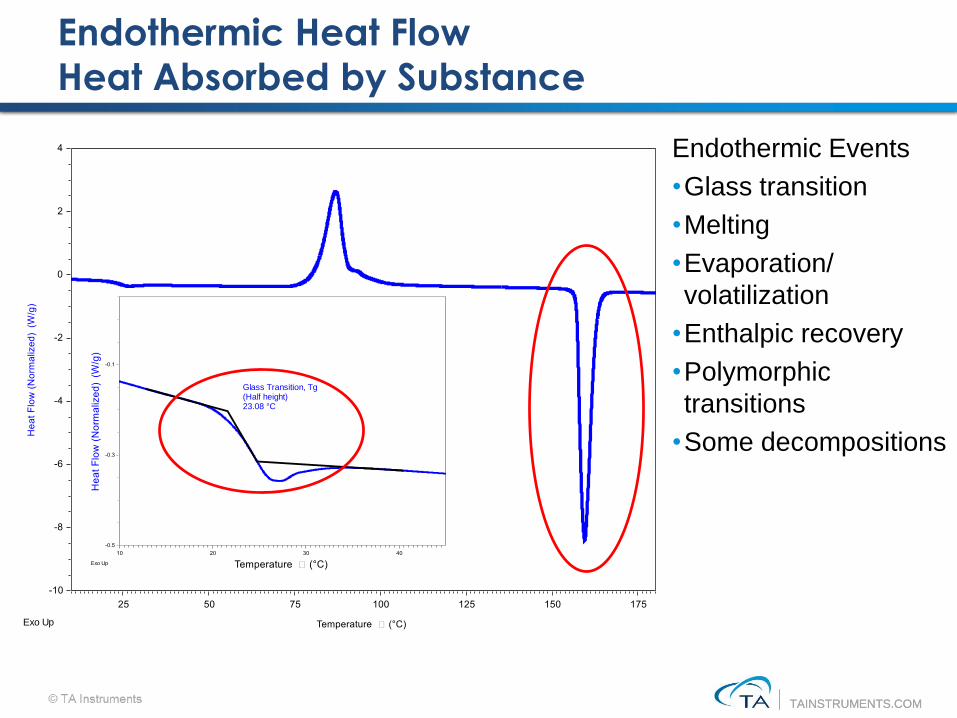
Glass Transition, Tg(Half height) 23.08 °C
Endothermic Heat Flow
Heat Absorbed by Substance
Endothermic Events
•Glass transition
•Melting
•Evaporation/
volatilization
•Enthalpic recovery
•Polymorphic
transitions
•Some decompositions
TAINSTRUMENTS.COMTAINSTRUMENTS.COM
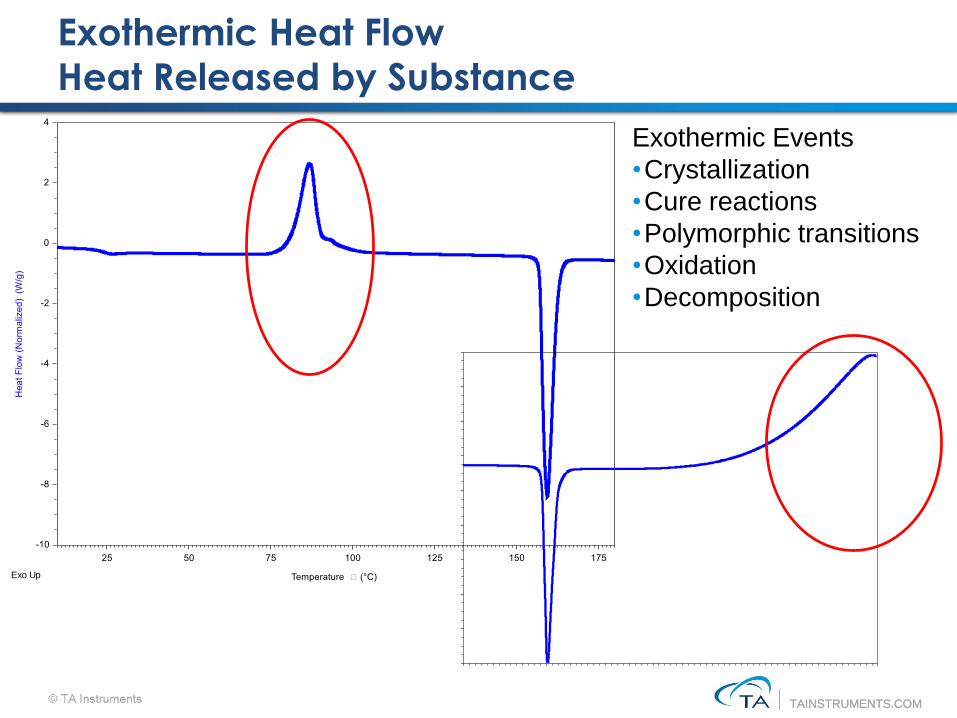
Exothermic Heat Flow
Heat Released by Substance
Exothermic Events
•Crystallization
•Cure reactions
•Polymorphic transitions
•Oxidation
•Decomposition
Exo Up
Exo Up
TAINSTRUMENTS.COMTAINSTRUMENTS.COM
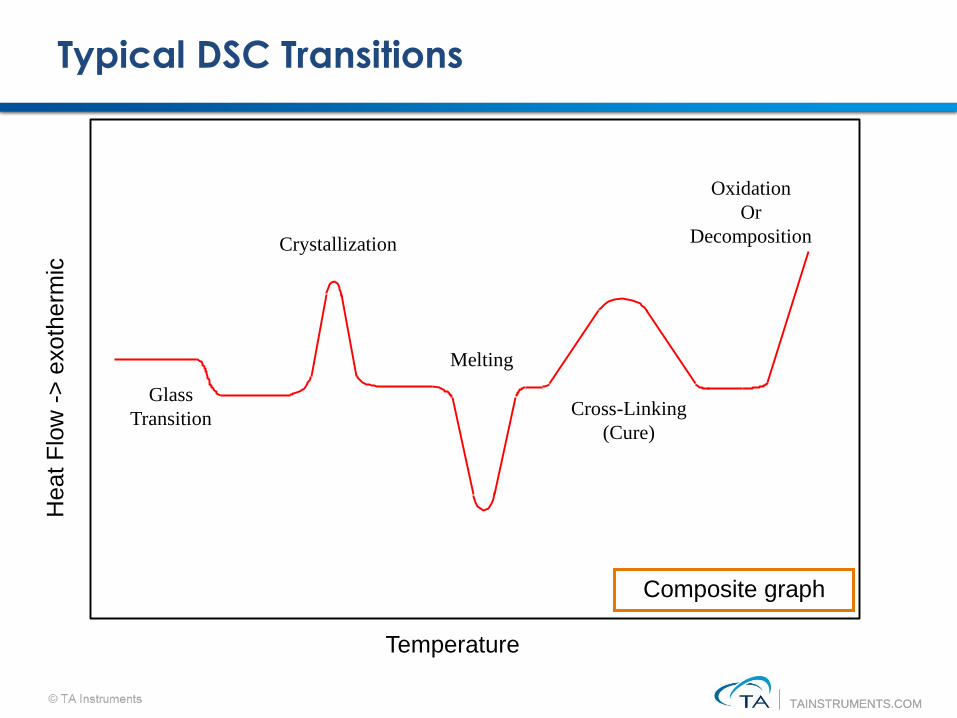
Typical DSC Transitions
Temperature
Heat F
low
->
exoth
erm
ic
Glass
Transition
Crystallization
Melting
Cross-Linking
(Cure)
Oxidation
Or
Decomposition
Composite graph
TAINSTRUMENTS.COMTAINSTRUMENTS.COM
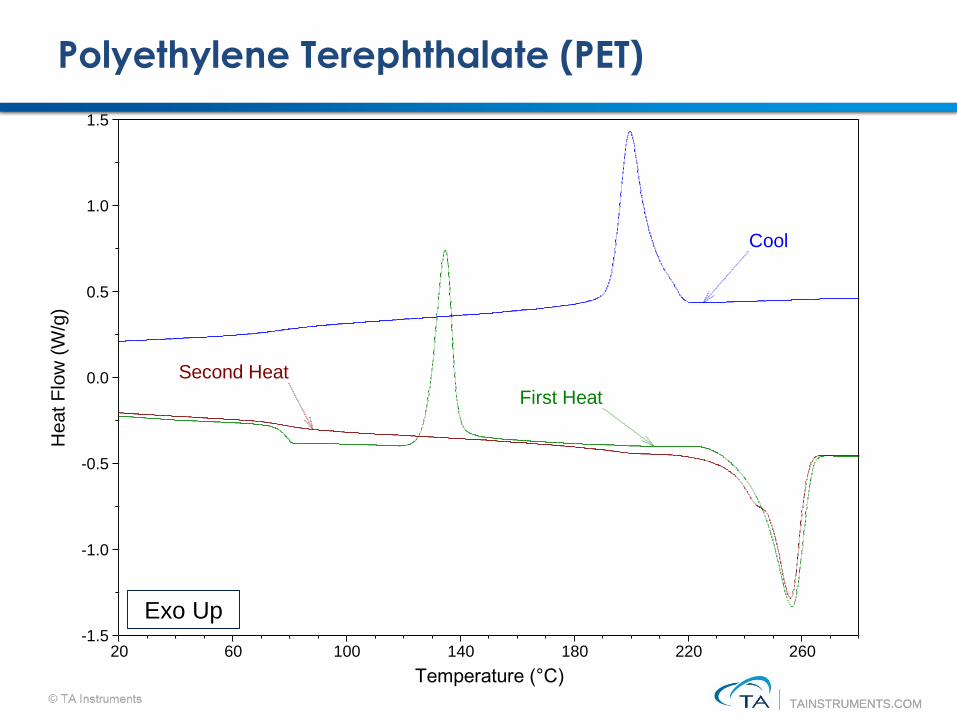
Polyethylene Terephthalate (PET)
Second Heat
First Heat
Cool
-1.5
-1.0
-0.5
0.0
0.5
1.0
1.5
Heat F
low
(W
/g)
20 60 100 140 180 220 260
Temperature (°C)
Exo Up
TAINSTRUMENTS.COMTAINSTRUMENTS.COM
What Does MDSC® Measure?
•MDSC separates the Total heat flow of DSC into two parts based on the heat flow that does and does not respond to a changing heating rate
•MDSC applies a changing heating rate on top of a linear heating rate in order measure the heat flow that responds to the changing heating rate
•In general, only heat capacity and melting respond to the changing heating rate
•The Reversing and Non-reversing signals of MDSC should never be interpreted as the measurement of reversible and nonreversible properties
TAINSTRUMENTS.COMTAINSTRUMENTS.COM
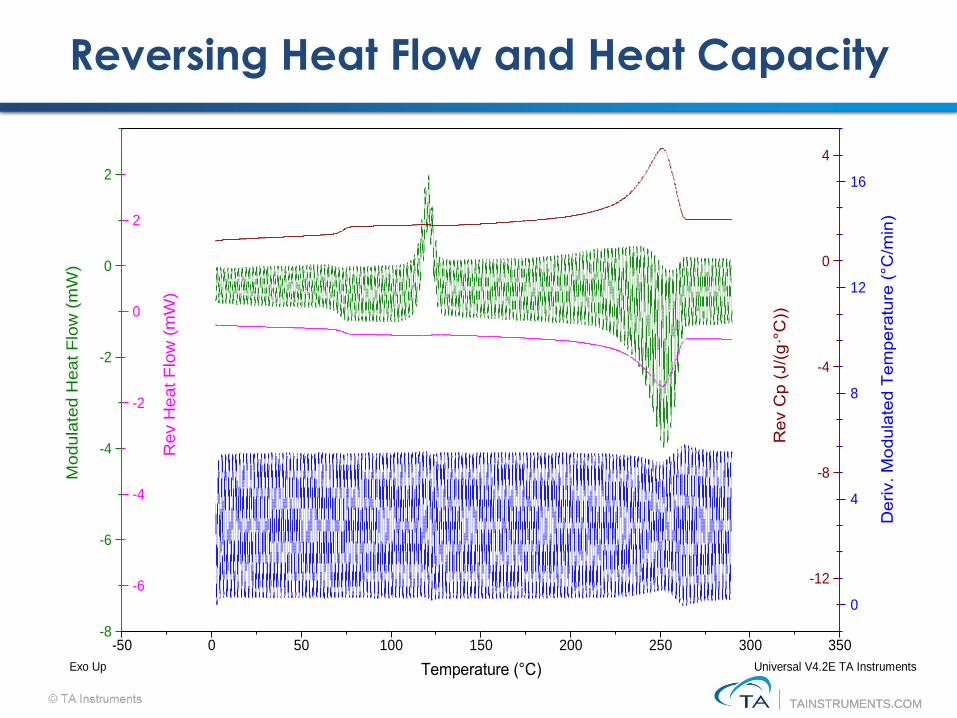
Reversing Heat Flow and Heat Capacity
-6
-4
-2
0
2
Rev H
eat F
low
(m
W)
-12
-8
-4
0
4
Rev C
p (
J/(
g·°
C))
0
4
8
12
16
Deriv. M
odula
ted T
em
pera
ture
(°C
/min
)
-8
-6
-4
-2
0
2
Modula
ted H
eat F
low
(m
W)
-50 0 50 100 150 200 250 300 350
Temperature (°C)
Exo Up Universal V4.2E TA Instruments
TAINSTRUMENTS.COMTAINSTRUMENTS.COM
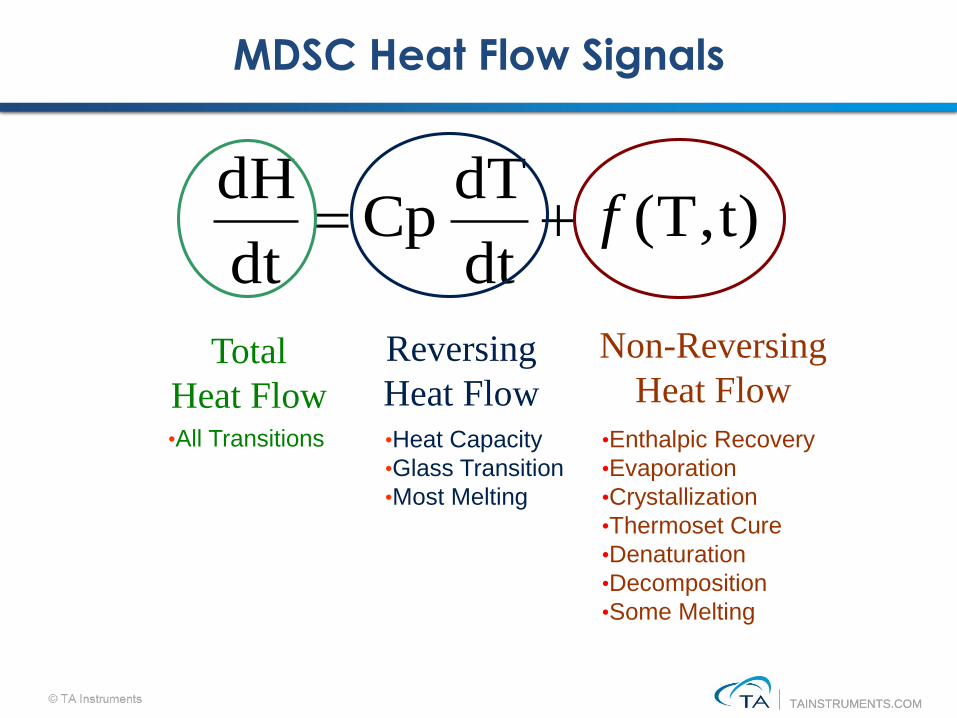
•Enthalpic Recovery
•Evaporation
•Crystallization
•Thermoset Cure
•Denaturation
•Decomposition
•Some Melting
MDSC Heat Flow Signals
Total
Heat Flow
t)(T,dt
dT Cp
dt
dHf
Reversing
Heat Flow
Non-Reversing
Heat Flow
•Heat Capacity
•Glass Transition
•Most Melting
•All Transitions
TAINSTRUMENTS.COMTAINSTRUMENTS.COM
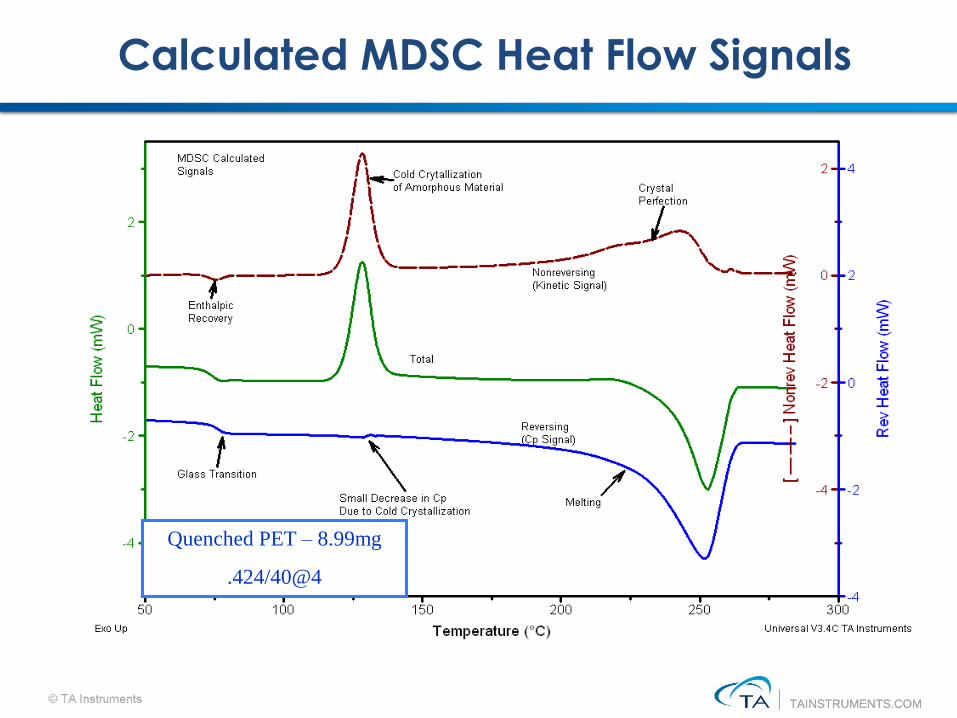
Calculated MDSC Heat Flow Signals
Quenched PET – 8.99mg
.424/40@4

TAINSTRUMENTS.COMTAINSTRUMENTS.COM
PET/ABS Blend - Conventional DSC
-0.2
-0.3
-0.4
-0.5
-0.6
-0.7
-0.8
Temperature (°C)50 100 150 200 250
He
at F
low
(W
/g)
first heat on molded part
(Curve shifted on Y axis to avoid overlap)
second heat after 10°C/min cooling
120.92°C67.38°C
70.262°C (H)235.36°C
111.82°C9.016J/g
22.63J/g
249.75°C
9.22 mg sample, nitrogen purge 10°C/minute heating rate
TAINSTRUMENTS.COMTAINSTRUMENTS.COM
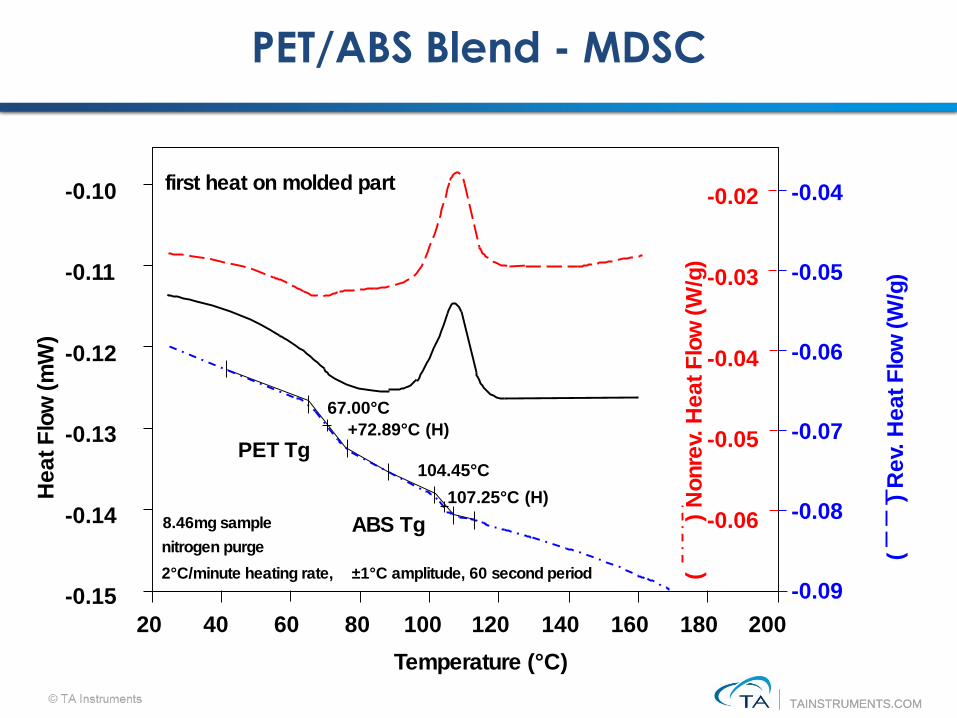
PET/ABS Blend - MDSC
8.46mg sample
nitrogen purge
2°C/minute heating rate, ±1°C amplitude, 60 second period
first heat on molded part
PET Tg
ABS Tg
-0.10
-0.11
-0.12
-0.13
-0.14
-0.15
Temperature (°C)
40 60 100 120 140
He
at
Flo
w (
mW
)
20 80 160
-0.02
-0.03
-0.04
-0.05
-0.06
-0.04
-0.05
-0.06
-0.07
-0.08
-0.09
(
) N
on
rev.
He
at
Flo
w (
W/g
)
(
) R
ev.
He
at F
low
(W
/g)
67.00°C
+72.89°C (H)
104.45°C
107.25°C (H)
180 200
TAINSTRUMENTS.COMTAINSTRUMENTS.COM
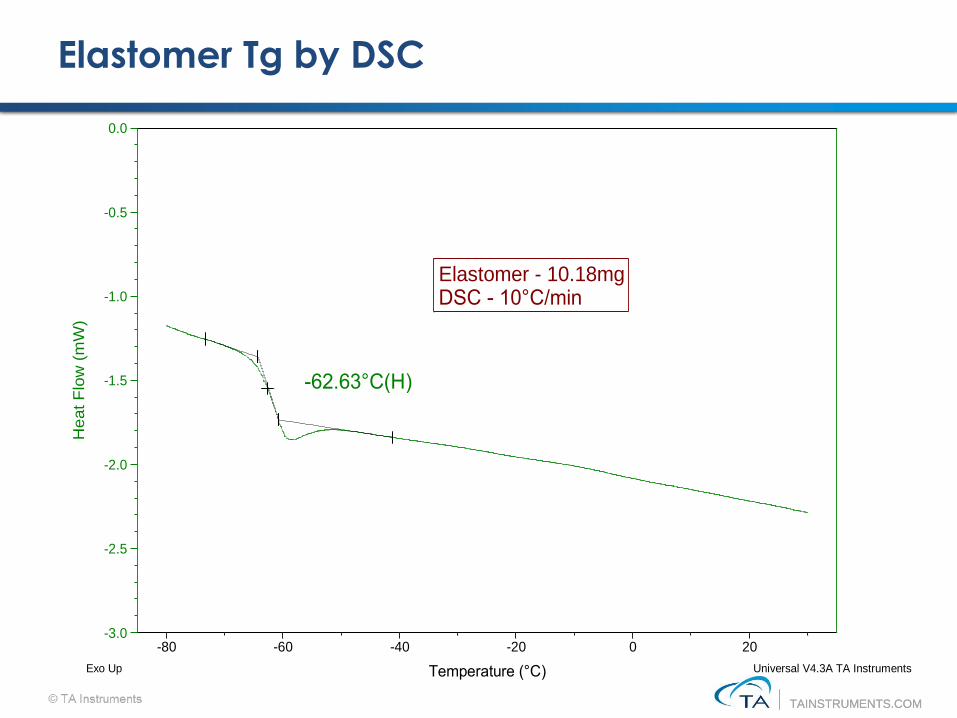
Elastomer Tg by DSC
-62.63°C(H)
Elastomer - 10.18mgDSC - 10°C/min
-3.0
-2.5
-2.0
-1.5
-1.0
-0.5
0.0
Heat
Flo
w (
mW
)
-80 -60 -40 -20 0 20
Temperature (°C)
Exo Up Universal V4.3A TA Instruments
TAINSTRUMENTS.COMTAINSTRUMENTS.COM
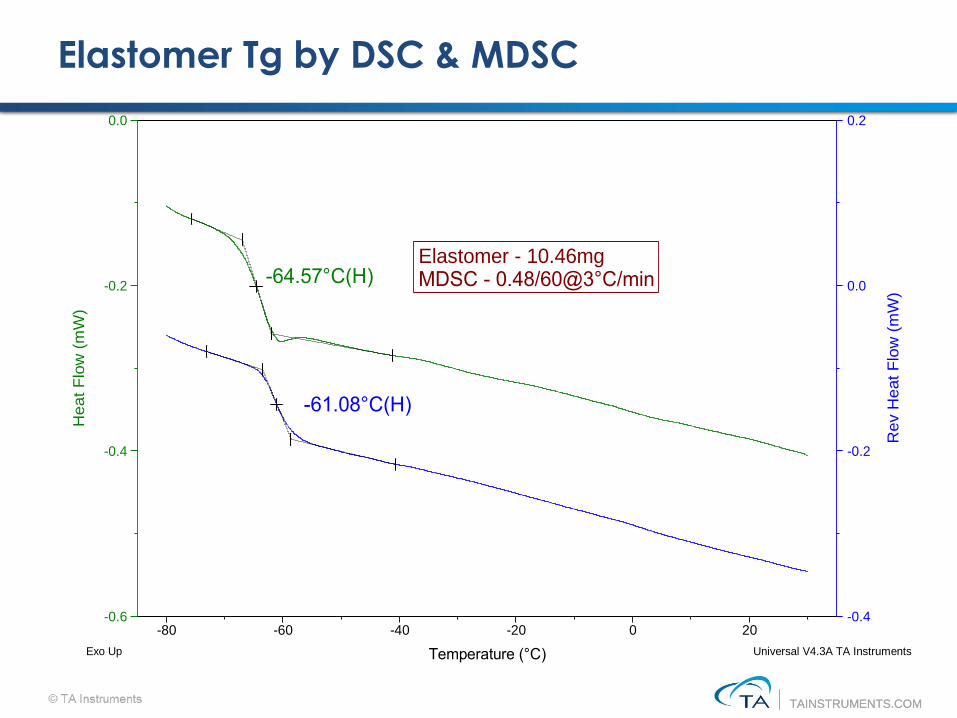
Elastomer Tg by DSC & MDSC
-61.08°C(H)
-64.57°C(H)Elastomer - 10.46mgMDSC - 0.48/60@3°C/min
-0.4
-0.2
0.0
0.2
Rev H
eat F
low
(m
W)
-0.6
-0.4
-0.2
0.0
Heat F
low
(m
W)
-80 -60 -40 -20 0 20
Temperature (°C)
Exo Up Universal V4.3A TA Instruments

TAINSTRUMENTS.COMTAINSTRUMENTS.COM
Curing Kinetics
TAINSTRUMENTS.COMTAINSTRUMENTS.COM
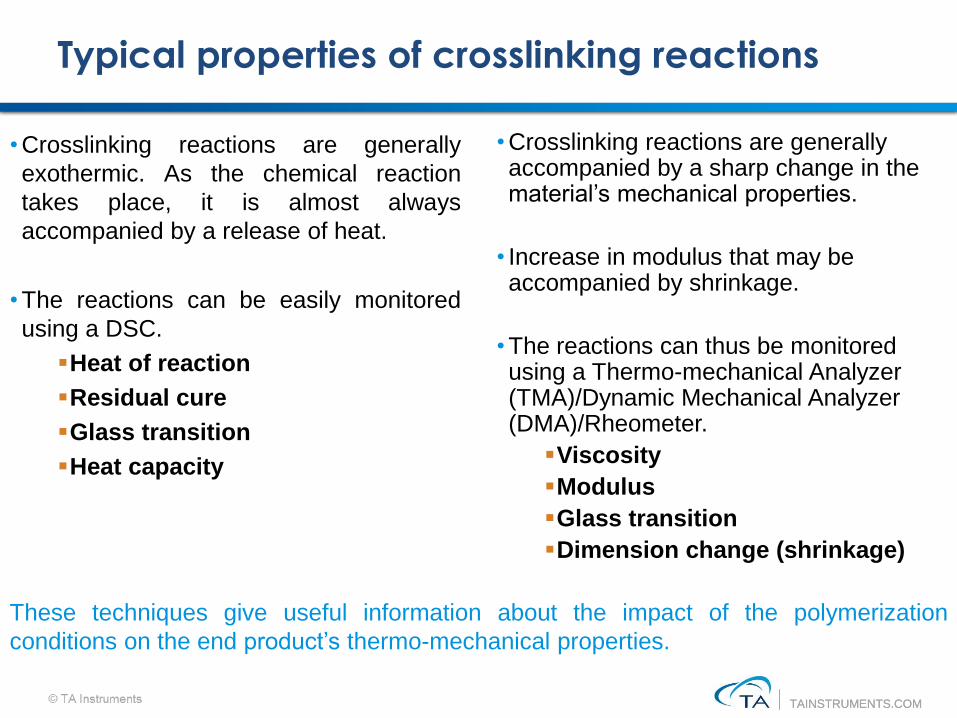
Typical properties of crosslinking reactions
• Crosslinking reactions are generally
exothermic. As the chemical reaction
takes place, it is almost always
accompanied by a release of heat.
• The reactions can be easily monitored
using a DSC.
▪Heat of reaction
▪Residual cure
▪Glass transition
▪Heat capacity
• Crosslinking reactions are generally accompanied by a sharp change in the material’s mechanical properties.
• Increase in modulus that may be accompanied by shrinkage.
• The reactions can thus be monitored using a Thermo-mechanical Analyzer (TMA)/Dynamic Mechanical Analyzer (DMA)/Rheometer.
▪Viscosity
▪Modulus
▪Glass transition
▪Dimension change (shrinkage)
These techniques give useful information about the impact of the polymerization
conditions on the end product’s thermo-mechanical properties.
TAINSTRUMENTS.COMTAINSTRUMENTS.COM
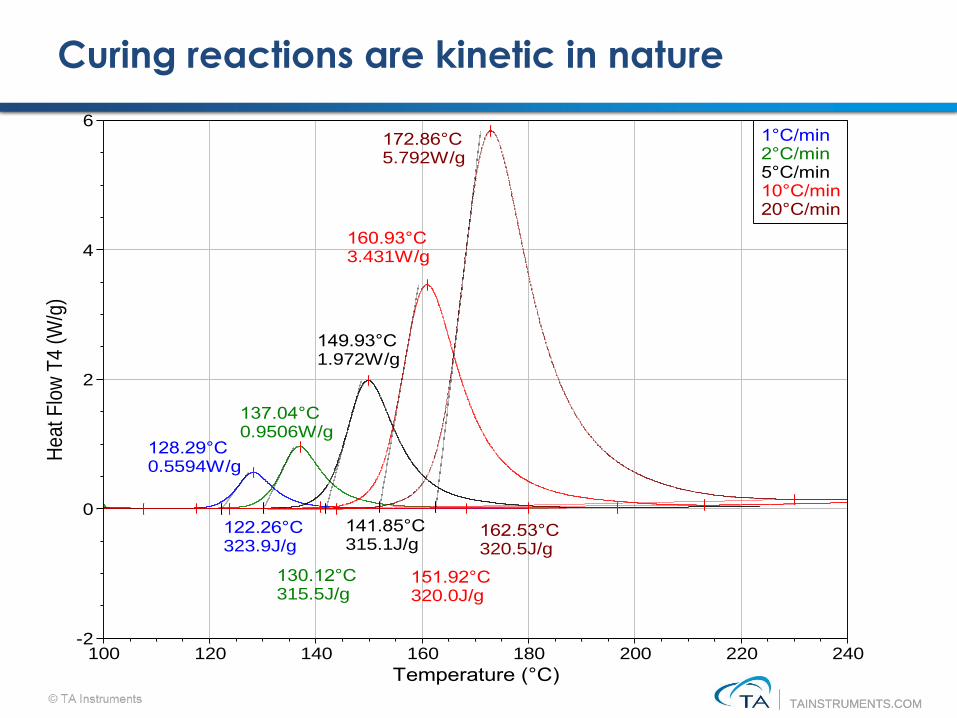
Curing reactions are kinetic in nature
128.29°C0.5594W/g
122.26°C323.9J/g
137.04°C0.9506W/g
130.12°C315.5J/g
149.93°C1.972W/g
141.85°C315.1J/g
160.93°C3.431W/g
151.92°C320.0J/g
172.86°C5.792W/g
162.53°C320.5J/g
-2
0
2
4
6
He
at F
low
T4
(W
/g)
100 120 140 160 180 200 220 240
Temperature (°C)
1°C/min2°C/min5°C/min10°C/min20°C/min
TAINSTRUMENTS.COMTAINSTRUMENTS.COM
Use of Kinetic Modeling for Characterization of Curing
Reactions
•Predict how long a reaction takes to go to completion
•Optimize polymerization, curing
•Quantify parameters that characterize time-temperature-dependent process behavior under conditions that may not always be experimentally feasible.
TAINSTRUMENTS.COMTAINSTRUMENTS.COM
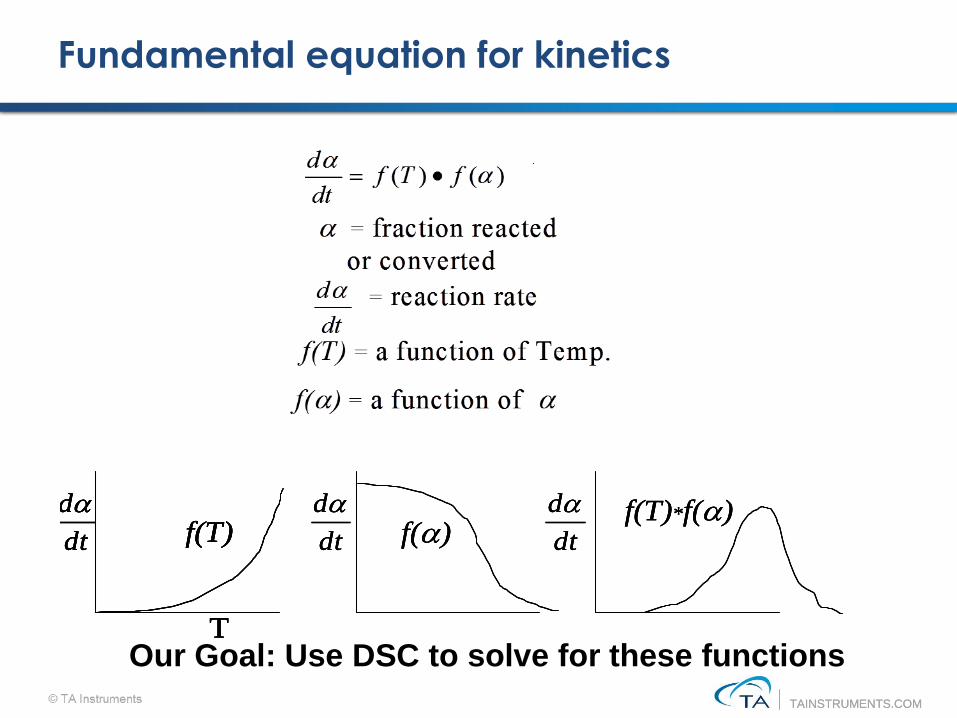
Fundamental equation for kinetics
)()(
fTfdt
d• Where:
= reaction rate
f() = a function of
f(T) = a function of Temp.
= fraction reacted
or converted
dt
d
dt
d
T
f(T) f() dt
d f(T)*f()dt
d
)()(
fTfdt
d• Where:
= reaction rate
f() = a function of
f(T) = a function of Temp.
= fraction reacted
or converted
dt
d
)()(
fTfdt
d• Where:
= reaction rate
f() = a function of
f(T) = a function of Temp.
= fraction reacted
or converted
dt
d
dt
d
T
f(T)dt
d
T
f(T)dt
d
T
f(T) f() dt
d f(T)*f()dt
df() dt
d f(T)*f()dt
d
Our Goal: Use DSC to solve for these functions
TAINSTRUMENTS.COMTAINSTRUMENTS.COM
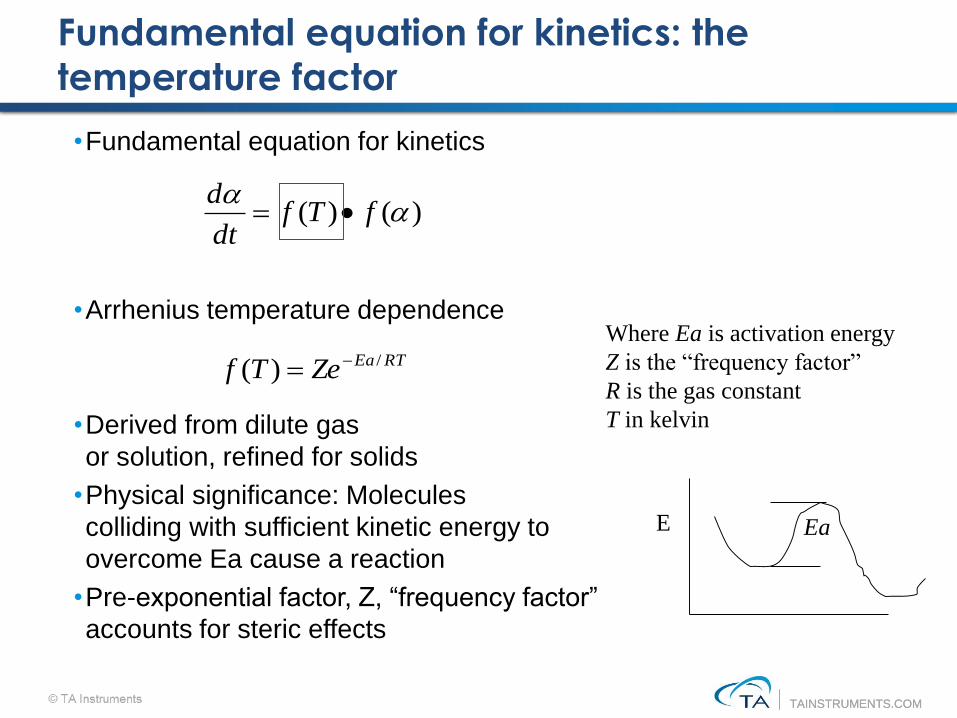
Fundamental equation for kinetics: the
temperature factor
•Fundamental equation for kinetics
•Arrhenius temperature dependence
•Derived from dilute gas
or solution, refined for solids
•Physical significance: Molecules
colliding with sufficient kinetic energy to
overcome Ea cause a reaction
•Pre-exponential factor, Z, “frequency factor”
accounts for steric effects
RTEaZeTf /)(
Where Ea is activation energy
Z is the “frequency factor”
R is the gas constant
T in kelvin
)()(
fTfdt
d•
E Ea
TAINSTRUMENTS.COMTAINSTRUMENTS.COM
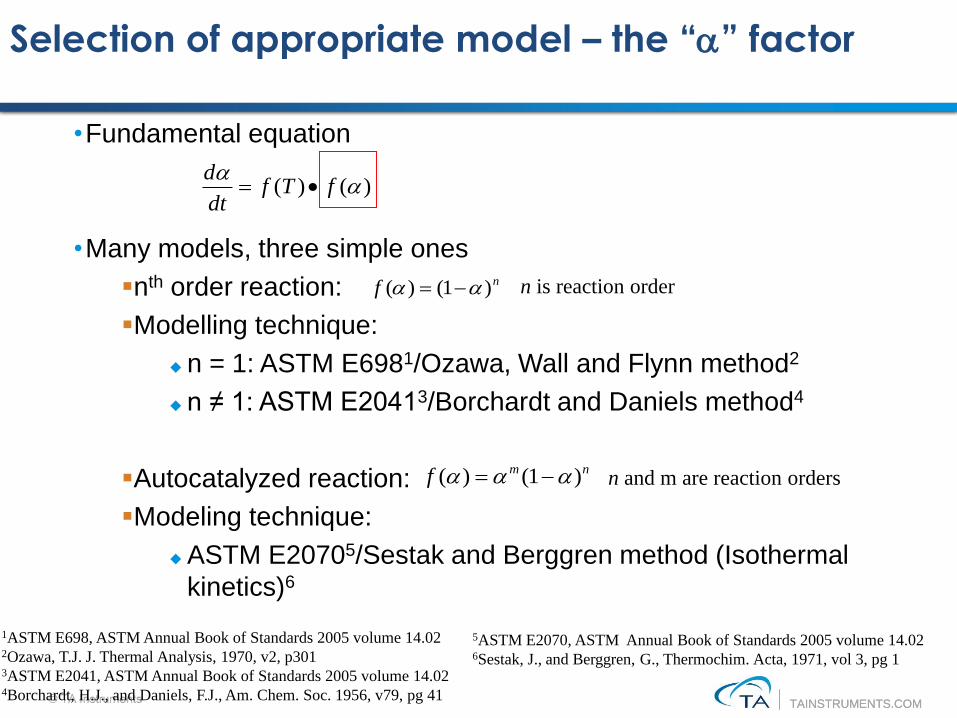
Selection of appropriate model – the “” factor
•Fundamental equation
•Many models, three simple ones
▪nth order reaction:
▪Modelling technique:
n = 1: ASTM E6981/Ozawa, Wall and Flynn method2
n ≠ 1: ASTM E20413/Borchardt and Daniels method4
▪Autocatalyzed reaction:
▪Modeling technique:
ASTM E20705/Sestak and Berggren method (Isothermal
kinetics)6
n and m are reaction orders
)()(
fTfdt
d•
nf )1()(
nmf )1()(
1ASTM E698, ASTM Annual Book of Standards 2005 volume 14.022Ozawa, T.J. J. Thermal Analysis, 1970, v2, p3013ASTM E2041, ASTM Annual Book of Standards 2005 volume 14.024Borchardt, H.J., and Daniels, F.J., Am. Chem. Soc. 1956, v79, pg 41
5ASTM E2070, ASTM Annual Book of Standards 2005 volume 14.026Sestak, J., and Berggren, G., Thermochim. Acta, 1971, vol 3, pg 1
n is reaction order
TAINSTRUMENTS.COMTAINSTRUMENTS.COM
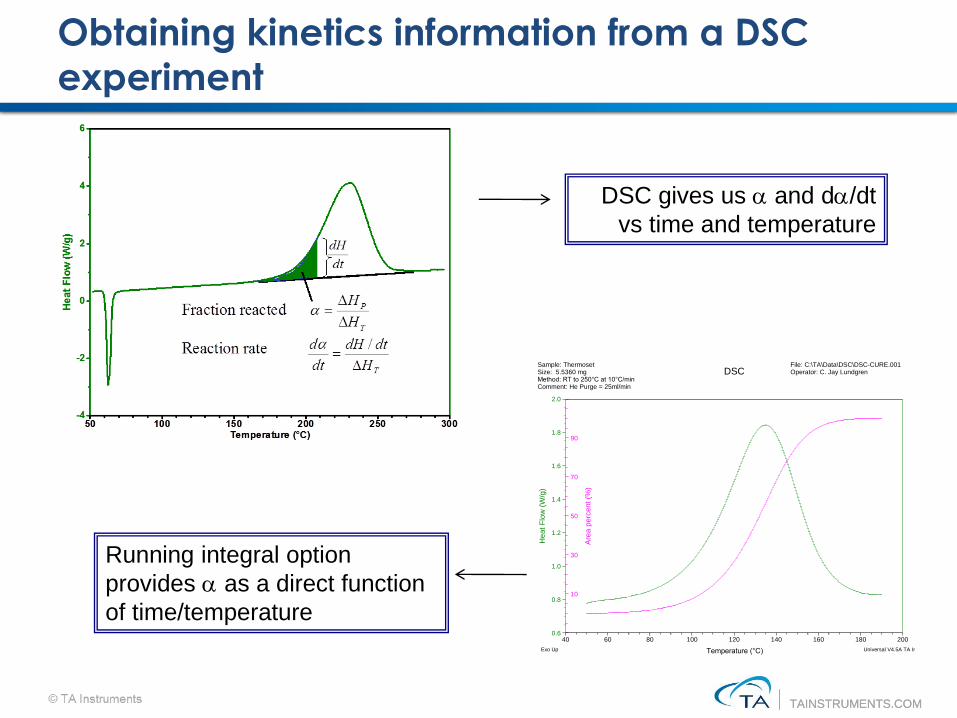
Obtaining kinetics information from a DSC
experiment
10
30
50
70
90
Are
a p
erc
en
t (%
)
0.6
0.8
1.0
1.2
1.4
1.6
1.8
2.0
He
at
Flo
w (
W/g
)
40 60 80 100 120 140 160 180 200
Temperature (°C)
Sample: ThermosetSize: 5.5360 mgMethod: RT to 250°C at 10°C/minComment: He Purge = 25ml/min
DSCFile: C:\TA\Data\DSC\DSC-CURE.001Operator: C. Jay Lundgren
Exo Up Universal V4.5A TA Instruments
DSC gives us and d/dt
vs time and temperature
Running integral option
provides as a direct function
of time/temperature
TAINSTRUMENTS.COMTAINSTRUMENTS.COM
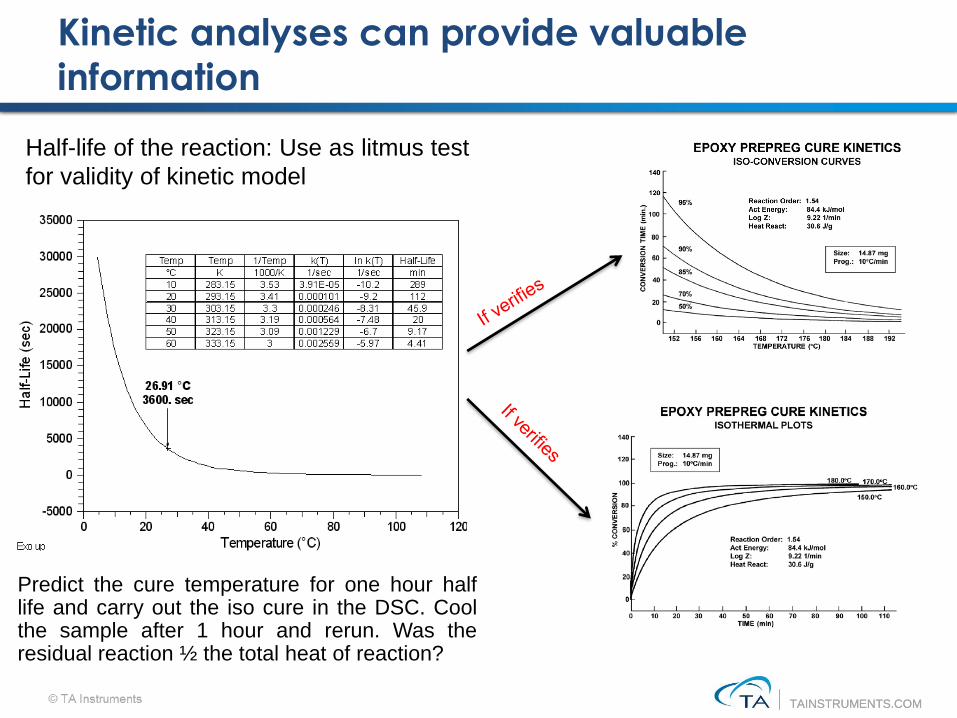
Kinetic analyses can provide valuable
information
Half-life of the reaction: Use as litmus test
for validity of kinetic model
Predict the cure temperature for one hour halflife and carry out the iso cure in the DSC. Coolthe sample after 1 hour and rerun. Was theresidual reaction ½ the total heat of reaction?
TAINSTRUMENTS.COMTAINSTRUMENTS.COM
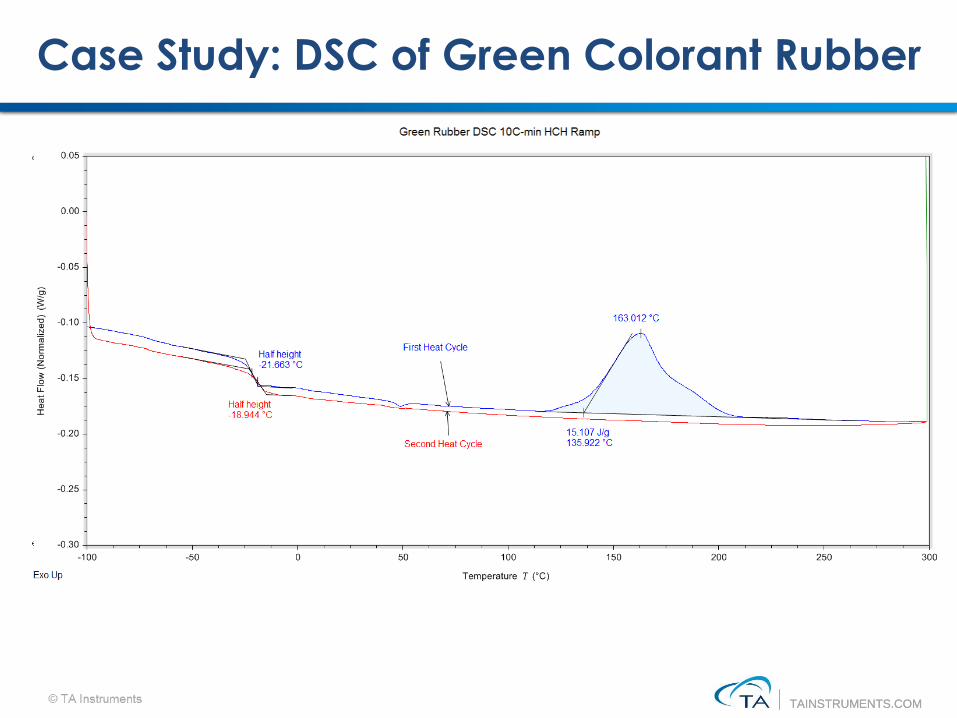
Case Study: DSC of Green Colorant Rubber
TAINSTRUMENTS.COMTAINSTRUMENTS.COM
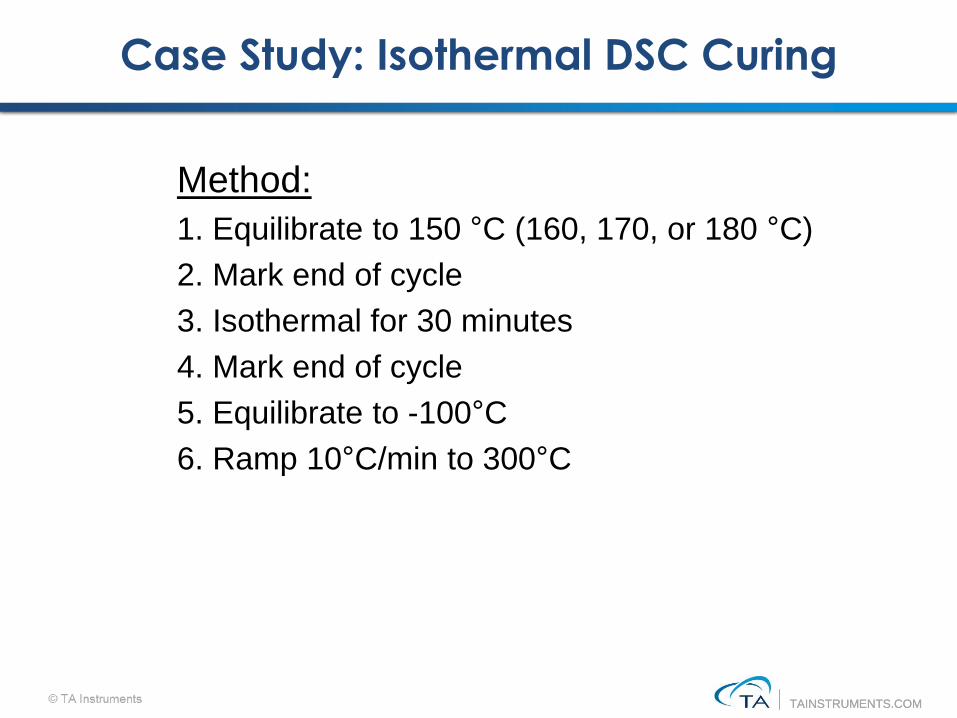
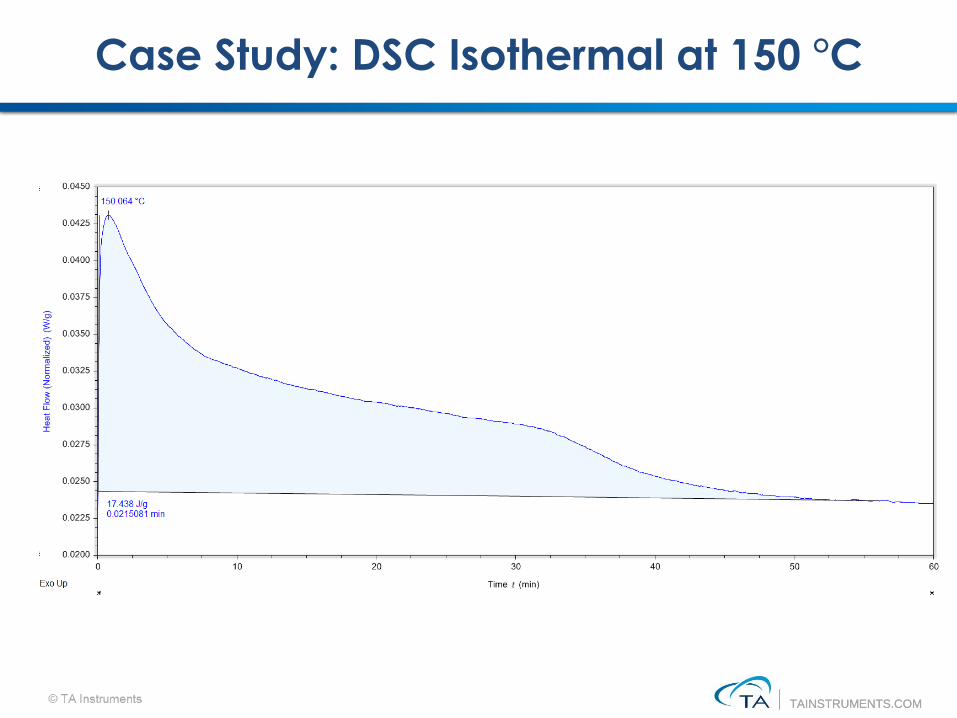
Case Study: Isothermal DSC Curing
Method:
1. Equilibrate to 150 °C (160, 170, or 180 °C)
2. Mark end of cycle
3. Isothermal for 30 minutes
4. Mark end of cycle
5. Equilibrate to -100°C
6. Ramp 10°C/min to 300°C
TAINSTRUMENTS.COMTAINSTRUMENTS.COM
Case Study: DSC Isothermal at 150 °C
TAINSTRUMENTS.COMTAINSTRUMENTS.COM
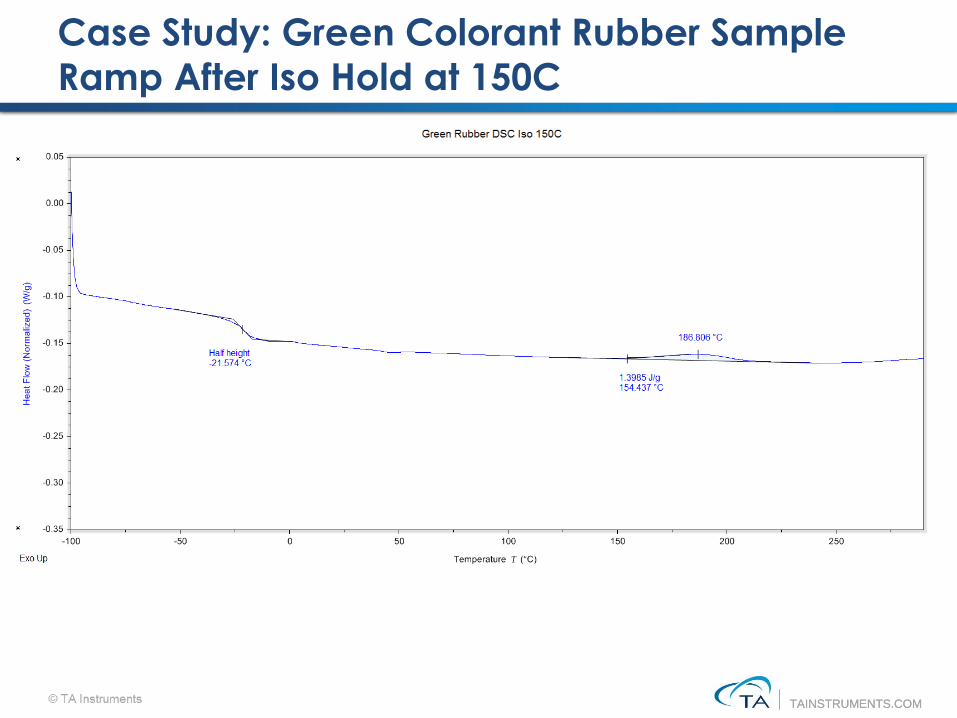
Case Study: Green Colorant Rubber Sample
Ramp After Iso Hold at 150C
TAINSTRUMENTS.COMTAINSTRUMENTS.COM
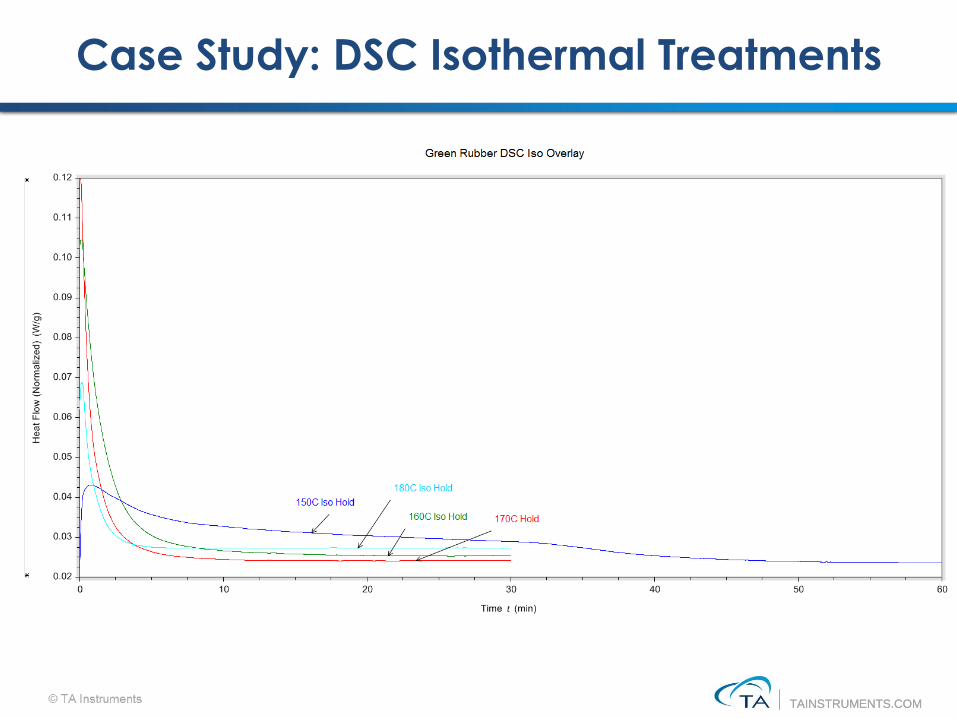
Case Study: DSC Isothermal Treatments
TAINSTRUMENTS.COMTAINSTRUMENTS.COM
Case Study: Summary
• Differential scanning calorimetry can be used to simulate
plant processing of thermosetting materials with limitations
•Common limitations are:
▪ Too high a curing temperature to get good DSC data
▪ Too low small or no curing exotherm
Examples: low level peroxide crosslinkers, vulcanization,
highly cured specimens
• DSC can be used both to thermally condition the
thermoset and then determine the extent of cure
• DSC kinetic model can be highly predictive
• Ongoing cutting edge academic studies
TAINSTRUMENTS.COMTAINSTRUMENTS.COM
Section Summary
•Thermal analysis – both TGA and DSC – are widely used
in the rubber industry
▪ Material characterization (QC, R&D, etc.)
▪ Process optimization through cure kinetics
▪ Stability (thermal, oxidative)
•TA Instruments is a premier supplies of thermal analytical,
rheological, thermal physical and other instrumentation to
all technology based industries

TAINSTRUMENTS.COMTAINSTRUMENTS.COM
Any questions?
TAINSTRUMENTS.COMTAINSTRUMENTS.COM
Thank You
The World Leader in Thermal Analysis,
Rheology, and Microcalorimetry
© TA Instruments


![Silicone rubbers for dielectric elastomers with improved ......dielectric elastomer (DE) formulation due to their favorable electro-mechanical properties. [1] Dielectric elastomers](https://static.fdocuments.net/doc/165x107/60a7aa8430c09b569000940a/silicone-rubbers-for-dielectric-elastomers-with-improved-dielectric-elastomer.jpg)

