Grain Refinement of Aluminum Weld Metal - American Welding Society
Chemistry and Materials Research www.iiste.org
ISSN 2224- 3224 (Print) ISSN 2225- 0956 (Online)
Vol.6 No.6, 2014
52
Thermal Analysis of Grain Refinement and Modification
of an A356 Cast Alloy. Verónica Gutiérrez
1, Gabriela González
2, Alejandro García
3
1,2,3Departamento de Ingeniería Metalúrgica, Facultad de Química UNAM, México D.F.
Abstract
It is well known that grain refining and eutectic Si modification treatments provide benefits to aluminum alloys.
The addition of master alloys makes it possible to obtain a fine grain size and a modified eutectic microstructure.
The present research evaluates the combined effect of both treatments in an A356 alloy by thermic analysis of
the cooling curves and micro- and macrostructural studies of the samples. Reviewing the thermal parameters of
the cooling curves indicated that using 0.2%Ti and 0.03% Sr, a good level of eutectic phase modification, as well
as a fine grain structure, is reached. The joint effect of both elements is involved in the alteration of the growth
kinetics both of the primary phase and the eutectic phase.
Keywords: grain refining, eutectic Si modification, A356 alloy, solidification, thermal parameters, thermic
analysis, microstructure, macrostructure.
1. Introduction
Producing cast aluminum alloys involves controlling a considerable number of variables, in order to achieve
isotropic mechanical properties throughout the material. Grain refining and the modification of eutectic Si are
two practices that are carried out for obtaining an optimal microstructure and composition of the alloy.
Through the addition of a grain-refining agent in the form of a master alloy, a fine grain structure is obtained.
This structure is desirable in a cast-alloy piece for many reasons: improves the melting feed, reduces contraction
defects, improves mechanical properties (specially, elongation and tension stress) as well as producing a fine
dispersion of microporosities and certain intermetallic components. [1].
Modification of eutectic Si is usually achieved by adding certain modifier agents in the liquid metal bath, which
depress the eutectic growth temperature, compared with an unmodified alloy. This takes place because the
modifier agent changes the growth kinetics of the eutectic phase and a morphological change, or gradual
refinement, occurs [2].
Several studies have focused on the techniques of modification or grain refinement in aluminum and its alloys,
however, little is known about the combined effect of both treatments.
The main objective of this paper is to obtain a proper ratio of Ti and Sr, which will allow reaching a good level
of grain refinement and an ideal degree of modification. This is accomplished by analyzing the influence of both
treatments on the thermal parameters of solidification, via the cooling curves of an A356 alloy, with additions of
Al-5Ti-1B and Al-10 Sr master alloys.
2. Experimental Procedure
A factorial design was done to determine the quantity of samples that would be used in the experimentation. This
design includes the eutectic phase modifier and grain refiner percentages to be used:
Chemistry and Materials Research www.iiste.org
ISSN 2224- 3224 (Print) ISSN 2225- 0956 (Online)
Vol.6 No.6, 2014
53
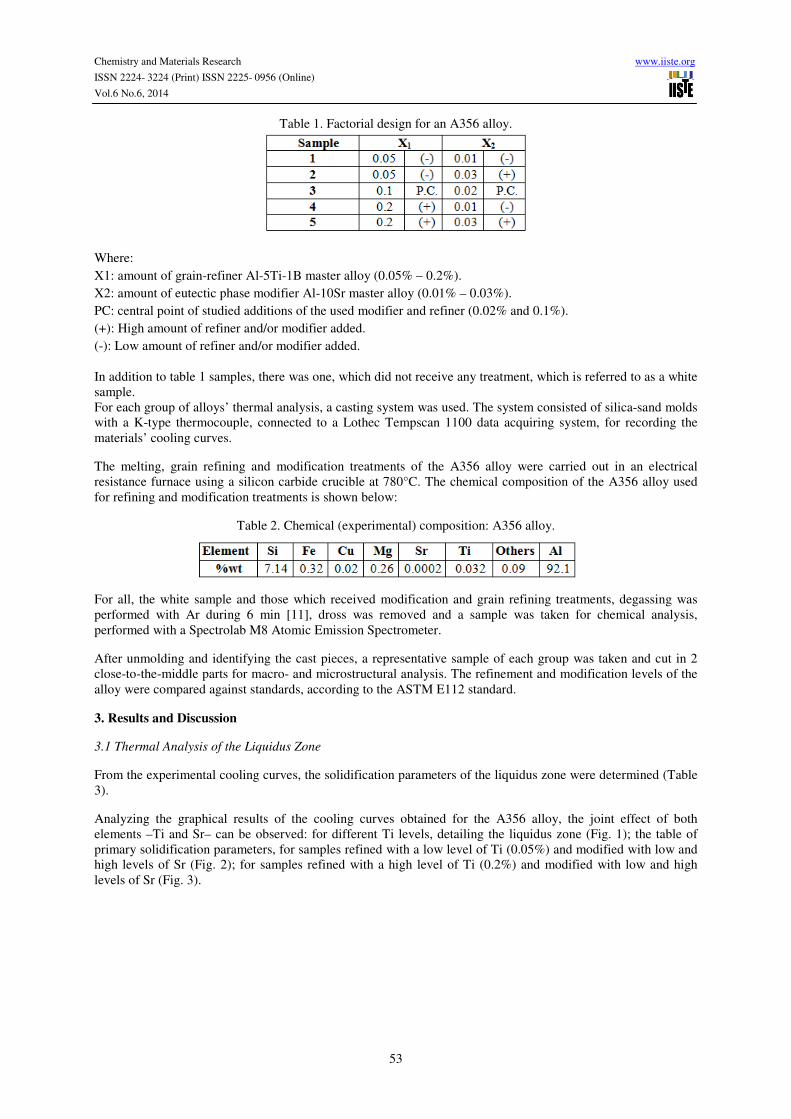
Table 1. Factorial design for an A356 alloy.
Where:
X1: amount of grain-refiner Al-5Ti-1B master alloy (0.05% – 0.2%).
X2: amount of eutectic phase modifier Al-10Sr master alloy (0.01% – 0.03%).
PC: central point of studied additions of the used modifier and refiner (0.02% and 0.1%).
(+): High amount of refiner and/or modifier added.
(-): Low amount of refiner and/or modifier added.
In addition to table 1 samples, there was one, which did not receive any treatment, which is referred to as a white
sample.
For each group of alloys’ thermal analysis, a casting system was used. The system consisted of silica-sand molds
with a K-type thermocouple, connected to a Lothec Tempscan 1100 data acquiring system, for recording the
materials’ cooling curves.
The melting, grain refining and modification treatments of the A356 alloy were carried out in an electrical
resistance furnace using a silicon carbide crucible at 780°C. The chemical composition of the A356 alloy used
for refining and modification treatments is shown below:
Table 2. Chemical (experimental) composition: A356 alloy.
For all, the white sample and those which received modification and grain refining treatments, degassing was
performed with Ar during 6 min [11], dross was removed and a sample was taken for chemical analysis,
performed with a Spectrolab M8 Atomic Emission Spectrometer.
After unmolding and identifying the cast pieces, a representative sample of each group was taken and cut in 2
close-to-the-middle parts for macro- and microstructural analysis. The refinement and modification levels of the
alloy were compared against standards, according to the ASTM E112 standard.
3. Results and Discussion
3.1 Thermal Analysis of the Liquidus Zone
From the experimental cooling curves, the solidification parameters of the liquidus zone were determined (Table
3).
Analyzing the graphical results of the cooling curves obtained for the A356 alloy, the joint effect of both
elements –Ti and Sr– can be observed: for different Ti levels, detailing the liquidus zone (Fig. 1); the table of
primary solidification parameters, for samples refined with a low level of Ti (0.05%) and modified with low and
high levels of Sr (Fig. 2); for samples refined with a high level of Ti (0.2%) and modified with low and high
levels of Sr (Fig. 3).
Chemistry and Materials Research www.iiste.org
ISSN 2224- 3224 (Print) ISSN 2225- 0956 (Online)
Vol.6 No.6, 2014
54
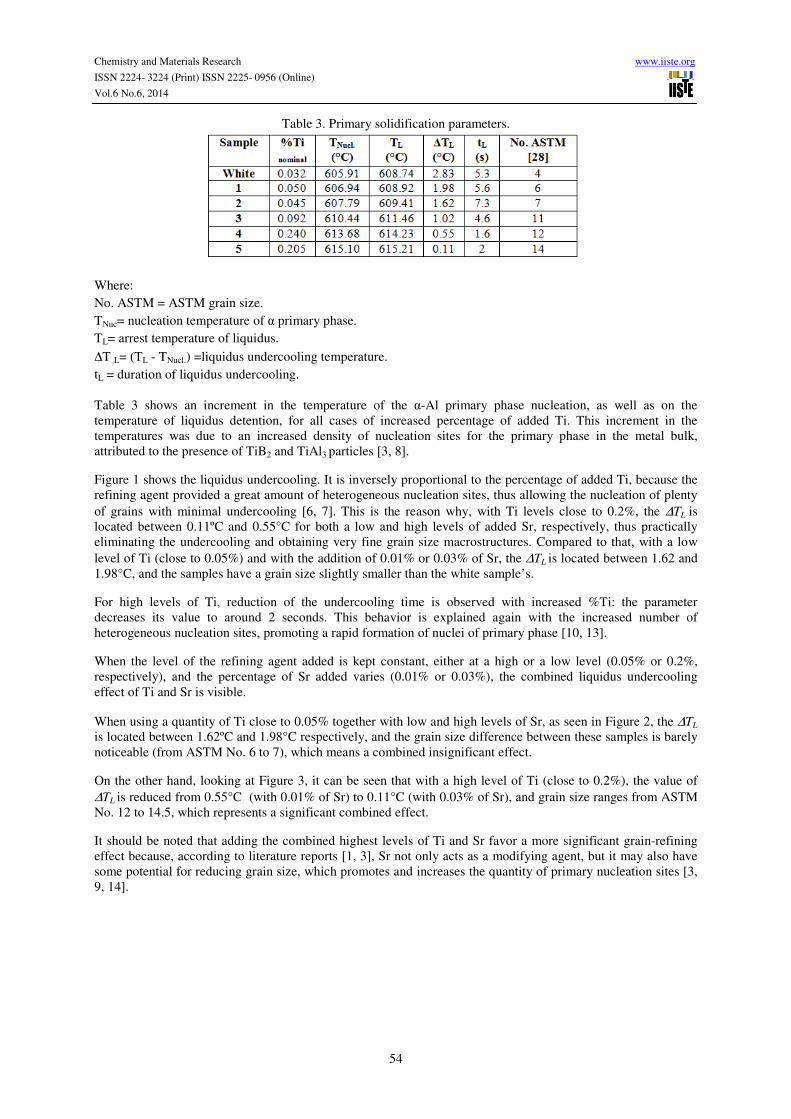
Table 3. Primary solidification parameters.
Where:
No. ASTM = ASTM grain size.
TNuc= nucleation temperature of α primary phase.
TL= arrest temperature of liquidus.
∆T L= (TL - TNucl.) =liquidus undercooling temperature.
tL = duration of liquidus undercooling.
Table 3 shows an increment in the temperature of the α-Al primary phase nucleation, as well as on the
temperature of liquidus detention, for all cases of increased percentage of added Ti. This increment in the
temperatures was due to an increased density of nucleation sites for the primary phase in the metal bulk,
attributed to the presence of TiB2 and TiAl3 particles [3, 8].
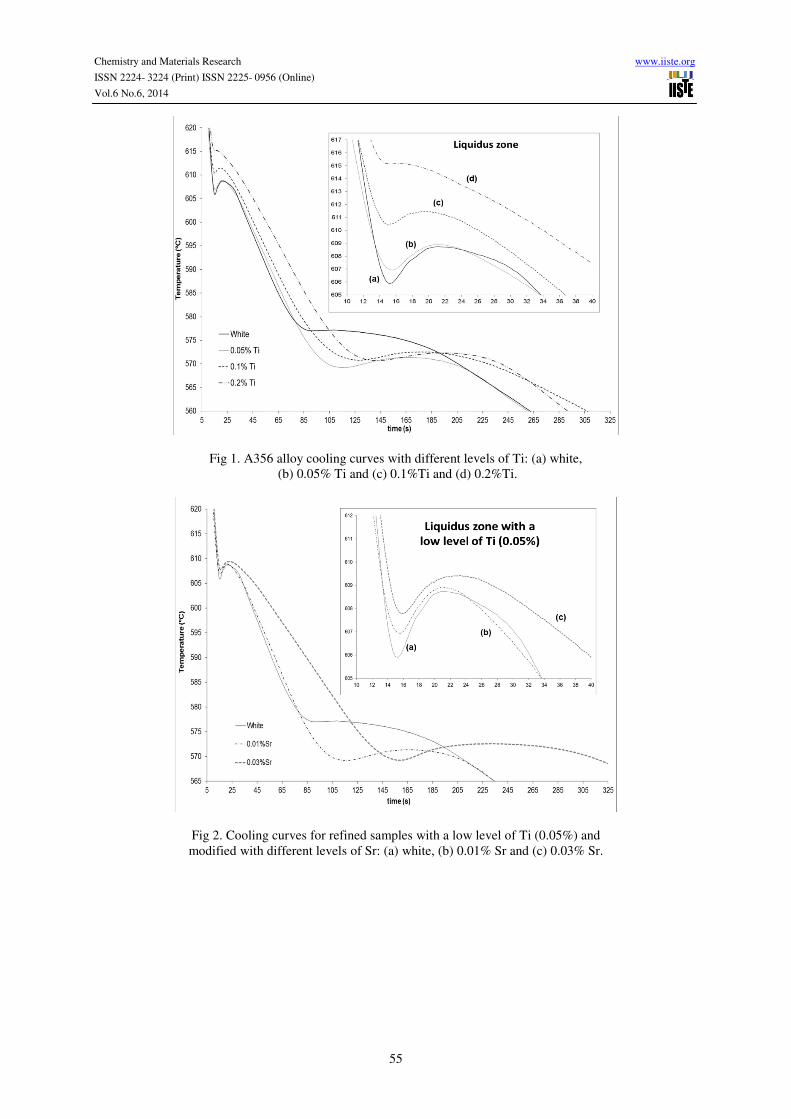
Figure 1 shows the liquidus undercooling. It is inversely proportional to the percentage of added Ti, because the
refining agent provided a great amount of heterogeneous nucleation sites, thus allowing the nucleation of plenty
of grains with minimal undercooling [6, 7]. This is the reason why, with Ti levels close to 0.2%, the ∆TL is
located between 0.11ºC and 0.55°C for both a low and high levels of added Sr, respectively, thus practically
eliminating the undercooling and obtaining very fine grain size macrostructures. Compared to that, with a low
level of Ti (close to 0.05%) and with the addition of 0.01% or 0.03% of Sr, the ∆TL is located between 1.62 and
1.98°C, and the samples have a grain size slightly smaller than the white sample’s.
For high levels of Ti, reduction of the undercooling time is observed with increased %Ti: the parameter
decreases its value to around 2 seconds. This behavior is explained again with the increased number of
heterogeneous nucleation sites, promoting a rapid formation of nuclei of primary phase [10, 13].
When the level of the refining agent added is kept constant, either at a high or a low level (0.05% or 0.2%,
respectively), and the percentage of Sr added varies (0.01% or 0.03%), the combined liquidus undercooling
effect of Ti and Sr is visible.
When using a quantity of Ti close to 0.05% together with low and high levels of Sr, as seen in Figure 2, the ∆TL
is located between 1.62ºC and 1.98°C respectively, and the grain size difference between these samples is barely
noticeable (from ASTM No. 6 to 7), which means a combined insignificant effect.
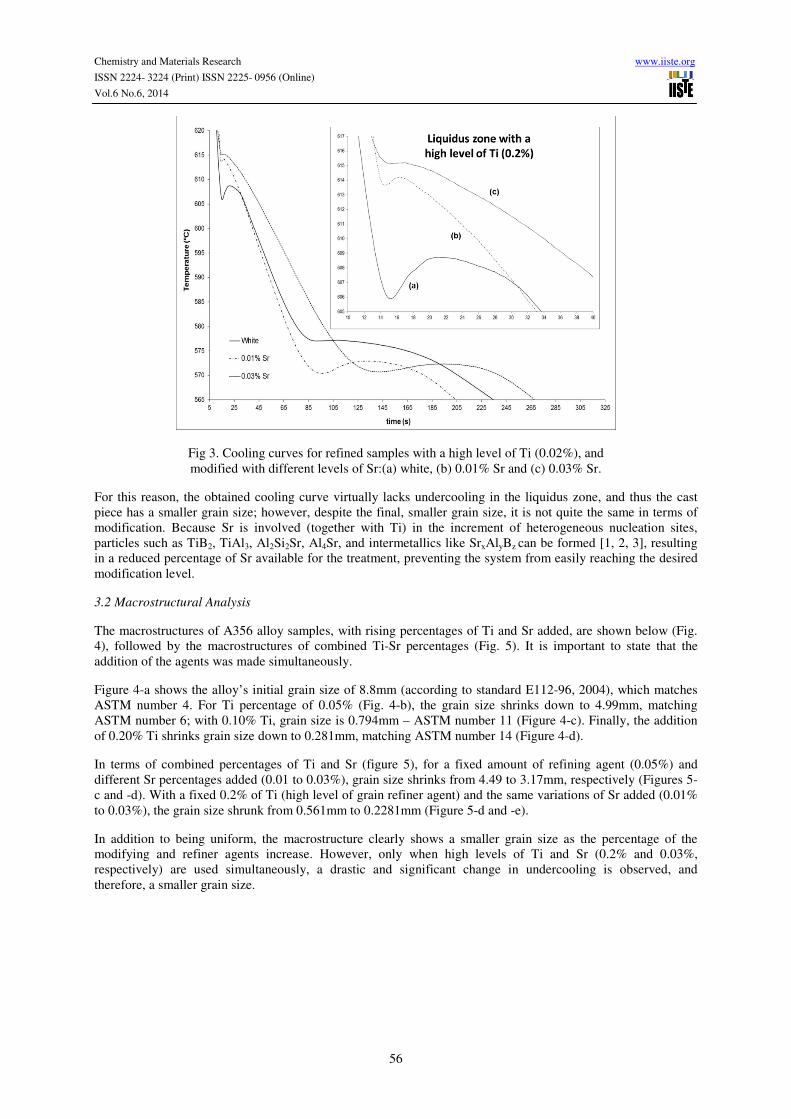
On the other hand, looking at Figure 3, it can be seen that with a high level of Ti (close to 0.2%), the value of
∆TL is reduced from 0.55°C (with 0.01% of Sr) to 0.11°C (with 0.03% of Sr), and grain size ranges from ASTM
No. 12 to 14.5, which represents a significant combined effect.
It should be noted that adding the combined highest levels of Ti and Sr favor a more significant grain-refining
effect because, according to literature reports [1, 3], Sr not only acts as a modifying agent, but it may also have
some potential for reducing grain size, which promotes and increases the quantity of primary nucleation sites [3,
9, 14].
Chemistry and Materials Research www.iiste.org
ISSN 2224- 3224 (Print) ISSN 2225- 0956 (Online)
Vol.6 No.6, 2014
55
Fig 1. A356 alloy cooling curves with different levels of Ti: (a) white,
(b) 0.05% Ti and (c) 0.1%Ti and (d) 0.2%Ti.
Fig 2. Cooling curves for refined samples with a low level of Ti (0.05%) and
modified with different levels of Sr: (a) white, (b) 0.01% Sr and (c) 0.03% Sr.
Chemistry and Materials Research www.iiste.org
ISSN 2224- 3224 (Print) ISSN 2225- 0956 (Online)
Vol.6 No.6, 2014
56
Fig 3. Cooling curves for refined samples with a high level of Ti (0.02%), and
modified with different levels of Sr:(a) white, (b) 0.01% Sr and (c) 0.03% Sr.
For this reason, the obtained cooling curve virtually lacks undercooling in the liquidus zone, and thus the cast
piece has a smaller grain size; however, despite the final, smaller grain size, it is not quite the same in terms of
modification. Because Sr is involved (together with Ti) in the increment of heterogeneous nucleation sites,
particles such as TiB2, TiAl3, Al2Si2Sr, Al4Sr, and intermetallics like SrxAlyBz can be formed [1, 2, 3], resulting
in a reduced percentage of Sr available for the treatment, preventing the system from easily reaching the desired
modification level.
3.2 Macrostructural Analysis
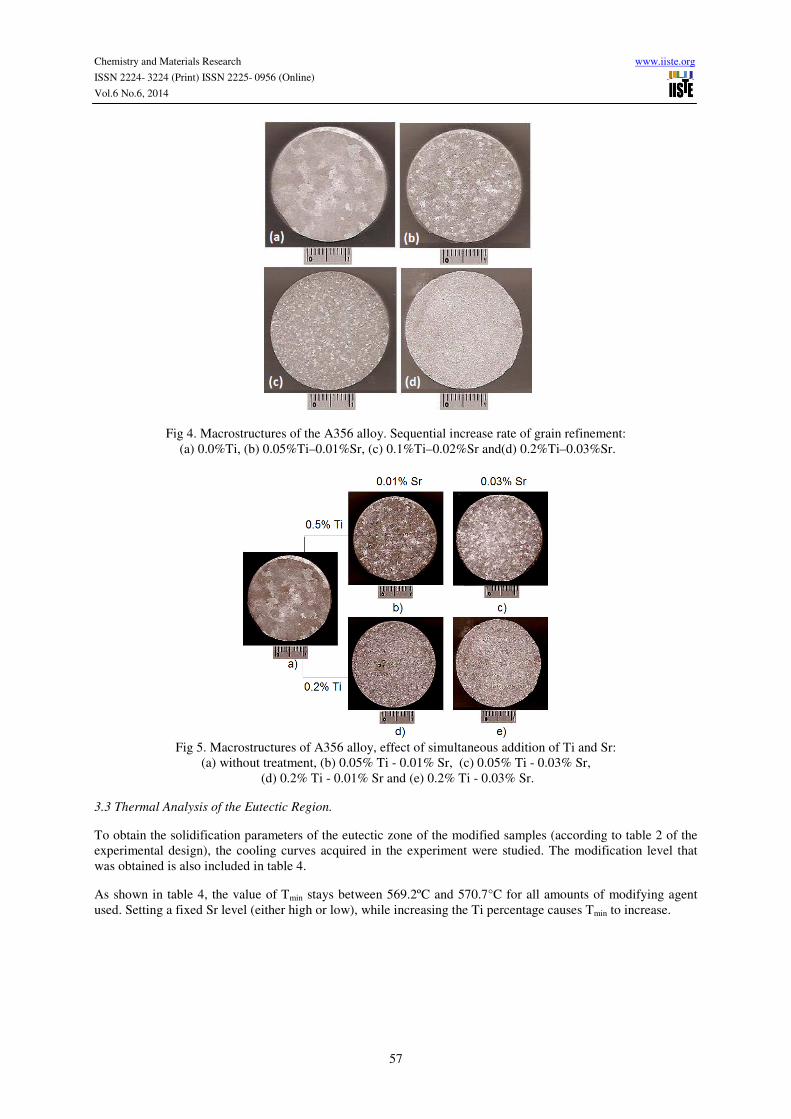
The macrostructures of A356 alloy samples, with rising percentages of Ti and Sr added, are shown below (Fig.
4), followed by the macrostructures of combined Ti-Sr percentages (Fig. 5). It is important to state that the
addition of the agents was made simultaneously.
Figure 4-a shows the alloy’s initial grain size of 8.8mm (according to standard E112-96, 2004), which matches
ASTM number 4. For Ti percentage of 0.05% (Fig. 4-b), the grain size shrinks down to 4.99mm, matching
ASTM number 6; with 0.10% Ti, grain size is 0.794mm – ASTM number 11 (Figure 4-c). Finally, the addition
of 0.20% Ti shrinks grain size down to 0.281mm, matching ASTM number 14 (Figure 4-d).
In terms of combined percentages of Ti and Sr (figure 5), for a fixed amount of refining agent (0.05%) and
different Sr percentages added (0.01 to 0.03%), grain size shrinks from 4.49 to 3.17mm, respectively (Figures 5-
c and -d). With a fixed 0.2% of Ti (high level of grain refiner agent) and the same variations of Sr added (0.01%
to 0.03%), the grain size shrunk from 0.561mm to 0.2281mm (Figure 5-d and -e).
In addition to being uniform, the macrostructure clearly shows a smaller grain size as the percentage of the
modifying and refiner agents increase. However, only when high levels of Ti and Sr (0.2% and 0.03%,
respectively) are used simultaneously, a drastic and significant change in undercooling is observed, and
therefore, a smaller grain size.
Chemistry and Materials Research www.iiste.org
ISSN 2224- 3224 (Print) ISSN 2225- 0956 (Online)
Vol.6 No.6, 2014
57
Fig 4. Macrostructures of the A356 alloy. Sequential increase rate of grain refinement:
(a) 0.0%Ti, (b) 0.05%Ti–0.01%Sr, (c) 0.1%Ti–0.02%Sr and(d) 0.2%Ti–0.03%Sr.
Fig 5. Macrostructures of A356 alloy, effect of simultaneous addition of Ti and Sr:
(a) without treatment, (b) 0.05% Ti - 0.01% Sr, (c) 0.05% Ti - 0.03% Sr,
(d) 0.2% Ti - 0.01% Sr and (e) 0.2% Ti - 0.03% Sr.
3.3 Thermal Analysis of the Eutectic Region.
To obtain the solidification parameters of the eutectic zone of the modified samples (according to table 2 of the
experimental design), the cooling curves acquired in the experiment were studied. The modification level that
was obtained is also included in table 4.
As shown in table 4, the value of Tmin stays between 569.2ºC and 570.7°C for all amounts of modifying agent
used. Setting a fixed Sr level (either high or low), while increasing the Ti percentage causes Tmin to increase.
Chemistry and Materials Research www.iiste.org
ISSN 2224- 3224 (Print) ISSN 2225- 0956 (Online)
Vol.6 No.6, 2014
58
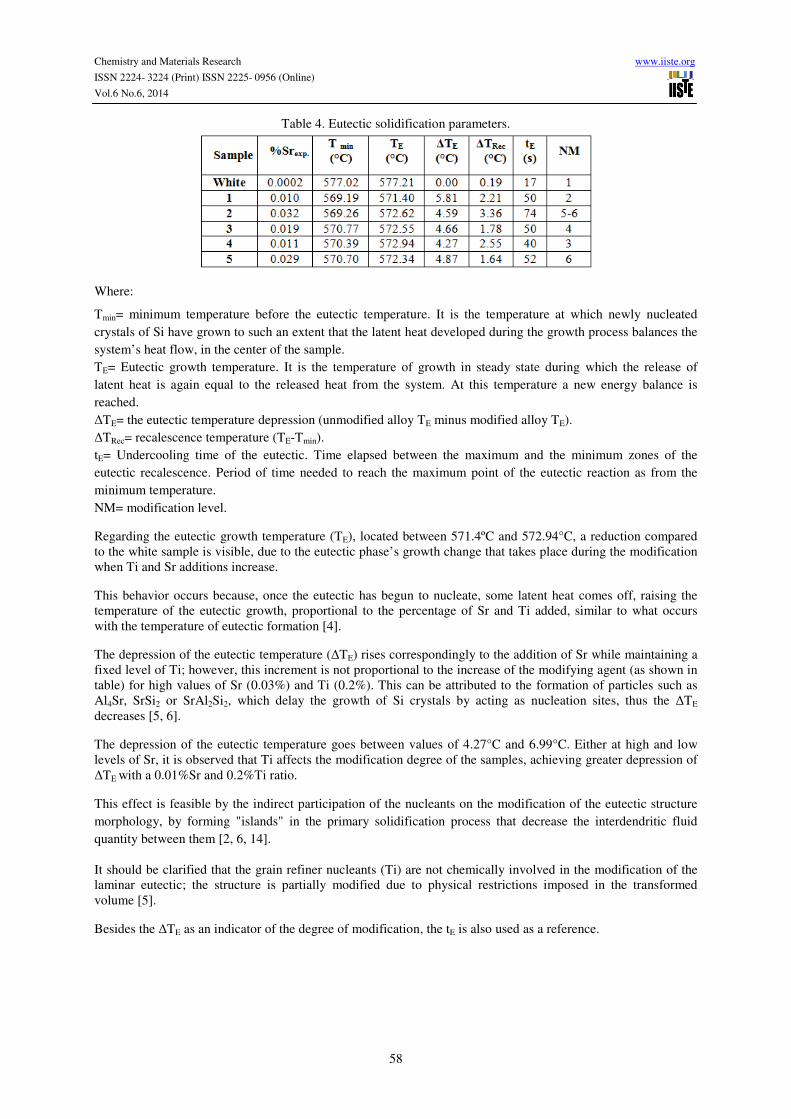
Table 4. Eutectic solidification parameters.
Where:
Tmin= minimum temperature before the eutectic temperature. It is the temperature at which newly nucleated
crystals of Si have grown to such an extent that the latent heat developed during the growth process balances the
system’s heat flow, in the center of the sample.
TE= Eutectic growth temperature. It is the temperature of growth in steady state during which the release of
latent heat is again equal to the released heat from the system. At this temperature a new energy balance is
reached.
∆TE= the eutectic temperature depression (unmodified alloy TE minus modified alloy TE).
∆TRec= recalescence temperature (TE-Tmin).
tE= Undercooling time of the eutectic. Time elapsed between the maximum and the minimum zones of the
eutectic recalescence. Period of time needed to reach the maximum point of the eutectic reaction as from the
minimum temperature.
NM= modification level.
Regarding the eutectic growth temperature (TE), located between 571.4ºC and 572.94°C, a reduction compared
to the white sample is visible, due to the eutectic phase’s growth change that takes place during the modification
when Ti and Sr additions increase.
This behavior occurs because, once the eutectic has begun to nucleate, some latent heat comes off, raising the
temperature of the eutectic growth, proportional to the percentage of Sr and Ti added, similar to what occurs
with the temperature of eutectic formation [4].
The depression of the eutectic temperature (∆TE) rises correspondingly to the addition of Sr while maintaining a
fixed level of Ti; however, this increment is not proportional to the increase of the modifying agent (as shown in
table) for high values of Sr (0.03%) and Ti (0.2%). This can be attributed to the formation of particles such as
Al4Sr, SrSi2 or SrAl2Si2, which delay the growth of Si crystals by acting as nucleation sites, thus the ∆TE
decreases [5, 6].
The depression of the eutectic temperature goes between values of 4.27°C and 6.99°C. Either at high and low
levels of Sr, it is observed that Ti affects the modification degree of the samples, achieving greater depression of
∆TE with a 0.01%Sr and 0.2%Ti ratio.
This effect is feasible by the indirect participation of the nucleants on the modification of the eutectic structure
morphology, by forming "islands" in the primary solidification process that decrease the interdendritic fluid
quantity between them [2, 6, 14].
It should be clarified that the grain refiner nucleants (Ti) are not chemically involved in the modification of the
laminar eutectic; the structure is partially modified due to physical restrictions imposed in the transformed
volume [5].
Besides the ∆TE as an indicator of the degree of modification, the tE is also used as a reference.
Chemistry and Materials Research www.iiste.org
ISSN 2224- 3224 (Print) ISSN 2225- 0956 (Online)
Vol.6 No.6, 2014
59
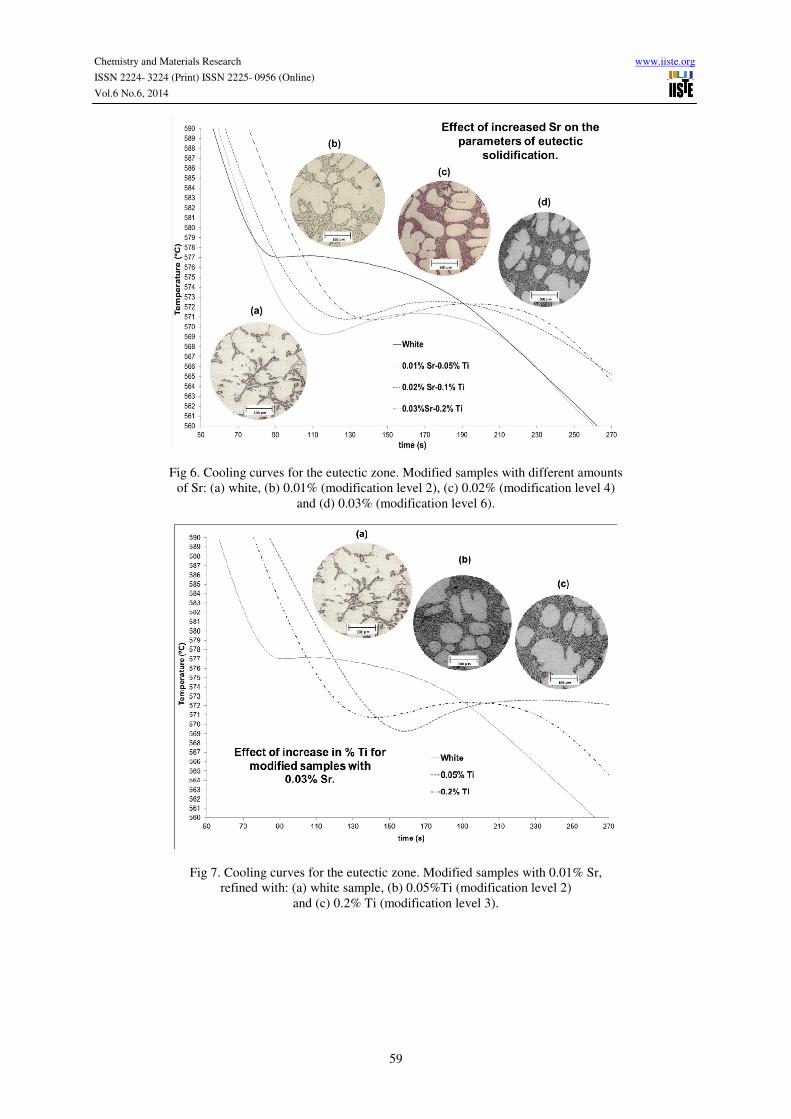
Fig 6. Cooling curves for the eutectic zone. Modified samples with different amounts
of Sr: (a) white, (b) 0.01% (modification level 2), (c) 0.02% (modification level 4)
and (d) 0.03% (modification level 6).
Fig 7. Cooling curves for the eutectic zone. Modified samples with 0.01% Sr,
refined with: (a) white sample, (b) 0.05%Ti (modification level 2)
and (c) 0.2% Ti (modification level 3).
Chemistry and Materials Research www.iiste.org
ISSN 2224- 3224 (Print) ISSN 2225- 0956 (Online)
Vol.6 No.6, 2014
60
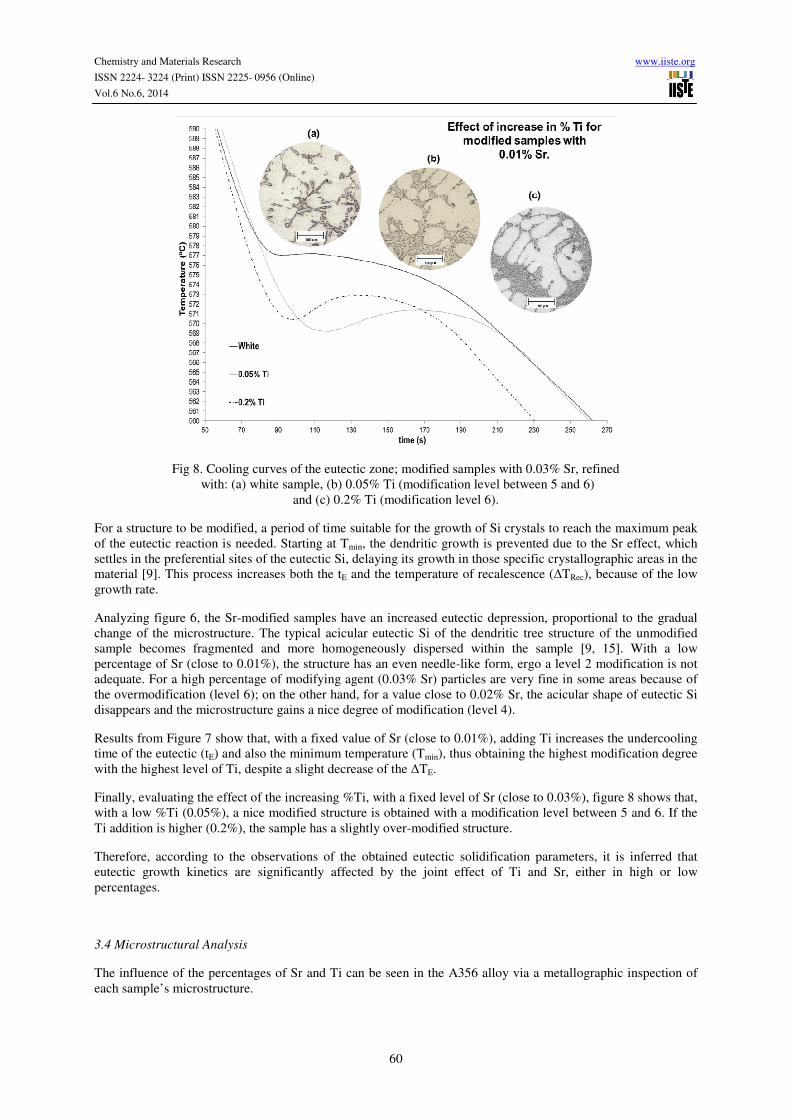
Fig 8. Cooling curves of the eutectic zone; modified samples with 0.03% Sr, refined
with: (a) white sample, (b) 0.05% Ti (modification level between 5 and 6)
and (c) 0.2% Ti (modification level 6).
For a structure to be modified, a period of time suitable for the growth of Si crystals to reach the maximum peak
of the eutectic reaction is needed. Starting at Tmin, the dendritic growth is prevented due to the Sr effect, which
settles in the preferential sites of the eutectic Si, delaying its growth in those specific crystallographic areas in the
material [9]. This process increases both the tE and the temperature of recalescence (∆TRec), because of the low
growth rate.
Analyzing figure 6, the Sr-modified samples have an increased eutectic depression, proportional to the gradual
change of the microstructure. The typical acicular eutectic Si of the dendritic tree structure of the unmodified
sample becomes fragmented and more homogeneously dispersed within the sample [9, 15]. With a low
percentage of Sr (close to 0.01%), the structure has an even needle-like form, ergo a level 2 modification is not
adequate. For a high percentage of modifying agent (0.03% Sr) particles are very fine in some areas because of
the overmodification (level 6); on the other hand, for a value close to 0.02% Sr, the acicular shape of eutectic Si
disappears and the microstructure gains a nice degree of modification (level 4).
Results from Figure 7 show that, with a fixed value of Sr (close to 0.01%), adding Ti increases the undercooling
time of the eutectic (tE) and also the minimum temperature (Tmin), thus obtaining the highest modification degree
with the highest level of Ti, despite a slight decrease of the ∆TE.
Finally, evaluating the effect of the increasing %Ti, with a fixed level of Sr (close to 0.03%), figure 8 shows that,
with a low %Ti (0.05%), a nice modified structure is obtained with a modification level between 5 and 6. If the
Ti addition is higher (0.2%), the sample has a slightly over-modified structure.
Therefore, according to the observations of the obtained eutectic solidification parameters, it is inferred that
eutectic growth kinetics are significantly affected by the joint effect of Ti and Sr, either in high or low
percentages.
3.4 Microstructural Analysis
The influence of the percentages of Sr and Ti can be seen in the A356 alloy via a metallographic inspection of
each sample’s microstructure.
Chemistry and Materials Research www.iiste.org
ISSN 2224- 3224 (Print) ISSN 2225- 0956 (Online)
Vol.6 No.6, 2014
61
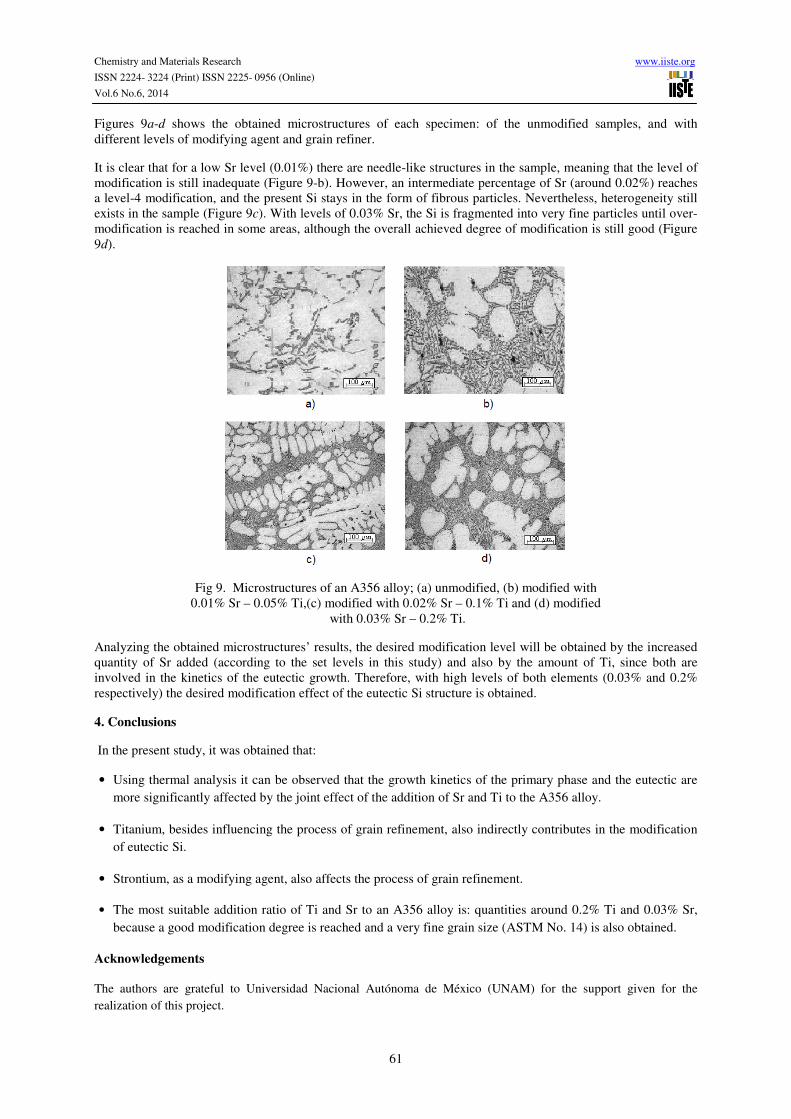
Figures 9a-d shows the obtained microstructures of each specimen: of the unmodified samples, and with
different levels of modifying agent and grain refiner.
It is clear that for a low Sr level (0.01%) there are needle-like structures in the sample, meaning that the level of
modification is still inadequate (Figure 9-b). However, an intermediate percentage of Sr (around 0.02%) reaches
a level-4 modification, and the present Si stays in the form of fibrous particles. Nevertheless, heterogeneity still
exists in the sample (Figure 9c). With levels of 0.03% Sr, the Si is fragmented into very fine particles until over-
modification is reached in some areas, although the overall achieved degree of modification is still good (Figure
9d).
Fig 9. Microstructures of an A356 alloy; (a) unmodified, (b) modified with
0.01% Sr – 0.05% Ti,(c) modified with 0.02% Sr – 0.1% Ti and (d) modified
with 0.03% Sr – 0.2% Ti.
Analyzing the obtained microstructures’ results, the desired modification level will be obtained by the increased
quantity of Sr added (according to the set levels in this study) and also by the amount of Ti, since both are
involved in the kinetics of the eutectic growth. Therefore, with high levels of both elements (0.03% and 0.2%
respectively) the desired modification effect of the eutectic Si structure is obtained.
4. Conclusions
In the present study, it was obtained that:
• Using thermal analysis it can be observed that the growth kinetics of the primary phase and the eutectic are
more significantly affected by the joint effect of the addition of Sr and Ti to the A356 alloy.
• Titanium, besides influencing the process of grain refinement, also indirectly contributes in the modification
of eutectic Si.
• Strontium, as a modifying agent, also affects the process of grain refinement.
• The most suitable addition ratio of Ti and Sr to an A356 alloy is: quantities around 0.2% Ti and 0.03% Sr,
because a good modification degree is reached and a very fine grain size (ASTM No. 14) is also obtained.
Acknowledgements
The authors are grateful to Universidad Nacional Autónoma de México (UNAM) for the support given for the
realization of this project.
Chemistry and Materials Research www.iiste.org
ISSN 2224- 3224 (Print) ISSN 2225- 0956 (Online)
Vol.6 No.6, 2014
62
A special mention to Alejandro Medina and Edgar Olvera for your technical collaboration in this work.
References
C. Yen, W. Evans and R. Nowicki (1997),”Measuring the Quality of Aluminium Casting Alloys with Microprocessor-aided
Thermal Analysis”, Casting Congress AFS 101.
A. Amaro, D. Yamamoto and A. Garcia (1993), “Modification and Refinement Treatment in Cast Al-Si/SiC Particle
Composites, Proceedings of the 2nd International Conference on Cast Metal Matrix Composites, 4-6.
B. T. Dunville, D. K. Young and G. W. Boone (1994), “A New Combination Grain Refiner/Modifier for Hypoeutectic Al-Si
Foundry Alloys”, Light Metals, (Ed.) U. Mannweiler, The Minerals, Metals and Materials Society, 1065-1073.
L. Lu, K. Nogita and A. Dahle (2005), “Combining Sr and Na Additions in Hypoeutectic Al-Si Foundry Alloys”, Materials
Science Engineering A 399, 244-253.
J. García, J. Juárez and M. Surappa (2004), “Effect of Grain Refinement Treatment on the Microstructure of Cast Al-7Si-
SiCp Composites”, Materials Science and Engineering A 386, 54-60.
D. Apelian and G. Sigworth (1984), “Assessment of Grain Refinement and Modification of Al-Si Foundry Alloys by
Thermal Analysis”, AFS Transactions 161.
M. M. Hariedy, A. Niazi and A. A. Nofal (1996), “Thermal Analysis of Aluminium Alloys as a Tool to Evaluate the Grain
Refiners Efficiency”, Light Metals, (Ed.) Wayne Hale, The Minerals, Metals and Materials Society, 697-706.
M. Johnsson (1992), “On the Mechanism of Grain Refinement of Aluminium after Additions of Ti and B, Light Metals”,
(Ed.) K. D. Subodh, The Minerals, Metals and Materials Society, 769-777.
D. Kanicki (1990), “Processing Molten Aluminum- Part 1: Understanding Silicon Modification”, The 2nd AFS International
Conference on Molten Aluminum Processing.
S. A. Levy (1990), “Monitoring Grain Refiner Performance Using Thermal Analysis”, Light Metals, (Ed.) C. M. Bickert, The
Minerals, Metals and Materials Society, 831-836.
X. Chen and F. Klinkenberg (1997), “Efficiency of Impeller Degassing and Regassing Phenomena in Aluminium Melts”,
Casting Congress AFS 101.
Standard Test Methods for Determining Average Grain Size (2004), ASTM E 112-96.
D. StJohn and M. Easton (1999), “Solidification of Hypoeutectic Aluminum-Silicon Alloys”, Materials Forum 23, 137-152.
D. Apelian and J. Cheng (1986), “Al-Si Processing Variables: Effect on Grain Refinement and Eutectic Modification”, AFS
Transactions 147.
G. Chai and Bächerud (1992), “Factors Affecting Modification of Al-Si Alloys by Adding Sr-Containing Master Alloys”,
AFS Transactions 194.
The IISTE is a pioneer in the Open-Access hosting service and academic event
management. The aim of the firm is Accelerating Global Knowledge Sharing.
More information about the firm can be found on the homepage:
http://www.iiste.org
CALL FOR JOURNAL PAPERS
There are more than 30 peer-reviewed academic journals hosted under the hosting
platform.
Prospective authors of journals can find the submission instruction on the
following page: http://www.iiste.org/journals/ All the journals articles are available
online to the readers all over the world without financial, legal, or technical barriers
other than those inseparable from gaining access to the internet itself. Paper version
of the journals is also available upon request of readers and authors.
MORE RESOURCES
Book publication information: http://www.iiste.org/book/
IISTE Knowledge Sharing Partners
EBSCO, Index Copernicus, Ulrich's Periodicals Directory, JournalTOCS, PKP Open
Archives Harvester, Bielefeld Academic Search Engine, Elektronische
Zeitschriftenbibliothek EZB, Open J-Gate, OCLC WorldCat, Universe Digtial
Library , NewJour, Google Scholar