Therese Leinonen - Over ons | Rijksuniversiteit … · Therese Leinonen Seminar in ......
16
Principal Component Analysis and Factor Analysis Therese Leinonen Seminar in Statistics and Methodology, 25th February, 2009
Transcript of Therese Leinonen - Over ons | Rijksuniversiteit … · Therese Leinonen Seminar in ......
Principal Component Analysis and Factor Analysis
Therese Leinonen
Seminar in Statistics and Methodology, 25th February, 2009
– Typeset by FoilTEX – 1
Overview
• Introduction
• Basic mathematics behind PCA and FA
• Background: on acoustic measures for vowel quality
• Example: PCA on Bark filtered vowel spectra
• PCA vs. FA
– Typeset by FoilTEX – 2
Introduction
• factor analysis (FA) and principal component analysis (PCA) are data reduc-tion methods
• by analyzing the correlation between variables in a data set the variables canbe reduced to a smaller amount of factors (FA) or principal components(PCA)
• both methods give a set of loadings an a set of scores
• loadings are correlations between original variables and extractedfactors/components
• scores are values each data item gets on the extracted factors/componentsafter data reduction
– Typeset by FoilTEX – 3
Basic mathematics behind PCA and FA
• starting point: a correlation matrix or a variance-covariance matrix
• by determining the eigenvalues and eigenvectors of the matrix variables thatcorrelate highly can be clustered together on components(/factors)
• the eigenvectors (=loadings) are ordered by eigenvalue, highest to lowest,which gives the components in order of significance
• by choosing the most significant components the eigenvectors of these canbe used to derive the scores (=reduced data set) for each subject
• the interpretability of the solutions can be enhanced by different rotationtechniques
– Typeset by FoilTEX – 4
Background: on acoustic measures for vowel quality
• measuring formant frequencies is the traditional way of analyzing vowel qual-ity acoustically
• formants = peaks in vowel spectra resulting from resonance in the vocal tract
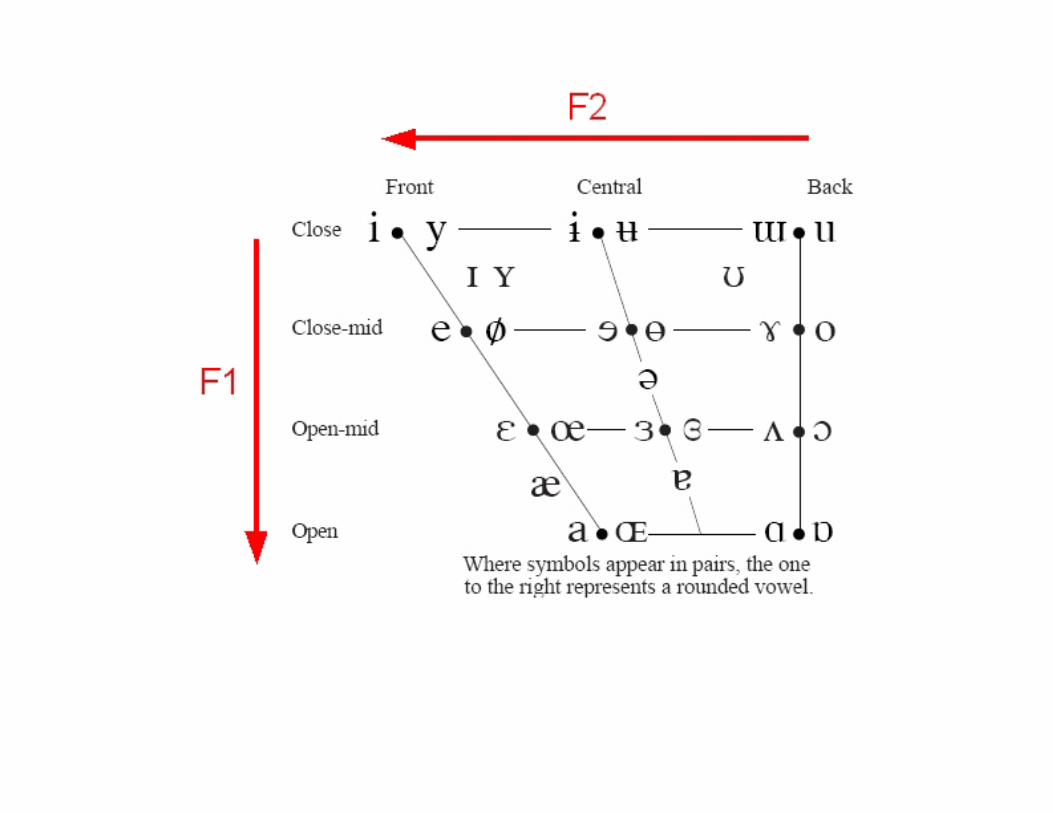
• the first two formants (F1 and F2), corresponding well with vowel height andbackness, are usually enough to distinguish vowels from each other
• problem with formant measurements: automatic detection of peaks in thespectrum not reliable
– Typeset by FoilTEX – 5
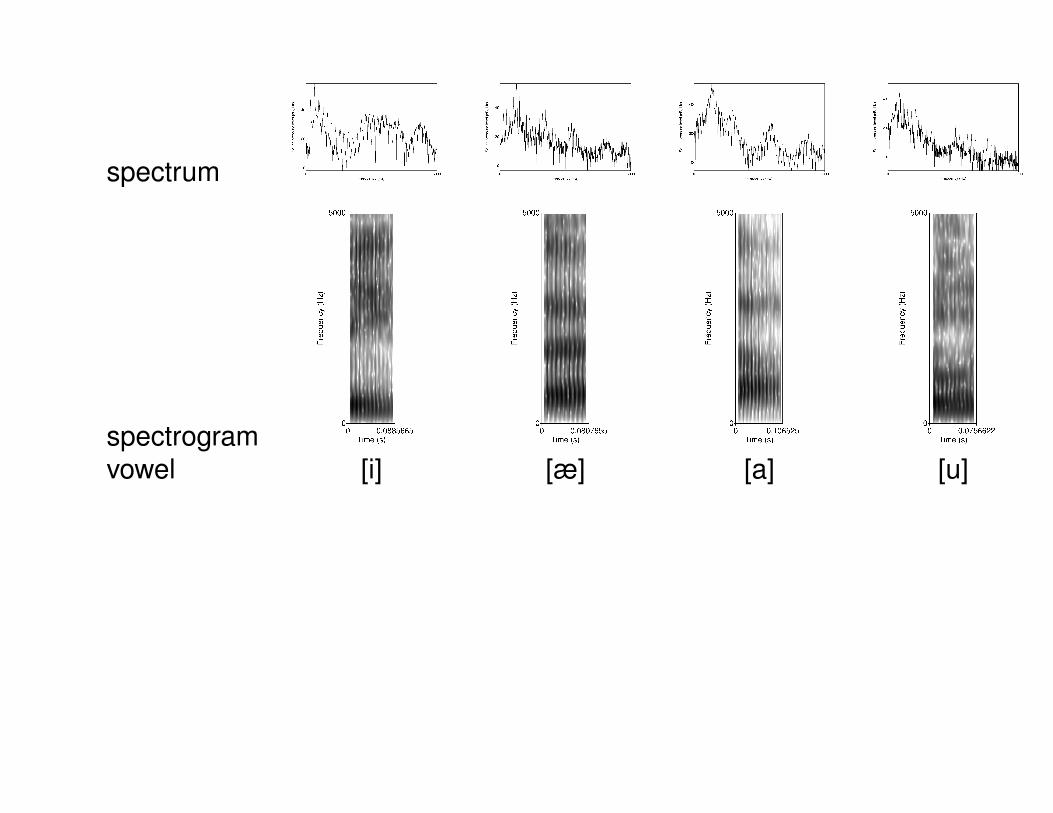
spectrum
spectrogramvowel [i] [æ] [a] [u]
– Typeset by FoilTEX – 6
– Typeset by FoilTEX – 7
Example: PCA on Bark filtered vowel spectra
• method introduced by Pols, Tromp and Plomp (1973), recently applied foranalyzing sub-phonemic variation in Dutch vowels by Jacobi (2008)
• alternative to formant measurements, can be fully automated
• vowel spectra filtered up to 17 Bark with every filter covering 1 Bark, meanintensity (dB) per filter band measured for each vowel pronunciation => everypronunciation is described by 17 variables
• since we know that vowel quality can generally be described with much fewervariables (2?) we use PCA for data reduction
– Typeset by FoilTEX – 8
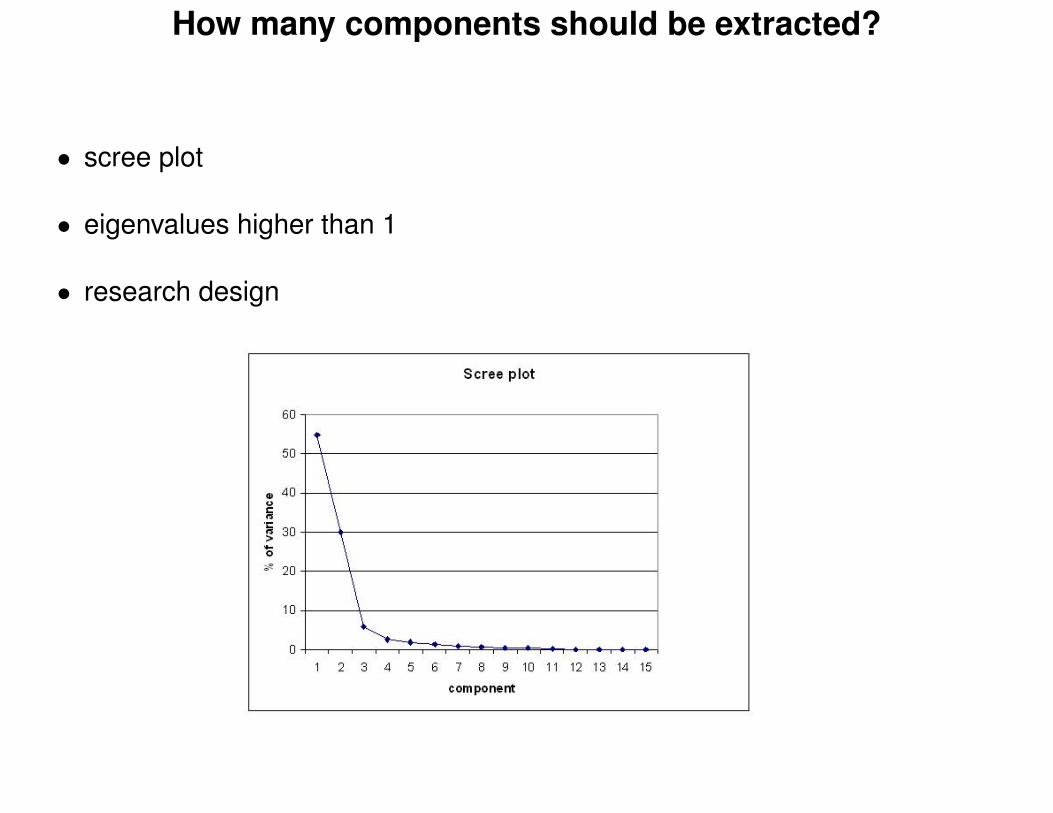
How many components should be extracted?
• scree plot
• eigenvalues higher than 1
• research design
– Typeset by FoilTEX – 9
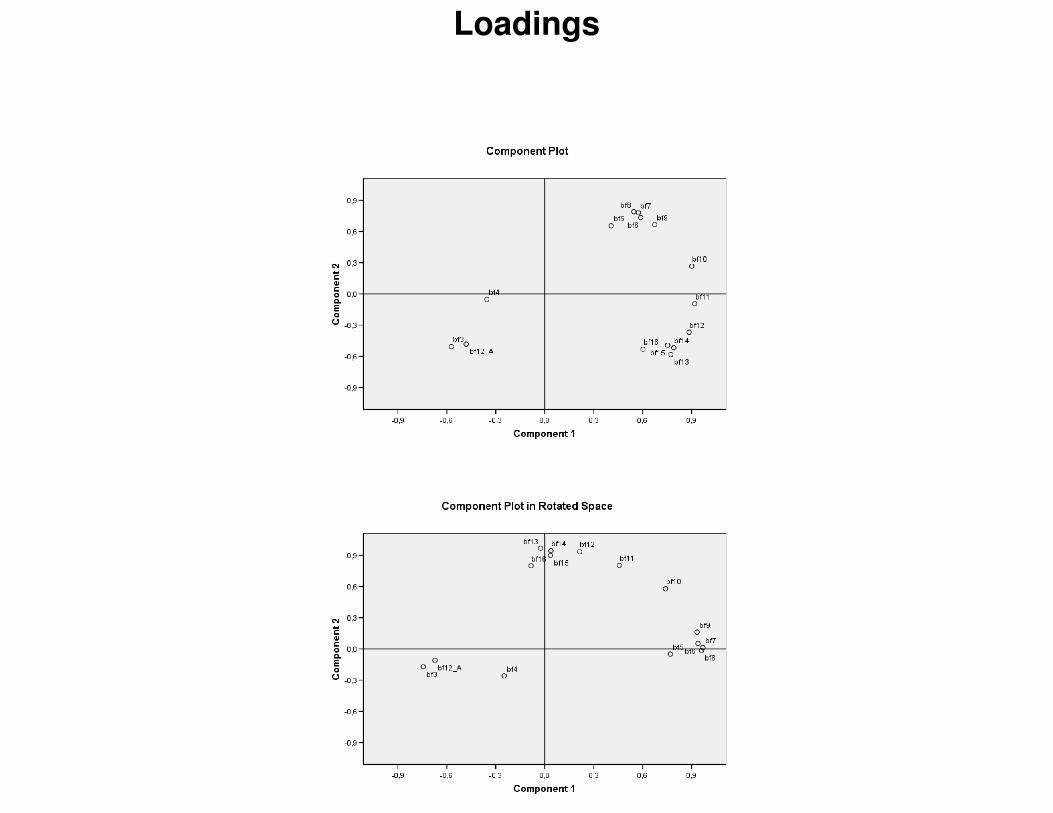
Loadings
– Typeset by FoilTEX – 10
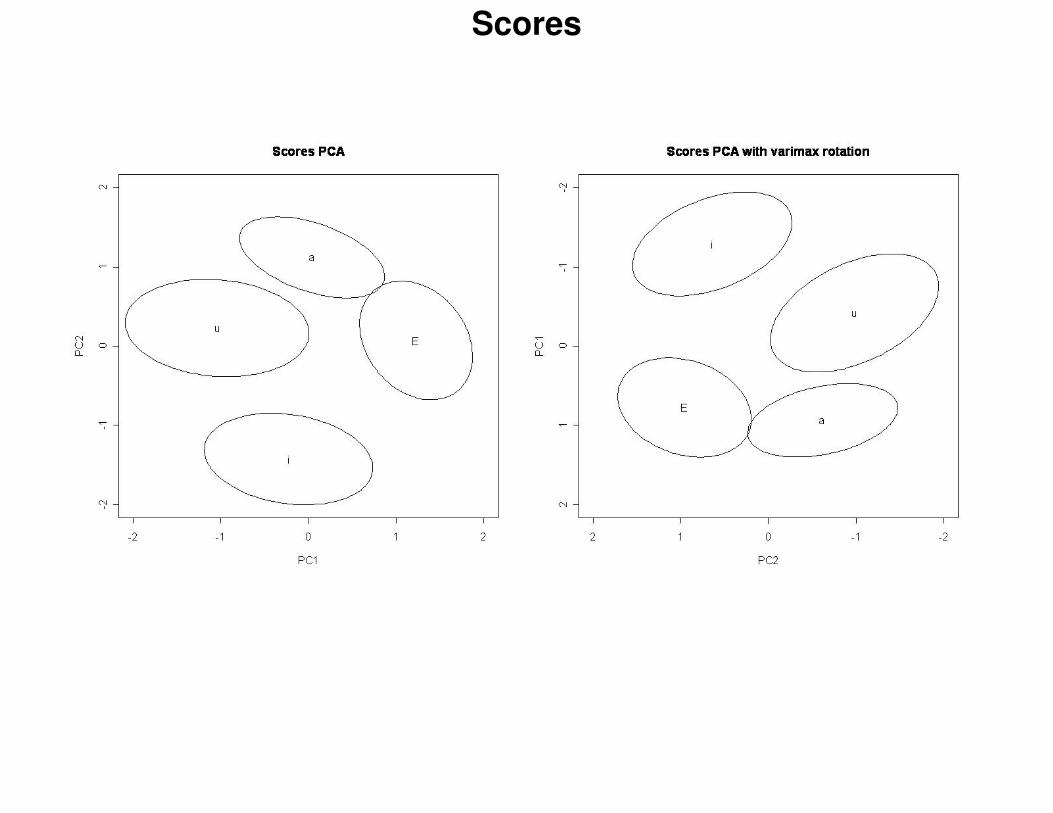
Scores
– Typeset by FoilTEX – 11
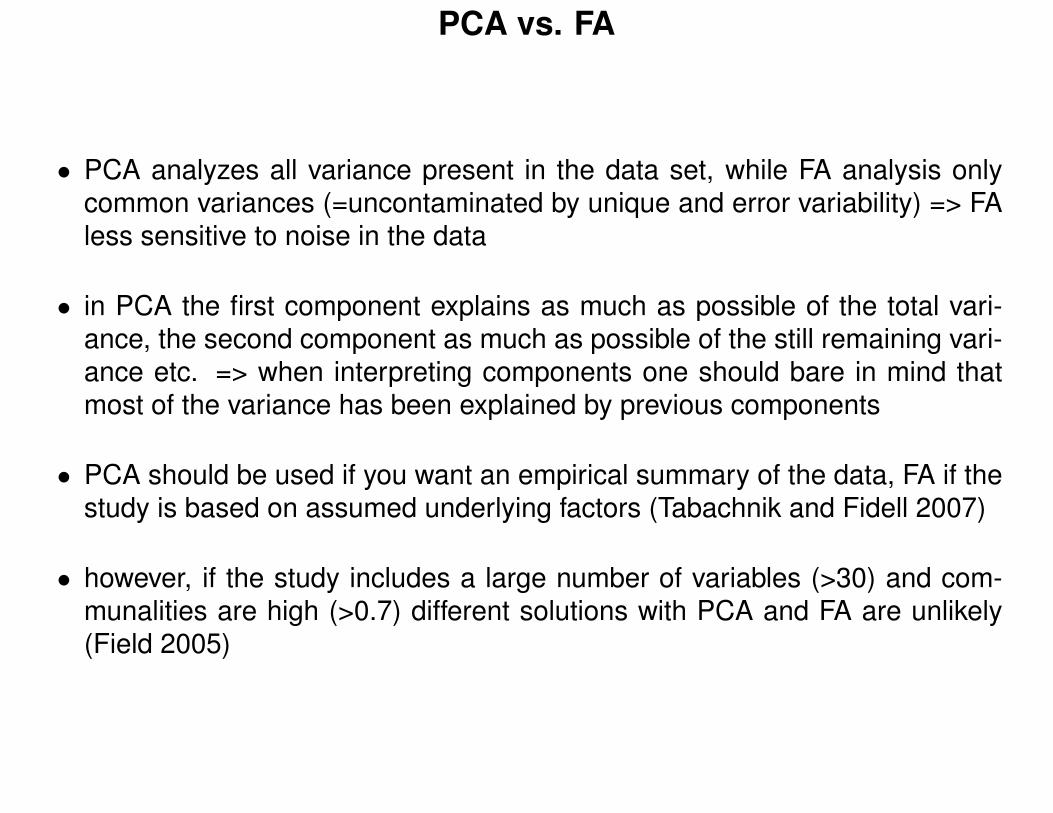
PCA vs. FA
• PCA analyzes all variance present in the data set, while FA analysis onlycommon variances (=uncontaminated by unique and error variability) => FAless sensitive to noise in the data
• in PCA the first component explains as much as possible of the total vari-ance, the second component as much as possible of the still remaining vari-ance etc. => when interpreting components one should bare in mind thatmost of the variance has been explained by previous components
• PCA should be used if you want an empirical summary of the data, FA if thestudy is based on assumed underlying factors (Tabachnik and Fidell 2007)
• however, if the study includes a large number of variables (>30) and com-munalities are high (>0.7) different solutions with PCA and FA are unlikely(Field 2005)
– Typeset by FoilTEX – 12
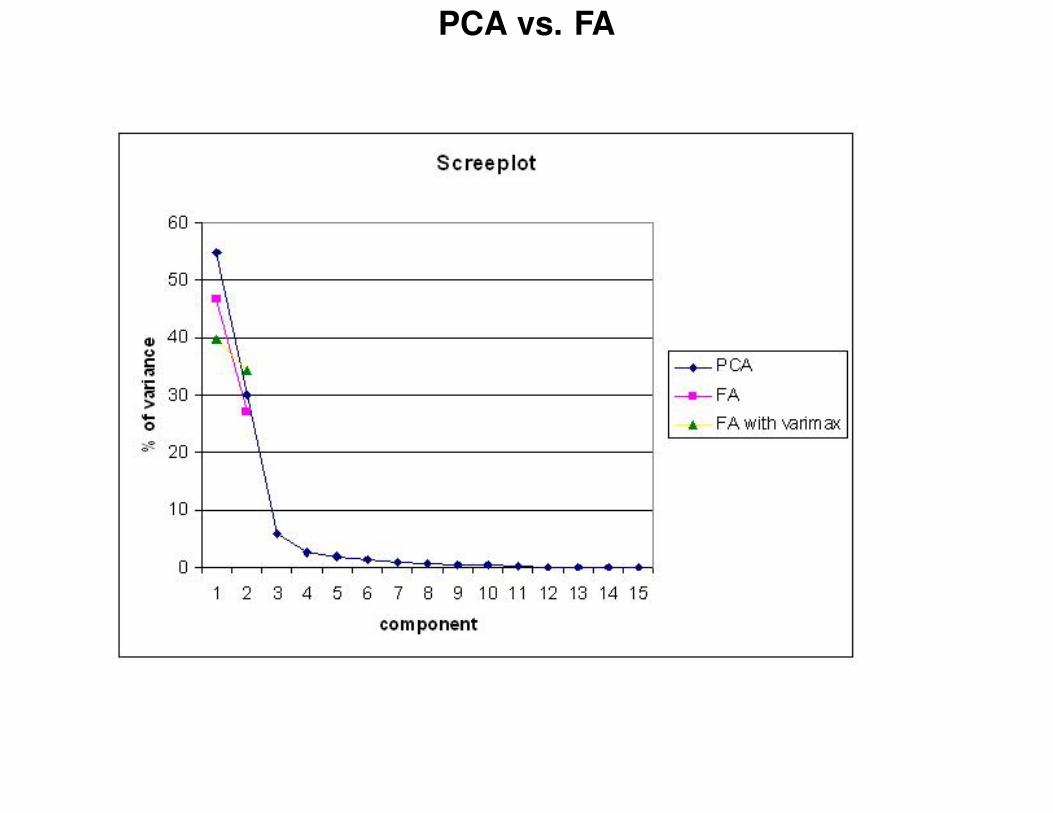
PCA vs. FA
– Typeset by FoilTEX – 13
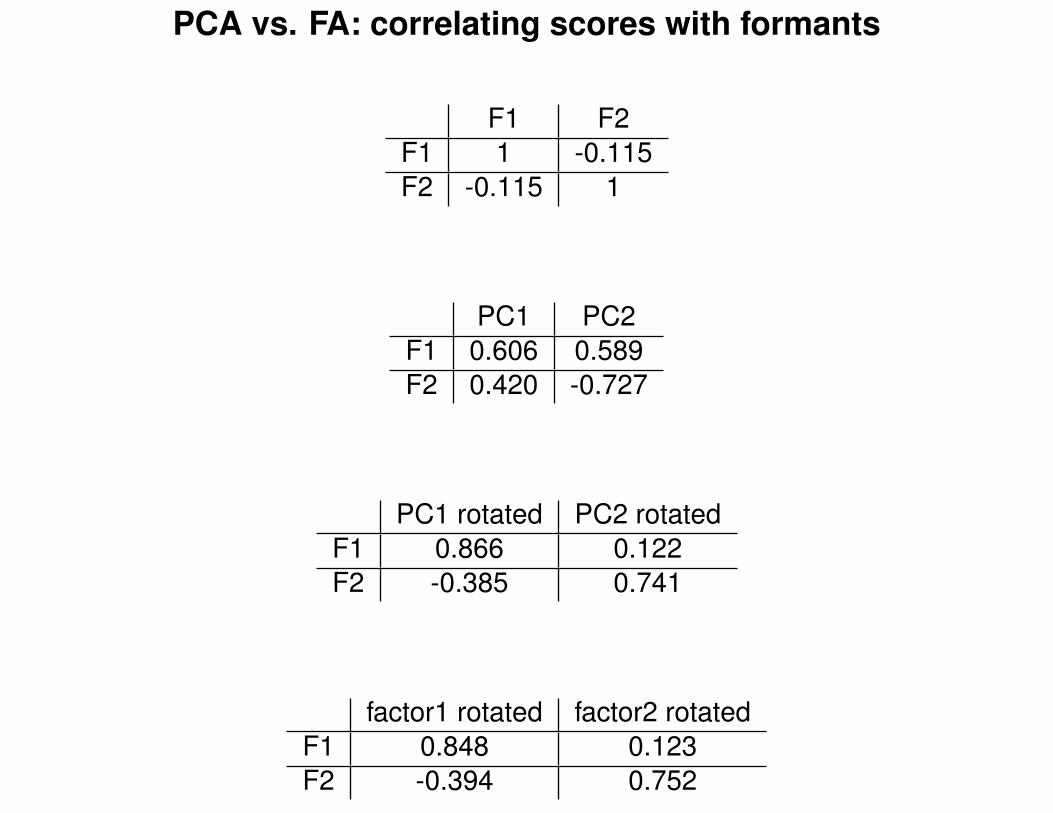
PCA vs. FA: correlating scores with formants
F1 F2F1 1 -0.115F2 -0.115 1
PC1 PC2F1 0.606 0.589F2 0.420 -0.727
PC1 rotated PC2 rotatedF1 0.866 0.122F2 -0.385 0.741
factor1 rotated factor2 rotatedF1 0.848 0.123F2 -0.394 0.752
– Typeset by FoilTEX – 14
How can we use the results of a PCA or FA?
1. interpret the loadings and scores of the analysis as such
2. use the results in subsequent analyses (MANOVA, multiple regression etc.)
– Typeset by FoilTEX – 15
References
Field, A.(2005), Discovering Statistics Using SPSS, 2nd edn, SAGE, London.Jacobi, I.(2008), On Variation and Change in Diphthongs and Long Vowels of Spoken Dutch,
PhD thesis, Universiteit van Amsterdam.Pols, L. C. W., Tromp, H. R. C. and Plomp, R.(1973), Frequency analysis of Dutch vowels from
50 male speakers, Journal of the Acoustical Society of America 53, 1093–1101.Tabachnik, B. G. and Fidell, L. S.(2007), Using Mulitvariate Statistics, 5th edn, Pearson.
– Typeset by FoilTEX – 16