Therapeutic Drug Monitoring of Immunosuppresive
213
University of Rhode Island University of Rhode Island DigitalCommons@URI DigitalCommons@URI Open Access Dissertations 2015 Therapeutic Drug Monitoring of Immunosuppresive Therapeutic Drug Monitoring of Immunosuppresive Mwlod A. Ghareeb University of Rhode Island, [email protected] Follow this and additional works at: https://digitalcommons.uri.edu/oa_diss Recommended Citation Recommended Citation Ghareeb, Mwlod A., "Therapeutic Drug Monitoring of Immunosuppresive" (2015). Open Access Dissertations. Paper 367. https://digitalcommons.uri.edu/oa_diss/367 This Dissertation is brought to you for free and open access by DigitalCommons@URI. It has been accepted for inclusion in Open Access Dissertations by an authorized administrator of DigitalCommons@URI. For more information, please contact [email protected].
Transcript of Therapeutic Drug Monitoring of Immunosuppresive
University of Rhode Island University of Rhode Island
DigitalCommons@URI DigitalCommons@URI
Open Access Dissertations
2015
Therapeutic Drug Monitoring of Immunosuppresive Therapeutic Drug Monitoring of Immunosuppresive
Mwlod A. Ghareeb University of Rhode Island, [email protected]
Follow this and additional works at: https://digitalcommons.uri.edu/oa_diss
Recommended Citation Recommended Citation Ghareeb, Mwlod A., "Therapeutic Drug Monitoring of Immunosuppresive" (2015). Open Access Dissertations. Paper 367. https://digitalcommons.uri.edu/oa_diss/367
This Dissertation is brought to you for free and open access by DigitalCommons@URI. It has been accepted for inclusion in Open Access Dissertations by an authorized administrator of DigitalCommons@URI. For more information, please contact [email protected].
THERAPEUTIC DRUG MONITORING OF IMMUNOSUPPRESSIVE
BY
MWLOD A. GHAREEB
A DISSERTATION SUBMITTED IN PARTIAL FULFILLMENT OF THE REQUIREMENTS FOR THE DEGREE OF
DOCTOR OF PHILOSOPHY IN
BIOMEDICAL AND PHARMACEUTICAL SCIENCES
UNIVERSITY OF RHODE ISLAND 2015
DOCTOR OF PHILOSOPHY DISSERTATION
OF
MWLOD A. GHAREEB
APPROVED:
Thesis Committee:
Major Professor Fatemeh Akhlaghi
Sara Rosenbaum
Liliana Gonzalez
Nasser H. Zawia
DEAN OF THE GRADUATE SCHOOL
UNIVERSITY OF RHODE ISLAND 2015
ABSTRACT
The immunosuppressive agents used to prevent rejection of transplanted organs
include cyclosporine (CsA), everolimus (EVE), mycophenolic acid (MPA),
prednisolone (PLN), sirolimus (SIR) and tacrolimus (TAC). Because of the narrow
therapeutic index and high inter- and intra-subject variability of these agents,
therapeutic drug monitoring (TDM) is an integral part of immunosuppressive therapy
following organ transplantation. The immunosuppressants incidence and severity of
side effects correlate with the degree of exposure while under-dosed patients can be at
a greater risk for allograft rejection. Currently, whole blood or plasma samples that
are obtained via venipuncture are used for routine immunosuppressive monitoring.
The limitations of venipuncture blood samples include (i) invasive nature associated
with the sample collection and (ii) weak correlation with the drug concentration at the
site of action. This thesis is consisted of the following sections written in a manuscript
format.
Manuscript I provides a comprehensive review of literature published on alternative
techniques that are proposed to overcome the limitation of venipuncture sampling.
These methods include the use of non-conventional techniques, namely, drug
monitoring in oral fluids or blood samples obtained from fingertip as well as drug
concentration measurement in lymphocytes or transplanted tissue.
Drug concentration measurement in lymphocytes or transplanted tissue is primarily
aimed at obtaining information on drug level at the site of action thus to facilitate
prediction of clinical outcomes. However, these approaches are impractical in clinical
setting because of the invasive nature of sampling as well as complicated sample
preparation procedures.
The objective of finger prick sampling is to mitigate the discomfort and difficulties
associated with venipuncture, especially in pediatrics and frail patients. In this
approach, the fingertip blood samples are either applied onto a filter paper (dried
blood spots) or are processed as a liquid. It has been reported that fingertip sampling
was preferred to venipuncture by both patients and healthcare providers. Nevertheless,
the main disadvantages of venipuncture whole blood sampling, which is the poor
correlation with concentration at the site of action, still exist.
Finally, oral fluid sampling is a promising non-invasive method of therapeutic
monitoring of immunosuppressive agents. Advances in analytical techniques have
enabled measuring drug concentration in minute amount of sample. Drug
concentration in oral fluids represents the free fraction which should theoretically
represent drug concentration at the site of action.
Few comprehensive studies investigated the use of oral fluids as a medium for
therapeutic drug monitoring. Therefore, this dissertation is focused on the
development of sensitive and robust liquid chromatography tandem mass spectrometry
methods for quantification of the most commonly used immunosuppressant agents,
tacrolimus and mycophenolic acid. The methods are then used to quantify these
agents in oral fluids samples collected from kidney transplant recipients.
Manuscript II describes, in details, the development and validation of a liquid
chromatography tandem mass spectrometry (LC-MS/MS) method for quantification of
tacrolimus in oral fluids. This method was validated in accordance with the current
Food and Drug Administration (FDA) guideline. The Lower Limit of Quantification
of this method is 30 pg/mL that is adequate for measuring tacrolimus concentration in
oral fluid samples from transplant recipients. Full separation between tacrolimus and
plasma phospholipids components was achieved in very short run time of 2.2 min.
Very simple sample predations procedure was followed by extraction 50 µL of oral
fluids with 100µL of acetonitrile.
Manuscript III in this manuscript, the method presented in manuscript II to quantify
tacrolimus in oral fluids. It focused on investigating factors that may affect tacrolimus
measurement in oral fluid, namely, sampling condition (resting, after mouth rinsing,
and after give a saliva stimulant), sampling time, and blood contamination expressed
as salivary transferrin level. The correlation between tacrolimus concentration in
blood and oral fluids was investigated under these conditions. Correlation analysis
revealed that samples collected after mouth rinse and at fasting provided better
correlation in tacrolimus concentrations in blood and oral fluid.
Manuscript IV: Liquid chromatography tandem mass spectrometry methods was
developed and validated according to current FDA Guidelines to quantify
mycophenolic acid and its glucuronide metabolites in oral fluids, total concentration in
plasma, and unbound fraction in plasma. Full separation of mycophenolic acid,
metabolites, and plasma phospholipids was achieved within the total run time of 2.8
min.
Manuscript V: The assay described in manuscript IV was used to quantify
mycophenolic acid and glucuronide metabolites in oral fluids. The aim was to
investigate factors that may affect mycophenolic acid and glucuronide metabolites
concentration in oral fluid, namely, sampling condition (resting, after mouth rinsing,
and after saliva stimulation), sampling time, and blood contamination expressed as
salivary transferrin level. The result of this study indicated that the blood
contamination had an insignificant effect on the concentration of mycophenolic acid
and metabolites in oral fluids. In addition, a good correlation was observed between
AUC0-12 of MPA in OF samples and unbound and total MPA. In contrast, a weak
association was observed between MPAG concentrations in oral fluids with total and
unbound plasma concentration.
Manuscript VI: PF-5190457 is a ghrelin receptor inverse agonist that is currently
undergoing clinical development for the treatment of alcoholism. In this manuscript,
the development and validation of a simple and sensitive assay for quantitative
analysis of PF-5190457 in human or rat plasma and rat brain was described using
liquid chromatography-tandem mass spectrometry. Full separation was achieved
between the analyte and phospholipids of the three matrices within the total
chromatographic run time of 2.2 minutes. The manuscript also identified and
described the abundance of phospholipids contents of the three matrices. The
developed method successfully used to quantify the analytes in the three matrices as
part of pre-clinical and ongoing clinical studies.
vi
ACKNOWLEDGMENTS
This dissertation would not be possible without the blessings of the Almighty God and
guidance and support of several individuals. In particular, I would like to express my
deepest appreciation to my major advisor Dr. Fatemeh Akhlaghi. Without her constant
guidance, persistent help and encouragement this dissertation would not have been
possible. Sincere thanks to her for giving me the chance to work under her supervision
and for providing with knowledge that would help me to meet my long-term goals.
I would like to thank my doctoral committee chair Dr. Ingrid Lofgren and committee
members, Dr. Sara Rosenbaum, Dr. Liliana Gonzalez, Dr. Ruitang Deng.
I am very much thankful to Dr. Reginald Gohh and Maria Medeiros RN, our research
collaborators at Rhode Island Hospital for their persistent great effort in recruiting our
study participants and other logistic work that helped us executing the clinical studies.
Moreover, I would like to thank Dr. Deyu Li for his help in preparing manuscript VI.
I am very much indebted to the Libyan Ministry of Higher Education and Scientific
Research for financial support throughout my study.
I am appreciative to all previous lab members for their help and support including Dr.
Miroslav Dostalek, Dr. Ken Ogasawara, Dr. Ileana Ionita, Dr. Shripad Chitnis, Dr.
Joyce Macwan, Dr. Amir Mohammadpour and Karen Thudium. I am also thankful to
present lab members Sravani, Enoch Abdalla, Armin, Rohitash and Anita for the
vii
enjoyable moments we have spent together. I deeply grateful to College of Pharmacy
and the University of Rhode Island for providing me all necessary resources and the
help of their personnel, especially Mrs. Gerralyn Perry and Kathy Hayes.
I am thrilled to express thankfulness to my dear wife Khouloud, for her love, patience,
support and constant motivation. Not to forget my amazing kids Aser, Ahmed, Ayaat
and Alaa for lovely and pleasurable moments that helped me to get through tough
times.
viii
DEDICATION
To My Deceased Mother and Father, May Allah Have Mercy upon
Their Souls.
To My Wife and My Children
ix
PREFACE
This dissertation was prepared according to the University of Rhode Island
‘Guidelines for the Format of Theses and Dissertations’ standards for Manuscript
format. This dissertation consists of six manuscripts that have been combined to
satisfy the requirements of the department of Biomedical and Pharmaceutical
Sciences, College of Pharmacy, University of Rhode Island.
MANUSCRIPT I: Alternative Matrices for Therapeutic Drug of Immunosuppressive
Agents using LC-MS/MS.
This manuscript has been accepted for publication and submitted to “Bioanalysis” as
a review article.
MANUSCRIPT II: Development and Validation of Sensitive and Selective LC-
MS/MS Method for Quantification of Tacrolimus in Oral Fluid Samples from Kidney
Transplant Recipients.
This manuscript has been prepared for publication and will be submitted to “Journal
of Chromatography B”
MANUSCRIPT III: Therapeutic Drug Monitoring of Tacrolimus in Oral Fluids.
This manuscript has been prepared for publication and will be submitted to “Clinical
Pharmacokinetics”
MANUSCRIPT IV: Development and Validation of Sensitive and Selective LC-
MS/MS Method for Quantifying Mycophenolic Acid and Glucuronide metabolites in
Oral Fluid, Plasma, and Plasma Ultrafiltrate.
This manuscript has been prepared for publication and will be submitted to “Journal
of Chromatography B”
x
MANUSCRIPT V: Therapeutic Drug Monitoring of Mycophenolic Acid in Oral
Fluid in Samples from Kidney Transplant Recipients.
This manuscript has been prepared for publication and will be submitted to “Clinical
Pharmacokinetics”
MANUSCRIPT VI: Development and Validation of an UPLC-MS/MS Assay for
Quantitative Analysis of the Ghrelin Receptor Inverse Agonist PF-5190457 in Human
or Rat Plasma and Rat Brain.
This manuscript has been prepared for publication and submitted to “Analytical and
Bioanalytical Chemistry”
xi
TABLE OF CONTENTS MANUSCRIPT I ............................................................................................................ 1
MANUSCRIPT II ........................................................................................................ 60
MANUSCRIPT III ....................................................................................................... 89
MANUSCRIPT IV ..................................................................................................... 118
MANUSCRIPT V ...................................................................................................... 146
MANUSCRIPT VI ..................................................................................................... 167
xii
LIST OF TABLES
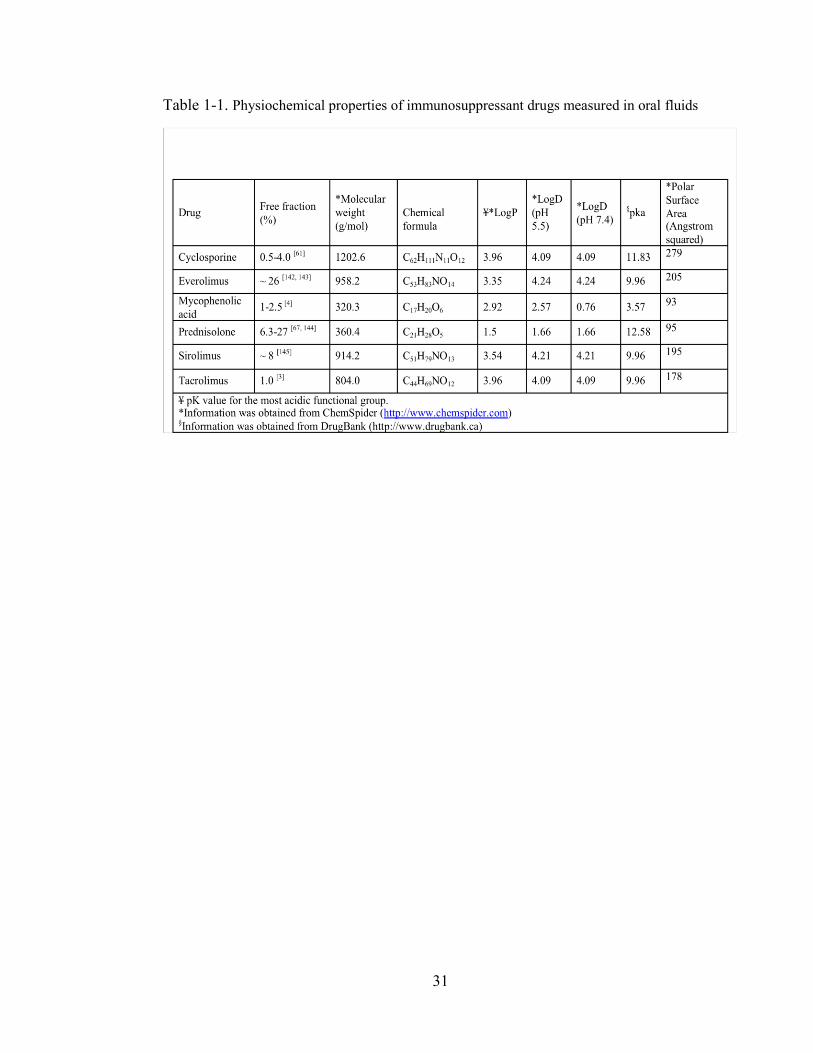
Table 1-1. Physiochemical properties of immunosuppressant drugs measured in oral fluids ..................................................................................................................... 31
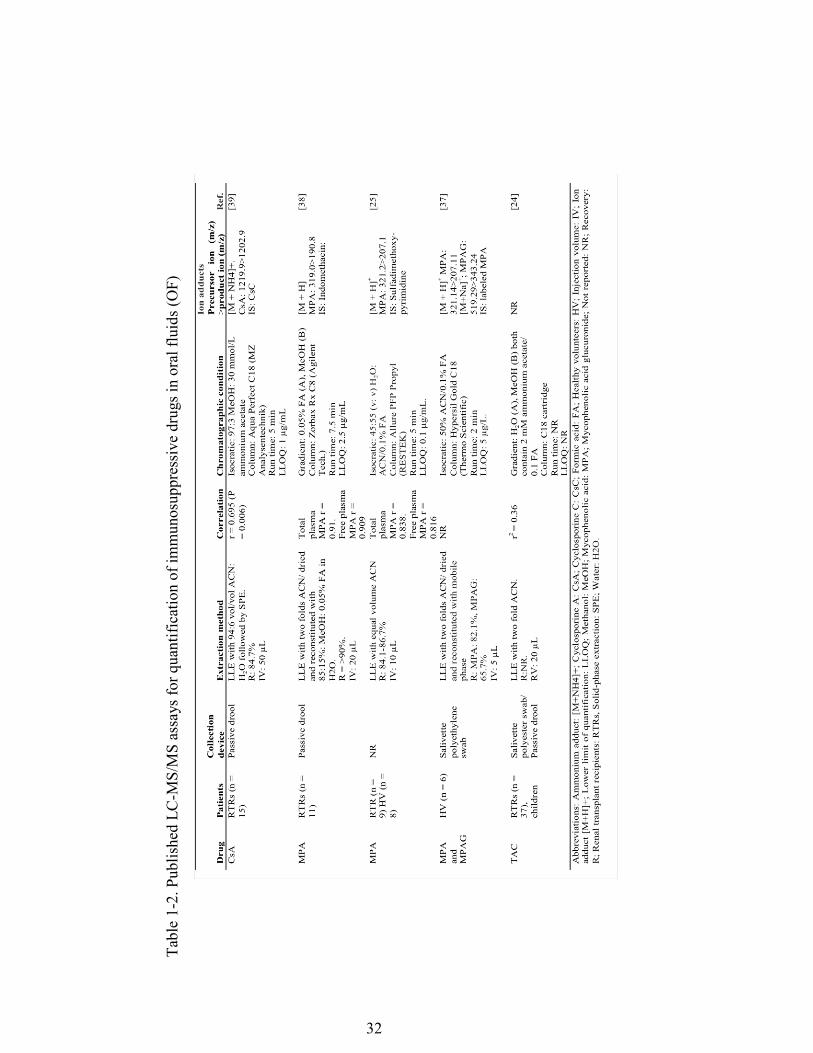
Table 1-2. Published LC-MS/MS assays for quantification of immunosuppressive drugs in oral fluids (OF) ....................................................................................... 32
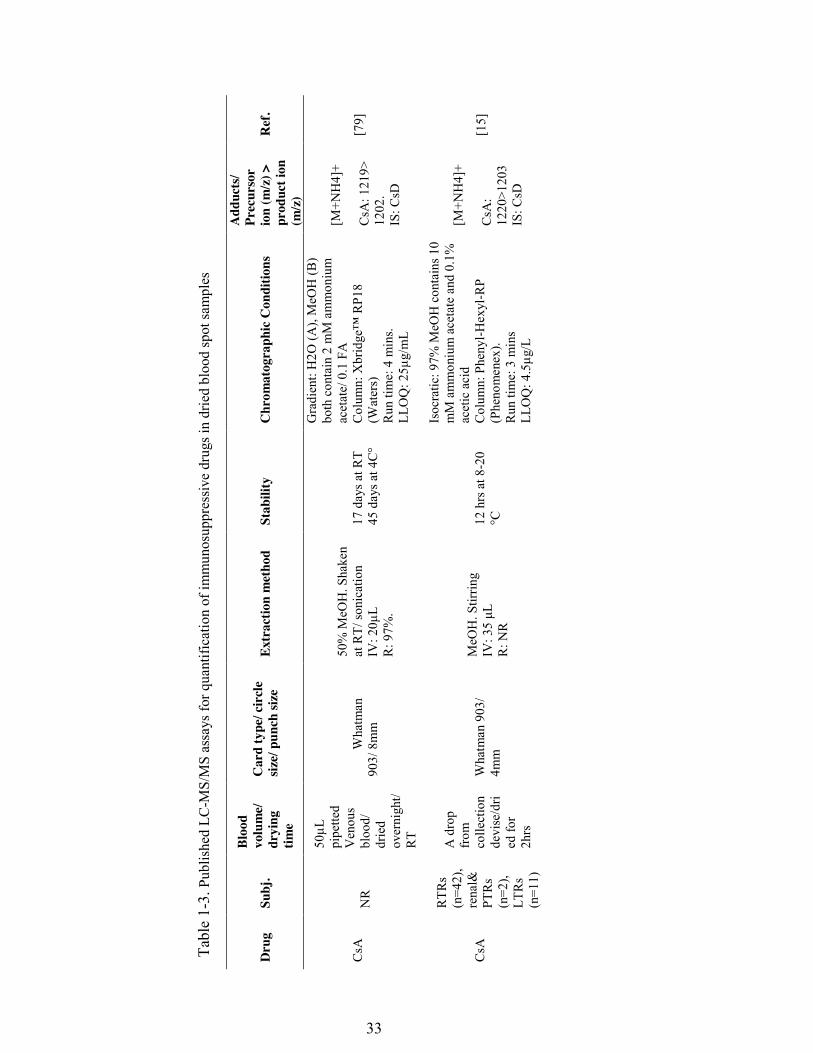
Table 1-3. Published LC-MS/MS assays for quantification of immunosuppressive drugs in dried blood spot samples ........................................................................ 33
Table 1-4. Published LC-MS/MS assays for quantification of immunosuppressive drugs in fingerprick samples ................................................................................ 38
Table 1-5. LC-MS/MS published assays for quantification of immunosuppressive drugs in lymphocytes ........................................................................................... 39
Table 1-6. LC-MS/MS published assays for quantification of immunosuppressive drugs in biopsies from transplanted organs .......................................................... 42
Table 2-1: Summary of QC samples from three individual runs (mean ± % CV, each QC had 6 replicates in each validation run, Total=18) ........................................ 78
Table 2-2: Results of stability studies (mean ± % CV, N= 3). .................................... 79 Table 2-3: Effect of different ratios of oral fluid sample: extraction solvent (ACN) on
recovery and absolute matrix effect, expressed as mean peak area ± std ( n =3) 80 Table 3-1: Summary of demographic information of participants............................. 103 Table 3-2: Correlation between salivary tacrolimus and transferrin concentrations (≤1
mg/dL). ............................................................................................................... 104 Table 3-3: shows mean, mean+1std and mean+2std transferrin concentration of all
samples transferrin level ≤6.6 mg/dL and TACs ............................................... 105 Table 3-4: Correlation between TACs and TRNs including samples that have
transferrin level of mean+ 1 std or mean+ 2 std. ............................................... 106 Table 3-5: Correlation between salivary transferrin (<6.6 mg/dL) and concentration.
............................................................................................................................ 107 Table 4-1. Summary of quality control samples from three individual runs. ............ 132 Table 4-2. Results of stability studies and recovery .................................................. 133 Table 5-1: Demographic information of study population ........................................ 157 Table 5-2: statistic summary of measured parameters ............................................... 158 Table 5-3: Shows statistics of AUC0-12 of MPA and MPAG in oral fluids, unbound
fraction and total concentration in plasma. ........................................................ 159 Table 6-1. Summary of standards curve parameters from three individual runs. ...... 182 Table 6-2. Summary of quality control samples from three individual runs ............. 183 Table 6-3. Results of stability studies ........................................................................ 184
xiii
LIST OF FIGURES
Figure 1-1, Chemical structure of immunosuppressive agents included in this review44 Figure 1-2. Schematic diagram depicting the relationship between bound and unbound
concentration of an immunosuppressive agent with the concentration at allograft or peripheral blood mononuclear cells as well as concentration in oral fluids or saliva. ................................................................................................................... 45
Figure 2-1 Chromatograms of TAC at LLOQ (10pg/mL) (1A, upper) and the internal standard ASC (200pg/mL) (1A,lower). Chromatograms 1B and (1C) represent a pooled blank OF and a blank solvent samples, respectively, injected following highest calibration curve concentration (1600pg/mL) injection. ......................... 81
Figure 2-2: Effect of blank OF and blank solvent injections on chromatograms obtained from continues post-column infused mixture of TAC and ASC overlaid on TAC at QC2 concentration (200pg/mL) (2A) and ASC (2B). ........................ 82
Figure 2-3 A Composite chromatogram shows traces of MRM transitions of 6 major phospholipids, obtained from a chromatogram of extracted blank pooled OF injection overlaid on TAC injection at concentration. ......................................... 83
Figure 2-4: Bland-Altman plot of % difference between the repeated measurements plotted against mean differences .......................................................................... 84
Figure 3-1: Correlation between transferrin and tacrolimus in oral fluids in 20 samples with highest transferrin concentration. ............................................................... 109
Figure 3-2: levels of tacrolimus at different sampling conditions in pre-dose samples (2A) and post-dose samples (2B). ...................................................................... 110
Figure 3-3: plots compare tacrolimus levels in oral fluids samples collected at rest (3A), after mouth rinse (3B), stimulated samples (3C), and in blood samples (3D) collected at pre and post dose. As can be seen, salivary levels of tacrolimus tend to be lower in 2 hours post dose oral fluid samples despite higher level in the corresponding blood samples. ............................................................................ 111
Figure 3-4: plots show the correlation between tacrolimus level in oral fluids and blood at different sampling conditions in pre-dose samples (4A) and 2 hours post dose samples (4B). ............................................................................................. 112
Figure 4-1: Representative chromatograms of [M + NH]+ MPAG at m/z 514.54>207.26 (A); MPA [M + NH]+ at m/z 338.41>207.28) (B); and MPA [M + H]+ at m/z 321.53 > 207.27 (C). As can be seen in (C), there is an MPA peaks in MPA channel (m/z 321.53 > 207.27) at the retention time of MAPG as a result of in source conversion. The in source conversion is not obvious in MPA channel with m/z 338.41>207.28 transition .................................................................... 134
Figure 4-2: Representative chromatograms show LLOQS of MPA (2A, 2 and 2CB) and MPAG (2D, 2E and 2F) in oral fluids plasma ultrafiltrate and plasma, respectively. ....................................................................................................... 135
Figure 4-3: Composite chromatogram of traces obtained from continues post-column infusion chromatograms of MPA (3A), MPAG (3B) and the internal standard (3C) overlaid on a chromatograms of injections of blank injections of mobile phase, oral fluids, plasma ultra filtrate and plasma rat and human plasma. There is now area of ion suppression or enhancement is seen at elution areas of the analytes. .............................................................................................................. 136
xiv
Figure 4-4: Chromatograms depicting traces of phospholipids obtained from injecting pooled blank samples of rat oral fluids (4A), plasma ultrafiltrate (4B) and plasma (4C). MRM transition of each individual phospholipids species is shown on the right side of the graph. Peaks of MPA and MPAG are also shown. .................. 138
Figure 5-1: Salivary, unbound and total concentration (mg/L) of mycophenolic acid (4.1A) and glucuronide metabolites (4.1B) versus time; data are expressed as mean and error bars represent standard error. .................................................... 160
Figure 5-2 Plots of mean AUC0-12 of mycophenolic acid (4.2.A-1, 4.2.A-2, and 4.2.A-3) and glucuronide metabolites (42.B-1, 4.2.B-2, and 4.2.B-3,) in oral fluids vs. unbound fraction; in oral fluids vs. total concentration ; and total vs. unbound fraction, respectively. ......................................................................................... 161
Figure 5-3: Salivary transferrin concentration (4.3.A) and pH levels (4.3.B) vs. time profiles; data are expressed as mean. The error bars represent standard error. . 162
Figure 5-4. Box plots compare the transferrin concentration at pre and two hours after dose and with different sampling conditions at resting (4.A), rinsed (4.B), and stimulated (4.C) .................................................................................................. 163
Figure 5-5. Box plots at left column show mycophenolic acid concentrations in resting, rinsed, and stimulated oral fluid samples at pre-dose (5.A) and two-hours after dose (5.B). In the right column, the box plots show transferrin level at pre-dose (5.C) and two-hours after dose (5.D) ......................................................... 164
Figure 6-1. Q1 scan of PF-5190457 shows the abundant adducts, [M+H]+ and [M+H4]
+. ......................................................................................................................... 185 Figure 6-2. Q3 scan shows fragmentation pattern of PF-5190457 [M+H]+ and intensity
of daughter ions. ................................................................................................. 186 Figure 6-3. Chromatograms of ghrelin antagonist (PF-5190457) (A, B, and C) and the
internal standard) at LLO Q (D,E and F) and in rat brain, rat plasma and human plasma samples, respectively. ............................................................................ 187
Figure 6-4. Chromatograms of ghrelin antagonist (PF-5190457) (A, B, and C) and the internal standard) at LLO Q (D,E and F) and in rat brain, rat plasma and human plasma samples, respectively. ............................................................................ 188
Figure 6-5. A composite chromatogram of traces obtained from continues post-column infusion chromatograms of PF-5190457 (A, B, and C) and the internal standard (D, E, and F) overlaid on a chromatograms of injections of rat brain (left column), rat plasma (middle column) and human plasma (right column). ........ 190
Figure 6-6 Chromatograms depicting traces of phospholipids obtained from injecting pooled blank samples of rat brain (A), rat plasma (B) and human plasma (C). MRM transition of each individual phospholipids species is shown on the right side of the graph. The figures show the relative amount of PF-5190457 to PLs in each matrix. ........................................................................................................ 192
Figure 6-7 Concentration-time profiles of PF-5190457 in a representative study volunteer after ingestion of 50 and 100 mg doses of PF-5190457 by oral route. ............................................................................................................................ 195
1
Chapter 1 : MANUSCRIPT I
Submitted as review article to Bioanalysis
Alternative Matrices for Therapeutic Drug Monitoring of Immunosuppressive
Agents using LC-MS/MS
Mwlod Ghareeb1, Fatemeh Akhlaghi1 1Department of Biomedical and Pharmaceutical Sciences, University of Rhode Island, Kingston, RI
Address correspondence to: Fatemeh Akhlaghi, PharmD, PhD, Clinical
Pharmacokinetics Research Laboratory, Department of Biomedical and
Pharmaceutical Sciences, University of Rhode Island, 495A College of Pharmacy, 7
Greenhouse Road, Kingston, RI 02881, USA. Phone: (401) 874 9205. Fax: (401) 874
5787. Email: [email protected]
2
Keywords Transplantation, immunosuppressant, dried blood spot, saliva, oral fluid, lymphocytes,
intra-tissue, therapeutic drug monitoring, LC-MS/MS.
Abbreviations ACN: Acetonitrile, ASC: Ascomycin, C0: pre dose concentration, C2: Two post dose
concentration, DBS: Dried blood spot, ESI: Electrospray ionization, EVE: Everolimus,
HT: Hematocrit, LC: MS/MS: Liquid chromatography tandem mass spectrometry,
LFB: Liquid finger prick blood sampling, LLOQ: Lower limit of quantification, ME:
Matrix effect, MeOH: Methanol, MPA: Mycophenolic acid, MPAG: Mycophenolic
acid glucuronide, OF: Oral fluid, PBMC: Peripheral blood mononuclear cells, P: gp:
P: glycoprotein, PLN: Prednisolone, SIR: Sirolimus, SPE: Solid phase extraction,
TAC: Tacrolimus, TDM: Therapeutic drug monitoring
3
Abstract
Immunosuppressive drugs used in solid organ transplants typically have narrow
therapeutic windows and high intra- and inter-subject variability. To ensure
satisfactory exposure, therapeutic drug monitoring (TDM) plays a pivotal role in any
successful post-transplant maintenance therapy. Currently, recommendations for
optimum immunosuppressant concentrations are based on blood/plasma
measurements. However, they introduce many disadvantages, including poor
prediction of allograft survival and toxicity, a weak correlation with drug
concentrations at the site of action, and the invasive nature of the sample collection.
Thus, alternative matrices have been investigated. This paper reviews tandem-mass
spectrometry (LC-MS/MS) methods used for the quantification of immunosuppressant
drugs utilizing non-conventional matrices, namely oral fluids, fingerprick blood, and
intra-cellular and intra-tissue sampling. The advantages, disadvantages, and clinical
application of such alternative mediums are discussed. Additionally, sample extraction
techniques and basic chromatography information regarding these methods are
presented in tabulated form.
4
Introduction
Therapeutic drug monitoring (TDM) is an integral part of immunosuppressive therapy
following organ transplantation because of the narrow therapeutic index and high
inter- and intra-subject variability of these agents [1-4]. The immunosuppressive
agents used in solid organ transplant include cyclosporine (CsA), everolimus (EVE),
mycophenolic acid (MPA), prednisolone (PLN), sirolimus (SIR) and tacrolimus
(TAC) [5]. The incidence and severity of side effects of immunosuppressant agents
correlate with a high exposure [5], while under-dosed patients can be at a greater risk
for allograft rejection [1, 5]. Currently, whole blood or plasma samples obtained
through venipuncture are used for routine immunosuppressive monitoring [5]. The
limitations of venipuncture blood samples include the invasive nature associated with
the sample collection and the weak correlation with the drug concentration at the site
of action. In this review, these limitations and proposed alternative methods will be
discussed.
Use of tandem mass spectrometry (LC-MS/MS) in drug monitoring
Advances in LC-MS/MS have enabled researchers to measure drug concentrations in
limited sample volumes with adequate sensitivity, selectivity and robustness. This
review will focus mainly on the use of LC-MS/MS in immunosuppressive agents in
TDM using alternative matrixes, namely oral fluids (OF), dried blood spots (DBS),
peripheral blood mononuclear cells (PBMC), and a biopsy sample from the implanted
organ. Other techniques, such as high-performance liquid chromatography (HPLC)
5
and immunoassays, will be briefly discussed wherever significant findings have been
reported.
The use of LC-MS/MS has long been a gold standard in pharmacokinetic studies [6],
and it is becoming an increasingly used technique in clinical laboratories [7]. A
reduced chromatographic run time and increased sensitivity are typically achieved
using ultra-performance liquid chromatography (UPLC) and newer stationary phases
[8,9]. LC-MS/MS has enabled researchers to quantify lower drug concentrations in
small blood sample volumes (i.e., 4-10 µL) [10-15] with higher specificity in
comparison with immunoassays [16-20]. In addition, LC-MS/MS allows the
simultaneous quantification of more than one analyte and/or metabolite [9, 21] with
different physiochemical properties with a high degree of sensitivity and selectivity
[22].
LC-MS/MS is a system that combines high-performance chromatography (HPLC)
with mass spectrometry (MS). Three atmospheric pressure ionization (API)
techniques, namely electrospray ionization (ESI), atmospheric-pressure chemical
ionization (APCI), and atmospheric-pressure photo-ionization (APPI), are typically
employed [23]. These techniques provide highly precise quantitative analysis with
minimal sample preparation of complex samples such as blood, plasma and OF [22,
24, 25]. ESI technique, most commonly used in quantifying polar to ionic compounds,
and in metabolomics and proteomics studies [23]. The main challenge that may hinder
the LC-MS/MS method development is the matrix effect (ME), which may produce
erroneous results [26, 27]. Proper cleanup of samples [26], the use of a deuterated
6
internal standard [21], and chromatographic separation of analytes from regions of
ion enhancement or suppression can mitigate/eliminate the effect of ME [28].
1. Oral fluids as a matrix for therapeutic drug monitoring
Oral fluids have been a subject of interest as an alternative medium to venipuncture
blood [24, 25, 29-39]. The main advantage of OF sampling is the noninvasive sample
collection, permitting more frequent sampling [40] and allowing more convenient self-
sampling [41]. Moreover, OF sampling offers a significantly lower cost per sample
[41, 42]. In addition, the drug portion measured in the OF represents the free drug
concentration [41, 42] (Figure 2). Given that the free drug concentration is responsible
for the pharmacological and toxicological effects [4, 43, 44], measurement of the drug
concentrations in OF may provide a better prediction of clinical outcomes and toxicity
[34,45]. Therefore, salivary drug level measurements are much easier and faster than
quantifying the free drug concentration in plasma [25, 38].
Drugs enter the OF mainly via passive diffusion [35]. Thus, physiochemical
properties, including protein binding, ionization, lipophilicity, and molecular weight,
are important determinants for the entry of a drug into the OF [35, 45]. The ability of a
drug to diffuse and equilibrate between the plasma and tissues is governed by its free
fraction [[35,45,46]. According to Lipinski’s rule of five, a molecular weight < 500 is
a prerequisite for good absorption/permeability [47]. However, despite its large
molecular weight (1202.6 g/mol), the total cyclosporine (CsA) concentration in both
blood and OF has shown a reasonable correlation (r=0.695) [39]. Blood capillaries
contain pores that are sufficiently large to allow molecules with a molecular weight
<1000 to permeate [45]. Because of their large size, drug-protein complexes are
7
prevented from crossing capillaries, and only the unbound drug enters the OF [34].
The salivary flow rate (see section 1.1.1), pH and pathophysiological conditions of the
oral cavity are also important physiological factors that affect the movement of a drug
between the plasma and the OF [48]. The pH of a medium influences the drug
distribution by altering the unionized portion of a drug [29,34,35,45,46]. The degree of
ionization of a drug is determined by its pKa (the pH at which 50% of the drug is
found in ionized form) and the pH of the medium [33]. Theoretically, basic drugs with
pKa values less than 5.5 and acidic drugs with pKa values greater than 8.5 are not
affected by changes in salivary pH (5.8-7.8) [45,48]. Under these conditions, drugs
predominantly exist in unionized form, therefore; they have higher lipophilicity and
consequently cross biological membranes more easily [29,35]. The chemical structure
and physicochemical properties of immunosuppressive agents are presented in Figure
1 and Table 1, respectively.
Recently, a Saliva Excretion Classification System has been proposed to predict the
ability of drugs to diffuse into the OF [49,50]. This system is based on the estimated
effective intestinal permeability and the percentage of the free fraction. According to
the authors, high drug permeability and/or high percentage of free fraction are required
to ensure the smooth movement of a drug between the plasma and OF. Based on the
logD value at pH 7.4, all immunosuppressive agents have high lipophilicity (Table 1),
and therefore high permeability is predicted despite the low free fraction. A low free
fraction thus will be the rate-limiting factor for penetration of drug into saliva making
saliva a suitable specimen to measure the unbound concentration of
immunosuppressive agents.
8
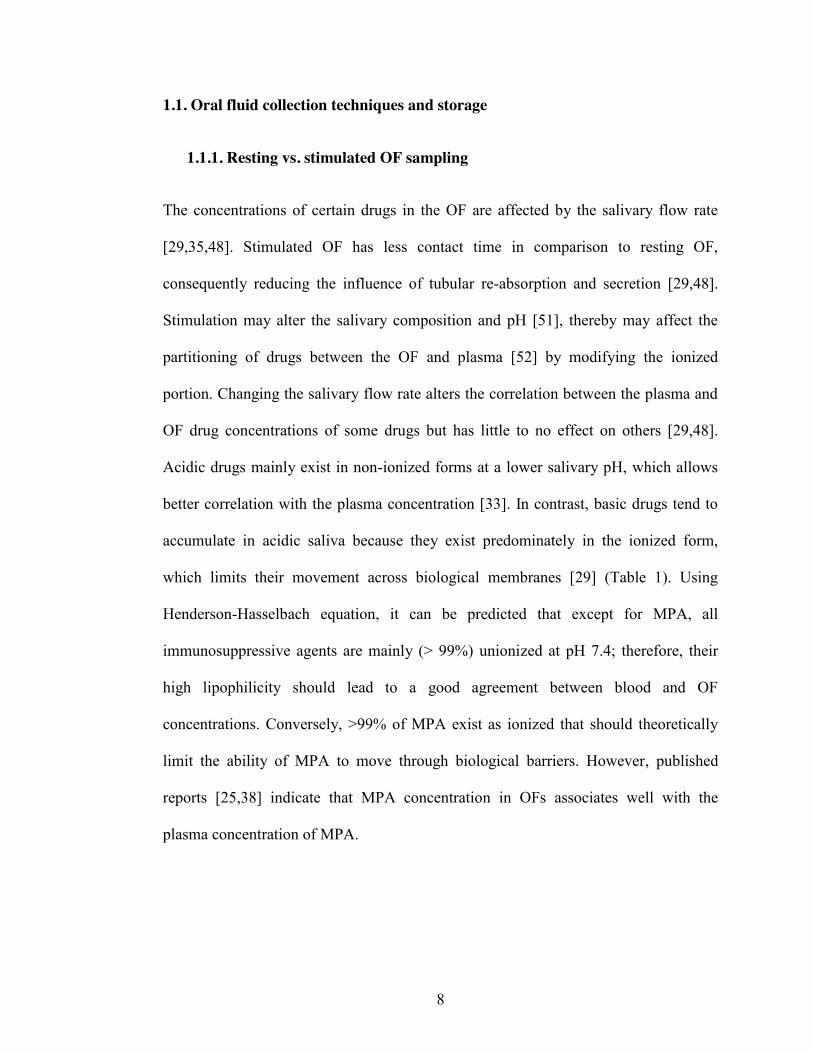
1.1. Oral fluid collection techniques and storage
1.1.1. Resting vs. stimulated OF sampling
The concentrations of certain drugs in the OF are affected by the salivary flow rate
[29,35,48]. Stimulated OF has less contact time in comparison to resting OF,
consequently reducing the influence of tubular re-absorption and secretion [29,48].
Stimulation may alter the salivary composition and pH [51], thereby may affect the
partitioning of drugs between the OF and plasma [52] by modifying the ionized
portion. Changing the salivary flow rate alters the correlation between the plasma and
OF drug concentrations of some drugs but has little to no effect on others [29,48].
Acidic drugs mainly exist in non-ionized forms at a lower salivary pH, which allows
better correlation with the plasma concentration [33]. In contrast, basic drugs tend to
accumulate in acidic saliva because they exist predominately in the ionized form,
which limits their movement across biological membranes [29] (Table 1). Using
Henderson-Hasselbach equation, it can be predicted that except for MPA, all
immunosuppressive agents are mainly (> 99%) unionized at pH 7.4; therefore, their
high lipophilicity should lead to a good agreement between blood and OF
concentrations. Conversely, >99% of MPA exist as ionized that should theoretically
limit the ability of MPA to move through biological barriers. However, published
reports [25,38] indicate that MPA concentration in OFs associates well with the
plasma concentration of MPA.
9
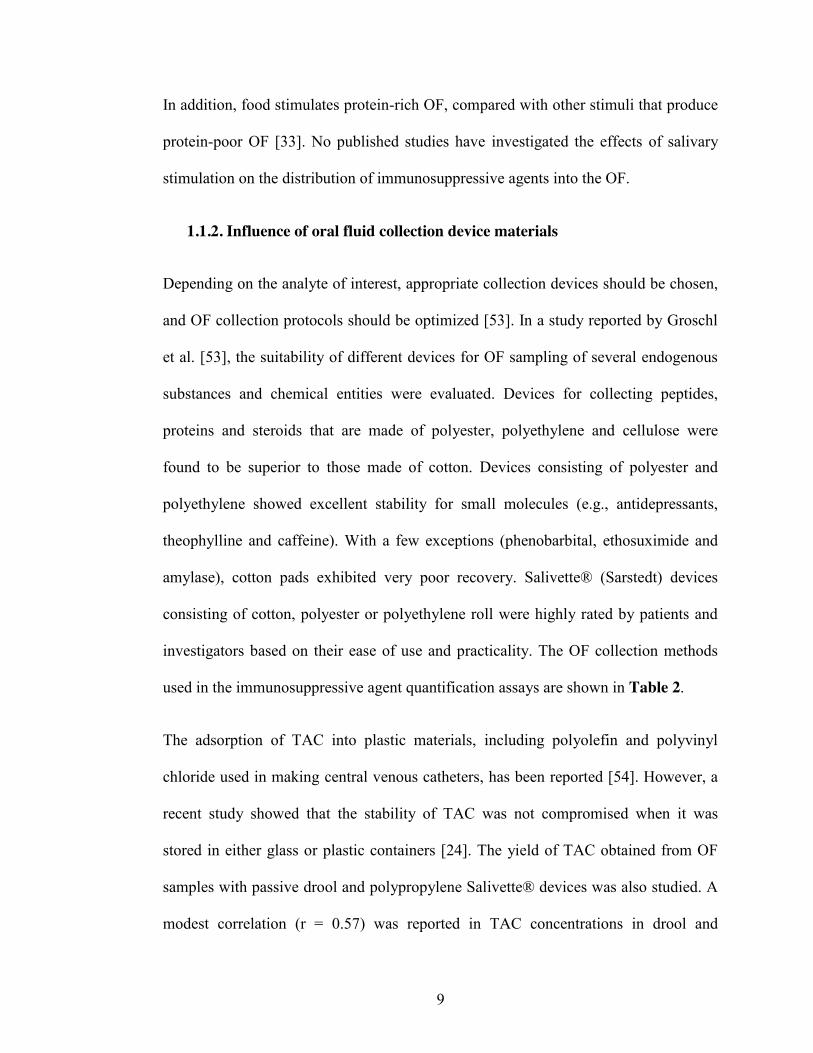
In addition, food stimulates protein-rich OF, compared with other stimuli that produce
protein-poor OF [33]. No published studies have investigated the effects of salivary
stimulation on the distribution of immunosuppressive agents into the OF.
1.1.2. Influence of oral fluid collection device materials
Depending on the analyte of interest, appropriate collection devices should be chosen,
and OF collection protocols should be optimized [53]. In a study reported by Groschl
et al. [53], the suitability of different devices for OF sampling of several endogenous
substances and chemical entities were evaluated. Devices for collecting peptides,
proteins and steroids that are made of polyester, polyethylene and cellulose were
found to be superior to those made of cotton. Devices consisting of polyester and
polyethylene showed excellent stability for small molecules (e.g., antidepressants,
theophylline and caffeine). With a few exceptions (phenobarbital, ethosuximide and
amylase), cotton pads exhibited very poor recovery. Salivette® (Sarstedt) devices
consisting of cotton, polyester or polyethylene roll were highly rated by patients and
investigators based on their ease of use and practicality. The OF collection methods
used in the immunosuppressive agent quantification assays are shown in Table 2.
The adsorption of TAC into plastic materials, including polyolefin and polyvinyl
chloride used in making central venous catheters, has been reported [54]. However, a
recent study showed that the stability of TAC was not compromised when it was
stored in either glass or plastic containers [24]. The yield of TAC obtained from OF
samples with passive drool and polypropylene Salivette® devices was also studied. A
modest correlation (r = 0.57) was reported in TAC concentrations in drool and
10
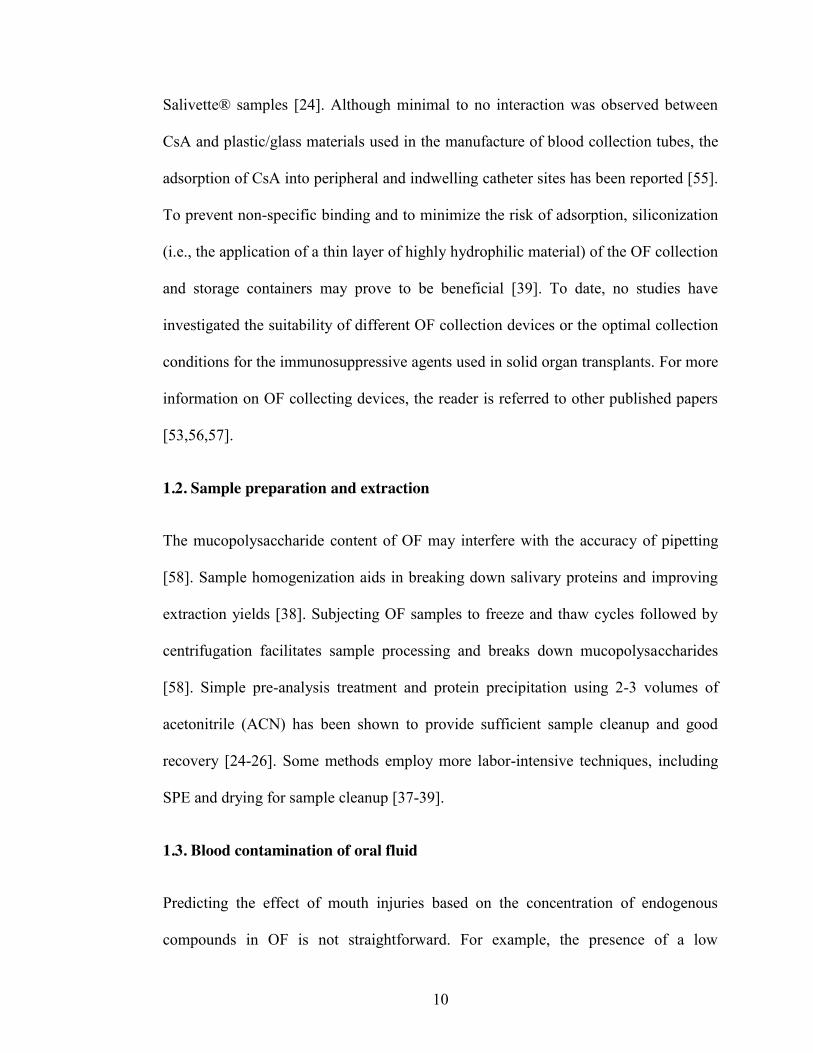
Salivette® samples [24]. Although minimal to no interaction was observed between
CsA and plastic/glass materials used in the manufacture of blood collection tubes, the
adsorption of CsA into peripheral and indwelling catheter sites has been reported [55].
To prevent non-specific binding and to minimize the risk of adsorption, siliconization
(i.e., the application of a thin layer of highly hydrophilic material) of the OF collection
and storage containers may prove to be beneficial [39]. To date, no studies have
investigated the suitability of different OF collection devices or the optimal collection
conditions for the immunosuppressive agents used in solid organ transplants. For more
information on OF collecting devices, the reader is referred to other published papers
[53,56,57].
1.2. Sample preparation and extraction
The mucopolysaccharide content of OF may interfere with the accuracy of pipetting
[58]. Sample homogenization aids in breaking down salivary proteins and improving
extraction yields [38]. Subjecting OF samples to freeze and thaw cycles followed by
centrifugation facilitates sample processing and breaks down mucopolysaccharides
[58]. Simple pre-analysis treatment and protein precipitation using 2-3 volumes of
acetonitrile (ACN) has been shown to provide sufficient sample cleanup and good
recovery [24-26]. Some methods employ more labor-intensive techniques, including
SPE and drying for sample cleanup [37-39].
1.3. Blood contamination of oral fluid
Predicting the effect of mouth injuries based on the concentration of endogenous
compounds in OF is not straightforward. For example, the presence of a low
11
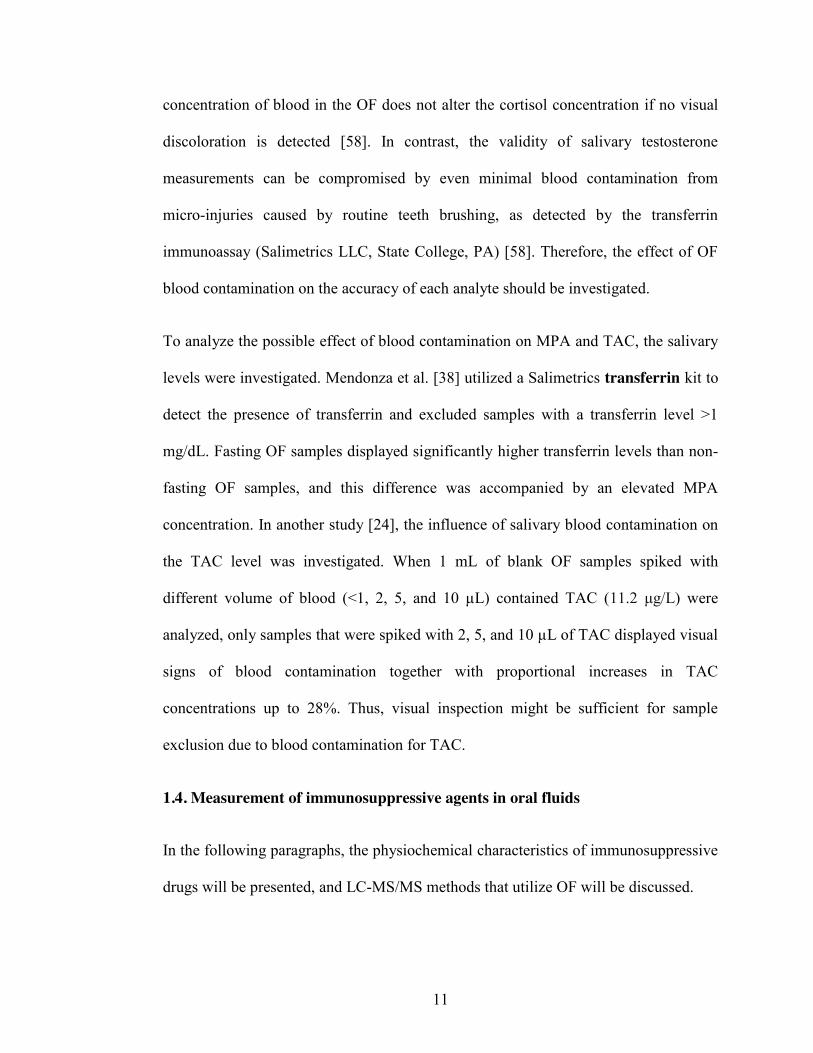
concentration of blood in the OF does not alter the cortisol concentration if no visual
discoloration is detected [58]. In contrast, the validity of salivary testosterone
measurements can be compromised by even minimal blood contamination from
micro-injuries caused by routine teeth brushing, as detected by the transferrin
immunoassay (Salimetrics LLC, State College, PA) [58]. Therefore, the effect of OF
blood contamination on the accuracy of each analyte should be investigated.
To analyze the possible effect of blood contamination on MPA and TAC, the salivary
levels were investigated. Mendonza et al. [38] utilized a Salimetrics transferrin kit to
detect the presence of transferrin and excluded samples with a transferrin level >1
mg/dL. Fasting OF samples displayed significantly higher transferrin levels than non-
fasting OF samples, and this difference was accompanied by an elevated MPA
concentration. In another study [24], the influence of salivary blood contamination on
the TAC level was investigated. When 1 mL of blank OF samples spiked with
different volume of blood (<1, 2, 5, and 10 µL) contained TAC (11.2 μg/L) were
analyzed, only samples that were spiked with 2, 5, and 10 µL of TAC displayed visual
signs of blood contamination together with proportional increases in TAC
concentrations up to 28%. Thus, visual inspection might be sufficient for sample
exclusion due to blood contamination for TAC.
1.4. Measurement of immunosuppressive agents in oral fluids
In the following paragraphs, the physiochemical characteristics of immunosuppressive
drugs will be presented, and LC-MS/MS methods that utilize OF will be discussed.
12
1.4.1. Cyclosporine
Cyclosporine is an extremely lipophilic compound that is mostly distributed in plasma
lipoproteins and blood cells [44]. Measurement of unbound fraction of CsA by
equilibrium dialysis is difficult and time consuming. Because of extreme lipophilicity,
CsA binds non-specifically to Teflon dialysis cells resulting in low yield and
prolonged dialysis time. As a result, unbound fraction measurement requires the use of
custom-made stainless-steel equilibrium dialysis devices [44]. Moreover, all methods
reported to date have utilized radiolabelled cyclosporine as tracer possibly because of
lack of sensitivity of analytical methods.
The degree of binding to plasma proteins is influenced by the time after
transplantation [60], drugs that modulate the lipid profile [44,59], nutritional status
[60], and clinical conditions [60,61]. Cyclosporine partitioning between the blood and
plasma depends on the drug concentration, hematocrit (HT), plasma lipoprotein level
and temperature. Therefore, whole blood is the recommended matrix for CsA
therapeutic drug monitoring [60]. The outcome of immunosuppressant therapy with
CsA is improved by a higher free fraction percentage [62]. There is a high variability
in the free fraction of CsA with a mean ± SD of 1.53 ± 0.38% in the lung and heart
transplant recipients [44] and a range from 0.5 to 4.2% [61]. The ease with which
cyclosporine crosses biological membranes and enters the OF is attributed to its
lipophilicity. CsA was the first immunosuppressant agent studied in OF by
radioimmunoassay [36]. A good correlation was reported (r=0.68) between the OF and
the total cyclosporine serum level in samples from 38 renal transplant recipients.
Mendonza et al. [39] published the first and, to date, the only method used to measure
13
CsA concentrations in the OF by LC-MS/MS following SPE for sample cleaning
(Table 2).
1.4.2. Tacrolimus
Tacrolimus is a highly lipophilic compound (Table 2) with a plasma free fraction of
approximately 1% [3]. The unbound fraction is significantly affected by changes in
plasma lipoprotein concentrations after liver transplantation [43], which may lead to
incidences of rejection and/or toxicity [43,63]. There is only one published method for
the utilization of the OF matrix for TAC quantification [24] (Table 2).
1.4.3. Mycophenolic acid
The unbound fraction of MPA ranges from 1 to 2.5% [4]. In patients with severe renal
impairment, the concentration of the major MPA metabolite, MPA-glucuronide
(MPAG), may increase up to 3-6-fold. This increase in MPAG leads to displacement
of MPA from its binding sites [4], and as a result, the MPA-free fraction may increase
up to 7% [4]. Mycophenolic acid has a low molecular weight and lipophilic nature
(logD 0.76 at pH 7.4) (Table 1). These characteristics make MPA a suitable candidate
for TDM in OF. LC-MS/MS is used to quantify MPA in negative [38] and positive
[25,37] ESI modes. In a recent paper [37], MPA and MPAG were quantified
simultaneously with 82.1% and 65.7% recovery, respectively. It must be noted that
MPAG is subject to in-source conversion to MPA. This phenomenon is observed as
small peaks in the MPA chromatogram channel with the same retention time as
MPAG [25,38,64]. Therefore, the chromatographic separation of MPA and MPAG
peaks is necessary to avoid overestimating the parent drug concentration.
14
1.4.4. Prednisolone
Prednisolone (PLN) is a synthetic glucocorticoid with an unspecific mechanism of
action [65]. Prednisolone is widely prescribed as a part of immunosuppressive therapy
regimens in solid organ transplantation [66]. The free fraction of PLN increases in
certain clinical conditions such as diabetes [67]. In addition, the free fraction is dose-
dependent and exhibits circadian variability (approximately 22% higher in the
morning) [68]. The PLN plasma unbound fraction demonstrates a high correlation
with the salivary level and a lower correlation with the concentration of the pro-drug
prednisone (PN) [69,70]. Total and free concentrations of PLN+PN in the OF and
plasma display an excellent association [70] (Table 2).
Some studies [24,39] have focused on finding an association between total drug
concentrations in the blood and OF. Because the drug fraction in OF theoretically
represents the unbound portion, a good association with the free fraction in the blood
should be pursued. The total drug concentration may not correlate very well with the
free fraction [4,43]. However, OF sampling may be considered a non-invasive
alternative to venous blood sampling if a good correlation between total blood and OF
drug concentrations is established.
2. Dried blood spot and liquid fingerprick blood sampling
Dried blood spot (DBS) and liquid fingerprick blood (LFB) sampling are other
techniques that have benefited from the introduction of LC-MS/MS [12-14,71-77].
The first report of the use of fingertip blood to measure an immunosuppressive agent
was published in the late 1980s [78]. The radioimmunoassay (RIA) technique was
15
utilized to quantify CsA in 20-µL blood samples obtained from the fingertips of renal
transplant recipients with a lower limit of quantification (LLOQ) of 62.5 µg/L.
Fingerprick sampling is much less invasive than venipuncture and offers the
possibility of home self-sampling at the patient’s convenience [79]. However,
adequate patient training might be needed for optimum sample collection [80].
Additionally, proper sample handling and storing after collection are required to avoid
deterioration and to ensure stability during mailing and transportation [73,79].
2.1. Sample collection
After cleaning the fingertip with a suitable disinfectant [11,14,79,81], a small
laceration is made using spring-loaded lancets that are designed to minimize pain and
discomfort [73,77,79,82]. A fingerprick blood sample is processed either as a dried
blood spot (DBS) (Table 3) or in liquid form (LFB) (Table 4).
In the DBS technique, blood samples are either applied directly from the fingertip
after discarding the first drop [71,73,74,76,79,82]; or the blood is collected using a
collecting device from the fingertip or venipuncture is pipetted onto a predetermined
circular area of a special filter paper [15,77,83]. The latter approach guarantees the
application of a precise amount of blood sample to the filter paper. However, this
additional step may make home self-sampling less appealing [15]. In addition,
capillary self-sampling may result in a significantly different result from sample
collection by healthcare professionals [15]. Liquid fingerprick blood sampling
involves the direct extraction of blood samples in liquid form, which are collected
16
using EDTA-containing devices such as Microvette™ [12,15] or Microtainer™ tubes
[13].
2.2. Extraction procedure and recovery of DBS and LFB sampling
A disc of the blood spot with a diameter between 4 and 8 mm is removed using a
special puncher. The sample extraction ranges from simple vortex mixing [15,75,82]
to ultra-sonication at temperatures of up to 80 °C [71,72,77,83]. The different pre-
treatment conditions used for the samples result in significant differences in the final
yield (Table 3). The applied blood volume, card type, punched area, and hematocrit
(HT) may also play important roles in the extraction recovery and method
reproducibility [84,85]. Therefore, these variables should be examined for the analyte
of interest, and corrections should be applied if necessary and feasible [86]. LFB
samples are pre-treated with a zinc sulfate solution (0.1- 0.4 mol/L) followed by
protein precipitation with ACN and centrifugation [11-14].
2.2.1 Effect of blood volume
A good precision of the estimation of CsA, SIR, and TAC (CV=4.3-13.5%) was
produced using a 25-100-μl blood drop on a Whatman 903 card with an 8-mm punch
size [75]. A different study [87] reported that 20 µL of blood was enough to fill the
designated area on the Whatman 903 card. In contrast, another study [71] used the
same type of filter paper and punch size reported that drops with a volume of 20 µL
were insufficient to fill the pre-determined area. The discrepancy between the two
studies could be attributed to differences in the HT values of the blood samples used.
17
2.2.2. Influence of the type of sampling card
A Whatman Protein saver 903 card (LifeSciences GH) [88] is the most commonly
used card for immunosuppressive drug testing (Table 3). This card is additive-free and
made from 100% pure cotton linters [89]. Whatman FTA and FTA Elute are high
quality papers that are chemically treated to provide cell lysis, protein denaturation
and prevention of microorganism growth [89]. Whatman 31 ET CHR
(chromatography/ethyl acetate) cards are intended for electrophoresis applications of
large molecules and are also used in immunosuppressant drug DBS testing [88].
Finally, Ahlstrom 226 (PerkinElmer) is another additive-free sampling card that
consists of 100% pure cotton linter and is validated for even and uniform sample
distribution [90].
There are no significant differences between Whatman 31 ET CHR and Whatman
FTA cards at the method validation level for CsA, EVE, SIR and TAC [86]. Heinig et
al. [87] compared MPA and MPAG metabolite recovery using five different cards.
There were lower recoveries of MPA and metabolites from Whatman FTA-DMPK-C
and FTA-DMPK-A than from Ahlstrom 226, FTA-DMP-B, and Whatman FTA elute
cards. In addition, poor reproducibility (CV=17-26%) was observed for FTA-DMPK-
C and FTA-DMPK-A. Although 20 µL of blood was sufficient to fill the designated
area on the Whatman 903 card, there was a visible clear area on the Ahlstrom 226
card.
18
2.2.3. Effect of the punching location
The distribution of analytes may differ between the center and the outer area of the
spot due to the chromatographic properties of the DBS sampling card [85]. The disc
obtained from punching close to the spot edges on Ahlstrom 226 cards produces 30%
higher MPA and metabolite (MPAG) concentrations than the concentrations
determined from central punching [87]. In contrast, the concentrations of MPA and its
metabolites at the edges were lower on FTA Elute and DMPK-B (4–10% and 14–
19%, respectively) [87]. Consistency of the punching location helps to improve the
reproducibility [87] and application of a larger spot than the size of the punched disc
ensures sampling from the center of the spot [71].
2.2.4. Effect of hematocrit
Normal HT values range from 42 to 52% in males and from 37 to 48% in females
[91]. Samples from patients with a high HT create drops that are more viscous and
have smaller volumes [92]. Furthermore, a drop with a high HT produces less
dispersion on the filter paper, and a larger volume is required to fill the same area [86].
Consequently, the concentration of certain analytes can be overestimated
[77,85,86,92]. A high HT has been reported to increase the MPA content by
approximately 10% [92]. Similar findings have been reported for CsA from blood
samples with high HT values (0.72%), demonstrating an approximately 10-14%
higher CsA concentration [77]. Conversely, in blood samples with HT levels less than
0.20, the CsA concentration was reduced by approximately 9-12%. The normalization
of individual HT values with an average HT value of venous blood obtained from the

19
precipitating individuals is recommended to minimize the effect of variability in HT
on the finalized results [71,77,91,92]. Using this approach, the calculated recovery in
samples with low HT improved to 112.4 and 97.0 for low (39.4 µg/L) and high (590
µg/L) CsA concentrations, respectively, compared to less than 85% for non-
normalized HT values [71]. The effect of HT on the recovery of EVE, SIR and TAC
appears to be minimal [71].
Recently, a new technique has been proposed to overcome variability in volumes of
blood samples applied to the filter paper arises from differences in HT value [93,94].
This utilizes simple and practical procedures using volumetric absorptive
microsampler devise (VAMS). It consists of porous absorbent polymeric tip capable
of absorbing more precisely 10 µL of blood utilizing capillary force.
2.3 Matrix effect
The extracted matrix from DBS appears to have a negligible effect on ME
[71,76,77,82,87]. The degree of interference of blood components may depend on the
type of sampling card used. For example, interfering residue is less pronounced in
ethanolic extract from samples prepared on the Whatman FTA elute and FTA DMPK-
A card than from samples prepared on the Ahlstrom 226 card [87]. However, remains
were further reduced after proper sample cleaning using SPE [87]. Using MeOH:
water (80:20, v:v) as an extracting solvent from the Whatman 31 ET CHR and
Whatman FTA cards, only CsA showed a significant ME; no interference was
observed with EVE, SIR or TAC [86]. The ME effect on CsA was diminished when a
deuterated internal standard was used.
20
2.4. Stability
Despite the use of the same DBS collection paper (Whatman 903), a discrepancy in
stability has been reported, especially for CsA (Table 3). Leichtle et al. [15] have
examined CsA stability in DBS. After the application of capillary venous blood (about
4 μL), the card was allowed to dry for two hours, and the CsA was extracted from a 4-
mm disc. Samples collected with capillary devices with or without EDTA were stable
for up 12 hours at 8 and 20 °C; the concentration decreased significantly by 24 hours.
In contrast, no identifiable changes in the blood samples processed in liquid form were
observed. Shorter stability time in the DBS samples compared to the capillary blood
samples, may indicate an insufficient drying time (2 hours) and/or poor storage
conditions and handling [89].
In another study [77], CsA concentrations were measured in dry blood spots prepared
by pipetting EDTA venous blood samples (50 µL) onto filter paper that was allowed
to dry overnight at room temperature. The extracted CsA from an 8-mm disc was
stable for 17 days at ambient temperature and for up to 45 days at 4 °C. Finally, a
recent study [75] reported that CsA extracted from an 8-mm disc prepared using 50 µL
EDTA venous blood dried for 3 hours at room temperature was stable for up to 5 days
at 60 °C. The only noticeable differences seemed to be the drying time and sample
volumes, which were approximately 12-fold higher in the latter two studies [75,77]
(see Table 3).
Tacrolimus that was measured in EDTA venous blood (50 µL) applied immediately
onto a filter paper and dried at room temperature for 3 hours showed stability for up to
21
5 days at 60 °C, and SIR was stable for the same period of time at 37 °C [75].
Tacrolimus in fingertip blood samples applied directly onto the filter paper also
showed stability for up to 7 days at 37 °C [82]. In addition, EVE appeared to be stable
for up to 3 days at 60 °C and for 32 days at 4 °C [76]. Fingertip DBS samples of CsA,
EVE, SIR and TAC have been reported to be stable for up to 5 months at 2 to 8 °C
when the blood was applied directly onto the filter paper [71].
Cyclosporine A in LFB blood samples collected in Microvette devices containing
EDTA were found to be stable for 5 days after mail delivery [12]. Tacrolimus [14, 79],
EVE [76], and CsA [12] DBS samples seemed to be stable during mailing and
transportation, supporting LFB and DBS home sampling.
2.5. Patient preference
Self-fingerprick sampling is well tolerated with no serious discomfort as reported by
children [14,81] or adult transplant patients [12,79,95]. In solid organ transplant
patients, LFB was preferred (60%) over venipuncture sampling, and approximately
68% of patients favored the use of DBS over LFP sampling (18%) [15]. The sampling
process for LFB may be troublesome for some patients and therefore may produce
poor sampling [12,15]. Nonetheless, unsupervised capillary and DBS self-sampling
can be improved by providing brief instructions or over-the-phone consultation
[12,73].
22
2.6. Clinical application of DBS and LFB
The mean difference in CsA concentrations is significantly higher in DBS prepared
from capillary tube-collected fingertip blood than from venous blood at C0 and C2
[15]. Despite the low recovery of EVE from DBS (76.5%), the concentration of EVE
in DBS was slightly higher than in venous blood. The concentrations of EVE in DBS
samples prepared by patients and in the laboratory were very similar [76]. Cheung et
al. [79] used DBS to estimate TAC exposure (AUC0–12) utilizing a limited sampling
strategy (C2 and C4) in 36 kidney transplant recipients. The dried blood spot results
showed a high correlation with the results obtained from analyzing venous blood
samples (r2= 96, P<0.001). The calculated AUC0–12 mean difference between DBS and
venous samples was less than 7.6%.
A high correlation between venous and fingertip samples is expected because both
represent whole blood. However, a statistically significant higher TAC has been
reported in LFB samples compared to venous blood, but the mean difference was
clinically insignificant (0.29 ng/mL, 95% CI 0.09–0.49), and a good correlation was
reported (r2 =0.845) [14]. In contrast, the CsA venous blood level was statistically
significantly higher than in LFB [11]. The mean difference was 9.5 ng/mL (95% CI
0.8-18.2 µg/L, P<0.03), however, a strong association was also reported between
venous and LFB samples (r2 = 0.96, P < 0.001).
Because fingertip sampling utilizes whole blood, a lack of correlation is expected
between the obtained levels of immunosuppressive agents in DBS or LFB and their
levels at the site of action (see sections 3 and 4). However, the relative ease of DBS
23
and LFB sampling compared to venipuncture, the possibility of home self-sampling,
and the stability during storage and transportation suggest that both of these
techniques have the potential to replace venipuncture in TDM.
3. Intracellular concentration
Despite maintaining a satisfactory blood level of immunosuppressants through
intensive TDM, rejection rates still remain between 8-15% [96], which necessitates the
need to develop a new approach that could further reduce the rejection rate.
To prevent allograft rejection resulting from suppressing the immune system,
immunosuppressants must first enter lymphocytes [97-99]. In heart transplant
recipients, there is a greater incidence of rejection associated with a higher peripheral
blood monocyte cell (PBMC) count [100]. Lymphocytes express P-glycoprotein efflux
transporter (P-gp), which is also known as multidrug resistance protein 1 (MDR1)
encoded by the ABCB1 gene [101-103]. This transporter is responsible for moving
xenobiotics from the intracellular to the extracellular environment [103]. As a result,
the intracellular level of P-gp substrates can be affected by genetic polymorphisms in
the coding gene of P-gp, altering the immune system response [103,104]. Both CsA
and TAC are well-documented substrates of P-gp [104-106]. In vitro data indicate
that SIR is a substrate and a weak inhibitor of the P-gp transporter [107-109], while
EVE has shown a weak inhibitory effect on P-gp [109]. Higher incidence of rejection
is proportionally correlated with higher expression of MDR1 gene on PBMCs
obtained from heart [100] and liver [110,111] transplant recipients who have been
prescribed CsA or TAC. The levels of immunosuppressants in lymphocytes, including
24
CsA [104,112-116], TAC [104-106,113,114,116-124], SIR [125] and EVE [126], have
been investigated in solid organ transplant patients (Table 5).
There is a histologically and clinically proven rejection associated with a lower level
of TAC in PBMCs measured at day 7 post-transplantation in liver transplant recipients
[117]. No correlation between whole blood and PBMCs’ tacrolimus concentrations in
heart (r2 = 0.259; P=0.183) and liver (r2 = 0.0142; P=0.42) transplant recipients has
been reported [106,113]. Contradictory findings have been reported for CsA. A study
by Gustafsson et al. [119] involving heart transplant recipients co-treated with MPA
reported a high correlation (r2=0.98, P<0.001) between CsA concentrations in two
hours post-dose (C2) whole blood samples and lymphocyte AUC0–12h exposure
(expressed as ng*h/10-6 cells). In contrast, a poor correlation was reported in patients
co-treated with EVE (r2 = 0.24, P = 0.18). The authors suggested that the difference
between the two groups could be attributed to the inhibitory effect of EVE on P-gp,
leading to modulation of intracellular CsA levels. A poor correlation (r2 = 0.055, P =
0.35) in CsA levels in matched pre-dose (C0) samples of blood and intra-lymphocytes
from heart transplant patients was also reported in a recent study by Robertsen et al.
[112]. Robertsen et al. suggested that the high correlation detected in the study by
Gustafsson et al. could be attributed to the use of C2 blood concentrations, which are
known to correlate better with blood AUC0–12h than C0. In addition, another study
reported a weak correlation between blood and PBMC AUC0–12h in healthy volunteers
following a single dose of CsA (Spearman, r=0.09, P=0.71) [105]. Slightly better
correlation was observed in C0 samples from stable renal, liver, and lung transplant
recipients (r = 0.30, P<0.001) [104]. A study by Falck et al. [120] involving kidney
25
transplant recipients reported that, patients who experienced rejection displayed
significantly lower CsA intra-lymphocyte AUC0–12h exposure compared to the non-
rejection group (P = 0.004), despite identical CsA blood levels. The level of CsA in
lymphocytes started to decline 7 days prior to clinical signs of rejection. The
difference in intracellular concentrations between the two groups reached statistical
significance (P = 0.014) three days before showing clinical signs of rejection.
Regarding EVE, a poor correlation between blood and PBMCs concentrations has
been reported (r = 0.32) [126]. Finally, in heart transplant recipients, a higher
incidence of rejection is associated with elevated PBMC counts in patients who are
receiving a triple drug regimen, including azathioprine, cyclosporine and steroids
[100].
3.1. Effect of genetic polymorphisms of ABCB1 on intracellular
immunosuppressants concentrations
A recent report involving 90 liver transplant patients reported the involvement of
genetic polymorphisms in P-gp transporters in modulating the concentration of TAC
in intra-lymphocytes at day 7 and steady-state [106]. Absolute, dose normalized, and
PBMC/blood TAC concentrations were 1.4 times higher (P<0.002) in carriers of the
mutant 1199G>A allele than in non-carriers. Additionally, carriers of the mutant
alleles 3435C>T and 2677G>T/A showed a 1.3-fold higher intracellular TAC
concentration (expressed in the geometric mean) compared to individuals with
homozygote wild type alleles (P values = 0.0089 and 0.0122 for 3435T and 2677T/A,
respectively). A similar effect of genetic polymorphisms in the P-gp transporter on
CsA has been reported in 3435T carriers among 64 stable renal, liver and lung
26
transplant recipients [104]. Carriers of 3435T showed an increase in intracellular CsA
concentrations of 1.7 times (P = 0.04) compared to wild type (P = 0.02). However, the
opposite findings have been reported in 1199A carriers, in whom intracellular
concentrations of CsA were 1.8 times lower (P = 0.04) compared to wild type. The
2677T polymorphism did not affect the intracellular concentration of CsA.
CYP3A-metabolizing enzymes are also expressed in lymphocytes [127,128]. CYP3A
enzymes are polymorphic [129-132], but the intracellular TAC concentration is
unlikely to be influenced by genetic polymorphisms in CYP3A enzymes [106].
In summary, an adequate intracellular concentration of immunosuppressant drugs is
pivotal for proper allograft maintenance. Monitoring the intracellular levels of
immunosuppressants and detecting any changes in exposure could serve as an early
warning call prior to the clinical manifestation of toxicity or rejection.
3.2. Sample preparation and extraction of immunosuppressants from PBMCs
The volume of whole blood needed to prepare PMBCs ranged from as low as 1.5 mL
to as high as 10 mL (Table 5). To prevent immunosuppressant efflux from PBMCs
during sample preparation, it is crucial to add a P-gp inhibitor such as verapamil or to
perform the preparation procedures at 4 °C. The main limitations of intracellular drug
concentration quantification methods the invasive nature of obtaining blood samples
and the labor-intensive sample preparation procedures, which involve cells counts,
drying and reconstitution and solid-phase extraction.
27
4. Intra-tissue concentration
Early reports on the measurement of intra-tissue concentrations of immunosuppressive
agents date to the early 1990s [133-135] (. In those studies, HPLC and enzyme
immunoassay (EIA) methods were used to measure CsA and TAC tissue
concentrations, respectively. Recently, there has been a renewed interest in utilizing
biopsied tissue from transplanted heart, kidney and liver allografts [112,136-139]
(Table 6).
Post-mortem examinations have revealed that CsA and its metabolites accumulate
rapidly in tissues after administration [133]. Measured using HPLC, the total
concentration of CsA and its metabolites reached levels that were 53-fold higher in
organs and tissues than in whole blood [133]. Tissue CsA concentrations were highest
in the pancreas, followed by the spleen, liver, kidney, lung, and heart. In a recent study
[137], analyses of CsA concentrations in kidney biopsies utilizing LC-MS/MS
confirmed previous study findings and demonstrated a CsA concentration that was
approximately four times higher in kidney tissue than in whole blood. A poor
correlation between CsA in blood and liver biopsies obtained from liver transplant
recipients has been reported. Sandborn et al. [135] showed no differences in the blood
concentrations of CsA in patients with and without rejection. In contrast, the
hepatocytes level of CsA was approximately two times higher in patients without
autopsy-proven rejection compared to the rejection group. Moreover, little to no
correlation in CsA concentrations has been reported between the blood and the kidney
(r = 0.168, P>0.05) [137] or endomyocardial biopsies (r2 = 0.029, P = 0.48) [112].
28
Similar findings have been reported for TAC in liver transplant recipients [134]. There
was a trend detected in TAC hepatocyte concentrations based on the condition of the
allograft. The highest TAC levels were found in liver biopsies from patients with no
detected rejection (median = 144 ng/g), followed by patients with no current signs of
rejection but with subsequently demonstrated rejection (median = 87 ng/g). The lowest
concentrations were detected in patients with current rejection (median = 48 ng/g). In
contrast, all three groups showed no significant differences in plasma concentrations
(median = 0.9, 0.9 and 0.6 µg/L, respectively). Similar results were found in recent
studies using LC-MS/MS to evaluate the correlation between TAC concentrations in
C0 blood samples and liver tissues on day 5 and 7 after transplantation [117,136].
Concentrations of TAC in hepatocytes displayed a significant first-order exponential
correlation r2 = 0.720-0.96 with Banff scores (histological marker of rejection)
[117,136]. Higher concentrations of TAC in liver tissues were associated with lower
Banff scores and consequently fewer episodes of rejection [117,136]. In contrast, a
poor correlation has been reported between Banff scores and the blood level of TAC
(r2 = 0.0281) [117]. In kidney transplant recipients (2 patients) [138], a decrease in
TAC was observed in tissue and C0 whole blood over time (16-300 days) but, there
was no correlation between the two measurements.
Only one published study investigated the intra-tissue concentrations of MPA. This
study was performed using biopsies obtained from four kidney transplant patients. The
authors were unable to determine the association between plasma and intra-tissue
concentrations of MPA [139].
29
4.1. Effect of ABCB1 gene polymorphisms on tissues concentrations of
immunosuppressive agents
The inter-subject variability of P-gp substrates in tissues may be the result of genetic
polymorphisms in P-gp transporters. Indeed, significantly higher TAC concentrations
have been found in hepatic tissue from patients carrying alleles with reduced activity
[140]. There were significantly higher hepatic tissue TAC concentrations, expressed as
the geometric mean of the dose-normalized hepatic concentration, in carriers of the
reduced-activity 1199A allele (1199A) than in non-carriers (P=0.036).
Correspondingly, hepatic tissue obtained from carriers of the 236C>T and 2677G>T/A
alleles demonstrated a higher TAC concentration, expressed as the geometric mean of
the hepatic concentration (P = 0.014 and 0.035, respectively). Finally, although
CYP3A-metabolizing enzymes are expressed in hepatic tissues, they have no effect on
hepatocyte TAC concentrations [140]. In summary, the blood concentration of
immunosuppressive drugs in solid organ transplant recipients is a poor predictor of
intra-hepatocyte levels.
5. Conclusions and future prospective
Optimal exposure to immunosuppressant agents is required to improve allograft
survival and reduce toxicity. Despite its limitations, venous blood remains the
recommended medium for TDM of immunosuppressive agents. Limitations include
the lack of association with in situ concentrations and the invasiveness of the sample
collection. The introduction of LC-MS/MS into clinical practice has further
encouraged investigating alternative matrices to overcome these limitations.
30
Intracellular and intra-tissue immunosuppressant measurements are proven predictors
of allograft survival and toxicity. Nonetheless, the complexity associated with
obtaining and processing samples makes these approaches impractical for routine
TDM. The area under the concentration-time curve (AUC) and maximum
concentration (Cmax) are the best parameters to estimate because they correlate better
to the clinical outcome and toxicity when whole blood is used [1]. Unfortunately, the
estimation of AUC and Cmax requires multiple sampling over a dosing interval of up to
12 hours, which is unsuitable for routine TDM. The relatively simple sample
preparation procedures involved with fingerprick sampling offer a less invasive
alternative and the possibility of multiple self-home samplings. However, because
finger sampling utilizes whole blood, it provides drug measurements that are poorly
related to the concentration at the site of action. Finally, OF sampling provide a simple
process to quantify the free drug concentration in non-invasively collected samples
that can be easily collect by patients at home. Recently, multiple sampling of oral fluid
has been successfully used to individualize glucocorticoid replacement therapy in
patients with Addison’s disease [141]. If a good association is established between the
drug concentration in OF and the sites of action or blood-free fraction, OF has the
potential to replace blood drug measurements, making repeated sampling and
calculations of AUC and Cmax for the TDM of immunosuppressant agents feasible.
31
Table 1-1. Physiochemical properties of immunosuppressant drugs measured in oral fluids
32
Tabl
e 1-
2. P
ublis
hed
LC-M
S/M
S as
says
for q
uant
ifica
tion
of im
mun
osup
pres
sive
dru
gs in
ora
l flu
ids (
OF)
33
Tabl
e 1-
3. P
ublis
hed
LC-M
S/M
S as
says
for q
uant
ifica
tion
of im
mun
osup
pres
sive
drug
s in
drie
d bl
ood
spot
sam
ples
Dru
g Su
bj.
Bloo
d vo
lum
e/
dryi
ng
time
Car
d ty
pe/ c
ircl
e siz
e/ p
unch
size
Ex
trac
tion
met
hod
Stab
ility
C
hrom
atog
raph
ic C
ondi
tions
Add
ucts
/ Pr
ecur
sor
ion
(m/z
) >
prod
uct i
on
(m/z
)
Ref
.
CsA
NR
50µL
pi
pette
d V
enou
s bl
ood/
dr
ied
over
nigh
t/R
T
Wha
tman
90
3/ 8
mm
50%
MeO
H. S
hake
n at
RT/
soni
catio
n IV
: 20µ
L R
: 97%
.
17 d
ays a
t RT
45 d
ays a
t 4C
°
Gra
dien
t: H
2O (A
), M
eOH
(B)
both
con
tain
2 m
M a
mm
oniu
m
acet
ate/
0.1
FA
Colum
n: Xbridge™ RP18
(Wat
ers)
R
un ti
me:
4 m
ins.
LLO
Q: 2
5µg/
mL
[M+N
H4]
+
CsA
: 121
9>
1202
. IS
: CsD
[79]
CsA
RTR
s (n
=42)
, re
nal&
PT
Rs
(n=2
), LT
Rs
(n=1
1)
A d
rop
from
co
llect
ion
devi
se/d
ried
for
2hrs
Wha
tman
903
/ 4m
m
MeO
H. S
tirrin
g
IV: 35 μL
R
: NR
12 h
rs a
t 8-2
0 °C
Isoc
ratic
: 97%
MeO
H c
onta
ins 1
0 m
M a
mm
oniu
m a
ceta
te a
nd 0
.1%
ac
etic
aci
d C
olum
n: P
heny
l-Hex
yl-R
P (P
heno
men
ex).
Run
tim
e: 3
min
s LL
OQ
: 4.5
µg/L
[M+N
H4]
+
CsA
: 12
20>1
203
IS
: CsD
[15]
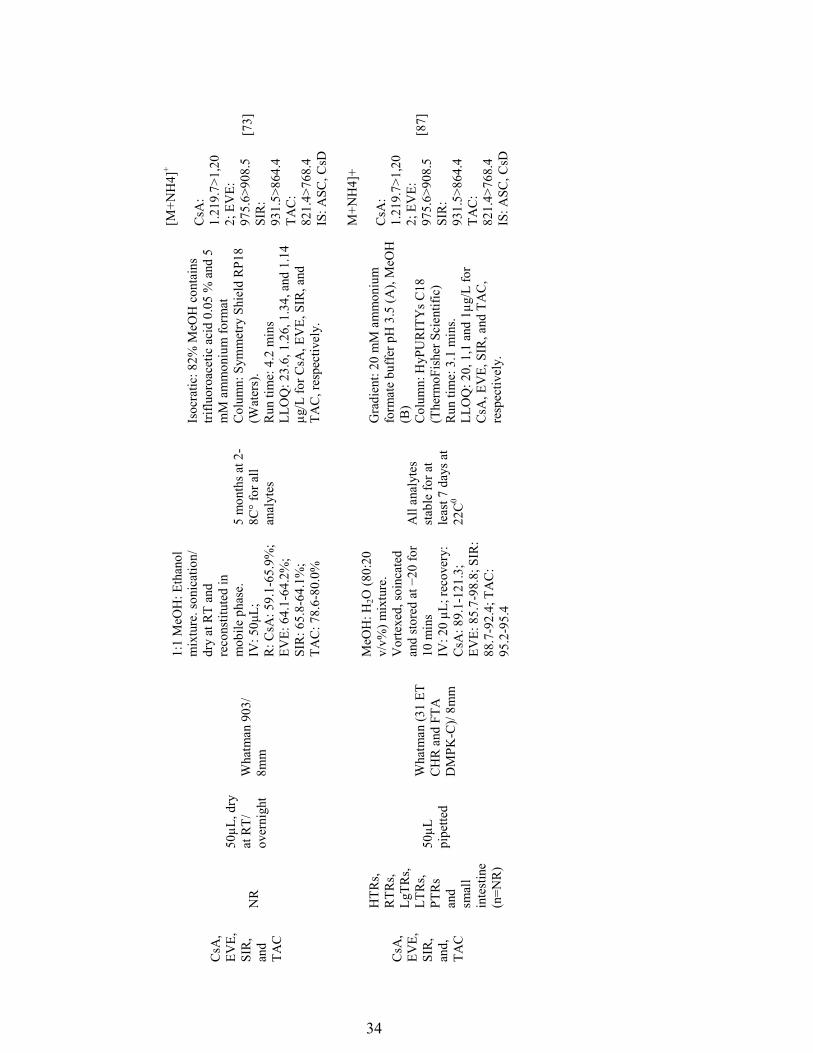
34
CsA
, EV
E,
SIR
, an
d TA
C
NR
50µL
, dry
at
RT/
ov
erni
ght
Wha
tman
903
/ 8m
m
1:1
MeO
H: E
than
ol
mix
ture
. son
icat
ion/
dr
y at
RT
and
reco
nstit
uted
in
mob
ile p
hase
. IV: 50μL;;
R: C
sA: 5
9.1-
65.9
%;
EVE:
64.
1-64
.2%
; SI
R: 6
5.8-
64.1
%;
TAC
: 78.
6-80
.0%
5 m
onth
s at 2
-8C
° for
all
anal
ytes
Isoc
ratic
: 82%
MeO
H c
onta
ins
triflu
oroa
cetic
aci
d 0.
05 %
and
5
mM
am
mon
ium
form
at
Col
umn:
Sym
met
ry S
hiel
d R
P18
(Wat
ers)
. R
un ti
me:
4.2
min
s LL
OQ
: 23.
6, 1
.26,
1.3
4, a
nd 1
.14
µg/L
for C
sA, E
VE,
SIR
, and
TA
C, r
espe
ctiv
ely.
[M+N
H4]
+
CsA
: 1.
219.
7>1,
202;
EV
E:
975.
6>90
8.5
SIR
: 93
1.5>
864.
4 TA
C:
821.
4>76
8.4
IS
: ASC
, CsD
[73]
CsA
, EV
E,
SIR
, an
d,
TAC
HTR
s, R
TRs,
LgTR
s, LT
Rs,
PTR
s an
d sm
all
inte
stin
e (n
=NR
)
50µL
pi
pette
d
Wha
tman
(31
ET
CH
R a
nd F
TA
DM
PK-C
)/ 8m
m
MeO
H: H
2O (8
0:20
v/
v%) m
ixtu
re.
Vor
texe
d, so
inca
ted
and stored at −20 for
10 m
ins
IV: 2
0 µL
; rec
over
y:
CsA
: 89.
1-12
1.3;
EV
E: 8
5.7-
98.8
; SIR
: 88
.7-9
2.4;
TA
C:
95.2
-95.
4
All
anal
ytes
st
able
for a
t le
ast 7
day
s at
22C
0
Gra
dien
t: 20
mM
am
mon
ium
fo
rmat
e bu
ffer
pH
3.5
(A),
MeO
H
(B)
Col
umn:
HyP
UR
ITY
s C18
(T
herm
oFis
her S
cien
tific
) R
un ti
me:
3.1
min
s.
LLO
Q: 2
0, 1
,1 a
nd 1
µg/L
for
CsA
, EV
E, S
IR, a
nd T
AC
, re
spec
tivel
y.
M+N
H4]
+
CsA
: 1.
219.
7>1,
202;
EV
E:
975.
6>90
8.5
SIR
: 93
1.5>
864.
4 TA
C:
821.
4>76
8.4
IS
: ASC
, CsD
[87]
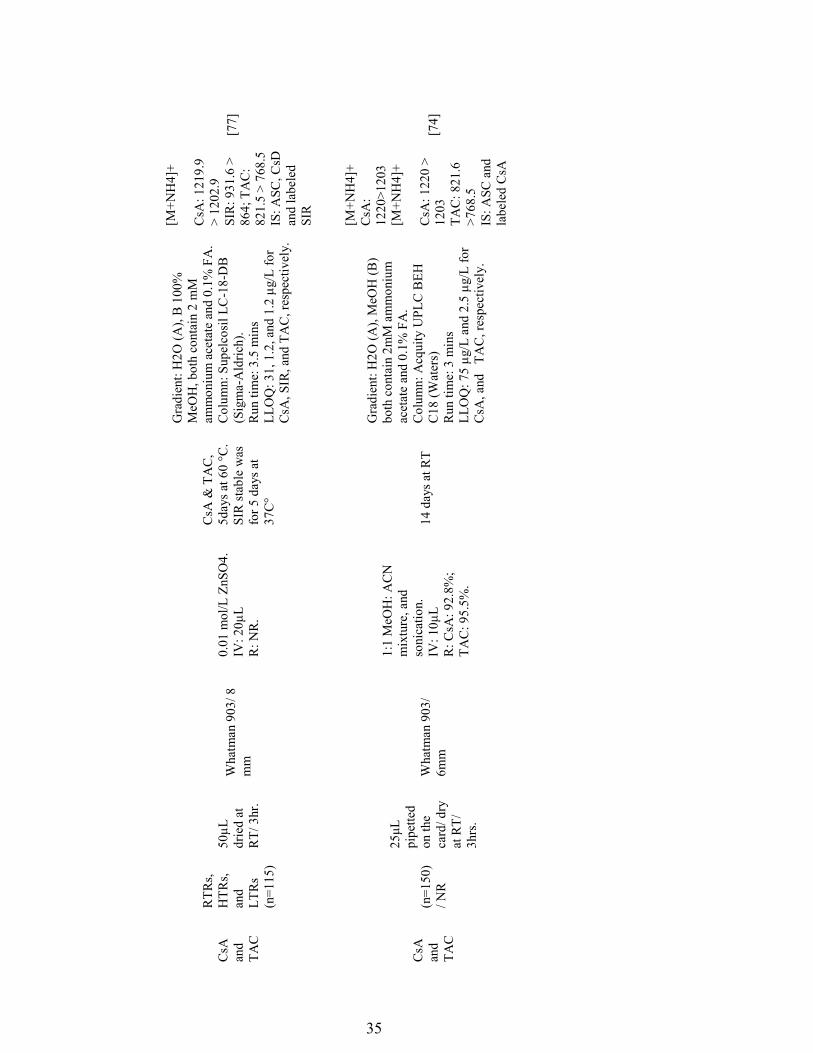
35
CsA
an
d TA
C
RTR
s, H
TRs,
and
LTR
s (n
=115
)
50µL
dr
ied
at
RT/
3hr
.
Wha
tman
903
/ 8
mm
0.01
mol
/L Z
nSO
4.
IV: 2
0µL
R: N
R.
CsA
& T
AC
, 5d
ays a
t 60
°C.
SIR
stab
le w
as
for 5
day
s at
37C
°
Gra
dien
t: H
2O (A
), B
100
%
MeO
H, b
oth
cont
ain
2 m
M
amm
oniu
m a
ceta
te a
nd 0
.1%
FA
. C
olum
n: S
upel
cosi
l LC
-18-
DB
(S
igm
a-A
ldric
h).
Run
tim
e: 3
.5 m
ins
LL
OQ
: 31,
1.2
, and
1.2
µg/
L fo
r C
sA, S
IR, a
nd T
AC
, res
pect
ivel
y.
[M+N
H4]
+
CsA
: 121
9.9
> 12
02.9
SI
R: 9
31.6
>
864;
TA
C:
821.
5 >
768.
5
IS: A
SC, C
sD
and
labe
led
SIR
[77]
CsA
an
d TA
C
(n=1
50)
/ NR
25μL
pi
pette
d on
the
card
/ dry
at
RT/
3h
rs.
Wha
tman
903
/ 6m
m
1:1
MeO
H: A
CN
m
ixtu
re, a
nd
soni
catio
n.
IV: 1
0µL
R: C
sA: 9
2.8%
; TA
C: 9
5.5%
.
14 d
ays a
t RT
Gra
dien
t: H
2O (A
), M
eOH
(B)
both
con
tain
2m
M a
mm
oniu
m
acet
ate
and
0.1%
FA
. C
olum
n: A
cqui
ty U
PLC
BEH
C
18 (W
ater
s)
Run
tim
e: 3
min
s LL
OQ
: 75
µg/L
and
2.5
µg/
L fo
r C
sA, a
nd
TAC
, res
pect
ivel
y.
[M+N
H4]
+ C
sA:
1220
>120
3
[M+N
H4]
+
CsA
: 122
0 >
1203
TA
C: 8
21.6
>7
68.5
IS
: ASC
and
la
bele
d C
sA
[74]
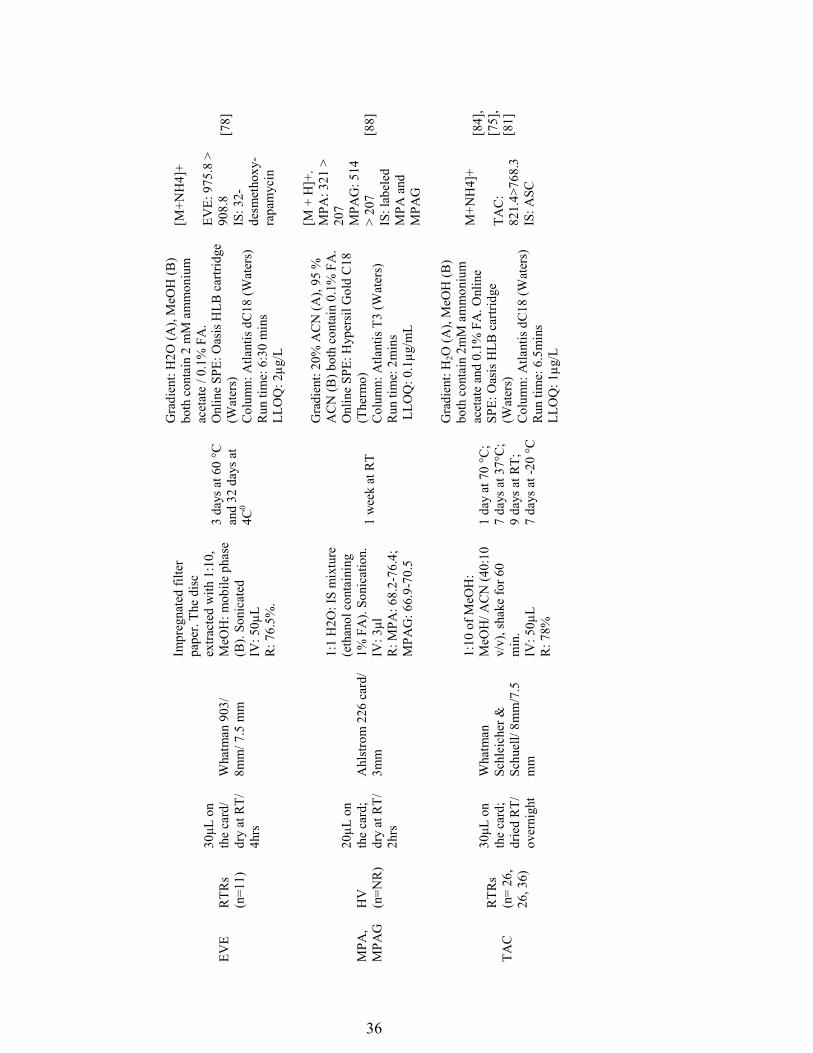
36
EVE
R
TRs
(n=1
1)
30μL
on
the
card
/ dr
y at
RT/
4h
rs
Wha
tman
903
/ 8m
m/ 7
.5 m
m
Impr
egna
ted
filte
r pa
per.
The
disc
ex
tract
ed w
ith 1
:10,
M
eOH
: mob
ile p
hase
(B
). So
nica
ted
IV: 5
0µL
R: 7
6.5%
.
3 da
ys a
t 60
°C
and
32 d
ays a
t 4C
0
Gra
dien
t: H
2O (A
), M
eOH
(B)
both
con
tain
2 m
M a
mm
oniu
m
acet
ate
/ 0.1
% F
A.
Onl
ine
SPE:
Oas
is H
LB c
artri
dge
(Wat
ers)
C
olum
n: A
tlant
is d
C18
(Wat
ers)
R
un ti
me:
6:3
0 m
ins
LLO
Q: 2
µg/L
[M+N
H4]
+
EVE:
975
.8 >
90
8.8
IS
: 32-
desm
etho
xy-
rapa
myc
in
[78]
MPA
, M
PAG
H
V
(n=N
R)
20µL
on
the
card
; dr
y at
RT/
2h
rs
Ahl
stro
m 2
26 c
ard/
3m
m
1:1
H2O
: IS
mix
ture
(e
than
ol c
onta
inin
g 1%
FA
). So
nica
tion.
IV
: 3μl
R: M
PA: 6
8.2-
76.4
; M
PAG
: 66.
9-70
.5
1 w
eek
at R
T
Gra
dien
t: 20
% A
CN
(A),
95 %
A
CN
(B) b
oth
cont
ain
0.1%
FA
. O
nlin
e SP
E: H
yper
sil G
old
C18
(T
herm
o)
Col
umn:
Atla
ntis
T3
(Wat
ers)
R
un ti
me:
2m
ins
LLO
Q: 0
.1µg
/mL
[M +
H]+
. M
PA: 3
21 >
20
7
MPA
G: 5
14
> 20
7
IS: l
abel
ed
MPA
and
M
PAG
[88]
TAC
R
TRs
(n=
26,
26, 3
6)
30μL
on
the
card
; dr
ied
RT/
ov
erni
ght
Wha
tman
Sc
hlei
cher
&
Schu
ell/
8mm
/7.5
m
m
1:10
of M
eOH
: M
eOH
/ AC
N (4
0:10
v/
v), s
hake
for 6
0 m
in.
IV: 5
0µL
R: 7
8%
1 da
y at
70
°C;
7 da
ys a
t 37°
C;
9 da
ys a
t RT;
7
days
at -
20 °C
Gra
dien
t: H
2O (A
), M
eOH
(B)
both
con
tain
2m
M a
mm
oniu
m
acet
ate
and
0.1%
FA
. Onl
ine
SPE:
Oas
is H
LB c
artri
dge
(Wat
ers)
C
olum
n: A
tlant
is d
C18
(Wat
ers)
R
un ti
me:
6.5
min
s LL
OQ
: 1µg
/L
M+N
H4]
+
TAC
: 82
1.4>
768.
3 IS
: ASC
[84]
, [7
5],
[81]
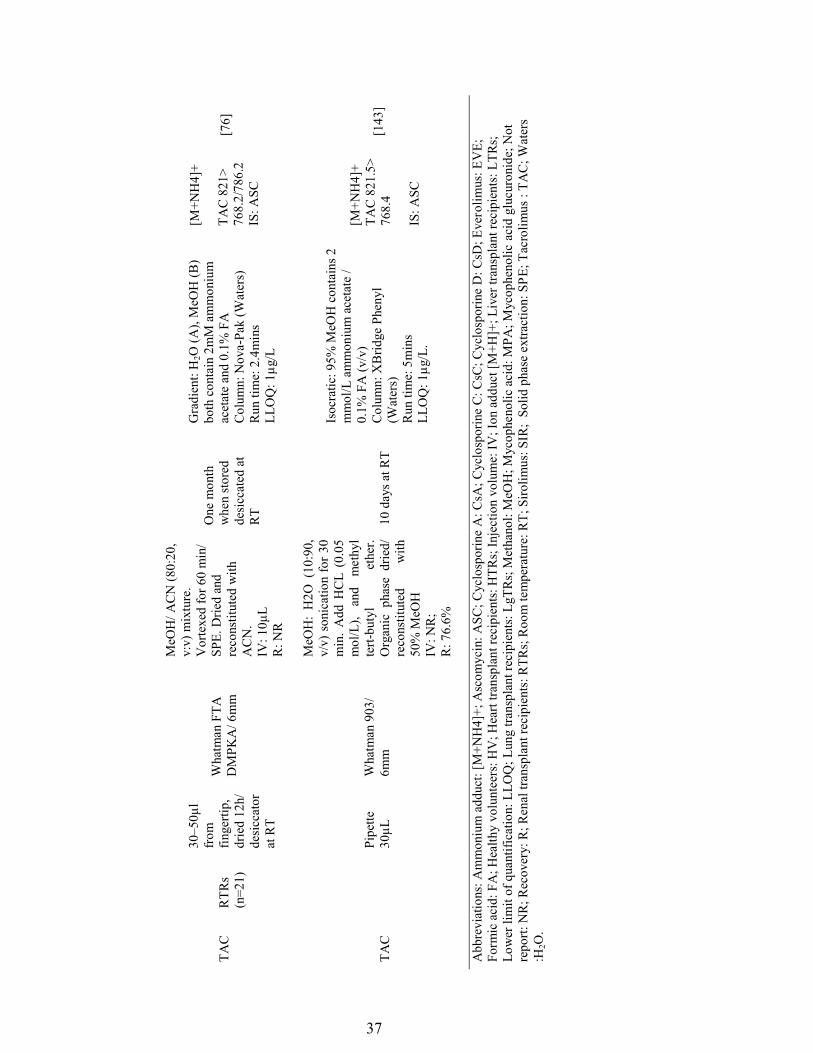
37
TAC
RTR
s (n
=21)
30–5
0µl
from
fin
gerti
p,
drie
d 12
h/
desi
ccat
or
at R
T
Wha
tman
FTA
D
MPK
A/ 6
mm
MeO
H/ A
CN
(80:
20,
v:v)
mix
ture
. V
orte
xed
for 6
0 m
in/
SPE.
Drie
d an
d re
cons
titut
ed w
ith
AC
N.
IV: 1
0µL
R: N
R
One
mon
th
whe
n st
ored
de
sicc
ated
at
RT
Gra
dien
t: H
2O (A
), M
eOH
(B)
both
con
tain
2m
M a
mm
oniu
m
acet
ate
and
0.1%
FA
C
olum
n: N
ova-
Pak
(Wat
ers)
R
un ti
me:
2.4
min
s LL
OQ
: 1µg
/L
[M+N
H4]
+
TAC
821
> 76
8.2/
786.
2
IS: A
SC
[76]
TAC
Pipe
tte
30µL
Wha
tman
903
/ 6m
m
MeO
H:
H2O
(10
:90,
v/
v) s
onic
atio
n fo
r 30
min
. A
dd H
CL
(0.0
5 m
ol/L
), an
d m
ethy
l te
rt-bu
tyl
ethe
r. O
rgan
ic p
hase
drie
d/
reco
nstit
uted
w
ith
50%
MeO
H
IV: N
R;
R: 7
6.6%
10 d
ays a
t RT
Isoc
ratic
: 95%
MeO
H c
onta
ins 2
m
mol
/L a
mm
oniu
m a
ceta
te /
0.1%
FA
(v/v
) C
olum
n: X
Brid
ge P
heny
l (W
ater
s)
Run
tim
e: 5
min
s LL
OQ
: 1µg
/L.
[M+N
H4]
+ TA
C 8
21.5
> 76
8.4
IS: A
SC
[143
]
Abb
revi
atio
ns: A
mm
oniu
m a
dduc
t: [M
+NH
4]+;
Asc
omyc
in: A
SC; C
yclo
spor
ine
A: C
sA; C
yclo
spor
ine
C: C
sC; C
yclo
spor
ine
D: C
sD; E
vero
limus
: EV
E;
Form
ic a
cid:
FA
; Hea
lthy
volu
ntee
rs: H
V; H
eart
trans
plan
t rec
ipie
nts:
HTR
s; In
ject
ion
volu
me:
IV; I
on a
dduc
t [M
+H]+
; Liv
er tr
ansp
lant
reci
pien
ts: L
TRs;
Lo
wer
lim
it of
qua
ntifi
catio
n: L
LOQ
; Lun
g tra
nspl
ant r
ecip
ient
s: L
gTR
s; M
etha
nol:
MeO
H; M
ycop
heno
lic a
cid:
MPA
; Myc
ophe
nolic
aci
d gl
ucur
onid
e; N
ot
repo
rt: N
R; R
ecov
ery:
R; R
enal
tran
spla
nt re
cipi
ents
: RTR
s; R
oom
tem
pera
ture
: RT;
Siro
limus
: SIR
; So
lid p
hase
ext
ract
ion:
SPE
; Tac
rolim
us :
TAC
; Wat
ers
:H2O
.
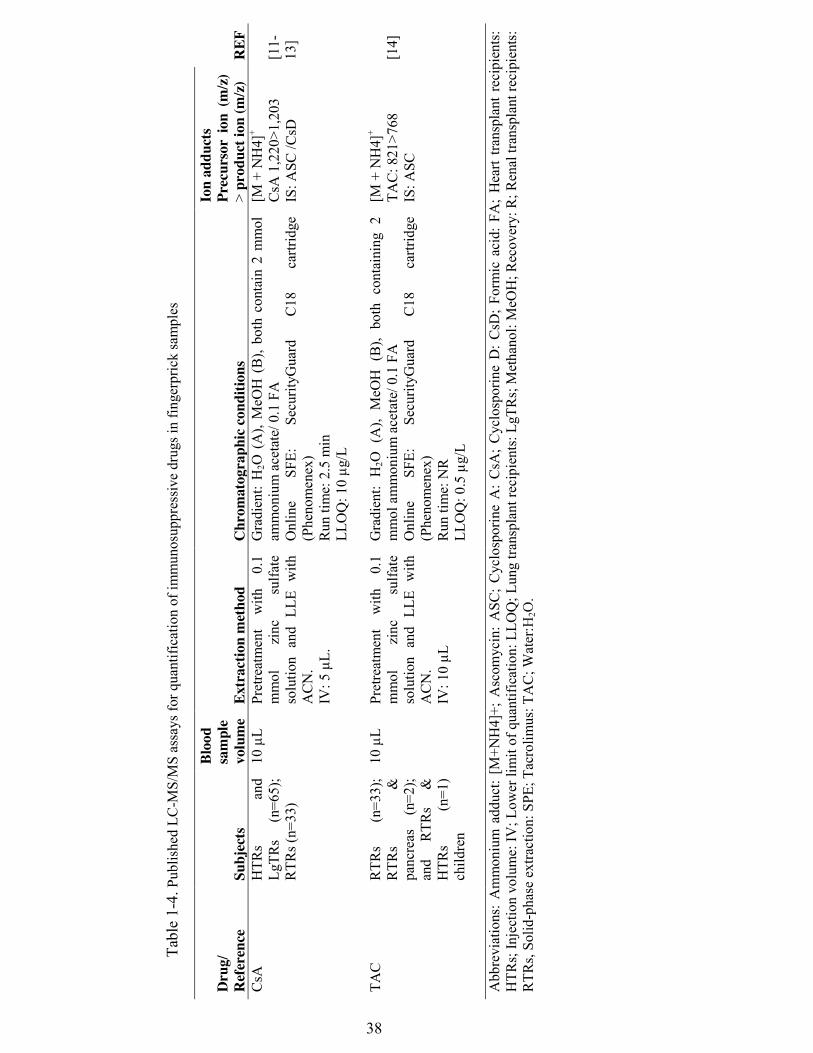
38
Tabl
e 1-
4. P
ublis
hed
LC-M
S/M
S as
says
for q
uant
ifica
tion
of im
mun
osup
pres
sive
drug
s in
finge
rpric
k sa
mpl
es
Dru
g/
Ref
eren
ce
Subj
ects
Bloo
d sa
mpl
e vo
lum
e Ex
trac
tion
met
hod
Chr
omat
ogra
phic
cond
ition
s
Ion
addu
cts
Prec
urso
r io
n (m
/z)
> pr
oduc
t ion
(m/z
) R
EF
CsA
HTR
s an
d Lg
TRs
(n=6
5);
RTR
s (n=
33)
10 µ
L
Pret
reat
men
t w
ith
0.1
mm
ol
zinc
su
lfate
so
lutio
n an
d LL
E w
ith
AC
N.
IV: 5
µL.
Gra
dien
t: H
2O (
A),
MeO
H (
B),
both
con
tain
2 m
mol
am
mon
ium
ace
tate
/ 0.1
FA
O
nlin
e SF
E:
Secu
rityG
uard
C
18
cartr
idge
(P
heno
men
ex)
Run
tim
e: 2
.5 m
in
LLO
Q: 1
0 µg
/L
[M +
NH
4]+
CsA
1,2
20>1
,203
IS
: ASC
/CsD
[11-
13]
TAC
R
TRs
(n=3
3);
RTR
s &
pa
ncre
as
(n=2
); an
d R
TRs
&
HTR
s (n
=1)
child
ren
10 µ
L Pr
etre
atm
ent
with
0.
1 m
mol
zi
nc
sulfa
te
solu
tion
and
LLE
with
A
CN
. IV
: 10
µL
Gra
dien
t: H
2O (
A),
MeO
H (
B),
both
con
tain
ing
2 m
mol
am
mon
ium
ace
tate
/ 0.1
FA
O
nlin
e SF
E:
Secu
rityG
uard
C
18
cartr
idge
(P
heno
men
ex)
Run
tim
e: N
R
LLO
Q: 0
.5 µ
g/L
[M +
NH
4]+
TAC
: 821
>768
IS
: ASC
[14]
Abb
revi
atio
ns:
Am
mon
ium
add
uct:
[M+N
H4]
+; A
scom
ycin
: A
SC;
Cyc
losp
orin
e A
: C
sA;
Cyc
losp
orin
e D
: CsD
; Fo
rmic
aci
d: F
A;
Hea
rt tra
nspl
ant
reci
pien
ts:
HTR
s; In
ject
ion
volu
me:
IV; L
ower
lim
it of
qua
ntifi
catio
n: L
LOQ
; Lun
g tra
nspl
ant r
ecip
ient
s: L
gTR
s; M
etha
nol:
MeO
H; R
ecov
ery:
R; R
enal
tran
spla
nt re
cipi
ents
: R
TRs,
Solid
-pha
se e
xtra
ctio
n: S
PE; T
acro
limus
: TA
C; W
ater
:H2O
.
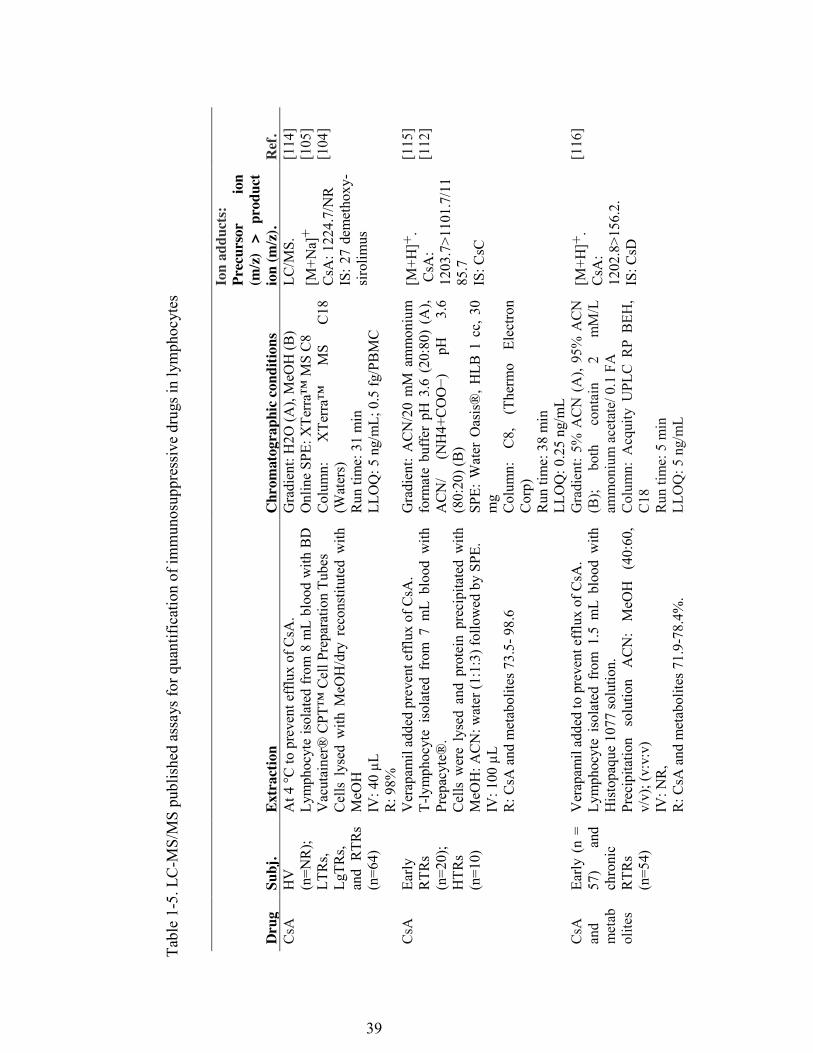
39
Tabl
e 1-
5. L
C-M
S/M
S pu
blis
hed
assa
ys fo
r qua
ntifi
catio
n of
imm
unos
uppr
essi
ve d
rugs
in ly
mph
ocyt
es
Dru
g Su
bj.
Extr
actio
n C
hrom
atog
raph
ic co
nditi
ons
Ion
addu
cts:
Pr
ecur
sor
ion
(m/z
) >
prod
uct
ion
(m/z
). R
ef.
CsA
H
V
(n=N
R);
LT
Rs,
LgTR
s, an
d R
TRs
(n=6
4)
At 4
°C to
pre
vent
eff
lux
of C
sA.
Lym
phoc
yte
isol
ated
from
8 m
L bl
ood
with
BD
Vacutainer® CPT
™ Cell Preparation Tubes
Cel
ls l
ysed
with
MeO
H/d
ry r
econ
stitu
ted
with
M
eOH
IV
: 40
µL
R: 9
8%
Gra
dien
t: H
2O (A
), M
eOH
(B)
Online SPE: XTerra™
MS C8
Colum
n:
XTerra™
MS
C18
(Wat
ers)
R
un ti
me:
31
min
LL
OQ
: 5 n
g/m
L; 0
.5 fg
/PB
MC
LC/M
S.
[M+N
a]+
C
sA: 1
224.
7/N
R IS
: 27
dem
etho
xy-
siro
limus
[114
] [1
05]
[104
]
CsA
Early
R
TRs
(n=2
0);
HTR
s (n
=10)
Ver
apam
il ad
ded
prev
ent e
fflu
x of
CsA
. T-
lym
phoc
yte
isol
ated
fro
m 7
mL
bloo
d w
ith
Prep
acyt
e®.
Cel
ls w
ere
lyse
d an
d pr
otei
n pr
ecip
itate
d w
ith
MeO
H: A
CN
: wat
er (1
:1:3
) fol
low
ed b
y SP
E.
IV: 1
00 µ
L
R: C
sA a
nd m
etab
olite
s 73.
5- 9
8.6
Gra
dien
t: A
CN
/20
mM
am
mon
ium
fo
rmat
e bu
ffer
pH
3.6
(20
:80)
(A
), ACN/
(NH4+COO−)
pH
3.6
(80:
20) (
B)
SPE:
Wat
er O
asis
®, H
LB 1
cc,
30
mg
C
olum
n:
C8,
(T
herm
o El
ectro
n C
orp)
R
un ti
me:
38
min
LL
OQ
: 0.2
5 ng
/mL
[M+H
]+.
CsA
: 12
03.7
>110
1.7/
1185
.7
IS: C
sC
[115
] [1
12]
CsA
an
d m
etab
olite
s
Early
(n
= 57
) an
d ch
roni
c R
TRs
(n=5
4)
Ver
apam
il ad
ded
to p
reve
nt e
fflu
x of
CsA
. Ly
mph
ocyt
e is
olat
ed f
rom
1.5
mL
bloo
d w
ith
His
topa
que
1077
solu
tion.
Pr
ecip
itatio
n so
lutio
n A
CN
: M
eOH
(4
0:60
, v/
v); (
v:v:
v)
IV: N
R,
R: C
sA a
nd m
etab
olite
s 71.
9-78
.4%
.
Gra
dien
t: 5%
AC
N (
A),
95%
AC
N
(B);
both
co
ntai
n 2
mM
/L
amm
oniu
m a
ceta
te/ 0
.1 F
A
Col
umn:
Acq
uity
UPL
C R
P B
EH,
C18
R
un ti
me:
5 m
in
LLO
Q: 5
ng/
mL
[M+H
]+.
CsA
: 12
02.8
>156
.2.
IS: C
sD
[116
]
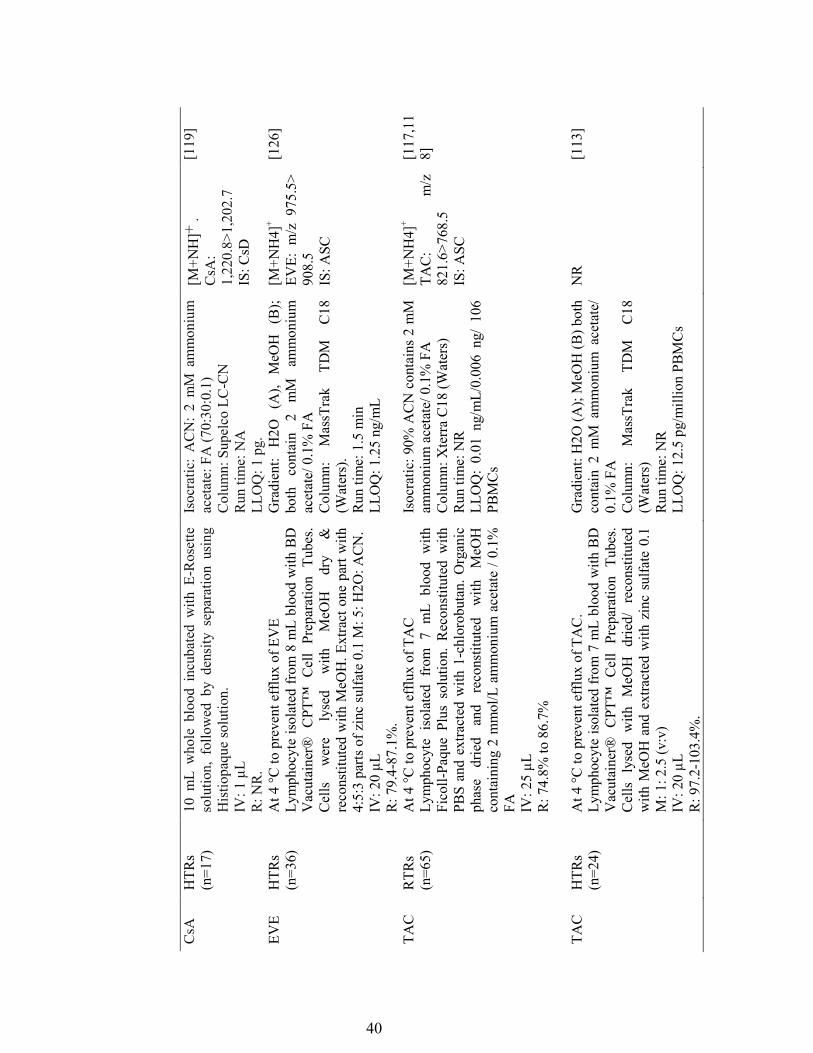
40
CsA
H
TRs
(n=1
7)
10 m
L w
hole
blo
od i
ncub
ated
with
E-R
oset
te
solu
tion,
fol
low
ed b
y de
nsity
sep
arat
ion
usin
g H
istio
paqu
e so
lutio
n.
IV: 1
µL
R: N
R.
Isoc
ratic
: A
CN
: 2
mM
am
mon
ium
ac
etat
e: F
A (7
0:30
:0.1
) C
olum
n: S
upel
co L
C-C
N
Run
tim
e: N
A
LLO
Q: 1
pg.
[M+N
H]+
.
CsA
: 1,
220.
8>1,
202.
7 IS
: CsD
[119
]
EVE
HTR
s (n
=36)
A
t 4 °C
to p
reve
nt e
fflu
x of
EV
E
Lym
phoc
yte
isol
ated
from
8 m
L bl
ood
with
BD
Vacutainer® C
PT™ C
ell Preparation Tubes.
Cel
ls
wer
e ly
sed
with
M
eOH
dr
y &
re
cons
titut
ed w
ith M
eOH
. Ext
ract
one
par
t with
4:
5:3
parts
of z
inc
sulfa
te 0
.1 M
: 5: H
2O: A
CN
. IV
: 20
µL
R: 7
9.4-
87.1
%.
Gra
dien
t: H
2O
(A),
MeO
H
(B);
both
co
ntai
n 2
mM
am
mon
ium
ac
etat
e/ 0
.1%
FA
C
olum
n:
Mas
sTra
k TD
M
C18
(W
ater
s).
Run
tim
e: 1
.5 m
in
LLO
Q: 1
.25
ng/m
L
[M+N
H4]
+
EVE:
m/z
975
.5>
908.
5
IS: A
SC
[126
]
TAC
RTR
s (n
=65)
At 4
°C to
pre
vent
eff
lux
of T
AC
Ly
mph
ocyt
e is
olat
ed f
rom
7 m
L bl
ood
with
Fi
coll-
Paqu
e Pl
us s
olut
ion.
Rec
onst
itute
d w
ith
PBS
and
extra
cted
with
1-c
hlor
obut
an. O
rgan
ic
phas
e dr
ied
and
reco
nstit
uted
w
ith
MeO
H
cont
aini
ng 2
mm
ol/L
am
mon
ium
ace
tate
/ 0.
1%
FA
IV: 2
5 µL
R
: 74.
8% to
86.
7%
Isoc
ratic
: 90%
AC
N c
onta
ins
2 m
M
amm
oniu
m a
ceta
te/ 0
.1%
FA
C
olum
n: X
terr
a C
18 (W
ater
s)
Run
tim
e: N
R
LLO
Q:
0.01
ng/
mL/
0.00
6 ng
/ 10
6 PB
MC
s
[M+N
H4]
+
TAC
: m
/z
821.
6>76
8.5
IS
: ASC
[117
,11
8]
TAC
HTR
s (n
=24)
A
t 4 °C
to p
reve
nt e
fflu
x of
TA
C.
Lym
phoc
yte
isol
ated
from
7 m
L bl
ood
with
BD
Vacutainer® C
PT™ C
ell
Prep
arat
ion
Tube
s. C
ells
lys
ed w
ith M
eOH
drie
d/ r
econ
stitu
ted
with
MeO
H a
nd e
xtra
cted
with
zin
c su
lfate
0.1
M
: 1: 2
.5 (v
:v)
IV: 2
0 µL
R
: 97.
2-10
3.4%
.
Gra
dien
t: H
2O (A
); M
eOH
(B) b
oth
cont
ain
2 m
M a
mm
oniu
m a
ceta
te/
0.1%
FA
C
olum
n:
Mas
sTra
k TD
M
C18
(W
ater
s)
Run
tim
e: N
R
LLO
Q: 1
2.5
pg/m
illio
n PB
MC
s
NR
[1
13]
41
A
bbre
viat
ions
: Am
mon
ium
add
uct:
[M+N
H4]
+; A
scom
ycin
: ASC
; Cyc
losp
orin
e A
: CsA
; Cyc
losp
orin
e C:
CsC
; Cyc
losp
orin
e D
: C
sD;
Ever
olim
us:
EVE;
For
mic
aci
d: F
A;
Hea
rt tra
nspl
ant r
ecip
ient
s: H
TRs;
Inj
ectio
n vo
lum
e: I
V;
Ion
addu
ct [
M+H
]+;
Live
r tra
nspl
ant
reci
pien
ts:
LTRs
; Lo
wer
lim
it of
qua
ntifi
catio
n: L
LOQ
; Lu
ng t
rans
plan
t re
cipi
ents
: Lg
TRs;
Met
hano
l: M
eOH
; N
ot
repo
rted:
NR
; Ph
osph
ate
buff
er s
olut
ion:
PB
S; R
ecov
ery:
R;
Ren
al t
rans
plan
t re
cipi
ents
: RT
Rs,
Solid
-pha
se e
xtra
ctio
n: S
PE;
Tacr
olim
us: T
AC
.
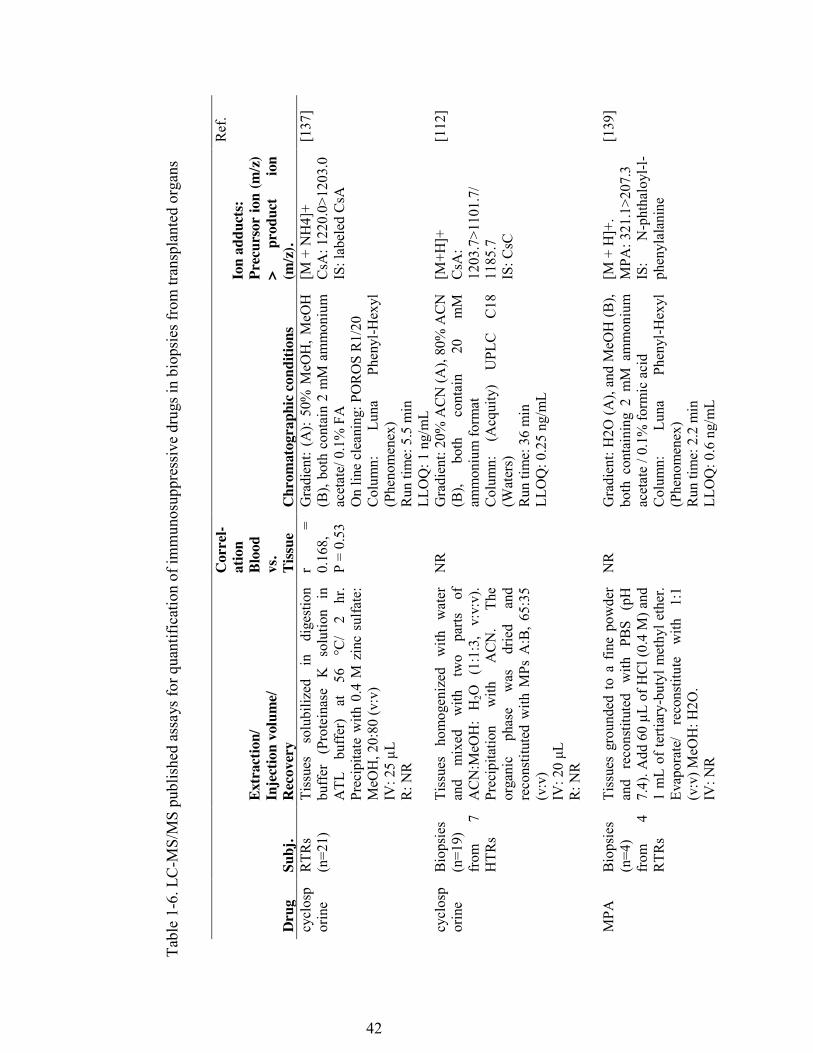
42
Tabl
e 1-
6. L
C-M
S/M
S pu
blis
hed
assa
ys fo
r qua
ntifi
catio
n of
imm
unos
uppr
essi
ve d
rugs
in b
iops
ies f
rom
tran
spla
nted
org
ans
Dru
g Su
bj.
Extr
actio
n/
Inje
ctio
n vo
lum
e/
Rec
over
y
Cor
rel-
atio
n Bl
ood
vs.
Tiss
ue
Chr
omat
ogra
phic
cond
ition
s
Ion
addu
cts:
Pr
ecur
sor
ion
(m/z
) >
prod
uct
ion
(m/z
).
Ref
.
cycl
osp
orin
e R
TRs
(n=2
1)
Tiss
ues
solu
biliz
ed
in
dige
stio
n bu
ffer
(P
rote
inas
e K
so
lutio
n in
A
TL
buff
er)
at
56
°C/
2 hr
. Pr
ecip
itate
with
0.4
M z
inc
sulfa
te:
MeO
H, 2
0:80
(v:v
) IV
: 25
µL
R: N
R
r =
0.16
8,
P =
0.53
Gra
dien
t: (A
): 50
% M
eOH
, MeO
H
(B),
both
con
tain
2 m
M a
mm
oniu
m
acet
ate/
0.1
% F
A
On
line
clea
ning
: PO
RO
S R
1/20
C
olum
n:
Luna
Ph
enyl
-Hex
yl
(Phe
nom
enex
) R
un ti
me:
5.5
min
LL
OQ
: 1 n
g/m
L
[M +
NH
4]+
CsA
: 122
0.0>
1203
.0
IS: l
abel
ed C
sA
[137
]
cycl
osp
orin
e B
iops
ies
(n=1
9)
from
7
HTR
s
Tiss
ues
hom
ogen
ized
w
ith
wat
er
and
mix
ed
with
tw
o pa
rts
of
AC
N:M
eOH
: H
2O
(1:1
:3,
v:v:
v).
Prec
ipita
tion
with
A
CN
. Th
e or
gani
c ph
ase
was
dr
ied
and
reco
nstit
uted
with
MPs
A:B
, 65:
35
(v:v
) IV: 20 μL
R
: NR
NR
G
radi
ent:
20%
AC
N (A
), 80
% A
CN
(B
), bo
th
cont
ain
20
mM
am
mon
ium
form
at
Col
umn:
(A
cqui
ty)
UPL
C
C18
(W
ater
s)
Run
tim
e: 3
6 m
in
LLO
Q: 0
.25
ng/m
L
[M+H
]+
CsA
: 12
03.7
>110
1.7/
11
85.7
IS
: CsC
[112
]
MPA
Bio
psie
s (n
=4)
from
4
RTR
s
Tiss
ues
grou
nded
to
a fin
e po
wde
r an
d re
cons
titut
ed
with
PB
S (p
H
7.4)
. Add
60
µL o
f HCl
(0.4
M) a
nd
1 m
L of
terti
ary-
buty
l met
hyl e
ther
. Ev
apor
ate/
re
cons
titut
e w
ith
1:1
(v:v
) MeO
H: H
2O.
IV: N
R
NR
G
radi
ent:
H2O
(A),
and
MeO
H (B
), bo
th c
onta
inin
g 2
mM
am
mon
ium
ac
etat
e / 0
.1%
form
ic a
cid
Col
umn:
Lu
na
Phen
yl-H
exyl
(P
heno
men
ex)
Run
tim
e: 2
.2 m
in
LLO
Q: 0
.6 n
g/m
L
[M +
H]+
. M
PA: 3
21.1
>207
.3
IS:
N-p
htha
loyl
-l-ph
enyl
alan
ine
[139
]
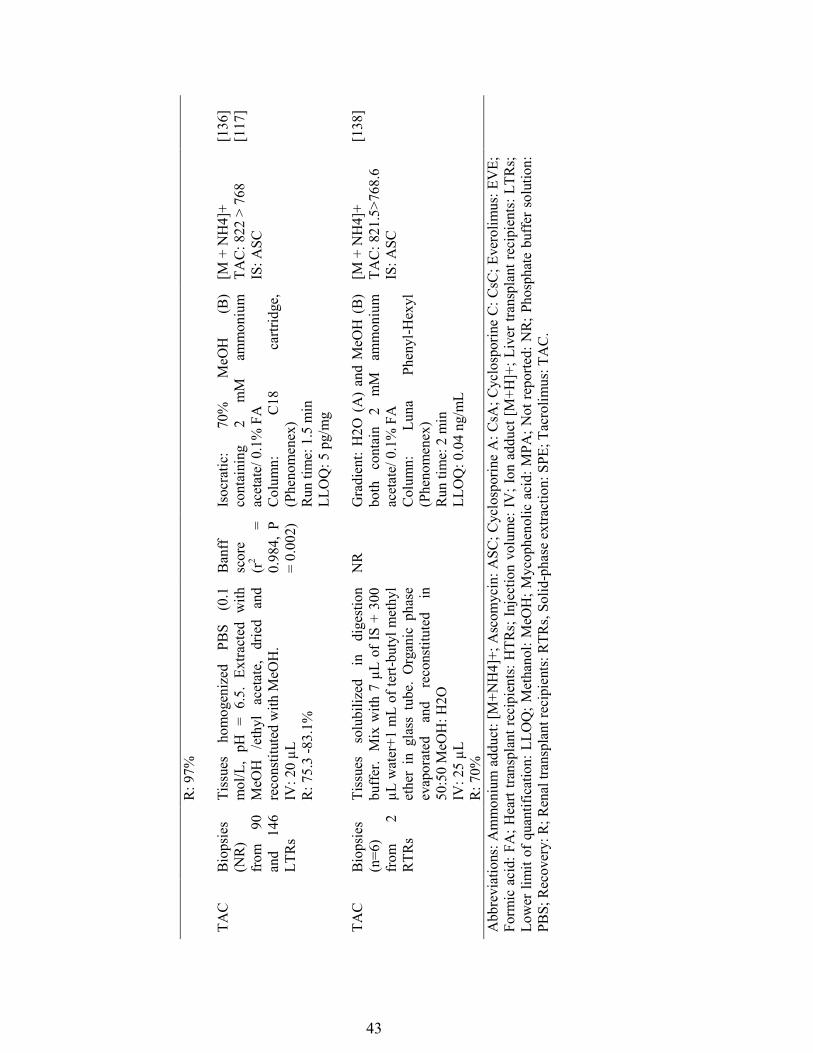
43
R: 9
7%
TA
C B
iops
ies
(NR
) fr
om
90
and
146
LTR
s
Tiss
ues
hom
ogen
ized
PB
S (0
.1
mol
/L,
pH =
6.5
. Ex
tract
ed w
ith
MeO
H
/eth
yl
acet
ate,
dr
ied
and
reco
nstit
uted
with
MeO
H.
IV: 2
0 µL
R
: 75.
3 -8
3.1%
Ban
ff
scor
e (r
2 =
0.98
4, P
=
0.00
2)
Isoc
ratic
: 70
%
MeO
H
(B)
cont
aini
ng
2 m
M
amm
oniu
m
acet
ate/
0.1
% F
A
Col
umn:
C
18
cartr
idge
, (P
heno
men
ex)
Run
tim
e: 1
.5 m
in
LLO
Q: 5
pg/
mg
[M +
NH
4]+
TAC
: 822
> 7
68
IS: A
SC
[136
] [1
17]
TAC
Bio
psie
s (n
=6)
from
2
RTR
s
Tiss
ues
solu
biliz
ed
in
dige
stio
n bu
ffer
. M
ix w
ith 7
µL
of IS
+ 3
00
µL w
ater
+1 m
L of
tert-
buty
l met
hyl
ethe
r in
gla
ss t
ube.
Org
anic
pha
se
evap
orat
ed
and
reco
nstit
uted
in
50
:50
MeO
H: H
2O
IV: 2
5 µL
R
: 70%
NR
G
radi
ent:
H2O
(A
) an
d M
eOH
(B
) bo
th
cont
ain
2 m
M
amm
oniu
m
acet
ate/
0.1
% F
A
Col
umn:
Lu
na
Phen
yl-H
exyl
(P
heno
men
ex)
Run
tim
e: 2
min
LL
OQ
: 0.0
4 ng
/mL
[M +
NH
4]+
TAC
: 821
.5>7
68.6
IS
: ASC
[138
]
Abb
revi
atio
ns: A
mm
oniu
m a
dduc
t: [M
+NH
4]+;
Asc
omyc
in: A
SC; C
yclo
spor
ine
A: C
sA; C
yclo
spor
ine
C: C
sC; E
vero
limus
: EV
E;
Form
ic a
cid:
FA
; Hea
rt tra
nspl
ant r
ecip
ient
s: H
TRs;
Inje
ctio
n vo
lum
e: IV
; Ion
add
uct [
M+H
]+; L
iver
tran
spla
nt re
cipi
ents
: LTR
s; Lo
wer
lim
it of
qua
ntifi
catio
n: L
LOQ
; Met
hano
l: M
eOH
; Myc
ophe
nolic
aci
d: M
PA; N
ot re
porte
d: N
R; P
hosp
hate
buf
fer s
olut
ion:
PB
S; R
ecov
ery:
R; R
enal
tran
spla
nt re
cipi
ents
: RTR
s, So
lid-p
hase
ext
ract
ion:
SPE
; Tac
rolim
us: T
AC
.
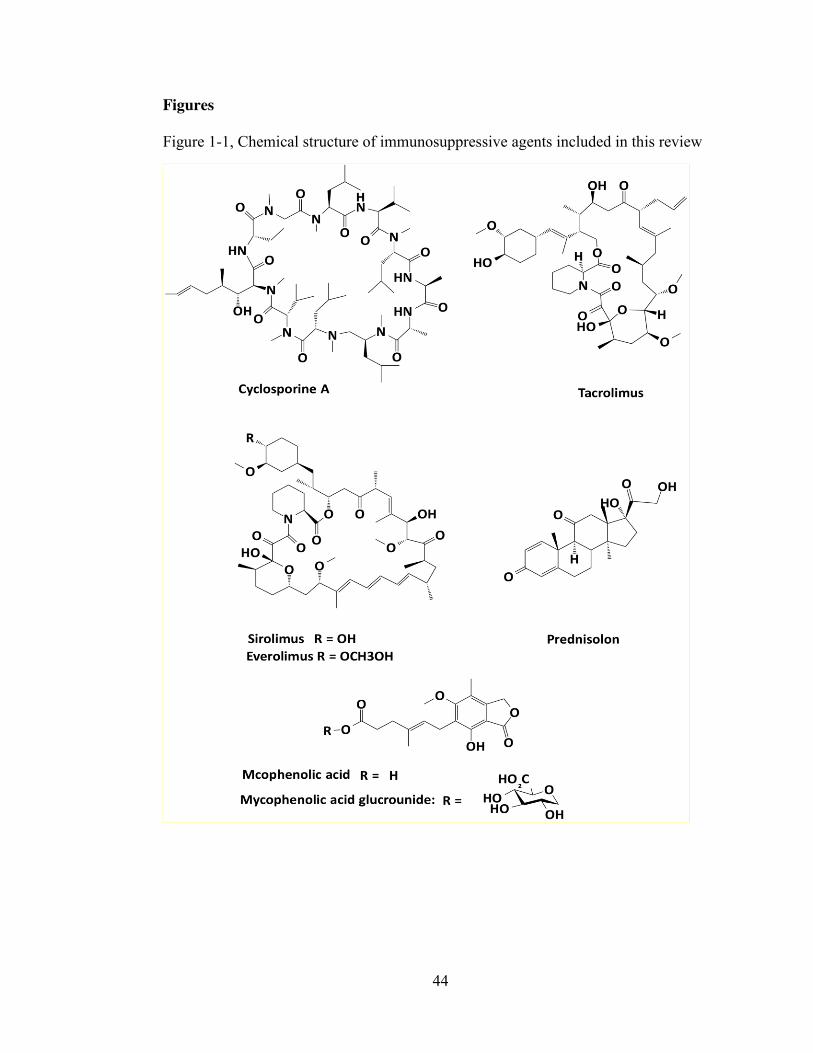
44
Figures
Figure 1-1, Chemical structure of immunosuppressive agents included in this review
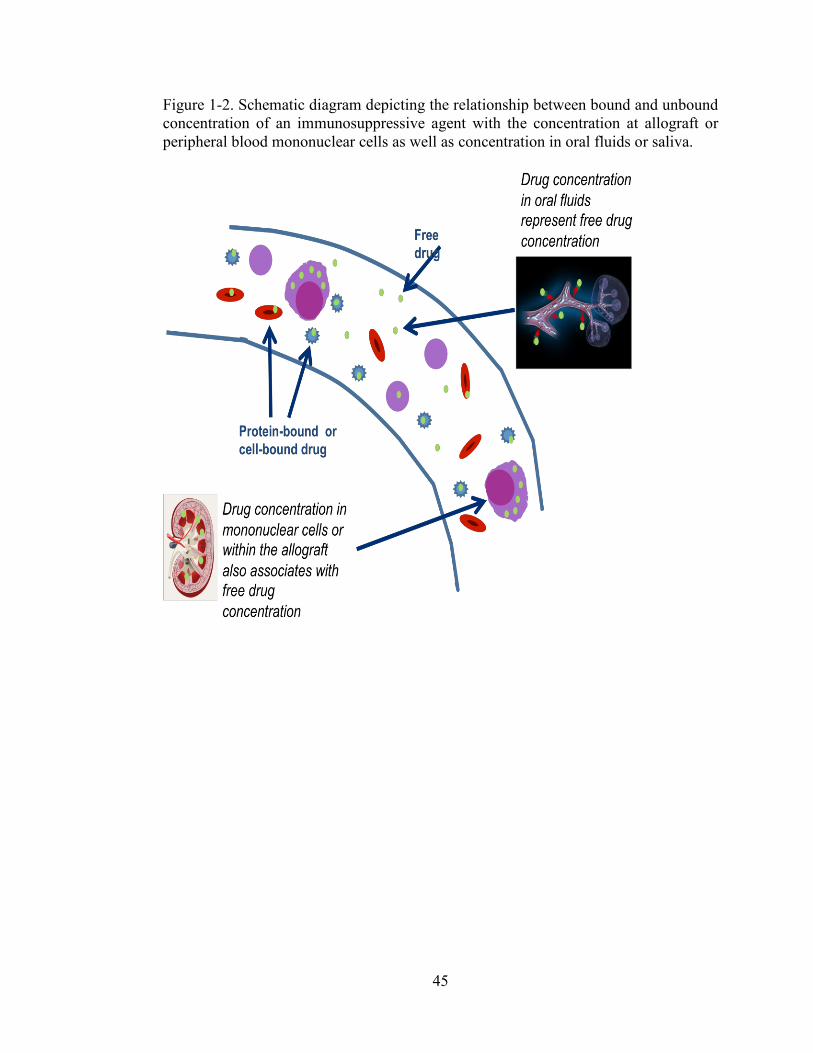
45
Figure 1-2. Schematic diagram depicting the relationship between bound and unbound concentration of an immunosuppressive agent with the concentration at allograft or peripheral blood mononuclear cells as well as concentration in oral fluids or saliva.
46
References 1. Schiff J, Cole E, Cantarovich M. Therapeutic monitoring of calcineurin
inhibitors for the nephrologist. Clinical journal of the American Society of Nephrology : CJASN, 2(2), 374-384 (2007).
2. Johnston A, Holt DW. Therapeutic drug monitoring of immunosuppressant
drugs. British journal of clinical pharmacology, 47(4), 339-350 (1999). 3. Staatz CE, Tett SE. Clinical pharmacokinetics and pharmacodynamics of
tacrolimus in solid organ transplantation. Clinical pharmacokinetics, 43(10), 623-653 (2004).
4. Staatz CE, Tett SE. Clinical pharmacokinetics and pharmacodynamics of
mycophenolate in solid organ transplant recipients. Clinical pharmacokinetics, 46(1), 13-58 (2007).
5. Mohammadpour N, Elyasi S, Vahdati N, Mohammadpour AH, Shamsara J. A
review on therapeutic drug monitoring of immunosuppressant drugs. Iranian journal of basic medical sciences, 14(6), 485-498 (2011).
6. Korecka M, Shaw LM. Review of the newest HPLC methods with mass
spectrometry detection for determination of immunosuppressive drugs in clinical practice. Annals of transplantation : quarterly of the Polish Transplantation Society, 14(2), 61-72 (2009).
7. Sallustio BC. LC-MS/MS for immunosuppressant therapeutic drug monitoring.
Bioanalysis, 2(6), 1141-1153 (2010). 8. Vogeser M, Kirchhoff F. Progress in automation of LC-MS in laboratory
medicine. Clinical biochemistry, 44(1), 4-13 (2011). 9. Marinova M, Artusi C, Brugnolo L, Antonelli G, Zaninotto M, Plebani M.
Immunosuppressant therapeutic drug monitoring by LC-MS/MS: workflow optimization through automated processing of whole blood samples. Clinical biochemistry, 46(16-17), 1723-1727 (2013).
10. Spooner N, Lad R, Barfield M. Dried blood spots as a sample collection
technique for the determination of pharmacokinetics in clinical studies: considerations for the validation of a quantitative bioanalytical method. Anal. Chem., 81(4), 1557-1563 (2009).
11. Webb NJ, Coulthard MG, Trompeter RS et al. Correlation between finger-
prick and venous ciclosporin levels: association with gingival overgrowth and hypertrichosis. Pediatric nephrology (Berlin, Germany), 22(12), 2111-2118 (2007).
47
12. Yonan N, Martyszczuk R, Machaal A, Baynes A, Keevil BG. Monitoring of cyclosporine levels in transplant recipients using self-administered fingerprick sampling. Clinical transplantation, 20(2), 221-225 (2006).
13. Keevil BG, Tierney DP, Cooper DP, Morris MR, Machaal A, Yonan N.
Simultaneous and rapid analysis of cyclosporin A and creatinine in finger prick blood samples using liquid chromatography tandem mass spectrometry and its application in C2 monitoring. Therapeutic drug monitoring, 24(6), 757-767 (2002).
14. Webb NJ, Roberts D, Preziosi R, Keevil BG. Fingerprick blood samples can be
used to accurately measure tacrolimus levels by tandem mass spectrometry. Pediatric transplantation, 9(6), 729-733 (2005).
15. Leichtle AB, Ceglarek U, Witzigmann H, Gabel G, Thiery J, Fiedler GM.
Potential of dried blood self-sampling for cyclosporine c(2) monitoring in transplant outpatients. Journal of transplantation, 2010, 201918 (2010).
16. Murthy JN, Yatscoff RW, Soldin SJ. Cyclosporine metabolite cross-reactivity
in different cyclosporine assays. Clinical biochemistry, 31(3), 159-163 (1998). 17. Murthy JN, Davis DL, Yatscoff RW, Soldin SJ. Tacrolimus metabolite cross-
reactivity in different tacrolimus assays. Clinical biochemistry, 31(8), 613-617 (1998).
18. Dietemann J, Berthoux P, Gay-Montchamp JP, Batie M, Berthoux F.
Comparison of ELISA method versus MEIA method for daily practice in the therapeutic monitoring of tacrolimus. Nephrology, dialysis, transplantation : official publication of the European Dialysis and Transplant Association - European Renal Association, 16(11), 2246-2249 (2001).
19. Napoli KL. Is microparticle enzyme-linked immunoassay (MEIA) reliable for
use in tacrolimus TDM? Comparison of MEIA to liquid chromatography with mass spectrometric detection using longitudinal trough samples from transplant recipients. Therapeutic drug monitoring, 28(4), 491-504 (2006).
20. Moes DJ, Press RR, de Fijter JW, Guchelaar HJ, den Hartigh J. Liquid
chromatography-tandem mass spectrometry outperforms fluorescence polarization immunoassay in monitoring everolimus therapy in renal transplantation. Therapeutic drug monitoring, 32(4), 413-419 (2010).
21. Buchwald A, Winkler K, Epting T. Validation of an LC-MS/MS method to
determine five immunosuppressants with deuterated internal standards including MPA. BMC clinical pharmacology, 12, 2 (2012).
48
22. Zimmer D. Introduction to Quantitative Liquid Chromatography-Tandem Mass Spectrometry. Chromatographia, 57(SUPL.), S-325-S-332 (2003).
23. Holcapek M, Kolarova L, Nobilis M. High-performance liquid
chromatography-tandem mass spectrometry in the identification and determination of phase I and phase II drug metabolites. Analytical and bioanalytical chemistry, 391(1), 59-78 (2008).
24. Belostotsky V, Adaway J, Keevil BG, Cohen DR, Webb NJ. Measurement of
saliva tacrolimus levels in pediatric renal transplant recipients. Pediatric nephrology (Berlin, Germany), 26(1), 133-138 (2011).
25. Shen B, Li S, Zhang Y et al. Determination of total, free and saliva
mycophenolic acid with a LC-MS/MS method: application to pharmacokinetic study in healthy volunteers and renal transplant patients. Journal of pharmaceutical and biomedical analysis, 50(3), 515-521 (2009).
26. Dams R, Huestis MA, Lambert WE, Murphy CM. Matrix effect in bio-analysis
of illicit drugs with LC-MS/MS: influence of ionization type, sample preparation, and biofluid. J. Am. Soc. Mass Spectrom., 14(11), 1290-1294 (2003).
27. Mei H, Hsieh Y, Nardo C et al. Investigation of matrix effects in bioanalytical
high-performance liquid chromatography/tandem mass spectrometric assays: application to drug discovery. Rapid communications in mass spectrometry : RCM, 17(1), 97-103 (2003).
28. Chambers E, Wagrowski-Diehl DM, Lu Z, Mazzeo JR. Systematic and
comprehensive strategy for reducing matrix effects in LC/MS/MS analyses. Journal of chromatography. B, Analytical technologies in the biomedical and life sciences, 852(1-2), 22-34 (2007).
29. Feller K, le Petit G. On the distribution of drugs in saliva and blood plasma.
International journal of clinical pharmacology and biopharmacy, 15(10), 468-469 (1977).
30. Horning MG, Brown L, Nowlin J, Lertratanangkoon K, Kellaway P, Zion TE.
Use of saliva in therapeutic drug monitoring. Clinical chemistry, 23(2 PT. 1), 157-164 (1977).
31. Mucklow JC, Bending MR, Kahn GC, Dollery CT. Drug concentration in
saliva. Clinical pharmacology and therapeutics, 24(5), 563-570 (1978). 32. Drobitch RK, Svensson CK. Therapeutic drug monitoring in saliva. An update.
Clinical pharmacokinetics, 23(5), 365-379 (1992).
49
33. Gorodischer R, Koren G. Salivary excretion of drugs in children: theoretical and practical issues in therapeutic drug monitoring. Developmental pharmacology and therapeutics, 19(4), 161-177 (1992).
34. Haeckel R. Factors influencing the saliva/plasma ratio of drugs. Ann. N. Y.
Acad. Sci., 694, 128-142 (1993). 35. Jusko WJ, Milsap RL. Pharmacokinetic principles of drug distribution in
saliva. Ann. N. Y. Acad. Sci., 694, 36-47 (1993). 36. Coates JE, Lam SF, McGaw WT. Radioimmunoassay of salivary cyclosporine
with use of 125I-labeled cyclosporine. Clinical chemistry, 34(8), 1545-1551 (1988).
37. Wiesen MH, Farowski F, Feldkotter M, Hoppe B, Muller C. Liquid
chromatography-tandem mass spectrometry method for the quantification of mycophenolic acid and its phenolic glucuronide in saliva and plasma using a standardized saliva collection device. Journal of chromatography. A, 1241, 52-59 (2012).
38. Mendonza AE, Gohh RY, Akhlaghi F. Analysis of mycophenolic acid in saliva
using liquid chromatography tandem mass spectrometry. Therapeutic drug monitoring, 28(3), 402-406 (2006).
39. Mendonza A, Gohh R, Akhlaghi F. Determination of cyclosporine in saliva
using liquid chromatography-tandem mass spectrometry. Therapeutic drug monitoring, 26(5), 569-575 (2004).
40. Swallow V, Hughes J, Roberts D, Webb NJ. Assessing children's and parents'
opinions on salivary sampling for therapeutic drug monitoring. Nurse Res., 19(3), 32-37 (2012).
41. Tennison M, Ali I, Miles MV, D'Cruz O, Vaughn B, Greenwood R. Feasibility
and acceptance of salivary monitoring of antiepileptic drugs via the US Postal Service. Therapeutic drug monitoring, 26(3), 295-299 (2004).
42. Gorodischer R, Burtin P, Hwang P, Levine M, Koren G. Saliva versus blood
sampling for therapeutic drug monitoring in children: patient and parental preferences and an economic analysis. Therapeutic drug monitoring, 16(5), 437-443 (1994).
43. Zahir H, McCaughan G, Gleeson M, Nand RA, McLachlan AJ. Changes in
tacrolimus distribution in blood and plasma protein binding following liver transplantation. Therapeutic drug monitoring, 26(5), 506-515 (2004).
50
44. Akhlaghi F, Ashley J, Keogh A, Brown K. Cyclosporine plasma unbound fraction in heart and lung transplantation recipients. Therapeutic drug monitoring, 21(1), 8-16 (1999).
45. Haeckel R, Hanecke P. Application of saliva for drug monitoring. An in vivo
model for transmembrane transport. European journal of clinical chemistry and clinical biochemistry : journal of the Forum of European Clinical Chemistry Societies, 34(3), 171-191 (1996).
46. Kaufman E, Lamster IB. The diagnostic applications of saliva--a review.
Critical reviews in oral biology and medicine : an official publication of the American Association of Oral Biologists, 13(2), 197-212 (2002).
47. Lipinski CA, Lombardo F, Dominy BW, Feeney PJ. Experimental and
computational approaches to estimate solubility and permeability in drug discovery and development settings. Advanced drug delivery reviews, 46(1-3), 3-26 (2001).
48. Liu H, Delgado MR. Therapeutic drug concentration monitoring using saliva
samples. Focus on anticonvulsants. Clinical pharmacokinetics, 36(6), 453-470 (1999).
49. Idkaidek NM. Interplay of biopharmaceutics, biopharmaceutics drug
disposition and salivary excretion classification systems. Saudi pharmaceutical journal : SPJ : the official publication of the Saudi Pharmaceutical Society, 22(1), 79-81 (2014).
50. Idkaidek N, Arafat T. Saliva versus plasma pharmacokinetics: theory and
application of a salivary excretion classification system. Molecular pharmaceutics, 9(8), 2358-2363 (2012).
51. Drummer OH. Introduction and review of collection techniques and
applications of drug testing of oral fluid. Therapeutic drug monitoring, 30(2), 203-206 (2008).
52. Granger DA, Shirtcliff EA, Booth A, Kivlighan KT, Schwartz EB. The
"trouble" with salivary testosterone. Psychoneuroendocrinology, 29(10), 1229-1240 (2004).
53. Groschl M, Kohler H, Topf HG, Rupprecht T, Rauh M. Evaluation of saliva
collection devices for the analysis of steroids, peptides and therapeutic drugs. Journal of pharmaceutical and biomedical analysis, 47(3), 478-486 (2008).
54. Shaefer MS, Collier DS, Haven MC et al. Falsely elevated FK-506 levels
caused by sampling through central venous catheters. Transplantation, 56(2), 475-476 (1993).
51
55. Blifeld C, Ettenger RB. Measurement of cyclosporine levels in samples
obtained from peripheral sites and indwelling lines. N. Engl. J. Med., 317(8), 509 (1987).
56. Lillsunde P. Analytical techniques for drug detection in oral fluid. Therapeutic drug monitoring, 30(2), 181-187 (2008).
57. Langel K, Engblom C, Pehrsson A, Gunnar T, Ariniemi K, Lillsunde P. Drug
testing in oral fluid-evaluation of sample collection devices. Journal of analytical toxicology, 32(6), 393-401 (2008).
58. Kivlighan KT, Granger DA, Schwartz EB, Nelson V, Curran M, Shirtcliff EA.
Quantifying blood leakage into the oral mucosa and its effects on the measurement of cortisol, dehydroepiandrosterone, and testosterone in saliva. Hormones and behavior, 46(1), 39-46 (2004).
59. Akhlaghi F, McLachlan AJ, Keogh AM, Brown KF. Effect of simvastatin on
cyclosporine unbound fraction and apparent blood clearance in heart transplant recipients. British journal of clinical pharmacology, 44(6), 537-542 (1997).
60. Akhlaghi F, Trull AK. Distribution of cyclosporin in organ transplant
recipients. Clinical pharmacokinetics, 41(9), 615-637 (2002). 61. Lindholm A, Henricsson S. Intra- and interindividual variability in the free
fraction of cyclosporine in plasma in recipients of renal transplants. Therapeutic drug monitoring, 11(6), 623-630 (1989).
62. Akhlaghi F, Keogh AM, Brown KF. Unbound cyclosporine and allograft
rejection after heart transplantation. Transplantation, 67(1), 54-59 (1999). 63. Zahir H, McCaughan G, Gleeson M, Nand RA, McLachlan AJ. Factors
affecting variability in distribution of tacrolimus in liver transplant recipients. British journal of clinical pharmacology, 57(3), 298-309 (2004).
64. Vogeser M, Zachoval R, Spohrer U, Jacob K. Potential lack of specificity
using electrospray tandem-mass spectrometry for the analysis of mycophenolic acid in serum. Therapeutic drug monitoring, 23(6), 722-724 (2001).
65. Spies CM, Strehl C, van der Goes MC, Bijlsma JW, Buttgereit F.
Glucocorticoids. Best practice & research. Clinical rheumatology, 25(6), 891-900 (2011).
66. Bergmann TK, Barraclough KA, Lee KJ, Staatz CE. Clinical pharmacokinetics
and pharmacodynamics of prednisolone and prednisone in solid organ transplantation. Clinical pharmacokinetics, 51(11), 711-741 (2012).
52
67. Ionita IA, Ogasawara K, Gohh RY, Akhlaghi F. Pharmacokinetics of total and unbound prednisone and prednisolone in stable kidney transplant recipients with diabetes mellitus. Therapeutic drug monitoring, 36(4), 448-455 (2014).
68. Meffin PJ, Brooks PM, Sallustio BC. Alterations in prednisolone disposition as
a result of time of administration, gender and dose. British journal of clinical pharmacology, 17(4), 395-404 (1984).
69. Teeninga N, Guan Z, Freijer J et al. Monitoring prednisolone and prednisone
in saliva: a population pharmacokinetic approach in healthy volunteers. Therapeutic drug monitoring, 35(4), 485-492 (2013).
70. Ruiter AF, Teeninga N, Nauta J, Endert E, Ackermans MT. Determination of
unbound prednisolone, prednisone and cortisol in human serum and saliva by on-line solid-phase extraction liquid chromatography tandem mass spectrometry and potential implications for drug monitoring of prednisolone and prednisone in saliva. Biomedical chromatography : BMC, 26(7), 789-796 (2012).
71. den Burger JC, Wilhelm AJ, Chahbouni A, Vos RM, Sinjewel A, Swart EL.
Analysis of cyclosporin A, tacrolimus, sirolimus, and everolimus in dried blood spot samples using liquid chromatography tandem mass spectrometry. Analytical and bioanalytical chemistry, 404(6-7), 1803-1811 (2012).
72. Hinchliffe E, Adaway JE, Keevil BG. Simultaneous measurement of
cyclosporin A and tacrolimus from dried blood spots by ultra high performance liquid chromatography tandem mass spectrometry. Journal of chromatography. B, Analytical technologies in the biomedical and life sciences, 883-884, 102-107 (2012).
73. Hoogtanders K, van der Heijden J, Christiaans M, van de Plas A, van Hooff J,
Stolk L. Dried blood spot measurement of tacrolimus is promising for patient monitoring. Transplantation, 83(2), 237-238 (2007).
74. Koop DR, Bleyle LA, Munar M, Cherala G, Al-Uzri A. Analysis of tacrolimus
and creatinine from a single dried blood spot using liquid chromatography tandem mass spectrometry. Journal of chromatography. B, Analytical technologies in the biomedical and life sciences, 926, 54-61 (2013).
75. Sadilkova K, Busby B, Dickerson JA, Rutledge JC, Jack RM. Clinical
validation and implementation of a multiplexed immunosuppressant assay in dried blood spots by LC-MS/MS. Clinica chimica acta; international journal of clinical chemistry, 421, 152-156 (2013).
76. van der Heijden J, de Beer Y, Hoogtanders K et al. Therapeutic drug
monitoring of everolimus using the dried blood spot method in combination
53
with liquid chromatography-mass spectrometry. Journal of pharmaceutical and biomedical analysis, 50(4), 664-670 (2009).
77. Wilhelm AJ, den Burger JC, Vos RM, Chahbouni A, Sinjewel A. Analysis of
cyclosporin A in dried blood spots using liquid chromatography tandem mass spectrometry. Journal of chromatography. B, Analytical technologies in the biomedical and life sciences, 877(14-15), 1595-1598 (2009).
78. Lampe D, Scholz D, Prumke HJ, Blank W, Huller H. Capillary blood, dried on
filter paper, as sample for monitoring cyclosporin A concentrations. Clinical chemistry, 33(9), 1643-1644 (1987).
79. Cheung CY, van der Heijden J, Hoogtanders K et al. Dried blood spot
measurement: application in tacrolimus monitoring using limited sampling strategy and abbreviated AUC estimation. Transplant international : official journal of the European Society for Organ Transplantation, 21(2), 140-145 (2008).
80. Keevil BG. The analysis of dried blood spot samples using liquid
chromatography tandem mass spectrometry. Clinical biochemistry, 44(1), 110-118 (2011).
81. Acott PD. Home fingerprick sampling for immunosuppressant drug monitoring
in pediatric renal transplant patients. Nature clinical practice. Nephrology, 2(6), 304-305 (2006).
82. Hoogtanders K, van der Heijden J, Christiaans M, Edelbroek P, van Hooff JP,
Stolk LM. Therapeutic drug monitoring of tacrolimus with the dried blood spot method. Journal of pharmaceutical and biomedical analysis, 44(3), 658-664 (2007).
83. Li Q, Cao D, Huang Y, Xu H, Yu C, Li Z. Development and validation of a
sensitive LC-MS/MS method for determination of tacrolimus on dried blood spots. Biomedical chromatography : BMC, 27(3), 327-334 (2013).
84. Bowen CL, Dopson W, Kemp DC, Lewis M, Lad R, Overvold C.
Investigations into the environmental conditions experienced during ambient sample transport: impact to dried blood spot sample shipments. Bioanalysis, 3(14), 1625-1633 (2011).
85. Holub M, Tuschl K, Ratschmann R et al. Influence of hematocrit and
localisation of punch in dried blood spots on levels of amino acids and acylcarnitines measured by tandem mass spectrometry. Clinica chimica acta; international journal of clinical chemistry, 373(1-2), 27-31 (2006).
54
86. Koster RA, Alffenaar JW, Greijdanus B, Uges DR. Fast LC-MS/MS analysis of tacrolimus, sirolimus, everolimus and cyclosporin A in dried blood spots and the influence of the hematocrit and immunosuppressant concentration on recovery. Talanta, 115, 47-54 (2013).
87. Heinig K, Bucheli F, Hartenbach R, Gajate-Perez A. Determination of
mycophenolic acid and its phenyl glucuronide in human plasma, ultrafiltrate, blood, DBS and dried plasma spots. Bioanalysis, 2(8), 1423-1435 (2010).
88. LifeSciences G. Grade 31ET Chr Cellulose Chromatography Papers.
(LifeSciences, GH) http://www.gelifesciences.com/webapp/wcs/stores/servlet/ProductDisplay?categoryId=104361&catalogId=10101&productId=15116&storeId=11787&langId=-1
89. Li W, Tse FL. Dried blood spot sampling in combination with LC-MS/MS for
quantitative analysis of small molecules. Biomedical chromatography : BMC, 24(1), 49-65 (2010).
90. PerkinElmer. PerkinElmer 226 Sample Collection Devices – Clinical.
(PerkinElmer). http://www.perkinelmer.com/pages/060/newbornscreening/default.xhtml
91. Besarab A, Bolton WK, Browne JK et al. The effects of normal as compared
with low hematocrit values in patients with cardiac disease who are receiving hemodialysis and epoetin. The New England journal of medicine, 339(9), 584-590 (1998).
92. Wilhelm AJ, den Burger JC, Chahbouni A, Vos RM, Sinjewel A. Analysis of
mycophenolic acid in dried blood spots using reversed phase high performance liquid chromatography. Journal of chromatography. B, Analytical technologies in the biomedical and life sciences, 877(30), 3916-3919 (2009).
93. Spooner N, Denniff P, Michielsen L et al. A device for dried blood
microsampling in quantitative bioanalysis: overcoming the issues associated blood hematocrit. Bioanalysis, 1-7 (2014).
94. Denniff P, Spooner N. Volumetric absorptive microsampling: a dried sample
collection technique for quantitative bioanalysis. Analytical chemistry, 86(16), 8489-8495 (2014).
95. Merton G, Jones K, Lee M, Johnston A, Holt DW. Accuracy of cyclosporin
measurements made in capillary blood samples obtained by skin puncture. Therapeutic drug monitoring, 22(5), 594-598 (2000).
55
96. Wallemacq P, Armstrong VW, Brunet M et al. Opportunities to optimize tacrolimus therapy in solid organ transplantation: report of the European consensus conference. Therapeutic drug monitoring, 31(2), 139-152 (2009).
97. Batiuk TD, Pazderka F, Enns J, DeCastro L, Halloran PF. Cyclosporine
inhibition of calcineurin activity in human leukocytes in vivo is rapidly reversible. The Journal of clinical investigation, 96(3), 1254-1260 (1995).
98. Thomson AW, Bonham CA, Zeevi A. Mode of action of tacrolimus (FK506):
molecular and cellular mechanisms. Therapeutic drug monitoring, 17(6), 584-591 (1995).
99. Dumont FJ, Su Q. Mechanism of action of the immunosuppressant rapamycin.
Life Sci., 58(5), 373-395 (1996). 100. Kemnitz J, Uysal A, Haverich A et al. Multidrug resistance in heart transplant
patients: a preliminary communication on a possible mechanism of therapy-resistant rejection. The Journal of heart and lung transplantation : the official publication of the International Society for Heart Transplantation, 10(2), 201-210 (1991).
101. Albermann N, Schmitz-Winnenthal FH, Z'Graggen K et al. Expression of the
drug transporters MDR1/ABCB1, MRP1/ABCC1, MRP2/ABCC2, BCRP/ABCG2, and PXR in peripheral blood mononuclear cells and their relationship with the expression in intestine and liver. Biochem. Pharmacol., 70(6), 949-958 (2005).
102. Chaudhary PM, Mechetner EB, Roninson IB. Expression and activity of the
multidrug resistance P-glycoprotein in human peripheral blood lymphocytes. Blood, 80(11), 2735-2739 (1992).
103. Cattaneo D, Ruggenenti P, Baldelli S et al. ABCB1 genotypes predict
cyclosporine-related adverse events and kidney allograft outcome. Journal of the American Society of Nephrology : JASN, 20(6), 1404-1415 (2009).
104. Crettol S, Venetz JP, Fontana M et al. Influence of ABCB1 genetic
polymorphisms on cyclosporine intracellular concentration in transplant recipients. Pharmacogenetics and genomics, 18(4), 307-315 (2008).
105. Ansermot N, Rebsamen M, Chabert J et al. Influence of ABCB1 gene
polymorphisms and P-glycoprotein activity on cyclosporine pharmacokinetics in peripheral blood mononuclear cells in healthy volunteers. Drug metabolism letters, 2(2), 76-82 (2008).
106. Capron A, Mourad M, De Meyer M et al. CYP3A5 and ABCB1
polymorphisms influence tacrolimus concentrations in peripheral blood
56
mononuclear cells after renal transplantation. Pharmacogenomics, 11(5), 703-714 (2010).
107. Chen N, Weiss D, Reyes J et al. No clinically significant drug interactions
between lenalidomide and Pglycoprotein substrates and inhibitors: results from controlled phase I studies in healthy volunteers. Cancer chemotherapy and pharmacology, 73(5), 1031-1039 (2014).
108. Anglicheau D, Pallet N, Rabant M et al. Role of P-glycoprotein in
cyclosporine cytotoxicity in the cyclosporine-sirolimus interaction. Kidney international, 70(6), 1019-1025 (2006).
109. Laplante A, Demeule M, Murphy GF, Beliveau R. Interaction of
immunosuppressive agents rapamycin and its analogue SDZ-RAD with endothelial P-gp. Transplantation proceedings, 34(8), 3393-3395 (2002).
110. Grude P, Boleslawski E, Conti F, Chouzenoux S, Calmus Y. MDR1 gene
expression in peripheral blood mononuclear cells after liver transplantation. Transplantation, 73(11), 1824-1828 (2002).
111. Goto M, Masuda S, Kiuchi T et al. Relation between mRNA expression level
of multidrug resistance 1/ABCB1 in blood cells and required level of tacrolimus in pediatric living-donor liver transplantation. The Journal of pharmacology and experimental therapeutics, 325(2), 610-616 (2008).
112. Robertsen I, Falck P, Andreassen AK et al. Endomyocardial, intralymphocyte,
and whole blood concentrations of ciclosporin A in heart transplant recipients. Transplantation research, 2(1), 5 (2013).
113. Lemaitre F, Antignac M, Fernandez C. Monitoring of tacrolimus
concentrations in peripheral blood mononuclear cells: Application to cardiac transplant recipients. Clinical biochemistry, (2013).
114. Ansermot N, Fathi M, Veuthey JL, Desmeules J, Hochstrasser D, Rudaz S.
Quantification of cyclosporine A in peripheral blood mononuclear cells by liquid chromatography-electrospray mass spectrometry using a column-switching approach. Journal of chromatography. B, Analytical technologies in the biomedical and life sciences, 857(1), 92-99 (2007).
115. Falck P, Guldseth H, Asberg A, Midtvedt K, Reubsaet JL. Determination of
ciclosporin A and its six main metabolites in isolated T-lymphocytes and whole blood using liquid chromatography-tandem mass spectrometry. Journal of chromatography. B, Analytical technologies in the biomedical and life sciences, 852(1-2), 345-352 (2007).
57
116. Brozmanova H, Perinova I, Halvova P, Grundmann M. Liquid chromatography-tandem mass spectrometry method for simultaneous determination of cyclosporine A and its three metabolites AM1, AM9 and AM4N in whole blood and isolated lymphocytes in renal transplant patients. Journal of separation science, 33(15), 2287-2293 (2010).
117. Capron A, Lerut J, Latinne D, Rahier J, Haufroid V, Wallemacq P. Correlation
of tacrolimus levels in peripheral blood mononuclear cells with histological staging of rejection after liver transplantation: preliminary results of a prospective study. Transplant international : official journal of the European Society for Organ Transplantation, 25(1), 41-47 (2012).
118. Capron A, Musuamba F, Latinne D et al. Validation of a liquid
chromatography-mass spectrometric assay for tacrolimus in peripheral blood mononuclear cells. Therapeutic drug monitoring, 31(2), 178-186 (2009).
119. Gustafsson F, Barth D, Delgado DH, Nsouli M, Sheedy J, Ross HJ. The impact
of everolimus versus mycophenolate on blood and lymphocyte cyclosporine exposure in heart-transplant recipients. European journal of clinical pharmacology, 65(7), 659-665 (2009).
120. Falck P, Asberg A, Guldseth H et al. Declining intracellular T-lymphocyte
concentration of cyclosporine a precedes acute rejection in kidney transplant recipients. Transplantation, 85(2), 179-184 (2008).
121. Lepage JM, Lelong-Boulouard V, Lecouf A, Debruyne D, Hurault de Ligny B,
Coquerel A. Cyclosporine monitoring in peripheral blood mononuclear cells: feasibility and interest. A prospective study on 20 renal transplant recipients. Transplantation proceedings, 39(10), 3109-3110 (2007).
122. Barbari A, Stephan A, Masri M et al. Cyclosporine lymphocyte level and
lymphocyte count: new guidelines for tailoring immunosuppressive therapy. Transplantation proceedings, 35(7), 2742-2744 (2003).
123. Barbari A, Masri MA, Stephan A et al. Cyclosporine lymphocyte versus whole
blood pharmacokinetic monitoring: correlation with histological findings. Transplantation proceedings, 33(5), 2782-2785 (2001).
124. Masri MA, Barbari A, Stephan A, Rizk S, Kilany H, Kamel G. Measurement
of lymphocyte cyclosporine levels in transplant patients. Transplantation proceedings, 30(7), 3561-3562 (1998).
125. Masri M, Rizk S, Barbari A, Stephan A, Kamel G, Rost M. An assay for the
determination of sirolimus levels in the lymphocyte of transplant patients. Transplantation proceedings, 39(4), 1204-1206 (2007).
58
126. Roullet-Renoleau F, Lemaitre F, Antignac M, Zahr N, Farinotti R, Fernandez C. Everolimus quantification in peripheral blood mononuclear cells using ultra high performance liquid chromatography tandem mass spectrometry. Journal of pharmaceutical and biomedical analysis, 66, 278-281 (2012).
127. Starkel P, Sempoux C, Van Den Berge V et al. CYP 3A proteins are expressed
in human neutrophils and lymphocytes but are not induced by rifampicin. Life Sci., 64(8), 643-653 (1999).
128. Dey A, Yadav S, Dhawan A, Seth PK, Parmar D. Evidence for cytochrome
P450 3A expression and catalytic activity in rat blood lymphocytes. Life sciences, 79(18), 1729-1735 (2006).
129. Hesselink DA, van Schaik RH, van der Heiden IP et al. Genetic
polymorphisms of the CYP3A4, CYP3A5, and MDR-1 genes and pharmacokinetics of the calcineurin inhibitors cyclosporine and tacrolimus. Clinical pharmacology and therapeutics, 74(3), 245-254 (2003).
130. Kamdem LK, Streit F, Zanger UM et al. Contribution of CYP3A5 to the in
vitro hepatic clearance of tacrolimus. Clinical chemistry, 51(8), 1374-1381 (2005).
131. Miura M, Niioka T, Kagaya H et al. Pharmacogenetic determinants for
interindividual difference of tacrolimus pharmacokinetics 1 year after renal transplantation. J. Clin. Pharm. Ther., 36(2), 208-216 (2011).
132. Uesugi M, Masuda S, Katsura T, Oike F, Takada Y, Inui K. Effect of intestinal
CYP3A5 on postoperative tacrolimus trough levels in living-donor liver transplant recipients. Pharmacogenetics and genomics, 16(2), 119-127 (2006).
133. Lensmeyer GL, Wiebe DA, Carlson IH, Subramanian R. Concentrations of
cyclosporin A and its metabolites in human tissues postmortem. Journal of analytical toxicology, 15(3), 110-115 (1991).
134. Sandborn WJ, Lawson GM, Cody TJ et al. Early cellular rejection after
orthotopic liver transplantation correlates with low concentrations of FK506 in hepatic tissue. Hepatology (Baltimore, Md.), 21(1), 70-76 (1995).
135. Sandborn WJ, Lawson GM, Krom RA, Wiesner RH. Hepatic allograft
cyclosporine concentration is independent of the route of cyclosporine administration and correlates with the occurrence of early cellular rejection. Hepatology (Baltimore, Md.), 15(6), 1086-1091 (1992).
136. Capron A, Lerut J, Verbaandert C et al. Validation of a liquid chromatography-
mass spectrometric assay for tacrolimus in liver biopsies after hepatic
59
transplantation: correlation with histopathologic staging of rejection. Therapeutic drug monitoring, 29(3), 340-348 (2007).
137. Noll BD, Coller JK, Somogyi AA et al. Measurement of cyclosporine A in rat
tissues and human kidney transplant biopsies--a method suitable for small (<1 mg) samples. Therapeutic drug monitoring, 33(6), 688-693 (2011).
138. Noll BD, Coller JK, Somogyi AA et al. Validation of an LC-MS/MS Method
to Measure Tacrolimus in Rat Kidney and Liver Tissue and Its Application to Human Kidney Biopsies. Therapeutic drug monitoring, (2013).
139. Ting LS, Partovi N, Levy RD, Riggs KW, Ensom MH. Pharmacokinetics of
mycophenolic acid and its phenolic-glucuronide and ACYl glucuronide metabolites in stable thoracic transplant recipients. Therapeutic drug monitoring, 30(3), 282-291 (2008).
140. Elens L, Capron A, Kerckhove VV et al. 1199G>A and 2677G>T/A
polymorphisms of ABCB1 independently affect tacrolimus concentration in hepatic tissue after liver transplantation. Pharmacogenetics and genomics, 17(10), 873-883 (2007).
141. Smans L, Lentjes E, Hermus A, Zelissen P. Salivary cortisol day curves in
assessing glucocorticoid replacement therapy in Addison's disease. Hormones (Athens, Greece), 12(1), 93-100 (2013).
142. Kovarik JM, Sabia HD, Figueiredo J et al. Influence of hepatic impairment on
everolimus pharmacokinetics: implications for dose adjustment. Clinical pharmacology and therapeutics, 70(5), 425-430 (2001).
143. Peveling-Oberhag J, Zeuzem S, Yong WP et al. Effects of hepatic impairment
on the pharmacokinetics of everolimus: a single-dose, open-label, parallel-group study. Clinical therapeutics, 35(3), 215-225 (2013).
144. Reece PA, Disney AP, Stafford I, Shastry JC. Prednisolone protein binding in
renal transplant patients. British journal of clinical pharmacology, 20(2), 159-162 (1985).
145. MacDonald A, Scarola J, Burke JT, Zimmerman JJ. Clinical pharmacokinetics
and therapeutic drug monitoring of sirolimus. Clinical therapeutics, 22 Suppl B, B101-121 (2000

60
Chapter 2 : MANUSCRIPT II
To be submitted to Journal of Chromatography B
Development and Validation of Sensitive and Selective LC-MS/MS Method for
Quantification of Tacrolimus in Oral Fluid Samples from Kidney Transplant
Recipients
AUTHORS
1Mwlod Ghareeb, 1Fatemeh Akhlaghi.
DEPARTMENT AND INSTITUTION
1Department of Biomedical and Pharmaceutical Sciences, University of Rhode Island,
Kingston, RI
Address correspondence to: Fatemeh Akhlaghi, PharmD, PhD, Clinical
Pharmacokinetics Research Laboratory, Department of Biomedical and
Pharmaceutical Sciences, University of Rhode Island, 495A College of Pharmacy, 7
Greenhouse Road, Kingston, RI 02881, USA. Phone: (401) 874 9205. Fax: (401) 874
5787. Email: [email protected]
61
KEYWORDS
Renal transplantation, tacrolimus, saliva, oral fluid, therapeutic drug monitoring,
immunosuppressant, LC-MS/MS.
ABBRIVATIONS
ACN: Acetonitrile, ASC: Ascomycin, CV: Coefficient of variation, DBS: Dried blood
spot, ESI: Electrospray ionization, FDA: Food and Drug Administration, IS: Internal
standard, ISR: Incurred Sample Reanalysis, LC-MS/MS: Liquid chromatography
tandem mass spectrometry, LLOQ: Lower limit of quantification, ME: Matrix effect,
MeOH: Methanol, MRM: Multiple reaction monitoring, MS: Mass spectrometry,
MW: molecular weight, OF: Oral fluid, QCs: Quality controls, RTR: Renal transplant
recipients, S/N: Signal to noise ratio, TAC: Tacrolimus, TDM: Therapeutic Drug
Monitoring.
62
CORRESPONDING AUTHOR
Address correspondence to: Fatemeh Akhlaghi, PharmD, PhD, Clinical
Pharmacokinetics Research Laboratory, Department of Biomedical and
Pharmaceutical Sciences, University of Rhode Island, 495A College of Pharmacy, 7
Greenhouse Road, Kingston, RI 02881, USA. Phone: (401) 874 9205. Fax: (401) 874
5787. Email: [email protected]
DISCLOSURE
No conflict of interest is declared.
63
ABSTRACT
Tacrolimus (TAC) is a commonly used immunosuppressive agent in solid organs
transplant recipients. Due to its high inter-subject and intra-subject variability and the
consequent risk of toxicity and/or allograft rejection, therapeutic drug monitoring
(TDM) is required. Venipuncture blood sampling is recommended for tacrolimus
TDM. Using peripheral blood samples for quantifying TAC concentration has
limitations of being invasive and provides poor correlation with TAC concentration at
the site of action, in lymphocytes and tissues. Tacrolimus concentration that is present
in oral fluid (OF) is considered representative of the free fraction that is responsible
for the desired clinical outcomes and toxicity. Therefore, measuring salivary TAC may
provide a suitable alternative to using whole blood. In this study, a validated, rapid,
sensitive and selective liquid chromatography tandem mass spectrometry (LC-
MS/MS) is presented. Chromatography separation was achieved using Acquity UPLC
BEH C18 column and gradient elution using 2mM ammonium acetate/0.1 formic acid
in water (mobile phase A) and in methanol (mobile phase B). Short sample analysis
cycle with 2.2 min run was achieved. Simple sample preparation and extraction
procedure with two folds of ACN as precipitating solvent provided sufficient sample
cleanness and negligible matrix effect. Tacrolimus was stable in OF for up to one
month at -80 °C and up to 48hr in auto-sampler at 20 °C. The method showed high
reproducibility as confirmed by incurred sample reanalysis (ISR) test.
64
Introduction
Tacrolimus (TAC) is a widely described immunosuppressive agent for solid organ
transplant recipients. It has a narrow therapeutic index, significant intra- [146] and
inter-subject pharmacokinetic variability [3]. Therefore, routine TDM is required for
optimized outcomes [147]. Currently, peripheral venous blood is recommended for
estimation of TAC exposure [148]. However, TAC blood level showed poor
correlation with, in situ level, in lymphocytes [146] and tissues [146] as well as free
fraction [146]. As a result, whole blood sampling fails to provide a reliable prediction
of allograft rejection and toxicity [146]. Moreover, the invasive nature of venipuncture
sampling makes this approach less appealing as compared to less invasive sampling
methods [15][146].
Intra-lymphocytes and intra-tissue TAC concentration showed to be good indicators of
therapeutic efficacy and predictor for allograft rejection in liver [146] and kidney
[146] transplant recipients. However, using these techniques in clinical practice are
hampered by relatively large amount of blood needed for intracellular TAC
measurement (7-8 mL); laborious lymphocytes isolation and TAC extraction
procedures; and the need for biopsy for intra-tissue.
Dried blood spot (DBS) sampling was proposed as a possible less invasive alternative
to venipuncture [146]. Dried blood spot provides a way of obtaining samples less
invasively and makes patient self-sampling more feasible [146]. Tacrolimus
concentration obtained using DBS showed excellent association with TAC venous
level [146]. However, since whole blood is used in preparing DBS, it still has the main
65
disadvantage of the venous blood of being a poor predictor for intra-lymphocytes and
intra-tissue concentration.
For TAC, about 1% of the total amount in blood present in free form, which is
responsible for clinical outcome and toxicity [3]. The free fraction significantly
affected by changes in plasma lipoprotein concentration after transplantation [146],
leading to the incidence of episodes of rejection and/or toxicity [146]. Therefore,
probably it is sensible to monitor free TAC concentration instead of total
concentration.
Accumulated knowledge about how drugs partition into saliva promoted OF as
possible media for TDM [146]. Due to their large size, protein-bound drugs are unable
to cross biological membranes, and the only free fraction of a drug can enter OF [146].
Therefore, drugs concentration in OF represents free drug fraction [35]. Accordingly,
OF may enable measuring free drug fraction directly in samples obtained easily and
non-invasively with minimum sample preparation steps [146]. In this paper, a
validated, rapid, sensitive and selective method for quantifying TAC in OF is
presented. The study also investigated optimum sample treatment conditions using
simple extraction methods.
Chemicals and reagents
Tacrolimus (C44H69NO12, MW = 804.02, 1.0 mg/mL solution in acetonitrile) and the
internal standard (IS), ascomycin (ASC, C43H69NO12, Mw = 792.01, 1.0 mg/mL
solution in acetonitrile) were purchased from Cerilliant Corporation (Round Rock,
Texas, USA). Optima LC/MS grade of acetonitrile (ACN), ammonium acetate, formic
66
acid, and methanol (MeOH) were obtained from Fisher Scientific (Fair Lawn, NJ,
USA). Deionized water was obtained using Milli-Q Synthesis system fitted with Q-
Gard 2 Purification Pack (Millipore, Bedford, MA, USA). AquaSil Siliconizing Fluid
was purchased from Thermo Fisher Scientific Inc (Franklin, MA, USA). Drug-free
human OF from six donors was obtained from Bioreclamation Inc. (Westbury, NY,
USA).
Apparatus
Samples were sonicated using Branson® Sonicator (Danbury, CT, USA) to produce a
homogeneous mixture. The supernatant was obtained using Eppendorf 5810 centrifuge
from Micro and Nanotechnology (Urbana, IL, USA). Samples were analyzed using
Liquid Chromatography tandem Mass Spectrometry (LC-MS/MS). The LC-MS/MS
system consisted of Acquity UPLC from Waters Corp (Milford, MA, USA) connected
to Xevo TQ MS mass spectrometry from Waters Corp. MassLynx™ software (V 4.1)
was used to control the system and data acquisition, and data processed using
TargetLynx™ tool. The UPLC system had a binary pump and equipped with built-in
column heater. Twenty micro-litters sample loop was used to deliver 10 µL of the
samples in partial loop mode. For salivary blood contamination assay, SpectraMax
M5e Microplate Reader (Sunnyvale, CA, USA) was used.
Chromatographic conditions
An Acquity UPLC BEH C18 (2.1 mm x 50 mm) column with 1.7µm-particle size and
130Å pores size used (Waters Corp) for chromatographic separation. An Acquity
67
UPLC BEH C18, (2.1 mm x 5 mm) pre-column with 1.7µm particle size and 130Å
porosity (Waters Corp) was connected immediately to the inlet of the analytical
column. The temperature of the column was kept at 60 °C, and the auto-sampler
temperature was maintained at 20 °C. Gradient elution was employed with a mobile
phase consisted of water containing 2 mM ammonium acetate/0.1% (v/v) formic acid
(Solvent A); and MeOH containing 2 mM ammonium acetate/0.1% (v/v) formic acid
(Solvent B). The mobile phase was delivered at 0.4mL/ min flow rate. The run cycle
started at 50% solvent (B) and increased gradually to 98% over 0.5 min and
maintained at this level till 1.8 min. To re-equilibrate the column for next run, solvent
(B) decreased within 0.1 min to 50% and kept till the end of the run at 2.2 min.
Diversion valve was set to deliver the first 0.70 min and from 1.20 min till the end of
each run to waste. The elution time of ASC and TAC was 1.0 min.
Mass spectrometry condition
Mass spectrometry detection and quantification of TAC and ASC performed in
positive electrospray ionization (ESI) and multiple reaction monitoring (MRM)
modes. Intellistart tool was used to obtain initial mass spectrometry parameters in low
mass resolution analysis mode followed by manual tuning to achieve highest possible
sensitivity. Final mass spectrometry parameters were as following: collision energy
(CE) = 22 and 20 for ASC and TAC respectively, cone voltage (CV) = 28, capillary
voltage (kV = 1.50), source temperature (°C) = 150, cone gas flow (L/hr) = 25,
desolvation gas flow (L/hr) = 1000, and collision gas flow (mL/min) = 0.15.
Ammonium adducts [M+NH4]+ were selected as precursors for MRM with transitions
68
(m/z, Q1 > Q3) of (m/z, 809.30 > 756.30) and (m/z, 821.30 > 768.35) for ASC and
TAC, respectively.
Standards, quality controls, and internal standard solutions preparation
Sub-stock and working stock solutions of ASC and TAC were prepared from the
original solutions (1mg/mL) using ACN and MeOH, respectively, and stored at – 20
°C. Standards and quality controls (QCs) were prepared by spiking the OF with
serially diluted working stock solutions (< 5% of total OF volume) to achieve desired
concentrations. A final concentration of 600 ng/L ASC in ACN was used as the
precipitating solvent.
Patients Samples
Studies protocols approved by Institutional Review Board at Rhode Island Hospital
(Providence, RI). After giving the formal consent, kidney transplant recipients
attending kidney transplant clinics were recruited. All patients were on a triple
immunosuppressive regimen including tacrolimus, prednisone, and mycophenolic or
azathioprine). After the physical examination by the physician, signed inform consent
was obtained from each patient. In two studies, patients were asked to give venous
blood samples (approximately 4 mL collected ethylenediaminetetraacetic acid
(EDTA) and matching OF samples. In the first study, 85 samples were collected
sporadically at certain time points, including, pre-dose (time 0 = C0) and at 0.5, 1, 1.5,
2, 3, 4, 5, 6, 8, 10 and 12 hrs post-dose from 10 patients. In the second study, samples
collected at 0 hr (50 samples) and 2 hrs from (46 samples) from 61 patients. The OF
69
samples were collected by passive drool into siliconized plastic cups. All blood and
OF samples kept on dry ice till transferred to the Department of Biomedical and
Pharmaceutical Sciences (BPS) at the University of Rhode Island and stored at – 80
°C until analyzed.
Sample extraction
Calibration standards, quality controls (QCs), blank, and patients' OF samples were
allowed to thaw at room temperature. After vortexing for 5 seconds, samples were
sonicated for 5-10 seconds (depending on samples volume) to breakdown salivary
components and produce a homogenous mixture. Fifty micro-liters of the samples
were transferred into a 1.5 mL polypropylene tube, and 100 µL of precipitating
solvent were added (IS final concentration was 200 ng/L). After vortexing for 10
seconds, samples centrifuged at 10,000 xg for 5 min at 20 °C. The supernatant were
then transferred into an auto-sampler vial and 10 μL was injected.
Statistical analysis of the data
Statistical analysis was performed using the SPSS software (version 19.0, SPSS Inc.,
Chicago, IL, USA) and GraphPad Prism (version 4.0, GraphPad Software, Inc., La
Jolla, CA, USA). Normal distribution of the data was checked graphically and
confirmed with the Shapiro-Wilk test.
Assay validation
Standards and QCs
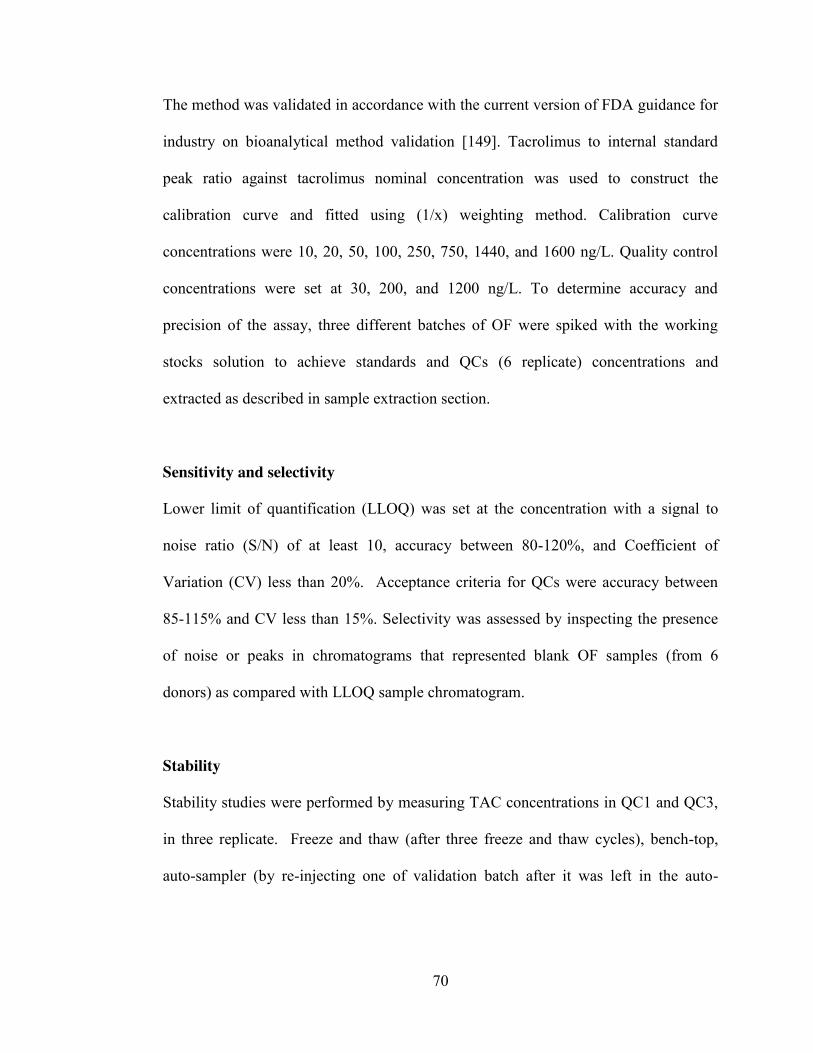
70
The method was validated in accordance with the current version of FDA guidance for
industry on bioanalytical method validation [149]. Tacrolimus to internal standard
peak ratio against tacrolimus nominal concentration was used to construct the
calibration curve and fitted using (1/x) weighting method. Calibration curve
concentrations were 10, 20, 50, 100, 250, 750, 1440, and 1600 ng/L. Quality control
concentrations were set at 30, 200, and 1200 ng/L. To determine accuracy and
precision of the assay, three different batches of OF were spiked with the working
stocks solution to achieve standards and QCs (6 replicate) concentrations and
extracted as described in sample extraction section.
Sensitivity and selectivity
Lower limit of quantification (LLOQ) was set at the concentration with a signal to
noise ratio (S/N) of at least 10, accuracy between 80-120%, and Coefficient of
Variation (CV) less than 20%. Acceptance criteria for QCs were accuracy between
85-115% and CV less than 15%. Selectivity was assessed by inspecting the presence
of noise or peaks in chromatograms that represented blank OF samples (from 6
donors) as compared with LLOQ sample chromatogram.
Stability
Stability studies were performed by measuring TAC concentrations in QC1 and QC3,
in three replicate. Freeze and thaw (after three freeze and thaw cycles), bench-top,
auto-sampler (by re-injecting one of validation batch after it was left in the auto-
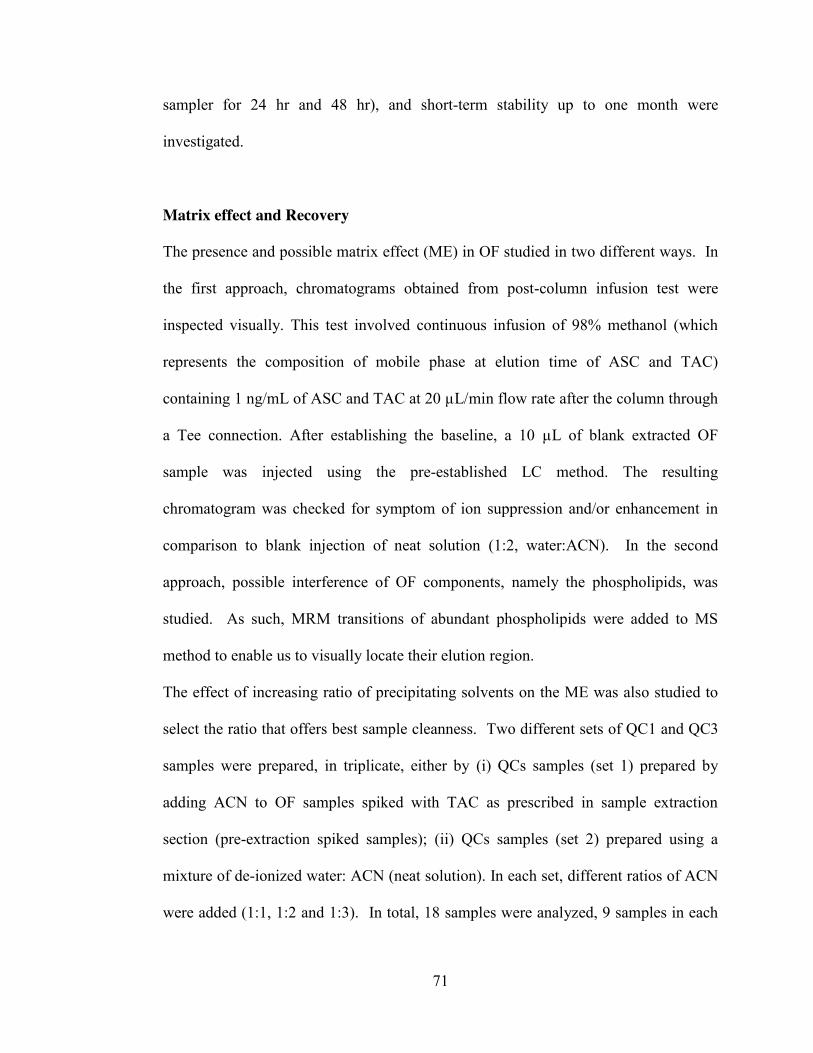
71
sampler for 24 hr and 48 hr), and short-term stability up to one month were
investigated.
Matrix effect and Recovery
The presence and possible matrix effect (ME) in OF studied in two different ways. In
the first approach, chromatograms obtained from post-column infusion test were
inspected visually. This test involved continuous infusion of 98% methanol (which
represents the composition of mobile phase at elution time of ASC and TAC)
containing 1 ng/mL of ASC and TAC at 20 µL/min flow rate after the column through
a Tee connection. After establishing the baseline, a 10 µL of blank extracted OF
sample was injected using the pre-established LC method. The resulting
chromatogram was checked for symptom of ion suppression and/or enhancement in
comparison to blank injection of neat solution (1:2, water:ACN). In the second
approach, possible interference of OF components, namely the phospholipids, was
studied. As such, MRM transitions of abundant phospholipids were added to MS
method to enable us to visually locate their elution region.
The effect of increasing ratio of precipitating solvents on the ME was also studied to
select the ratio that offers best sample cleanness. Two different sets of QC1 and QC3
samples were prepared, in triplicate, either by (i) QCs samples (set 1) prepared by
adding ACN to OF samples spiked with TAC as prescribed in sample extraction
section (pre-extraction spiked samples); (ii) QCs samples (set 2) prepared using a
mixture of de-ionized water: ACN (neat solution). In each set, different ratios of ACN
were added (1:1, 1:2 and 1:3). In total, 18 samples were analyzed, 9 samples in each
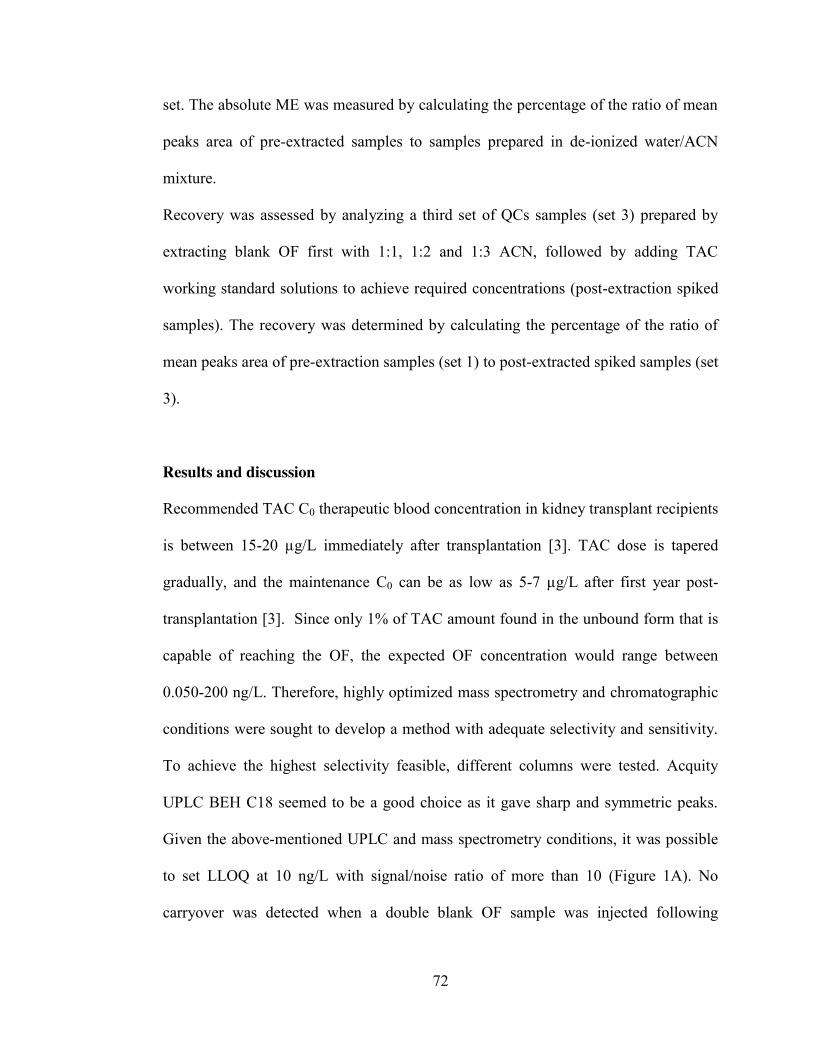
72
set. The absolute ME was measured by calculating the percentage of the ratio of mean
peaks area of pre-extracted samples to samples prepared in de-ionized water/ACN
mixture.
Recovery was assessed by analyzing a third set of QCs samples (set 3) prepared by
extracting blank OF first with 1:1, 1:2 and 1:3 ACN, followed by adding TAC
working standard solutions to achieve required concentrations (post-extraction spiked
samples). The recovery was determined by calculating the percentage of the ratio of
mean peaks area of pre-extraction samples (set 1) to post-extracted spiked samples (set
3).
Results and discussion
Recommended TAC C0 therapeutic blood concentration in kidney transplant recipients
is between 15-20 µg/L immediately after transplantation [3]. TAC dose is tapered
gradually, and the maintenance C0 can be as low as 5-7 µg/L after first year post-
transplantation [3]. Since only 1% of TAC amount found in the unbound form that is
capable of reaching the OF, the expected OF concentration would range between
0.050-200 ng/L. Therefore, highly optimized mass spectrometry and chromatographic
conditions were sought to develop a method with adequate selectivity and sensitivity.
To achieve the highest selectivity feasible, different columns were tested. Acquity
UPLC BEH C18 seemed to be a good choice as it gave sharp and symmetric peaks.
Given the above-mentioned UPLC and mass spectrometry conditions, it was possible
to set LLOQ at 10 ng/L with signal/noise ratio of more than 10 (Figure 1A). No
carryover was detected when a double blank OF sample was injected following
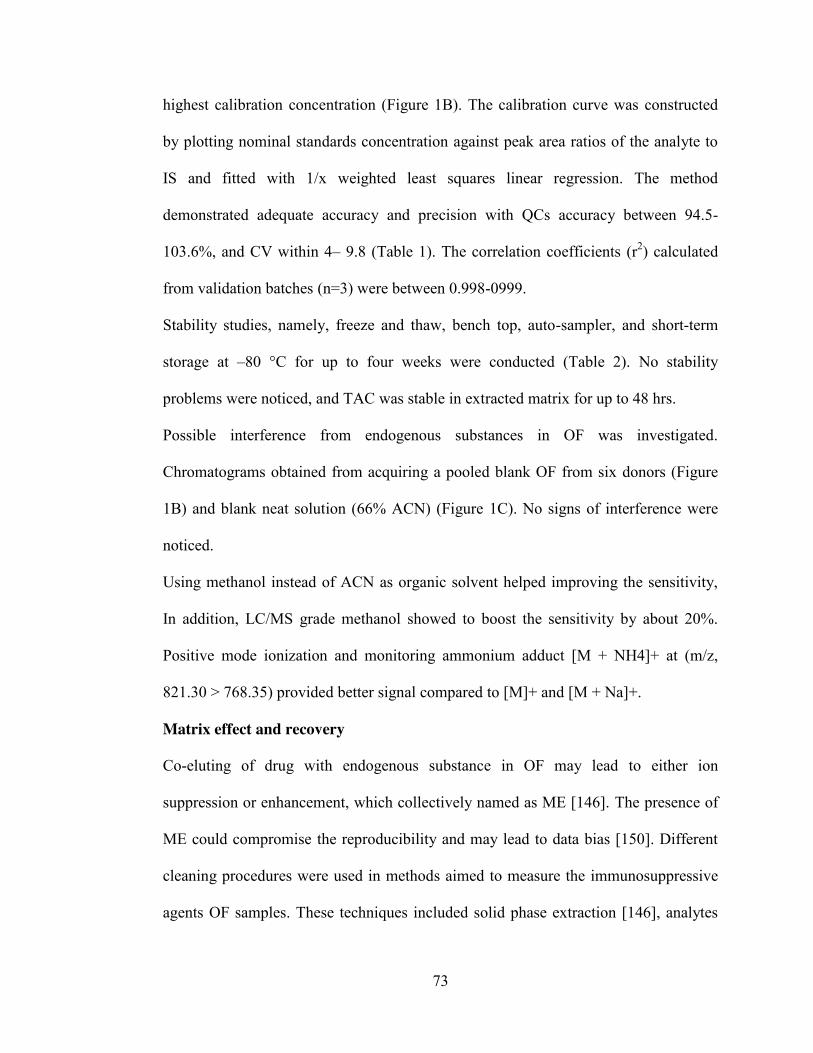
73
highest calibration concentration (Figure 1B). The calibration curve was constructed
by plotting nominal standards concentration against peak area ratios of the analyte to
IS and fitted with 1/x weighted least squares linear regression. The method
demonstrated adequate accuracy and precision with QCs accuracy between 94.5-
103.6%, and CV within 4– 9.8 (Table 1). The correlation coefficients (r2) calculated
from validation batches (n=3) were between 0.998-0999.
Stability studies, namely, freeze and thaw, bench top, auto-sampler, and short-term
storage at –80 °C for up to four weeks were conducted (Table 2). No stability
problems were noticed, and TAC was stable in extracted matrix for up to 48 hrs.
Possible interference from endogenous substances in OF was investigated.
Chromatograms obtained from acquiring a pooled blank OF from six donors (Figure
1B) and blank neat solution (66% ACN) (Figure 1C). No signs of interference were
noticed.
Using methanol instead of ACN as organic solvent helped improving the sensitivity,
In addition, LC/MS grade methanol showed to boost the sensitivity by about 20%.
Positive mode ionization and monitoring ammonium adduct [M + NH4]+ at (m/z,
821.30 > 768.35) provided better signal compared to [M]+ and [M + Na]+.
Matrix effect and recovery
Co-eluting of drug with endogenous substance in OF may lead to either ion
suppression or enhancement, which collectively named as ME [146]. The presence of
ME could compromise the reproducibility and may lead to data bias [150]. Different
cleaning procedures were used in methods aimed to measure the immunosuppressive
agents OF samples. These techniques included solid phase extraction [146], analytes
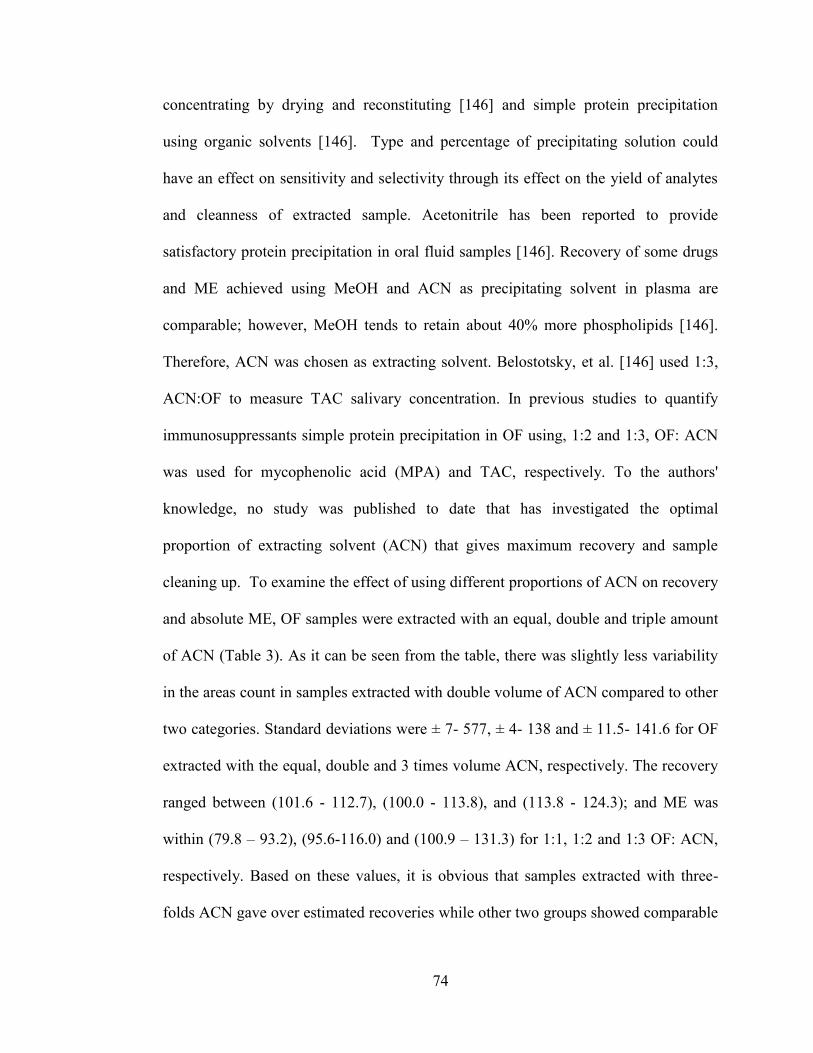
74
concentrating by drying and reconstituting [146] and simple protein precipitation
using organic solvents [146]. Type and percentage of precipitating solution could
have an effect on sensitivity and selectivity through its effect on the yield of analytes
and cleanness of extracted sample. Acetonitrile has been reported to provide
satisfactory protein precipitation in oral fluid samples [146]. Recovery of some drugs
and ME achieved using MeOH and ACN as precipitating solvent in plasma are
comparable; however, MeOH tends to retain about 40% more phospholipids [146].
Therefore, ACN was chosen as extracting solvent. Belostotsky, et al. [146] used 1:3,
ACN:OF to measure TAC salivary concentration. In previous studies to quantify
immunosuppressants simple protein precipitation in OF using, 1:2 and 1:3, OF: ACN
was used for mycophenolic acid (MPA) and TAC, respectively. To the authors'
knowledge, no study was published to date that has investigated the optimal
proportion of extracting solvent (ACN) that gives maximum recovery and sample
cleaning up. To examine the effect of using different proportions of ACN on recovery
and absolute ME, OF samples were extracted with an equal, double and triple amount
of ACN (Table 3). As it can be seen from the table, there was slightly less variability
in the areas count in samples extracted with double volume of ACN compared to other
two categories. Standard deviations were ± 7- 577, ± 4- 138 and ± 11.5- 141.6 for OF
extracted with the equal, double and 3 times volume ACN, respectively. The recovery
ranged between (101.6 - 112.7), (100.0 - 113.8), and (113.8 - 124.3); and ME was
within (79.8 – 93.2), (95.6-116.0) and (100.9 – 131.3) for 1:1, 1:2 and 1:3 OF: ACN,
respectively. Based on these values, it is obvious that samples extracted with three-
folds ACN gave over estimated recoveries while other two groups showed comparable
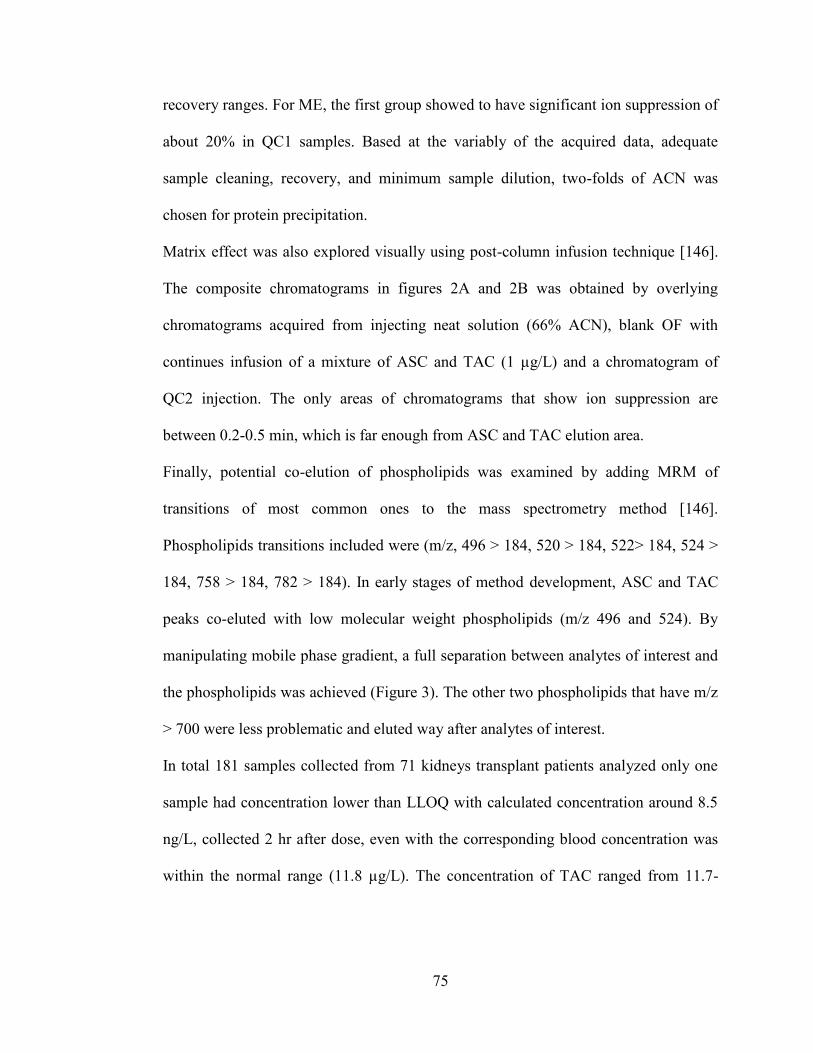
75
recovery ranges. For ME, the first group showed to have significant ion suppression of
about 20% in QC1 samples. Based at the variably of the acquired data, adequate
sample cleaning, recovery, and minimum sample dilution, two-folds of ACN was
chosen for protein precipitation.
Matrix effect was also explored visually using post-column infusion technique [146].
The composite chromatograms in figures 2A and 2B was obtained by overlying
chromatograms acquired from injecting neat solution (66% ACN), blank OF with
continues infusion of a mixture of ASC and TAC (1 µg/L) and a chromatogram of
QC2 injection. The only areas of chromatograms that show ion suppression are
between 0.2-0.5 min, which is far enough from ASC and TAC elution area.
Finally, potential co-elution of phospholipids was examined by adding MRM of
transitions of most common ones to the mass spectrometry method [146].
Phospholipids transitions included were (m/z, 496 > 184, 520 > 184, 522> 184, 524 >
184, 758 > 184, 782 > 184). In early stages of method development, ASC and TAC
peaks co-eluted with low molecular weight phospholipids (m/z 496 and 524). By
manipulating mobile phase gradient, a full separation between analytes of interest and
the phospholipids was achieved (Figure 3). The other two phospholipids that have m/z
> 700 were less problematic and eluted way after analytes of interest.
In total 181 samples collected from 71 kidneys transplant patients analyzed only one
sample had concentration lower than LLOQ with calculated concentration around 8.5
ng/L, collected 2 hr after dose, even with the corresponding blood concentration was
within the normal range (11.8 µg/L). The concentration of TAC ranged from 11.7-
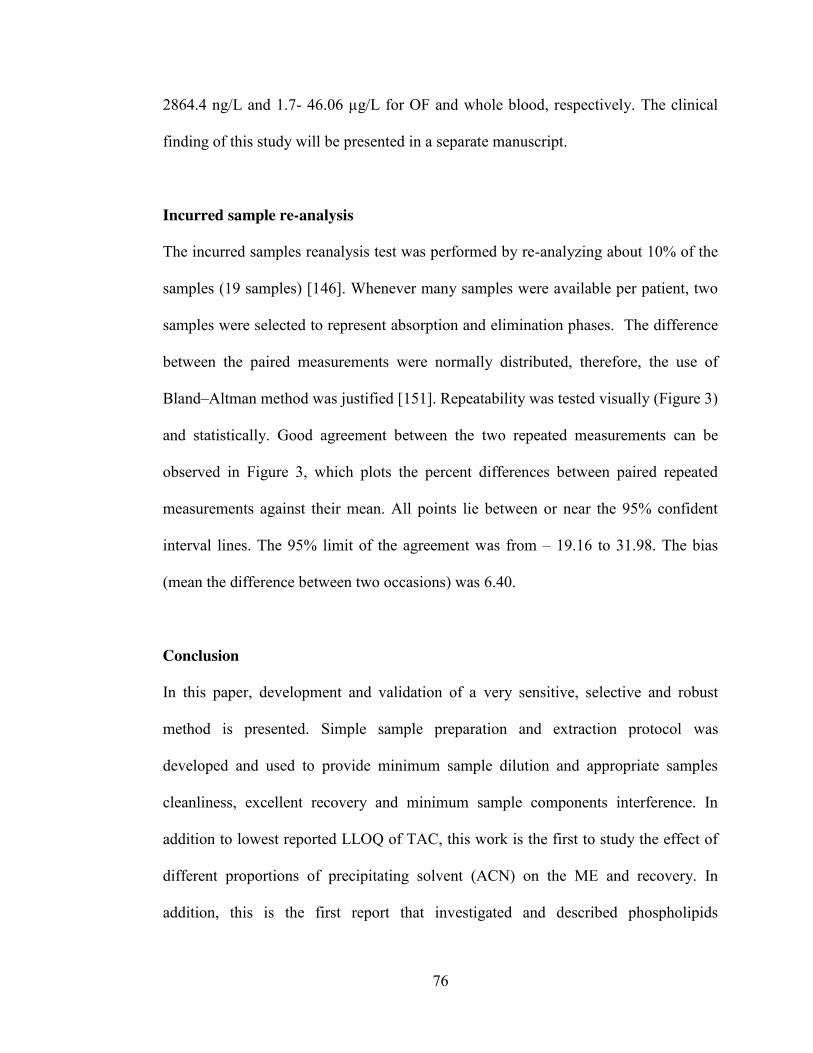
76
2864.4 ng/L and 1.7- 46.06 µg/L for OF and whole blood, respectively. The clinical
finding of this study will be presented in a separate manuscript.
Incurred sample re-analysis
The incurred samples reanalysis test was performed by re-analyzing about 10% of the
samples (19 samples) [146]. Whenever many samples were available per patient, two
samples were selected to represent absorption and elimination phases. The difference
between the paired measurements were normally distributed, therefore, the use of
Bland–Altman method was justified [151]. Repeatability was tested visually (Figure 3)
and statistically. Good agreement between the two repeated measurements can be
observed in Figure 3, which plots the percent differences between paired repeated
measurements against their mean. All points lie between or near the 95% confident
interval lines. The 95% limit of the agreement was from – 19.16 to 31.98. The bias
(mean the difference between two occasions) was 6.40.
Conclusion
In this paper, development and validation of a very sensitive, selective and robust
method is presented. Simple sample preparation and extraction protocol was
developed and used to provide minimum sample dilution and appropriate samples
cleanliness, excellent recovery and minimum sample components interference. In
addition to lowest reported LLOQ of TAC, this work is the first to study the effect of
different proportions of precipitating solvent (ACN) on the ME and recovery. In
addition, this is the first report that investigated and described phospholipids
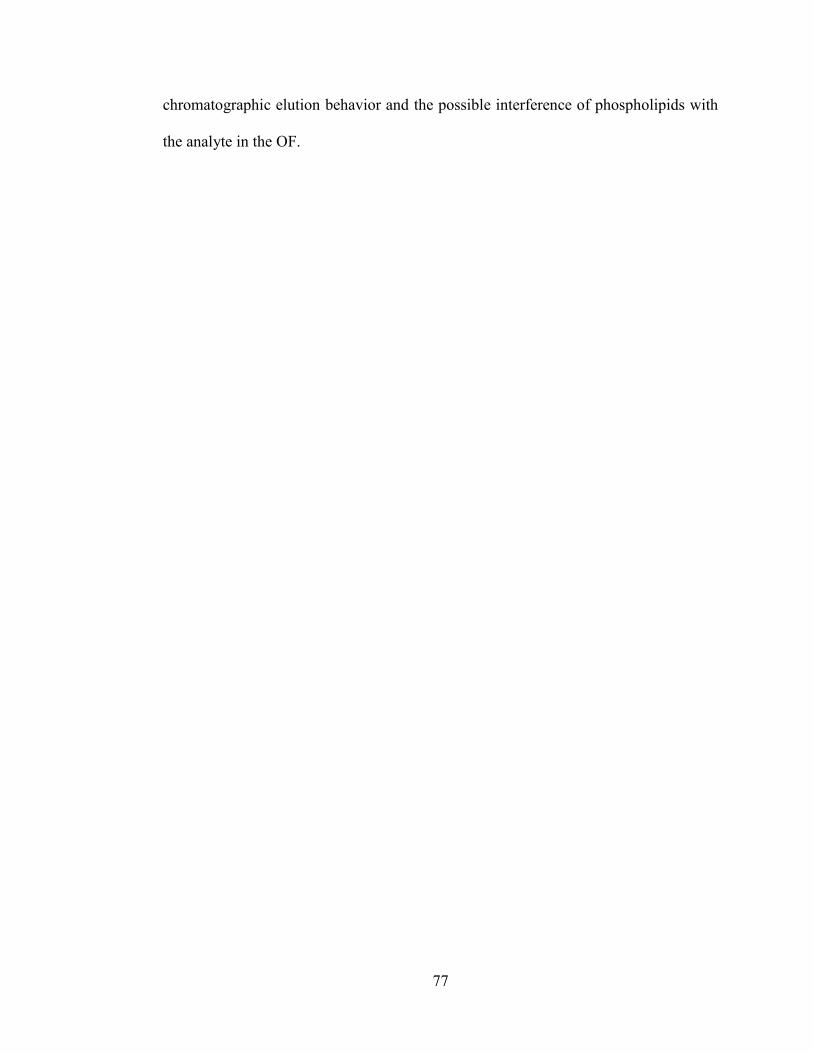
77
chromatographic elution behavior and the possible interference of phospholipids with
the analyte in the OF.
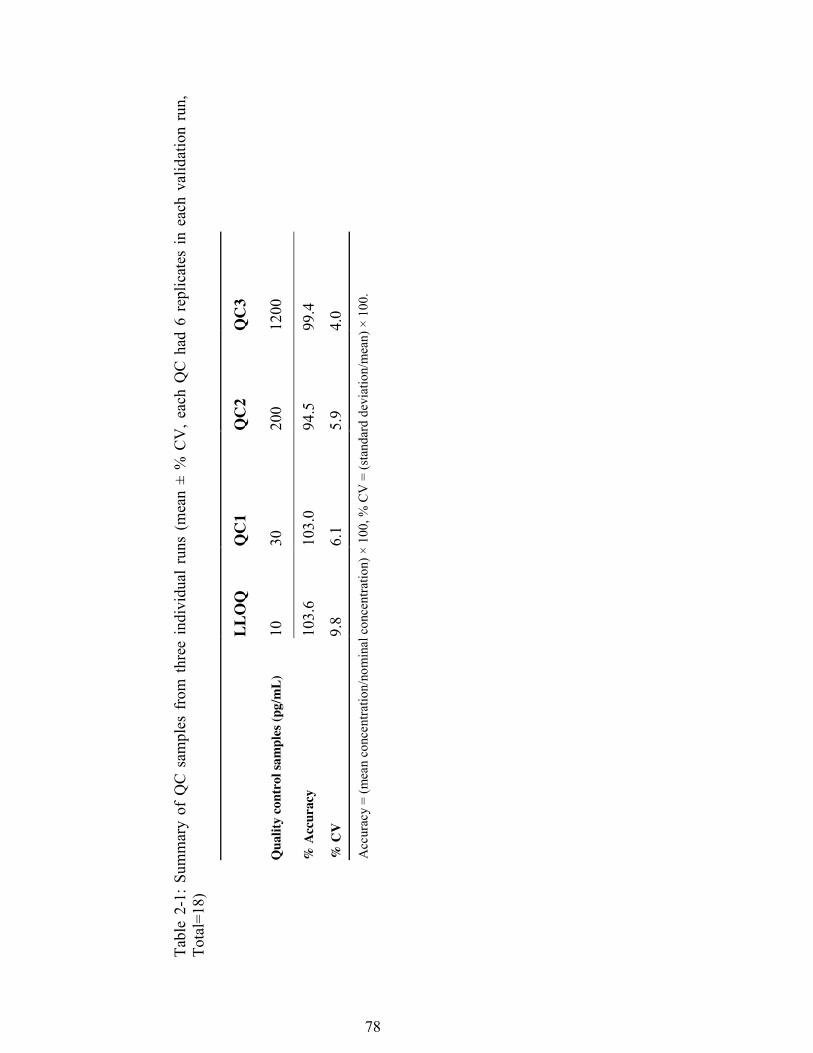
78
Tabl
e 2-
1: S
umm
ary
of Q
C s
ampl
es f
rom
thr
ee i
ndiv
idua
l ru
ns (
mea
n ±
% C
V, e
ach
QC
had
6 r
eplic
ates
in e
ach
valid
atio
n ru
n,
Tota
l=18
)
LL
OQ
Q
C1
QC
2 Q
C3
Qua
lity
cont
rol s
ampl
es (p
g/m
L)
10
30
200
1200
% A
ccur
acy
103.
6 10
3.0
94.5
99
.4
% C
V
9.8
6.1
5.9
4.0
Acc
urac
y =
(mea
n co
ncen
tratio
n/no
min
al c
once
ntra
tion)
× 1
00, %
CV
= (s
tand
ard
devi
atio
n/m
ean)
× 1
00.
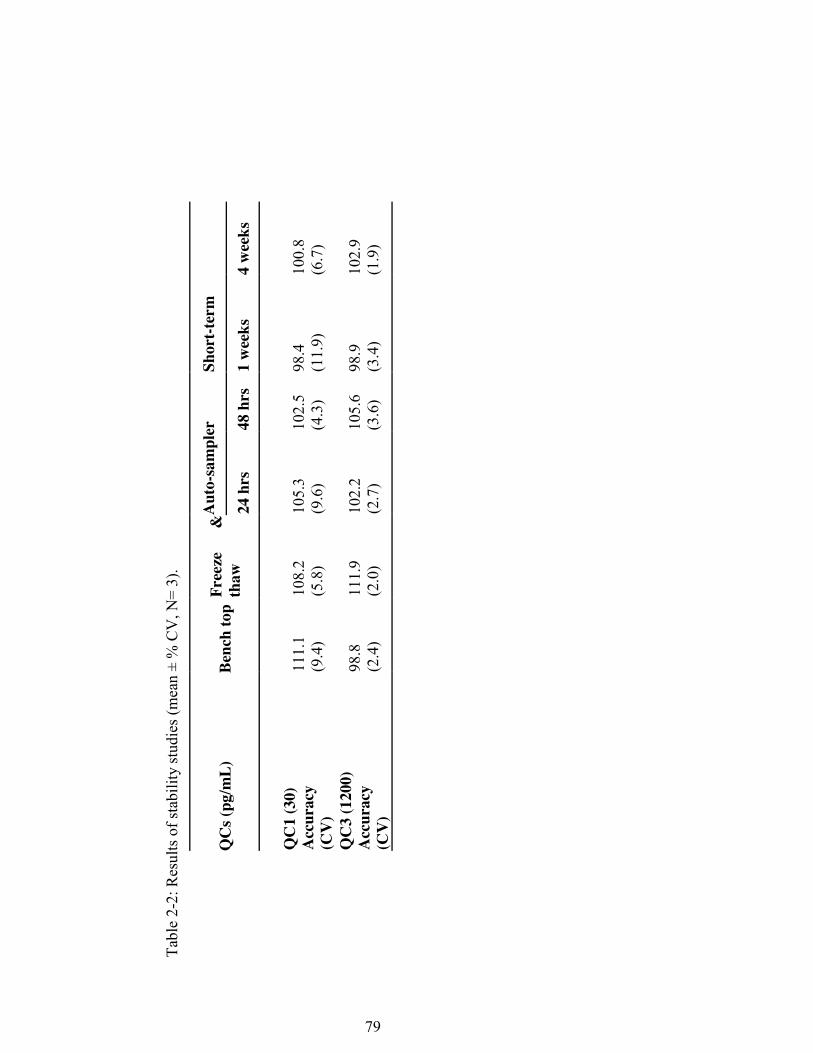
79
Tabl
e 2-
2: R
esul
ts o
f sta
bilit
y st
udie
s (m
ean
± %
CV
, N=
3).
QC
s (pg
/mL)
Be
nch
top
Free
ze
&
thaw
A
uto-
sam
pler
Sh
ort-t
erm
24 h
rs
48 h
rs
1 w
eeks
4
wee
ks
Q
C1
(30)
A
ccur
acy
(CV
)
111.
1 (9
.4)
108.
2 (5
.8)
105.
3 (9
.6)
102.
5
(4.3
) 98
.4
(11.
9)
100.
8 (6
.7)
QC
3 (1
200)
A
ccur
acy
(CV
)
98.8
(2
.4)
111.
9 (2
.0)
102.
2 (2
.7)
105.
6
(3.6
) 98
.9
(3.4
) 10
2.9
(1.9
)

80
Tabl
e 2-
3: E
ffec
t of d
iffer
ent r
atio
s of
ora
l flu
id s
ampl
e: e
xtra
ctio
n so
lven
t (A
CN
) on
reco
very
and
abs
olut
e m
atrix
eff
ect,
expr
esse
d as
mea
n pe
ak a
rea
± st
d ( n
=3)
Q
C1
(30
pg/m
L)
QC
2 (2
00 p
g/m
L)
QC
3 (1
200
pg/m
L)
Mat
rix
1:1
1:2
1:3
1:1
1:2
1:3
1:1
1:2
1:3
De-
ioni
zed
wat
er
104.
0 ±
(7.5
) 91
.6 ±
(4
.0)
85.0
±
(14.
7)
1592
±
(44.
5)
1738
.6 ±
(5
0.3)
17
19.0
±
(141
.6)
4260
.0 ±
(5
77.0
) 46
53.0
±
(109
.1 )
4409
.3±
(138
.5)
Extr
acte
d O
F 83
.0 ±
(7
.0)
106.
3 ±
(8.1
) 11
1.6
± (1
3.5)
14
85.3
±
(138
.5)
1688
.6 ±
(5
3.6)
17
74.6
±
(47.
1)
3916
.3 ±
(1
39.1
) 44
52.3
±
(138
,5)
4452
.3 ±
(6
3.3)
Post
-ext
ract
ion
Spik
ed O
F 81
.6 ±
(7
.7)
106.
3 ±
(5.6
) 96
±
(11.
5)
1317
.3 ±
(3
6.4)
14
83.6
±
(66.
5)
1559
.0 ±
(6
7)
3759
.6 ±
(2
44.7
) 40
90.3
±
(20.
2)
3579
.3 ±
(5
9.2)
Rec
over
y (%
) 10
1.6
100.
0 11
6.3
112.
7 11
3.8
113.
8 10
4.1
108.
8 12
4.3
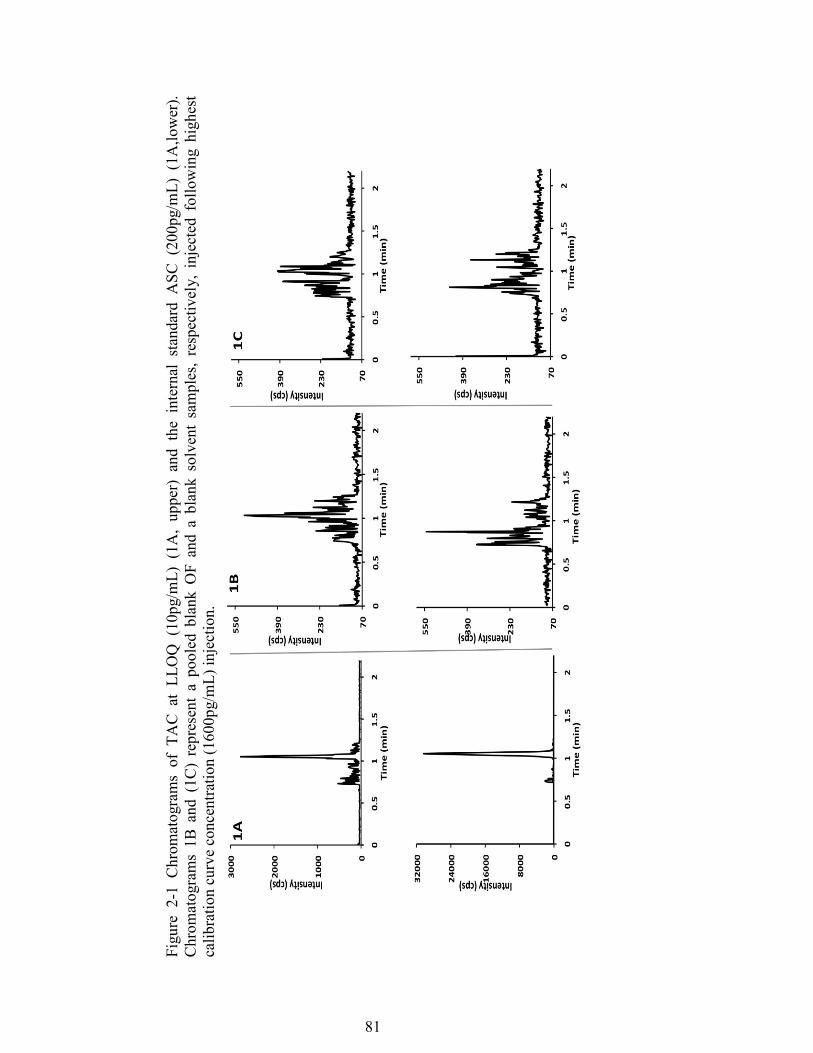
81
Figu
re 2
-1 C
hrom
atog
ram
s of
TA
C a
t LL
OQ
(10
pg/m
L) (
1A,
uppe
r) a
nd t
he i
nter
nal
stan
dard
ASC
(20
0pg/
mL)
(1A
,low
er).
Chr
omat
ogra
ms
1B a
nd (
1C)
repr
esen
t a
pool
ed b
lank
OF
and
a bl
ank
solv
ent
sam
ples
, re
spec
tivel
y, i
njec
ted
follo
win
g hi
ghes
t ca
libra
tion
curv
e co
ncen
tratio
n (1
600p
g/m
L) in
ject
ion.
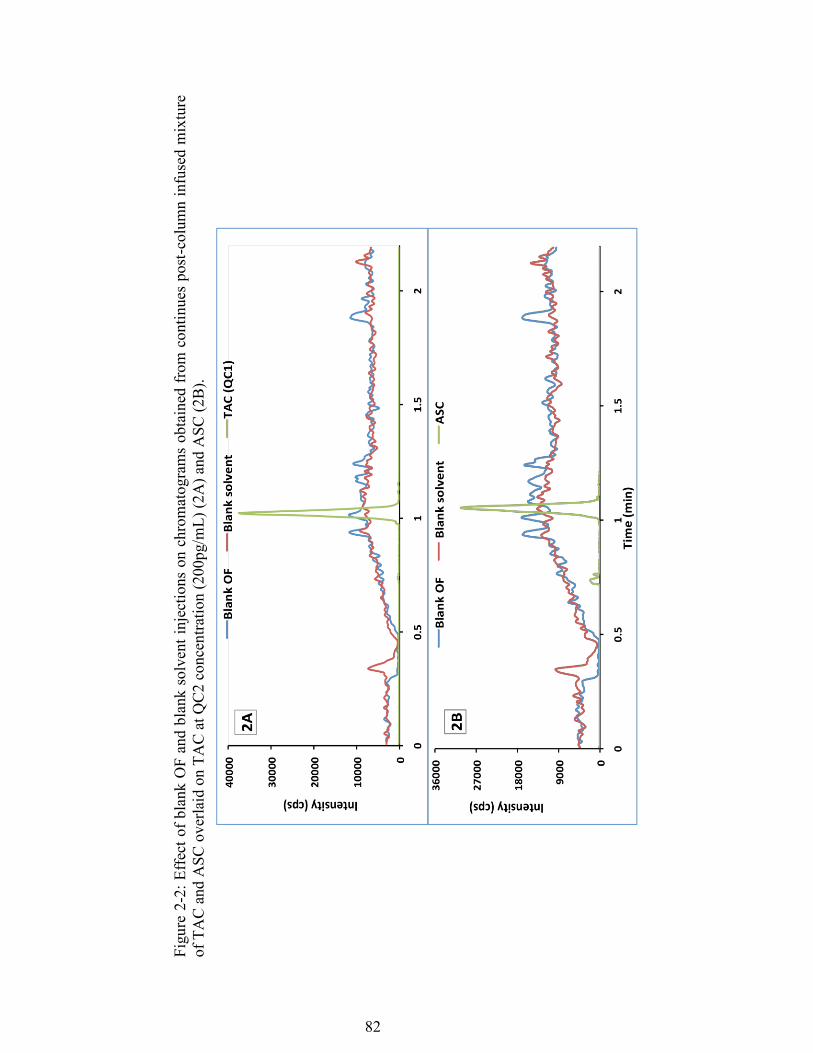
82
Figu
re 2
-2: E
ffec
t of b
lank
OF
and
blan
k so
lven
t inj
ectio
ns o
n ch
rom
atog
ram
s ob
tain
ed fr
om c
ontin
ues
post
-col
umn
infu
sed
mix
ture
of
TA
C a
nd A
SC o
verla
id o
n TA
C a
t QC
2 co
ncen
tratio
n (2
00pg
/mL)
(2A
) and
ASC
(2B
).
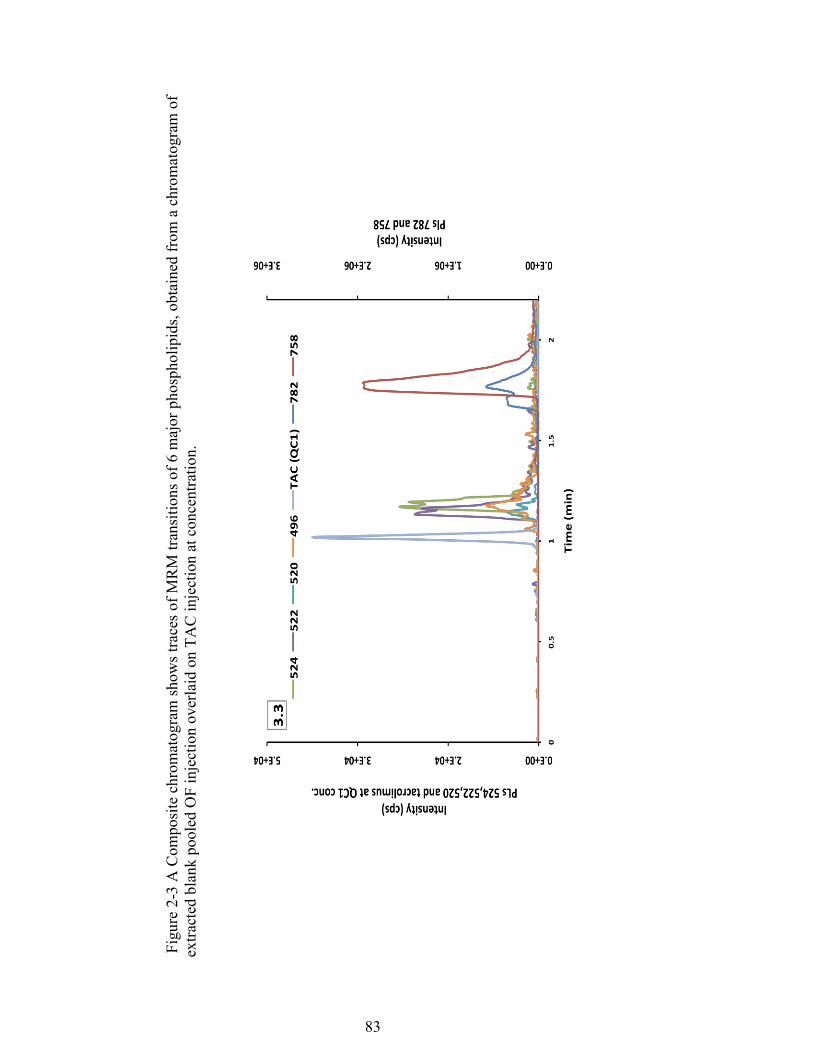
83
Fig
ure 2-
3 A
Com
posi
te c
hrom
atog
ram
show
s tra
ces o
f MR
M tr
ansi
tions
of 6
maj
or p
hosp
holip
ids,
obta
ined
from
a c
hrom
atog
ram
of
extra
cted
bla
nk p
oole
d O
F in
ject
ion
over
laid
on
TAC
inje
ctio
n at
con
cent
ratio
n.
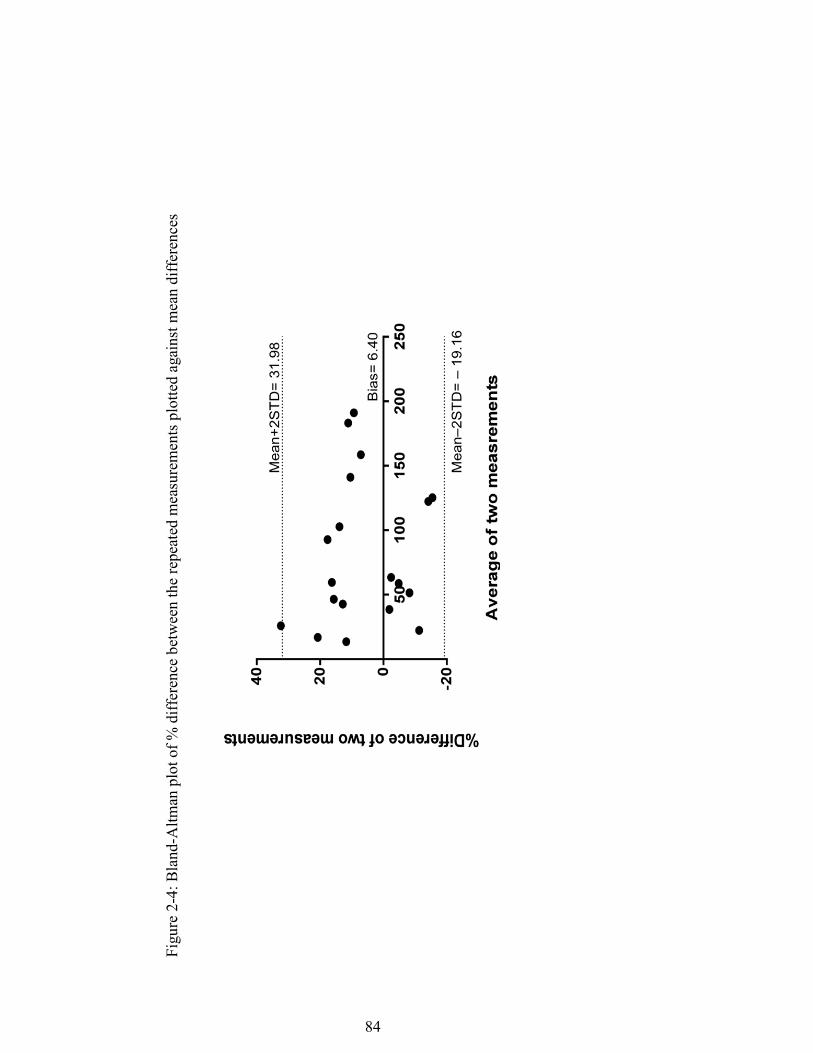
84
Figu
re 2
-4: B
land
-Altm
an p
lot o
f % d
iffer
ence
bet
wee
n th
e re
peat
ed m
easu
rem
ents
plo
tted
agai
nst m
ean
diff
eren
ces
85
References
1. Borra, L.C., et al., High within-patient variability in the clearance of tacrolimus is a risk factor for poor long-term outcome after kidney transplantation. Nephrol Dial Transplant, 2010. 25(8): p. 2757-63.
2. Staatz, C.E. and S.E. Tett, Clinical pharmacokinetics and pharmacodynamics
of tacrolimus in solid organ transplantation. Clin Pharmacokinet, 2004. 43(10): p. 623-53.
3. Scott, L.J., et al., Tacrolimus: a further update of its use in the management of
organ transplantation. Drugs, 2003. 63(12): p. 1247-97. 4. Taylor, P.J., et al., The current role of liquid chromatography-tandem mass
spectrometry in therapeutic drug monitoring of immunosuppressant and antiretroviral drugs. Clin Biochem, 2011. 44(1): p. 14-20.
5. Lemaitre, F., M. Antignac, and C. Fernandez, Monitoring of tacrolimus
concentrations in peripheral blood mononuclear cells: Application to cardiac transplant recipients. Clin Biochem, 2013.
6. Capron, A., et al., Correlation of tacrolimus levels in peripheral blood
mononuclear cells with histological staging of rejection after liver transplantation: preliminary results of a prospective study. Transpl Int, 2012. 25(1): p. 41-7.
7. Sandborn, W.J., et al., Early cellular rejection after orthotopic liver
transplantation correlates with low concentrations of FK506 in hepatic tissue. Hepatology, 1995. 21(1): p. 70-6.
8. Zahir, H., et al., Changes in tacrolimus distribution in blood and plasma
protein binding following liver transplantation. Ther Drug Monit, 2004. 26(5): p. 506-15.
9. Zahir, H., et al., Factors affecting variability in distribution of tacrolimus in
liver transplant recipients. Br J Clin Pharmacol, 2004. 57(3): p. 298-309. 10. Leichtle, A.B., et al., Potential of dried blood self-sampling for cyclosporine
c(2) monitoring in transplant outpatients. J Transplant, 2010. 2010: p. 201918. 11. Tennison, M., et al., Feasibility and acceptance of salivary monitoring of
antiepileptic drugs via the US Postal Service. Ther Drug Monit, 2004. 26(3): p. 295-9.
86
12. Capron, A., et al., CYP3A5 and ABCB1 polymorphisms influence tacrolimus concentrations in peripheral blood mononuclear cells after renal transplantation. Pharmacogenomics, 2010. 11(5): p. 703-14.
13. Capron, A., et al., Validation of a liquid chromatography-mass spectrometric
assay for tacrolimus in peripheral blood mononuclear cells. Ther Drug Monit, 2009. 31(2): p. 178-86.
14. Noll, B.D., et al., Validation of an LC-MS/MS Method to Measure Tacrolimus
in Rat Kidney and Liver Tissue and Its Application to Human Kidney Biopsies. Ther Drug Monit, 2013.
15. Elens, L., et al., 1199G>A and 2677G>T/A polymorphisms of ABCB1
independently affect tacrolimus concentration in hepatic tissue after liver transplantation. Pharmacogenet Genomics, 2007. 17(10): p. 873-83.
16. Capron, A., et al., Validation of a liquid chromatography-mass spectrometric
assay for tacrolimus in liver biopsies after hepatic transplantation: correlation with histopathologic staging of rejection. Ther Drug Monit, 2007. 29(3): p. 340-8.
17. Hoogtanders, K., et al., Dried blood spot measurement of tacrolimus is
promising for patient monitoring. Transplantation, 2007. 83(2): p. 237-8. 18. Hoogtanders, K., et al., Therapeutic drug monitoring of tacrolimus with the
dried blood spot method. J Pharm Biomed Anal, 2007. 44(3): p. 658-64. 19. Cheung, C.Y., et al., Dried blood spot measurement: application in tacrolimus
monitoring using limited sampling strategy and abbreviated AUC estimation. Transpl Int, 2008. 21(2): p. 140-5.
20. Koop, D.R., et al., Analysis of tacrolimus and creatinine from a single dried
blood spot using liquid chromatography tandem mass spectrometry. J Chromatogr B Analyt Technol Biomed Life Sci, 2013. 926: p. 54-61.
21. Hinchliffe, E., J.E. Adaway, and B.G. Keevil, Simultaneous measurement of
cyclosporin A and tacrolimus from dried blood spots by ultra high performance liquid chromatography tandem mass spectrometry. J Chromatogr B Analyt Technol Biomed Life Sci, 2012. 883-884: p. 102-7.
22. den Burger, J.C., et al., Analysis of cyclosporin A, tacrolimus, sirolimus, and
everolimus in dried blood spot samples using liquid chromatography tandem mass spectrometry. Anal Bioanal Chem, 2012. 404(6-7): p. 1803-11.
87
23. Webb, N.J., et al., Fingerprick blood samples can be used to accurately measure tacrolimus levels by tandem mass spectrometry. Pediatr Transplant, 2005. 9(6): p. 729-33.
24. Yonan, N., et al., Monitoring of cyclosporine levels in transplant recipients
using self-administered fingerprick sampling. Clin Transplant, 2006. 20(2): p. 221-5.
25. Haeckel, R., Factors influencing the saliva/plasma ratio of drugs. Ann N Y
Acad Sci, 1993. 694: p. 128-42. 26. Liu, H. and M.R. Delgado, Therapeutic drug concentration monitoring using
saliva samples. Focus on anticonvulsants. Clin Pharmacokinet, 1999. 36(6): p. 453-70.
27. Haeckel, R. and P. Hanecke, Application of saliva for drug monitoring. An in
vivo model for transmembrane transport. Eur J Clin Chem Clin Biochem, 1996. 34(3): p. 171-91.
28. Jusko, W.J. and R.L. Milsap, Pharmacokinetic principles of drug distribution
in saliva. Ann N Y Acad Sci, 1993. 694: p. 36-47. 29. Belostotsky, V., et al., Measurement of saliva tacrolimus levels in pediatric
renal transplant recipients. Pediatr Nephrol, 2011. 26(1): p. 133-8. 30. Shen, B., et al., Determination of total, free and saliva mycophenolic acid with
a LC-MS/MS method: application to pharmacokinetic study in healthy volunteers and renal transplant patients. J Pharm Biomed Anal, 2009. 50(3): p. 515-21.
31. US Department of Health and Human Services. Food and Drug
Administration (FDA). Center for Drug Evaluation and Research (CDER). Guidance for Industry.Bioanalytical Method Validation 2001.
32. Mei, H., et al., Investigation of matrix effects in bioanalytical high-
performance liquid chromatography/tandem mass spectrometric assays: application to drug discovery. Rapid Commun Mass Spectrom, 2003. 17(1): p. 97-103.
33. Zhang, G. and C.E. Wujcik, Overcoming ionization effects through
chromatography: a case study for the ESI-LC-MS/MS quantitation of a hydrophobic therapeutic agent in human serum using a stable-label internal standard. J Chromatogr B Analyt Technol Biomed Life Sci, 2009. 877(22): p. 2003-10.
88
34. Dams, R., et al., Matrix effect in bio-analysis of illicit drugs with LC-MS/MS: influence of ionization type, sample preparation, and biofluid. J Am Soc Mass Spectrom, 2003. 14(11): p. 1290-4.
35. Matuszewski, B.K., M.L. Constanzer, and C.M. Chavez-Eng, Strategies for the
assessment of matrix effect in quantitative bioanalytical methods based on HPLC-MS/MS. Anal Chem, 2003. 75(13): p. 3019-30.
36. Mendonza, A.E., R.Y. Gohh, and F. Akhlaghi, Analysis of mycophenolic acid
in saliva using liquid chromatography tandem mass spectrometry. Ther Drug Monit, 2006. 28(3): p. 402-6.
37. Mendonza, A., R. Gohh, and F. Akhlaghi, Determination of cyclosporine in
saliva using liquid chromatography-tandem mass spectrometry. Ther Drug Monit, 2004. 26(5): p. 569-75.
38. Wiesen, M.H., et al., Liquid chromatography-tandem mass spectrometry
method for the quantification of mycophenolic acid and its phenolic glucuronide in saliva and plasma using a standardized saliva collection device. J Chromatogr A, 2012. 1241: p. 52-9.
39. Chambers, E., et al., Systematic and comprehensive strategy for reducing
matrix effects in LC/MS/MS analyses. J Chromatogr B Analyt Technol Biomed Life Sci, 2007. 852(1-2): p. 22-34.
40. Bland, J.M. and D.G. Altman, Statistical methods for assessing agreement
between two methods of clinical measurement. Lancet, 1986. 1(8476): p. 307-10.
41. van Amsterdam, P., et al., The European Bioanalysis Forum community's
evaluation, interpretation and implementation of the European Medicines Agency guideline on Bioanalytical Method Validation. Bioanalysis, 2013. 5(6): p. 645-59.

89
Chapter 3 : MANUSCRIPT III
To be submitted to Clinical Pharmacokinetics
Therapeutic Drug Monitoring of Tacrolimus in Oral Fluids
Mwlod Ghareeb1, Reginald Y. Gohh 2, Fatemeh Akhlaghi1
DEPARTMENT AND INSTITUTION
1Department of Biomedical and Pharmaceutical Sciences, University of Rhode Island,
Kingston, RI.
2 Division of Organ Transplantation, Rhode Island Hospital, Warren Alpert Medical
School of Brown University, Providence, Rhode Island, USA.
90
Address correspondence to: Fatemeh Akhlaghi, PharmD, PhD, Clinical
Pharmacokinetics Research Laboratory, Department of Biomedical and
Pharmaceutical Sciences, University of Rhode Island, 495A College of Pharmacy, 7
Greenhouse Road, Kingston, RI 02881, USA. Phone: (401) 874 9205. Fax: (401) 874
5787. Email: [email protected]
DISCLOSURE
No conflict of interest is declared.
91
ABBREVIATIONS
C0: Pre dose concentration, C2: Two hours-post dose concentration, OF: Oral fluid, P-
gp: P-glycoprotein transporter, TAC: Tacrolimus, TACs: Tacrolimus salivary
concentration, TRNs: Transferrin salivary concentration, TRNs: Transferrin salivary
concentration, TDM: Therapeutic drug monitoring
92
Abstract
Oral fluids, has attracted great attention for therapeutic drug monitoring due to
noninvasive nature and the ease of sampling. Considering the only unbound drug can
pass through capillaries of salivary gland, salivary drug concentration that is present in
can provide an alternative yet convenient specimen for estimating unbound fraction.
In this study, the correlation between tacrolimus concentration in oral fluids and blood
was investigated. Moreover, factors that may affect such correlation, including
sampling time, salivary blood contamination, and food were investigated. In total 256
oral fluid samples with matching blood samples from stable kidney transplant
recipients were included in this study. Conclusion: Effect of salivary blood
contamination on TACs was minimal when TRN level was ≤ 6.6 mg/dL. Acceptable
correlation between oral fluid and blood tacrolimus concentration was observed in
fasted samples collected at pre-dose as compared with non-fasted samples collected
post dose.

93
Introduction
To prevent allograft rejection, organ transplant recipients require chronic
immunosuppressive therapy [1]. Tacrolimus (TAC) is a widely prescribed
immunosuppressive agent for solid organ transplant recipients [1]. It acts by binding
to an immunophilin, FK506-binding protein 12 (FKBP12) [2]. The complex then
inhibits calcineurin phosphatase and thereby halts T-cell activation [3]. TAC is highly
lipophilic and excreted from the body after undergoing extensive metabolism by the
CYP450 3A4/5 enzymes [4]. Bioavailability of TAC varies significantly due to
genetic polymorphism in CYP3A as well as co-administration of CYP3A enzymes
inhibitors or inducers [5-8], thus increasing intra and inter-subject variability in
pharmacokinetics [9-12]. In addition, TAC is a substrate for glycoprotein efflux
transporter (P-gp), which is also known as multidrug resistance protein 1 (MDR1)
encoded by the ABCB1 gene [13]. Differences in the expression of MDR1 [13] and
genotype [14] may contribute to inter-individual variability in tacrolimus
pharmacokinetics. Given narrow therapeutic index and high variability, ongoing
therapeutic drug monitoring is essential to maintain allograft survival and reduce
toxicity [15].
Venipuncture is the recommended medium for TAC therapeutic drug monitoring [1].
However, due the invasive nature of blood sampling, alternative matrices were
investigated including dried blood spot and oral fluid (OF) monitoring [16-20]. Oral
fluid has attracted great attention as an alternative medium to venipuncture blood [21-
23]. The main advantage of OF sampling is noninvasive sample collection,
significantly reduced sample collection cost [24, 25] and the possibility of home self-

94
sampling for patient convenience [24]. In addition, biological barriers are permeable
to free drug fraction only considering that protein bound complexes are excluded from
passive diffusion because of their large size [26]. Consequently, the portion of a drug
that is present in OF represents the unbound fraction [26]. Given that the free fraction
is responsible for therapeutic effect and toxicity [27], measuring drug concentration in
OF may give better prediction of therapeutic outcomes.
The area under the concentration-time curve (AUC) and maximum concentration
(Cmax) correlate better with clinical outcomes and toxicity that blood sample [28].
Since calculation of AUC requires collection of several samples over a 12 hour hour
dosing interval, venipuncture blood sampling is impractical for routine calculation of
AUC. The simplicity of OF sample collection allows multiple sampling, therefore,
estimating AUC and Cmax will be possible. A few reports were published on
immunosuppressant, namely, cyclosporine A [19, 29], mycophenolic acid [17, 30, 31]
and TAC [20].
The aim of this study was to study factors that may affect correlation between the
TAC concentrations in blood and OF, as well as the quality of OF samples obtained at
different sampling condition.
Study population
Studies protocols approved by Institutional Review Board of Rhode Island Hospital
(Providence, RI). Samples included in this paper were collected, in two studies, from
patients attending kidney transplant clinics. Recruited patients were on triple
95
immunosuppressants regimen included tacrolimus, prednisone, and mycophenolic
acid.
Patients Samples
On the study day, patients underwent the physical examination by the physician and
asked to sign the informed consent. In the first study, venous blood samples (about 4
mL) were collected in ethylenediaminetetraacetic acid (EDTA) accompanied by
passive drooled rested OF samples collected in siliconized plastic cups. Samples
collected intermittently at certain time points, including pre-dose (time 0 = C0). In the
second study, blood samples were collected at C0 and C2. Matching OF samples
collected with ± 5 min from blood sample time at resting, 5 min after mouth rinsing
using bottled water, and instantly after taking a saliva stimulant (patients asked to put
a commercial sour candy in their mouth for 10 second with continues tong
movement). After pre-dose samples collection, patients were given a voucher for free
breakfast and asked to report back at study location shortly before C2 sampling time
when blood and corresponding OF samples were collected. All blood and OF samples
kept on dry ice till transferred to the Biomedical and Pharmaceutical Sciences (BPS)
department at University of Rhode Island and stored at -80 °C till analyzed.
Participant’s Demographic information is showed in Table 1.
Measuring TAC in blood and OF
Details of the LC-MS/MS method used to quantify TAC blood concentration is
described elsewhere [32]. In brief, sample extraction involved mixing 200µL of blood
sample with 800µL precipitating solution of ZnSO4 (17.28 g/L): methanol (30:70,

96
v/v) mixture contained ascomycin as internal standard (100ng/mL). After vortex
mixing, samples centrifuged for 10min at 13000 rpm.
Measuring TAC in OF
TAC concentration in OF was measured using a validated LC-MS/MS method
(manuscript II). In brief, chromatography separation was achieved with a run time of
2.2 min using an Acquity UPLC BEH C18 column kept at 60 °C and. Gradient elution
consisted of 2mM ammonium acetate/0.1 formic acid in water (mobile phase A) and
in methanol (mobile phase B) at 0.4 mL/ min flow rate. Initial mobile phase composed
of 50% solvent (B) increased gradually to 98% over 0.5 min and maintained at this
level till 1.8 min. Then mobile phase returned to initial conditions within 10 seconds
and maintained until the end of the run at 2.2 min to recondition the column for the
next run. The elution times of TAC and internal standard were 1.0 min.
A simple sample preparation and extraction procedures were followed, involved
adding 50µL of OF sample with 100µL of ACN precipitating solvent containing
internal standard (ascomycin, 600 ng/L) in 1.5 mL polypropylene tube. After vortex
mix for 10 seconds, the mixture was centrifuged at 10,000xg for 5 min at 20°C. The
supernatant was then transferred into an auto-sampler vial, and 10 μL was injected.
The dynamic range of was 30- 4800 ng/L. The lower limit of quantification (LLOQ)
was set at the concentration that had a signal-to-noise ratio (S/N) of ≥10;; accuracy of
80-120%; and a Coefficient of Variation (CV) less than 20%. Acceptance criteria for
QCs included accuracy between 85-115% and CV less than 15%. Selectivity assessed
by inspecting the presence of noise or peaks in chromatograms represent blank OF
samples injections (from 6 donors) compared with LLOQ sample chromatogram.
97
Statistical data analysis
Statistical analysis was performed using the SPSS software (version 22, SPSS Inc.,
Chicago, IL, USA). Normal distribution of the data was checked graphically and
confirmed with the Shapiro-Wilk test, and nonparametric tests were used whenever
needed.
Genomic studies:
DNAzol kit was used to extract genomic DNA from blood samples obtained from
each patient as described in manufacture’s protocol (Invitrogen Corporation, Carlsbad,
CA, USA). Samples genotyped for SNPs in for CYP3A and P-glycoprotein. The
genotyping process utilized allelic discrimination with a TaqMan® Drug Metabolism
Genotyping Assay. Life Technologies 7500 Real-Time PCR system (Life
Technologies, Foster City, CA) was used for SNP analysis.
Salivary blood contamination
To assess and quantify possible salivary blood contamination, transferrin kit from
Salimetrics LLC (State College, PA, USA) was used following manufacture's
recommendation [33]. Transferrin quantification was performed using SpectraMax
M5e Microplate Reader (Sunnyvale, CA, USA).
Results and discussion
12-hours profile
Eighty-five OF samples collected from 10 patients at rest. All samples had TACs
within assay’s validated range (30-4800 pg/mL). The concentration of TACs and
blood were 5.57±2.58 and 863±641, respectively
2 hours profile study

98
In total, 184 OF samples were analyzed. Five samples were excluded (four samples
had TAC concentration less than LLOQ all of them were stimulated samples, and one
rested C0 sample had visible blood contamination). On the other hand, 4 OF samples
had TAC concentration higher than upper limit of quantification; all of them had
salivary transferrin (TRNs) level higher than transferrin salivary assay quantification
range (0.08 - 6.6 mg/dL). Four additional samples had TRNs higher than the upper
limit of quantification. In total 171 samples were eligible for further data analysis.
Following manufacturer's recommended threshold of ≤1mg/dL TRNs, 131samples
would be eligible for further analysis (Table 2). Samples with TRNs level >1mg/dL
were 14 rested, 11 rinsed and 4 stimulated samples collected at C0 and 7 rested, 2
rinsed and 2 stimulated samples collected at C2.
Blood contamination and TACs concentration
Transferrin is a plasma protein with molecular weight of 76000 [33]. The presence of
TRN in OF is an indication of injury in oral cavity [33]. The possibility of salivary
blood contamination may increase in the presence of micro injuries from poor oral
hygiene, some infectious diseases and smoking [33]. TRNs level showed to have
diurnal variation, with a higher level in the afternoon compared with earlier collected
samples [34]. Contradicting finding regarding the effect of gender differences in the
TRNs level in children (higher in boys) [34] and adults (higher in females) [35].
Therefore, using TRNs as biomarker of salivary blood contamination should take into
the consideration the physiological and environmental factors that may alter the TRNs
level. About 85% of tacrolimus distribute into red blood cells [36]. Therefore, the
presence of blood traces in OF fluids may compromise the integrity of results. The
99
association between the amount of TRNs and TACs in samples collected at different
sampling conditions was investigated to determine samples to be included if final data
analysis.
The effect of increasing salivary TRN level seems to be compound specific. The
minimum amount of TRN in oral fluids showed a significant increase in testosterone
concentration, but for cortisol, the association only seen if signs of visual discoloration
are seen [37]. The concentration of mycophenolic acid in the oral fluid also showed an
elevated level accompanied by increased level of TRNs (excluding samples with
TRNs >1 mg/dL), in pre-dose fasted samples [17]. In this study, we measured the
transferrin concentration in oral fluid as a biomarker for blood contamination to
determine the threshold value at which TACs measurements would be compromised.
Following manufacturer's recommended threshold of ≤1mg/dL TRNs, data analysis
revealed a significant correlation between TACs and TRNs concentration (p-values
<0.05) in some sampling condition (Table 2, R-values denoted with *).
High TRNs is an indication of salivary blood contamination that may artificially
overestimate drugs concentration in OF [34]. Assumed increases of TACs levels in
response to high TRNs level was investigated in all sub-groups by calculating
mean+1STD and mean+2STD of TRNs in all samples with TRN level within the
dynamic range of the assay ≤6.6mg/dL (Table 3). All samples that have TRNs level
falls within mean+1STD or mean+2STD were included, and the correlation between
produced values (mean+1STD or mean+2STD) and TACs was tested. As can be seen
from Table 4, strong correlation in the same subgroups still exist (P value <0.5)
despite changes in TRNs levels. In addition, when all samples with TRNs ≤6.6mg/dL
100
included, statistically insignificant correlation is seen (tables 5) which is comparable
to those when only samples with TRNs ≤1mg/dL included (Tables 2). Furthermore,
when 20 samples with highest TRNs level (Table 6) plot against TACs, no correlation
is seen (Figures 1). These results are agreement with previous study [20]. In this
study, the effect of blood contamination on TACs level was investigated by spiking
OF with increasing amount of blood contained 11.2 μg/L TAC. Only samples that
showed signs of discoloration had elevated TAC level between 4.5 and 28%. Given all
above, it seems that there is insignificant/weak correlation between TACs and TRNs
concentration in samples with TRNs ≤6.6mg/dL;; therefore all samples with TRNs ≤
6.6mg/dL were included in further data analysis.
Effect of different sampling conditions
Changing salivary flow rate may alter the drug concentration drug concentrations in
the OF via altering contact time and the pH, consequently, affecting tubular re-
absorption and secretion [21, 38]. Changes of flow rate may affect some drugs but has
little to no effect on others [21, 38]. Tacrolimus is a highly lipophilic compound with
logP and pka value of 3.19- 5.59 and 9.96, respectively [39]. These characteristics
make TAC non-ionized in physiological pH, therefore, ideal for OF therapeutic drug
monitoring. Additionally, food consumption produces protein-rich OF compared with
protein-poor OF produced from other stimuli [40]. In this study, the effect of different
sampling conditions on quality of OF samples, as determined by TRNs level, and the
correlation between TAC concentrations in OF and blood, were studied.
101
The concentrations of TAC in OF in all subgroups are showed in Figures 2A and 2B.
In both time points, there is as decrease in concentration, with the highest level in the
rested sample followed by rinsed and stimulated samples.
Correlation between TAC in OF and blood
Interestingly, when comparing same sampling conditions across the two time points,
the mean concentration of TACs in C2 samples were always lower compared to C0
samples (Figures 3A, 3B and 3C, not statistically significant), despite the fact of
significantly higher TAC in C2 blood samples (Figures 3D). We attribute this to the
possible effect of food as C2 samples were collected after serving the breakfast.
Correlation between salivary and blood TAC concentrations are presented in Figures
4A and 4B. As can be seen, the correlation was best in rinsed samples collected at C0;
therefore, this subset of data was selected to check possible covariate effect.
Metabolizing enzymes CYP3A4 [41] and P-gp transporter are expressed in minor and
major salivary glands [42, 43]. The possible effect of genetic polymorphism in
CYPA3 enzymes and P-gp on the association between TAC concentration in OF and
blood was examined. Nonetheless, no statistically significant differences were seen in
different genotyped patients.
12 hours profile study
The High correlation between TACs and TRNs was seen in samples collected over 12
hours period (Figure 5A, R= 0.67, p <0.001). However, weak correlation was seen
between TAC concentration in OF and blood (Figure 5B, R = 0.13, p= 0.21). These
results are online with these obtained in 2 hours profile study in which poor
correlation in TAC concentration in OF and blood was seen.
102
Conclusion
Using OF as an alternative to blood for TDM is appealing due to ease and low-cost of
sampling. Many factors may alter drugs levels in OF. Results of this study indicate
that salivary blood contamination has minimal on TACs when TRN level was ≤ 6.6
mg/dL. Better correlation between oral fluid and blood tacrolimus concentration was
observed in fasted samples collected at pre-dose as compared with non-fasted samples
collected post dose.

103
Table 3-1: Summary of demographic information of participants
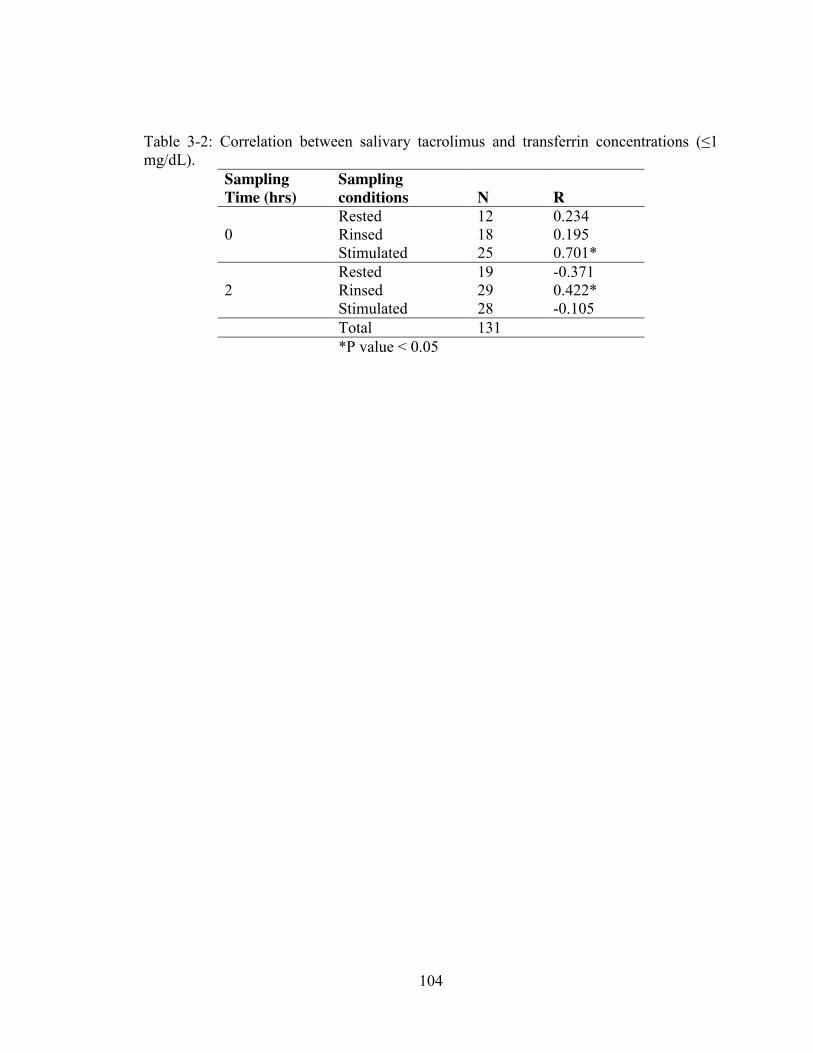
104
Table 3-2: Correlation between salivary tacrolimus and transferrin concentrations (≤1 mg/dL).
Sampling Sampling Time (hrs) conditions N R Rested 12 0.234 0 Rinsed 18 0.195 Stimulated 25 0.701* Rested 19 -0.371 2 Rinsed 29 0.422* Stimulated 28 -0.105 Total 131 *P value < 0.05
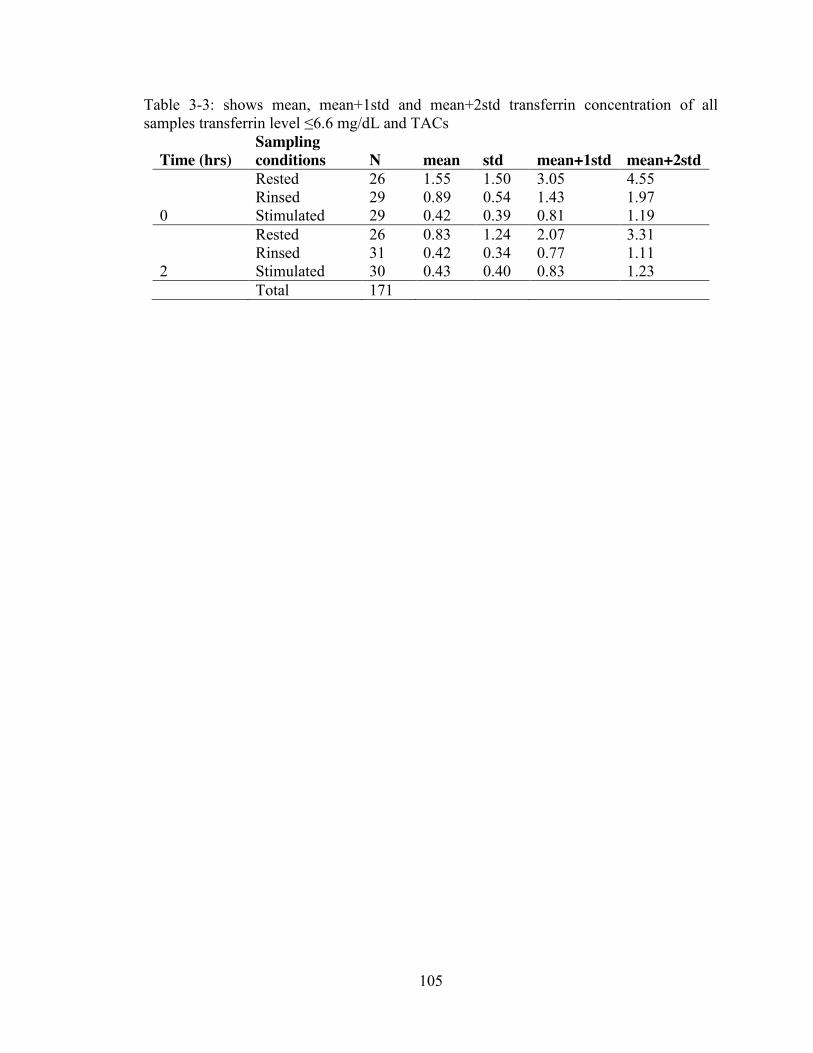
105
Table 3-3: shows mean, mean+1std and mean+2std transferrin concentration of all samples transferrin level ≤6.6 mg/dL and TACs
Time (hrs) Sampling conditions N mean std mean+1std mean+2std
Rested 26 1.55 1.50 3.05 4.55 Rinsed 29 0.89 0.54 1.43 1.97 0 Stimulated 29 0.42 0.39 0.81 1.19 Rested 26 0.83 1.24 2.07 3.31 Rinsed 31 0.42 0.34 0.77 1.11 2 Stimulated 30 0.43 0.40 0.83 1.23 Total 171
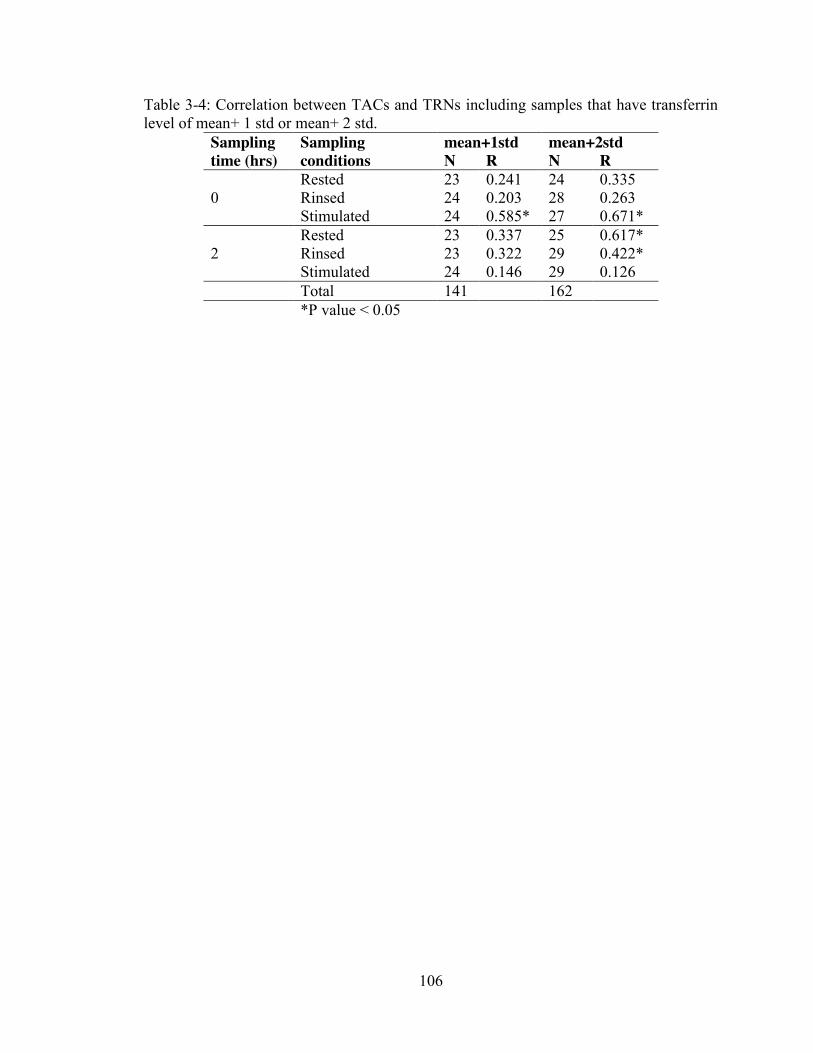
106
Table 3-4: Correlation between TACs and TRNs including samples that have transferrin level of mean+ 1 std or mean+ 2 std.
Sampling Sampling mean+1std mean+2std time (hrs) conditions N R N R Rested 23 0.241 24 0.335 0 Rinsed 24 0.203 28 0.263 Stimulated 24 0.585* 27 0.671* Rested 23 0.337 25 0.617* 2 Rinsed 23 0.322 29 0.422* Stimulated 24 0.146 29 0.126 Total 141 162 *P value < 0.05
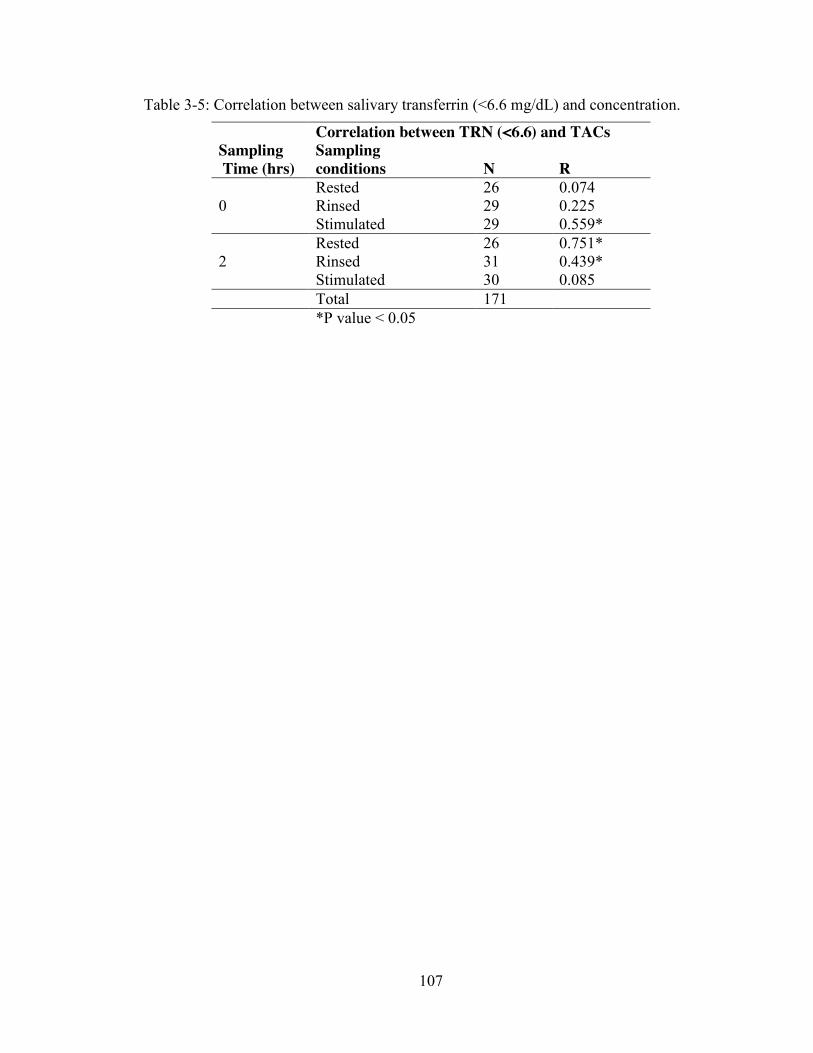
107
Table 3-5: Correlation between salivary transferrin (<6.6 mg/dL) and concentration.
Correlation between TRN (<6.6) and TACs Sampling Sampling Time (hrs) conditions N R Rested 26 0.074 0 Rinsed 29 0.225 Stimulated 29 0.559* Rested 26 0.751* 2 Rinsed 31 0.439* Stimulated 30 0.085 Total 171 *P value < 0.05
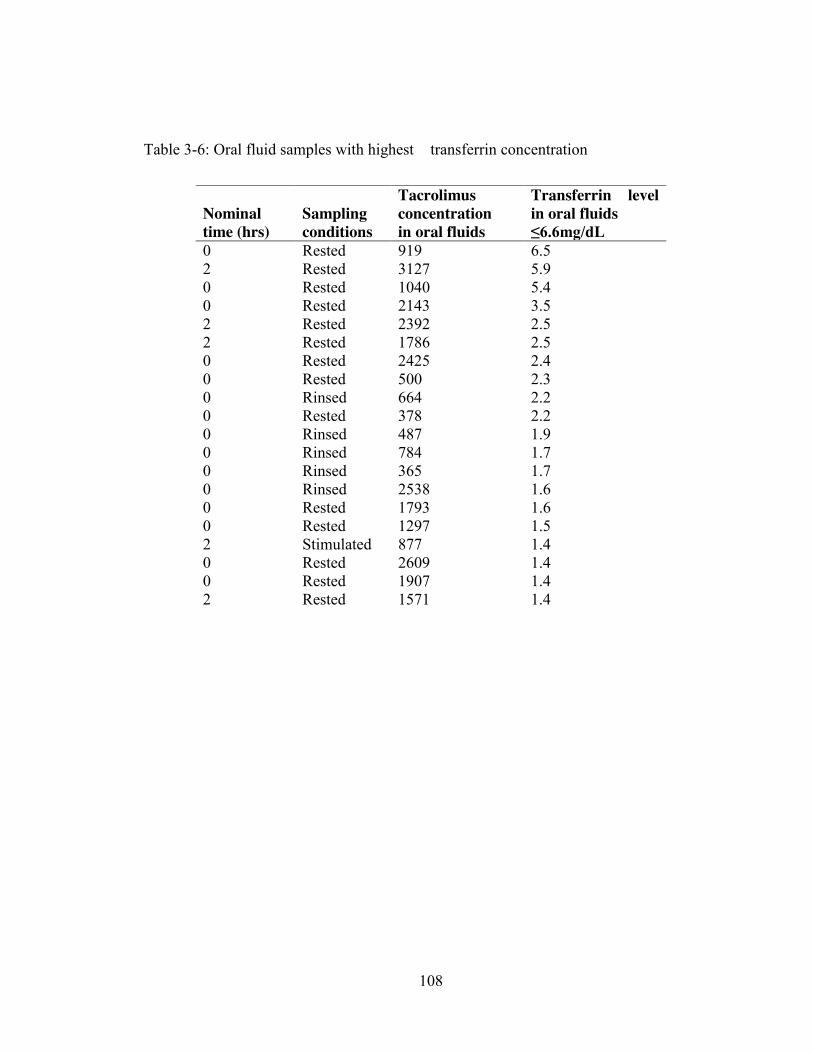
108
Table 3-6: Oral fluid samples with highest transferrin concentration
Nominal Sampling Tacrolimus concentration
Transferrin level in oral fluids
time (hrs) conditions in oral fluids ≤6.6mg/dL 0 Rested 919 6.5 2 Rested 3127 5.9 0 Rested 1040 5.4 0 Rested 2143 3.5 2 Rested 2392 2.5 2 Rested 1786 2.5 0 Rested 2425 2.4 0 Rested 500 2.3 0 Rinsed 664 2.2 0 Rested 378 2.2 0 Rinsed 487 1.9 0 Rinsed 784 1.7 0 Rinsed 365 1.7 0 Rinsed 2538 1.6 0 Rested 1793 1.6 0 Rested 1297 1.5 2 Stimulated 877 1.4 0 Rested 2609 1.4 0 Rested 1907 1.4 2 Rested 1571 1.4
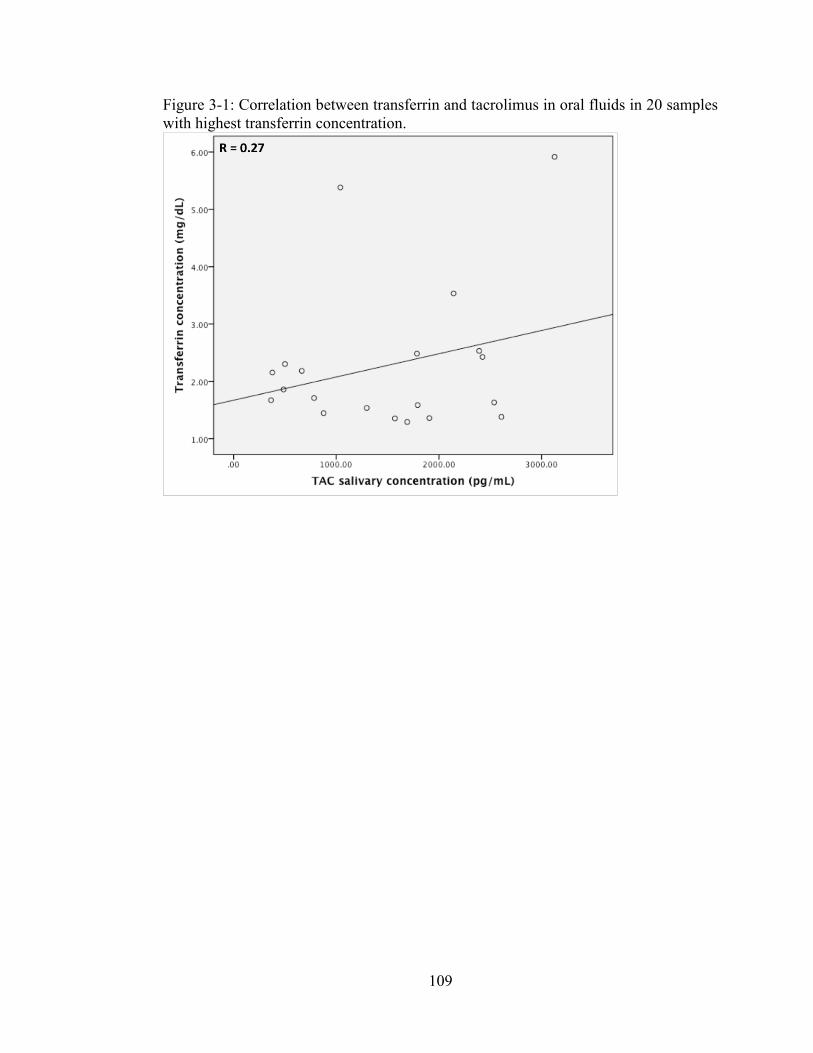
109
Figure 3-1: Correlation between transferrin and tacrolimus in oral fluids in 20 samples with highest transferrin concentration.
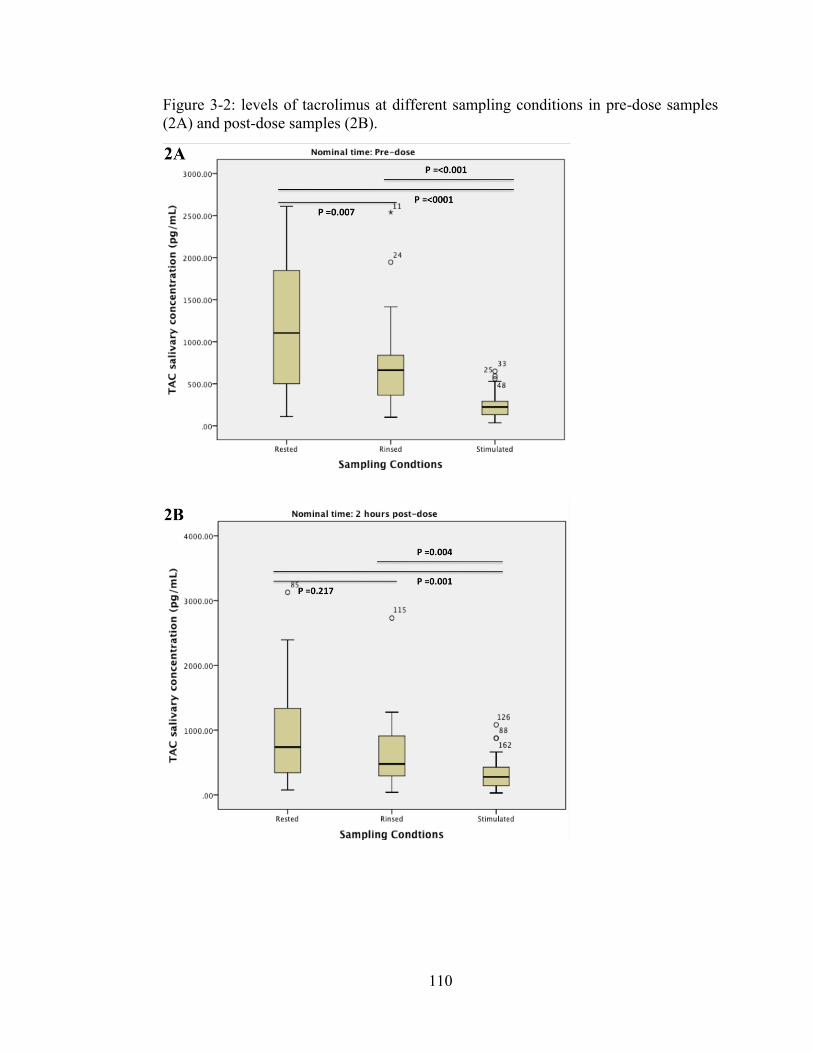
110
Figure 3-2: levels of tacrolimus at different sampling conditions in pre-dose samples (2A) and post-dose samples (2B).
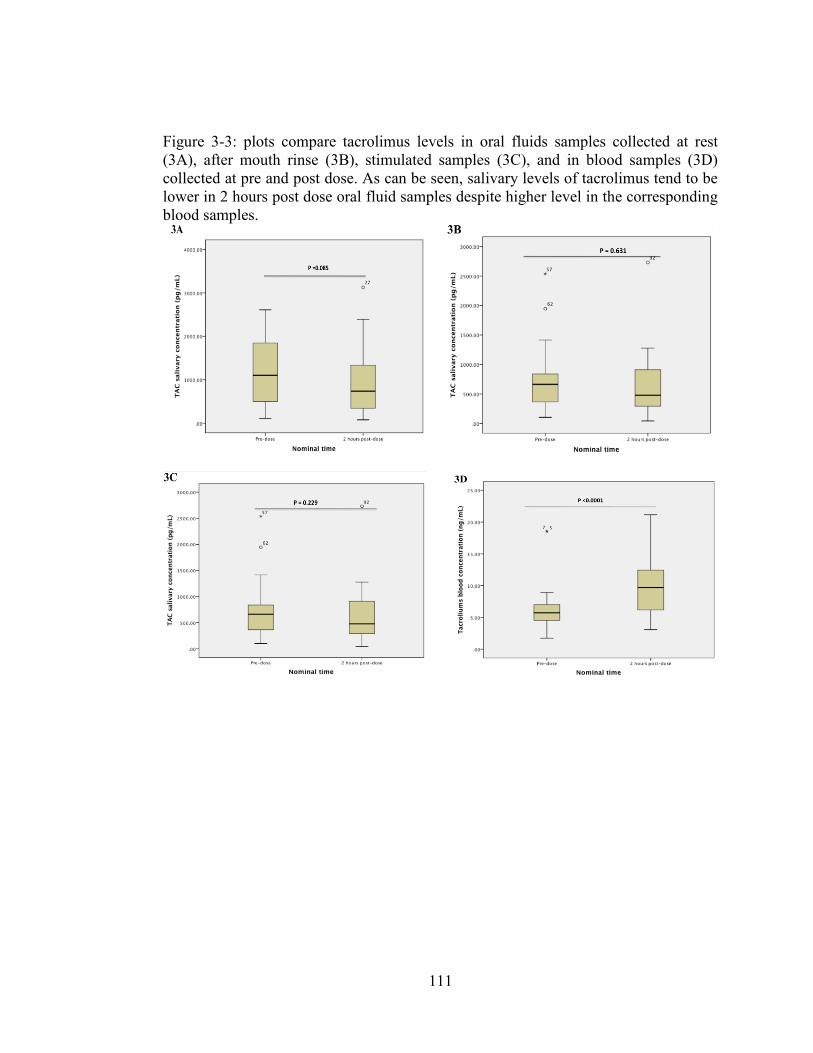
111
Figure 3-3: plots compare tacrolimus levels in oral fluids samples collected at rest (3A), after mouth rinse (3B), stimulated samples (3C), and in blood samples (3D) collected at pre and post dose. As can be seen, salivary levels of tacrolimus tend to be lower in 2 hours post dose oral fluid samples despite higher level in the corresponding blood samples.
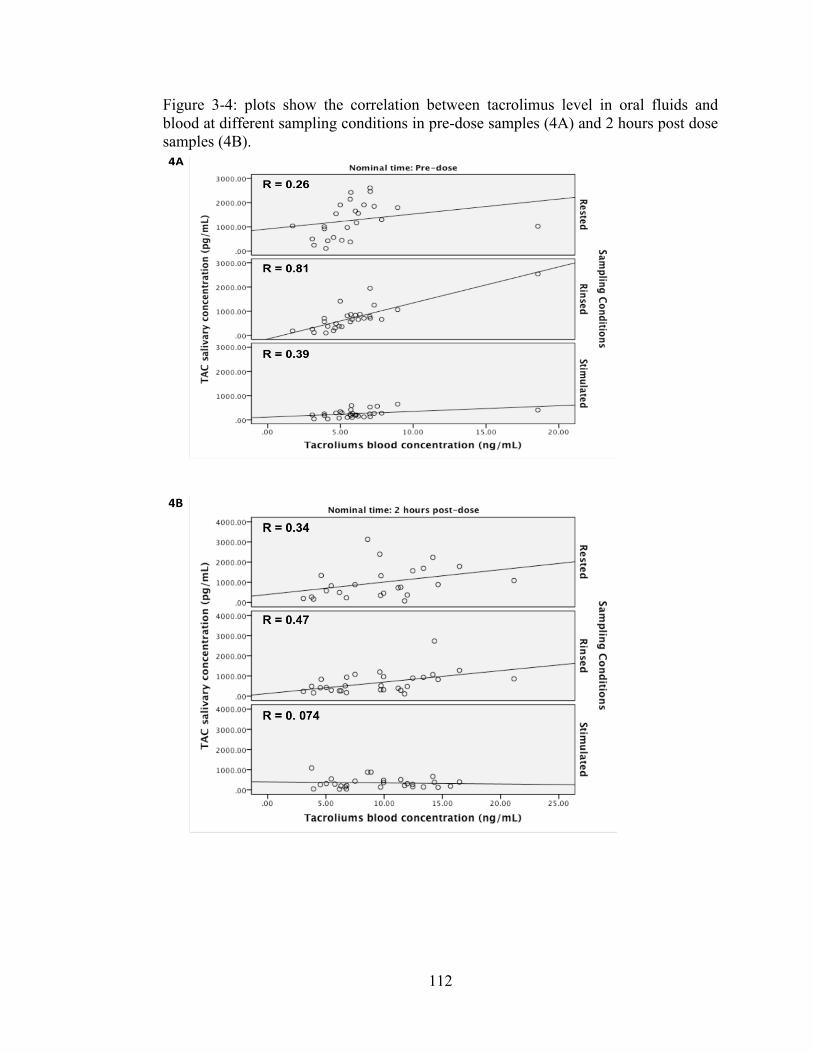
112
Figure 3-4: plots show the correlation between tacrolimus level in oral fluids and blood at different sampling conditions in pre-dose samples (4A) and 2 hours post dose samples (4B).

113
Figure 5: plots data from 12 hours profile study show the correlation between salivary tacrolimus and transferrin concentrations (5A) and tacrolimus concentrations in oral fluids and blood (5B)
114
References 1. Mohammadpour, N., et al., A review on therapeutic drug monitoring of
immunosuppressant drugs. Iran J Basic Med Sci, 2011. 14(6): p. 485-98. 2. Thomson, A.W., C.A. Bonham, and A. Zeevi, Mode of action of tacrolimus
(FK506): molecular and cellular mechanisms. Ther Drug Monit, 1995. 17(6): p. 584-91.
3. Halloran, P.F., Immunosuppressive drugs for kidney transplantation. N Engl J
Med, 2004. 351(26): p. 2715-29. 4. Iwasaki, K., Metabolism of tacrolimus (FK506) and recent topics in clinical
pharmacokinetics. Drug Metab Pharmacokinet, 2007. 22(5): p. 328-35. 5. Staatz, C.E., L.K. Goodman, and S.E. Tett, Effect of CYP3A and ABCB1 single
nucleotide polymorphisms on the pharmacokinetics and pharmacodynamics of calcineurin inhibitors: Part I. Clin Pharmacokinet, 2010. 49(3): p. 141-75.
6. Ro, H., et al., Impact of tacrolimus intraindividual variability and CYP3A5
genetic polymorphism on acute rejection in kidney transplantation. Ther Drug Monit, 2012. 34(6): p. 680-5.
7. Shi, Y., et al., Influence of CYP3A4, CYP3A5 and MDR-1 polymorphisms on
tacrolimus pharmacokinetics and early renal dysfunction in liver transplant recipients. Gene, 2013. 512(2): p. 226-31.
8. Uesugi, M., et al., Effect of intestinal CYP3A5 on postoperative tacrolimus
trough levels in living-donor liver transplant recipients. Pharmacogenet Genomics, 2006. 16(2): p. 119-27.
9. Blume, H., et al., Pharmacokinetic drug interaction profiles of proton pump
inhibitors. Drug Saf, 2006. 29(9): p. 769-84. 10. Hooper, D.K., et al., Risk of tacrolimus toxicity in CYP3A5 nonexpressors
treated with intravenous nicardipine after kidney transplantation. Transplantation, 2012. 93(8): p. 806-12.
11. Maguire, M., T. Franz, and D.S. Hains, A clinically significant interaction
between tacrolimus and multiple proton pump inhibitors in a kidney transplant recipient. Pediatr Transplant, 2012. 16(6): p. E217-20.
12. Takahashi, K., et al., Lansoprazole-tacrolimus interaction in Japanese
transplant recipient with CYP2C19 polymorphism. Ann Pharmacother, 2004. 38(5): p. 791-4.
115
13. Fukudo, M., et al., Impact of MDR1 and CYP3A5 on the oral clearance of tacrolimus and tacrolimus-related renal dysfunction in adult living-donor liver transplant patients. Pharmacogenet Genomics, 2008. 18(5): p. 413-23.
14. Capron, A., et al., CYP3A5 and ABCB1 polymorphisms influence tacrolimus
concentrations in peripheral blood mononuclear cells after renal transplantation. Pharmacogenomics, 2010. 11(5): p. 703-14.
15. Staatz, C.E. and S.E. Tett, Clinical pharmacokinetics and pharmacodynamics
of tacrolimus in solid organ transplantation. Clin Pharmacokinet, 2004. 43(10): p. 623-53.
16. Cheung, C.Y., et al., Dried blood spot measurement: application in tacrolimus
monitoring using limited sampling strategy and abbreviated AUC estimation. Transpl Int, 2008. 21(2): p. 140-5.
17. Mendonza, A.E., R.Y. Gohh, and F. Akhlaghi, Analysis of mycophenolic acid
in saliva using liquid chromatography tandem mass spectrometry. Ther Drug Monit, 2006. 28(3): p. 402-6.
18. Teeninga, N., et al., Monitoring prednisolone and prednisone in saliva: a
population pharmacokinetic approach in healthy volunteers. Ther Drug Monit, 2013. 35(4): p. 485-92.
19. Mendonza, A., R. Gohh, and F. Akhlaghi, Determination of cyclosporine in
saliva using liquid chromatography-tandem mass spectrometry. Ther Drug Monit, 2004. 26(5): p. 569-75.
20. Belostotsky, V., et al., Measurement of saliva tacrolimus levels in pediatric
renal transplant recipients. Pediatr Nephrol, 2011. 26(1): p. 133-8. 21. Feller, K. and G. le Petit, On the distribution of drugs in saliva and blood
plasma. Int J Clin Pharmacol Biopharm, 1977. 15(10): p. 468-9. 22. Horning, M.G., et al., Use of saliva in therapeutic drug monitoring. Clin
Chem, 1977. 23(2 PT. 1): p. 157-64. 23. Mucklow, J.C., et al., Drug concentration in saliva. Clin Pharmacol Ther,
1978. 24(5): p. 563-70. 24. Tennison, M., et al., Feasibility and acceptance of salivary monitoring of
antiepileptic drugs via the US Postal Service. Ther Drug Monit, 2004. 26(3): p. 295-9.
116
25. Gorodischer, R., et al., Saliva versus blood sampling for therapeutic drug monitoring in children: patient and parental preferences and an economic analysis. Ther Drug Monit, 1994. 16(5): p. 437-43.
26. Haeckel, R., Factors influencing the saliva/plasma ratio of drugs. Ann N Y
Acad Sci, 1993. 694: p. 128-42. 27. Zahir, H., et al., Changes in tacrolimus distribution in blood and plasma
protein binding following liver transplantation. Ther Drug Monit, 2004. 26(5): p. 506-15.
28. Reece, P.A., et al., Prednisolone protein binding in renal transplant patients.
Br J Clin Pharmacol, 1985. 20(2): p. 159-62. 29. Coates, J.E., S.F. Lam, and W.T. McGaw, Radioimmunoassay of salivary
cyclosporine with use of 125I-labeled cyclosporine. Clin Chem, 1988. 34(8): p. 1545-51.
30. Shen, B., et al., Determination of total, free and saliva mycophenolic acid with
a LC-MS/MS method: application to pharmacokinetic study in healthy volunteers and renal transplant patients. J Pharm Biomed Anal, 2009. 50(3): p. 515-21.
31. Wiesen, M.H., et al., Liquid chromatography-tandem mass spectrometry
method for the quantification of mycophenolic acid and its phenolic glucuronide in saliva and plasma using a standardized saliva collection device. J Chromatogr A, 2012. 1241: p. 52-9.
32. Chitnis, S.D., et al., Concentration of tacrolimus and major metabolites in
kidney transplant recipients as a function of diabetes mellitus and cytochrome P450 3A gene polymorphism. Xenobiotica, 2013.
33. Schwartz, E.B. and D.A. Granger, Transferrin enzyme immunoassay for
quantitative monitoring of blood contamination in saliva. Clin Chem, 2004. 50(3): p. 654-6.
34. Granger, D.A., et al., Blood contamination in children's saliva: prevalence,
stability, and impact on the measurement of salivary cortisol, testosterone, and dehydroepiandrosterone. Psychoneuroendocrinology, 2007. 32(6): p. 724-33.
35. Fleissig, Y., et al., Comparative proteomic analysis of human oral fluids
according to gender and age. Oral Dis, 2010. 16(8): p. 831-8. 36. Zahir, H., et al., Validation of methods to study the distribution and protein
binding of tacrolimus in human blood. J Pharmacol Toxicol Methods, 2001. 46(1): p. 27-35.
117
37. Kivlighan, K.T., et al., Quantifying blood leakage into the oral mucosa and its effects on the measurement of cortisol, dehydroepiandrosterone, and testosterone in saliva. Horm Behav, 2004. 46(1): p. 39-46.
38. Liu, H. and M.R. Delgado, Therapeutic drug concentration monitoring using
saliva samples. Focus on anticonvulsants. Clin Pharmacokinet, 1999. 36(6): p. 453-70.
39. DrugBank. Tacrolimus. [cited on 11/02/2014; Available from:
http://www.drugbank.ca/drugs/DB00864. 40. Gorodischer, R. and G. Koren, Salivary excretion of drugs in children:
theoretical and practical issues in therapeutic drug monitoring. Dev Pharmacol Ther, 1992. 19(4): p. 161-77.
41. Kragelund, C., et al., Expression of two drug-metabolizing cytochrome P450-
enzymes in human salivary glands. Oral Dis, 2008. 14(6): p. 533-40. 42. Uematsu, T., et al., P-glycoprotein expression in human major and minor
salivary glands. Arch Oral Biol, 2001. 46(6): p. 521-7. 43. Uematsu, T., et al., Expression of ATP-binding cassette transporter in human
salivary ducts. Arch Oral Biol, 2003. 48(1): p. 87-90.
118
Chapter 4 : MANUSCRIPT IV
To be submitted to Clinical Pharmacokinetics
Development and Validation of a Sensitive and Selective LC-MS/MS Method for
Quantification of Mycophenolic Acid and its Glucuronide Metabolites in Oral
Fluid, Plasma and Plasma Ultrafiltrate in Kidney Transplant Recipients
Mwlod Ghareeb1, Reginald Y. Gohh 2 , Fatemeh Akhlaghi1
DEPARTMENT AND INSTITUTION
1Department of Biomedical and Pharmaceutical Sciences, University of Rhode Island, Kingston, RI 2 Division of Organ Transplantation, Rhode Island Hospital, Warren Alpert Medical School of Brown University, Providence, Rhode Island, USA.

119
Address correspondence to: Fatemeh Akhlaghi, PharmD, PhD, Clinical Pharmacokinetics Research Laboratory, Department of Biomedical and Pharmaceutical Sciences, University of Rhode Island, 495A College of Pharmacy, 7 Greenhouse Road, Kingston, RI 02881, USA. Phone: (401) 874 9205. Fax: (401) 874 5787. Email: [email protected]
DISCLOSURE
No conflict of interest is declared
120
ABBREVIATIONS
ACN: Acetonitrile, LC-MS/MS: Liquid chromatography tandem mass spectrometry, LLOQ: Lower limit of quantification ME: Matrix effect, MeOH: Methanol, MPA: Mycophenolic acid, MPAf: Unbound mycophenolic acid concentration in plasma, MPAof: Oral fluid mycophenolic acid concentration, MPAt: Total mycophenolic acid concentration in plasma, MPAG: Mycophenolic acid glucuronide, MPAf: Unbound mycophenolic acid glucuronide concentration in plasma, MPAof: Oral fluid mycophenolic acid glucuronide concentration, MPAt: Total mycophenolic acid glucuronide concentration in plasma, OF: Oral fluid, PLs: Phospholipids

121
Abstract
Free drug fraction in the blood is responsible for pharmacological effect and toxicity.
However, quantifying unbound fraction is costly and labor intensive. Drug fraction in
oral fluid (OF) is believed to be in equilibrium with plasma free fraction. Therefore,
OF may provide a mean for estimating unbound fraction in noninvasively collected
samples and with a simple sample preparation procedure. In this manuscript, a liquid
chromatography tandem mass spectrometry method was developed and validated and
used to quantify the concentration of mycophenolic acid (MPA) and its glucuronide
metabolites (MPAG) in oral fluid, plasma and in plasma ultrafiltrate. A simple,
sensitive and selective method was developed for quantification of salivary, unbound,
total MPA and MPAG. The robustness of the method was confirmed by incurred
sample reanalysis test. The method was successfully used for quantifying the analytes
in samples obtained from stable renal transplant recipients.
Introduction
Mycophenolic acid (MPA) is an immunosuppressive agent that is widely used in solid
organ transplantation. In United States, in year 2005, about 87% of kidney and
pancreas transplant patients were prescribed MPA at hospital discharge [1]. It is
metabolized by uridine diphosphate glucuronosyltransferases (UGTs) to the major
inactive metabolites mycophenolic acid β-D-glucuronide (MPAG) and the minor but
pharmacologically active metabolites mycophenolic acid acyl-β-D-glucuronide
(AcMPAG) [2]. MPA highly binds to plasma protein with only 1-3% found in free
form [2]. In patients with compromised renal, MPAG metabolites level may increases
by 3-6 folds, resulting displacement of MPA from plasma protein binding sites [2]. As
122
a result, MPA free fraction may increase up to 7% [2]. Currently, whole blood or
plasma obtained through venipuncture is used for TDM of immunosuppressive agents
[3]. Because of the invasive nature of blood sampling, alternative matrices were
investigated, including OF [4-6] and dried blood spot [7]. Because of the narrow
therapeutic index, therapeutic drug monitoring of MPA is recommended.
Few reports were previously published utilizing liquid chromatography tandem mass
spectrometry (LC-MS/MS) for quantification MPA in OF (MPAof) [6]; MPAof,
plasma free fraction (MPAf), and total plasma (MPAt) [5]; and total MPAt, MPAof,
total glucuronide metabolites (MPAGt), and oral fluid MPAG metabolites (MPAGof)
concentrations [4]. None of these methods, however, has quantified MPA and MPAG
in OF, concurrently with free and total MPA and MPAG in plasma. In this paper, a
simple, sensitive and robust LC-MS/MS method was developed for quantification of
MPA and MPAG in OF, as well as, their free and total plasma concentrations. In this
method, a simple samples preparation procedures were employed using liquid-liquid
extraction with acetonitrile (ACN) with good recovery, is presented. The quality of the
method was assessed by re-measurement some of the randomly selected patient
samples (Incurred Samples Reanalysis procedure) obtained from renal transplant
recipients.
Chemicals and reagents
Mycophenolic acid and (C17H20O6, MW = 320), MPAG (C23H28O12, MW= 496) and
the deuterated mycophenolic acid internal standard (MPA-d3) (C17H17D3O6, Mw
=323), in powder form were purchased from Toronto Research Chemicals (Toronto,
Canada). Optima™ LC/MS grade acetonitrile (ACN), ammonium acetate
123
(Crystalline), and formic acid, were obtained from Fisher Scientific (Fair Lawn, NJ,
USA). Deionized water was obtained using Milli-Q Synthesis system fitted with Q-
Gard 2 Purification Pack (Millipore, Bedford, MA, USA). AquaSil Siliconizing Fluid
was purchased from Thermo Fisher Scientific Inc. (Franklin, MA, USA). Drug-free
human OF from six donors was obtained from Bioreclamation Inc. (Westbury, NY,
USA). For salivary blood contamination, transferrin assay kit from Salimetrics LLC
(State College, PA, USA) was used [8] and quantified with SpectraMax M5e
Microplate Reader (Sunnyvale, CA, USA).
Apparatus
Oral fluid samples were sonicated using Branson® Sonicator (Danbury, CT, USA) to
produce a homogeneous mixture. The supernatant was obtained from OF and plasma
samples using Eppendorf 5810 centrifuge from Micro and Nanotechnology (Urbana,
IL, USA). Free MPA and MPAG concentrations were measured in plasma ultra-
filtrate obtained using Centrifree® Ultrafiltration device from EMD Millipore, Merck
KGaA (Darmstadt, Germany).
Samples were analyzed using Liquid Chromatography Tandem Mass Spectrometry
(LC-MS/MS). The LC-MS/MS system was consisted of Acquity UPLC from Waters
Corp (Milford, MA, USA) connected to Xevo TQ MS mass spectrometry from Waters
Corp. MassLynx™ software (ver. 4.1) was used to control the system and data
acquisition, and data processed using TargetLynx™ tool. The UPLC system had a
binary pump and equipped with built-in column heater. Twenty micro-litters sample
loop was used to deliver 10 µL of extracted samples in a partial loop mode.
124
Chromatographic conditions
An Acquity UPLC BEH C18 (2.1 mm x 50 mm) column with a 1.7µm-particle size
and 130Å pores size was used (Waters Corp) for chromatographic separation. The
temperature of the column was kept at 55°C, and the auto-sampler temperature was
maintained at 20°C. Gradient elution was employed with a mobile phase consisted of
water containing 95:5% water: ACN mixture contained 2 mM ammonium acetate /
0.1% (v/v) formic acid (Solvent A); and ACN containing 2 mM ammonium acetate /
0.1% (v/v) formic acid (Solvent B). The mobile phase was delivered at 0.350 mL/min
flow rate. The run cycle started at 85% solvent (A) slowly decreased 5% over 1.4 min
and maintained at this level till 2.2 min. To re-equilibrate the column for the next run,
solvent (A) was increased within 0.1 min to 85% and kept till the end of the run at 2.8
min. Diversion valve was set to deliver the first 0.65 min and from 1.60 min till the
end of each run to waste. The elution times were 0.93 min MPA and MPA-d3; and
1.31 min for MPAG.
Mass spectrometry conditions
Mass spectrometry detection and quantification of MPA and MPAG performed in
positive electrospray ionization (ESI) and multiple reaction monitoring (MRM)
modes. Intellistart tool was used to obtain initial mass spectrometry parameters in unit
mass resolution analysis mode followed by manual tuning to achieve highest possible
sensitivity. Final mass spectrometry parameters were as following: collision voltage
(V)= 25, 14 and 23 for MPA, MPAG and IS respectively, cone voltage (CV) = 30,
125
collision energy (CE) = 20 and capillary voltage (kV = 1.5), source temperature (°C) =
150, dissolution temperature (°C) = 500, cone gas flow (L/hr) = 25, desolvation gas
flow (L/hr) = 1000, and collision gas flow (mL/min) = 0.15. Ammonium adducts
[M+NH4]+ were selected as precursors for MRM with transitions (m/z, Q1 > Q3) of
(m/z, 338.41>207.28) (m/z, 514.54 > 207.26), and (m/z, 341.45 > 210.33) for MPA,
MPAG and MPA-d3 respectively.
Preparation of solution for standard, quality control and internal standard
Stock, sub-stock and working stock solutions of MPA and MPAG were prepared by
reconstitution in 80% ACN. Internal standard stock and working solution were
prepared in 100% ACN. All solutions were stored at – 20 °C. Standards and quality
controls (QCs) were prepared by spiking the OF and plasma with serially diluted
working stock solutions to achieve desired concentrations. The concentrations of
internal standard working solution (precipitating solvent) were set at 0.005, 0.025 and
0.05 µg/mL for OF, ultra-filtrate and plasma samples.
Clinical Samples
Patients’ samples included in this report were collected from patients attending kidney
transplant clinic at Rhode Island Hospital (Providence, RI) after the hospital’s
Institutional Review Board approved the study protocol. About 4 mL of blood
collected in ethylenediaminetetraacetic acid (EDTA) along with matching OF
samples. All samples kept on dry ice till transferred to the Biomedical and
126
Pharmaceutical Sciences (BPS) department at University of Rhode Island and stored at
– 80 °C till analyzed.
Sample extraction
Plasma and OF calibration curve standards, quality controls (QCs), blank, and patients'
samples were allowed to thaw at room temperature. Oral fluids samples were vortexed
for 5 seconds and sonicated for 5-10 seconds (depending on samples volume) to
breakdown salivary components and produce a homogenous mixture. Fifty micro-
liters of OF or whole plasma samples loaded into 96-well plates contained 100 µL and
200 µL precipitating solution in each well for OF or plasma respectively. The plate
mixed on an automatic shaker for 5 min followed by centrifugation a speed of 3000 xg
for 5 min at 20°C using swing rotor rack. The supernatant then transferred to a new
plate using a multichannel pipette. For MPAf and MPAGf concentrations
measurement, 300 µL of calibration curve standards, quality controls (QCs), blank,
and patients' plasma samples were loaded into the ultra-filtration devices and
centrifuged following manufacturer's recommendation. One part of ultra-filtrate was
diluted with five parts of 50% ACN, briefly vortex mix and transferred to an auto-
sampler 96-wells plate. The injection volume was 5 µL for OF and plasma; and 10 µL
for plasma ultra-filtrate.
Statistical data analysis
Statistical analysis was performed using GraphPad Prism software.
127
Assay validation
Sensitivity and selectivity
The method was validation in accordance with the current version of FDA guidance
for industry bioanalytical method validation [9]. The lower limit of quantification
(LLOQ) was determined by the concentration that had signal/noise ratio of at least 10,
accuracy between 80-120%, and Coefficient of Variation (CV) less than 20%.
Acceptance criteria for QCs were accuracy between 85-115% and CV less than 15%.
Selectivity assessed by inspecting the presence of noise or peaks in chromatograms
represent blank OF, whole plasma and plasma ultrafiltrate samples (from 6 donors)
compared with LLOQ samples chromatograms.
Stability
Stability studies were performed by measuring MPA and MPAG in each matrix, in
three replicate, at QC1 and QC3 concentrations. Stability studies included freeze and
thaw (after three freeze and thaw cycles), bench-top (for up to 8hrs) and auto-sampler
(by re-injecting one of validation batch after it was left in the auto-sampler for 24hrs).
Matrix effect and Recovery
The presence and the possible effect of matrix effect (ME) in all matrices studied in
two different ways. In the first approach, chromatograms obtained from post-column
infusion test were inspected visually. This test involved continuous infusion of 95%
ACN (which represents the composition of mobile phase at elution time of the
analytes and the IS) contains MPA, MPAG and the MPA-d3 at concentrations around
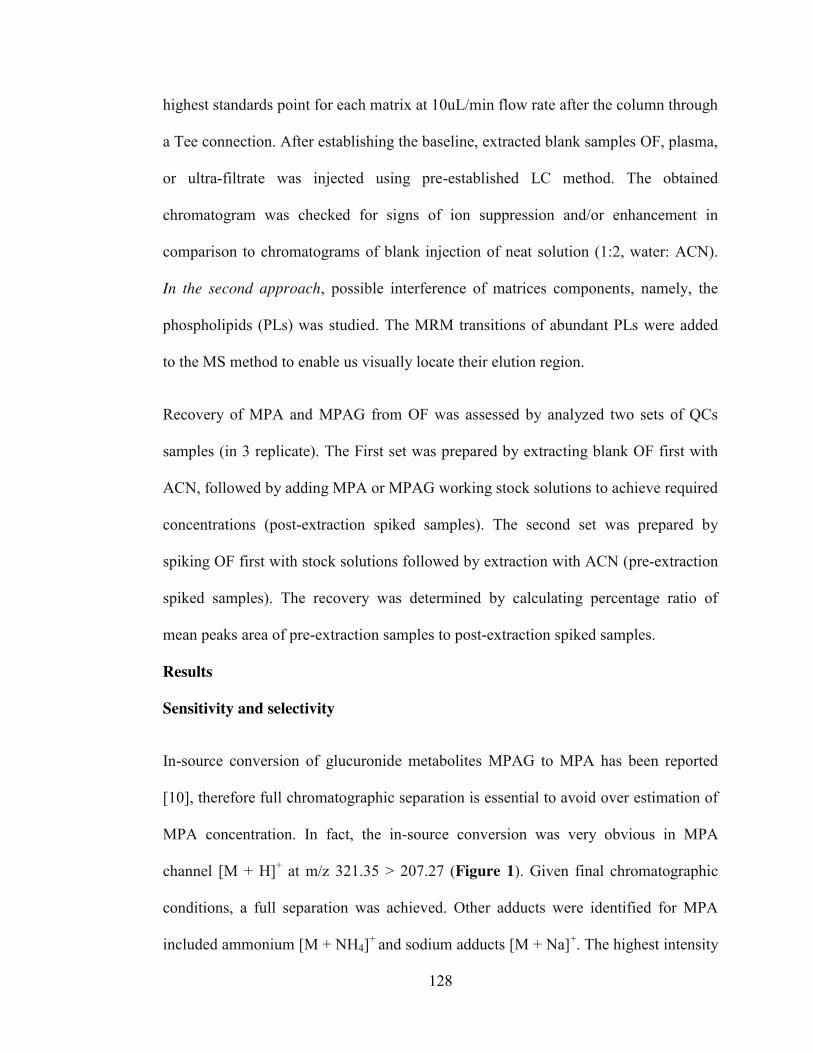
128
highest standards point for each matrix at 10uL/min flow rate after the column through
a Tee connection. After establishing the baseline, extracted blank samples OF, plasma,
or ultra-filtrate was injected using pre-established LC method. The obtained
chromatogram was checked for signs of ion suppression and/or enhancement in
comparison to chromatograms of blank injection of neat solution (1:2, water: ACN).
In the second approach, possible interference of matrices components, namely, the
phospholipids (PLs) was studied. The MRM transitions of abundant PLs were added
to the MS method to enable us visually locate their elution region.
Recovery of MPA and MPAG from OF was assessed by analyzed two sets of QCs
samples (in 3 replicate). The First set was prepared by extracting blank OF first with
ACN, followed by adding MPA or MPAG working stock solutions to achieve required
concentrations (post-extraction spiked samples). The second set was prepared by
spiking OF first with stock solutions followed by extraction with ACN (pre-extraction
spiked samples). The recovery was determined by calculating percentage ratio of
mean peaks area of pre-extraction samples to post-extraction spiked samples.
Results
Sensitivity and selectivity
In-source conversion of glucuronide metabolites MPAG to MPA has been reported
[10], therefore full chromatographic separation is essential to avoid over estimation of
MPA concentration. In fact, the in-source conversion was very obvious in MPA
channel [M + H]+ at m/z 321.35 > 207.27 (Figure 1). Given final chromatographic
conditions, a full separation was achieved. Other adducts were identified for MPA
included ammonium [M + NH4]+ and sodium adducts [M + Na]+. The highest intensity
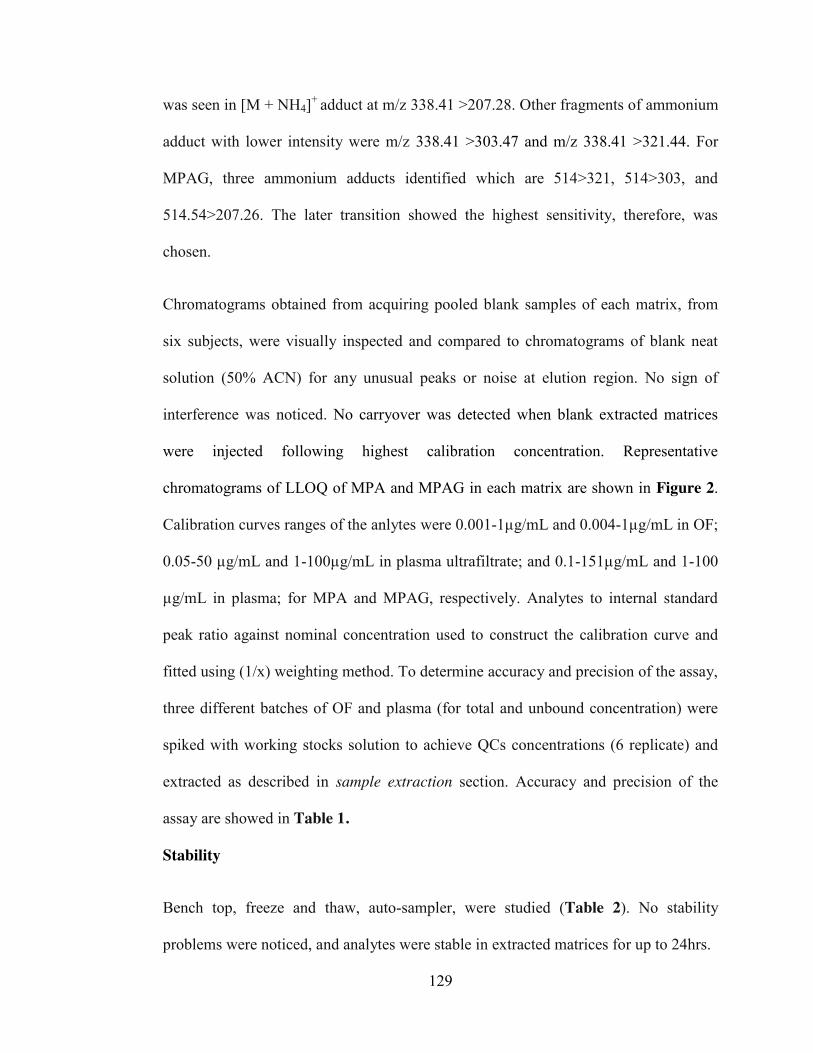
129
was seen in [M + NH4]+ adduct at m/z 338.41 >207.28. Other fragments of ammonium
adduct with lower intensity were m/z 338.41 >303.47 and m/z 338.41 >321.44. For
MPAG, three ammonium adducts identified which are 514>321, 514>303, and
514.54>207.26. The later transition showed the highest sensitivity, therefore, was
chosen.
Chromatograms obtained from acquiring pooled blank samples of each matrix, from
six subjects, were visually inspected and compared to chromatograms of blank neat
solution (50% ACN) for any unusual peaks or noise at elution region. No sign of
interference was noticed. No carryover was detected when blank extracted matrices
were injected following highest calibration concentration. Representative
chromatograms of LLOQ of MPA and MPAG in each matrix are shown in Figure 2.
Calibration curves ranges of the anlytes were 0.001-1µg/mL and 0.004-1µg/mL in OF;
0.05-50 µg/mL and 1-100µg/mL in plasma ultrafiltrate; and 0.1-151µg/mL and 1-100
µg/mL in plasma; for MPA and MPAG, respectively. Analytes to internal standard
peak ratio against nominal concentration used to construct the calibration curve and
fitted using (1/x) weighting method. To determine accuracy and precision of the assay,
three different batches of OF and plasma (for total and unbound concentration) were
spiked with working stocks solution to achieve QCs concentrations (6 replicate) and
extracted as described in sample extraction section. Accuracy and precision of the
assay are showed in Table 1.
Stability
Bench top, freeze and thaw, auto-sampler, were studied (Table 2). No stability
problems were noticed, and analytes were stable in extracted matrices for up to 24hrs.
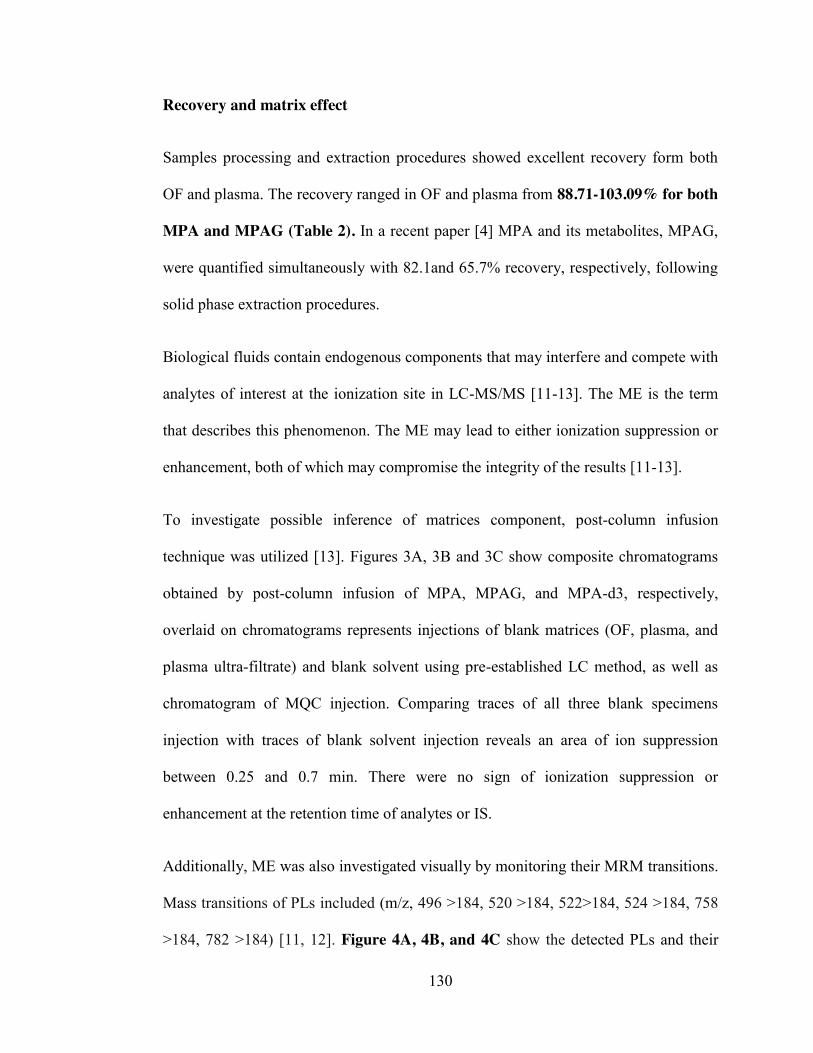
130
Recovery and matrix effect
Samples processing and extraction procedures showed excellent recovery form both
OF and plasma. The recovery ranged in OF and plasma from 88.71-103.09% for both
MPA and MPAG (Table 2). In a recent paper [4] MPA and its metabolites, MPAG,
were quantified simultaneously with 82.1and 65.7% recovery, respectively, following
solid phase extraction procedures.
Biological fluids contain endogenous components that may interfere and compete with
analytes of interest at the ionization site in LC-MS/MS [11-13]. The ME is the term
that describes this phenomenon. The ME may lead to either ionization suppression or
enhancement, both of which may compromise the integrity of the results [11-13].
To investigate possible inference of matrices component, post-column infusion
technique was utilized [13]. Figures 3A, 3B and 3C show composite chromatograms
obtained by post-column infusion of MPA, MPAG, and MPA-d3, respectively,
overlaid on chromatograms represents injections of blank matrices (OF, plasma, and
plasma ultra-filtrate) and blank solvent using pre-established LC method, as well as
chromatogram of MQC injection. Comparing traces of all three blank specimens
injection with traces of blank solvent injection reveals an area of ion suppression
between 0.25 and 0.7 min. There were no sign of ionization suppression or
enhancement at the retention time of analytes or IS.
Additionally, ME was also investigated visually by monitoring their MRM transitions.
Mass transitions of PLs included (m/z, 496 >184, 520 >184, 522>184, 524 >184, 758
>184, 782 >184) [11, 12]. Figure 4A, 4B, and 4C show the detected PLs and their
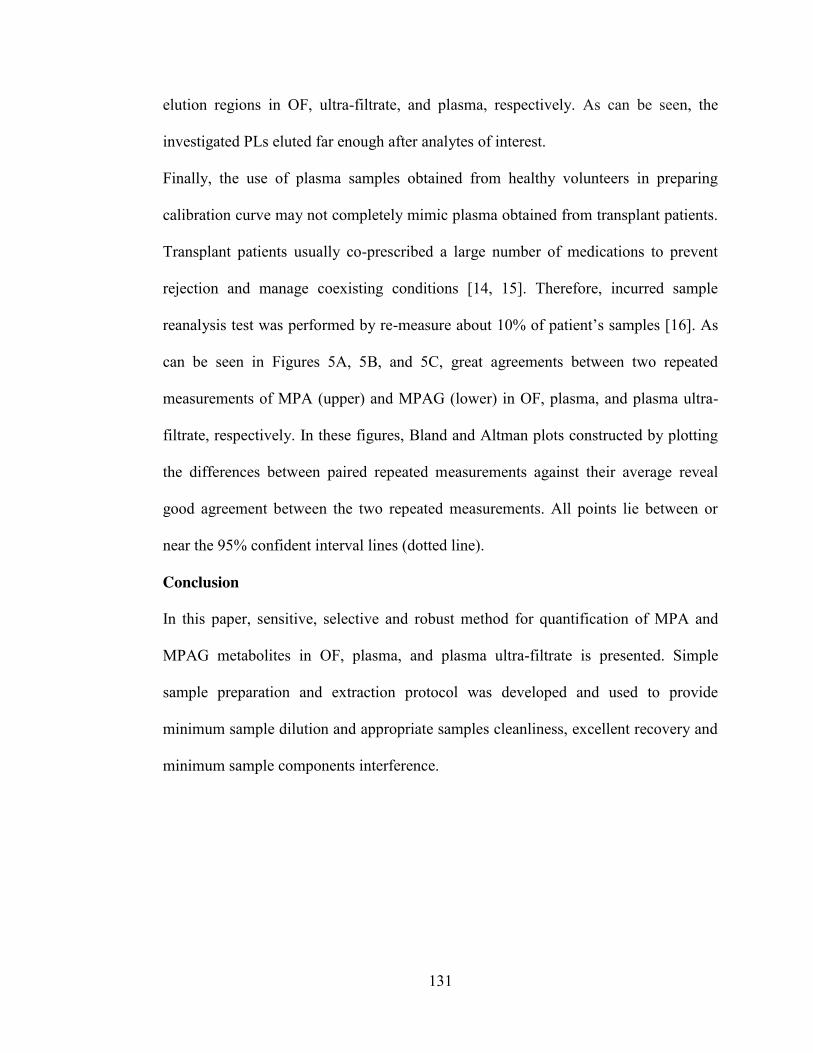
131
elution regions in OF, ultra-filtrate, and plasma, respectively. As can be seen, the
investigated PLs eluted far enough after analytes of interest.
Finally, the use of plasma samples obtained from healthy volunteers in preparing
calibration curve may not completely mimic plasma obtained from transplant patients.
Transplant patients usually co-prescribed a large number of medications to prevent
rejection and manage coexisting conditions [14, 15]. Therefore, incurred sample
reanalysis test was performed by re-measure about 10% of patient’s samples [16]. As
can be seen in Figures 5A, 5B, and 5C, great agreements between two repeated
measurements of MPA (upper) and MPAG (lower) in OF, plasma, and plasma ultra-
filtrate, respectively. In these figures, Bland and Altman plots constructed by plotting
the differences between paired repeated measurements against their average reveal
good agreement between the two repeated measurements. All points lie between or
near the 95% confident interval lines (dotted line).
Conclusion
In this paper, sensitive, selective and robust method for quantification of MPA and
MPAG metabolites in OF, plasma, and plasma ultra-filtrate is presented. Simple
sample preparation and extraction protocol was developed and used to provide
minimum sample dilution and appropriate samples cleanliness, excellent recovery and
minimum sample components interference.
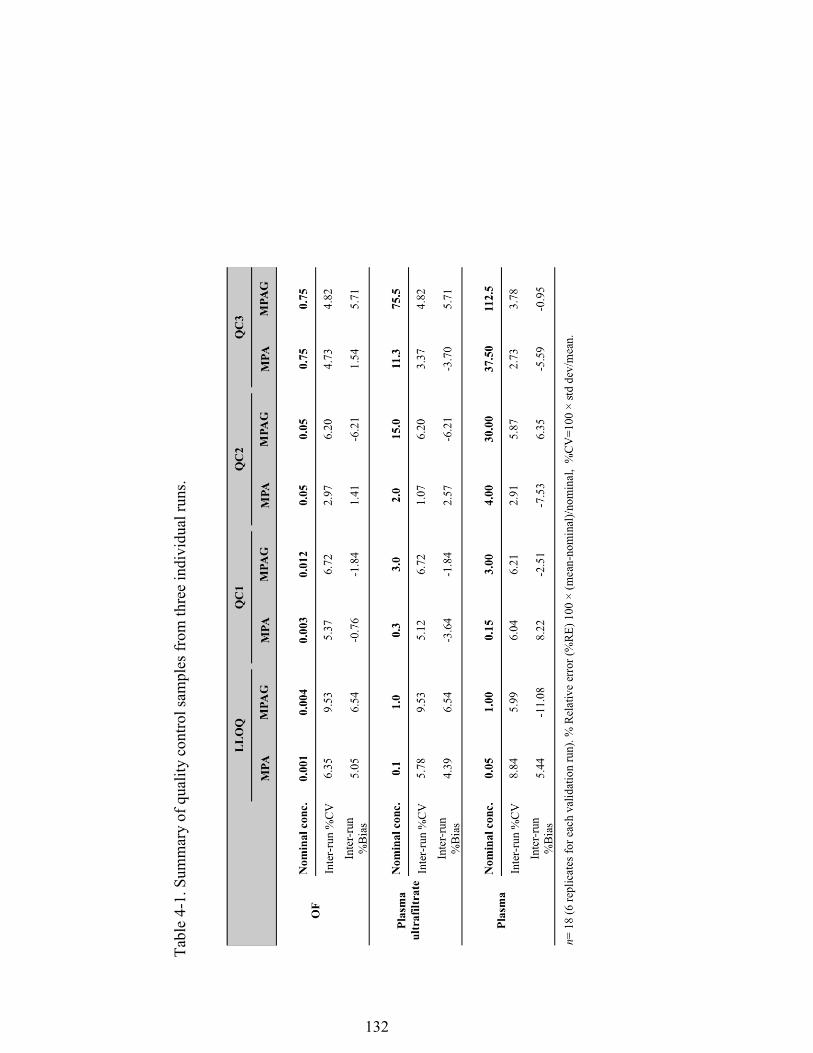
132
Tabl
e 4-
1. S
umm
ary
of q
ualit
y co
ntro
l sam
ples
from
thre
e in
divi
dual
runs
.
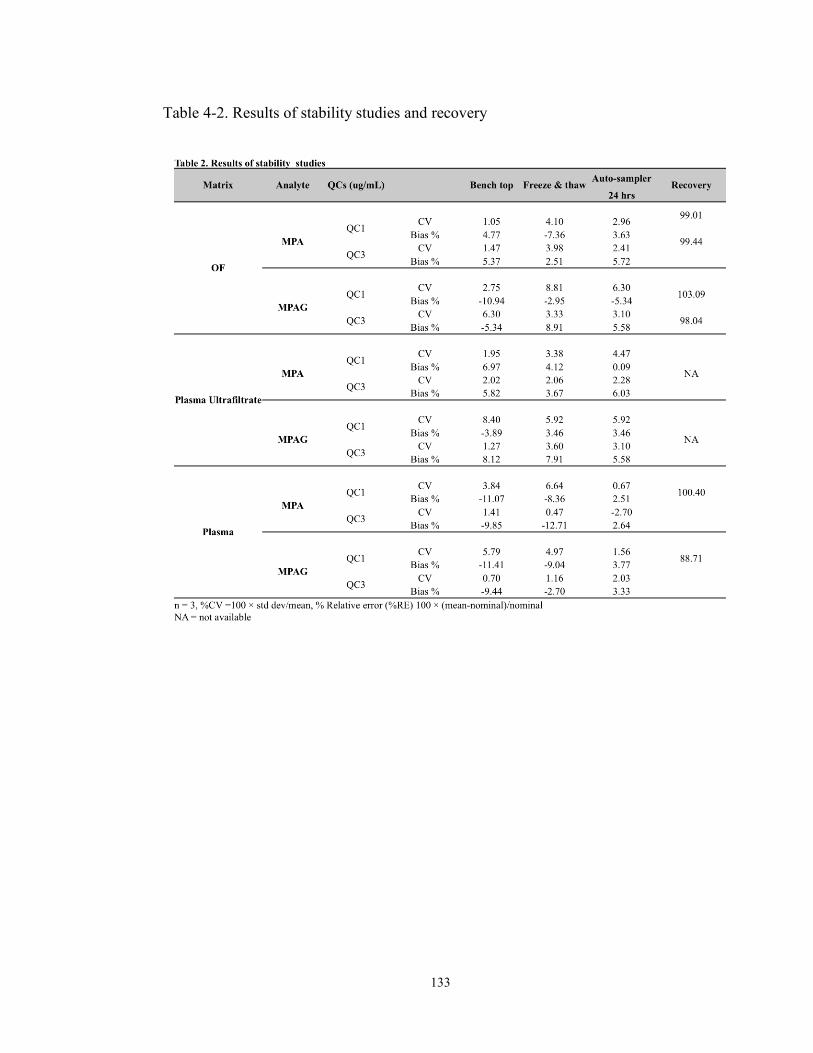
133
Table 4-2. Results of stability studies and recovery
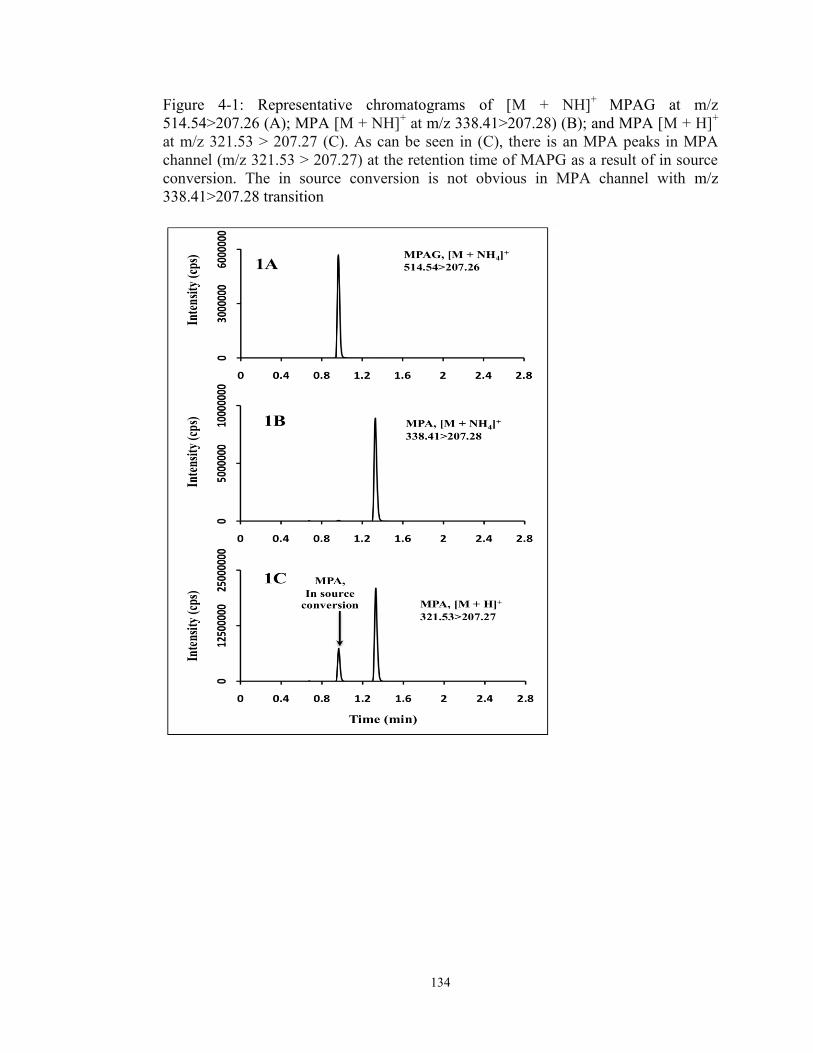
134
Figure 4-1: Representative chromatograms of [M + NH]+ MPAG at m/z 514.54>207.26 (A); MPA [M + NH]+ at m/z 338.41>207.28) (B); and MPA [M + H]+ at m/z 321.53 > 207.27 (C). As can be seen in (C), there is an MPA peaks in MPA channel (m/z 321.53 > 207.27) at the retention time of MAPG as a result of in source conversion. The in source conversion is not obvious in MPA channel with m/z 338.41>207.28 transition
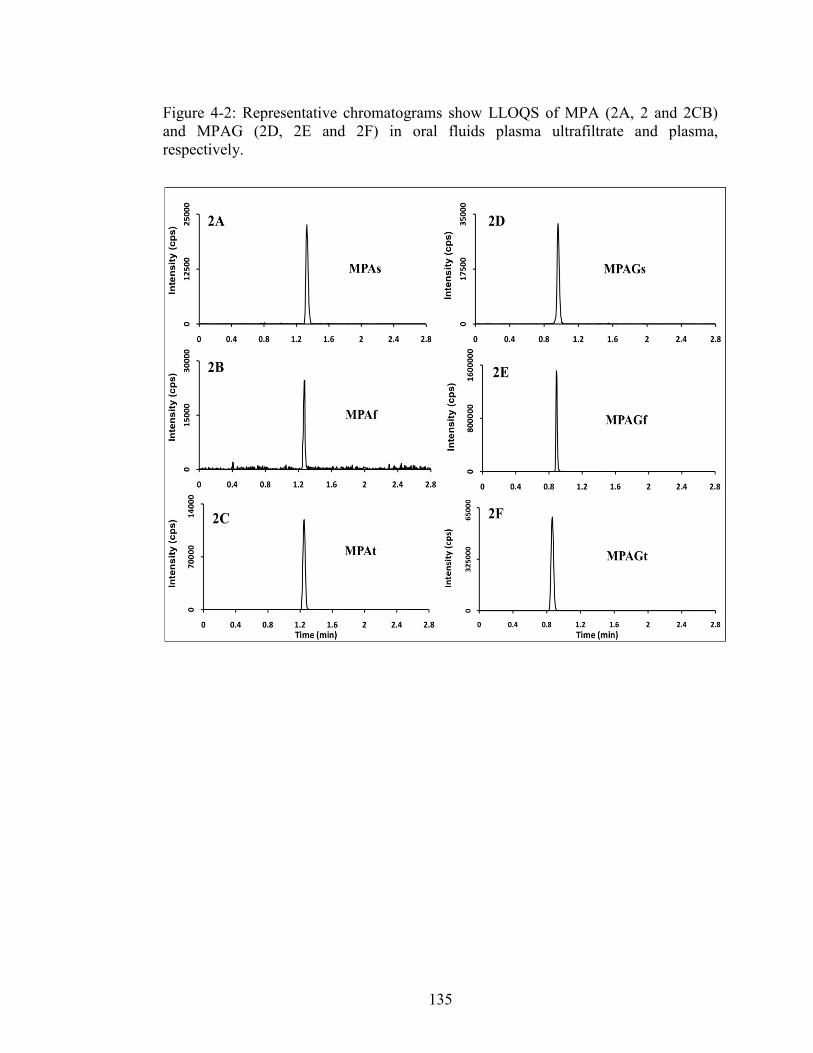
135
Figure 4-2: Representative chromatograms show LLOQS of MPA (2A, 2 and 2CB) and MPAG (2D, 2E and 2F) in oral fluids plasma ultrafiltrate and plasma, respectively.

136
Figure 4-3: Composite chromatogram of traces obtained from continues post-column infusion chromatograms of MPA (3A), MPAG (3B) and the internal standard (3C) overlaid on a chromatograms of injections of blank injections of mobile phase, oral fluids, plasma ultra filtrate and plasma rat and human plasma. There is now area of ion suppression or enhancement is seen at elution areas of the analytes.
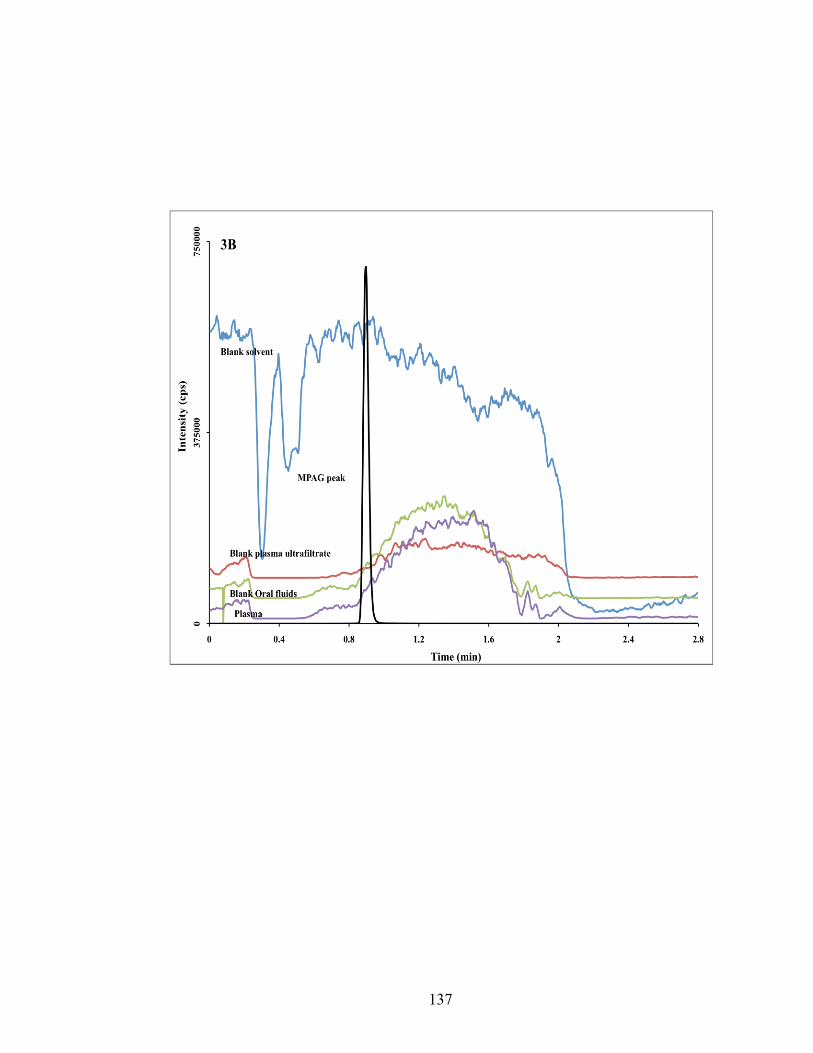
137
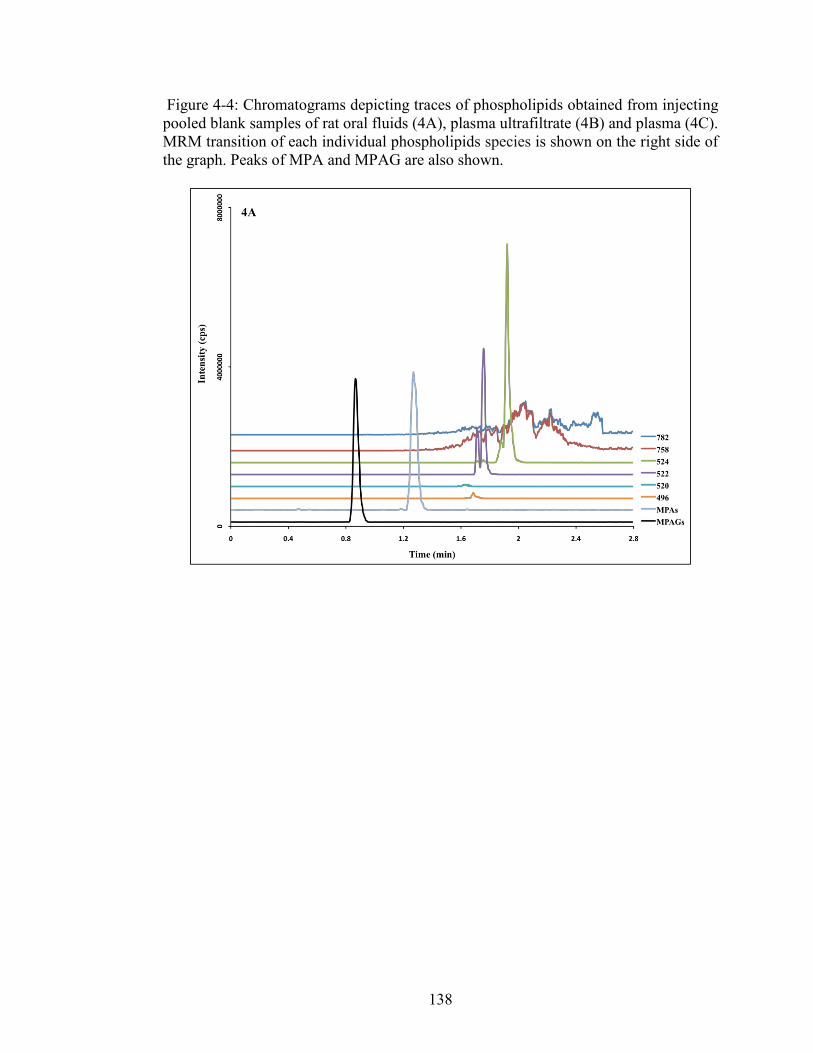
138
Figure 4-4: Chromatograms depicting traces of phospholipids obtained from injecting pooled blank samples of rat oral fluids (4A), plasma ultrafiltrate (4B) and plasma (4C). MRM transition of each individual phospholipids species is shown on the right side of the graph. Peaks of MPA and MPAG are also shown.
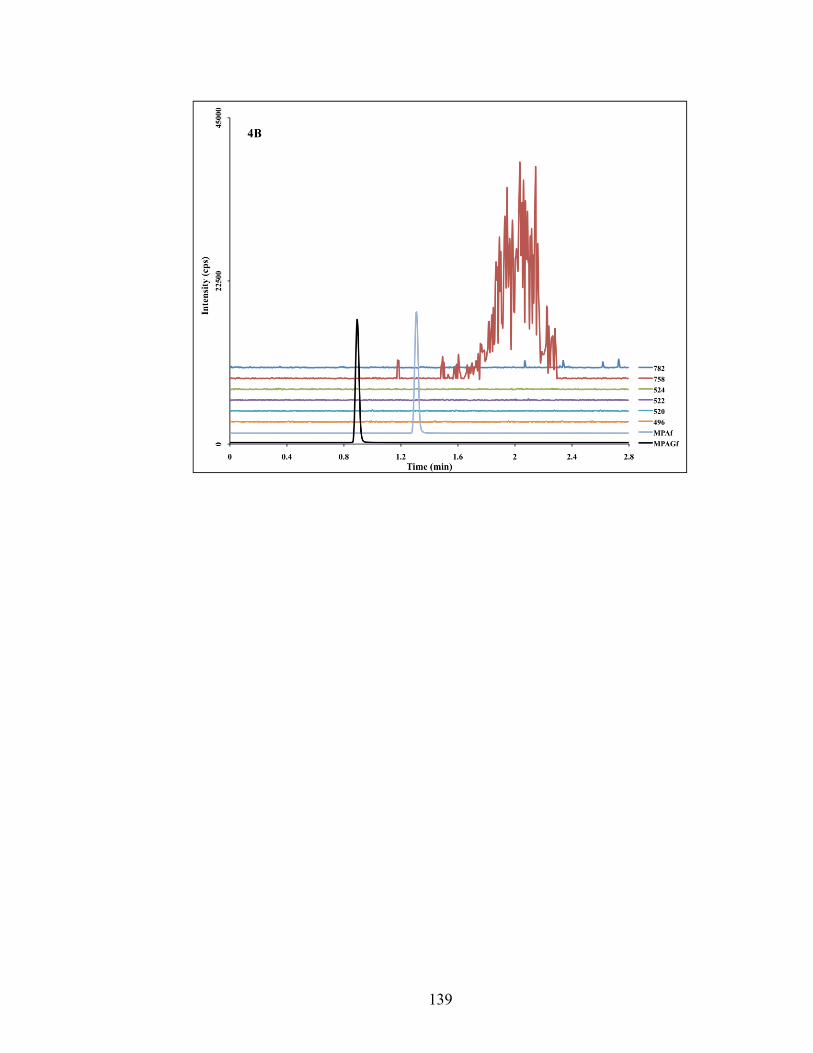
139
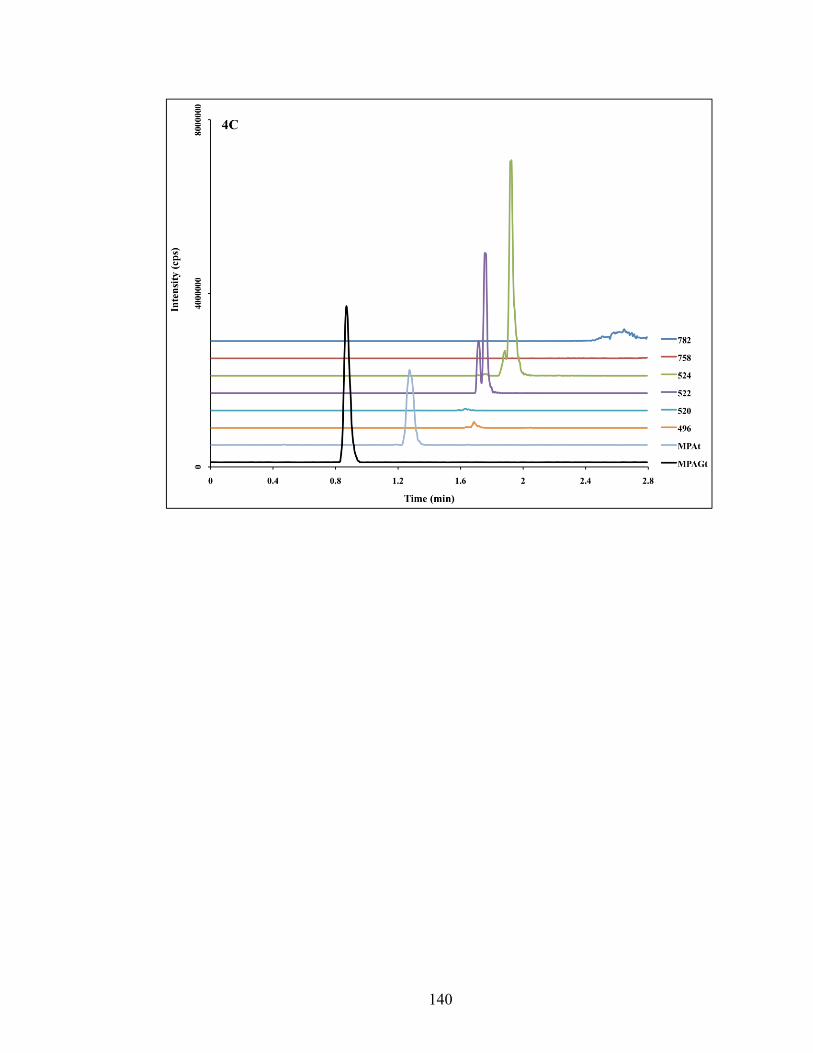
140
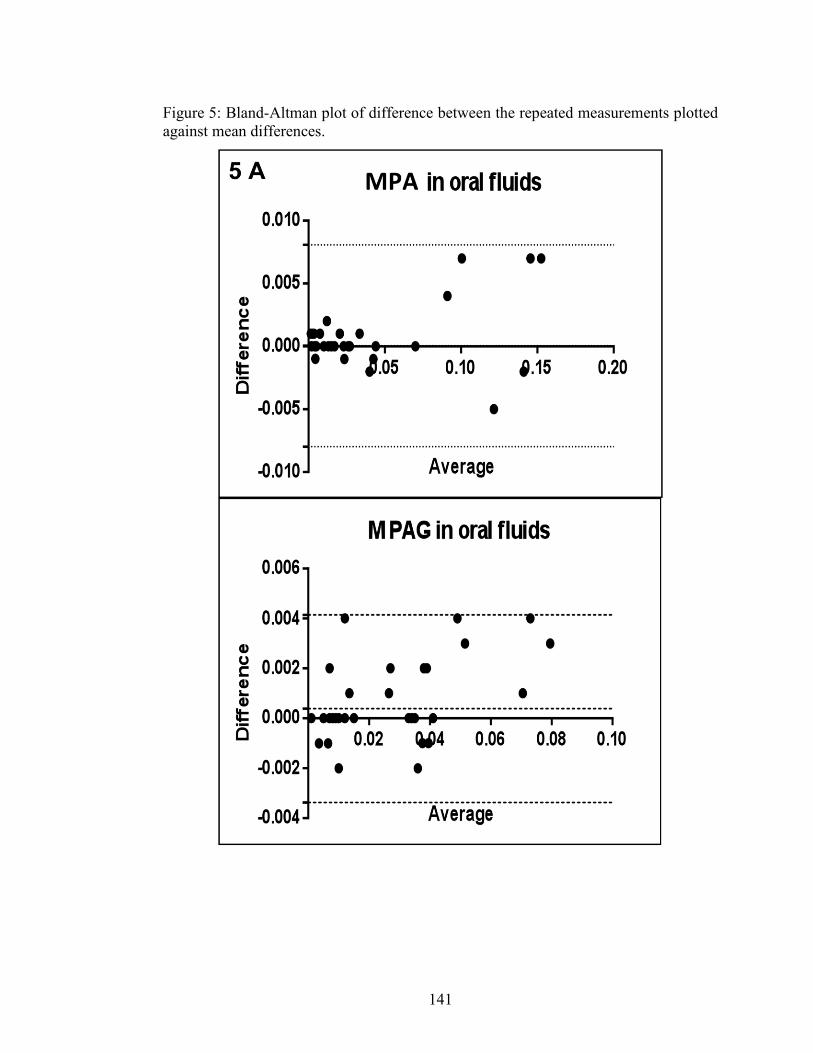
141
Figure 5: Bland-Altman plot of difference between the repeated measurements plotted against mean differences.
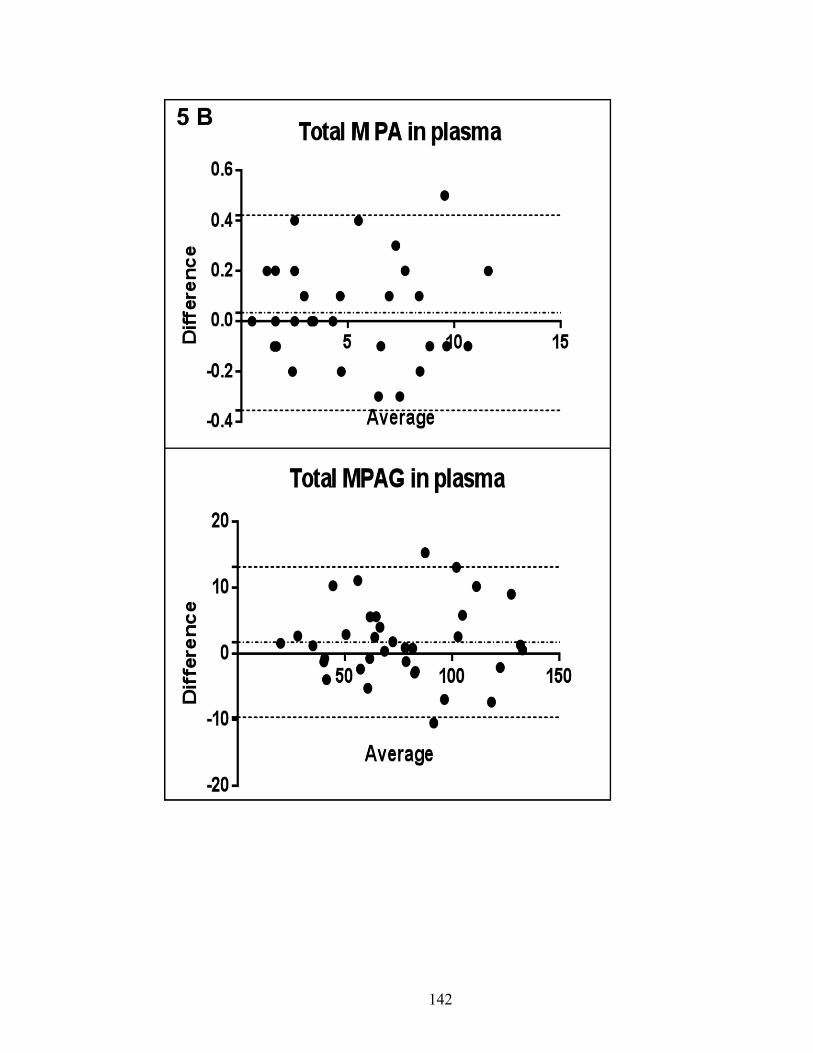
142
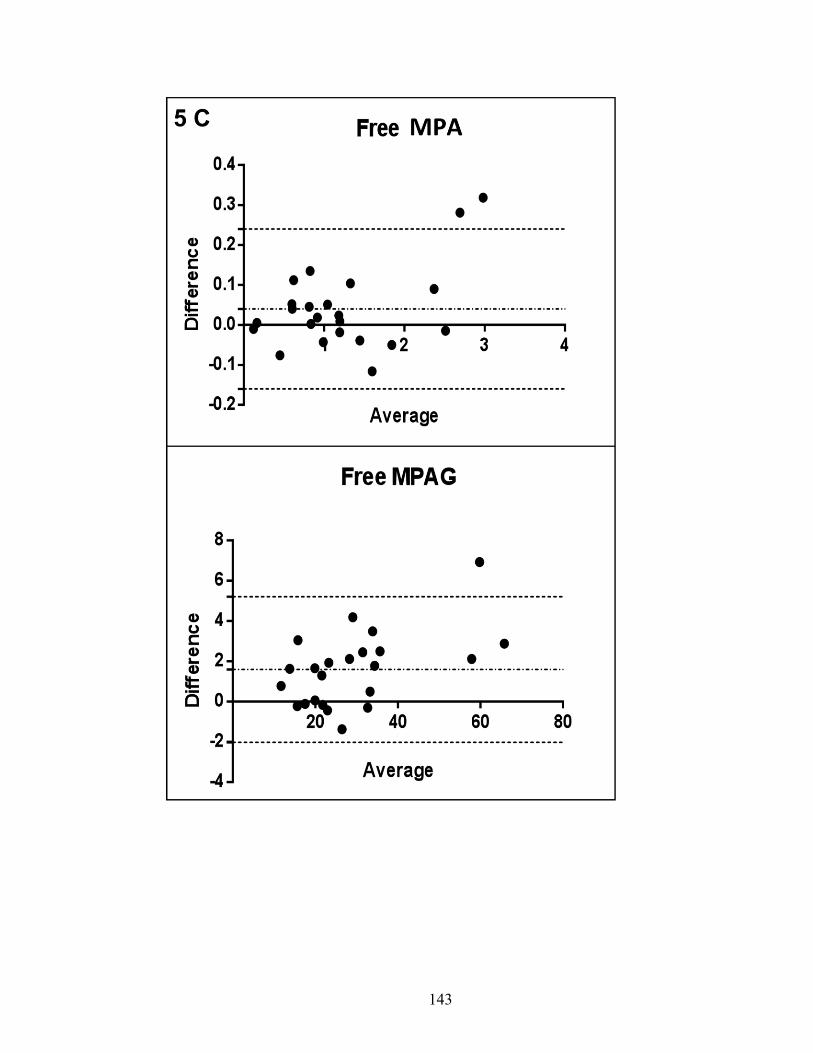
143
144
References
1. Andreoni, K.A., et al., Kidney and pancreas transplantation in the United
States, 1996-2005. Am J Transplant, 2007. 7(5 Pt 2): p. 1359-75. 2. Staatz, C.E. and S.E. Tett, Clinical pharmacokinetics and pharmacodynamics
of mycophenolate in solid organ transplant recipients. Clin Pharmacokinet, 2007. 46(1): p. 13-58.
3. Mohammadpour, N., et al., A review on therapeutic drug monitoring of
immunosuppressant drugs. Iran J Basic Med Sci, 2011. 14(6): p. 485-98. 4. Wiesen, M.H., et al., Liquid chromatography-tandem mass spectrometry
method for the quantification of mycophenolic acid and its phenolic glucuronide in saliva and plasma using a standardized saliva collection device. J Chromatogr A, 2012. 1241: p. 52-9.
5. Shen, B., et al., Determination of total, free and saliva mycophenolic acid with
a LC-MS/MS method: application to pharmacokinetic study in healthy volunteers and renal transplant patients. J Pharm Biomed Anal, 2009. 50(3): p. 515-21.
6. Mendonza, A.E., R.Y. Gohh, and F. Akhlaghi, Analysis of mycophenolic acid
in saliva using liquid chromatography tandem mass spectrometry. Ther Drug Monit, 2006. 28(3): p. 402-6.
7. Wilhelm, A.J., et al., Analysis of mycophenolic acid in dried blood spots using
reversed phase high performance liquid chromatography. J Chromatogr B Analyt Technol Biomed Life Sci, 2009. 877(30): p. 3916-9.
8. Schwartz, E.B. and D.A. Granger, Transferrin enzyme immunoassay for
quantitative monitoring of blood contamination in saliva. Clin Chem, 2004. 50(3): p. 654-6.
9. US Department of Health and Human Services. Food and Drug
Administration (FDA). Center for Drug Evaluation and Research (CDER). Guidance for Industry.Bioanalytical Method Validation 2001.
10. Vogeser, M., et al., Potential lack of specificity using electrospray tandem-
mass spectrometry for the analysis of mycophenolic acid in serum. Ther Drug Monit, 2001. 23(6): p. 722-4.
11. Zhang, G. and C.E. Wujcik, Overcoming ionization effects through
chromatography: a case study for the ESI-LC-MS/MS quantitation of a hydrophobic therapeutic agent in human serum using a stable-label internal
145
standard. J Chromatogr B Analyt Technol Biomed Life Sci, 2009. 877(22): p. 2003-10.
12. Chambers, E., et al., Systematic and comprehensive strategy for reducing
matrix effects in LC/MS/MS analyses. J Chromatogr B Analyt Technol Biomed Life Sci, 2007. 852(1-2): p. 22-34.
13. Dams, R., et al., Matrix effect in bio-analysis of illicit drugs with LC-MS/MS:
influence of ionization type, sample preparation, and biofluid. J Am Soc Mass Spectrom, 2003. 14(11): p. 1290-4.
14. Hardinger, K.L., et al., Influence of pill burden and drug cost on renal function
after transplantation. Pharmacotherapy, 2012. 32(5): p. 427-32. 15. Jacubeit, T., D. Drisch, and E. Weber, Risk factors as reflected by an intensive
drug monitoring system. Agents Actions Suppl, 1990. 29: p. 117-25. 16. van Amsterdam, P., et al., The European Bioanalysis Forum community's
evaluation, interpretation and implementation of the European Medicines Agency guideline on Bioanalytical Method Validation. Bioanalysis, 2013. 5(6): p. 645-59.
146
Chapter 5 M MANUSCRIPT V
To be submitted to Clinical Pharmacokinetics
Therapeutic Drug Monitoring of Mycophenolic Acid in Oral Fluid samples from
Kidney Transplant Recipients
Mwlod Ghareeb1, Reginald Y. Gohh 2 , Fatemeh Akhlaghi1
DEPARTMENT AND INSTITUTION
1Department of Biomedical and Pharmaceutical Sciences, University of Rhode Island, Kingston, RI 2 Division of Organ Transplantation, Rhode Island Hospital, Warren Alpert Medical School of Brown University, Providence, Rhode Island, USA.
147
Address correspondence to: Fatemeh Akhlaghi, PharmD, PhD, Clinical Pharmacokinetics Research Laboratory, Department of Biomedical and Pharmaceutical Sciences, University of Rhode Island, 495A College of Pharmacy, 7 Greenhouse Road, Kingston, RI 02881, USA. Phone: (401) 874 9205. Fax: (401) 874 5787. Email: [email protected]
DISCLOSURE
No conflict of interest is declared
148
ABBREVIATIONS
C0: pre-dose concentration, C2: Two post dose concentration, LC-MS/MS: Liquid chromatography tandem mass spectrometry, LLOQ: Lower limit of quantification, MPA: Mycophenolic acid, MPAf: Unbound mycophenolic acid concentration in plasma, MPAof: Oral fluid mycophenolic acid concentration, MPAt: Total mycophenolic acid concentration in plasma, MPAG: Mycophenolic acid glucuronide, MPAGf: Unbound mycophenolic acid glucuronide concentration in plasma MPAof: Oral fluid mycophenolic acid glucuronide concentration, MPAt: Total mycophenolic acid glucuronide concentration in plasma, OF: Oral fluid, TDM: Therapeutic drug monitoring, TRN: Transferrin
149
Abstract
Mycophenolic acid (MPA) is widely described immunosuppressive agent for solid
organ transplant patients. It has a narrow therapeutic index. Therefore routine
therapeutic drug monitoring (TDM) is recommended. Since the free drug fraction is
responsible for pharmacological and toxic effect, quantifying unbound fraction might
be more sensible. Quantifying plasma-unbound fraction is costly and labor intensive.
However, drugs presented in oral fluid (OF) are considered a preventative of plasma
free fraction. Therefore, oral fluid drug concentration may provide a mean for
estimating unbound fraction with simple sample preparation procedures in
noninvasively collected samples. In this paper, the concentration of MPA and its
glucuronide metabolites (MPAG) were quantified in OF, plasma and plasma ultra-
filtrate.
The correlation between MPA and MPAG concentrations in three matrices was
investigated. Moreover, factors that may affect such correlation, including sampling
time, salivary blood contamination, and food were investigated.
Introduction
In United States, in year 2005, about 87% of kidney and pancreas transplant patients
were prescribed Mycophenolic acid (MPA) at hospital discharge [1]. MPA is a
substrate for uridine diphosphate glucuronosyltransferases (UGTs). It is metabolized
to a major inactive metabolite mycophenolic acid β-D-glucuronide (MPAG) and the
minor but pharmacologically active metabolites mycophenolic acid acyl-β-D-
glucuronide (AcMPAG) [2]. About 97-99% of MPA binds to plasma protein [2].
MPAG metabolites also bind to plasma protein and increased level MPAG, as in
150
patients with compromised renal function, may increases by 3-6 folds resulting
displacement of MPA from plasma protein binding sites [2]. As a result, MPA free
fraction may increase up to 7% [2]. Because of the narrow therapeutic index,
therapeutic drug monitoring of MPA is recommended. Currently, plasma obtained
through venipuncture is used for TDM of MPA [3]. Due to the invasive nature of
blood sampling, alternative matrices were investigated, including dried blood spot [4]
and OF [5-7].
The free fraction of a drug is responsible for pharmacological and toxicological effects
[2,8,9], Therefore, measuring drug concentrations in OF may provide a better
prediction of clinical outcomes and toxicity. The concentration of a drug in OF
represents free drug concentration [10-12]. Thus, salivary drug level measurements are
much easier and faster compared to quantifying free drug concentrations in plasma
[6,7,13]. Mycophenolic acid is a small molecule with a molecular weight of 320.3, has
a lipophilic nature (LogD = 2.57 and 0.75 at pH 5.5 and 7.4, respectively) [14]. These
characteristics facilitate its movement through biological and entering OF [11,15]. In
this paper, the association between MPA and MPAG metabolites in oral fluid, plasma,
and plasma ultra-filtrate was studied.
Study population
Samples included collected in two studies from patients attending kidney transplant
clinics and recruited in two studies. Patients' were on triple immunosuppressants
regimen included tacrolimus or sirolimus, prednisone, and mycophenolic acid. Before
conducting the studies, protocols were reviewed and approved by Institutional Review
Board at Rhode Island Hospital (Providence, RI).
151
Patients Samples
After the physical examination by the physician, patients were asked to sign the
informed consent. In the first study, patients were asked to give about 4mL venous
blood samples, collected ethylenediaminetetraacetic acid (EDTA), and matching OF
samples collected sporadically at certain time points, including, pre-dose (time 0 =
C0). In the second study, C0 blood samples were collected with 3 matching OF
samples collected at resting, 5 min after mouth rinsing using bottled water, and
immediately after giving a saliva stimulant (commercial sour candy). Following, the
patients were given vouchers for free breakfast and asked to report back at the study
location shortly before 2 hours after dose (C2) sampling time when blood a sample and
correspond OF samples were collected. The OF samples were collected by passive
drool into siliconized plastic cups. Blood and OF samples kept on dry ice till
transferred to the Biomedical and Pharmaceutical Sciences (BPS) department at
University of Rhode Island and stored at – 80 °C till analyzed.
Statistical data analysis
Statistical analysis was performed using the SPSS software (version 19.0, SPSS Inc.,
Chicago, IL, USA). Normal distribution of the data was checked graphically and
confirmed with the Shapiro-Wilk test, and nonparametric tests were used whenever
needed.
Measuring MPA and MPAG in OF and blood
Concentrations of MPA and MPAG in OF (MPAof and MPAGof, respectively),
plasma (MPAt and MPAGt, respectively) and plasma ultrafiltrate (MPAf and MPAGf,
respectively) were measured using a validated LC-MS/MS method (not published,
152
Chapter IV). In brief, an Acquity UPLC BEH C18 column (Waters Corp) was
utilized as a stationary phase. Full chromatography separation between MPA and
MPAG was achieved within a run time of 2.8 min using gradient elution delivered at
0.350 mL/ min flow rate. The mobile phase consisted of water containing 95:5%
water: acetonitrile (ACN) mixture contained 2 mM ammonium acetate / 0.1% (v/v)
formic acid (Solvent A); and ACN containing 2 mM ammonium acetate / 0.1% (v/v)
formic acid (Solvent B).
Sample preparation involved extracting 50 µL of OF or plasma patients' samples,
calibration curve standards, quality controls (QCs), blank, with 100µL or 200 µL of
ACN precipitating solvent containing the internal standard, respectively, in 96-well
plates. After shake mix and centrifugation, the supernatant then transferred to a new
plate using a multichannel pipette. For MPAf and MPAGf quantification, 300uL of
patients' plasma samples, calibration curve standards, QCs and blank were loaded into
the ultra-filtration devices and centrifuged following manufacturer's recommendation
(Centrifree® ultrafiltration device from EMD Millipore, Merck KGaA, Darmstadt,
Germany). One part of ultra-filtrate was diluted with five parts of 50% ACN, briefly
vortex mix and transferred to 96-wells plate. The injection volumes were 5µL for OF
and plasma; and 10µL for plasma ultra-filtrate.
Salivary pH and blood contamination
Orion STAR A111 pH meter equipped with Micro Electrode from Thermo Scientific
(Waltham, MA, USA) was used to measure salivary pH. To assess and quantify
possible salivary blood contamination, transferrin kit from Salimetrics LLC (State
College, PA, USA) was used following manufacture's recommendations [16].
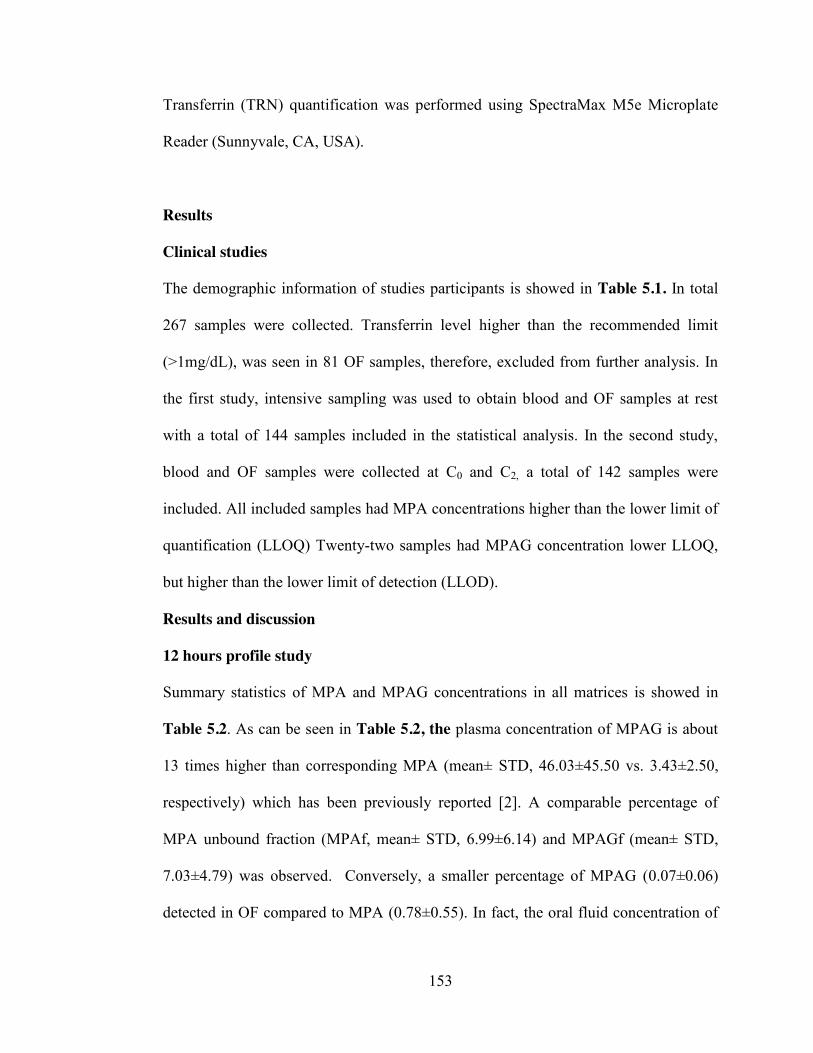
153
Transferrin (TRN) quantification was performed using SpectraMax M5e Microplate
Reader (Sunnyvale, CA, USA).
Results
Clinical studies
The demographic information of studies participants is showed in Table 5.1. In total
267 samples were collected. Transferrin level higher than the recommended limit
(>1mg/dL), was seen in 81 OF samples, therefore, excluded from further analysis. In
the first study, intensive sampling was used to obtain blood and OF samples at rest
with a total of 144 samples included in the statistical analysis. In the second study,
blood and OF samples were collected at C0 and C2, a total of 142 samples were
included. All included samples had MPA concentrations higher than the lower limit of
quantification (LLOQ) Twenty-two samples had MPAG concentration lower LLOQ,
but higher than the lower limit of detection (LLOD).
Results and discussion
12 hours profile study
Summary statistics of MPA and MPAG concentrations in all matrices is showed in
Table 5.2. As can be seen in Table 5.2, the plasma concentration of MPAG is about
13 times higher than corresponding MPA (mean± STD, 46.03±45.50 vs. 3.43±2.50,
respectively) which has been previously reported [2]. A comparable percentage of
MPA unbound fraction (MPAf, mean± STD, 6.99±6.14) and MPAGf (mean± STD,
7.03±4.79) was observed. Conversely, a smaller percentage of MPAG (0.07±0.06)
detected in OF compared to MPA (0.78±0.55). In fact, the oral fluid concentration of
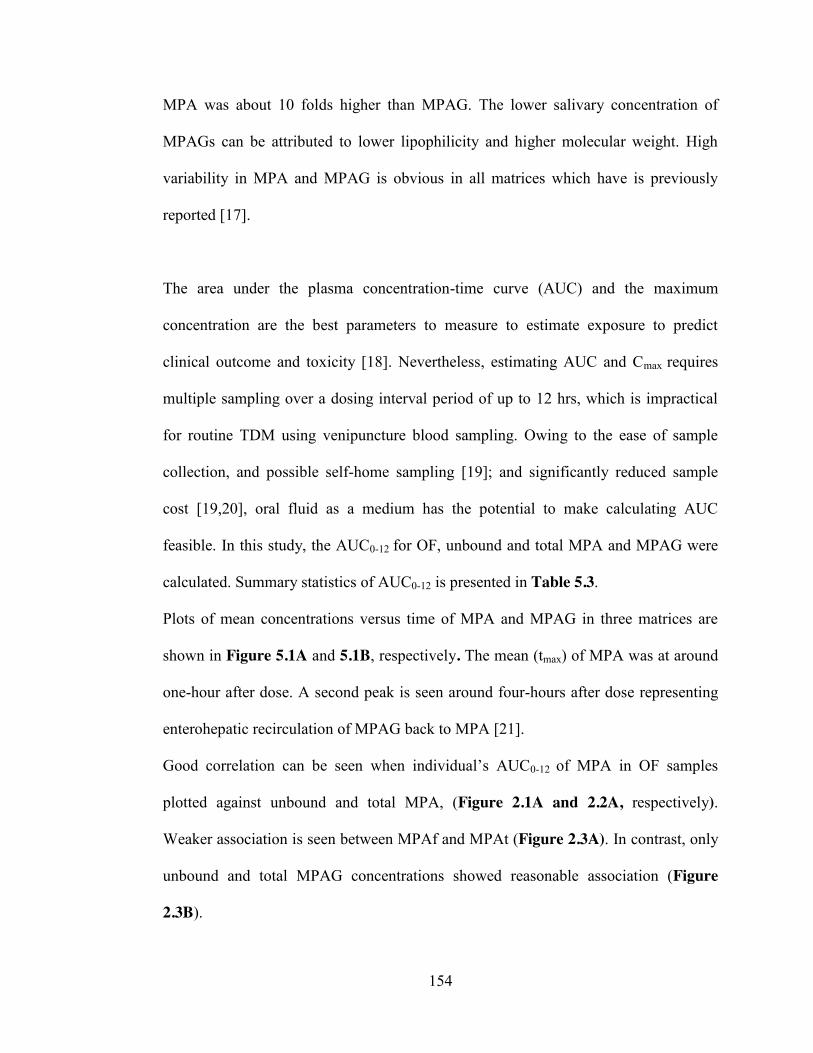
154
MPA was about 10 folds higher than MPAG. The lower salivary concentration of
MPAGs can be attributed to lower lipophilicity and higher molecular weight. High
variability in MPA and MPAG is obvious in all matrices which have is previously
reported [17].
The area under the plasma concentration-time curve (AUC) and the maximum
concentration are the best parameters to measure to estimate exposure to predict
clinical outcome and toxicity [18]. Nevertheless, estimating AUC and Cmax requires
multiple sampling over a dosing interval period of up to 12 hrs, which is impractical
for routine TDM using venipuncture blood sampling. Owing to the ease of sample
collection, and possible self-home sampling [19]; and significantly reduced sample
cost [19,20], oral fluid as a medium has the potential to make calculating AUC
feasible. In this study, the AUC0-12 for OF, unbound and total MPA and MPAG were
calculated. Summary statistics of AUC0-12 is presented in Table 5.3.
Plots of mean concentrations versus time of MPA and MPAG in three matrices are
shown in Figure 5.1A and 5.1B, respectively. The mean (tmax) of MPA was at around
one-hour after dose. A second peak is seen around four-hours after dose representing
enterohepatic recirculation of MPAG back to MPA [21].
Good correlation can be seen when individual’s AUC0-12 of MPA in OF samples
plotted against unbound and total MPA, (Figure 2.1A and 2.2A, respectively).
Weaker association is seen between MPAf and MPAt (Figure 2.3A). In contrast, only
unbound and total MPAG concentrations showed reasonable association (Figure
2.3B).
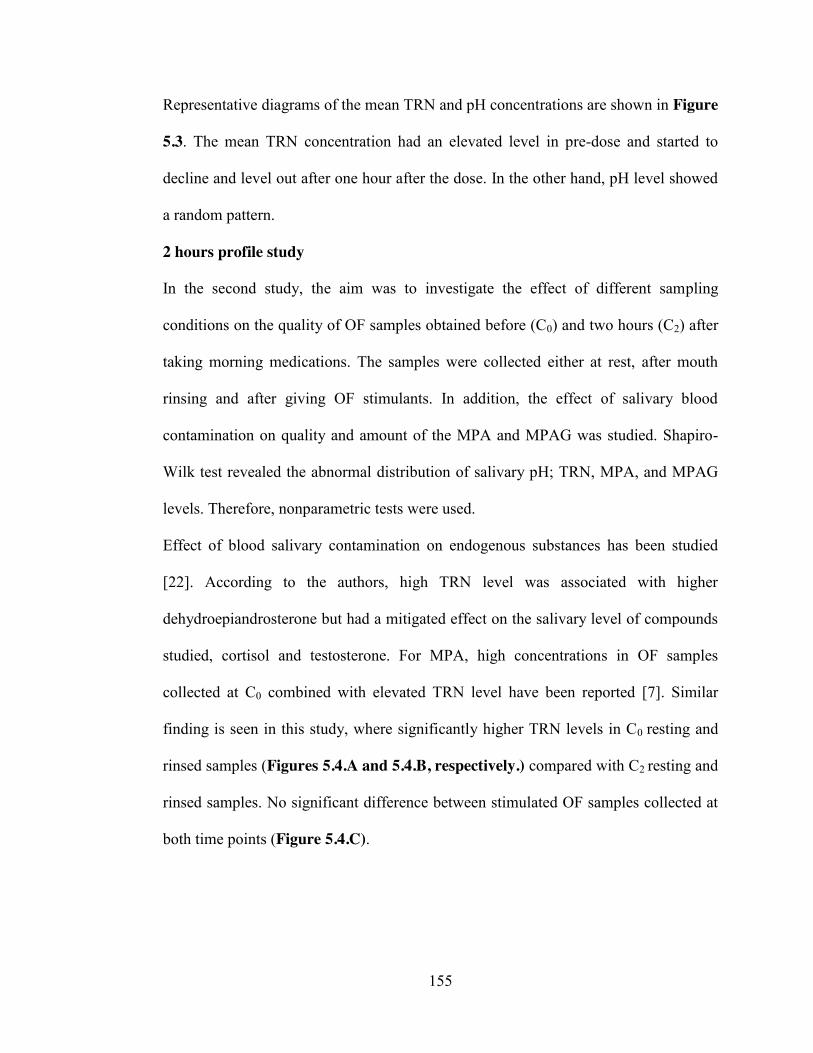
155
Representative diagrams of the mean TRN and pH concentrations are shown in Figure
5.3. The mean TRN concentration had an elevated level in pre-dose and started to
decline and level out after one hour after the dose. In the other hand, pH level showed
a random pattern.
2 hours profile study
In the second study, the aim was to investigate the effect of different sampling
conditions on the quality of OF samples obtained before (C0) and two hours (C2) after
taking morning medications. The samples were collected either at rest, after mouth
rinsing and after giving OF stimulants. In addition, the effect of salivary blood
contamination on quality and amount of the MPA and MPAG was studied. Shapiro-
Wilk test revealed the abnormal distribution of salivary pH; TRN, MPA, and MPAG
levels. Therefore, nonparametric tests were used.
Effect of blood salivary contamination on endogenous substances has been studied
[22]. According to the authors, high TRN level was associated with higher
dehydroepiandrosterone but had a mitigated effect on the salivary level of compounds
studied, cortisol and testosterone. For MPA, high concentrations in OF samples
collected at C0 combined with elevated TRN level have been reported [7]. Similar
finding is seen in this study, where significantly higher TRN levels in C0 resting and
rinsed samples (Figures 5.4.A and 5.4.B, respectively.) compared with C2 resting and
rinsed samples. No significant difference between stimulated OF samples collected at
both time points (Figure 5.4.C).
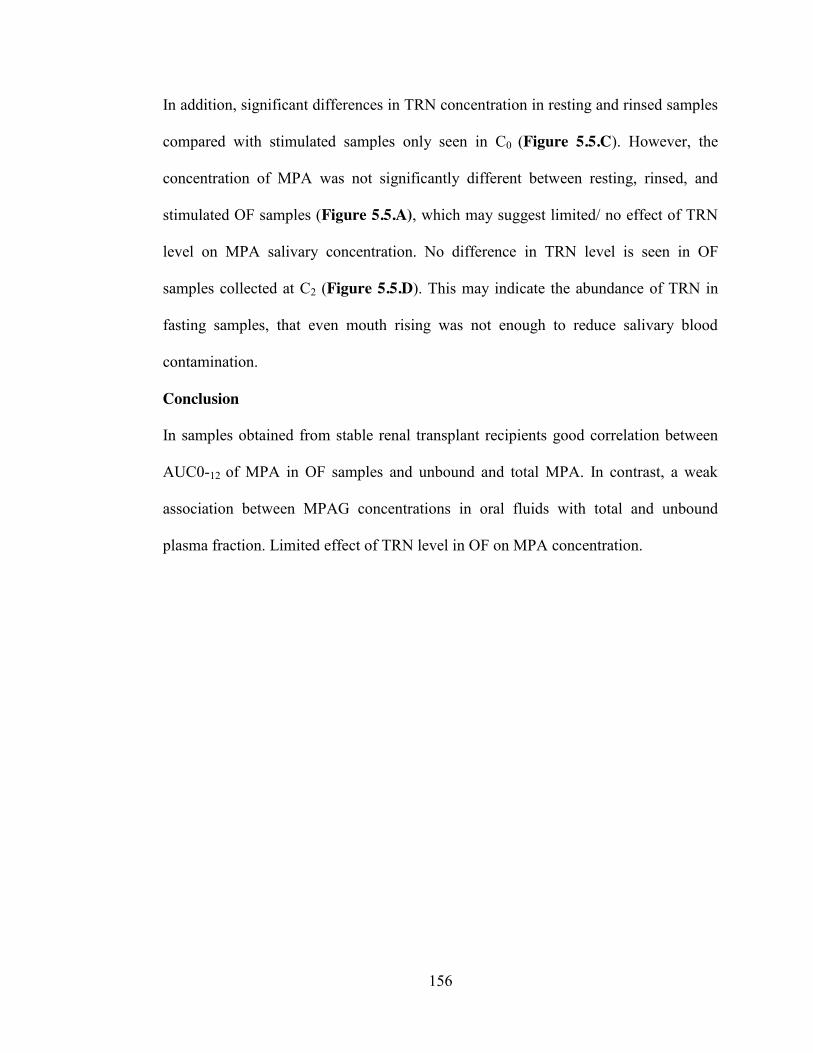
156
In addition, significant differences in TRN concentration in resting and rinsed samples
compared with stimulated samples only seen in C0 (Figure 5.5.C). However, the
concentration of MPA was not significantly different between resting, rinsed, and
stimulated OF samples (Figure 5.5.A), which may suggest limited/ no effect of TRN
level on MPA salivary concentration. No difference in TRN level is seen in OF
samples collected at C2 (Figure 5.5.D). This may indicate the abundance of TRN in
fasting samples, that even mouth rising was not enough to reduce salivary blood
contamination.
Conclusion
In samples obtained from stable renal transplant recipients good correlation between
AUC0-12 of MPA in OF samples and unbound and total MPA. In contrast, a weak
association between MPAG concentrations in oral fluids with total and unbound
plasma fraction. Limited effect of TRN level in OF on MPA concentration.
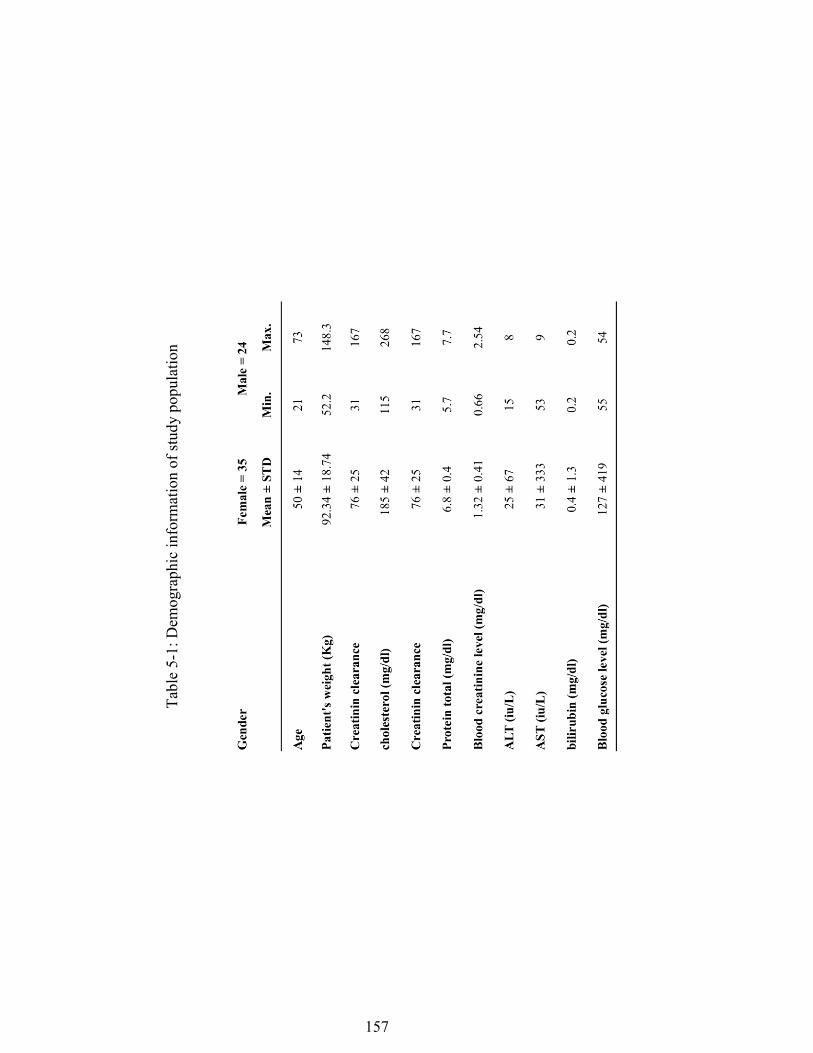
157
Tabl
e 5-
1: D
emog
raph
ic in
form
atio
n of
stud
y po
pula
tion

158
Tabl
e 5-
2: st
atis
tic su
mm
ary
of m
easu
red
para
met
ers
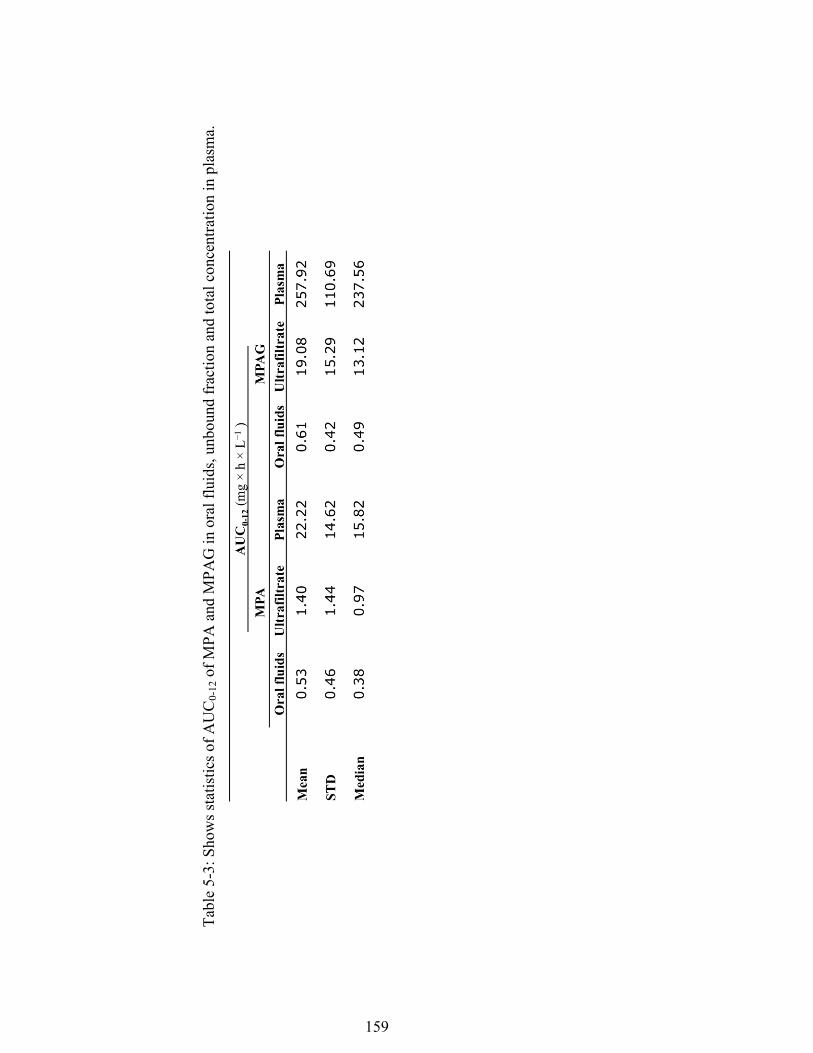
159
Tabl
e 5-
3: S
how
s sta
tistic
s of A
UC
0-12
of M
PA a
nd M
PAG
in o
ral f
luid
s, un
boun
d fr
actio
n an
d to
tal c
once
ntra
tion
in p
lasm
a.

160
Figu
re 5
-1: S
aliv
ary,
unb
ound
and
tota
l con
cent
ratio
n (m
g/L)
of m
ycop
heno
lic a
cid
(4.1
A) a
nd g
lucu
roni
de m
etab
olite
s (4.
1B) v
ersu
s tim
e; d
ata
are
expr
esse
d as
mea
n an
d er
ror b
ars r
epre
sent
stan
dard
err
or.
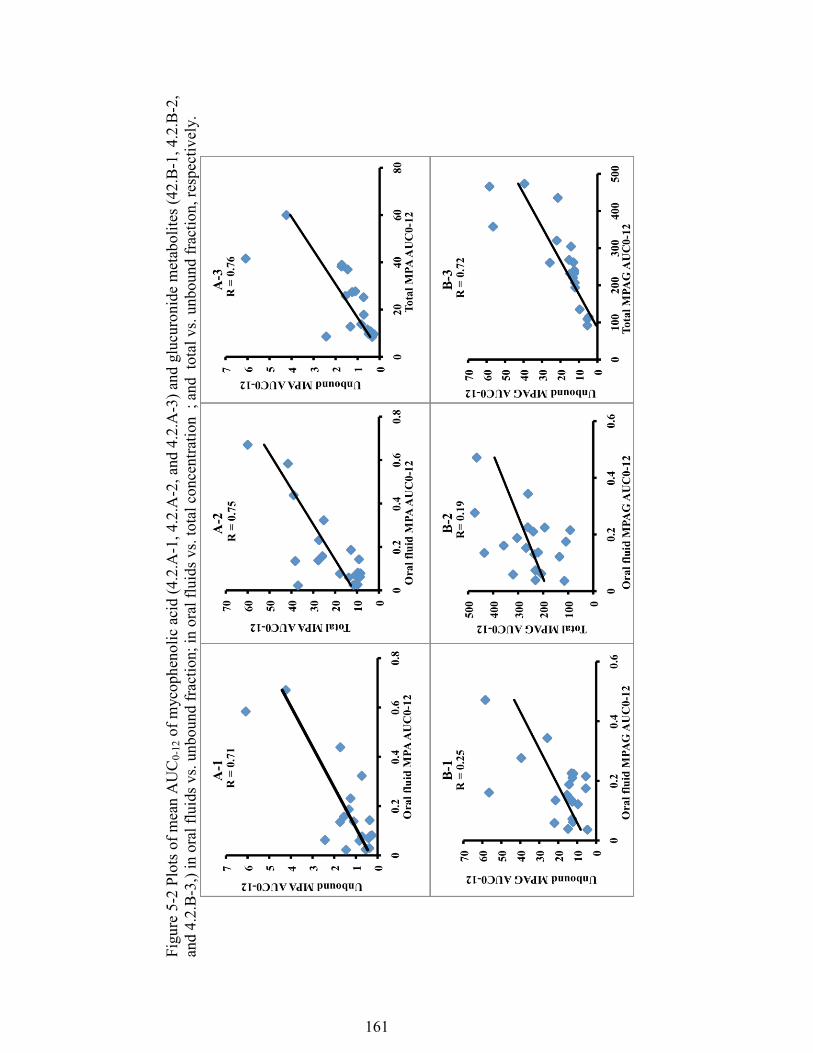
161
Figu
re 5
-2 P
lots
of m
ean
AU
C0-
12 o
f myc
ophe
nolic
aci
d (4
.2.A
-1, 4
.2.A
-2, a
nd 4
.2.A
-3) a
nd g
lucu
roni
de m
etab
olite
s (42
.B-1
, 4.2
.B-2
, an
d 4.
2.B
-3,)
in o
ral f
luid
s vs.
unbo
und
frac
tion;
in o
ral f
luid
s vs.
tota
l con
cent
ratio
n ;
and
tota
l vs.
unbo
und
frac
tion,
resp
ectiv
ely.
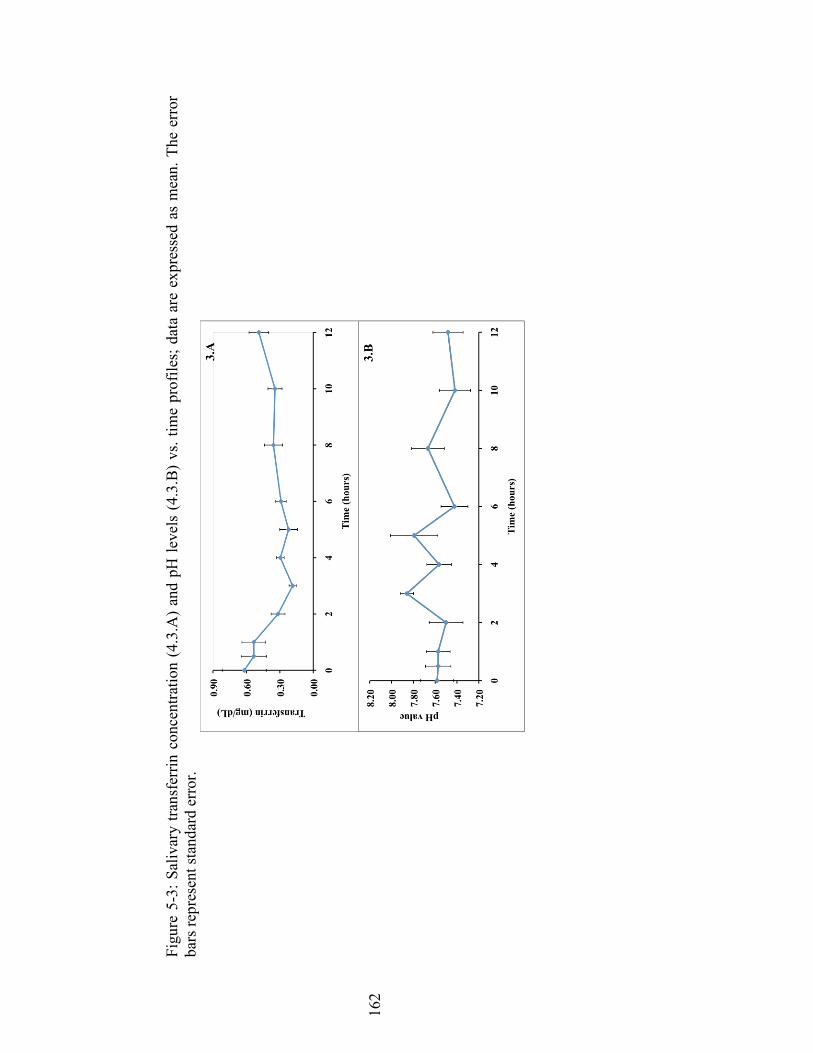
162
Figu
re 5
-3: S
aliv
ary
trans
ferr
in c
once
ntra
tion
(4.3
.A)
and
pH le
vels
(4.
3.B
) vs
. tim
e pr
ofile
s; d
ata
are
expr
esse
d as
mea
n. T
he e
rror
ba
rs re
pres
ent s
tand
ard
erro
r.

163
Figu
re 5
-4.
Box
plo
ts c
ompa
re th
e tra
nsfe
rrin
con
cent
ratio
n at
pre
and
two
hour
s afte
r dos
e an
d w
ith d
iffer
ent s
ampl
ing
cond
ition
s at
rest
ing
(4.A
), rin
sed
(4.B
), an
d st
imul
ated
(4.C
)
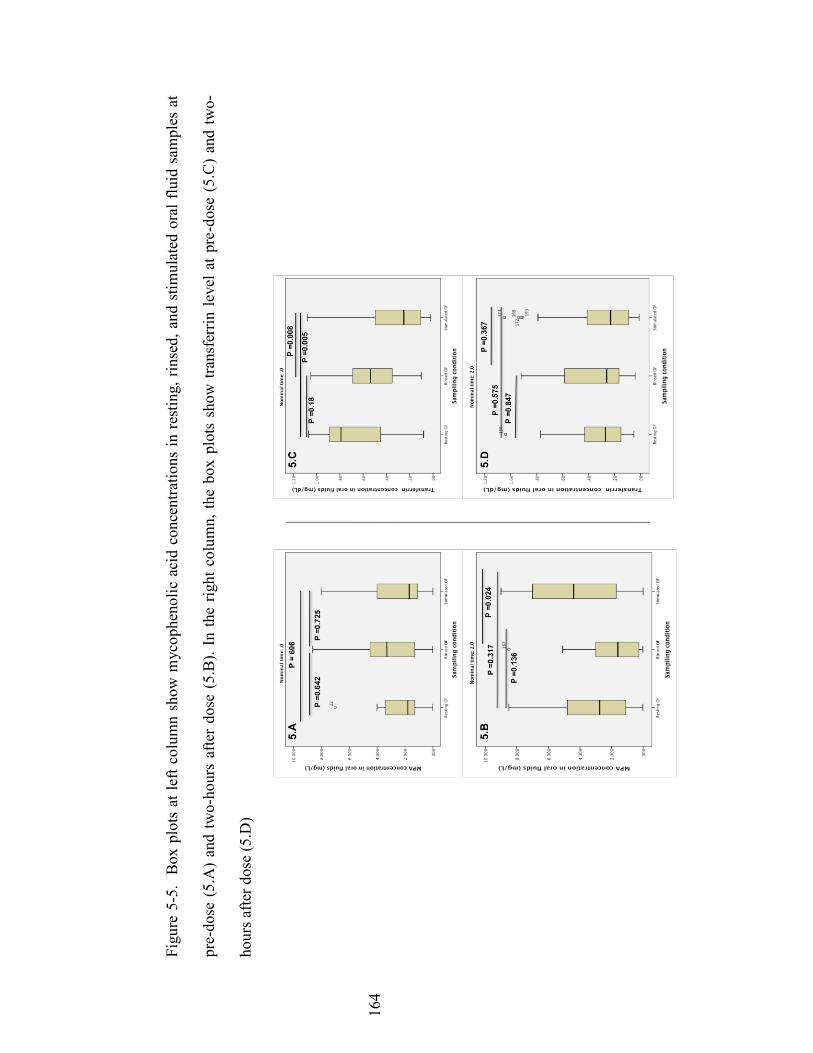
164
Figu
re 5
-5.
Box
plo
ts a
t lef
t col
umn
show
myc
ophe
nolic
aci
d co
ncen
tratio
ns in
rest
ing,
rin
sed,
and
stim
ulat
ed o
ral f
luid
sam
ples
at
pre-
dose
(5.
A)
and
two-
hour
s af
ter
dose
(5.
B).
In th
e rig
ht c
olum
n, th
e bo
x pl
ots
show
tran
sfer
rin le
vel a
t pre
-dos
e (5
.C)
and
two-
hour
s afte
r dos
e (5
.D)
165
References 1. Andreoni KA, Brayman KL, Guidinger MK, Sommers CM, Sung RS. Kidney
and pancreas transplantation in the United States, 1996-2005. Am. J. Transplant., 7(5 Pt 2), 1359-1375 (2007).
2. Staatz CE, Tett SE. Clinical pharmacokinetics and pharmacodynamics of
mycophenolate in solid organ transplant recipients. Clinical pharmacokinetics, 46(1), 13-58 (2007).
3. Mohammadpour N, Elyasi S, Vahdati N, Mohammadpour AH, Shamsara J. A
review on therapeutic drug monitoring of immunosuppressant drugs. Iranian journal of basic medical sciences, 14(6), 485-498 (2011).
4. Wilhelm AJ, den Burger JC, Chahbouni A, Vos RM, Sinjewel A. Analysis of
mycophenolic acid in dried blood spots using reversed phase high performance liquid chromatography. Journal of chromatography. B, Analytical technologies in the biomedical and life sciences, 877(30), 3916-3919 (2009).
5. Wiesen MH, Farowski F, Feldkotter M, Hoppe B, Muller C. Liquid
chromatography-tandem mass spectrometry method for the quantification of mycophenolic acid and its phenolic glucuronide in saliva and plasma using a standardized saliva collection device. Journal of chromatography. A, 1241, 52-59 (2012).
6. Shen B, Li S, Zhang Y et al. Determination of total, free and saliva
mycophenolic acid with a LC-MS/MS method: application to pharmacokinetic study in healthy volunteers and renal transplant patients. Journal of pharmaceutical and biomedical analysis, 50(3), 515-521 (2009).
7. Mendonza AE, Gohh RY, Akhlaghi F. Analysis of mycophenolic acid in saliva
using liquid chromatography tandem mass spectrometry. Therapeutic drug monitoring, 28(3), 402-406 (2006).
8. Zahir H, McCaughan G, Gleeson M, Nand RA, McLachlan AJ. Changes in
tacrolimus distribution in blood and plasma protein binding following liver transplantation. Therapeutic drug monitoring, 26(5), 506-515 (2004).
9. Akhlaghi F, Ashley J, Keogh A, Brown K. Cyclosporine plasma unbound
fraction in heart and lung transplantation recipients. Therapeutic drug monitoring, 21(1), 8-16 (1999).
10. Haeckel R. Factors influencing the saliva/plasma ratio of drugs. Ann. N. Y.
Acad. Sci., 694, 128-142 (1993). 11. Jusko WJ, Milsap RL. Pharmacokinetic principles of drug distribution in
saliva. Ann. N. Y. Acad. Sci., 694, 36-47 (1993).
166
12. Haeckel R, Hanecke P. Application of saliva for drug monitoring. An in vivo
model for transmembrane transport. European journal of clinical chemistry and clinical biochemistry : journal of the Forum of European Clinical Chemistry Societies, 34(3), 171-191 (1996).
13. Ionita IA, Akhlaghi F. Quantification of unbound prednisolone, prednisone,
cortisol and cortisone in human plasma by ultrafiltration and direct injection into liquid chromatrography tandem mass spectrometry. Annals of clinical biochemistry, 47(Pt 4), 350-357 (2010).
14. ChemSpider / Search and share chemistry. (Royal Society of Chemistry)
http://www.chemspider.com 15. Feller K, le Petit G. On the distribution of drugs in saliva and blood plasma.
International journal of clinical pharmacology and biopharmacy, 15(10), 468-469 (1977).
16. Schwartz EB, Granger DA. Transferrin enzyme immunoassay for quantitative
monitoring of blood contamination in saliva. Clinical chemistry, 50(3), 654-656 (2004).
17. Bergmann TK, Barraclough KA, Lee KJ, Staatz CE. Clinical pharmacokinetics
and pharmacodynamics of prednisolone and prednisone in solid organ transplantation. Clinical pharmacokinetics, 51(11), 711-741 (2012).
18. Schiff J, Cole E, Cantarovich M. Therapeutic monitoring of calcineurin
inhibitors for the nephrologist. Clinical journal of the American Society of Nephrology : CJASN, 2(2), 374-384 (2007).
19. Tennison M, Ali I, Miles MV, D'Cruz O, Vaughn B, Greenwood R. Feasibility
and acceptance of salivary monitoring of antiepileptic drugs via the US Postal Service. Therapeutic drug monitoring, 26(3), 295-299 (2004).
20. Gorodischer R, Koren G. Salivary excretion of drugs in children: theoretical
and practical issues in therapeutic drug monitoring. Developmental pharmacology and therapeutics, 19(4), 161-177 (1992).
21. Bullingham RE, Nicholls AJ, Kamm BR. Clinical pharmacokinetics of
mycophenolate mofetil. Clinical pharmacokinetics, 34(6), 429-455 (1998). 22. Granger DA, Cicchetti D, Rogosch FA, Hibel LC, Teisl M, Flores E. Blood
contamination in children's saliva: prevalence, stability, and impact on the measurement of salivary cortisol, testosterone, and dehydroepiandrosterone. Psychoneuroendocrinology, 32(6), 724-733 (2007).
167
Chapter 6 : MANUSCRIPT VI
Submitted to Analytical and Bioanalytical Chemistry
Development and Validation of an UPLC-MS/MS Assay for Quantitative Analysis of the Ghrelin Receptor Inverse Agonist PF-5190457 in Human or Rat Plasma and Rat Brain
Mwlod Ghareeb1, Lorenzo Leggio2,3, Ayman El-Kattan 4, Fatemeh Akhlaghi1
DEPARTMENT AND INSTITUTION
1Department of Biomedical and Pharmaceutical Sciences, University of Rhode Island, Kingston, RI, USA, 02881 2Section on Clinical Psychoneuroendocrinology and Neuropsychopharmacology, Laboratory of Clinical and Translational Studies, National Institute on Alcohol Abuse and Alcoholism, Bethesda, MD, USA; and Intramural Research Program, National Institute on Drug Abuse, National Institutes of Health, Baltimore, MD, USA. 3Center for Alcohol and Addiction Studies, Department of Behavioral and Social Sciences, Brown University, Providence, RI, USA. 4 Pfizer Inc., 610 Main St, Cambridge, MA, USA
168
Address correspondence to: Fatemeh Akhlaghi, PharmD, PhD; Clinical Pharmacokinetics Research Laboratory; Department of Biomedical and Pharmaceutical Sciences; University of Rhode Island; 495A College of Pharmacy; 7 Greenhouse Road; Kingston; RI 02881, USA. Phone: (401) 874 9205. Fax: (401) 874 5787. Email: [email protected]
Funding:
This work was supported by grant number 1UH2TR000963 (PIs: Akhlaghi and Leggio) from the National Center for Advancing Translational Sciences (NCATS), National Institutes of Health (NIH); and by NIH intramural funding ZIA-AA000218 (PI: Leggio) jointly supported by the Division of Intramural Clinical and Biological Research of the National Institute on Alcohol Abuse and Alcoholism (NIAAA) and the Intramural Research Program of the National Institute on Drug Abuse (NIDA). Acknowledgment: Authors would like to thank Professor Deyu Li for his help in elucidating the fragmentation pattern of PF-5190457.
169
KEY WORDS
Alcoholism, bioanalytical methods, ghrelin, LC-MS/MS, PF-5190457, pharmacokinetics
ABBREVIATIONS
ACN: acetonitrile, CV: coefficient of variation IS: internal standard, LLOQ: lower limit of quantification, ME: matrix effect, MeOH: methanol, MRM: multiple reaction monitoring, MS: mass spectrometry, Mw: molecular weight, PLs: phospholipids, QCs: Quality controls, UPLC-MS/MS: ultra performance liquid chromatography tandem mass spectrometry
170
ABSTRACT
PF-5190457 is a ghrelin receptor inverse agonist that is currently undergoing clinical
development for the treatment of alcoholism. Our aim was to develop and validate a
simple and sensitive assay for quantitative analysis of PF-5190457 in human or rat
plasma and rat brain using liquid chromatography-tandem mass spectrometry. The
analyte and stable isotope internal standard were extracted from 50 μL plasma or rat
brain homogenate by protein precipitation using 0.1% formic acid in acetonitrile.
Chromatography was carried on an Acquity UPLC BEH C18 (2.1 mm X 50 mm) with
1.7 µm particle size and 130Å pore size. Flow rate was 0.5 mL/min and total
chromatographic run time was 2.2 minutes. Mobile phase consisted of gradient
mixture of water: acetonitrile 95:5% (v/v) containing 0.1% formic acid (Solvent A),
and 100% acetonitrile containing 0.1% formic acid (Solvent B). Multiple reaction
monitoring was carried out in positive electro-spray ionization mode using m/z 513.35
→ 209.30 for PF-5190457 and m/z 518.47 → 214.43 for the internal standard. The
recovery ranged from 102-118% with CV less than 6% for all matrices. The
calibration curves for all matrices were linear over the studied concentration range
(R2 ≥ 0.998, n = 3). Lower limit of quantification was 1 ng/mL in rat or human plasma
and 0.75 ng/g in rat brain. Intra- and inter-run mean percent accuracy were between
85–115% and percent imprecision was ≤ 15%. The assays were successfully utilized
to measure the concentration of PF-5190457 in pre-clinical and clinical pharmacology
studies of the compound.
171
Introduction
Ghrelin is a 28-amino acid peptide primarily produced by the endocrine X/A-like cells
of the fundus mucosa of the stomach and acts as an endogenous ligand for the growth
hormone secretagogue receptor (GHS-R1a). GHS-R1a is a G-protein coupled receptor
that induces growth hormone (GH) release from the pituitary [1]. Ghrelin activates
hypothalamic orexigenic neurons and inhibits anorectic neurons to induce hunger
[2,3]. In humans, intravenous (IV) acetylated ghrelin administration increases appetite
and food intake [4,5]. Moreover, ghrelin infusion can suppress glucose-dependent
insulin secretion in rodents and humans resulting in insulin resistance [2,6].
Therefore, it is conceivable to believe that pharmacological modulation of ghrelin may
be beneficial in regulating appetite and body weight or in treating type 2 diabetes
mellitus.
Consistent with converging evidence illustrating that alcohol and food-seeking
behaviors share common neural pathways [7,8], ghrelin signaling has been proposed
as a potential novel pharmacological target for the treatment of alcoholism [9]. In
mice, central ghrelin administration to reward nodes of the brain increased alcohol
intake while central or peripheral administration of ghrelin receptor antagonists
suppressed alcohol intake [10]. Furthermore, clinical studies from our team have
shown that plasma concentrations of ghrelin were different in abstinent compared to
active drinking alcohol-dependent individuals and correlated with alcohol craving
[11]. Additionally, in a human laboratory setting, intravenous administration of 3
µg/kg ghrelin to alcohol-dependent, heavy-drinking individuals resulted in a
significant acute increase in cue-induced alcohol craving [12]. Furthermore, there was
172
a positive significant correlation between post-infusion blood ghrelin levels and
increased alcohol craving [12].
Generally, it appears that GHS-1Ra antagonism can possibly increase satiety and does
not only result in weight loss and improvement in glycemic control but it may also be
helpful for treating alcoholism. PF-5190457 is a sensitive and specific ghrelin receptor
inverse agonist that is orally bioavailable [13]. It is a member of a spiro-azetidino-
piperidine series that was identified through high-throughput screening by Pfizer
Pharmaceuticals. PF-5190457 (Mw=512), has a measured logD value of 1.5 at pH 7.4
and a topological polar surface area of 95. Pharmacokinetics studies in rats have
shown a high volume of distribution and clearance and an almost 100% fraction
absorption in portal vein cannulated rats [10]. Here, we report the development and
validation of a sensitive, specific and robust assay for measurements of PF-5190457 in
either human or rat plasma or in rat brain homogenate using an ultra-performance
liquid chromatography tandem mass spectrometry (UPLC-MS/MS) technique.
Chemicals and reagents
PF-5190457 and the internal standard (IS) PF-06340740 (stable labeled isotope) were
kindly donated by Pfizer. OptimaTM LC/MS grade of acetonitrile, ammonium acetate,
formic acid, and methanol were obtained from Fisher Scientific (Fair Lawn, NJ,
USA). Deionized water was obtained using a Milli-Q Synthesis system fitted with a
Q-Gard 2 Purification Pack (Millipore, Bedford, MA, USA). Drug-free K2EDTA rat
plasma or brain specimens were from Wistar rats (n=6) aged between 2 to 4 months
and weighing between 300-500 grams (Bioreclamation IVT Inc., Westbury, NY,
USA). Similarly, K2EDTA human plasma from 6 subjects (3 male, 3 female) were
173
obtained from Bioreclamation IVT Inc.
Instruments
Eppendorf 5810 refrigerated centrifuge from Micro and Nanotechnology (Urbana, IL,
USA) was used to obtain supernatants. Acquity UPLC from Waters Corp (Milford,
MA, USA) connected to Xevo TQ MS mass spectrometry (Waters Corp) was used to
quantify PF-5190457 concentrations. Acquity UPLC system had a binary pump and
was equipped with a built-in column heater. A 20µL sample loop was used to deliver
samples in partial loop injection mode. The system was controlled with MassLynx™
software (V 4.1) and data was processed using TargetLynx™ tool.
Chromatographic conditions
Chromatographic separation was carried out in an Acquity UPLC BEH C18 (2.1 mm
X 50 mm) with 1.7 µm particle size and 130Å pore size analytical column (Waters
Corp, Milford, MA). An Acquity UPLC BEH C18 pre-column was used to preserve
the performance of the analytical column. The column was maintained at 55 °C and
an auto-sampler temperature was kept at 20°C. A gradient elution method was utilized
with a mobile phase consisting of water: acetonitrile 95:5% (v/v) containing 0.1%
formic acid (Solvent A), and 100% acetonitrile containing 0.1% formic acid (Solvent
B). The mobile phase was delivered at 0.5 mL /min flow rate. Each chromatographic
cycle started and maintained at 2% solvent (B) for 0.3 min and increased gradually to
98% over 0.7 min and maintained at this level until 1.8 min. To re-equilibrate the
column for the next run, the proportion of solvent (B) was decreased within 0.1 min to
2% and kept constant until the end of the run at 2.2 min. To minimize detector
contamination, a diversion valve was set to deliver the first 0.60 min and from 1.10
174
min until the end of each run to waste. The elution time for both analyte and IS was
0.83 min.
Mass spectrometry conditions
Multiple reaction monitoring (MRM) in positive electro-spray ionization (ESI) mode
was used for detection and quantification of analytes and IS. The MS scan of infused
PF-5190457 detected protonated molecules [M+H]+ (m/z= 513.61) with highest
intensity, followed by sodium adduct (m/z= 535.61) [M+NA]+ as seen in Figure 1.
Therefore, the protonated form was selected. Protonated precursors were fragmented
into two compounds of similar intensity with m/z values of 127.21, and 209.30; a third
compound (m/z =335.35) was fragmentized with 50% intensity compared to the first
two fragments (Figure 2). The two fragments with the highest m/z values were
selected. MRM transitions were monitored (m/z, Q1> Q3); m/z, 513.35 > 209.30
transition was used for quantification while m/z, 513.35 > 335.35 transition was used
as backup. M/z, 518.47 > 214.43 transition was selected for the internal standard. The
proposed fragment formation of PF-5190457 is illustrated in Figure 3. All chemical
structures were produced using ChemDraw version 14.0.0.117 from PerkinElmer Inc
(Waltham, Massachusetts, USA). A gradient elution method was utilized with a
mobile phase consisting of water: acetonitrile 95:5% (v/v) containing 0.1% formic
acid (Solvent A), and 100% acetonitrile containing 0.1% formic acid (Solvent B).
After automatically obtaining initial mass spectrometry parameters with IntelliStart
tool, manual tuning of final parameters were performed to achieve the highest possible
signal. Final mass spectrometry parameters were: capillary voltage = 0.30 kV,
extractor voltage = 3 V source temperature = 150°C, desolvation temperature =650°C,
175
desolvation gas flow = 400 L/hr, and collision gas flow 0.15 mL/min. Cone voltages
and collision energy were 32 and 38 for analytes with m/z, 513.35 →> 209.30
transition and 32 and 18 for analytes with m/z, 513.35 >→ 335.35 transition,
respectively; and 38, and 44 for the internal standard.
Preparation of standards, quality controls, and IS solutions
Sub-stock and working stock solutions of PF-5190457 and IS were prepared using
50% acetonitrile (ACN) and were stored at 4 °C. Standards and quality controls
(QCs) samples were prepared by spiking rat or human plasma or rat brain homogenate
to achieve desired PF-5190457 concentrations while keeping the organic solvent ≤ 5%
of total volume. Standard concentrations of PF-5190457 in rat brain homogenates
before extraction were: 0.15, 0.30, 0.68, 2.40, 4.80, 9.60, 19.20, and 24.00 µg/L; QCs
concentrations were 0.45, 3.00, and 18.00 µg/L for LQC, MQC, and HQC,
respectively. The final standard and QCs concentrations in brain samples are shown
in Tables 1 and 2.
Plasma standard concentrations before extraction were 1, 2, 10, 100, 250, 500, 800 and
1000 µg/L; QCs concentrations were 3, 200, 750 µg/L for LQC, MQC, and HQC,
respectively. Working internal standard solutions (WIS) composed of 0.1% formic
acid in ACN at concentrations of 5 and 10µg/L were used as precipitating solvents for
brain and plasma samples, respectively. The final standard and QCs concentrations in
plasma samples are shown in Tables 1 and 2.
Protein precipitation and sample extraction
A. Rat brain samples
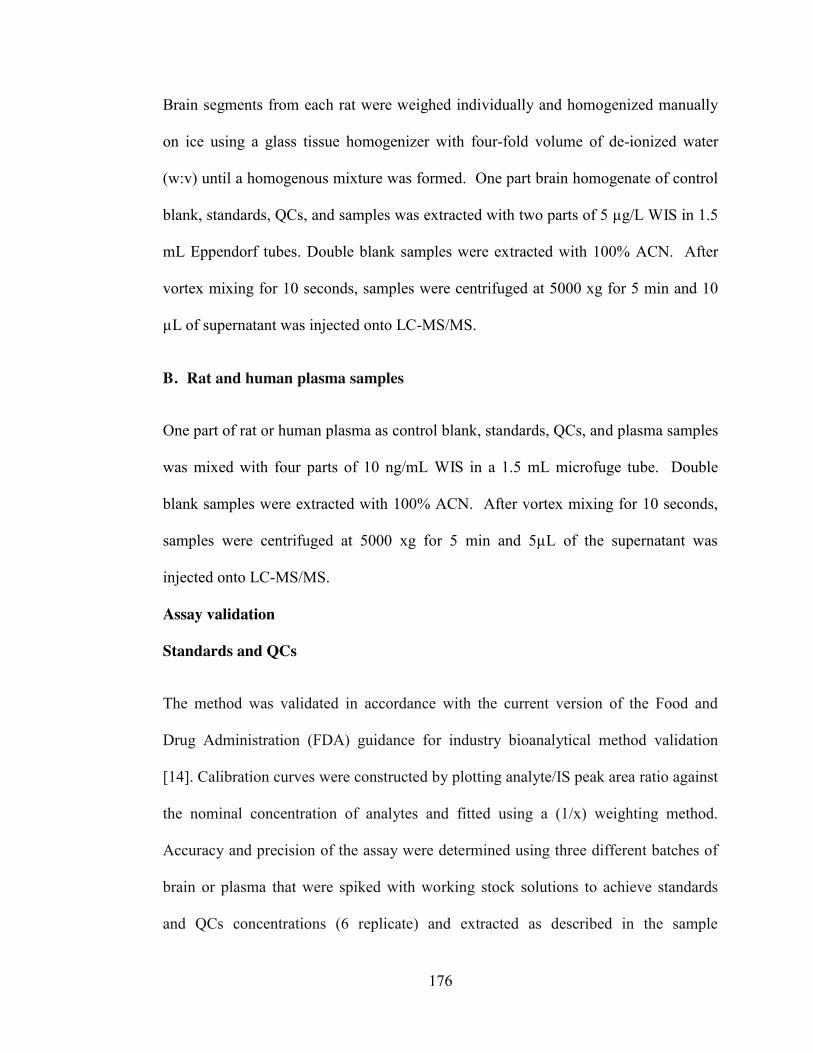
176
Brain segments from each rat were weighed individually and homogenized manually
on ice using a glass tissue homogenizer with four-fold volume of de-ionized water
(w:v) until a homogenous mixture was formed. One part brain homogenate of control
blank, standards, QCs, and samples was extracted with two parts of 5 µg/L WIS in 1.5
mL Eppendorf tubes. Double blank samples were extracted with 100% ACN. After
vortex mixing for 10 seconds, samples were centrifuged at 5000 xg for 5 min and 10
µL of supernatant was injected onto LC-MS/MS.
B. Rat and human plasma samples
One part of rat or human plasma as control blank, standards, QCs, and plasma samples
was mixed with four parts of 10 ng/mL WIS in a 1.5 mL microfuge tube. Double
blank samples were extracted with 100% ACN. After vortex mixing for 10 seconds,
samples were centrifuged at 5000 xg for 5 min and 5µL of the supernatant was
injected onto LC-MS/MS.
Assay validation
Standards and QCs
The method was validated in accordance with the current version of the Food and
Drug Administration (FDA) guidance for industry bioanalytical method validation
[14]. Calibration curves were constructed by plotting analyte/IS peak area ratio against
the nominal concentration of analytes and fitted using a (1/x) weighting method.
Accuracy and precision of the assay were determined using three different batches of
brain or plasma that were spiked with working stock solutions to achieve standards
and QCs concentrations (6 replicate) and extracted as described in the sample
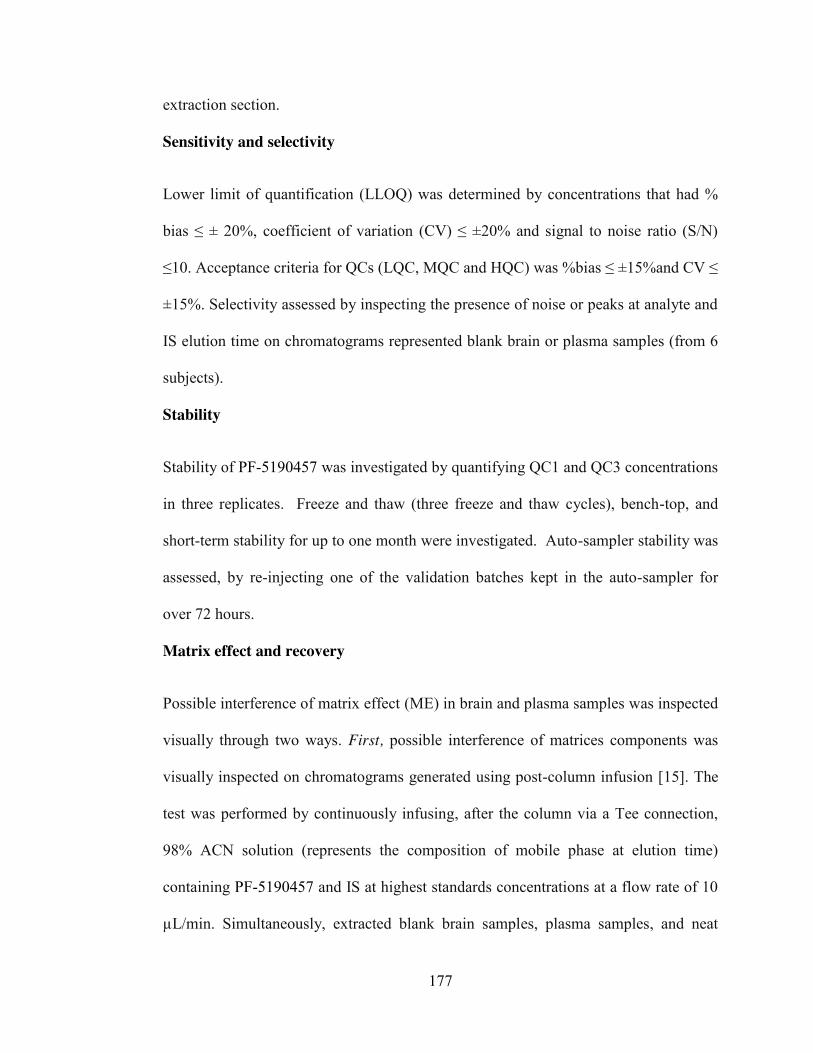
177
extraction section.
Sensitivity and selectivity
Lower limit of quantification (LLOQ) was determined by concentrations that had %
bias ≤ ± 20%, coefficient of variation (CV) ≤ ±20% and signal to noise ratio (S/N)
≤10. Acceptance criteria for QCs (LQC, MQC and HQC) was %bias ≤ ±15%and CV ≤
±15%. Selectivity assessed by inspecting the presence of noise or peaks at analyte and
IS elution time on chromatograms represented blank brain or plasma samples (from 6
subjects).
Stability
Stability of PF-5190457 was investigated by quantifying QC1 and QC3 concentrations
in three replicates. Freeze and thaw (three freeze and thaw cycles), bench-top, and
short-term stability for up to one month were investigated. Auto-sampler stability was
assessed, by re-injecting one of the validation batches kept in the auto-sampler for
over 72 hours.
Matrix effect and recovery
Possible interference of matrix effect (ME) in brain and plasma samples was inspected
visually through two ways. First, possible interference of matrices components was
visually inspected on chromatograms generated using post-column infusion [15]. The
test was performed by continuously infusing, after the column via a Tee connection,
98% ACN solution (represents the composition of mobile phase at elution time)
containing PF-5190457 and IS at highest standards concentrations at a flow rate of 10
µL/min. Simultaneously, extracted blank brain samples, plasma samples, and neat
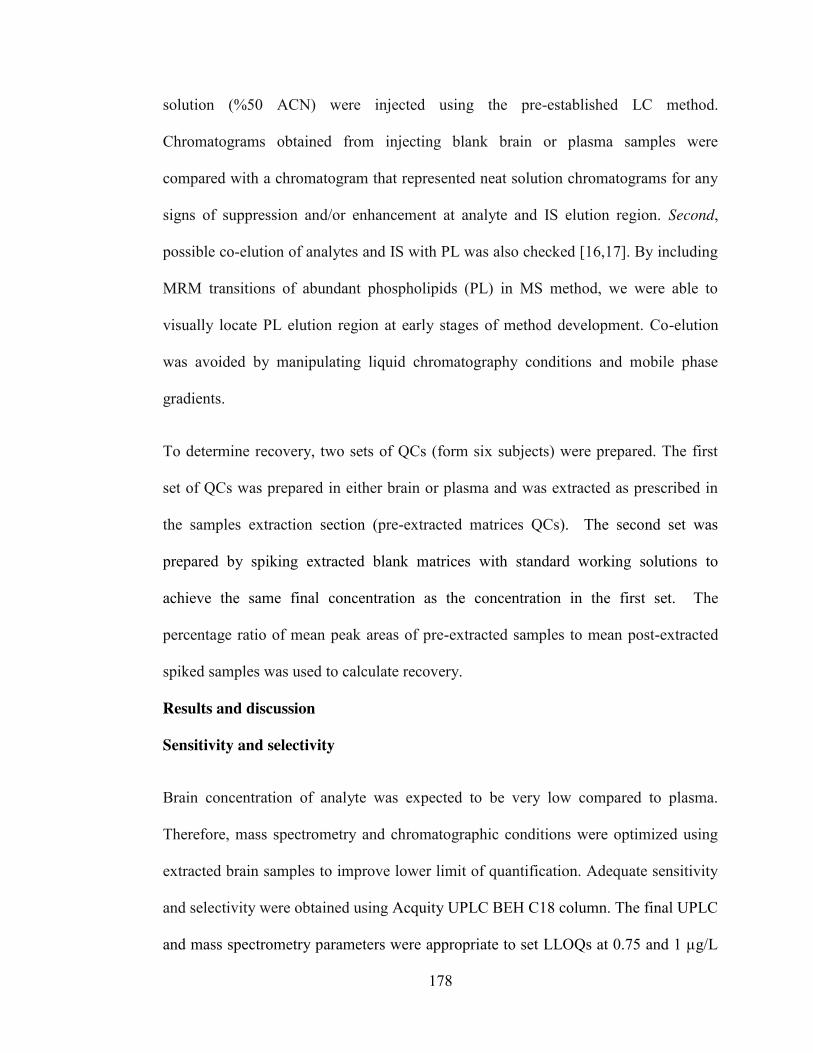
178
solution (%50 ACN) were injected using the pre-established LC method.
Chromatograms obtained from injecting blank brain or plasma samples were
compared with a chromatogram that represented neat solution chromatograms for any
signs of suppression and/or enhancement at analyte and IS elution region. Second,
possible co-elution of analytes and IS with PL was also checked [16,17]. By including
MRM transitions of abundant phospholipids (PL) in MS method, we were able to
visually locate PL elution region at early stages of method development. Co-elution
was avoided by manipulating liquid chromatography conditions and mobile phase
gradients.
To determine recovery, two sets of QCs (form six subjects) were prepared. The first
set of QCs was prepared in either brain or plasma and was extracted as prescribed in
the samples extraction section (pre-extracted matrices QCs). The second set was
prepared by spiking extracted blank matrices with standard working solutions to
achieve the same final concentration as the concentration in the first set. The
percentage ratio of mean peak areas of pre-extracted samples to mean post-extracted
spiked samples was used to calculate recovery.
Results and discussion
Sensitivity and selectivity
Brain concentration of analyte was expected to be very low compared to plasma.
Therefore, mass spectrometry and chromatographic conditions were optimized using
extracted brain samples to improve lower limit of quantification. Adequate sensitivity
and selectivity were obtained using Acquity UPLC BEH C18 column. The final UPLC
and mass spectrometry parameters were appropriate to set LLOQs at 0.75 and 1 µg/L

179
for brain and plasma, respectively (Figure 4). Chromatograms obtained from pooled
blank samples from six subjects and blank neat solutions (50% ACN) were visually
inspected and compared for any peaks or noises at elution regions. No sign of
interference was noticed. No carryover was detected when double blank samples were
injected following the highest calibration concentration.
Curve fitting of the standard curve was comprised of 1/x weighted least squares linear
regression. The average correlation coefficient (r2) of the three validation batches was
0.999. The inter-run % bias and coefficient of variation (CV) were in the
recommended limit of ±20 for LLOQ and ±15 for QCs (Table 2).
Stability
Bench top, freeze and thaw, auto-sampler, and short-term storage at –80 Co for up to
four weeks were studied (Table 3). No stability problems were noticed and analytes
were stable in extracted matrices for up to 72hrs.
Recovery and matrix effect
Samples processing and extraction procedures showed excellent recovery. The
recovery ranged from 102-118% with CV less than 6% for all matrices (Table 3).
Endogenous components in biological fluids may interfere and compete for ionization
with the analytes of interest [15]. The ME could be either ionization suppression or
enhancement, both of which can potentially compromise the integrity of the data [16].
A post-column infusion technique was utilized to examine possible interference of
components present in matrices of interest. Figure 5 shows a representative composite
of PF-5190457 and IS traces obtained from post-column infusion at a concentration of
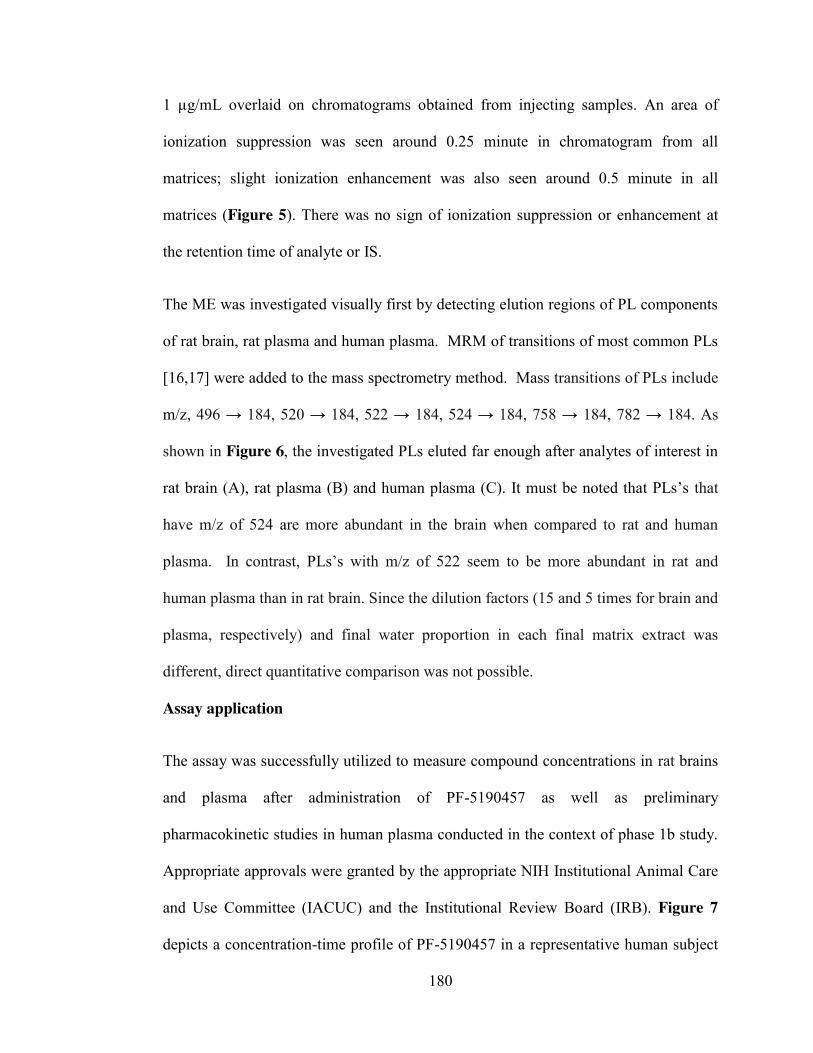
180
1 µg/mL overlaid on chromatograms obtained from injecting samples. An area of
ionization suppression was seen around 0.25 minute in chromatogram from all
matrices; slight ionization enhancement was also seen around 0.5 minute in all
matrices (Figure 5). There was no sign of ionization suppression or enhancement at
the retention time of analyte or IS.
The ME was investigated visually first by detecting elution regions of PL components
of rat brain, rat plasma and human plasma. MRM of transitions of most common PLs
[16,17] were added to the mass spectrometry method. Mass transitions of PLs include
m/z, 496 → 184, 520 → 184, 522 → 184, 524 → 184, 758 → 184, 782 → 184. As
shown in Figure 6, the investigated PLs eluted far enough after analytes of interest in
rat brain (A), rat plasma (B) and human plasma (C). It must be noted that PLs’s that
have m/z of 524 are more abundant in the brain when compared to rat and human
plasma. In contrast, PLs’s with m/z of 522 seem to be more abundant in rat and
human plasma than in rat brain. Since the dilution factors (15 and 5 times for brain and
plasma, respectively) and final water proportion in each final matrix extract was
different, direct quantitative comparison was not possible.
Assay application
The assay was successfully utilized to measure compound concentrations in rat brains
and plasma after administration of PF-5190457 as well as preliminary
pharmacokinetic studies in human plasma conducted in the context of phase 1b study.
Appropriate approvals were granted by the appropriate NIH Institutional Animal Care
and Use Committee (IACUC) and the Institutional Review Board (IRB). Figure 7
depicts a concentration-time profile of PF-5190457 in a representative human subject
181
at steady-state after administration of 50 and 100 mg oral dose of PF-5190457.
Conclusion
This is the first reported analytical method for quantification of PF-5190457 in rat
brain, rat plasma and human plasma. This LC-MS/MS method was developed and
validated in accordance with the current FDA guideline and showed high sensitivity,
selectivity and robustness. Simple extraction processes with excellent recovery and
sufficient sample cleanness was used. The method allowed us to examine the presence
and describe relative components and elution behaviors of the investigated PLs
species. The assays were successfully applied for quantification of PF-5190457 in
both pre-clinical and clinical studies.
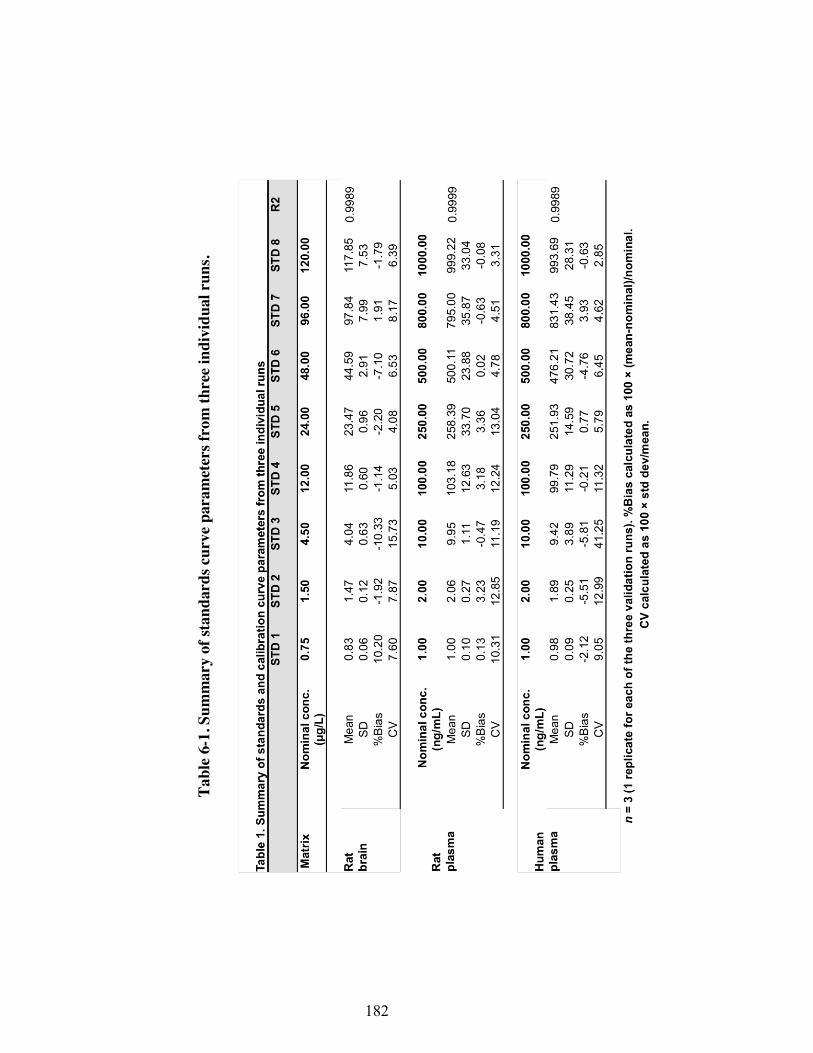
182
Tabl
e 6-
1. S
umm
ary
of st
anda
rds c
urve
par
amet
ers f
rom
thre
e ind
ivid
ual r
uns.
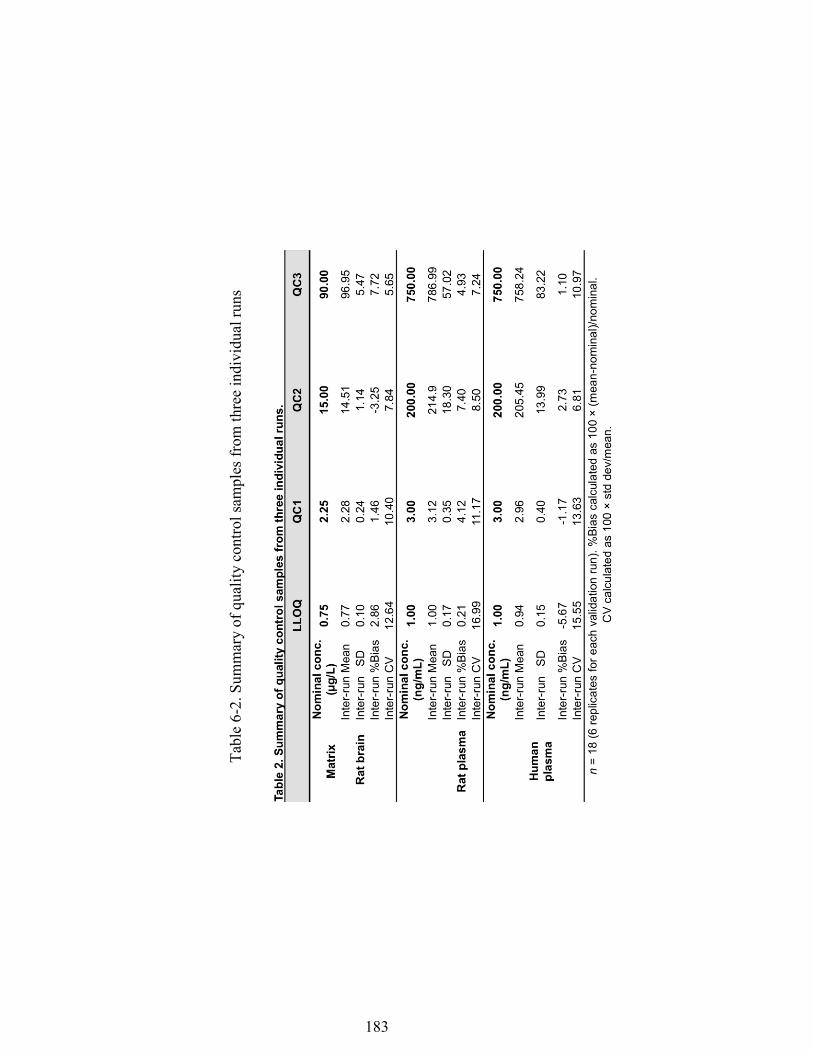
183
Tabl
e 6-
2. S
umm
ary
of q
ualit
y co
ntro
l sam
ples
from
thre
e in
divi
dual
runs

184
Tabl
e 6-
3. R
esul
ts o
f sta
bilit
y st
udie
s
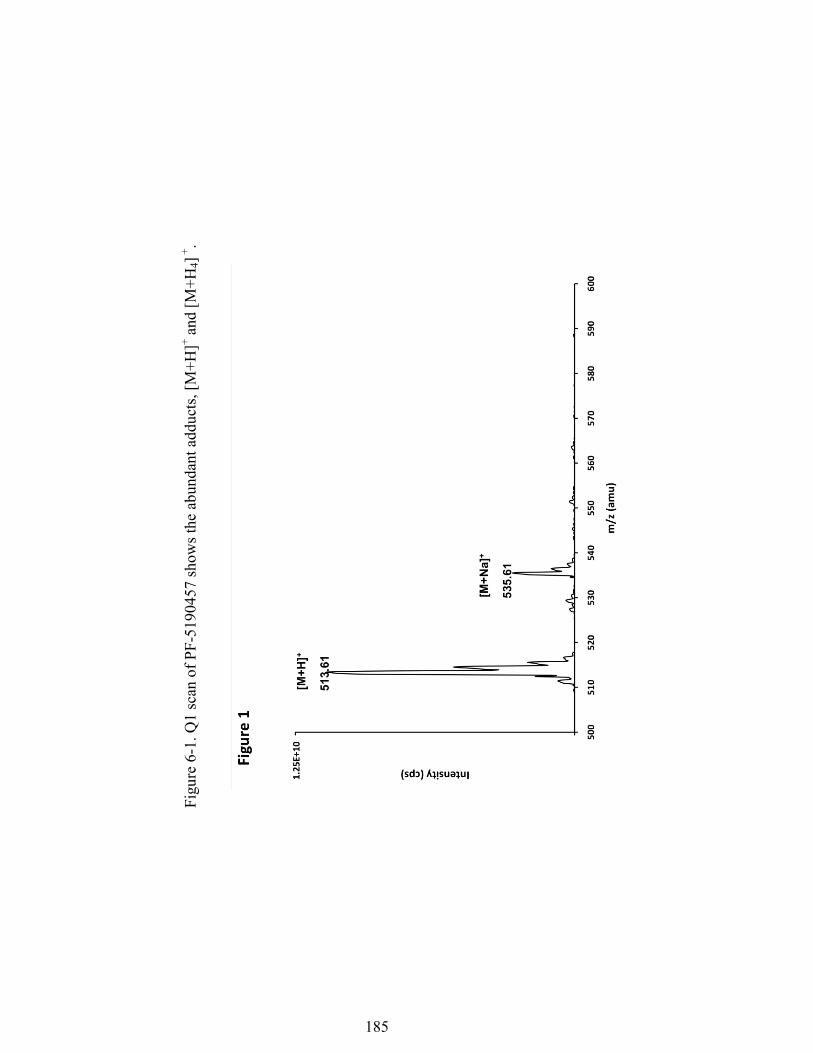
185
Fi
gure
6-1
. Q1
scan
of P
F-51
9045
7 sh
ows t
he a
bund
ant a
dduc
ts, [
M+H
]+ and
[M+H
4] +
.
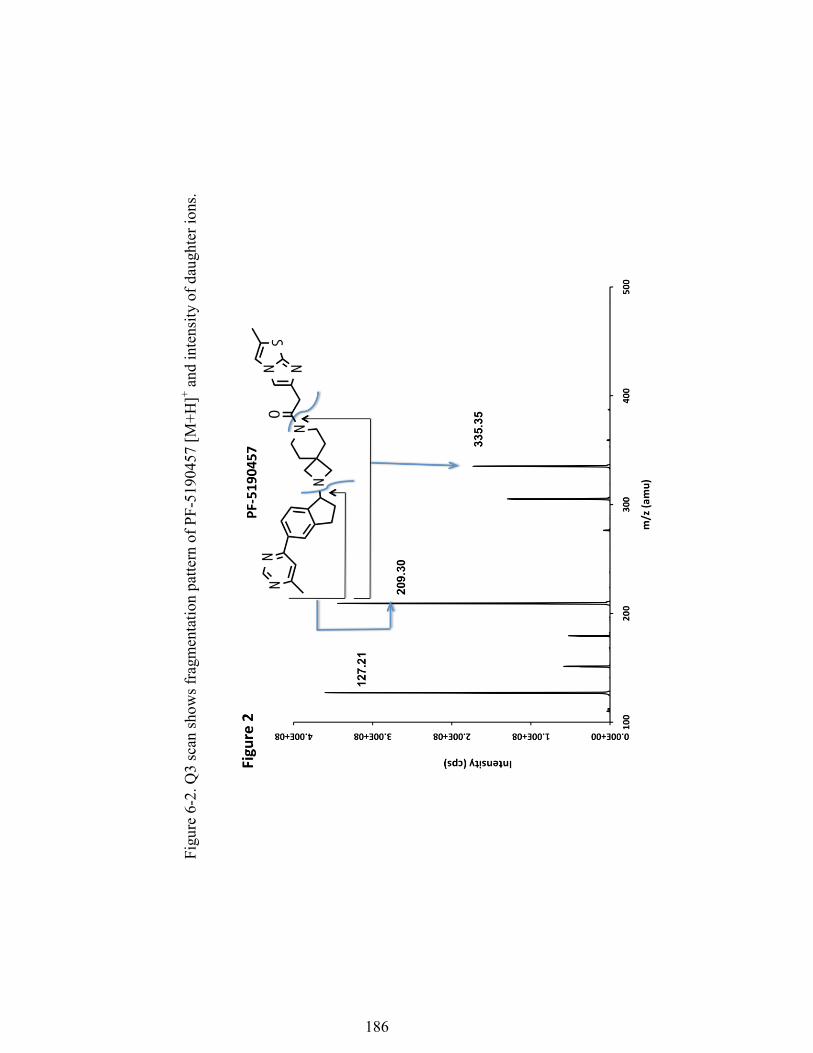
186
Fi
gure
6-2
. Q3
scan
show
s fra
gmen
tatio
n pa
ttern
of P
F-51
9045
7 [M
+H]+ a
nd in
tens
ity o
f dau
ghte
r ion
s.
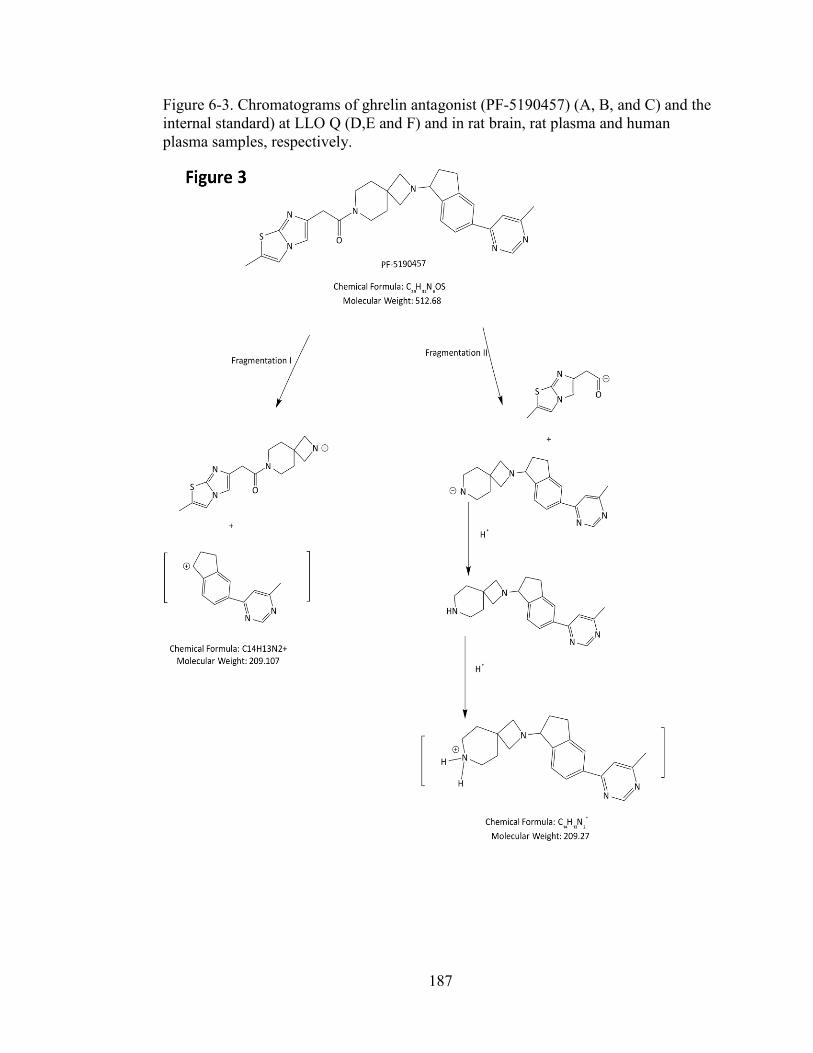
187
Figure 6-3. Chromatograms of ghrelin antagonist (PF-5190457) (A, B, and C) and the internal standard) at LLO Q (D,E and F) and in rat brain, rat plasma and human plasma samples, respectively.
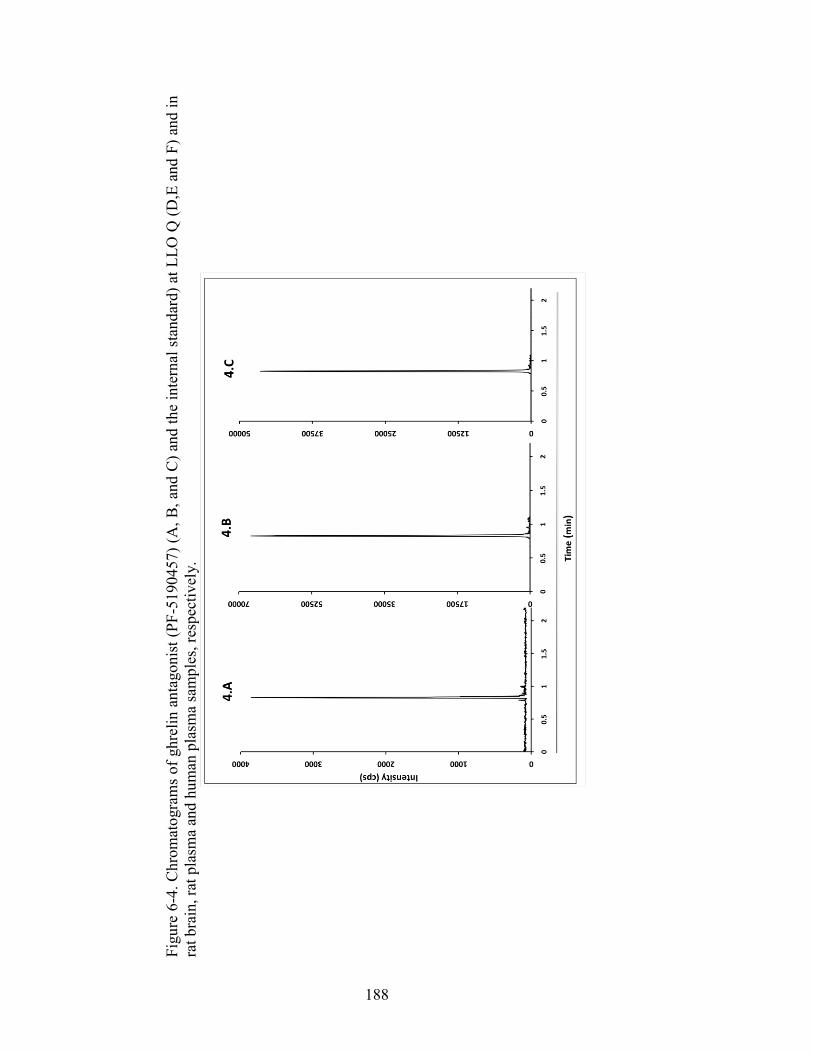
188
Figu
re 6
-4. C
hrom
atog
ram
s of
ghr
elin
ant
agon
ist (
PF-5
1904
57) (
A, B
, and
C) a
nd th
e in
tern
al s
tand
ard)
at L
LO Q
(D,E
and
F) a
nd in
ra
t bra
in, r
at p
lasm
a an
d hu
man
pla
sma
sam
ples
, res
pect
ivel
y.
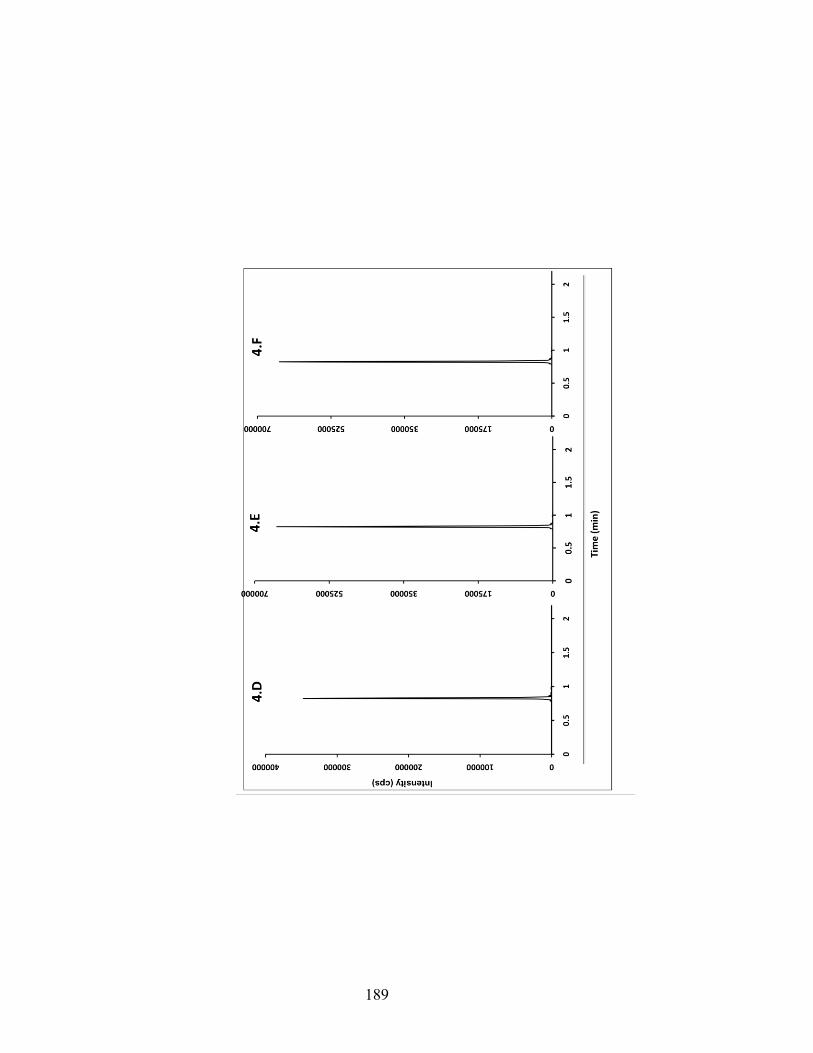
189
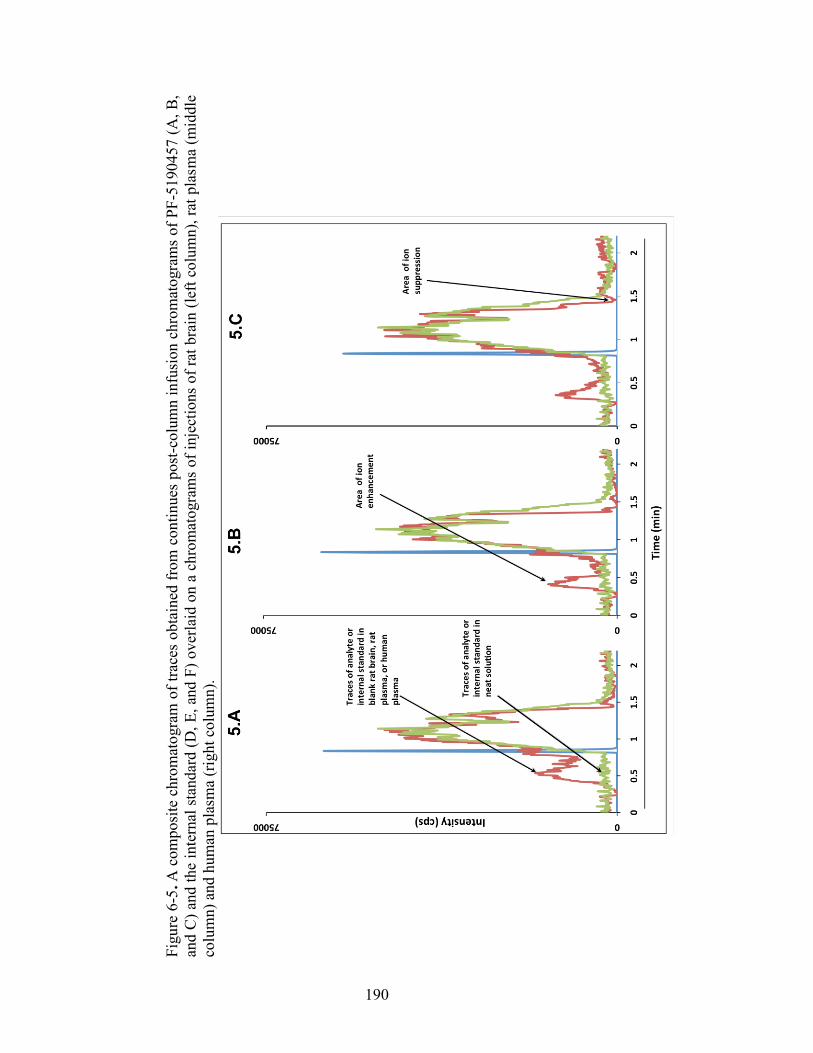
190
Figu
re 6
-5. A
com
posi
te c
hrom
atog
ram
of t
race
s ob
tain
ed fr
om c
ontin
ues
post
-col
umn
infu
sion
chr
omat
ogra
ms
of P
F-51
9045
7 (A
, B,
and
C) a
nd th
e in
tern
al s
tand
ard
(D, E
, and
F) o
verla
id o
n a
chro
mat
ogra
ms
of in
ject
ions
of r
at b
rain
(lef
t col
umn)
, rat
pla
sma
(mid
dle
colu
mn)
and
hum
an p
lasm
a (r
ight
col
umn)
.
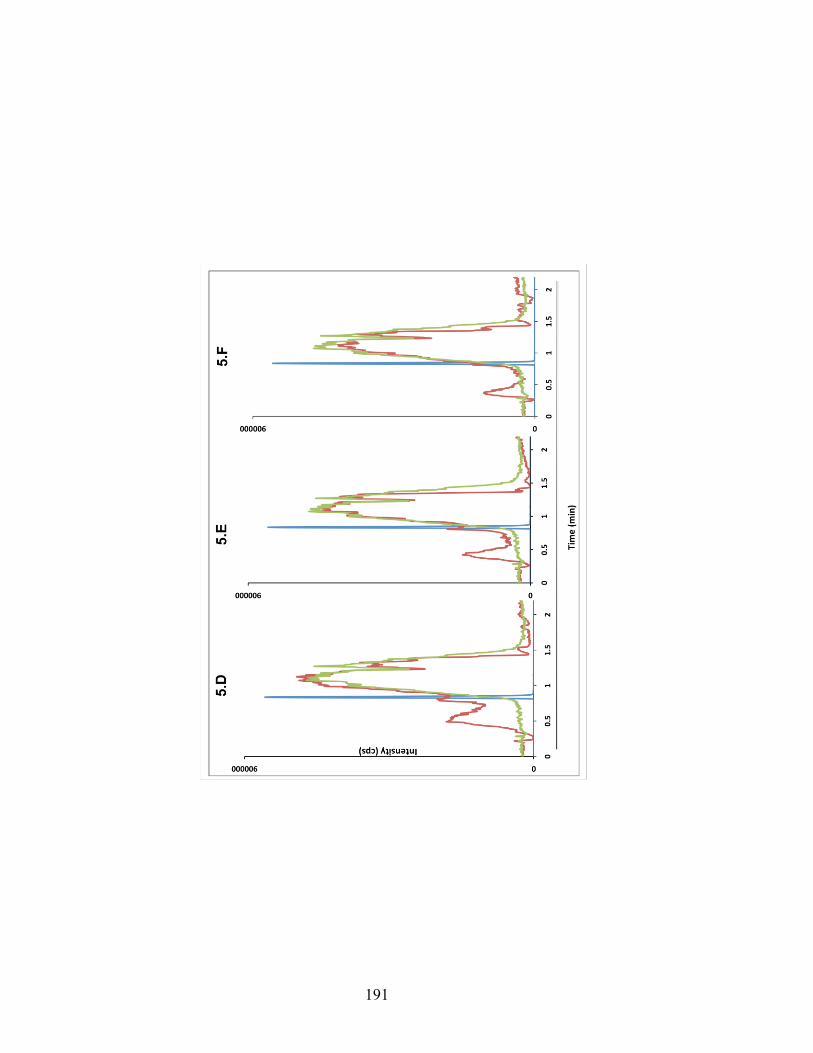
191
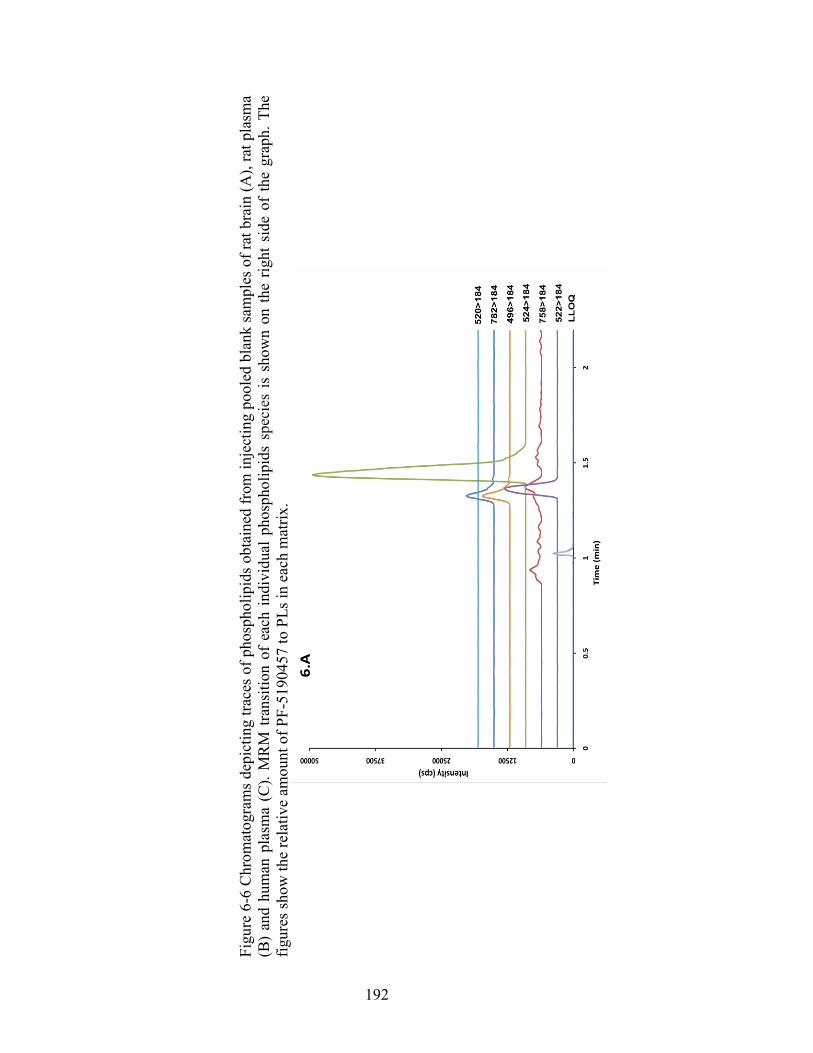
192
Figu
re 6
-6 C
hrom
atog
ram
s dep
ictin
g tra
ces o
f pho
spho
lipid
s obt
aine
d fr
om in
ject
ing
pool
ed b
lank
sam
ples
of r
at b
rain
(A),
rat p
lasm
a (B
) an
d hu
man
pla
sma
(C).
MR
M tr
ansi
tion
of e
ach
indi
vidu
al p
hosp
holip
ids
spec
ies
is s
how
n on
the
right
sid
e of
the
grap
h. T
he
figur
es sh
ow th
e re
lativ
e am
ount
of P
F-51
9045
7 to
PLs
in e
ach
mat
rix.
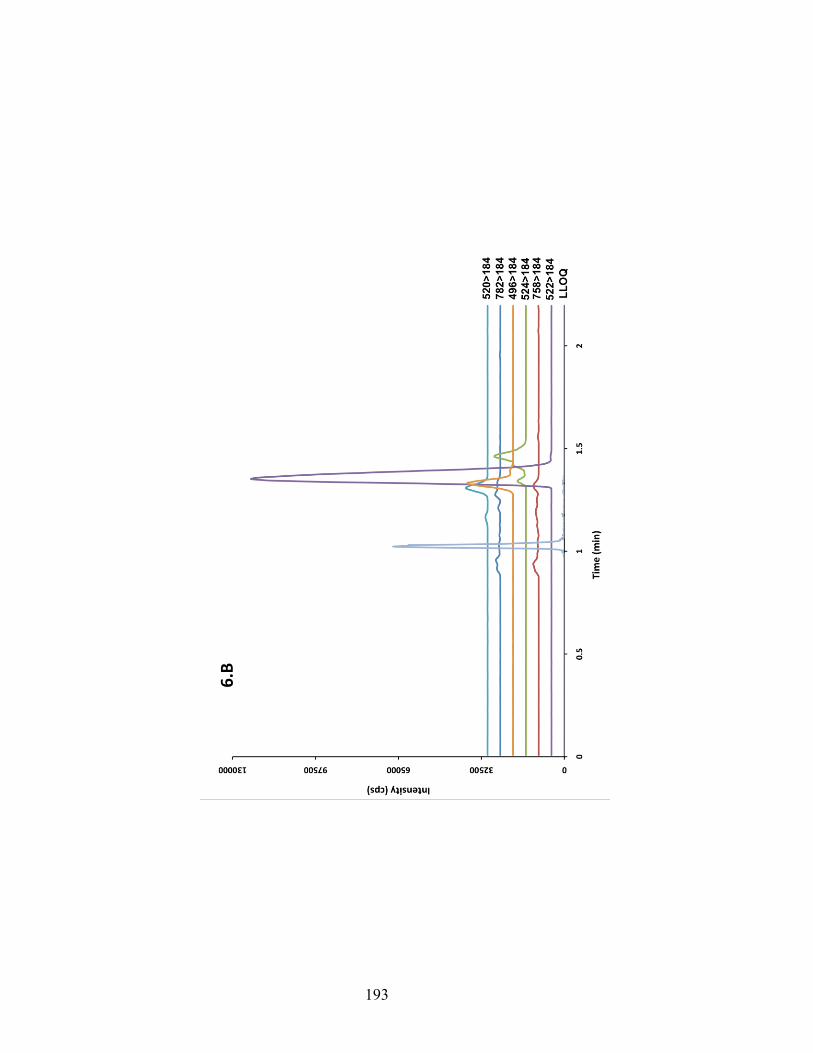
193
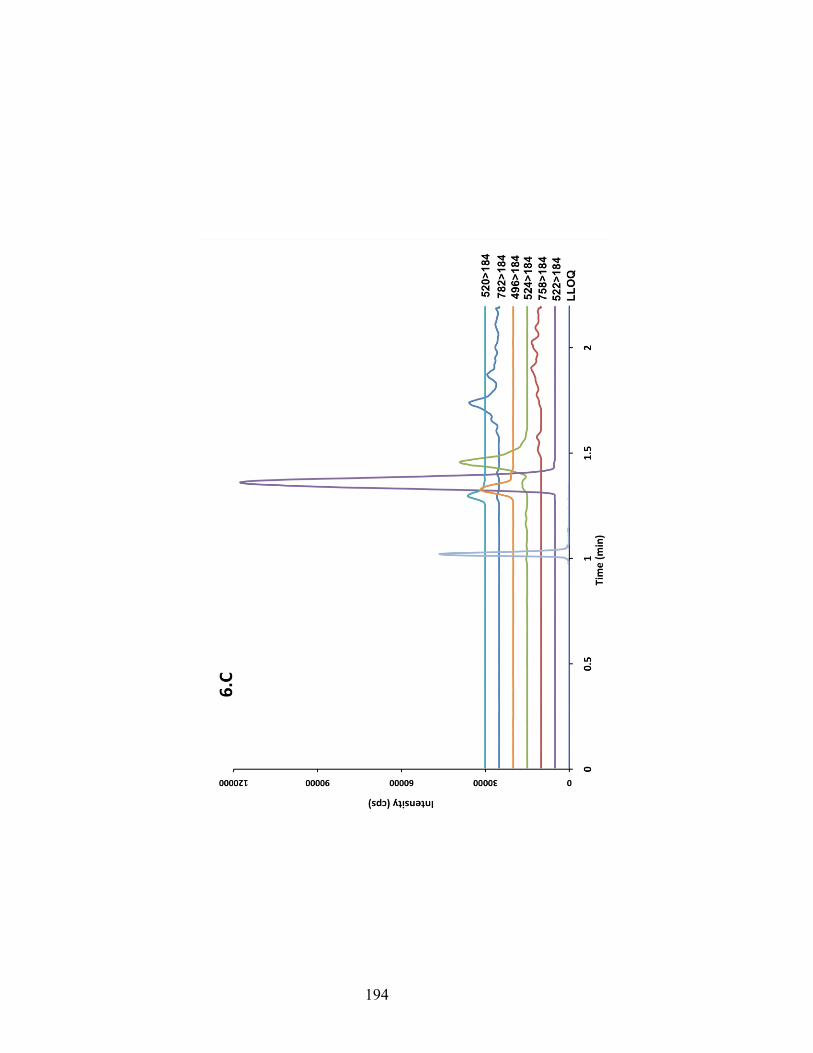
194

195
Figu
re 6
-7 C
once
ntra
tion-
time
prof
iles
of P
F-51
9045
7 in
a re
pres
enta
tive
stud
y vo
lunt
eer a
fter i
nges
tion
of 5
0 an
d 10
0 m
g do
ses
of
PF-5
1904
57 b
y or
al ro
ute.
196
References
1. Kojima M, Hosoda H, Date Y, Nakazato M, Matsuo H, Kangawa K. Ghrelin is a growth-hormone-releasing acylated peptide from stomach. Nature, 402(6762), 656-660 (1999).
2. Tong J, Prigeon RL, Davis HW et al. Ghrelin suppresses glucose-stimulated
insulin secretion and deteriorates glucose tolerance in healthy humans. Diabetes, 59(9), 2145-2151 (2010).
3. Solomon A, De Fanti BA, Martinez JA. Peripheral ghrelin participates in
glucostatic feeding mechanisms and in the anorexigenic signalling mediated by CART and CRF neurons. Nutritional neuroscience, 8(5-6), 287-295 (2005).
4. Druce MR, Wren AM, Park AJ et al. Ghrelin increases food intake in obese as
well as lean subjects. International journal of obesity, 29(9), 1130-1136 (2005).
5. Neary NM, Small CJ, Wren AM et al. Ghrelin increases energy intake in
cancer patients with impaired appetite: acute, randomized, placebo-controlled trial. The Journal of clinical endocrinology and metabolism, 89(6), 2832-2836 (2004).
6. Kirchner H, Tong J, Tschop MH, Pfluger PT. Ghrelin and PYY in the
regulation of energy balance and metabolism: lessons from mouse mutants. American journal of physiology. Endocrinology and metabolism, 298(5), E909-919 (2010).
7. Volkow ND, Wang GJ, Tomasi D, Baler RD. The addictive dimensionality of
obesity. Biological psychiatry, 73(9), 811-818 (2013). 8. Leggio L, Addolorato G, Cippitelli A, Jerlhag E, Kampov-Polevoy AB, Swift
RM. Role of feeding-related pathways in alcohol dependence: A focus on sweet preference, NPY, and ghrelin. Alcoholism, clinical and experimental research, 35(2), 194-202 (2011).
9. Leggio L. Role of the ghrelin system in alcoholism: Acting on the growth
hormone secretagogue receptor to treat alcohol-related diseases. Drug news & perspectives, 23(3), 157-166 (2010).
10. Jerlhag E, Egecioglu E, Landgren S et al. Requirement of central ghrelin
signaling for alcohol reward. Proceedings of the National Academy of Sciences of the United States of America, 106(27), 11318-11323 (2009).
197
11. Leggio L, Ferrulli A, Cardone S et al. Ghrelin system in alcohol-dependent subjects: role of plasma ghrelin levels in alcohol drinking and craving. Addiction biology, 17(2), 452-464 (2012).
12. Leggio L, Zywiak WH, Fricchione SR et al. Intravenous Ghrelin
Administration Increases Alcohol Craving in Alcohol-Dependent Heavy Drinkers: A Preliminary Investigation. Biological psychiatry, 76(9), 734-741 (2014).
13. Bhattacharya SK, Andrews K, Beveridge R et al. Discovery of PF-5190457, a
Potent, Selective, and Orally Bioavailable Ghrelin Receptor Inverse Agonist Clinical Candidate. ACS medicinal chemistry letters, 5(5), 474-479 (2014).
14. US Department of Health and Human Services. Food and Drug
Administration (FDA). Center for Drug Evaluation and Research (CDER). Guidance for Industry. Bioanalytical Method Validation (2001).
15. Dams R, Huestis MA, Lambert WE, Murphy CM. Matrix effect in bio-analysis
of illicit drugs with LC-MS/MS: influence of ionization type, sample preparation, and biofluid. J. Am. Soc. Mass Spectrom., 14(11), 1290-1294 (2003).
16. Chambers E, Wagrowski-Diehl DM, Lu Z, Mazzeo JR. Systematic and
comprehensive strategy for reducing matrix effects in LC/MS/MS analyses. Journal of chromatography. B, Analytical technologies in the biomedical and life sciences, 852(1-2), 22-34 (2007).
17. Zhang G, Wujcik CE. Overcoming ionization effects through chromatography:
a case study for the ESI-LC-MS/MS quantitation of a hydrophobic therapeutic agent in human serum using a stable-label internal standard. Journal of chromatography. B, Analytical technologies in the biomedical and life sciences, 877(22), 2003-2010 (2009).