Theory and Practice of Crisis in Political … AND PRACTICE OF CRISIS IN POLITICAL ECONOMY. THE CASE...
33
Juan Pablo Mateo Theory and Practice of Crisis in Political Economy: the Case of the Great Recession in Spain April 2017 Working Paper 15/2017 Department of Economics The New School for Social Research The views expressed herein are those of the author(s) and do not necessarily reflect the views of the New School for Social Research. © 2017 by Juan Pablo Mateo. All rights reserved. Short sections of text may be quoted without explicit permission provided that full credit is given to the source.
Transcript of Theory and Practice of Crisis in Political … AND PRACTICE OF CRISIS IN POLITICAL ECONOMY. THE CASE...
Juan Pablo Mateo
Theory and Practice of Crisis in Political Economy: the Case of the Great Recession in Spain
April 2017 Working Paper 15/2017 Department of Economics The New School for Social Research
The views expressed herein are those of the author(s) and do not necessarily reflect the views of the New School for Social Research. © 2017 by Juan Pablo Mateo. All rights reserved. Short sections of text may be quoted without explicit permission provided that full credit is given to the source.

THEORY AND PRACTICE OF CRISIS IN POLITICAL ECONOMY. THE CASE OF
THE GREAT RECESSION IN SPAIN
Juan Pablo Mateo1
Abstract
This paper addresses the Marx´s theory of crisis in order to analyze the Great Recession in Spain,
a peripheral economy within the Eurozone. It is shown the underlying problem in the capacity to
generate surplus value behind the housing bubble, which in turn explain some particularities
related to the capital composition and productivity, as well as wages and finance. The document
also carries out a critic of both orthodox and heterodox approaches that focus i) on a profit
squeeze caused by labor market rigidities, ii) underconsumption because of stagnant wages, as
well as iii), finances: interest rates and indebtedness.
Key words: theory of crisis, profit rate, Spain, housing bubble, interest rates, wages
JEL classification: B14, E11, E20, E43, J30
1 Visiting scholar, department of Economics, The New School, New York, NY 10011, and professor at the University of Valladolid (Spain): [email protected].
1. Introduction
This article addresses the economic crisis in Spain from a political economy approach based on
the labor theory of value (LTV), with a double objective: i) theoretically, highlighting the
relevance of Marx´s theory of crisis and his analytical method for the analysis of the post-2008
long depression in Spain; ii) empirically, explaining the crisis from a global process of
valorization perspective. This, in turn, allows for the logical ordering of the role of profitability,
capital composition, and productivity, together with finance and income distribution, all of them
relevant aspects of the process of reproduction and crisis.2
The hypothesis is that the crisis is explained by the capacity to generate a surplus, the
specifically capitalist form of the concept of production. Throughout the process of
accumulation, there is an increased pressure on profitability, which endogenously arises from the
very contradictions of the capitalist mode of production (CMP). However, analyzing the crisis in
a national space of valorization requires theoretically addressing some elements that explain how
a general trend at the level of the world system manifests itself in a country. Thus, reference has
to be made to both the particularities of the integration of the Spanish economy into the
Eurozone as well as the historical context.
This approach, however, is a minority even in the field of political economy. A great part of
studies of the Great Recession suggests that this crisis does not fit into the foundations of Marx's
theory (see Roberts 2010, Potts 2011, Carchedi 2011, Mateo 2015). Moreover, in the case of
Spain, the role of capital valorization is not even mentioned. It is important, therefore, to
establish a critical dialogue with other approaches, although it is not without difficulties. One of
the disadvantages found in much of the literature lies in the absence of a logical ordering of the
different role that categories play in the emergence of the crisis. In many cases, the authors list
various conjunctural imbalances, but a consistent logic allowing to differentiate causes from
consequences, together with their different explanatory status, is not always explicit.
The article is made up of three parts. In the first one, I discuss theoretical aspects with the
purpose of integrating the abstract theory of the crisis with the particularities of the Spanish
2 The crisis outbreaks in the second half of 2008, following a long period of growth since 1995, averaging 3.78% per year until 2007 (NSO 2016a).

economy, therefore establishing the general framework for the empirical analysis. Subsequently,
the second section deals with the generation of surplus in Spain, addressing both profitability and
the composition of capital. The third part essentially discusses the role of income distribution and
finance in relation to other conceptions of the crisis.
2. The theory of crisis
Methodological aspects
Even though a complete and detailed account of the crisis is not to be found in Marx, it does not
imply the absence of a Marxist theory of the economic crisis. It happens that his analysis is
carried out from a high degree of abstraction. Marx explains the tendency towards the crisis by
avoiding the fluctuations of market prices unsupported by changes in values because he precisely
wants to show that crises are inherent to the CMP. Thus, crises occur even if goods are sold at
their corresponding labor-values, meaning that the source of the crisis must be located in changes
in value relations, that is, in production. When crises are triggered by changes in prices that do
not coincide with changes in value, it is therefore not investigated in the context of the analysis
of capital in general (Marx, MECW 32, Clarke 1994).
Marx’s references to the crisis appear as a complement to his broader conception of the process
of economic reproduction. In other words, his theory of crisis belongs to the general theory of the
dynamics of the CMP (Clarke 1994). If, on the one hand, it implies that it is not complete, on the
other it reveals the central place of the crisis in Marx´s analysis of capitalism. It follows that the
characterization of the different crises must take into account the set of methodological aspects
characterizing this thought: abstract character, with a holistic and structural perspective
constructed from identifying an essence, which imposes the logic of reproduction over time.3
Thus, analytical priority is given to the production process, understood as generation of surplus
value (sv) (MECW 29), which incorporates the whole valorization cycle M − C ... P ... C' − M'.
From this view, the relevance of the law of value is justified because production, content
common to all societies, assumes the form of capital valorization in the CMP.4 The totality, the
3 For a more detailed discussion, I refer to the introduction (pp. xxi- xlvii) of Mateo (2007). 4 To the extent that labor value constitutes the regulating principle of the capitalist economy, the LTV is a general theory of the working and dynamics of the CMP. Therefore, the concept of value is indispensable to explain the crisis (Freeman 1999).
capitalist society at the global level, is not a mere aggregation of elements, but a structured unit
or a historically specific totality.5 In turn, it has a certain logic, since its reproduction is not
arbitrary, but rather responds to certain objective laws (tendencies). The constituent elements of
the capitalist system and the cycle of reproduction of capital (see interest, wages, etc.) can only
be grasped from the place they occupy within the whole process of valorization, as it has
explanatory priority.
Capitalist reproduction is subject to deep turbulences, imbalances, volatility, and accumulation
implies the periodical recurrence of crises (Shaikh, 2016). The specific aspect of the Marxist
conception of the crisis, then, is that it constitutes a necessary moment of the process of
accumulation, whose necessity is derived from both its indispensability and functionality for the
systemic economic reproduction (Gill 1996). Though “the history of capitalism is also a history
of proclamations that each crisis was a oneoff event,” (Shaikh 2016: 726)
the theoretical problem is not to explain the particular causes of this or that crisis… The task is to explain the regular recurrence of economic crises as a normal part of the developmental tendencies of the capitalist mode of production… but that the tendency to crisis is inherent in the social form of capitalist production. (Clarke 1994: 6)
Thus, the Marxist theory of crisis is a theory of the necessity of crises in capitalism, not of its
mere possibility (Shaikh 1990). The theory of capital accumulation is also a theory of crisis
because the essence of crises lies in the foundation of capitalist production, the valorization of
capital (Mattick 1974). Although there are a multitude of explanatory factors of the crisis, and a
wide variety of forces with different meanings and simultaneously pushing in different
directions, a fundamental cause consistent with the essence of the system can be identified.
Accordingly, it is necessary to differentiate essential, fundamental, or the cause ‘in the last
instance’, from the direct or triggering factors of the crisis. In this way, the crisis is anchored in
the core of the logic of capital in general as a social relation of production (Grossman 1929,
Smith 1999).6
5 Max (MECW 29: 160) himself clearly made reference to “the world market, in which production is posited as a totality and all its moments also, but in which simultaneously all contradictions are set in motion.” 6 In this sense, this holistic conception implies confronting the opposition that is usually established by dominant approaches between economics and politics, or the market and the state (see Desai 2013).
The crisis and the valorization of capital
Marx´s theory of crisis is based on the general law of capital accumulation, culminating with
"the most important law of modern political economy" (MECW 29: 133), the law of the
tendency of the rate of profit to fall (LTRPF). For this reason, the crisis is a recurrent
phenomenon because the movement of capitalist production generates an increasing pressure on
the profitability of capital.
If the essential aspect of capitalism is the maximization of profit appropriated, and therefore
production is, first, generation of surplus (valorization), the collapse of capital accumulation
must be linked to that driving force. Ultimately, the crisis arises from the inability to generate a
sufficient amount of surplus value that allows the continuation of investment (I, GFCF), or
valorization of the accumulated capital stock (Mattick 1974). For Marx, there is a tendency
towards the progressive mechanization, which increases the mass of means of production
(constant capital) (K) per unit of labor (L), in turn leading to a consequent increase in the relation
between objectified and living labor.7 The relevant aspect is that this tendency is based on an
objective need for capitalist reproduction (macroeconomic basis), arising from the nature of
capital as its essence lies in the immanent impulse to be valorizated, not a free choice of agents
(microeconomics).
Since the increase in the composition of capital is a tendency leading to the LTRPF, the essential
aspect is the ability to produce surplus value by workers. The characteristic feature of the means
of production is precisely to serve as means for the exaction and absorption of surplus value. In
the level of abstraction of capital-in-general of Capital I (MECW 35), Marx identifies
mechanization with productivity, because the social degree of labor productivity is expressed in
the relative volume of the means of production that the worker turns into product.8 For this
reason, his theory of crisis is based on a technical change that is, however, essentially social,
from which i) there is a tendency towards concentration and centralization of capital, and this is
associated as well with the development of financial activity (Sotiropoulos et al 2013); ii) the
7 Whose proxy is the capital-output ratio (K/Y) (see appendix). 8 The analysis of capital composition is of the utmost importance in relation to my interpretation of the LTV, since it allows the transformation of concrete into abstract labor. Therefore, capitals with more advanced technologies are able to make their workers to produce more value per hour of work than their competitors. This interpretation rejects the idea of sectoral value transfers, an extended idea among Marxists (see Nieto 2015).

subjection of cyclical wage fluctuations to the requirements of accumulation, generating a
tendency towards the fall of the wage share, but also allowing for an increase in the real wage,
and ultimately; iii) inasmuch that it undermines the source of generation of value, it lays the
basis for an increased pressure to the decline in profitability.
The Spanish economy and the analysis of the crisis
The capitalist system is made up of countries, which establish national spaces of valorization in
which a first transformation of concrete labor into social or abstract one takes place, for which a
national currency does exist. It implies, in addition to geopolitical relations, a connection
between such economic spaces materialized in exchange rates.9 Thus, the analysis of the crisis in
a social formation, in this case, Spain, cannot be independent of the place it occupies in the world
economy, and more specifically, in the Eurozone.
The characterization of the crisis from a domestic perspective requires complementing the
general abstract framework with two aspects, what can be called displacements in both space and
time of the dynamics of valorization. The first one refers to a basic feature of Marx's approach,
the tendency towards an uneven geographical development: the national development of the
productive forces constitutes the fundamental determinant of the type of external insertion
(commercial, financial, productive), and in particular, the restructuring processes that take place
along crisis. For this reason, the external dependence of an economy materialized in the capacity
of external factors to generate internal volatility (or even crises) is not a fundamental cause, but
rather a consequence of the domestic conditions in surplus production (Astarita 2010).
Taking into account the worldwide redistribution of the surplus by means of international capital
flows, the cost of financing is largely conditioned by the domestic productive development, so
there is a first causal relationship, going from gross profitability (r) to the interest rate (i): r → i,
hence the centrality of the net expression of the profit rate (r − i).10 In this way, the greater
productive development is supposed to allow for a greater power to access world savings (lower
9 The exchange rate reflects the degree of development of the productive forces (see Astarita 2010), so that it can be alluded to the redistribution of the value pointed out by Carchedi (1997). 10 Shaikh (2016: 734) claims that “the real net rate of profit is the central driver of accumulation, the material foundation around which the “animal spirits” of capitalists frisk.” Although there is no natural rate of interest, there are structural determinants (Astarita 2010, Shaikh 2016), since the fundamental aspect is the demand for money-capital.
cost of financing). This is followed by the second element mentioned, that is, the role of finance
through credit, and the way it affects countries unequally. With credit, contradictions are
stretched out in time as the positive sanction of the market to realize the monetary value of goods
(M' − C') is anticipated. As the level of productive development of a country conditions both the
way of generation of the crisis and its effects, certain elements of the Spanish economy must be
exposed synchronously and diachronically.
Spain belongs to the European periphery, with a development of productive forces historically
below the average of Western Europe in terms of capital composition, productivity and sectoral
economic structure (BoS 2009, Maluquer 2014, Mateo 2017). Moreover, there is an underlying
profitability problem, as the level of the profit rate in 1995, the first year of this study, is at
historically low levels: 17% below the average of the immediately preceding boom (1985-91),
and more than 25% less than in 1970s,11 so lacking a full recovery after the 1992-93 recession.
Yet, the nominal exchange rate has remained constant since 1997, and in 1999 the Euro area
parity is set at a rate of 166.386 pta/Eur. Spain, however, has historically had a higher level of
inflation than the Euro area and the US (see AMECO 2016, Maluquer 2014), which has not
dissapeared with the integration into the Eurozone (Estrada et al 2009). The consequence has
been an appreciation of the real exchange rate, almost 20% in 1997-08 in relation to the former
Eur-15 (AMECO 2016). Given a context with the worst performance in labor productivity of the
whole OECD club (see OECD 2016), the process of capital accumulation in Spain has been
deeply influenced by the terms (the real exchange rate) under which domestic labor is
transformed into world value, far away from the domestic productive development.
These elements make it possible to understand the reasons for the asset-inflation associated with
construction (mainly residential) to become the driving force of capital accumulation in Spain.
Although the exhaustive analysis of this speculative boom transcends the objective of this article
(see Mateo 2017, Mateo and Montanyà 2017), I will just point out the most relevant aspects.
First, it is essentially explained by problems of profitability (Grossman 1929, Carchedi 2011,
Potts 2011), albeit it can assume a relative autonomy, with the capacity to influence the
11 Gross profit in relation to non-residential net capital stock excluding FIRE activities, according to EU-Klems (2012) and FBBVA (2015).

economic structure itself.12 The deep change in certain asset-prices relative to their underlying
labor values led not only to a change in the structure of sectoral profit rates, and thus to
investment flows, but also in the short term, i) to the appropriation of capital gains by certain
agents even if the quantity of surplus labor has not been modified, and ii) the realization of the
corresponding "real" productive cycles in activities related to construction.
Thus, there have been profits not supported by a corresponding surplus labor, but changes in
relative prices (Shaikh 2016). Ultimately, if there is no objective basis for the generation of
value, there must be a transfer of income from the household income circuit to that of capital
(Shaikh 2016) by means of a fall in wages and/or debt, a destruction (not necessarily physical) of
capital (bankruptcies, devaluation), or a depreciation of the national currency (Astarita 2010),
although this last one is not possible for Spain.
Controversies about the theory of the crisis
There are important controversies about the Marxist theory of crises, in turn reflected in the
diagnostics of the Great Recession. Probably, it could be largely explained by the shortcomings
of Marx's exposition. Among them, when it comes to Marx´s analysis of particular crises I would
emphasize the absence of an adequate integration of the abstract and the concrete, as well as
financial and international aspects.13 It follows that academic controversies arise from
discrepancies between root causes and triggering or direct factors.
It is my interpretation that there exists in Marx a single theory of crisis, but elaborated in a high
level of abstraction. The dichotomy between monocausality and the diversity of explanatory
factors outside of the above-mentioned question of analytical abstraction should be avoided (see
Roberts 2016b), because finding a specific explaining cause for each crisis implies a lack of a
consistent theory of crisis (see Freeman 1999). Yet, this conception of monocausality refers to
12 In a complementary way, reference can be made to factors such as economic policy (Law of Soil (1998), decentralization), demographic (changes in family structures, immigration) and natural phenomena (orography, climate), considering as well that the phases of growth in Spain since the industrialization of 1960s have been linked to construction (Rodríguez and López 2011). 13 See the difference between his New York Daily Tribune analysis of different crises in Europe between 1852 and 1858 (MECW 15-18) and theoretical references to the crisis in Capital (vol. III) (MECW, 37). At the same time, it should be considered that it is only from the 1860s onwards that a maturity analysis of the crisis is to be found, for up to that point Marx emphasizes the opposition between production and consumption, together with disproportionality (see Clarke 1994, Mateo 2007). Even in Theories of surplus value (Vol. II), his exposition critically responds to Ricardo's theory of accumulation (MECW 32).
the cause ‘in the last instance’ or of a fundamental character. It should be clarified that there is
not one-sidedness in the sense that it does not ignore the typology of concrete crises and the
various factors that come into play. This issue is relevant, as it is the CMP's own contradictions
that explain the reasons for a crisis manifesting itself in a given way and not another, or why
certain factors are more important in some conjunctures and/or national economies (see Freeman
2016).14
In short, it should be integrated the most abstract with the concrete through a continuity in the
analysis, not from an analytical rupture that gives rise to a variety of crises theories. But this
distinction is however not radical, as the abstract is the foundation of the concrete. That is to say,
the typologies in the manifestation of different crises and the diversity of direct factors that
trigger them are not the foundations for the elaboration of corresponding theories of crises.
Hence, I must distinguish between systematic primacy and primacy in specific historical
explanations in the sense of Smith (1999), which requires locating the national experience in a
particular historical context.
The holistic approach of Marx opposes, on the one hand, the partial conceptions that emphasize
as a causal element one or another phase of exchange within the cycle of capital valorization [M
(finance) – M − C{capital, labor (wage)}; C’− M’ − M’ (finance)]. These explanations ultimately
constitute theories of the possibility of crisis. On the other hand, this approach “does resist an
eclectic liberalism which refuses to search for analytical priorities,” (Dunn, 2012: 364) “or any
systematic analytical ordering” (Ibid.:362), as it is the case with empiricist or postmodern
theories (See Foley 1986). As a consequence, the explanations of the crisis that do not
analytically start from the production of surplus value end up limited to the form under which the
crisis manifests itself. In other words, its causality originates in a factor that for the Marxist
theory is a point of arrival, and that does not reflect the essence or cause "in the last instance."
In the case of the Great Recession, even among explanations coming from political economy
approaches, those focusing on finance, underconsumption, inequality, economic policy and
international imbalances are predominant (Roberts 2010, Mateo 2015). Nevertheless, they are
rather results of the contradictions inherent to the CMP, so making reference to the form, instead
14 Marx himself pointed out that the fall in the profit rate “breeds overproduction, speculation, crises, and surplus capital alongside surplus population.” (MECW 37: 240)
to the (essential) content. The relevant aspect is its theoretical status: such elements cannot give
rise to general laws of capitalist accumulation, and thus supporting other conceptions of the
crisis. From an approach based on the LTV, “such claims remain reified in a Marxist sense of
failing to link the phenomenal forms with their underlying social production.” (Dunn, 2012: 370)
In order to be analytically consistent, my aim must be to explain the reasons why the crisis is
triggered in one place or another of the valorization cycle, since “profit regulates both supply and
demand.” (Shaikh 2016)
3. Characterization of the crisis of the Spanish economy
A fall in the surplus value produced
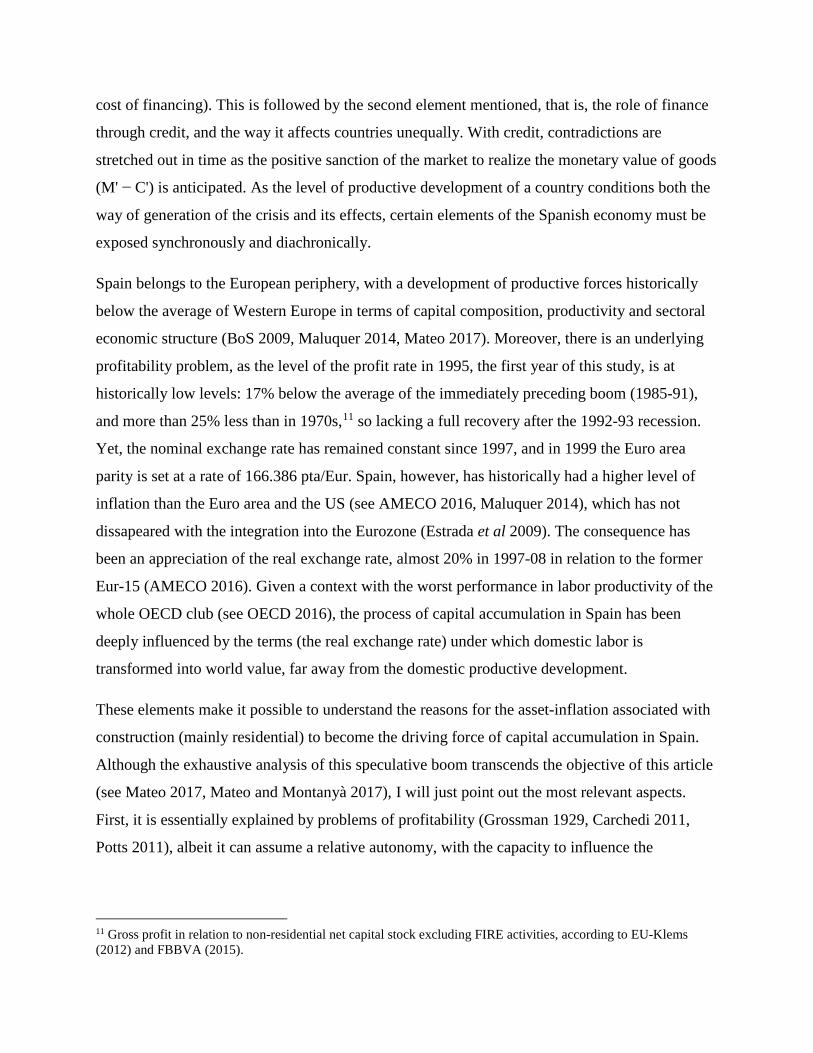
The central category in the great depression of the Spanish economy has been the profit rate (see
appendix), due to the insufficient capacity to generate surplus. The gross rate of profit shows a
ceaseless fall during both the growth years and throughout the crisis (Fig. 1). Until 2007, the
decline reaches 28.5%, and in 2014 the cumulative drop is 43.3%. Alternative measures fall even
more until 2007 and 2014: 43.4% and 63.5% the rate with net profit over gross capital stock (r1),
respectively, and 51.6% and 72.1% if mixed income (r2) is taken out from r1, respectively.
Graph 1. Measures of the profit rate (1995= 100)
Notes: r = gross profit/capital; r1: gross profit excluding consumption of fixed capital/gross stock of fixed capital; r2: r1 without mixed income. See appendix Sources: NSO (2004, 2016a, 2016b), FBBVA (2015)
20.00
30.00
40.00
50.00
60.00
70.00
80.00
90.00
100.00
1995
1996
1997
1998
1999
2000
2001
2002
2003
2004
2005
2006
2007
2008
2009
2010
2011
2012
2013
2014
r r1 r2
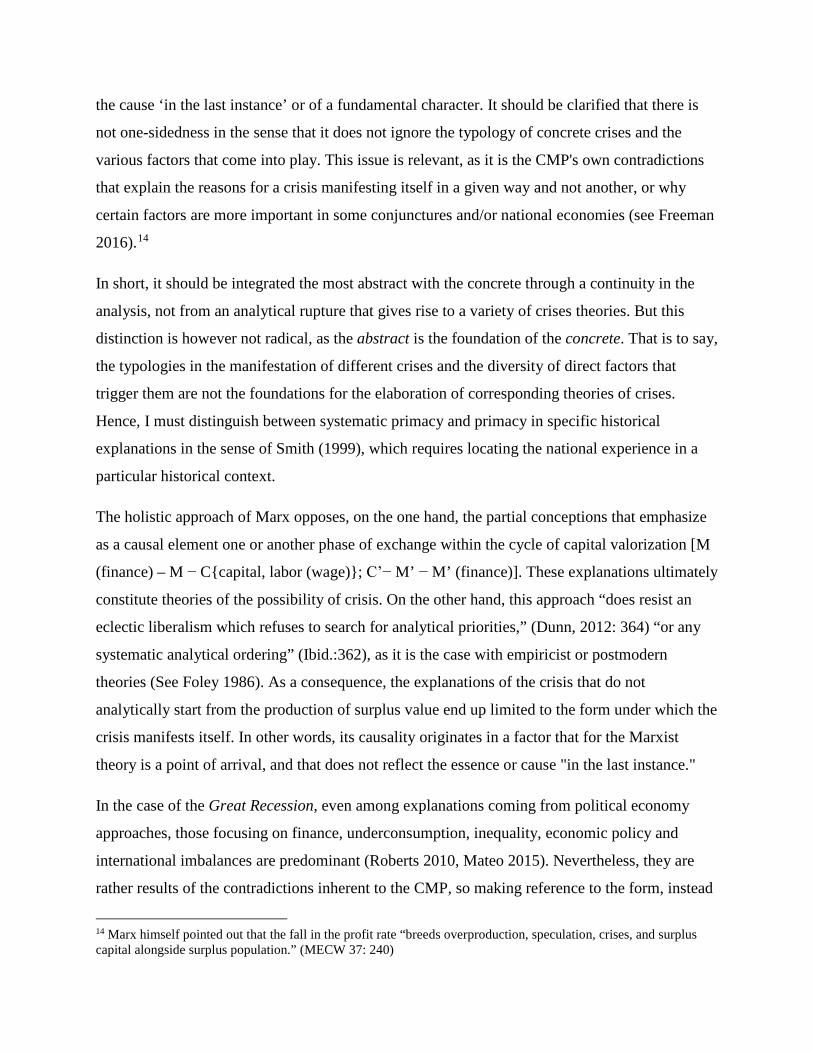
Behind this fall there can be found the dynamics of the mass of profit, which barely grows at an
annual average of 1.1% between 2000 and 2006 (Fig. 2). In this year, 2006, it reaches a
maximum of Mill.€ 320 at 2010 constant prices, but subsequently falls by 9.4% until 2014. In
turn, the profit net of depreciation peaks in 2002, leading to a decrease of 33% during the next 12
years.
Graph 2. Dynamics of the mass of profit Mass of profit at constant prices (1995= 100, left) and annual rates of change (%, right)
Notes: mass of profit with and without consumption of fixed capital, deflated by the stock of capital price index (Pk) Sources: NSO (2016a, 2016b), FBBVA (2015)
Thus, two important elements are revealed. First, there is a permanent drop in the rate of profit,
before and after the outbreak of the crisis, with greater intensity in the second part of the growth
period (2000-07), which also corresponds to the peak of the housing bubble. Second, the gross
potential for accumulation, reflected in the volume of surplus generated, reaches a maximum
before the collapse of the Spanish economy, which takes place in the second half of 2008. Due to
the lack of quarterly data for profits in the productive sector in Spain, table 1 shows the time
sequence leading up to the crisis on the demand side and the price of housing, showing the
variables from left to right as they reach the maximum.
-10
-8
-6
-4
-2
0
2
4
6
70
80
90
100
110
120
130
1995
1996
1997
1998
1999
2000
2001
2002
2003
2004
2005
2006
2007
2008
2009
2010
2011
2012
2013
2014
Gross profit (rate of change) Net profit (rate of change)
Gross profit Net profit
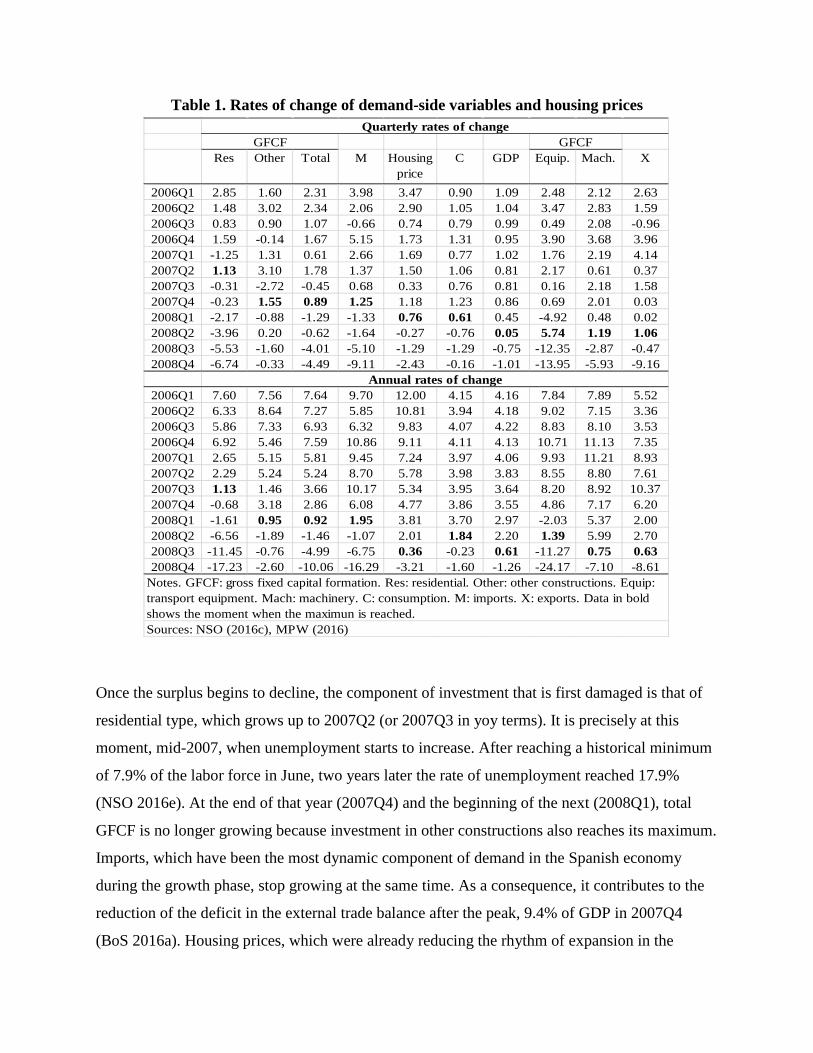
Table 1. Rates of change of demand-side variables and housing prices
Once the surplus begins to decline, the component of investment that is first damaged is that of
residential type, which grows up to 2007Q2 (or 2007Q3 in yoy terms). It is precisely at this
moment, mid-2007, when unemployment starts to increase. After reaching a historical minimum
of 7.9% of the labor force in June, two years later the rate of unemployment reached 17.9%
(NSO 2016e). At the end of that year (2007Q4) and the beginning of the next (2008Q1), total
GFCF is no longer growing because investment in other constructions also reaches its maximum.
Imports, which have been the most dynamic component of demand in the Spanish economy
during the growth phase, stop growing at the same time. As a consequence, it contributes to the
reduction of the deficit in the external trade balance after the peak, 9.4% of GDP in 2007Q4
(BoS 2016a). Housing prices, which were already reducing the rhythm of expansion in the
Res Other Total M Housing price
C GDP Equip. Mach. X
2006Q1 2.85 1.60 2.31 3.98 3.47 0.90 1.09 2.48 2.12 2.632006Q2 1.48 3.02 2.34 2.06 2.90 1.05 1.04 3.47 2.83 1.592006Q3 0.83 0.90 1.07 -0.66 0.74 0.79 0.99 0.49 2.08 -0.962006Q4 1.59 -0.14 1.67 5.15 1.73 1.31 0.95 3.90 3.68 3.962007Q1 -1.25 1.31 0.61 2.66 1.69 0.77 1.02 1.76 2.19 4.142007Q2 1.13 3.10 1.78 1.37 1.50 1.06 0.81 2.17 0.61 0.372007Q3 -0.31 -2.72 -0.45 0.68 0.33 0.76 0.81 0.16 2.18 1.582007Q4 -0.23 1.55 0.89 1.25 1.18 1.23 0.86 0.69 2.01 0.032008Q1 -2.17 -0.88 -1.29 -1.33 0.76 0.61 0.45 -4.92 0.48 0.022008Q2 -3.96 0.20 -0.62 -1.64 -0.27 -0.76 0.05 5.74 1.19 1.062008Q3 -5.53 -1.60 -4.01 -5.10 -1.29 -1.29 -0.75 -12.35 -2.87 -0.472008Q4 -6.74 -0.33 -4.49 -9.11 -2.43 -0.16 -1.01 -13.95 -5.93 -9.16
2006Q1 7.60 7.56 7.64 9.70 12.00 4.15 4.16 7.84 7.89 5.522006Q2 6.33 8.64 7.27 5.85 10.81 3.94 4.18 9.02 7.15 3.362006Q3 5.86 7.33 6.93 6.32 9.83 4.07 4.22 8.83 8.10 3.532006Q4 6.92 5.46 7.59 10.86 9.11 4.11 4.13 10.71 11.13 7.352007Q1 2.65 5.15 5.81 9.45 7.24 3.97 4.06 9.93 11.21 8.932007Q2 2.29 5.24 5.24 8.70 5.78 3.98 3.83 8.55 8.80 7.612007Q3 1.13 1.46 3.66 10.17 5.34 3.95 3.64 8.20 8.92 10.372007Q4 -0.68 3.18 2.86 6.08 4.77 3.86 3.55 4.86 7.17 6.202008Q1 -1.61 0.95 0.92 1.95 3.81 3.70 2.97 -2.03 5.37 2.002008Q2 -6.56 -1.89 -1.46 -1.07 2.01 1.84 2.20 1.39 5.99 2.702008Q3 -11.45 -0.76 -4.99 -6.75 0.36 -0.23 0.61 -11.27 0.75 0.632008Q4 -17.23 -2.60 -10.06 -16.29 -3.21 -1.60 -1.26 -24.17 -7.10 -8.61
Notes. GFCF: gross fixed capital formation. Res: residential. Other: other constructions. Equip: transport equipment. Mach: machinery. C: consumption. M: imports. X: exports. Data in bold shows the moment when the maximun is reached. Sources: NSO (2016c), MPW (2016)
GFCFQuarterly rates of change
Annual rates of change
GFCF
previous quarters, achieve a maximum of €2,101 per sq.m. in 2008Q1 (MPW 2016), as its
evolution was explained by investment in residential assets.
The other components of GFCF, transport equipment and machinery, began their decline in mid-
2008, following investment flows directly related to construction. However, transport-related
flows are closely related to this type of accumulation, as one of its centerpieces has been a
disproportionate impulse to the construction of transport infrastructures, that supported and
integrated new urban developments into the sphere of valorization (Rodríguez and López 2011).
On the other hand, investment in machinery grows until 2008Q2/Q3 due to the externalities of
the real estate bubble, and its evolution does condition the path followed by exports.
Therefore, the causality explaining the end of the GDP expansion in the second half of 2008 does
not lie in household consumption as neither in the foreign sector, but in investment. And within
GFCF, the driving force is to be found in construction, primarily residential. Furthermore, the
profitability of capital is behind all of this process.
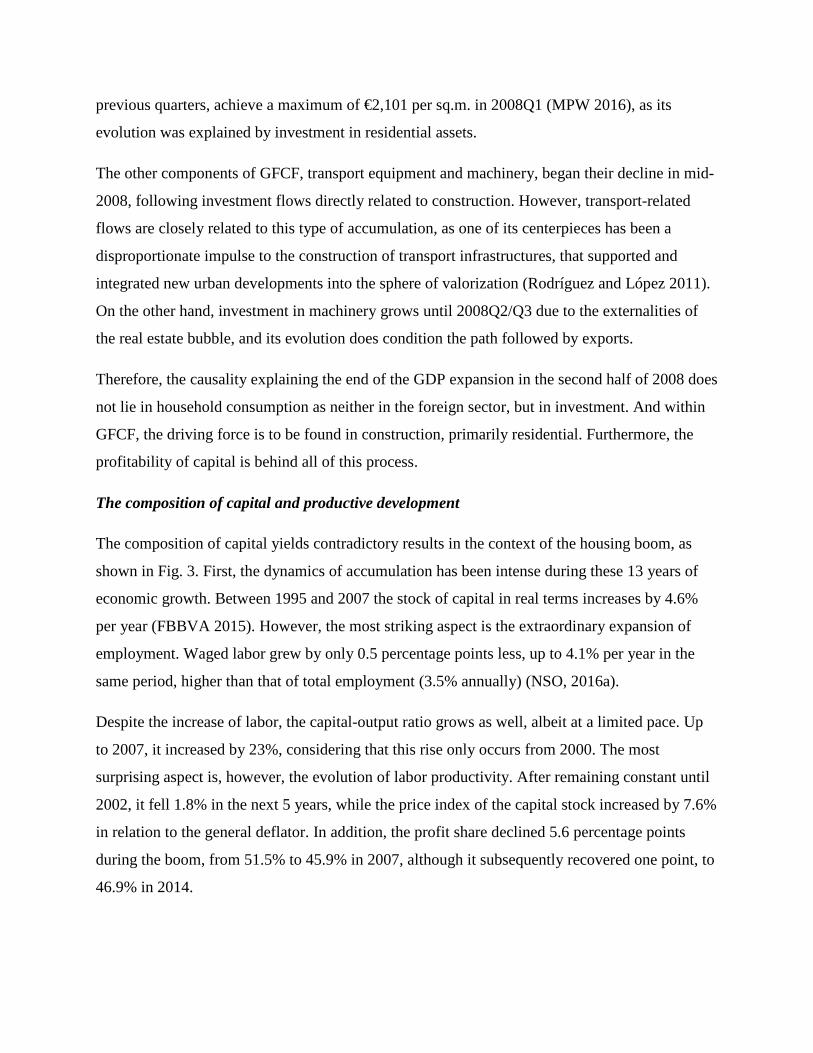
The composition of capital and productive development
The composition of capital yields contradictory results in the context of the housing boom, as
shown in Fig. 3. First, the dynamics of accumulation has been intense during these 13 years of
economic growth. Between 1995 and 2007 the stock of capital in real terms increases by 4.6%
per year (FBBVA 2015). However, the most striking aspect is the extraordinary expansion of
employment. Waged labor grew by only 0.5 percentage points less, up to 4.1% per year in the
same period, higher than that of total employment (3.5% annually) (NSO, 2016a).
Despite the increase of labor, the capital-output ratio grows as well, albeit at a limited pace. Up
to 2007, it increased by 23%, considering that this rise only occurs from 2000. The most
surprising aspect is, however, the evolution of labor productivity. After remaining constant until
2002, it fell 1.8% in the next 5 years, while the price index of the capital stock increased by 7.6%
in relation to the general deflator. In addition, the profit share declined 5.6 percentage points
during the boom, from 51.5% to 45.9% in 2007, although it subsequently recovered one point, to
46.9% in 2014.
Graph 3. Determinants of the profit rate
Notes. Profit share (%) in right axis, other variables 1995= 100 (left). See appendix for details Source: NSO (2016a), FBBVA (2015)
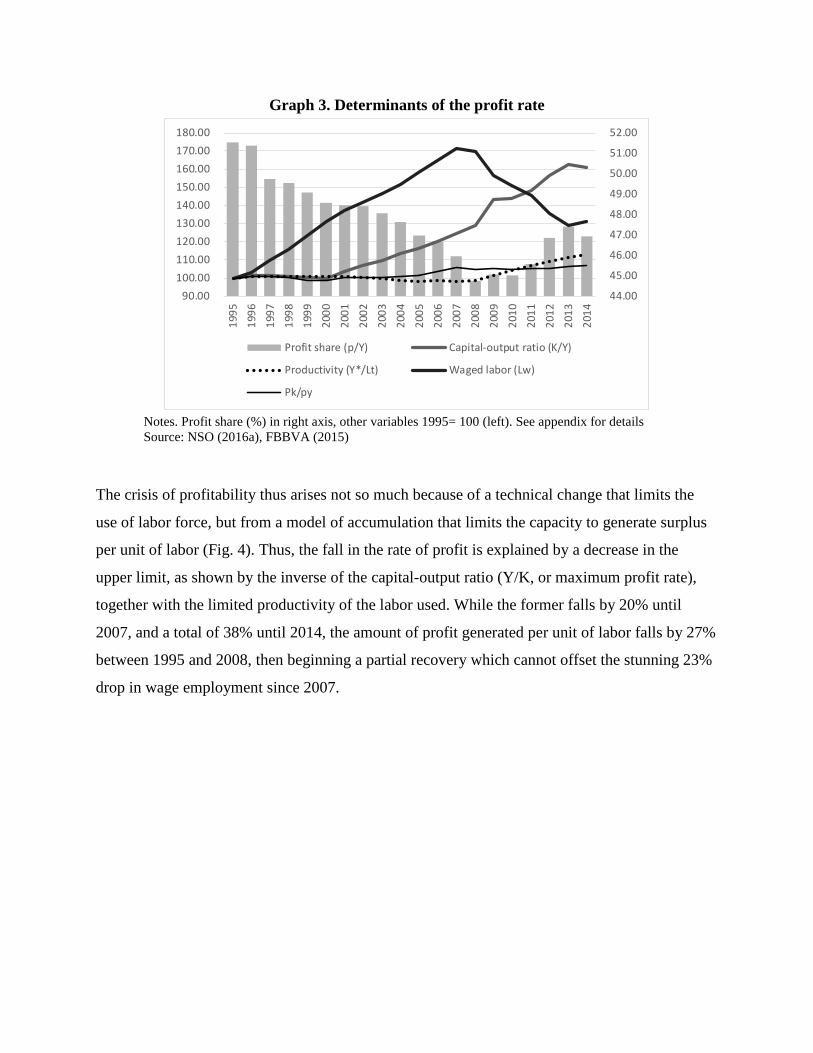
The crisis of profitability thus arises not so much because of a technical change that limits the
use of labor force, but from a model of accumulation that limits the capacity to generate surplus
per unit of labor (Fig. 4). Thus, the fall in the rate of profit is explained by a decrease in the
upper limit, as shown by the inverse of the capital-output ratio (Y/K, or maximum profit rate),
together with the limited productivity of the labor used. While the former falls by 20% until
2007, and a total of 38% until 2014, the amount of profit generated per unit of labor falls by 27%
between 1995 and 2008, then beginning a partial recovery which cannot offset the stunning 23%
drop in wage employment since 2007.
44.00
45.00
46.00
47.00
48.00
49.00
50.00
51.00
52.00
90.00 100.00 110.00 120.00 130.00 140.00 150.00 160.00 170.00 180.00
1995
1996
1997
1998
1999
2000
2001
2002
2003
2004
2005
2006
2007
2008
2009
2010
2011
2012
2013
2014
Profit share (p/Y) Capital-output ratio (K/Y)
Productivity (Y*/Lt) Waged labor (Lw)
Pk/py
Graph 4. Surplus productivity index and the maximum rate of profit (1995= 100)
Notes: P*/Lw: real mass of profit per unit of equivalent wage labor, see appendix Sources: NSO (2016a), FBBVA (2015)
Therefore, it can be claimed that the contradictory evolution of the composition of capital is
explained by the distortions associated to the housing boom. One of the main driving forces of
investment has been the revaluation of assets related with construction, rather than profits
coming from a reduction of socially necessary labor time through the mechanization of the
productive process. While the stock of non-residential capital at current prices multiplies by 1.7
between 1995 and 2007, the residential stock does so by 5 (FBBVA 2015, MPW 2016).
Under these conditions, the housing market offered attractive opportunities for investment in the
late 90s. Since 1999, housing prices start a spiral relatively autonomous of other variables. The
price per square meter (sqm) increases to 12.4% per year in 1999-07, and even progressively,
since between 2002 and 2006 it is higher than 10% per year (MPW 2016). In the meantime, the
cost of financing was generally less than 4%, and other fixed-income investment alternatives
provided yields well below 4% (BoS 2016c).
55.00
60.00
65.00
70.00
75.00
80.00
85.00
90.00
95.00
100.00
105.00
1995
1996
1997
1998
1999
2000
2001
2002
2003
2004
2005
2006
2007
2008
2009
2010
2011
2012
2013
2014
P*/Lw Y/K r

Graph 5. Housing prices Vs interest
Notes. Interest rates in loans to non-financial corporations (lending over €1 Mill); Average annual rates of change (%) of housing prices (Eur per square meter, national average) Sources: BoS (2016a), MPW (2016)
Given this differential, more than two-thirds of total investment was concentrated on
construction-related assets (housing and other constructions) (BoS 2016b). Sectorally, this
distorted accumulation materialized in the greater dynamism of manufacturing branches related
to construction (furnitures, etc.) and mainly, of non-tradable activities such as services linked to
urban developments, and the corresponding financial activity to provide credits, also with a
relatively low level of capital-product ratio.15
Table 2 shows the activities of construction, commerce and repairs, hospitality, publishing,
programming, professional activities and other services, which have had the highest rates of
capital stock increase, between 5.5 and 10.8% per year. These branches have accounted for 39-
42% of GDP at current prices during the growth phase and received 46% of net investment at
current prices (FBBA, 2015). Nevertheless, they have a relatively lower level of capital
composition, since in 1995 the K/Y ratio ranged between 38 and 67% of the national average of
15 See Mateo y Montanyà (2017). This "price-effect" makes other assets of fixed capital (offices, industrial buildings, etc.) more expensive (Bellod 2007), and thus, it pushes upwards the general level of inflation.
- 2.00 4.00 6.00 8.00
10.00 12.00 14.00 16.00 18.00 20.00
2003
Q1
2003
Q2
2003
Q3
2003
Q4
2004
Q1
2004
Q2
2004
Q3
2004
Q4
2005
Q1
2005
Q2
2005
Q3
2005
Q4
2006
Q1
2006
Q2
2006
Q3
2006
Q4
2007
Q1
2007
Q2
2007
Q3
2007
Q4
Housing price Interest

the productive area. In the last year of expansion, they still had lower levels, except for the other
services, although the difference had been reduced.
Table 2. Sectoral pattern of capital accumulation in key less advanced sectors
These branches are relatively labor-intensive, and in general, using labor with a relative lower
level of qualification (Estrada et al 2009). Thus, they represented 91% of the new total
employment, 75% in relation to the productive sector, and in the case of wage labor, the
percentages are in both cases very similar, barely 4 percentage points less (87% and 71%). In this
sense, in 4 out of these 7 activities productivity declined during the years of expansion, between -
29% and up to -50%, and in five of them, the price index has increased to more than 3% per
year. Also, the gross rate of profit has decreased more than the domestic average, between -33%
and -61%.16
16 Some exceptions are noted, in particular: i) "Other services", whose K/Y ratio rises to national average´s absolute level, its productivity increases by 19% and its price index keeps below the average; and ii) the increased productivity in programming activities, the only branch that could even increase its gross rate of profit (51%).
1 2 3 4 5 6 7Variation Avg Variation
Activities 1995 2007 K Lw Y/L Prices rMachinery 65.80 51.39 3.88 2.87 37.26 2.60 44.66Furniture 75.09 48.63 3.33 3.99 53.82 1.03 129.25Construction 67.00 82.44 8.27 6.84 -35.92 5.93 -44.61Trade 59.65 69.45 5.74 5.77 2.36 2.62 -52.56Accommodation 38.31 44.98 5.53 6.17 -36.32 4.87 -48.57Publishing 65.04 96.43 8.45 5.30 -50.63 6.52 -43.22Programming 34.45 25.55 10.56 8.66 41.20 3.87 51.36Professional 58.20 59.39 8.35 9.20 -29.76 4.46 -33.71Other services 52.31 106.03 10.80 3.05 18.99 1.97 -61.29Total economy 100.00 100.00 4.90 4.08 -1.90 3.19 -28.55
K/Y relative level
Notes: Machinery: manufacture of machinery and equipment n.e.c.. Furniture: manufacture of furniture; other manufacturing, repair and installation of machinery and equipment. Trade: wholesale and retail trade and repair of motor vehicles and motorcycles. Accommodation: accommodation and food service activities. Publishing activities. Programming: computer programming, consultancy and related activities; information service activities. Professional: professional, scientific and technical activities. Other services: arts, entertainment and recreation, repair of household goods and other services. Average annual rates of change (3, 4 6), total variation (5,7)
Avg
Sources: NSO (2016a), FBBVA (2015)
4. Controversies around the causes
This section addresses the role of factors considered complementary in explaining the crisis, as
opposed to other explanations of the crisis in Spain.
Competitiveness, demand and distribution of income
The particular path of wages in Spain has provided opposing arguments for the crisis. First, the
orthodox literature usually blames the State intervention, which supposedly led to an inefficient
allocation of resources (BoS 2009). One of the consequences was a kind of profit-squeeze
stemming from the allegedly rigidity of the labor market, although substituting the rate of profit
for the rather accepted concept of "competitiveness." The argument is based on the increase in
wage costs at current prices in relation to labor productivity at constant prices, and compared to
the rest of the Eurozone (BoS 2016a, 2016b, Estrada et al 2009, Cuadrado and Maroto 2012,
Maluquer 2014). Thus, nominal wages would be responsible for the loss of business
competitiveness, and by extension, indebtedness and external imbalances.17 The BoS (2016b)
highlights that the nominal wage per worker grew in Spain between 1995Q1 and 2008Q2 by
59.2%, while in the Eurozone-19 the increase was 37.9%. As labor productivity in Spain
stagnated in relation to the Eurozone, unit labor costs (ULC) would be fundamental to
understanding the crisis, for they increased in Spain by 49.9%, compared to 21.3% in the Euro-
19.
Apart from the fallacy of the rigidity of the labor market in Spain, which has also been deeply
liberalized since the 1980s (see Guamán and Illueca 2012), the orthodox emphasis on wage costs
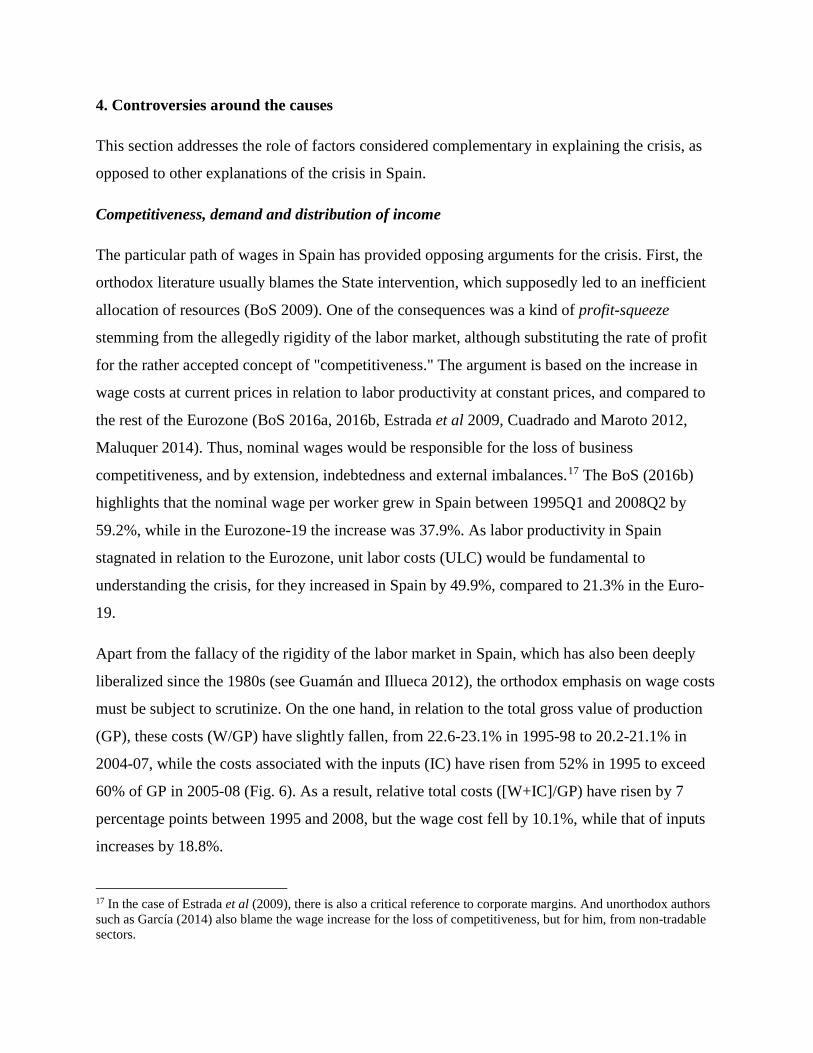
must be subject to scrutinize. On the one hand, in relation to the total gross value of production
(GP), these costs (W/GP) have slightly fallen, from 22.6-23.1% in 1995-98 to 20.2-21.1% in
2004-07, while the costs associated with the inputs (IC) have risen from 52% in 1995 to exceed
60% of GP in 2005-08 (Fig. 6). As a result, relative total costs ([W+IC]/GP) have risen by 7
percentage points between 1995 and 2008, but the wage cost fell by 10.1%, while that of inputs
increases by 18.8%.
17 In the case of Estrada et al (2009), there is also a critical reference to corporate margins. And unorthodox authors such as García (2014) also blame the wage increase for the loss of competitiveness, but for him, from non-tradable sectors.
On the other hand, it should be noted that Spain's economic restructuring since its integration
into the European common market in 1986 has favored activities with a lower capital
composition. Indeed, those activities in which the wage share did not declined have been
industrial activities related with wood and cork, paper and printing, as well as trade and repair,
hotels and professional activities, all of them (except for the first one, which it is relatively labor
intensive) with a lower-than-average capital-output ratio (FBBVA 2015, NSO 2016a). Also, if
the wage share in the productive area is adjusted by the increase of wage labor in the total labor
force occupied, it turns out that it does not rise by 7.7 points until 2008, but only 2.2.
Graph 6. Cost structure of gross production Costs in relation to GDP (1995= 100)
Notes: total costs= inputs + wages Source: NSO (2016a)
The central role of price indexes compels to refute certain assertions. During the previous years
to the crisis (1995-1907), the consumption price index (CPI) increased by 41.8%, while the GDP
deflator rose by 50.8%. However, the CPI does not record the increase in housing prices, a
durable consumption good for workers, so the statistics do not show the actual deterioration in
the purchasing power of wages.18 Thus, average real wages in the whole economy deflated by
18 As Bellod (2009) explains on the measure of the CPI, the ‘use-cost’ method was replaced in 1992 by the ‘lease method’, which is somewhat contradictory with the behavior of families in Spain. The price of housing has always exceeded that of rent in the recent period (almost triple from 1998 to 2007), in turn reducing quantified inflation.
80.0
85.0
90.0
95.0
100.0
105.0
110.0
115.0
120.0
1995
1996
1997
1998
1999
2000
2001
2002
2003
2004
2005
2006
2007
2008
2009
2010
2011
2012
2013
2014
Total costs Inputs Wages
the CPI grew by 3.8% between 1995 and 2007, but with the GDP deflator, they fell by -0.58%,
and the real hourly wage reached a stunning fall of 2.8% (NSO 2016a).19 These values are still
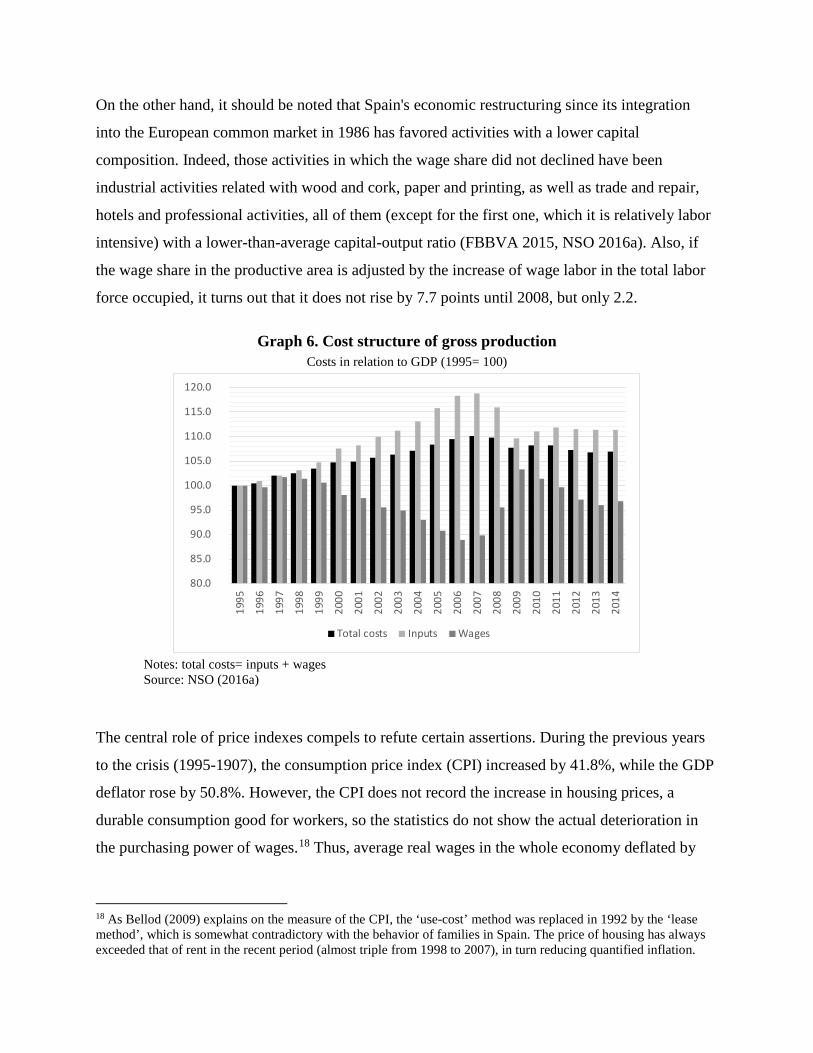
lower in the case of the productive sectors (Fig. 7). However, the purchasing power of wages has
fallen to a greater extent for those who have had to deal with the acquisition of a house.20 It
should be clarified as well that the increase in the average real wage shown in Fig. 7 during the
crisis is largely explained by layoffs of low-paid workers. Furthermore, social public spending
(indirect wage) did not rise, but in fact kept its level at 19-20% of GDP (BSE 2016).
Graph 7. Average real wages in the productive activities (1995= 100)
Notes: wr: real wage; Lw: waged labor; hw: equivalent hours worked by wages labor; Pc, Py: price deflators of consumption and total product, respectively Source: NSO (2016a)
In short, the underlying controversy lies in something that in any case is not specific to this
period, the higher inflation in Spain with respect to the Euro area (AMECO 2016). In contrast to
the orthodox approach, I argue that it is not explained by wages, but rather is a structural result
given the lower productive development of Spain, reflected in the increase of Pk/Py, and
therefore, the way in which the valorization process has been developed. Corporate profitability
19 In turn, between 2002 and 2005 the average income corresponding to the poorest 20% of Spanish households fell by 23%, while the average income of the richest 10% increased by more than 15%, and the difference of average income between the richest 10% and the poorest 20% of Spanish households went from 12 times to 17.4 (Torres 2009). 20 Note that according to the Survey of BoS (2008), low-income households became more indebted than rich ones in order to acquire the main dwelling.
93.0
96.0
99.0
102.0
105.0
108.0
111.0
114.0
1995
1996
1997
1998
1999
2000
2001
2002
2003
2004
2005
2006
2007
2008
2009
2010
2011
2012
2013
2014
wr(Lw,Pc) wr(Lw,Py) wr(hw,Py)
has largely been linked to a price effect, i.e. the construction-related asset-inflation, and has been
transmitted to other activities, particularly to non-tradables.
In an opposite way, but also complementary, the underconsumptionist hypothesis of much of the
heterodox authors in Spain focuses on the evolution of wages under a demand-side perspective,
from which they derive the macroeconomic behavior. In this case, the ultimate cause of the crisis
would be inequality, reflected in the fall of the wage share, associated in turn with the neoliberal
policies implemented in response to the crisis of the postwar accumulation model. This demand-
problem would limit growth, so this gap would have led to the financialization of the Spanish
economy, thus reflected in credit, debt and the housing boom (Torres 2009, Rodríguez and
López 2011, Álvarez et al 2013).21
This explanation addresses the current phase from a long-term perspective. Following AMECO
(2016), wages relative to GDP barely increased by 0.5 percentage points between 1995 and
2007, in contrast to increases in the growth phases of 1960-74 and 1985-91. However, according
to the same source, the wage share in gross value added has grown by 6 percentage points in
1995-07, but if NSO (2016) is taken, the rise would be 2 points, and for the productive activities
the increase amounts to 6 points. But even adjusting for the relative increase in wage labor, this
causality does not hold in a long-term perspective, for periods of economic growth have
coexisted with different dynamics of the wage share.
21 Although this Kaleckian approach actually arises from a power balance between companies, foundation of the mark-up which thus determines profits and, then, the wage share (Sawyer 1985, Shaikh 2016). However, in these post-Keynesian studies, the emphasis is on neoliberal economic policy, probably due to the atomization of the corporate structure in Spain, since 90% of companies have 5 or fewer workers (NSO 2016d).
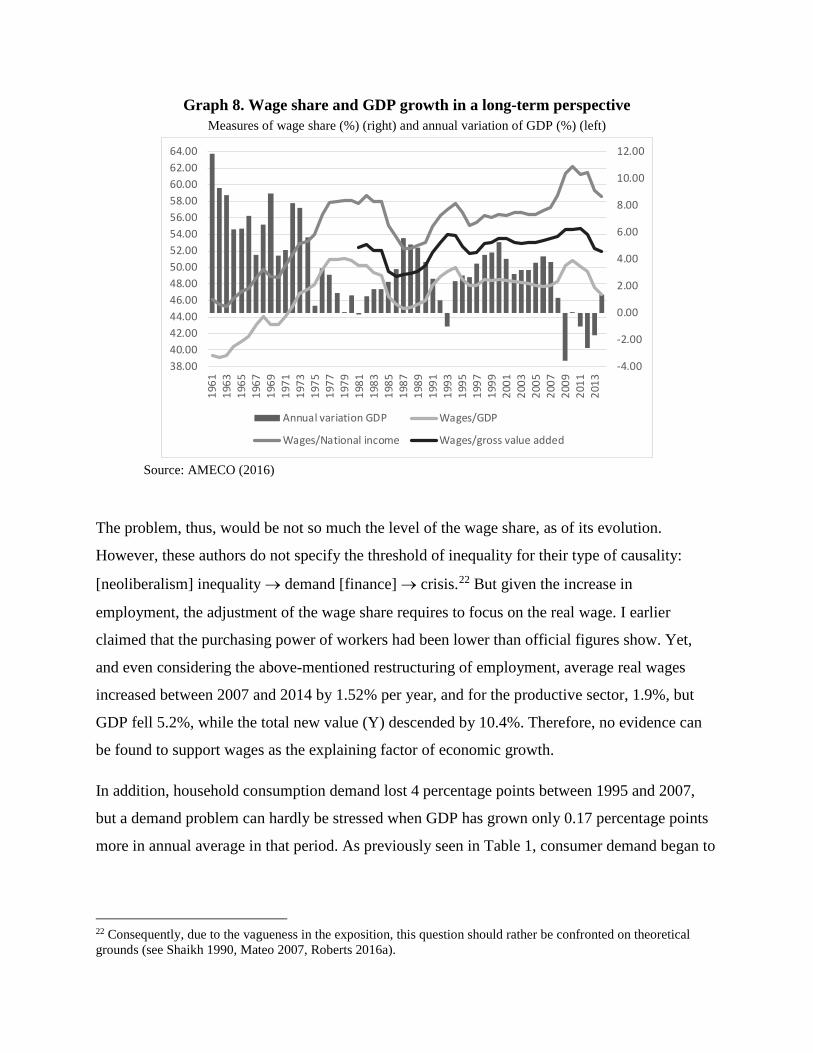
Graph 8. Wage share and GDP growth in a long-term perspective Measures of wage share (%) (right) and annual variation of GDP (%) (left)
Source: AMECO (2016)
The problem, thus, would be not so much the level of the wage share, as of its evolution.
However, these authors do not specify the threshold of inequality for their type of causality:
[neoliberalism] inequality → demand [finance] → crisis.22 But given the increase in
employment, the adjustment of the wage share requires to focus on the real wage. I earlier
claimed that the purchasing power of workers had been lower than official figures show. Yet,
and even considering the above-mentioned restructuring of employment, average real wages
increased between 2007 and 2014 by 1.52% per year, and for the productive sector, 1.9%, but
GDP fell 5.2%, while the total new value (Y) descended by 10.4%. Therefore, no evidence can
be found to support wages as the explaining factor of economic growth.
In addition, household consumption demand lost 4 percentage points between 1995 and 2007,
but a demand problem can hardly be stressed when GDP has grown only 0.17 percentage points
more in annual average in that period. As previously seen in Table 1, consumer demand began to
22 Consequently, due to the vagueness in the exposition, this question should rather be confronted on theoretical grounds (see Shaikh 1990, Mateo 2007, Roberts 2016a).
-4.00
-2.00
0.00
2.00
4.00
6.00
8.00
10.00
12.00
38.0040.0042.0044.0046.0048.0050.0052.0054.0056.0058.0060.0062.0064.00
1961
1963
1965
1967
1969
1971
1973
1975
1977
1979
1981
1983
1985
1987
1989
1991
1993
1995
1997
1999
2001
2003
2005
2007
2009
2011
2013
Annual variation GDP Wages/GDP
Wages/National income Wages/gross value added
fall in mid-2008, after the fall in both profitability and investment, and has lower variability than
other categories.23
To sum up, this approach is based on the apparent contradiction underlying the housing boom,
for in the last instance stagnant wages make objectively impossible a permanent increase in
housing prices because of lack of purchasing power. But the causality is radically different, as
there has been no material basis (considering this mode of production) in terms of productivity
for increases in wages. Within the framework of the Eurozone, the inability to compensate for
lower productivity through a currency devaluation has brought with it the need to moderate the
wage cost. Therefore, this path of wages has been rather functional to the requirements of capital
valorization, so what appears as a wage-demand limit turns out to be essentially a labor-value
limit.
Finance and the rate of interest
As it happens with income distribution, there are explanations from both orthodox and heterodox
approaches that emphasize the role of finance in explaining the crisis. First, an excessively lax
monetary policy (or the superabundance of world savings in the case of Andrés 2009) is often
blamed, which, by excessively reducing interest rates, promoted the indebtedness of private
agents.24 Secondly, other authors refer to the financialization of the Spanish economy as a
product of neoliberal policies following the Maastricht agreements and the subsequent
integration into the Eurozone. The expansion of credit activity by the banking sector would
ultimately be, nevertheless, a consequence of wage stagnation. Thus, finance would have been
responsible for recycling the excess profit and/or maintaining aggregate demand.25
Certainly, interest rates have declined throughout the expansion phase (Fig. 9), mainly in the
process leading up to the integration in the Eurozone in the second half of the 1990s. Both long-
23 Household consumption declined at an annual average of 1.74% between 2007 and 2014, less than GFCF (-5.7% per year), exports (+2%) and imports (-2.9%) (NSO 2016a). 24 From a neoclassical framework, see Estrada et al (2009), Vara (2009) following the von Mises Austrian school, and among heterodox accounts, see Febrero and Bermejo (2012) and Muñoz de Bustillo (2014). 25 Within a Minsky's approach, other authors refer to expectations and risks taken, supported by a nominal exchange rate and an increase in labor costs, as García (2014).

term and short-term rates of interest fell relatively more than the profit rate, from 11.2% to 4.7%
(1995-98) and from 9.3% to 2.9% (1995-99), respectively.
Graph 9. Nominal interest rates Short and long term, quarterly (%)
Source: OECD (2016)
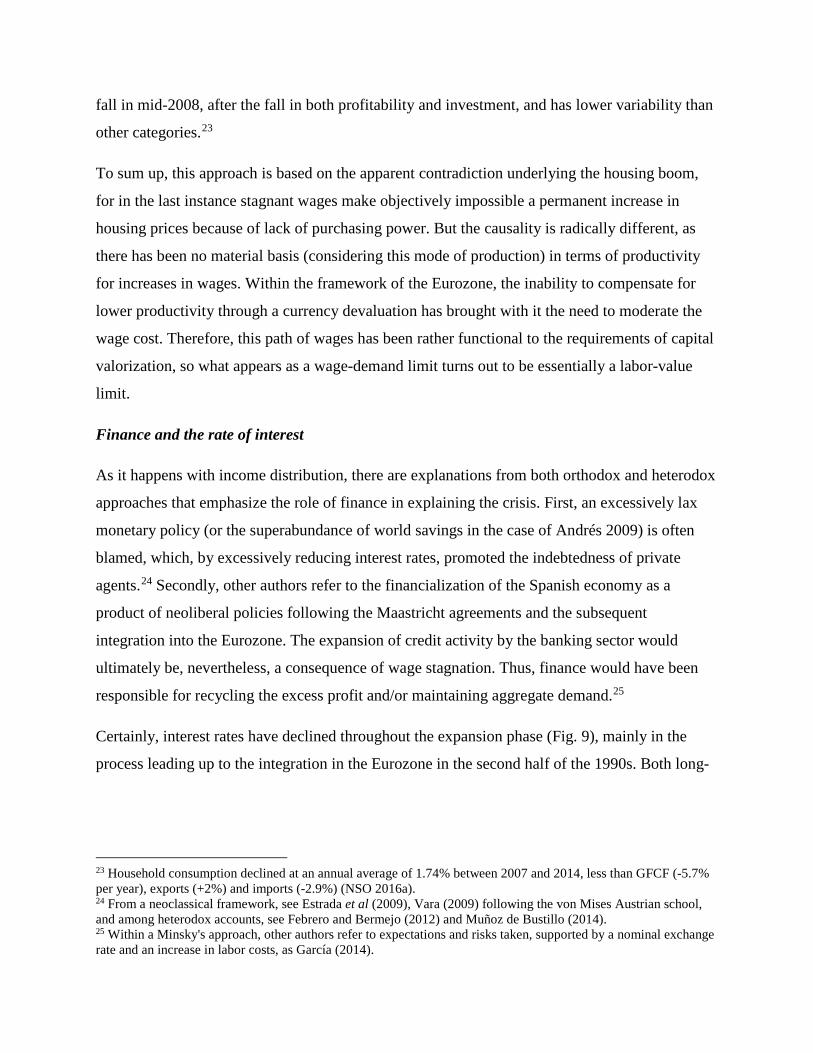
This extraordinary fall increased the difference between the ordinary return on net assets and the
cost debt of non-financial corporations (NFC). After having increased 31% between 1998 and
2004 (from 3.2 to 4.2), this spread suffered a decline that accelerated since 2006, from 3.8-3.9 in
2005-06 to 1.3-1.7 in 2008-10, as shown in Fig. 10.
0.001.002.003.004.005.006.007.008.009.00
10.0011.0012.0013.00
Q1-
1995
Q4-
1995
Q3-
1996
Q2-
1997
Q1-
1998
Q4-
1998
Q3-
1999
Q2-
2000
Q1-
2001
Q4-
2001
Q3-
2002
Q2-
2003
Q1-
2004
Q4-
2004
Q3-
2005
Q2-
2006
Q1-
2007
Q4-
2007
Q3-
2008
Q2-
2009
Q1-
2010
Q4-
2010
Q3-
2011
Q2-
2012
Q1-
2013
Q4-
2013
Q3-
2014
3 month interbank rate Long term
Graph 10. Spread return on investment minus cost debt (1998= 100)
Source: BoS (2016d)
From the approach argued so far, the role of finance in the gestation of the crisis should be
analyzed basically within the holistic framework of capital as a social relation, and specifically
with the gross profit rate (see Sotiropoulos et al 2013), that is, the process of valorization and the
place that Spain occupies in the European capitalism. Thus, the functionality of interest rates is
twofold. On the one hand, the reduction in the cost of financing has fostered the so-called profit
rate of enterprise (r − i) (Shaikh, 2016), compensating for the relatively low level and the fall in
the upper ceiling (gross ‘r’) by this further reduction of the lower limit (‘i’), as it happened with
wages. But this reduction has not generated the crisis, but has displaced over time the
manifestation of problems located in the productive sphere, in turn by means of a real influence
in the sectoral structure of economic reproduction. Therefore, it rather influences the form, but
not as a cause of a content (the crisis of profitability), which was already latent.
This fall in interest rates, indeed, was not based on the productive conditions of the Spanish
economy. Monetary integration and the inefficiency of the financial markets made the risk
premium with Germany practically null between 2003 and 2007 (BoS 2016c).26 As a result, this
distorted rise in net profitability (r − i) led to an explosion in credit, with increases above 15%
per year between 1999 and 2007 for non-financial corporations, while productivity stagnated.
Out of total credits granted, those related to the housing bubble (construction, real estate
26 In 1995, real interest rates were higher in Spain than in Germany, but in 2005-06 they were lower by more than 3 percentage points, since historically there was a gap of 4-6 points that virtually disappeared (AMECO 2016) .
0
20
40
60
80
100
120
140
1998
1999
2000
2001
2002
2003
2004
2005
2006
2007
2008
2009
2010
2011
2012
2013
2014
activities and acquisition and rehabilitation of houses) have increased from 38% to 60% of the
total between 1995 and 2006-08. Accordingly, the stock of debt to GDP (annual average) has
multiplied by two between 1995 and 2012-14, i.e., from 132% to 264-272%, and in particular,
private sector indebtedness (BoS 2016b).
Consequently, and contrary to the theories of financialization, this decline in interest rates
precisely shows that interest are part of the total surplus value (‘r’), so its level has objective
constraints and is not essentially a mere cost. Furthermore, it is consistent with Marx´s holistic
approach, so r → i, meaning that it is the fall in the gross rate of profit that makes debt a problem
because sufficient surplus is not generated to repay loans (Kliman, 2015, Roberts, 2016). The
question of credit and debt should not be analyzed in absolute terms as a primary analytical
element, but in relation to profits because it is not independent of the general process of surplus
value production.
Finance has in turn been functional from the geographical perspective of capital within the
Eurozone. The real estate bubble in Spain made it possible to recycle current account surpluses
from the more advanced economies of this Eurozone (Germany, etc.).27 The increase in the risk
premium in Spain, which from February 2008 increased from 0.1 points to more than 1.5 in the
middle of 2009 (BoS, 2016c), contributed to the restructuring that the crisis must undertake. In
business terms, the NFC interest burden has grown from 13% in 2004-05 to 22-25% in 2008-14
(BoS, 2016d), particularly affecting small enterprises (from 16% to 30-37% in 2008-12),
promoting the destruction of capital through bankruptcies, asset depreciations, etc. After the
outbreak of the crisis, capitals sought safe havens to avoid further risks. Central economies such
as Germany or Switzerland received many funds and so their interest rates sharply fell, just
unlike peripheral economies such as the Spanish, Portuguese or the Greek ones.
This regional polarization complements the corporate restructuration and constitutes the
geographic materialization of the unequal development and the tendency towards the deepening
of the inequalities between national spaces of valorization promoted by the crisis. Thus, finance
27 It should be noted that the most important bilateral capital flow within the Euro area capital was the one developed between Germany and Spain, with the acquisition of mortgage-backed bonds destined to investment in the Spanish housing market (Pérez, 2013).
has been functional for the logic of capital in its social and geopolitical dimensions, that is, in the
reorganization of power relations (Sotiropoulos et al 2013).
5. Conclusions
The main idea to highlight in this analysis of the Spanish economic crisis is the underlying
profitability problem behind (and hidden by) the real estate-financial process that has led the
dynamics of accumulation. Between 1995 and 2007, different measures of profitability decrease
by 28-51%, and until 2014, the total fall reaches 43-72%. The mass of profits in relation to the
capital deflator only increases at 1.1% per year between 2000 and 2006, and in this last year a
maximum is achieved.
Therefore, the crisis is rooted in the production of surplus value, prior to the manifestation of the
crisis, since it regulates the functioning of the economy, and in turn originates different
imbalances. The time-sequence of variables has been the following: residential investment
[2007Q2Q3] [employment] → total GFCF [2007Q4-2008Q1] → imports (current account
deficit) and housing price [2008Q1] → investment in machinery [2008Q2Q3], household
consumption and exports [2008Q3].
Simplifying, rather than production of surplus labor, there has been a process of accumulation
driven by a price-effect. The real estate bubble implies both a temporary and geographic
displacement of the valorization circuit, so that reference can be made to a spatial solution to the
contradictions arising from the sphere of value-production, and closely linked with finance. The
counterparts were, i) a contradictory relationship between the composition of capital, which grew
by 23% between 2000 and 2007, and the stagnation of labor productivity, explained by a sectoral
reorganization to the detriment of activities with higher level of mechanization; and ii) a huge
increase in indebtedness, making contradictions to arise later on but in a deeper way and under
the form of a debt crisis.
The analysis of the controversies on the Great Recession reveals the importance of the labor
theory of value as a theoretical foundation for explaining the crisis. Two aspects have been
highlighted:
i) In the case of wages, it manifests itself in the dichotomy between two unilateral
conceptions, either nominal wage as cost (supply) within a technical production
function, which makes it possible to resort to exogenous factors (allegedly labor
market rigidities) either by orthodox analysis, or as the main source of demand,
which determines the benefit for underconsumptionist approaches. In any case,
the concept of the value of labor power is absent, which in Marx allows for the
quantification of the surplus;
ii) As regard finance, whether the analysis emphasizes falling interest rates as the
starting point, or if it focuses on its role for absorption of super-profits or
maintaining demand (in neoclassical or post-Keynesian approaches), it ultimately
reveals that interest is not treated as a part of surplus value. As a result, the
boundaries of the analysis are the economic policy decisions, animal spirits, risk
aversions or individual choices to borrow, in contrast to the objective framework
of social relations of production.
Faced with the Marxist approach, these conceptions of the crisis are based on different concepts
of the meaning of capitalist production, prioritizing the sphere of use-values transactions.
Therefore, the source of the crisis would be found in the phases of exchange of "things," M − C
and C' − M', hence the role of interest and debt (M − M'), profit-squeeze (M' − labor), or demand
(C' − M').
References Álvarez, N.; Luego, F. and J. Uxó (2013). Fracturas y crisis en Europa. Madrid: Clave
Intelectual.
AMECO (2016). Annual macro-economic database. European Commission, Directorate General for Economic and Financial Affairs.
Andrés, J. (2009). España y los desequilibrios globales. In FEDEA, La crisis de la economía española: lecciones y propuestas. Sociedad Abierta – Fedea, 5-11. In internet: <http://www.crisis09.es/ebook/>
Astarita, R. (2010). Economía política de la dependencia y el subdesarrollo. Buenos Aires: Universidad Nacional de Quilmes Editions.
Bellod, J.F. (2007). Crecimiento y especulación inmobiliaria en la economía española. Principios: Estudios de Economía Política 8, 59-84
_____ (2009). El precio de la vivienda y la inflación en España. El Trimestre Económico LXXVI(302), 379-405

BoS (2008): Survey of Household Finances. Madrid: Bank of Spain
_____ (2009). Annual report. Madrid: Bank of Spain
_____ (2016a). Statistical Bulletin. Madrid: Bank of Spain
_____ (2016b). Economic Indicators. Madrid: Bank of Spain
_____ (2016c). Summary Indicators. Madrid: Bank of Spain
_____ (2016d). Central balance sheet data. Madrid: Bank of Spain
BSE (2016). Protección social, Barómetro Social de España. Colectivo Ioé
Carchedi, G. (1997). The EMU, monetary crises, and the single European currency. Capital & Class, 21(3), 85-114
_____ (2011). Behind the crisis: Marx's dialectic of value and knowledge. London: Haymarket.
Clarke, S. (1994). Marx’s theory of crisis. New York: St. Martin's Press.
Cuadrado J.R. and A. Maroto (2012). El problema de la productividad en España: causas estructurales, cíclicas y sectoriales. Madrid: FUNCAS. In internet: <http://www.funcas.es/publicaciones/Sumario.aspx?IdRef=9-08013>
Desai, R. (2013). Geopolitical economy after US hegemony, globalization and empire. London: Pluto Press
Dunn, B. (2012). Marx’s method and the global crisis. International Critical Thought 2(3), 362–74
Estrada, A; Jimeno, J. F. and J. L. Malo de Molina (2009). La economía española en la UEM: los diez primeros años. Occasional Papers 0901, Bank of Spain
EU-KLEMS (2012). EU KLEMS database. EU KLEMS growth and productivity accounts: data in the ISIC Rev. 4 industry classification
FBBVA (2015). El stock y los servicios del capital en España y su distribución territorial y sectorial (1964-2013). Madrid: Fundación BBVA/Ivie
Febrero, E. and F. Bermejo (2012). Spain during the Great Recession. Teetering on the brink of collapse. Working Paper, 2012/3. University of Castilla-La Mancha
Foley, D. (1986). Understanding Capital. Marx's economic theory. Cambridge, MA: Harvard University Press
Freeman, A. (1999). Crisis and the poverty of nations: two market products which value explains better. Historical Materialism 5(1), 29-76
_____ (2016). Booms, depressions and the rate of profit: a pluralist, inductive guide. In T. Subasat (ed.), The great financial meltdown. Systemic, conjunctural or policy created? Northampton MA: Edward Elgar, 73-96
García, N. (2014). Las causas de la doble recesión de España en 2008-2013. In Norberto García and Santos Ruesga (coord..), ¿Qué ha pasado con la economía española? Madrid: Pirámide, 29-54
Gill, L. (1996). Fundamentos y límites del capitalismo. Madrid: Trotta, 2002

Grossman, H. (1929). The law of accumulation and breakdown of the capitalist system: being also a theory of crises. London: Pluto, 1992.
Guamán, A. and H. Illueca (2012). El huracán neoliberal. Una reforma laboral contra el trabajo. Madrid: Sequitur.
Kliman, A. (2015). The Great Recession and Marx’s crisis theory. American Journal of Economics and Sociology 74(2), 236-77
Maluquer, J. (2014). La economía española en perspectiva histórica. Barcelona: Pasado y Presente.
Marx, K. and F. Engels. Marx & Engels collected works (MECW), 50 vols. London: Lawrence & Wishart, 2010.
Mateo, J.P. (2007). La tasa de ganancia en México (1970-2003). Ph.D. Thesis, Complutense University of Madrid.
_____ (2015). Heterodox controversies on the Great Recession: (neo)Marxists, post-Keynesians and radicals, unpublished document, The New School.
_____ (2017). The long depression in the Spanish economy: bubble, profits and debt. In G. Carchedi and M. Roberts (eds.), The world in crisis. Winchester, UK & Washington, USA: Zero Books, pp. 330-365 (forthcoming)
Mateo, J.P. and M. Montanyà (2017). The capital accumulation model of the Spanish economy: profitability, housing bubble and sectoral imbalances. In L. Buendía and R. Molero (coords), The political economy of contemporary Spain: from miracle to mirage. London: Routledge (forthcoming)
Mattick, P. (1974). Economic crisis and crisis theory. New York: M.E. Sharpe, 1980.
MPW (2016). Información estadística. Valor tasado de la vivienda. Madrid: Ministry of Public Works and Transport.
Muñoz de Bustillo, R. (2014). La crisis del nunca acabar. El comportamiento macroeconómico español 2008-13. In N. García and S. Ruesga (coord.), ¿Qué ha pasado con la economía española? Madrid: Pirámide, 55-82.
Nieto, M. (2015). Cómo funciona la economía capitalista. Madrid: Escolar y Mayo.
NSO (2004). National Accounts. Accounting series 1995-2003. Madrid: National Statistical Office
_____ (2016a). Annual Spanish National Accounts. Base 2010. Main results 1995-2015. Madrid: National Statistical Office
_____ (2016b). Non-financial accounts of the institutional sectors (1999-2015). Integrated annual accounts of the institutional sectors. Madrid: National Statistical Office
_____ (2016c). Quarterly Spanish National Accounts. Base 2010. Madrid: National Statistical Office
_____ (2016d). Central business register: statistical use. Madrid: National Statistical Office
_____ (2016e). Economically active population survey. Madrid: National Statistical Office

OECD (2016). OECD.Stat. Paris: Organization for Economic Co-operation and Development
Pérez, F. (dir.) (2013). Crecimiento y competitividad. Los retos de la recuperación. Valencia: Fundación BBVA-Ivie, October 18
Potts, N. (2011). Marx and the crisis. Capital & Class 35(3), 455-73
Roberts, M. (2010). The causes of the Great Recession: mainstream and heterodox interpretations and the cherry pickers. Annual Conference of Heterodox Economists, Bourdeaux, July
_____ (2016a). The long depression: how it happened, why it happened, and what happens next. London: Haymarket.
_____ (2016b). Monocausality and crisis theory: a reply to David Harvey. In T. Subasat (ed.), The great financial meltdown. Systemic, conjunctural or policy created? Northampton MA: Edward Elgar, 55-72
Rodríguez, E. and I. López (2011). Del auge al colapso. El modelo financiero-inmobiliario de la economía española. Revista de Economía Crítica 12, 39-63
Sawyer, M. (1985). The economics of Michał Kalecki. Armonk (NY): M.E. Sharpe.
Shaikh, A. (1990). Valor, acumulación y crisis: ensayos de economía política. Tercer Mundo Editions, Bogota, 1991.
_____ (2016). Capitalism: competition, conflict, crises. New York: Oxford University Press
Smith, T. (1999). Brenner and crisis theory: issues in systematic and historical dialectics. Historical Materialism 5(1): 145-78.
Sotiropoulos, D.; Milios, J. and S. Lapatsioras (2013). A political economy of contemporary capitalism and its crisis: demystifying finance. London: Routledge
Torres, J. (2009). Crisis inmobiliaria, crisis crediticia y recesión económica en España. Papeles de Europa 19, 82-107
Vara, Ó. (2009). Causas de la crisis financiera en el caso español. Cuadernos de Economía 32(88), 141-58.
Appendix. Methodological questions
Variables correspond to productive sectors, so excluding finance, real estate, government and social services, unless otherwise specified.
Profit rate (r)= profit/capital (P/K)
𝑟𝑟 =𝑞𝑞 − 𝑤𝑤𝑟𝑟𝜃𝜃
∙𝑃𝑃𝑘𝑘𝑃𝑃𝑦𝑦
Where output (new value) (Y): wages (W) + gross profits (p) + indirect taxes (T) (NSO 2016a); profit (P): gross profits net of indirect taxes, but without adjustment for mixed income or consumption of fixed capital (NSO, 2916a) because statistical difficulties (see NSO 2004, 2016b,
OECD, 2016), unless otherwise noted; P*: mass of profits using the stock of capital price deflator (Pk); labor productivity (q= Y*/Lt): new value at constant prices (Y*) of total equivalent labor (Y*/Lt); real wage (wr), deflated by the new value price index (Py); Capital (K): non-residential net fixed stock of capital of the previous year (Kt-1), according to FBBVA (2015), which does not provide the measure in gross terms, at current prices (K) and constant prices (K*); 𝜃𝜃=K*/Lt, technical composition of capital (however, it is not used because of statistical inconsistencies, following Shaikh 2016), instead, composition of capital ≈ capital-output ratio (K/Y).