Thematic analysis · Thematic analysis Aquaculture 7 Low yields (
139
Thematic analysis Aquaculture
Transcript of Thematic analysis · Thematic analysis Aquaculture 7 Low yields (

Thematic analysis
Aquaculture

Thematic analysis Aquaculture 2
List of Contents General ...................................................................................................................................... 3
1. Thematic analysis .................................................................................................................. 3
1.1 Farms by pond type and water surface ............................................................................. 4
1.2 Types and species of aquaculture organisms ................................................................... 4
1.3 Aquaculture Farms on the basis of water surface ............................................................. 5
1.4 Yields of aquaculture farms .............................................................................................. 6
1.5 Production of aquaculture farms by type and species ....................................................... 7
1.6 Water source of the aquaculture companies ..................................................................... 8
1.7 The cultivation medium of aquaculture companies............................................................ 9
1.8 Aquaculture products .......................................................................................................10
1.9 Broodstock of aquaculture farms .....................................................................................11
1.10 Marketing method of aquaculture farms .........................................................................12
1.11 Markets for aquaculture farms .......................................................................................13
1.12 The use of feed sources on aquaculture farms ..............................................................13
1.13 Energy use on aquaculture farms ..................................................................................13
Sources:....................................................................................................................................14
Appendix 1: ...............................................................................................................................16
Appendix 2: ...............................................................................................................................17
Appendix 3: ...............................................................................................................................18

Thematic analysis Aquaculture 3
General
The number of aquaculture companies in Suriname is 63 with a total of 65 ponds (4 in
rice paddies, 4 concrete ponds, 55 earthen ponds, and 2 other). Of the total land
available for agricultural production (63,989.48 ha) only in 4% (2,296.11 ha) is used for
aquaculture. Suriname does not have an aquaculture tradition as is the case in other
agricultural branches such as livestock breeding and rice cultivation. Aquaculture
products were initially a byproduct of irrigation sources in agriculture/ horticulture and
animal husbandry.
Of the total production on the baseline day of aquaculture products fish occupies 2%
with 5,451 kg. While the majority of the production 3,070,070 (98%) consists of shrimp.
Shrimp are produced on an industrial scale by 2 farms that have specialized in their
breeding. The other farms are small family farms that started in aquaculture as an initial
phase to growing into large aquaculture farms.
The most important water sources that can be used by aquaculture companies are:
- river/canal (33 companies (51%)) - lake/swamp (14 companies (22%)) - groundwater (11 companies (17%))
As most important breeding medium 80% of the companies used freshwater and 6%
brackish water.
For as far as the most important markets are concerned for the produce, 74% of the
farms sells on the local market and 3% exports.
1. Thematic analysis.
The results of the census are brought together in tables. Below the data from these
tables are analyzed. The analysis per table are elaborated in the next chapter.

Thematic analysis Aquaculture 4
1.1 Farms by pond type and water surface
From table 1 (see Appendix 1) appears that 85% of the aquaculture farms have earthen
ponds. This can be explained by the fact that the construction costs for the construction
of concrete ponds are very high. The construction of earthen ponds also involves a lot
of earthworks and thus high costs. Tanks and cages are not used. Cultivating
aquaculture organisms in tanks and cages requires a high degree of knowhow and
investment. The use of tanks and cages is mostly found in countries where there are
limited opportunities for the construction of ponds. That is not the case in Suriname.
Furthermore, in Nickerie 2 types of ponds are found with a dualistic character, more in
particular rice-fish culture. This type of cultivation system both yields fish and rice as a
harvest and is very interesting for the small rice farmer. The Underdirectorate Fisheries
had an ongoing project in the period 2004/2005 in cooperation with the FAO to promote
this cultivation system (ODVIS, Aquaculture Department). The focal region was
Nickerie, as rice cultivation has been engaged in on a large scale of old.
1.2 Types and species of aquaculture organisms
Table 2: Number Aquaculture Farms by type and species by District on the day baseline day
DISTRICT
TYPE EN SOORT
VIS GARNALEN
KWI-KWI TILAPIA SIERVISSEN ANDERE P.VANNAMEI ANDERE
PARAMARIBO
WANICA 7 2 2 5 2
NICKERIE 29 10 1 12 1
CORONIE 3
SARAMACCA 1 1
COMMEWIJNE 2 2 1 2 1 1
MAROWIJNE
PARA 2 1 2 3
TOTAAL KUSTVLAKTE
44 16 6 23 3 2
Source : Static data Fifth Agricultural census
From table 2 appears that 95% of the total of the aquaculture companies has fish
species as the cultivation organism. The choice of fish over the cultivation of shrimp can
be found in the fact that there is little broodstock for shrimp available for small
aquaculture farmers. Shrimp broodstock would have to be imported from abroad. In
Suriname there are no hatcheries for the production of shrimp broodstock. The
production of shrimp broodstock, especially P. vannamei in Suriname has as setback
the high sediment dissolution in the sea water in front of our coast. For establishing a
hatchery for shrimp species such as P. vannamei, the first requirement is clear and

Thematic analysis Aquaculture 5
clean seawater. The large specialist companies that import broodstock, would
apparently be able to provide the small farmers with broodstock, so that shrimp farming
by small farmers can be promoted. An umbrella organization would have to arrange the
necessary contacts and take the initiative.
Furthermore, table 2 shows that the share of kwi kwi (Hoplosternum littorale) is 47% of
all cultivated fishes. This fish is an armor-plated catfish that does well in Surinamese
swamps and can easily survive low oxygen content of the water. The reproduction of
this fish in captivity is simple to initiate, so that relatively a lot of broodstock of this type
of fish is available. It is also easy to collect broodstock from swamps. H. littorale is a
much appreciated fish and considered a delicacy in Suriname among all ethnic groups.
Locally H. littorale has a good market and price.
1.3 Aquaculture Farms on the basis of water surface
Table 3: Number of aquaculture farms by size (water surface) in categories on the baseline day
DISTRICT TOTAL
NUMBER OF FARMS
TOTAL SIZE (WATER SURFACE) IN CATEGORIES (HA)
< 2 2 - < 5 5 - < 50 ≥ 50 NOT
MENTIONED
PARAMARIBO
WANICA 16 15 1
NICKERIE 29 27 1 1
CORONIE 3 2 1
SARAMACCA 1 1
COMMEWIJNE 8 6 1 1
MAROWIJNE 1 1
PARA 5 5
TOTAL COASTAL PLAIN
63 56 2 2 3
Source : Statistic data Fifth Agricultural census
Table 3 shows that 89% of all aquaculture farms have a size of less than 2 ha. Two of
the companies have a pond surface between the 2 and 5 ha, while 2 companies have a
surface between 5 and 50 ha. From the data in Tables 1 (see Appendix 1) and 2 can be
concluded that many more small companies are busy with aquaculture.
Furthermore, it appears that most farms, 46% of the total, are located in Nickerie. The
construction of the ponds from old rice paddies requires relatively fewer costs. Nickerie
further has a better climate for earthworks and further infrastructural works for rice
cultivation that can easily be used for aquaculture. The project of the Ministry of LVV

Thematic analysis Aquaculture 6
(ODVIS) in cooperation with the FAO also had its impact on promoting aquaculture in
Nickerie.
1.4 Yields of aquaculture farms
Table 4: Number of aquaculture companies by average yield (kg/ha/year) in categories per district
DISTRICT
TOTAL NUMBER
OF FARMS
AVERAGE YIELD IN CATEGORIES (KG/HA/YEAR)
LOW [<1000 KG/HA/YEAR]
MEDIOCRE [1000 - 5000
KG/HA/YEAR]
HIGH [>5000 KG/HA/YEAR]
NOT MENTIONED
PARAMARIBO 0
WANICA 16 12 4
NICKERIE 29 23 4 1 1
CORONIE 3 2 1
SARAMACCA 1 1
COMMEWIJNE 8 4 1 3
MAROWIJNE 1 1
PARA 5 4 1
TOTAL COASTAL PLAIN
63 47 5 2 9
Source : Static data Fifth Agricultural census
Table 4 shows that most (almost 75%) of the aquaculture companies have a yield of
less than 1000 kg/ha/yr. On the basis of their yield and from an aquaculture technical
viewpoint these farms can be classified as extensive farms. Extensive farms are farms
that try to achieve a high profit with a minimum input from an aquaculture enterprise.
These companies invest minimally in knowledge and input such as fodder, aeration to
the cultivation medium, etc.
Characteristics of extensive farms are:
Use of large earthen ponds (0 - 100 ha)
Low water replacement (0 - 5% per day)
Low fish density (less than 5 individuals per m²)
No artificial aeration
Little or no fertilization
Low labor input and low production costs (< 1 arbeider/10 ha)

Thematic analysis Aquaculture 7
Low yields (<1000 kg/ha/year)
Low investments
Hardly any application of technology and no additional fodder.
There are 5 farms with an average yield of between 1000 and 5000 kg/ha/yr.
Relatively these farms are more intensive than the other 75%. These farms have a
greater input. These farms can be categorized as semi-intensive farms. The
characteristics of semi-extensive farms are:
Small to medium-sized earthen ponds (0 - 20 ha)
Moderate water replacement (5 - 20% per day)
Medium fish density (5 - 25 individuals per m²)
Partial or continuous aeration
Fertilization
Moderate labor input and production costs (1 - 5 laborers/10 ha)
Moderate investments
Limited technology and additional to complete feeding
Moderate yields (1000 - 5000 kg/ha/year).
There are 2 farms that have a yield of 5000 kg and more per ha per year. On the
basis of their yield and from an aquaculture technical viewpoint these farms can be
classified as intensive farms. In intensive farms a reasonable level of knowhow and
inputs are invested in the company. Characteristics of intensive farms are:
Small dressed ponds (0.1 - 2 ha) or supply canals or tanks
High degree of water replacement (25 - 100% per day)
Large fish density (> 25 individuals /m²)
Partial or continuous aeration
High labor and production costs (1 - 3 laborers/10 ha)
Significant application of technology and use of complete balanced feed (containing all nutrients)
Important investments
High yields (>5000 kg/ha/year)
1.5 Production of aquaculture farms by type and species
Table 5: Estimated quantity by type and species per district on the baseline day
DISTRICT
TYPE AND SPECIES
FISH SHRIMP
KWI KWI TILAPIA ORNAMENTAL
FISH OTHER P.VANNAMEI OTHER
KG PCS. KG PCS. KG PCS. KG PCS. KG PCS. KG PCS.
PARAMARIBO

Thematic analysis Aquaculture 8
WANICA 2 504 50 545 1
NICKERIE 56 48.06 9 2.39 236 1,241 70
CORONIE 1 2
SARAMACCA 1 1
COMMEWIJNE 380 4 60 300 800 3,000,000 70
MAROWIJNE
PARA 200 50 1 150 1,016
TOTAL COASTAL PLAIN
1 54 4,009 63,744 1 386 4,702 3,000,000 1 70070
Source : Static data Fifth Agricultural census
This shows that P. vannamei is the most produced species. Approximately 3000 ton
This represents 98% of the total production of the sector. P.vannamei is being produced
by 2 companies that focus on the (semi)-intensive method. The majority of the
companies focuses on the cultivation of fish with much lower yields (2% of the total).
Table 6: Quantity produced in the last three months by type and species per district
DISTRICT
TYPE AND SPECIES
FISH SHRIMP
KWI KWI TILAPIA ORNAMENTAL
FISH OTHER P.VANNAMEI OTHER
KG PCS. KG PCS. KG PCS. KG PCS. KG PCS. KG PCS.
PARAMARIBO
WANICA 560 800 160 9
NICKERIE 50 11.39 400 60
CORONIE 100
SARAMACCA 400 500
COMMEWIJNE 162 2 60 610 9 150
MAROWIJNE
PARA 50
TOTAL COASTAL PLAIN
150 12,512 2 860 50 400 1.33 9 9 150
Source : Statistic data Fifth Agricultural census Table 6 indicates that in the past three months of the census shrimp of the P. vannamei
species were produced most. This shrimp species represents almost 77% of the total
weight of produced aquaculture products over a period of 3 months.
1.6 Water source of the aquaculture companies
Table 7: Number of aquaculture farms according to most important water source per district in 2008

Thematic analysis Aquaculture 9
DISTRICT TOTAL FARMS
MOST IMPORTANT WATER SOURCE
RIVER / CHANN
EL
LAKE/ SWAMP
GROUND WATER
SEA OTHER NOT
MENTIONED
PARAMARIBO
WANICA 16 5 4 4 3
NICKERIE 29 25 3 1
CORONIE 3 3
SARAMACCA 1 1
COMMEWIJNE 8 1 1 5 1
MAROWIJNE 1 1
PARA 5 1 2 1 1
TOTAL COASTAL PLAIN
63 33 14 11 4 1
Source : Statistic data Fifth Agricultural census
Table 7 shows that most companies (53%) use a river or channel as most important water source. The company is made or broken by the quality and quantity of the water source. The medium of cultivation is of the utmost importance for the company.
Second place as water source is the swamp/lake. The quality of the water in a swamp/
lake is less in comparison with a larger dynamic water source such as a river or canal.
Swamp water has a relatively lower content of dissolved oxygen. For organisms that
have a great need of dissolved oxygen in the water, this source is not suitable unless
the quality of the water is improved by aeration, biofiltration, etc. Almost 22% have a
swamp/ lake as most important water source.
Other types of water sources are less used (groundwater 17%). Ground water also is of
lesser quality in comparison with other water sources. The quality depends on the
location of the source.
The sea as water source is not used by any company. Apparently the companies are
not located near the sea. Seawater in front of the coast of Suriname has a high content
of dissolved sediment. This means that the direct use of seawater in aquaculture ponds
could lead to the ponds becoming shallow because of the high sedimentation. Not all
types of organism can support water with a high salinity and sediment content.
1.7 The cultivation medium of aquaculture companies
Table 8. Number of aquaculture farms according to cultivation medium per district in 2008
DISTRICT TOTAL CULTIVATION MEDIUM

Thematic analysis Aquaculture 10
FARMS FRESH WATER
BRACKISH WATER
SEA OTHER NOT
MENTIONED
PARAMARIBO
WANICA 16 12 2 2
NICKERIE 29 27 1 1
CORONIE 3 2 1
SARAMACCA 1 1
COMMEWIJNE 8 5 1 1 1
MAROWIJNE 1 1
PARA 5 4 1
TOTAL COASTAL PLAIN
63 52 4 5 2
Source : Static data Fifth Agricultural census
From table 8 appears that 83% of the farms use freshwater as the cultivation medium,
followed by 8% of the total that uses another cultivation medium. The cultivation
medium depends on the type of organism that is being cultivated. As most companies
raise fish (H. littorale and Tilapia), use is also made of freshwater as cultivation medium
as both are freshwater fishes. Tilapia could also survive in brackish water up to a
content of 15 ppt. The reproduction, however, takes place in freshwater.
The breeding of P.vannamei shrimps takes mainly place in brackish water. The
companies that focus on raising this shrimp species (the large aquaculture companies)
use brackish water as cultivation medium. The range of salinity content for this species
strongly varies from freshwater to even saltwater.
1.8 Aquaculture products
Table 9: Number of aquaculture farms according to most important aquaculture product per district in 2008
DISTRICT
TOTAL FARMS
MOST IMPORTANT AQUACULTURE PRODUCT
FISH SHRIMP BROODSTOC
K (FISH FRY)
OTHER NOT
MENTIONED
PARAMARIBO 0
WANICA 16 14 2

Thematic analysis Aquaculture 11
NICKERIE 29 26 3
CORONIE 3 3
SARAMACCA 1 1
COMMEWIJNE 8 5 1 1 1
MAROWIJNE 1 1
PARA 5 5
TOTAL COASTAL PLAIN
63 55 1 2 4 1
Source : Static data Fifth Agricultural census
The table shows that most aquaculture farms (87% of the total) have fish as most
important aquaculture product. Very important is the information that only 2 companies
(3%) have specialized in the production of broodstock. Such companies are called
hatcheries and are very important for the further development of the sector. One of the
important inputs in the aquaculture sector is the use of high-quality broodstock in the
ponds. In general it is true that the broodstock strongly determines the output upon
harvesting. The production of broodstock is a specialist task and requires a lot of
knowhow. To further stimulate aquaculture such hatchery farms should be stimulated.
This situation can be compared to the poultry sector. There are thousands of breeders
that are supplied by specialized firms with chicks. The breeders are not occupied with
the production of chicks, but especially focus on the production of the final product. The
same system should be promoted in the aquaculture sector.
1.9 Broodstock of aquaculture farms
Table 10: Number of aquaculture farms according to most important source of broodstock per district in 2008
DISTRICT TOTAL FARMS
MOST IMPORTANT SOURCE FOR BROODSTOCK (FISH FRY)
OWN PRODUCTIO
N
PURCHASE
WILD CAUGHT
FISH OTHER
NOT MENTIONED
PARAMARIBO
WANICA 16 9 3 3 1
NICKERIE 29 13 7 8 1

Thematic analysis Aquaculture 12
CORONIE 3 1 2
SARAMACCA 1 1
COMMEWIJNE 8 5 1 1 1
MAROWIJNE 1 1
PARA 5 4 1
TOTAL COASTAL PLAIN
63 33 12 14 3 1
Source : Static data Fifth Agricultural census
Table 10 shows that most aquaculture farms (52%) produce their own broodstock.
Approximately 22% has to resort to wild catch while 19% of the farms purchase their
own brood. As stated earlier in Paragraph 1.8 broodstock of a high quality is one of the
most important inputs for the aquaculture farm. Companies that produce their own
broodstock could in case of good availability of broodstock on the market, invest their
energy in raising the aquaculture organisms that they breed.
Harvesting broodstock from the wild is accompanied by a population decline of aquatic
organisms in nature. With this method one strongly depends on the seasons and market
demand can not be met in case of using broodstock in raising ponds. The broodstock
from nature has in most cases a high genetic quality. There are always risks associated
to parasites and other disease-causing organisms that are introduced into the farm
together with the broodstock.
1.10 Marketing method of aquaculture farms
Table 11: Number of aquaculture farms according to most important marketing procedure per district in 2008
DISTRICT TOTAL FARMS
MOST IMPORTANT MARKETING PROCEDURE
LOCAL EXPORT NOT MENTIONED
PARAMARIBO 0 .
WANICA 16 12 4
NICKERIE 29 25 2 2
CORONIE 3 1 2

Thematic analysis Aquaculture 13
SARAMACCA 1 1
COMMEWIJNE 8 6 2
MAROWIJNE 1 1
PARA 5 3 2
TOTAL COASTAL PLAIN
63 48 2 13
Source : Static data Fifth Agricultural census
The table shows that most aquaculture companies (76%) sell their produce. The
P.vannamei shrimps are mostly exported. Based on the fact that shrimp constitute the
larger part of the production in the sector, it can be stated that the larger part of the
production is exported. Companies that mainly focus on fish breeding sell their product
locally. The demand for fish products on the local market is great considering the high
prices that are paid for certain fishes, such as kwi kwi (H.littorale).
1.11 Markets for aquaculture farms
Table 12 (see Appendix 2) shows that all 8 markets are equally important.
1.12 The use of feed sources on aquaculture farms
Table 13 (see Appendix 3) shows that aquaculture farms that use local and imported feed sources is equal to 50% to 50%. The choice of using a local feed source has to do with price and quality of the feed. Locally fish feed is available.
1.13 Energy use on aquaculture farms
Table 14: Number of aquaculture farms according to most important energy source per district in 2008
DISTRICT
MOST IMPORTANT ENERGY SOURCE
GOVERNMENT GENERATOR OTHER
PARAMARIBO
WANICA 1
NICKERIE 1 1
CORONIE
SARAMACCA

Thematic analysis Aquaculture 14
COMMEWIJNE 1
MAROWIJNE
PARA 1
TOTAL COASTAL PLAIN
3 1 1
Source : Static data Fifth Agricultural census
Table 14 shows that 3 of the companies use the government as the most important
source of energy. The government is much cheaper as source of energy in comparison
with the use of a generator. The companies that use a generator do not have the
possibility to be connected to the grid.
Sources:
Report: Doorrekening Fiscale voorzieningen voor de agrarische sector (2008).
Annual Reports LVV: 2005, 2006, 2007, 2008.
Agricultural Statistics 2004 - 2009
Statistical Analysis Fifth Agricultural Census Suriname 2008

Thematic analysis Aquaculture 15

Thematic analysis Aquaculture 16
Appendix 1:
Table 1: Number of aquaculture farms by type of pond and water surface of the ponds in categories (m²) per district on the baseline day.
DISTRICT
TYPE OF POND AND WATER SURFACE OF THE PONDS IN CATEGORIES (M²)
EARTHEN PONDS CONCRETE PONDS TANKS CAGES RICE PADDIES OTHER
<5
0
50
-2
49
25
0 -
99
9
10
00
-1
99
9
≥20
00
<5
0
50
-2
49
25
0 -
99
9
10
00
-1
99
9
≥20
00
<5
0
50
-2
49
25
0 -
99
9
10
00
-1
99
9
≥20
00
<5
0
50
-2
49
25
0 -
99
9
10
00
-1
99
9
≥20
00
<5
0
50
-2
49
25
0 -
99
9
10
00
-1
99
9
≥20
00
<5
0
50
-2
49
25
0 -
99
9
10
00
-19
99
≥20
00
PARAMARIBO
WANICA 8 2 1 2 1 2
NICKERIE 4 10 9 2 1 2
CORONIE 1 1 1
SARAMACCA 1
COMMEWIJNE 1 4 2 1 1
MAROWIJNE 1
PARA 1 1 2 1 2
TOTAL COASTAL PLAIN
6 26 15 1 7 2 1 1 2 2 2
Source : Statistic data Fifth Agricultural census

Thematic analysis Aquaculture 17
Appendix 2:
Table 12: Number of aquaculture farms according to market per district and percentage categories of the total production in 2008
DISTRICT PERCENTAGE CATEGORIES
(%)
TYPES OF MARKETS
SUPERMARKET/ STORES
RESTAURANTS/ HOTELS
OWN CONSUMPTION/
GIFT PROCESSORS
SOLD BY
THE ROAD
PET SHOP
INTERMEDIARY OTHER
PARAMARIBO
0-25
26-50
51-75
76-100
WANICA
0-25 1 2 1 2 2 2 2 1
26-50 1
51-75 1
76-100 1
NICKERIE
0-25 5 6 2 6 5 6 6 5
26-50 1
51-75 1 1
76-100 3 1
CORONIE
0-25 1 1 1 1 1 1 1
26-50
51-75
76-100 1
SARAMACCA
0-25 1 1 1 1 1 1 1
26-50
51-75
76-100 1
COMMEWIJNE
0-25 1 1 1 1 1 1
26-50 1 1
51-75
76-100
MAROWIJNE
0-25
26-50
51-75
76-100
PARA
0-25 1 1 1 1 1 1 1
26-50
51-75
76-100 1
TOTAL 0-25 9 11 7 12 11 12 11 8
COASTAL PLAIN 26-50 1 1 2
51-75 2 1

Thematic analysis Aquaculture 18
76-100 4 1 1 2
Source : Statistic data Fifth Agricultural census
Appendix 3:
Table 13: Number of aquaculture farms according to feed source per district and percentage categories of local/ import feed source in 2008
DISTRICT PERCENTAGE CATEGORIES (%) FEED SOURCE
LOCAL IMPORT
PARAMARIBO
0-25
26-50
51-75
76-100
WANICA
0-25 4
26-50
51-75
76-100 4
NICKERIE
0-25 5
26-50
51-75
76-100 5
CORONIE
0-25
26-50
51-75
76-100
SARAMACCA
0-25
26-50
51-75
76-100
COMMEWIJNE
0-25 1 2
26-50
51-75
76-100 2 1
MAROWIJNE
0-25 1
26-50
51-75
76-100 1
PARA
0-25 1 3
26-50
51-75
76-100 3 1
TOTAL COASTAL PLAIN
0-25 2 15
26-50
51-75

Thematic analysis Aquaculture 19
76-100 15 2
Source : Statistic data Fifth Agricultural census

Thematic analysis
Labor & Mechanization

List of Contents General .......................................................................................................................................................... 1
1 Labor ..................................................................................................................................................... 2
1.1 The coastal plain ................................................................................................................................. 3
1.1.1 Farmers according to highest education and gender ...................................................................... 3
1.1.2 Number of hours worked per week ................................................................................................. 3
1.1.3 Contribution of household members to the agricultural farm ........................................................ 5
1.1.4 Contracted labor on the farms ......................................................................................................... 6
1. 2. The interior ........................................................................................................................................ 9
1.2.1 Farmers according to highest education and gender ...................................................................... 9
1.2.2 Number of hours worked per week ................................................................................................. 9
1.2.3 Contribution of household members to the agricultural farm ...................................................... 10
1.2.4 Contracted labor on the farms ....................................................................................................... 11
2. Mechanization ........................................................................................................................................ 12
2.1 The coastal plain ............................................................................................................................... 12
2.1.1 The number of machines and utensils according to age and type ................................................ 12
2.1.2 The number of machines and utensils according to age and type ................................................ 12
2.1.3 Number of machines / utensils according to title or origin per type ............................................ 12
2.1.4 Number of operators according to gender per type of machine or utensil .................................. 13
2.1.5 The number of machines and utensils according to type per district ........................................... 13
2.1.6 Number of machines and utensils according to use per district ................................................... 14
2.2The interior ........................................................................................................................................ 15
2.2.1 The number of machines and utensils according to age and type ................................................ 15
2.2.2 The number of machines and utensils according to use per type ................................................. 16
2.2.3 Number of machines and utensils according to title or origin per type ........................................ 17
2.2.4 Number of operators according to gender per type of machine or utensil .................................. 18
2.2.5 Number of machines and utensils according to type per district .................................................. 19
2.2.6 Number of machines and utensils according to use per district ................................................... 19
Sources: ....................................................................................................................................................... 20
Appendix 1: ................................................................................................................................................. 21
Appendix 2: ................................................................................................................................................. 22
Appendix 3: ................................................................................................................................................. 23
Appendix 4: ................................................................................................................................................. 25
Appendix 5: ................................................................................................................................................. 27
Appendix 6: ................................................................................................................................................. 29
Appendix 7: ................................................................................................................................................. 31

Thematic Analysis Labor & Mechanization 1
General
There are 10,234 farms in Suriname with a total area of 63,989.48 hectares. Most farms are
found in the coastal plain, namely 6,886 (about 67%) with a total area of 61,197.23 hectares
(approximately 96%). Four of these farms have no land.
Of these farms:
- 10,188 are family farms - 25 are corporate farms - 9 are government farms - 3 are institutes / institutions - 9 are other
Figure 1.1 – Number of companies according to management structure
Figure 1.2 – Gender ratio within the household
The number of persons within the household of farmers is 42,193, of which:
- 21,485 (51%) men - 20,708 (49%) women

Thematic Analysis Labor & Mechanization 2
1. Labor
The total number of contract labor is 8,656 of which 6,592 (76%) men and 2,064 (24%) women.
A division of men employed can be provided as follows:
- 46% permanently employed - 5% semipermanently employed - 49% temporarily employed
A division of women employed can be provided as follows:
- 60% permanently employed - 8% semipermanently employed - 32% temporarily employed.
The results of the census in the coastal plain and the interior in respect of labor are processed in
tables. Below the data from these tables are analyzed. The analyses per table are elaborated in
Chapters 1.1 and 1.2. This involves analyses about education, gender, number of hours worked,
the contribution of household members and contracted labor.

Thematic Analysis Labor & Mechanization 3
1.1 The coastal plain
1.1.1 Farmers according to highest education and gender
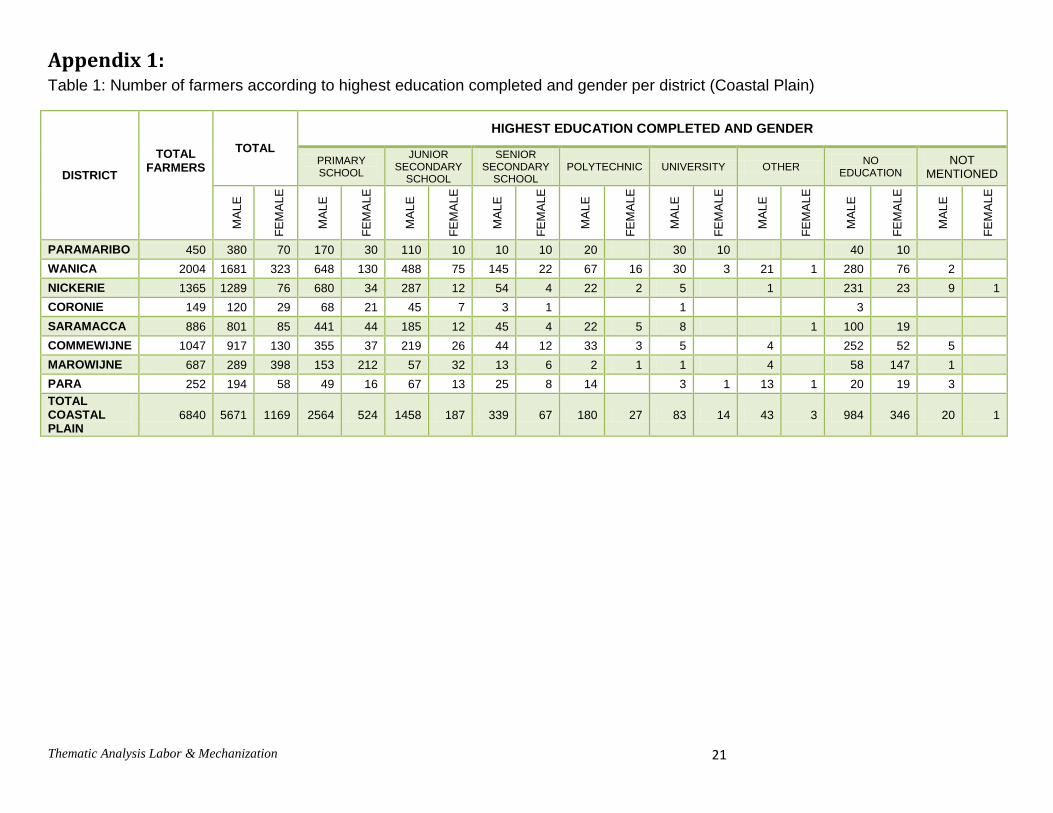
Table 1 of Annex 1 indicates that in the coastal plain, most farmers (45%) enjoyed primary school education as the highest level of education. It should be noted that of the farmers who have received a university education, the vast majority (41%) lives in the District of Paramaribo, followed by the District of Wanica (34%).
1.1.2 Number of hours worked per week
In this paragraph an analysis is made of the number of farmers according to the average number of hours worked per week on the farm in 2008 and according to gender per district. These figures are included in Table 1. Table 1 -Number of farmers according to the average number of hours worked per week on the
farm in 2008 and according to gender per district
DISTRICT TOTAL
FARMERS
TOTAL
AVERAGE NUMBER OF HOURS WORKED PER WEEK AND BY GENDER
<=7 HOURS/WK
8-20 HOURS/WK
>20 HOURS/WK
DOES NOT WORK ON THE FARM
NOT MENTIONED
MALE FEMALE MALE FEMALE MALE FEMALE MALE FEMALE MALE FEMALE MAL
E FEMAL
E
PARAMARIBO 450 380 70 110 20 160 30 90 10 10 10 10
WANICA 2,004 1,681 323 495 93 485 94 503 56 193 80 5
NICKERIE 1,365 1,289 76 274 27 379 13 537 10 81 20 18 6
CORONIE 149 120 29 35 16 30 5 38 1 17 7
SARAMACCA 886 801 85 197 22 296 27 287 24 21 12
COMMEWIJNE 1,047 917 130 365 61 329 37 179 14 40 18 4
MAROWIJNE 687 289 398 79 70 110 180 96 140 4 7
1
PARA 252 194 58 27 6 51 16 104 29 10 7 2
TOTAL COASTAL PLAIN
6,840 5,671 1,169 1,582 315 1,840 402 1,834 284 376 161 39 7
Source : Statistic data Fifth Agricultural census Table 1 shows that the majority of farmers, i.e. 33% of the total number of farmers, both men and women work 8-20 hours per week on the farm. Then 31% of the total number of farmers work more than 20 hours per week on the farm. Agriculture is thus mainly practiced as a part-time activity. It cannot be derived from the table what type of work is practiced. In the coastal plain more men are active in the agricultural sector.

Thematic Analysis Labor & Mechanization 4
Furthermore, an analysis of the number of farmers according to the average number of hours
worked per week and according to gender per most important economic activity in 2008 is also
important. This is provided in Table 2 below.
Table 2 - Number of farmers according to the average number of hours worked per week and according to gender per most important economic activity in 2008
MOST IMPORTANT ECONOMIC ACTIVITY
TOTAL FARMERS
TOTAL
AVERAGE NUMBER OF HOURS WORKED PER WEEK AND BY GENDER
<=7 HOURS/WK
8-20 HOURS/WK
>20 HOURS/WK DOES NOT WORK ON THE FARM
NOT MENTIONED
MALE FEMALE MALE FEMALE MALE FEMALE MALE FEMALE MAL
E FEMALE
MALE
FEMALE
AGRICULTURAL ACTIVITIES ON THE OWN FARM
5,193 4,290 903 1,085 250 1,443 366 1,730 280 28 7 4
AGRICULTURAL ACTIVITIES ON ANOTHER FARM
165 158 7 74 1 49 3 23 1 12 2
NO AGRICULTURAL ACTIVITIES
1,063 928 135 363 44 320 25 64 2 166 62 15 2
NONE 393 274 119 59 19 27 8 16 1 170 90 2 1
NOT MENTIONED 26 21 5 1 1 1
1
18 4
TOTAL FARMERS
6,840 5,671 1,169 1,582 315 1,840 402 1,834 284 376 161 39 7
Source : Statistic data Fifth Agricultural census
The table shows that the majority of farmers (33%), both men and women, work on average,
between 8 - 20 hours per week. Of this group of farmers over 27% are men and less than 6%
are women. As the second largest group are the farmers (about 31% of the farmers) that work
more than 20 hours per week. This group of farmers is represented by about 27% men and
about 4% are women. This table also shows that agriculture is largely practiced on a part time
basis

Thematic Analysis Labor & Mechanization 5
1.1.3 Contribution of household members to the agricultural farm
Analysis of the contribution of household members to the agricultural farm is also important.
This analysis can give an overview of the number of jobs in the own farm and or any other farm.
These data are included in below Table 3.
Table 3 - Number of household members of a farmer according to most important economic activity in 2008 and according to gender per district
DISTRICT TOTAAL
HOUSEHOLD MEMBERS
TOTAL
MOST IMPORTANT ECONOMIC ACTIVITY AND GENDER
1 2 3 4 NOT
MENTIONED
MALE FEMALE MALE FEMALE MALE FEMALE MALE FEMALE MALE FEMALE MALE FEMALE
PARAMARIBO 1,780 990 790 400 220 30 10 250 240 310 320
WANICA 7,312 3,837 3,475 1,898 1,180 71 34 915 746 943 1,503 10 12
NICKERIE 5,144 2,754 2,390 1,606 370 126 31 344 565 656 1,404 22 20
CORONIE 365 210 155 107 48 3
34 31 62 73 4 3
SARAMACCA 2,852 1,531 1,321 860 490 24 5 398 431 244 393 5 2
COMMEWIJNE 3,500 1,876 1,624 830 459 101 32 487 353 452 778 6 2
MAROWIJNE 2,379 1,141 1,238 887 960 4 6 96 91 154 179
2
PARA 868 464 404 339 238 6 2 45 41 71 122 3 1
TOTAL COASTAL PLAIN
24,200 12,803 11,397 6,927 3,965 365 120 2,569 2,498 2,892 4,772 50 42
ACTIVITIES IN 2008:
1 = AGRICULTURAL ACTIVITIES ON THE OWN FARM
2 = AGRICULTURAL ACTIVITIES ON ANOTHER FARM
3 = NO AGRICULTURAL ACTIVITIES
4 = NONE
Source : Statistic data Fifth Agricultural census
The table shows that most household members (45%), both men and women, have as main economic activity agricultural activities on the own farm. The relationship between men and women in this economic activity is respectively and 64% to 36%. It should be noted that about 22% does not report any economic activity and thus really depend on the farmers. However, it must be determined why so many household members are involved in the activities of the farm. This can possibly be explained by a shortage of workers in this sector. It is worth noting that a study on this subject should be done, to arrive at the right conclusions.

Thematic Analysis Labor & Mechanization 6
1.1.4 Contracted labor on the farms
Laborers are contracted to work on the farms. These can be divided in different categories
according to district (see Table 4). This paragraph furthermore provides an overview of the
number of contracted laborers according to time period contracted and gender per district and
the number of contracted laborers according to nationality and gender per age group.
Table 4: Number of farms according to contracted laborers per category per district in 2008.
DISTRICT TOTAL
NUMBER OF FARMS
CONTRACTED LABOURERS BY CATEGORY
1-2 3-4 5-9 10-19 20-49 50-99 100-199 200-499 500
PARAMARIBO 40 10 30
WANICA 135 99 23 9 4
NICKERIE 685 252 219 173 36 2 1 1 1
CORONIE 10 6 2 2
SARAMACCA 172 110 23 33 3 2 1
COMMEWIJNE 131 99 19 6 4 2 1
MAROWIJNE 116 14 28 33 36 4 1
PARA 28 22 1 3 2
TOTAL COASTAL PLAIN
1317 612 345 259 85 10 2 2 2
Source : Statistic data Fifth Agricultural census
It appears that of the total of farms that contract laborers, 46% of farms hire between 1 and 2
laborers. Of the total number of farms 19% of the farms contract labor. The other farms
apparently use household members for the activities.

Thematic Analysis Labor & Mechanization 7
Table 5: Number of contracted laborers according to time period contracted and gender per
district in 2008
DISTRICT TOTAL
TOTAL TIME PERIOD CONTRACTED AND GENDER
CONTRACTED LABOR
PERMANENT SEMI-
PERMANENT TEMPORARY NOT MENTIONED
MALE FEMALE MALE FEMALE MALE FEMALE MALE FEMALE MALE FEMALE
PARAMARIBO 130 130 90 40
WANICA 310 283 27 159 22 17 2 103 4 3
NICKERIE 4152 3906 246 1395 175 196 68 2286 3 29
CORONIE 26 26 12 2 10 2
SARAMACCA 1601 1123 478 772 466 18 7 327 4 6 1
COMMEWIJNE 452 414 38 240 28 20 152 10 2
MAROWIJNE 990 320 670 52 55 1 10 267 605
PARA 73 59 14 41 13 8 1 10
TOTAL COASTAL PLAIN
7734 6261 1473 2761 759 262 88 3195 622 43 4
Source : Statistic data Fifth Agricultural census
Of the total number of contract laborers 81% are men and 19% are women. Most of the
contracted laborers are hired on a temporary basis. This group represents around 49% of the
total number of contracted laborers. In the district of Nickerie occurs the largest number of
contracted laborers, i.e. 54% of the total number of contracted laborers. In the District of
Nickerie rice is cultivated which is strongly dependent on the growing seasons. This creates
employment peaks which is solved by hiring temporary workers.

Thematic Analysis Labor & Mechanization 8
Table 6: Number of contracted laborers according to nationality and gender per age group
AGE GROUP
TOTAL
TOTAL CONTRACTED
LABOR
NATIONALITY AND GENDER
SURINAMESE HAITIAN GUYANESE OTHER NOT
MENTIONED
MALE FEMALE MALE FEMALE MALE FEMALE MALE FEMALE MAL
E FEMAL
E MAL
E FEMALE
<25 857 547 310 532 306 7 4 5
1
2
25-34 1,813 1,380 433 1,292 414 52 16 25 3 1
10
35-44 3,316 2,776 540 2,559 450 47 16 154 73
16 1
45-54 938 798 140 726 117 31 13 25 7 5 1 11 2
55-64 206 177 29 151 25 8 1 14 3 3
1
≥ 65 604 583 21 563 19 6 1 6 1
8
TOTAL CONTRACTED LABOR
7,734 6,261 1,473 5,823 1,331 151 51 229 87 10 1 48 3
Source : Statistic data Fifth Agricultural census
The larger part of contracted laborers are Surinamese, more in particular 93% of the total. The
average contracted labor is more than 1 laborer per agricultural farm. The table leads to the
conclusion that Surinamese labor is preferred over foreign labor. However, it can also be
indicated that the number of contracted laborers with Haitian and Guyanese nationality in total
also forms an important portion for the sector.

Thematic Analysis Labor & Mechanization 9
1. 2. The interior
1.2.1 Farmers according to highest education and gender
Table 2 in Appendix 2 demonstrates that most farmers in the interior did not follow any formal
schooling. This group represents approximately 53% of the total number of farmers in the
interior. Then the group of farmers who have as highest education Primary School come second
(over 40%).
1.2.2 Number of hours worked per week
This paragraph provides an overview of the number of farmers according to the average number
of hours worked per week on the farm in 2008 and according to gender per district (see Table 7)
and the number of farmers according to average number of hours worked per week and
according to gender per most important economic activity (see Table 8)
Table 7: Number of farmers according to the average number of hours worked per week on the
farm in 2008 and according to gender per district
DISTRICT TOTAL
FARMERS
TOTAL
AVERAGE NUMBER OF HOURS WORKED PER WEEK AND BY GENDER
DOES NOT WORK ON THE FARM
<=7 HOURS/WK
8-20 HOURS/WK
>20 HOURS/WK
NOT MENTIONED
MALE
FEMALE MAL
E FEMAL
E MALE
FEMALE
MALE
FEMALE MAL
E FEMAL
E MAL
E FEMALE
MAROWIJNE 892 373 519 4 2 18 31 36 37 315 449
BROKOPONDO 129 22 107 2 3 20 94 8 2
SIPALIWINI 2,327 586 1,741 9 14 67 151 150 495 355 1,076 5 6
TOTAL INTERIOR
3,348 981 2,367 15 19 105 276 186 540 669 1,525 5 8
Source : Statistic data Fifth Agricultural census
The table demonstrates that most farmers, approximately 66%, in the interior work on average
more than 20 hours per week. Followed by approximately 22% of the farmers who work on
average between 8 and 20 hours per week. The medial group for the average hours is the
category of more than 20 hours per week. This shows that farmers in the interior spend more
labor time on their farm.

Thematic Analysis Labor & Mechanization 10
Table 8: Number of farmers according to the average number of hours worked per week and
according to gender per most important economic activity in 2008
MOST IMPORTANT ECONOMIC ACTIVITY
TOTAL FARMERS
TOTAL
AVERAGE NUMBER OF HOURS WORKED PER WEEK AND BY GENDER
<=7 HOURS/WK
8-20 HOURS/WK
>20 HOURS/WK
DOES NOT WORK ON THE FARM
NOT MENTIONED
MALE FEMAL
E MALE
FEMALE
MALE FEMAL
E MALE
FEMALE
MALE
FEMALE
MALE
FEMALE
AGRICULTURAL ACTIVITIES ON THE OWN FARM
3,161 918 2,243 99 256 169 534 641 1,438 8 15 1
AGRICULTURAL ACTIVITIES ON ANOTHER FARM
48 18 30 1 12 17 4 14
NO AGRICULTURAL ACTIVITIES
11 3 8 1 3 2 2 3
NONE 115 37 78 4 4 1 26 70 6 4
NOT MENTIONED 13 5 8 1 4 8
TOTAL FARMERS
3,348 981 2,367 105 275 187 540 669 1,525 15 19 5 8
Source : Statistic data Fifth Agricultural census
The table shows that ± 66% of the farmers, that perform agricultural activities on their own farm,
work on average more than 20 hours per week. Of this group of farmers approximately 46% is
female and 20% male. According to the statistics in the interior more women than men are
active in farming.
1.2.3 Contribution of household members to the agricultural farm
Table 9: Number of household members of a farmer according to most important economic
activity in 2008 and according to gender per district.
DISTRICT TOTAL
HOUSEHOLD MEMBERS
TOTAL
MOST IMPORTANT ECONOMIC ACTIVITY AND GENDER
1 2 3 4 NOT
MENTIONED
MALE FEMAL
E MALE FEMALE
MALE
FEMALE MAL
E FEMALE
MALE
FEMALE MAL
E FEMALE
MAROWIJNE 2,823 1,39
8 1,425
1,223
1,332 25 17 33 26 116 50
BROKOPONDO
364 162 202 88 127 1 2 4 3 65 63 4 7
SIPALIWINI 6,394 2,68
7 3,707
2,036
2,835 22 39 225 353 361 437 43 43
TOTAL INTERIOR
9,581 4,24
7 5,334
3,348
4,293 48 58 263 382 542 550 47 50
ACTIVITIES IN 2008: 1=AGRICULTURAL ACTIVITIES ON THE OWN FARM
2=AGRICULTURAL ACTIVITIES ON ANOTHER FARM
3=NO AGRICULTURAL ACTIVITIES
4=NONE
Source : Statistic data Fifth Agricultural census
Thematic Analysis Labor & Mechanization 11
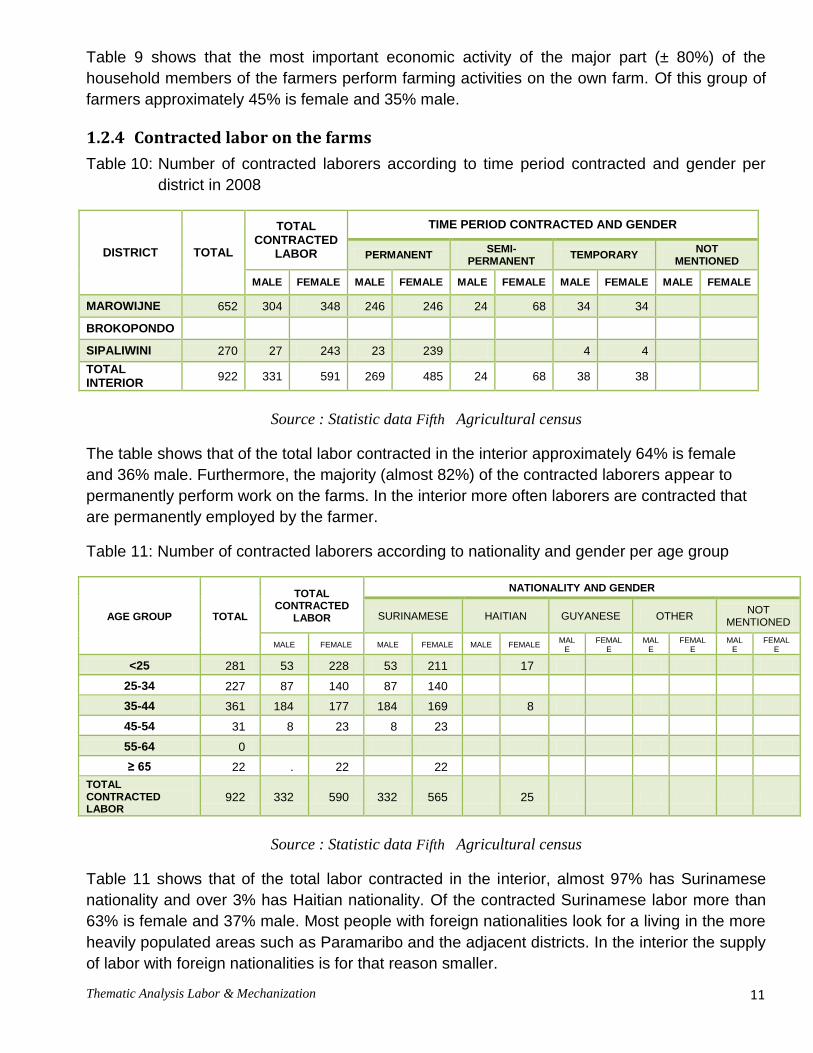
Table 9 shows that the most important economic activity of the major part (± 80%) of the
household members of the farmers perform farming activities on the own farm. Of this group of
farmers approximately 45% is female and 35% male.
1.2.4 Contracted labor on the farms
Table 10: Number of contracted laborers according to time period contracted and gender per
district in 2008
DISTRICT TOTAL
TOTAL CONTRACTED
LABOR
TIME PERIOD CONTRACTED AND GENDER
PERMANENT SEMI-
PERMANENT TEMPORARY
NOT MENTIONED
MALE FEMALE MALE FEMALE MALE FEMALE MALE FEMALE MALE FEMALE
MAROWIJNE 652 304 348 246 246 24 68 34 34
BROKOPONDO
SIPALIWINI 270 27 243 23 239 4 4
TOTAL INTERIOR
922 331 591 269 485 24 68 38 38
Source : Statistic data Fifth Agricultural census
The table shows that of the total labor contracted in the interior approximately 64% is female
and 36% male. Furthermore, the majority (almost 82%) of the contracted laborers appear to
permanently perform work on the farms. In the interior more often laborers are contracted that
are permanently employed by the farmer.
Table 11: Number of contracted laborers according to nationality and gender per age group
AGE GROUP TOTAL
TOTAL CONTRACTED
LABOR
NATIONALITY AND GENDER
SURINAMESE HAITIAN GUYANESE OTHER NOT
MENTIONED
MALE FEMALE MALE FEMALE MALE FEMALE MAL
E FEMAL
E MAL
E FEMAL
E MAL
E FEMAL
E
<25 281 53 228 53 211 17
25-34 227 87 140 87 140
35-44 361 184 177 184 169 8
45-54 31 8 23 8 23
55-64 0
≥ 65 22 . 22 22
TOTAL CONTRACTED LABOR
922 332 590 332 565 25
Source : Statistic data Fifth Agricultural census
Table 11 shows that of the total labor contracted in the interior, almost 97% has Surinamese
nationality and over 3% has Haitian nationality. Of the contracted Surinamese labor more than
63% is female and 37% male. Most people with foreign nationalities look for a living in the more
heavily populated areas such as Paramaribo and the adjacent districts. In the interior the supply
of labor with foreign nationalities is for that reason smaller.

Thematic Analysis Labor & Mechanization 12
In general it can be stated that in the agricultural sector most laborers are Surinamese.
2. Mechanization
The results of the census in the coastal plain and the interior in respect of mechanization are also processed in tables. Below the data from these tables are analyzed. The analyses per table are elaborated in the Chapter 2.1 and 2.2. In total 4,044 agricultural machines of which 1,265 (31%) are less than five years old and 2,750 (68%) older or equal to five years old. The remainder is not listed. The number of spraying machines is in total 1,478 of which 476 (32%) are less than five years old and 993 (67%) older or equal to five years old. Of the 1,054 harvesting machines 32 (3%) are less than five years old and 1,014 (96%) older or equal to five years old. Of the total number of machines and tools 67% is fully exploited and 33% partially.
2.1 The coastal plain
2.1.1 The number of machines and utensils according to age and type
Table 3 of Appendix 3 shows that the major part of the machines in the coastal plain is older
than 5 years. The percentage of this group of machines is approximately 72% of the total. The
machines younger than 5 years represent a little less than 18% of the machines in the coastal
plain.
In Suriname 2nd hand machines imported from abroad are used more often. This is obviously
done to keep the production costs low. Heavy investments by purchasing new machines can be
difficult to be earned back because of the fluctuating market prices for agricultural products.
2.1.2 The number of machines and utensils according to age and type
Table 4 (Appendix 4) shows that of the total fleet in the coastal plain, almost 68% is used
completely for agricultural purposes. More than 31% of the machines is partly used for
agricultural purposes. For the remainder, (1%) of the machines, there is no indication of its use.
By using machines in other sectors extra money can be earned. Idle machines do not earn
money. Surinamese farmers often rent earthmoving machines and other tillage operations.
2.1.3 Number of machines / utensils according to title or origin per type
Table 5 (Appendix 5) shows that the major part (± 60%) of the machines in the coastal plain are
owned, followed by machines that are rented. The machines that are rented in the coastal plain
represent around 36% of the machinery.
Most irrigation and drainage machines are owned by the farmers (> 90%). These machines are
cheaper to buy. For as far as transportation means are concerned, we see that a high
percentage (around 71%) of the total is owned by the farmers.

Thematic Analysis Labor & Mechanization 13
2.1.4 Number of operators according to gender per type of machine or utensil
Table 12: Number of operators according to gender per type of machine or utensil
TYPES OF MACHINES/ UTENSILS TOTAL MACHINES
GENDER OF THE OPERATOR
MALE FEMALE NOT
MENTIONED
TILLAGE EQUIPMENT
TOTAL 3,488 3,419 35 34
SPRAYING MACHINES
TOTAL 1,224 1,208 8 8
HARVESTING MACHINES
TOTAL 1,054 1,045 1 8
IRRIGATION AND DRAINAGE MACHINES
TOTAL 543 535 8
TRANSPORTATION MEANS
TOTAL 659 637 18 4
PROCESSING MACHINES
FOR AGRICULTURAL PRODUCE
TOTAL 4 2 2
MACHINES AND UTENSILS FOR
DAIRY CATTLE
TOTAL 87 81 4 2
MACHINES AND UTENSILS FOR
POULTRY
TOTAL 18 15 3
MACHINES AND UTENSILS FOR BEEKEEPING
TOTAL 1 1
MACHINES FOR AQUACULTURE
TOTAL 1 1
OTHER GROUPS OF MACHINES
TOTAL 77 72 1 4
TOTAL COASTAL PLAIN
7,156 7,016 80 60
Source : Statistic data Fifth Agricultural census
Table 12 shows that there is an operator for every machine, and that only 1% of the operators
belongs to the female sex. Operating most of the machines requires physical strength, which is
apparently the reason for this low percentage of female operators.
In Suriname we also do not have a culture of women performing the work of operator.
2.1.5 The number of machines and utensils according to type per district
Table 6 (Appendix 6) shows that most tillage machines are found in the District of Nickerie
(47%). These machines are used for tillage of rice growing areas.
In as far as harvesting machines are concerned 96% are found in the District of Nickerie.

Thematic Analysis Labor & Mechanization 14
Of the means of transportation used by agricultural enterprises 59% occurs in the District of
Nickerie.
Of the spraying machines 77% are found in the District of Nickerie. In rice cultivation motor
knapsack sprayers are used for controlling broadleaved weeds.
The Districts of Saramacca and Wanica respectively occupy the second and third position.
These districts have a high degree of vegetable cultivation.
2.1.6 Number of machines and utensils according to use per district
Table 13: Number of machines and utensils according to use per district
DISTRICT
TOTAL USE
MACHINES FULL PARTIAL NOT
MENTIONED
PARAMARIBO 200 150 50
WANICA 972 694 262 16
NICKERIE 4,112 2,604 1,466 42
CORONIE 128 105 23
SARAMACCA 998 818 180
COMMEWIJNE 534 396 138
MAROWIJNE 44 19 25
PARA 168 125 43
TOTAL COASTAL PLAIN 7,156 4,911 2,187 58
Source : Statistic data Fifth Agricultural census
The table shows that of the total number of machines/ utensils almost 68% is used completely
for agricultural purposes (see below diagram). Of these machines 53% are found in the District
of Nickerie. These machines are largely used for rice cultivation. These figures show that a lot of
money is invested in the mechanization of the rice cultivation. Rice cultivation in Suriname is for
a large part mechanized. The sowing is still done manually by some farmers.
The Districts of Saramacca and Wanica respectively occupy the second and third position.
These districts have a high degree of vegetable cultivation.

Thematic Analysis Labor & Mechanization 15
2.2The interior
2.2.1 The number of machines and utensils according to age and type
Table 14: The number of machines and utensils according to age and type
TYPES OF MACHINES/ UTENSILS TOTAL
MACHINES
AGE
< 5 YEARS
≥ 5 YEARS
NOT MENTIONED
TILLAGE EQUIPMENT
Heavy disc harrows, plows/ disc plow 8 8
Chainsaws 524 252 269 3
Brush cutters 16 14 2
Other 8 5 3
TOTAL 556 279 274 3
SPRAYING MACHINES
Motor knapsack sprayer 118 8 110
Airplanes
Other 136 34 102
TOTAL 254 42 212
TRANSPORTATION MEANS
Trucks, pick up 1 1
Passenger car 16 8 8
Motor cycle/ moped/ ATV
Motor boat 164 46 117 1
Boat without motor 11 3 8
TOTAL 192 58 133 1
PROCESSING MACHINES FOR AGRICULTURAL PRODUCE
Grater 134 78 56
Other 10 3 7
TOTAL 144 81 63 0
OTHER GROUPS OF MACHINES
Other groups of machines 18 4 14
TOTAL 18 4 14 0
TOTAL INTERIOR
1,164 464 696 4
Source : Statistic data Fifth Agricultural census
Table 14 shows that the major part of machines/utensils that are used in the interior have an
age over 5 years of age. The majority of the machines in the interior consists of chainsaws, i.e.
approximately 45% of the total number of machines in the interior. Then the motor boat follows
with about 14% and then follows the grater that represents approximately 11% of the total
number of machines / utensils that shows that the major part of the machines in the interior is
older than 5 years.
In Suriname 2nd hand machines imported from abroad are used more often. This is obviously
done to keep the production costs low. Heavy investments by purchasing new machines can be
difficult to be earned back because of the fluctuating market prices for agricultural products.

Thematic Analysis Labor & Mechanization 16
2.2.2 The number of machines and utensils according to use per type
Table 15: Number of machines and utensils according to use per type
TYPES OF MACHINES/ UTENSILS TOTAL
MACHINES
USE
FULL PARTIAL NOT
MENTIONED
TILLAGE EQUIPMENT
Heavy disc harrows, plows/ disc plow 8 8
Chainsaws 524 332 190 2
Brush cutters 16 10 6
Other 8 4 4
TOTAL 556 354 200 2
SPRAYING MACHINES
Motor knapsack sprayer 119 68 51
Airplanes
Other 135 59 76
TOTAL 254 127 127 0
TRANSPORTATION MEANS
Trucks, pick up 1 1
Passenger car 16 8 8
Motor cycle/ moped/ ATV
Motor boat 164 122 41 1
Boat without motor 11 11
Farm vehicles and other trailers
Other transportation means
TOTAL 192 141 50 1
PROCESSING MACHINES FOR AGRICULTURAL PRODUCE
Grater 134 9 125
Other 10 2 8
TOTAL 144 11 133 0
OTHER GROUPS OF MACHINES
Other groups of machines 18 3 15
TOTAL 18 3 15 0
TOTAL INTERIOR
1,164 636 525 3
Source : Statistic data Fifth Agricultural census
The table shows that most of the machines / utensils in the interior are fully used for agricultural
activities, i.e. about 55% of the total. 45% of the machines is partly used for agricultural
purposes.

Thematic Analysis Labor & Mechanization 17
2.2.3 Number of machines and utensils according to title or origin per type
Table 16: Number of machines and utensils according to title or origin per type
TYPES OF MACHINES/ UTENSILS
TOTAL MACHINES
TITLE OR ORIGIN
OWNERSHIP LEASE RENTAL BORROWED OTHER NOT
MENTIONED
TILLAGE EQUIPMENT
Heavy disc harrows, plows/ disc plow
8 8
Chainsaws 525 403 1 57 60 2 2
Brush cutters 16 14 1 1
Other 8 8
TOTAL 557 433 1 58 61 2 2
SPRAYING MACHINES
Motor knapsack sprayer 119 68 51
Airplanes
Other 135 110 25
TOTAL 254 178 0 0 76 0 0
TRANSPORTATION MEANS
Trucks, pick up 1 1
Passenger car 16 8 8
Motor cycle/ moped/ ATV
Motor boat 163 141 1 12 8 1
Boat without motor 11 11
TOTAL
FARM VEHICLES AND OTHER TRAILERS
Other transportation means 191 161 9 0 12 8 1
TOTAL 191 161 9 0 12 8 1
PROCESSING MACHINES FOR AGRICULTURAL PRODUCE
Grater 134 95 27 12
Other 10 2 8
TOTAL 144 97 0 27 20 0 0
OTHER GROUPS OF MACHINES
Other groups of machines 18 10 8
TOTAL 18 10 0 0 0 8 0
TOTAL INTERIOR
1,164 879 10 85 169 18 3
Source : Statistic data Fifth Agricultural census
The table shows that most of the machines / utensils are owned representing about 75% of the total. It also appears that about 78% of the chainsaws are owned.

Thematic Analysis Labor & Mechanization 18
2.2.4 Number of operators according to gender per type of machine or utensil
Table 17: Number of operators according to gender per type of machine or utensil
TYPE OF MACHINE/ UTENSIL TOTAL
MACHINES
GENDER OF THE OPERATOR
MALE FEMALE NOT
MENTIONED
TILLAGE EQUIPMENT
Heavy disc harrows, plows/ disc plow 8 8
Chainsaws 524 518 4 2
Brush cutters 16 15 1
Other 8 8
TOTAL 556 549 5 2
SPRAYING MACHINES
Spraying machines
Machines driven by a tractor
Motor knapsack sprayer 118 110 8
Airplanes
Other 135 135
TOTAL 253 245 8 0
TRANSPORTATION MEANS
Trucks, pick up 1 1
Passenger car 17 17
Motor cycle/ moped/ ATV
Motor boat 164 140 24
Boat without motor 11 9 2
TOTAL 193 166 27 0
PROCESSING MACHINES FOR AGRICULTURAL PRODUCE
Grater 134 9 125
Other 10 1 9
TOTAL 144 10 134 0
OTHER GROUPS OF MACHINES
Other groups of machines 18 18
TOTAL 18 18 0 0
TOTAL INTERIOR
1,164 988 174 2
Source : Statistic data Fifth Agricultural census
The table shows that around 85% of the operators of the machines / utensils are men and about
15% are women.
Male operators are significantly more in the interior. Operating most of the machines requires
physical strength, which is apparently the reason for this low percentage of female operators.
In Suriname we also do not have a culture of women performing the work of operator.

Thematic Analysis Labor & Mechanization 19
2.2.5 Number of machines and utensils according to type per district
Table 7 (Appendix 7) shows that of the total machines/ utensils 57% are found in the District of
Marowijne, followed by Sipaliwini with 43%. Tillage equipment (Chainsaws) can be found in the
Districts of Marowijne and Sipaliwini with each 50%. Spraying machines are only used in the
District of Marowijne. Motor boats are in general used as transportation means.
2.2.6 Number of machines and utensils according to use per district
Table 18: Number of machines and utensils according to use per district
DISTRICT TOTAL
MACHINES
USE
FULL PARTIAL NOT
MENTIONED
MAROWIJNE 667 415 252
BROKOPONDO
SIPALIWINI 497 223 271 3
TOTAL INTERIOR
1164 638 523 3
Source : Statistic data Fifth Agricultural census
The table shows that 57% of the machines / utensils in Marowijne are distributed over about
36% completely used and about 21% partly used for agricultural purposes. Of the machines in
Sipaliwini around 20% is completely used and around 23% of the machines is partly used for
agricultural purposes.

Thematic Analysis Labor & Mechanization 20
Sources:
- Report: Doorrekening Fiscale voorzieningen voor de agrarische sector (2008).
- Annual Reports LVV: 2005, 2006, 2007, 2008.
- Agricultural Statistics 2004-2009, Min LVV
- Second Agricultural Census Suriname 1959
- Tables Fourth Agricultural Census Suriname, 1981
- Statistical Analysis Fifth Agricultural Census Suriname, 2008
Thematic Analysis Labor & Mechanization 21
Appendix 1: Table 1: Number of farmers according to highest education completed and gender per district (Coastal Plain)
DISTRICT
TOTAL FARMERS
TOTAL
HIGHEST EDUCATION COMPLETED AND GENDER
PRIMARY SCHOOL
JUNIOR SECONDARY
SCHOOL
SENIOR SECONDARY
SCHOOL POLYTECHNIC UNIVERSITY OTHER
NO EDUCATION
NOT MENTIONED
MA
LE
FE
MA
LE
MA
LE
FE
MA
LE
MA
LE
FE
MA
LE
MA
LE
FE
MA
LE
MA
LE
FE
MA
LE
MA
LE
FE
MA
LE
MA
LE
FE
MA
LE
MA
LE
FE
MA
LE
MA
LE
FE
MA
LE
PARAMARIBO 450 380 70 170 30 110 10 10 10 20 30 10 40 10
WANICA 2004 1681 323 648 130 488 75 145 22 67 16 30 3 21 1 280 76 2
NICKERIE 1365 1289 76 680 34 287 12 54 4 22 2 5 1 231 23 9 1
CORONIE 149 120 29 68 21 45 7 3 1 1 3 SARAMACCA 886 801 85 441 44 185 12 45 4 22 5 8 1 100 19
COMMEWIJNE 1047 917 130 355 37 219 26 44 12 33 3 5 4 252 52 5
MAROWIJNE 687 289 398 153 212 57 32 13 6 2 1 1 4 58 147 1
PARA 252 194 58 49 16 67 13 25 8 14 3 1 13 1 20 19 3 TOTAL COASTAL PLAIN
6840 5671 1169 2564 524 1458 187 339 67 180 27 83 14 43 3 984 346 20 1

Thematic Analysis Labor & Mechanization 22
Appendix 2: Table 2: Number of farmers according to highest education completed and gender per district (Interior)
DISTRICT TOTAL
FARMERS
TOTAL
HIGHEST EDUCATION COMPLETED AND GENDER
PRIMARY SCHOOL
JUNIOR SECONDARY
SCHOOL
SENIOR SECONDARY
SCHOOL POLYTECHNIC UNIVERSITY OTHER
NO EDUCATION
NOT MENTIONED
MA
LE
FE
MA
LE
MA
LE
FE
MA
LE
MA
LE
FE
MA
LE
MA
LE
FE
MA
LE
MA
LE
FE
MA
LE
MA
LE
FE
MA
LE
MA
LE
FE
MA
LE
MA
LE
FE
MA
LE
MA
LE
FE
MA
LE
MAROWIJNE 892 373 519 203 271 92 35 8 8 61 213
BROKOPONDO 129 22 107 6 33 3 4 1 13 69
SIPALIWINI 2,327 586 1,741 278 560 9 36 4 3 1 1 291 1135 3 6
TOTAL INTERIOR
3,348 981 2,367 487 864 104 75 12 4 1 8 1 365 1417 3 6

Thematic Analysis Labor & Mechanization 23
Appendix 3: Table 3: Number of machines and utensils according to age and type
TYPES OF MACHINES/ UTENSILS TOTAL
MACHINES
AGE
< 5 years
≥ 5 years
NOT MENTIONED
TILLAGE EQUIPMENT
Tillage equipment 8 2 6
Two-wheel tractor 355 49 306
Four-wheel tractor/ more than four wheels 1,334 70 1,251 13
Heavy disc harrow, plows/ disc plow 183 20 163
Rotavators (rotary cultivator) 8 2 6
Trenching tools 1 1
Excavators/ dragline (backhoe poclain, etc.) 353 32 320 1
Bulldozers/ tractor with caterpillar tracks 18 18
Leveling tools (earthworks, graders, etc.) 10 10
Chainsaws 115 83 32
Brush cutters 766 579 186 1
Other 337 149 177 11
TOTAL 3,488 986 2,476 26
SPRAYING MACHINES
Spraying machines 4 1 3
Machines driven by a tractor 16 1 13 2
MOTOR KNAPSACK SPRAYER 952 392 557 3
Airplanes 125 4 121
Other 127 36 87 4
TOTAL 1,224 434 781 9
HARVESTING MACHINES
Harvesting machines 1,054 32 1,014 8
TOTAL 1,054 32 1,014 8
IRRIGATION AND DRAINAGE MACHINES
Irrigation and drainage machines 5 1 4
Electric water pumps 177 92 85
Gasoline or diesel water pumps 290 158 131 1
Vadini pumps 4 1 3
Sprayers/ drip equipment
Other irrigation and drainage equipment 67 30 37
TOTAL 543 282 260 1

Thematic Analysis Labor & Mechanization 24
TRANSPORTATION MEANS
Trucks. pick up 335 43 290 2
Passenger car 82 26 56
Motor cycle/ moped/ ATV 94 38 56
Motor boat 8 2 6
Boat without motor 2 2
Farm vehicle and other trailers 16 16
Other transportation means 122 7 114 1
TOTAL 659 116 540 3
PROCESSING MACHINES FOR AGRICULTURAL PRODUCE
Grater 1 1
Pulper
Cooling and refrigeration machines 1 1
Mixers 1 1
Filling, packaging, sealing machines
Other 1 1
TOTAL 4 1 3
MACHINES AND UTENSILS FOR DAIRY CATTLE
MILKING MACHINES 20 8 12
Milk refrigeration facilities 2 1 1
Other 65 44 21
TOTAL 87 53 34
MACHINES AND UTENSILS FOR POULTRY
Equipment for automatic water supply 3 2 1
Equipment for automatic feed supply 1 1
Brooder 1 1
Slaughter facilities 4 1 3
Other 9 2 7
TOTAL 18 6 10 2
MACHINES AND UTENSILS FOR BEEKEEPING
Machines and utensils for beekeeping 1 1
TOTAL 1 1
MACHINES FOR AQUACULTURE
Aerators
Pumps
Suction dredgers
Other 1 1
TOTAL 1 1
OTHER GROUPS OF MACHINES
Other groups of machines 77 21 52 4

Thematic Analysis Labor & Mechanization 25
TOTAL 77 21 52 4
TOTAL COASTAL PLAIN
7,156 1,931 5,172 53
Appendix 4: Table 4: Number of machines / utensils according to use per type
TYPES OF MACHINES/ UTENSILS TOTAL
MACHINES
USE
FULL PARTIAL NOT
MENTIONED
TILLAGE EQUIPMENT
Tillage equipment 8 4 4
Two-wheel tractor 355 259 96
Four-wheel tractor/ more than four wheels 1,334 986 333 15
Heavy disc harrows, plows/ disc plow 183 156 26 1
Rotavators (rotary cultivator) 8 6 2
Trenching tools 1 1
Excavators/ dragline (backhoe poclain, etc.) 353 175 177 1
Bulldozers/ tractor with caterpillar tracks 18 15 3
Leveling tools (earthworks, graders, etc.) 10 9 1
Chainsaws 115 63 52
Brush cutters 766 592 173 1
Other 337 258 68 11
TOTAL 3,488 2,524 935 29
SPRAYING MACHINES
Spraying machines 4 2 2
Machines driven by a tractor 16 7 9
Motor knapsack sprayer 952 513 434 5
Airplanes 125 86 39
Other 127 105 17 5
TOTAL 1,224 713 501 10
HARVESTING MACHINES
Harvesting machines 1,054 743 301 10
TOTAL 1,054 743 301 10
IRRIGATION AND DRAINAGE MACHINES
Irrigation and drainage machines 5 4 1
Electric water pumps 177 151 26
Gasoline or diesel water pumps 290 263 27
Vadini pumps 4 3 1
Sprayers/ drip equipment
Other irrigation and drainage equipment 67 60 7
TOTAL 543 481 62

Thematic Analysis Labor & Mechanization 26
TRANSPORTATION MEANS
Trucks. pick up 335 148 185 2
Passenger car 82 25 57
Motor cycle/ moped/ ATV 94 27 67
Motor boat 8 4 4
Boat without motor 2 1 1
Farm vehicles and other trailers 16 16
Other transportation means 122 74 47 1
TOTAL 659 295 361 3
PROCESSING MACHINES FOR AGRICULTURAL PRODUCE
Grater 1 1
Pulper
Cooling and refrigeration machines 1 1
Mixers 1 1
Filling, packaging, sealing machines
Other 1 1
TOTAL 4 4
MACHINES AND UTENSILS FOR DAIRY CATTLE
MILKING MACHINES 20 19 1
Milk refrigeration facilities 2 2
Other 65 52 13
TOTAL 87 73 14
MACHINES AND UTENSILS FOR POULTRY
Equipment for automatic water supply 3 1 1 1
Equipment for automatic feed supply 1 1
Brooder 1 1
Slaughter facilities 4 4
Other 9 9
TOTAL 18 15 1 2
MACHINES AND UTENSILS FOR BEEKEEPING
Machines and utensils for beekeeping 1 1
TOTAL 1 1
MACHINES FOR AQUACULTURE
Aerators
Pumps
Suction dredgers
Other 1 1
TOTAL 1 1
OTHER GROUPS OF MACHINES
Other groups of machines 77 61 12 4

Thematic Analysis Labor & Mechanization 27
TOTAL 77 61 12 4
TOTAL COASTAL PLAIN
7,156 4,911 2,187 58
Appendix 5:
Table 5: Number of machines / utensils according to title or origin per type
TYPES OF MACHINES/ UTENSILS TOTAL
MACHINES
TITLE OR ORIGIN
OWNERSHIP LEASE RENTAL BORROWED OTHER NOT
MENTIONED
TILLAGE EQUIPMENT
Tillage equipment 8 3 4 1
Two-wheel tractor 355 235 3 107 10
Four-wheel tractor/ more than four wheels 1,334 729 4 565 24 5 7
Heavy disc harrows, plows/ disc plow 183 94 2 81 6
Rotavators (rotary cultivator) 8 6 1 1
Trenching tools 1 1
Excavators/ dragline (backhoe poclain, etc.) 353 85 5 260 2 1
Bulldozers/ tractor with caterpillar tracks 18 16 2
Leveling tools (earthworks, graders, etc.) 10 5 5
Chainsaws 115 90 1 15 9
Brush cutters 766 719 2 8 26 11
Other 337 301 20 6 10
TOTAL 3,488 2,284 18 1,063 84 5 34
SPRAYING MACHINES
Spraying machines 4 4
Machines driven by a tractor 16 10 5 1
Motor knapsack sprayer 952 633 2 233 82 1 1
Airplanes 125 3 1 120 1
Other 127 106 12 6 3
TOTAL 1,224 756 3 370 89 2 4
HARVESTING MACHINES
Harvesting machines 1,054 106 8 926 10 2 2
TOTAL 1,054 106 8 926 10 2 2
IRRIGATION AND DRAINAGE MACHINES
Irrigation and drainage machines 5 3 1 1
Electric water pumps 177 169 1 5 2
Gasoline or diesel water pumps 290 259 27 3 1
Vadini pumps 4 4
Sprayers/ drip equipment
Other irrigation and drainage equipment 67 65 2
TOTAL 543 500 1 33 8 1
TRANSPORTATION MEANS
Trucks. pick up 335 190 1 138 4 1 1

Thematic Analysis Labor & Mechanization 28
Passenger car 82 75 2 4 1
Motor cycle/ moped/ ATV 94 92 2
Motor boat 8 5 2 1
Boat without motor 2 1 1
Farm vehicles and other trailers 16 14 2
Other transportation means 122 91 1 26 4
TOTAL 659 468 4 169 15 2 1
PROCESSING MACHINES FOR AGRICULTURAL PRODUCE
Grater 1 1
Pulper
Cooling and refrigeration machines 1 1
Mixers 1 1
Filling, packaging, sealing machines
Other 1 1
TOTAL 4 4
MACHINES AND UTENSILS FOR DAIRY CATTLE
MILKING MACHINES 20 19 1
Milk refrigeration facilities 2 2
Other 65 62 1 1 1
TOTAL 87 83 1 1 2
MACHINES AND UTENSILS FOR POULTRY
Equipment for automatic water supply 3 2 1
Equipment for automatic feed supply 1 1
Brooder 1 1
Slaughter facilities 4 4
Other 9 9
TOTAL 18 16 2
MACHINES AND UTENSILS FOR BEEKEEPING
Machines and utensils for beekeeping 1 1
TOTAL 1 1
MACHINES FOR AQUACULTURE
Aerators
Pumps
Suction dredgers
Other 1 1
TOTAL 1 1
OTHER GROUPS OF MACHINES
Other groups of machines 77 58 15 4
TOTAL 77 58 15 4

Thematic Analysis Labor & Mechanization 29
TOTAL COASTAL PLAIN
7,156 4,277 35 2,577 208 12 47
Appendix 6: Table 6: Number of machines/utensils by type per district
DISTRICT TOTAL
MACHINES
TYPES OF MACHINES/ UTENSILS
TILLAGE EQUIPMENT SPRAYING MACHINES HARVESTING
MACHINES IRRIGATION AND
DRAINAGE MACHINES
1 2 3 4 5 6 7 8 9 10 11 1 2 3 4 1 1 2 3 4 5
PARAMARIBO 180 40 10 10 30 30 20 40
WANICA 828 43 71 6 37 14 299 98 6 73 12 1 79 73 1 15
NICKERIE 3,647 182 998 129 2 205 14 6 3 20 64 5 736 119 79 1,009 17 56 3
CORONIE 87 2 9 5 1 3 1 2 5 50 2 2 2 1 2
SARAMACCA 891 72 184 30 5 1 87 1 3 21 153 50 5 88 6 38 42 21 42 1 41
COMMEWIJNE 486 11 53 1 17 2 27 183 29 22 59 70 1 11
MAROWIJNE 38 1 1 33 2 1
PARA 152 4 8 2 4 1 17 74 22 11 1 1 7
TOTAL COASTAL PLAIN
6,309 355 1,334 183 8 1 353 18 10 115 766 345 16 952 125 131 1,054 177 290 4 72
TILLAGE EQUIPMENT: SPRAYING MACHINES: IRRIGATION AND DRAINAGE MACHINES: 1=Two-wheel tractor 1=Machines driven by a tractor 1=Electric water pumps
2=Four-wheel tractor/ more than four wheels 2=Knapsack sprayers 2=Gasoline or diesel water pumps
3=Heavy disc harrows, plows/ disc plow 3=Airplanes 3=Vadini pumps
4=Rotavators (rotary cultivator) 4=Other 4=Sprayers/ drip equipment
5=Trenching tools 5=Other irrigation and drainage equipment
6=Hydraulic excavators HARVESTING MACHINES:
7=Bulldozers 1=Harvesting machines
8=Leveling tools
9=Chainsaws
10=Brush cutters
11=Other

Thematic Analysis Labor & Mechanization 30
Continued: “Table 6: Number of machines/utensils by type per district
DISTRICT TOTAL
MACHINES
TYPES OF MACHINES/ UTENSILS
TRANSPORTATION MEANS PROCESSING MACHINES
MACHINES AND
UTENSILS FOR DAIRY
CATTLE
MACHINES AND UTENSILS FOR
POULTRY
MACHINES FOR AQUACULTURE
OTHER GROUPS
OF MACHINES
1 2 3 4 5 6 7 1 2 3 4 5 6 1 2 3 1 2 3 4 5 1 2 3 4 1
PARAMARIBO 20 10 10
WANICA 144 44 32 6 4 10 1 1 15 1 3 1 4 8 14
NICKERIE 465 230 35 85 5 2 6 25 32 1 44
CORONIE 41 3 2 2 33
SARAMACCA 107 30 1 1 6 62 1 6
COMMEWIJNE 48 13 14 1 1 9 1 1 8
MAROWIJNE 6 1 2 1 1 1
PARA 16 5 2 4 1 4
TOTAL COASTAL PLAIN
847 335 82 94 8 2 16 122 1 1 1 1 20 2 65 3 1 1 4 9 1 77
TRANSPORTATION MEANS: PROCESSING MACHINES: MACHINES AND UTENSILS MACHINES AND UTENSILS
1=Trucks. pick up
1=Grater
FOR DAIRY CATTLE:
FOR BEEKEEPING:
2=Passenger car
2=Pulper
1=Milking machines
1=Machines and utensils for beekeeping 3=Motorcycle/ moped/ATV
3=Refrigerators and freezers
2=Milk refrigeration facility
4=Motor boat
4=Mixers
3=Other 5=Boat without motor
5=Filling, packaging machines, sealers
MACHINES FOR AQUACULTURE:
6=Farm vehicles and 6=Other processing machines
1=Aerators
other trailers MACHINES AND UTENSILS 2=Pumps
7=Other transportation means
FOR POULTRY:
3=Suction dredgers
1=Equipment for automatic water supply 4=Other
2=Equipment for automatic feed supply
3=Brooders
4=Slaughter facilities
OTHER GROUPS OF MACHINES:
1=Other groups of machines

Thematic Analysis Labor & Mechanization 31
Appendix 7: Table 7: Number of machines/utensils by type per district
DISTRICT TOTAL
MACHINES
TYPE OF MACHINE/ UTENSIL
TILLAGE EQUIPMENT SPRAYING MACHINES
IRRIGATION AND DRAINAGE
MACHINES TRANSPORTATION MEANS
1 2 3 4 5 6 7 8 9 10 11 1 2 3 4
1 2 3 4 5 1 2 3 4 5 6 7
MAROWIJNE 667 8 263 118 136 16 102 8
BROKOPONDO
SIPALIWINI 497 261 16 8 1 62 3
TOTAL INTERIOR
1,164 8 524 16 8 118 136 1 16 0 164 11
TILLAGE EQUIPMENT: SPRAYING MACHINES: IRRIGATION AND DRAINAGE
MACHINES: TRANSPORTATION MEANS:
1=Two-wheel tractor 1=Machines driven by a tractor 1=Electric water pumps 1=Trucks. pick up
2=Four-wheel tractor/ more than four wheels 2=Knapsack sprayers 2=Gasoline or diesel water pumps 2=Passenger car 3=Heavy disc harrows, plows/ disc plow
3=Airplanes 3=Vadini pumps 3=Motorcycle/ moped/ATV
4=Rotavators (rotary cultivator)
4=Other 4=Sprayers/ drip equipment 4=Motor boat
5=Trenching tools
5=Other irrigation and drainage equipment 5=Boat without motor
6=Hydraulic excavators
6=Farm vehicles and other trailers
7=Bulldozers
7=Other transportation means
8=Leveling tools
9=Chainsaws
10=Brush cutters

Thematic Analysis Labor & Mechanization 32
Continued: “Table 7: Number of machines/utensils by type per district”
DISTRICT
TYPE OF MACHINE/ UTENSIL
PROCESSING MACHINES: MACHINES AND UTENSILS FOR DAIRY CATTLE
MACHINES AND UTENSILS FOR
POULTRY
MACHINES FOR BEEKEEPING
MACHINES FOR AQUACULTURE
OTHER GROUPS
OF MACHINES
1 2 3 4 5 6 1 2 3 1 2 3 4 5 1 1 2 3 4 1
MAROWIJNE 8 8
BROKOPONDO
SIPALIWINI 126 10 10
TOTAL INTERIOR
134 10 18
PROCESSING MACHINES:
MACHINES AND UTENSILS FOR DAIRY CATTLE: MACHINES AND UTENSILS FOR BEEKEEPING:
1=Grater
1=Milking machines 1=Machines and utensils for beekeeping
2=Pulper
2=Milk refrigeration facility
3=Refrigerators and freezers
3=Other MACHINES AND UTENSILS FOR POULTRY:
4=Mixers
1=Equipment for automatic water supply
5=Filling, packaging machines, sealers
OTHER GROUPS OF MACHINES: 2=Equipment for automatic feed supply
6=Other processing machines
1=Other groups of machines 3=Brooders
MACHINES FOR AQUACULTURE:
1=Aerators
2=Pumps
3=Suction dredgers
4=Other

Thematic
analysis
Agriculture

Thematic analysis 2
List of Contents
INTRODUCTION ......................................................................................................................... 3
1 AGRICULTURAL CROPS AND PRODUCE ........................................................................................................... 4
1.1 Area under cultivation of agricultural crops ............................................................................................ 4
1.2 Production of agricultural crops .............................................................................................................. 6
1.3 Prices of agricultural produce (farm gate prices) .................................................................................. 11
1.4 Gross production value of agricultural produce .................................................................................... 12
1.5 Export quantities and values of agricultural products .......................................................................... 13
1.6 Import quantities and values of agricultural products .......................................................................... 17
2. PADDY ............................................................................................................................................................ 20
2.1 Acreage under cultivation and production of dry paddy ...................................................................... 20
2.2 Paddy production, processing and destination ..................................................................................... 22
2.3 Export quantities and values of rice and export quantities according to destination country ............. 25
3 VEGETABLES .................................................................................................................................................. 27
3.1 Area under cultivation, production and export of vegetables .............................................................. 28
3.2 Average consumer prices of agricultural produce................................................................................ 30
4 BANANAS ....................................................................................................................................................... 32
4.1 Acreage under cultivation and production of bananas ......................................................................... 32
4.2 Export van bananas ............................................................................................................................... 33
5 PEANUTS ........................................................................................................................................................ 34
6 CITRUS FRUITS ............................................................................................................................................... 36
7 TUBERS .......................................................................................................................................................... 37
8 SOURCES: ....................................................................................................................................................... 40

Thematic analysis 3
INTRODUCTION
This report will attempt to provide the most correct thematic analysis of the recently held Fifth Agricultural Census and the regular statistics reports. It should be noted that the Fifth Agricultural Census was carried out in the following areas:
- The coastal plain (in 2008); - Paramaribo and the interior on a random sample basis (in 2009).
The regular statistics figures by the Statistics Department of the Ministry of Agriculture, Animal Husbandry and Fisheries provides an annual overview of the agricultural situation in Suriname. Considering the above it can be stated that there are differences to be observed. Nevertheless, the thread will be followed, allowing for conclusions and recommendations to be made to bring the Agricultural sector in Suriname on a higher level.

Thematic analysis 4
1 AGRICULTURAL CROPS AND PRODUCE
1.1 Area under cultivation with agricultural crops According to the last Fifth Agricultural Census Suriname has 10,234 farms. These cover a total surface area of 63,989.48 ha and fall under the following land titles:
- 21,084.63 ha (33 %) : land rented from the Government for a long period (> 40 years) - 10,010.29 ha (16 %) : land rented from the Government for a short period (≤ 40 Year) - 14,636.59 ha (23 %) : land under ownership title - 4,689.23 ha (7 %) : use - 3,733.18 ha (6 %) : land rented from private parties
- 1,312.47 ha (2 %) : occupation - 504.64 ha (1 %) : allocated - 7,342.55 ha (11 %) : Other - 675.89 ha (1 %) : Not mentioned
Figure 1: Surface area in percentages according to title on the land Source : Statistic data Fifth Agricultural census

Thematic analysis 5
Figure 1 shows that about half of the total land area, which is used by farmers for production activities, are leased from the government. Of the total land area only 23% has an ownership title. The remaining 27% is used by farms to generate income, but they have no legal title to the land in question. From this distribution, the conclusion can be drawn that individuals within this sector have a more or less dependent position with respect to their income security and therefore their food security.
Land rent or lease is common in Suriname. As a result of the developments regarding plots and land in recent decades on the basis of the above figures, the following questions arose:
- How secure is the farmer in terms of his source of income, which falls in the 16% / 33% - land leased from the government for the short term / long term?
- What can the government do to guarantee the income security of the farmer?
The Fifth Agricultural Census indicates that of 63989.48 hectares, 35% is used for growing annual crops, semi-perennial crops and perennial crops.
Figure 2: Farm acreage according to land use
Source : Statistic data Fifth Agricultural census
Figure 2 shows that 16546.5 hectares are used for the cultivation of annual crops, 4560.76 for semi-perennial crops, and 1368.82 for perennial crops.
However, the regular national statistical data, Table 1, indicate that annual and perennial crops occupy a larger area while semi-perennial crops occupy less surface area.

Thematic analysis 6
Table 1: Total rural area under cultivation (in ha) with annual, semi-perennial and perennial crops
Area under cultivation (in ha): 2008 2009 2010
ANNUAL CROPS 44,635 55,665 54,758
SEMI-PERENNIAL CROPS 2,221 2,422 2,555
PERENNIAL CROPS 2,704 3,019 3,004
Source : Agricultural statistical data 2004-2009 In the introduction was already stated that there will differences between the two data. The classification of crop groups may also have played a role. In the Fifth Agricultural Census annual crops included the following crop groups: leafy vegetables, fruiting vegetables, legumes, grains and tubers, while in the regular statistic data are included: paddy, maize, cassava, other tubers, peanuts (shelled), mung beans, other legumes , vegetables and watermelon. Also in the semi-perennial crops a difference in categorization is found: Crop groups according to the Fifth Agricultural Census: bananas, Lady Finger bananas, papaya, pineapple, passion fruit and sugar cane. Crop groups according to the regular statistics are: Lady Finger bananas, bananas, pineapple and passion fruit.
Perennial crops, according to the Fifth Agricultural Census: avocado, carambola, West Indian cherry, mango and various citrus fruits. For the regular statistics these are: coconuts, oranges, grapefruit, other citrus, papaya, mango and avocado. Because there no consistent crop group classification is used, it is difficult to draw conclusions.
It should be noted that in the agricultural sector papaya does not belong to the perennial crops, but the semi-perennial crops due to the fact that the plant goes after about 9 months in production and after a period of 3 - 4 years dies or or stops producing. Perennial crops last many years longer with their production.
Both from the data of the Fifth Agricultural Census as the regular statistics can be noted that the largest area planted is for annual crops. This is probably because of the crop group grains, more in particular rice.
1.2 Production of agricultural crops Table 2: overview of the amount of acreage under cultivation (in ha) of annual crops and the quantity of
production (in tons) in the period 2000-2010
DESCRIPTION Unit 2000 2001 2002 2003 2004 2005 2006 2007 2008 2009 2010
ANNUAL CROPS:
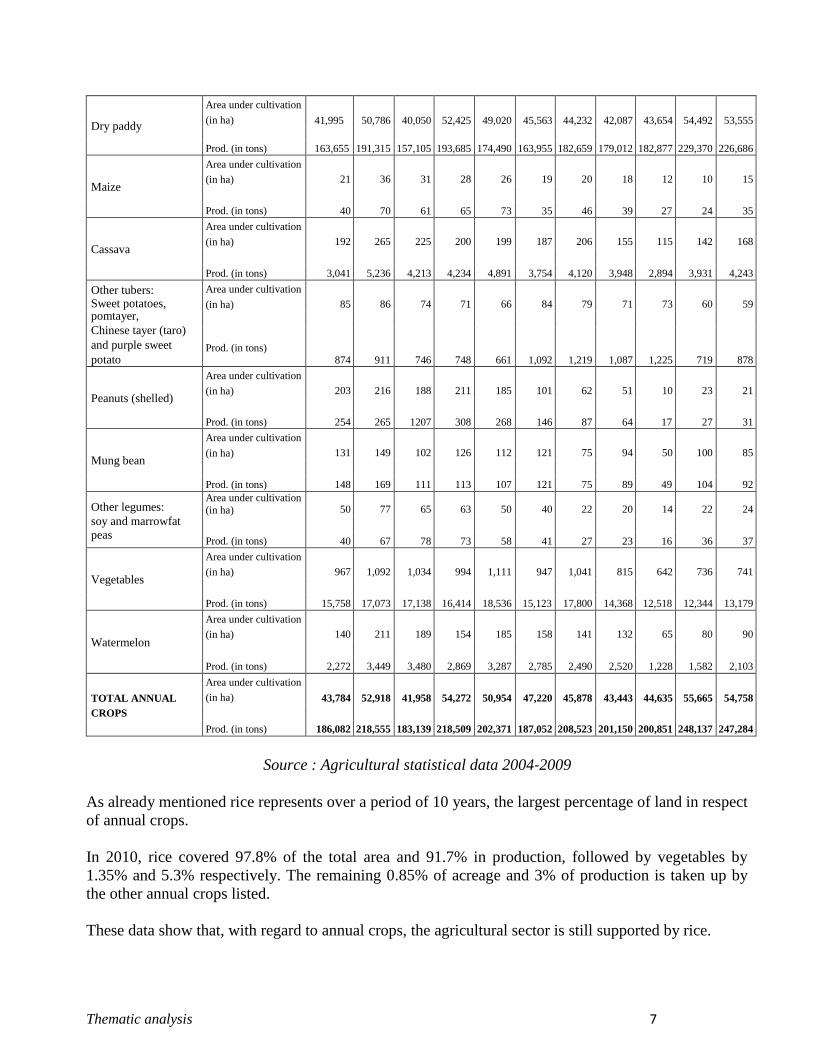
Thematic analysis 7
Dry paddy
Area under cultivation
(in ha) 41,995 50,786 40,050 52,425 49,020 45,563 44,232 42,087 43,654 54,492 53,555
Prod. (in tons) 163,655 191,315 157,105 193,685 174,490 163,955 182,659 179,012 182,877 229,370 226,686
Maize
Area under cultivation
(in ha) 21 36 31 28 26 19 20 18 12 10 15
Prod. (in tons) 40 70 61 65 73 35 46 39 27 24 35
Cassava
Area under cultivation
(in ha) 192 265 225 200 199 187 206 155 115 142 168
Prod. (in tons) 3,041 5,236 4,213 4,234 4,891 3,754 4,120 3,948 2,894 3,931 4,243
Other tubers: Sweet potatoes, pomtayer,
Chinese tayer (taro)
and purple sweet
potato
Area under cultivation
(in ha) 85 86 74 71 66 84 79 71 73 60 59
Prod. (in tons) 874 911 746 748 661 1,092 1,219 1,087 1,225 719 878
Peanuts (shelled)
Area under cultivation
(in ha) 203 216 188 211 185 101 62 51 10 23 21
Prod. (in tons) 254 265 1207 308 268 146 87 64 17 27 31
Mung bean
Area under cultivation
(in ha) 131 149 102 126 112 121 75 94 50 100 85
Prod. (in tons) 148 169 111 113 107 121 75 89 49 104 92
Other legumes:
soy and marrowfat
peas
Area under cultivation
(in ha) 50 77 65 63 50 40 22 20 14 22 24
Prod. (in tons) 40 67 78 73 58 41 27 23 16 36 37
Vegetables
Area under cultivation
(in ha) 967 1,092 1,034 994 1,111 947 1,041 815 642 736 741
Prod. (in tons) 15,758 17,073 17,138 16,414 18,536 15,123 17,800 14,368 12,518 12,344 13,179
Watermelon
Area under cultivation
(in ha) 140 211 189 154 185 158 141 132 65 80 90
Prod. (in tons) 2,272 3,449 3,480 2,869 3,287 2,785 2,490 2,520 1,228 1,582 2,103
TOTAL ANNUAL
CROPS
Area under cultivation
(in ha) 43,784 52,918 41,958 54,272 50,954 47,220 45,878 43,443 44,635 55,665 54,758
Prod. (in tons) 186,082 218,555 183,139 218,509 202,371 187,052 208,523 201,150 200,851 248,137 247,284
Source : Agricultural statistical data 2004-2009
As already mentioned rice represents over a period of 10 years, the largest percentage of land in respect
of annual crops.
In 2010, rice covered 97.8% of the total area and 91.7% in production, followed by vegetables by
1.35% and 5.3% respectively. The remaining 0.85% of acreage and 3% of production is taken up by
the other annual crops listed.
These data show that, with regard to annual crops, the agricultural sector is still supported by rice.

Thematic analysis 8
This entails that the agricultural sector has a high degree of risk sensitivity. If, because of some threat
to rice areas, for example salinization of the soil, the rice sector will fail, Suriname has a big problem.
This will be further discussed in chapter 2.
Table 3: overview of the amount of acreage under cultivation (in ha) of semi-perennial crops and the
quantity of production (in tons) in the period 2000-2010
DESCRIPTION Unit 2000 2001 2002 2003 2004 2005 2006 2007 2008 2009 2010
SEMI-
PERENNIAL
CROPS
Bananas
Area under cultivation
(in ha) 2,182 2,172 2,178 80 1,495 1,657 1,912 1,907 1,849 1,963 2,081
Prod. (in tons) 48,706 43,139 8,071 1,278 35,298 57,830 64,555 71,084 88,724 82,267 94,272
Plantain
Area under cultivation
(in ha) 496 536 482 443 381 309 252 402 332 424 440
Prod. (in tons) 10,782 12,481 11,449 11,843 11,684 8,815 5,052 10,237 9,384 14,493 12,330
Pineapple
Area under cultivation
(in ha) 25 25 23 25 26 27 25 25 20 20 20
Prod. (in tons) 360 375 290 375 360 425 336 375 300 300 425
Papaya
Area under cultivation
(in ha) 10 15 20 14 14 8 11 10 12 18 17
Prod. (in tons) 165 241 315 257 260 142 227 198 277 393 346
Passion fruit
Area under cultivation
(in ha) 21 30 36 40 25 22 14 12 20 15 14
Prod. (in tons) 260 390 506 493 316 263 191 231 279 220 190
TOTAL SEMI
PERENNIAL CROPS
Area under cultivation
(in ha) 5,399 3,457 3,086 3,034 2,791 2,948 2,903 2,967 2,716 3,037 3,021
Prod. (in tons) 60,273 56,626 20,631 14,246 47,918 67,465 70,161 82,125 98,964 97,673 107,563
Source : Agricultural statistical data 2004-2009
For the correctness the data for the papaya crop was included in the group of semi-perennial crops, and
not that of the perennial crops.
The overall data will differ somewhat from the original data of the regular statistics.
Table 3 shows that the banana crop in 2003 experienced a significant decline, and in 2004, after
converting the company Surland into the Foundation for the Preservation of the Banana Sector (SBBS)
went back into production. From 2004 to 2010, the production showed virtually an upward trend.

Thematic analysis 9
Table 3 also shows that this crop also occupies the largest percentage of the semi-perennial crops
followed by plantain.
Table 4: overview of the amount of acreage under cultivation (in ha) of perennial crops and the
quantity of production (in tons) in the period 2000-2010
DESCRIPTION Unit 2000 2001 2002 2003 2004 2005 2006 2007 2008 2009 2010
PERENNIAL
CROPS:
Coconut
Area under cultivation
(in ha) 1,082 1,078 1,036 962 840 827 781 777 771 813 822
Prod. (in tons) 8,517 8,056 10,033 10,273 6,137 5,144 4,971 7,116 8,508 9,014 8,709
Oranges
Area under cultivation
(in ha) 1,341 1,294 1,283 1,245 1,252 1,307 1,280 1,321 1,216 1,420 1,414
Prod. (in tons) 9,817 10,445 11,335 13,037 12,400 13,039 13,610 13,651 13,454 12,709 15,138
Grapefruit
Area under cultivation
(in ha) 139 135 141 119 114 117 113 107 110 105 113
Prod. (in tons) 819 1,062 1,026 1,052 974 927 921 879 1,141 1,252 1,314
Other citrus fruits*
Area under cultivation
(in ha) 258 260 312 410 317 400 421 470 388 377 359
Prod. (in tons) 1,948 2,192 2,537 3,014 2,877 2,850 4,270 5,087 4,525 4,008 4,026
Avocado***
Area under cultivation
(in ha) 7 7 8 7 7 3 5 4 7 8 8
Prod. (in tons) 62 75 85 74 70 49 56 92 133 153 140
Mango
Area under cultivation
(in ha) 144 163 157 141 141 129 109 103 69 91 90
Prod. (in tons) 1,341 1,748 1,845 1,711 1,693 1,384 1,465 1,226 996 1,639 1,149
Others perennial
crops*
Area under cultivation
(in ha) 508 490 109 122 92 149 172 165 131 187 181
Prod. (in tons) 1,349 1,074 1,144 1,439 1,263 1,508 1,877 1,709 1,770 2,698 2,549
TOTAL
PERENNIAL
CROPS
Area under cultivation
(in ha) 5,379 3,427 3,046 3,006 2,763 2,932 2,881 2,946 2,692 3,001 2,987
Prod. (in tons) 23,853 24,652 28,005 30,600 25,414 24,901 27,170 29,760 30,527 31,473 33,025
* Other citrus fruits: Pomelo, Mandarin, Lime, Tangelo, Lemon, Yellow and Red King
** Other perennial crops: Cocoa, coffee, soursop, West Indian cherry, guava, sapodilla, Spanish lime and rambutan
Source : Agricultural statistical data 2004-2009
Table 4 shows that for perennial crops the orange crop takes the lead followed by coconuts.

Thematic analysis 10
It is striking that the crop group "other citrus", for the period 2000 to 2005 covered an average planted
acreage of 2,570 ha with an average production of 326 tons. In the period 2006 to 2010, the average
area planted was 4,383 hectares with an average production of 403 tons. The increase in planted
acreage is about 70% while the increase in production is only 24%.
This may be due to the fact that it concerns perennial crops. The acreage was planted but the trees are
yet to come into production.
Table 5: total overview of the amount of acreage under cultivation (in ha) of perennial crops and the
total quantity produced (in tons) in the period 2000-2010 for annual, semi-perennial and
perennial crops
DESCRIPTION Unit 2000 2001 2002 2003 2004 2005 2006 2007 2008 2009 2010
ANNUAL
CROPS
Area under cultivation
(in ha) 43,784 52,918 41,958 54,272 50,954 47,220 45,878 43,443 44,635 55,665 54,758
Prod. (in tons) 186,082 218,555 183,139 218,509 202,371 187,052 208,523 201,150 200,851 248,137 247,284
SEMI-
PERENNIAL
CROPS
Area under cultivation
(in ha) 5,399 3,457 3,086 3,034 2,791 2,948 2,903 2,967 2,716 3,037 3,021
Prod. (in tons) 60,273 56,626 20,631 14,246 47,918 67,465 70,161 82,125 98,964 97,673 107,563
PERENNIAL
CROPS
Area under cultivation
(in ha) 5,379 3,427 3,046 3,006 2,763 2,932 2,881 2,946 2,692 3,001 2,987
Prod. (in tons) 23,853 24,652 28,005 30,600 25,414 24,901 27,170 29,760 30,527 31,473 33,025
GENERAL
TOTAL
Area under cultivation
(in ha) 51,8897 59,123 47,743 57,880 55,658 52,175 50,973 48,746 49,560 61,106 60,317
Prod. (in tons) 270,208 299,833 231,775 263,355 275,703 279,428 306,054 313,035 330,342 377,283 387,872
Source : Agricultural statistical data 2004-2009
Tables 2 and 5, and Figures 3a and 3b show very clearly that the Surinamese agricultural sector is
dependent on the annual crops and, in particular, the rice crop.
The semi-perennial and perennial crops have remained fairly constant after 2000 and differ little or not
from each other in area under cultivation.
As regards the production, there is however a significant difference between the semi-perennial and
perennial crops. The former have almost twice as high a production than the perennial crops. The
earlier mentioned reason, semi-perennial crops become productive earlier, while perennial crops have
to wait several years before the first production occurs.

Thematic analysis 11
Figure 3a: Overview of the total area under
cultivation (in 1,000 ha) of annual,
semi-perennial and perennial crops
in the period 2000 to 2010
Figure 3b: Overview of the total production
(in 1,000 ha) of annual, semi-
perennial and perennial crops in
the period 2000 to 2010
1.3 Prices of agricultural produce (farm gate prices) Table 6: The farm gate prices (in Srd) of agricultural products in the period 2004 - 2010
DESCRIPTION IN SRD PER KG
2004 2005 2006 2007 2008 2009 2010
ANNUAL CROPS:
Dry paddy 0.28 0.32 0.34 0.39 0.92 0.56 0.64
Corn (grains) 1.25 1.58 3.00 2.62 4.19 4.75 4.85
Cassava 0.62 0.93 1.69 1.93 1.78 1.65 1.48
Other tubers 1.65 1.88 3.17 3.17 3.94 4.18 7.51
Peanuts (shelled) 4.00 3.75 4.10 4.15 6.04 6.26 6.00
Mung bean 4.80 4.80 6.90 6.02 7.76 9.68 9.15
Other legumes: soy and
marrowfat peas 6.20 4.70 4.70 5.05 6.98 8.66 8.56
Vegetables 1.73 2.27 2.78 2.80 2.70 3.33 4.12
Watermelon 0.83 0.94 1.10 1.62 2.16 1.72 1.55
SEMI-PERENNIAL CROPS
Bananas 0.74 0.75 0.84 0.86 0.96 1.27 0.97
Plantain 1.05 1.21 1.54 1.44 1.57 2.03 1.46
Pineapple 1.76 2.07 4.33 3.83 3.83 3.96 4.76
Passion fruit 1.23 1.40 1.84 2.29 2.23 3.36 4.22
PERENNIAL CROPS:
Coconuts 0.88 0.96 0.65 0.71 1.30 1.31 1.33
Oranges 0.88 1.48 2.05 1.74 1.82 2.37 2.10
Grapefruit 0.89 1.13 1.64 1.66 1.40 1.13 1.23
Other citrus fruits 1.73 2.22 2.29 3.12 4.26 4.04 3.75
Papaya 0.70 1.32 2.25 3.15 2.65 2.89 3.57
Avocado 1.70 3.64 4.95 4.50 5.44 4.54 4.20
Mango 1.94 2.82 3.39 2.66 2.65 2.74 2.68
Source : Agricultural statistical data 2004-2009
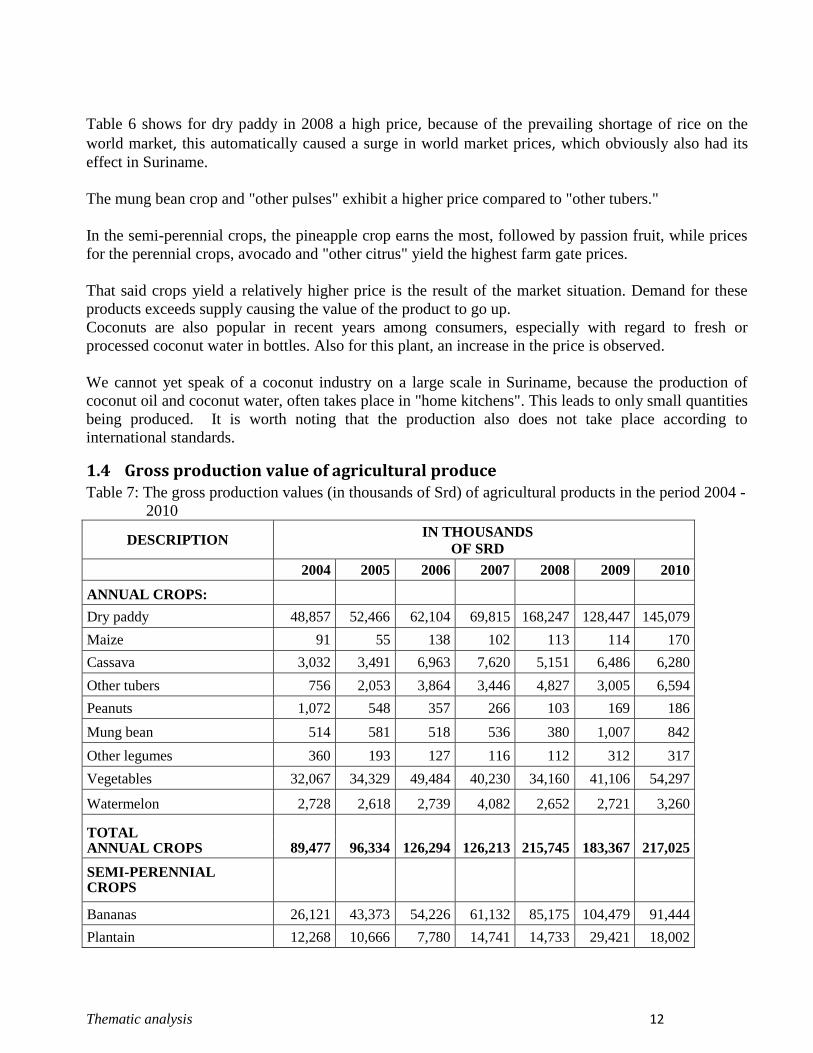
Thematic analysis 12
Table 6 shows for dry paddy in 2008 a high price, because of the prevailing shortage of rice on the
world market, this automatically caused a surge in world market prices, which obviously also had its
effect in Suriname.
The mung bean crop and "other pulses" exhibit a higher price compared to "other tubers."
In the semi-perennial crops, the pineapple crop earns the most, followed by passion fruit, while prices
for the perennial crops, avocado and "other citrus" yield the highest farm gate prices.
That said crops yield a relatively higher price is the result of the market situation. Demand for these
products exceeds supply causing the value of the product to go up.
Coconuts are also popular in recent years among consumers, especially with regard to fresh or
processed coconut water in bottles. Also for this plant, an increase in the price is observed.
We cannot yet speak of a coconut industry on a large scale in Suriname, because the production of
coconut oil and coconut water, often takes place in "home kitchens". This leads to only small quantities
being produced. It is worth noting that the production also does not take place according to
international standards.
1.4 Gross production value of agricultural produce Table 7: The gross production values (in thousands of Srd) of agricultural products in the period 2004 -
2010
DESCRIPTION IN THOUSANDS
OF SRD
2004 2005 2006 2007 2008 2009 2010
ANNUAL CROPS:
Dry paddy 48,857 52,466 62,104 69,815 168,247 128,447 145,079
Maize 91 55 138 102 113 114 170
Cassava 3,032 3,491 6,963 7,620 5,151 6,486 6,280
Other tubers 756 2,053 3,864 3,446 4,827 3,005 6,594
Peanuts 1,072 548 357 266 103 169 186
Mung bean 514 581 518 536 380 1,007 842
Other legumes 360 193 127 116 112 312 317
Vegetables 32,067 34,329 49,484 40,230 34,160 41,106 54,297
Watermelon 2,728 2,618 2,739 4,082 2,652 2,721 3,260
TOTAL ANNUAL CROPS 89,477 96,334 126,294 126,213 215,745 183,367 217,025
SEMI-PERENNIAL CROPS
Bananas 26,121 43,373 54,226 61,132 85,175 104,479 91,444
Plantain 12,268 10,666 7,780 14,741 14,733 29,421 18,002

Thematic analysis 13
Pineapple 634 880 1,455 1,436 1,149 1,188 2,023
Passion fruit 389 368 351 529 622 739 802
TOTAL SEMI-PERENNIAL CROPS 39,412 55,287 63,812 77,838 101,679 135,827 112,271
Source : Agricultural statistical data 2004-2009
Continued: “Table 7: The gross production values (in thousands of Srd) of agricultural products in the
period 2004 - 2010”
DESCRIPTION IN THOUSANDS
OF SRD
2004 2005 2006 2007 2008 2009 2010
PERENNIAL CROPS:
Coconuts 5,401 4,938 3,231 5,052 11,060 11,808 11,583
Oranges 10,912 19,298 27,901 23,753 24,486 30,120 31,790
Grapefruit 867 1,048 1,510 1,459 1,597 1,415 1,616
Other citrus fruits 4,977 6,327 9,778 15,871 19,277 16,192 15,098
Papaya 182 187 511 624 734 1,136 1,235
Avocado 119 178 277 414 724 695 588
Mango 3,284 3,903 4,966 3,261 2,639 4,491 3,079
TOTAL PERENNIAL CROPS: 25,742 35,879 48,174 50,434 60,517 65,857 64,989
TOTAL AGRICULTURAL PROD. 154,631 187,500 238,280 254,485 377,941 385,051 394,285
Source : Agricultural statistical data 2004-2009
The gross production value is calculated by multiplying the production (in kilograms) by the farm gate
price.
1.5 Export quantities and values of agricultural products Agricultural products that are being exported are: rice, bananas, vegetables, tubers, fruit, processed vegetables, fruits and other plant parts and flowers. The below figures (4 to 9) indicate the development of the export quantity and the accompanying value
per export product in the period 2005 to 2010.

Thematic analysis 14
Figure 4: development of export quantity and
export value of the rice crop in the
period 2005 - 2010
Figure 5: development of export quantity and
export value of the banana crop in
the period 2005 - 2010
In Figure 4, the peak of the export value of rice in 2008 is clearly shown. As previously indicated, the
rise in the world market price was responsible for this. In 2009, the value stabilized at the normal level
to rise again in 2010.
Importantly, from 2008, whether or not to a small extent, the trend of the export value exceeds the
trend of the export quantity.
For the banana crop both the decrease in export quantity in 2009 as the increase in the export value in
the same year is striking in Figure 5. Although less was exported, the export value was higher as a
result of the higher world market price.
In both cases, both for the rice and banana crop, it can be clearly seen how sensitive the Surinamese
agricultural sector is for the world market price. In the above cases , there was increase in the world
market price, which has been favorable, but what are the consequences if the world market price falls,
and how will we deal with that.
Figure 6: development of the export quantity
and export value of vegetables and
tubers in the period 2005 - 2010
Figure 7: development of the export quantity
and export value of fruit in the
period 2005 - 2010

Thematic analysis 15
Figure 6 shows a reasonably stable development of both the export quantity and export value. In this
case, the development of the export value is higher than that of the export quantity which indicates that
a relatively higher value has been paid per unit of product.
This is in contrast to the results in Figure 7, in which the two curves virtually fit on each other which
means that the ratio of the export quantity and export value is nearly 1 to 1.
Figure 8: development of the export quantity
and export value of processed
vegetables, fruits and plant parts in the period 2005 - 2010
Figure 9: development of the export quantity
and export value of flowers in the
period 2005 - 2010
The trend for processed vegetables, fruits and plant parts in Figure 8 shows for both the export quantity
and export value an increase. So there is a demand for processed products and the price per unit of
product is relatively high, indicating that there is potential in this export group.
For the crop flowers Figure 9 shows a decreasing trend for the export quantity. The trend of the export
value is indeed higher than the development of the exports quantity, but the peak period in 2007-2008
was continued with a major decline in 2009. Only in 2010 a slight increase occurred.
The above figures indicate that washed vegetables and tubers, and processed vegetables, fruits and
plant parts have a lot of potential. The value per product unit is relatively high and an increasing trend
can be seen in both the export quantity and export value.
The washed rice and bananas will probably always remain interesting but at the same time depend on
what is happening in the world market.
Since these two plants represent more than 90% of the total export volume and total export value of
plant agricultural products, it is important to draft a risk management plan for both sectors. Here the
risks are identified and described, their impact on the sectors is mapped and it is clearly stated how to
respond to these.

Thematic analysis 16
The total amount of plant agricultural export products and their export value for the period 2005 - 2010
is as follows:
Table 8: the export quantity (in tons) and export value (in SRD 1000) of plant agricultural products
during the period 2005-2010
DESCRIPTION UNIT 2004 2005 2006 2007 2008 2009 2010
QUANTITY
Rice tons 52,280 35,877 41,462 52,500 52,641 51,941 89,412
Bananas ,, 20,121 38,388 47,005 57,135 65,750 58,132 70,239
Vegetables and tubers ,, 2,732 2,873 2,390 2,783 2,936 2,757 3,239
Fruit (excl. Bananas) ,, 621 522 297 282 273 160 1,122
Preparation of vegetables, fruits and plant parts ,, 39 96 34 169 332 339 401
Flower cultivation ,, 339 204 256 206 257 145 102
TOTAL QUANTITY AGRICULTURAL
PROD. tons 76,132 77,960 91,444 113,075 122,189 113,474 164,515
VALUE:
Rice SRD1000 33,260 24,742 32,017 42,853 90,477 58,950 105,213
Bananas ,, 14,759 28,664 35,196 46,219 63,447 73,608 67,987
Vegetables and tubers ,, 2,925 3,724 3,587 4,408 4,665 4,193 5,289
Fruit (excl. Bananas) ,, 593 491 330 305 374 217 1,238
Preparation of vegetables, fruits and plant parts ,, 88 390 114 374 549 586 711
Flower cultivation ,, 671 457 391 859 855 372 404
TOTAL EXPORT VALUE OF
AGRICULTURAL PRODUCTS SRD1000 52,296 58,468 71,635 95,018 160,367 137,926 180,842
Source : Agricultural statistical data 2004-2009

Thematic analysis 17
Figure 10: diagram of the total export and import value of vegetable agricultural products in the period
2005 - 2010
The total export quantity has clearly increased in the period 2009 - 2010 The development of the export
value is since 2008 higher than the development of the export quantity.
1.6 Import quantities and values of agricultural products Suriname exports around 6 crops (see Chapter 1.5) and imports according to Table 9 more than twice
as many product groups.
Table 9: overview of the total import quantities (in tons) of vegetable agricultural products in the
period 2004 - 2010
DESCRIPTION UNIT 2004 2005 2006 2007 2008 2009 2010
QUANTITY:
Vegetables and tubers tons 11,702 14,248 13,360 15,913 15,245 15,294 15,647
Vegetable fats and oils ,, 8,211 8,827 10,149 9,838 11,350 10,805 12,322
Prep. of vegetables, fruits and other plant parts ,, 6,729 8,082 6,971 7,122 7,533 23,210 10,056
Coffee, tea, maté and spices ,, 403 408 410 377 506 391 364
Cocoa and cocoa products ,, 648 636 641 686 783 1,020 26
Sugar and confectionery ,, 18,177 20,533 18,729 22,892 22,662 19,282 22,626
Products for human consumption * ,, 5,567 6,245 7,781 7,733 7,656 7,486 3,868
Grains ,, 18,655 21,560 24,202 17,460 29,002 14,759 38,527
Flour, starch, wheat gluten ,, 18,119 19,107 20,311 21,258 19,774 22,041 17,221
Oil containing seeds and fruits ,, 7,339 8,452 3,271 748 895 675 612
Preparations of grains, flour, starch ,, 2,900 3,055 3,405 3,308 3,875 3,937 2,246
Beverages, alcohol-containing fluids and vinegar ,, 13,808 16,604 22,873 18,829 17,181 18,196 17,608
Flower cultivation ,, 19 38 28 42 35 42 35
Fruit ,, 1,224 1,805 1,672 1,752 1,912 2,114 3,397
TOTAL QUANTITY OF AGRICULTURAL
PRODUCTS tons 113,501 129,600 133,803 127,958 138,409 139,252 144,555
*: extracts, scents, concentrates, yeast, sauces, preparations for soup, consumption ice cream and other products for human
consumption.
Source : Agricultural statistical data 2004-2009
If Tables 8 and 9 are compared, then it appears that from 2004 to 2009 more was imported in various
products than was exported. Only in 2010 was 20,000 less imported than exported. In comparison with
the previous years more was imported, but in 2010 much more rice and bananas were exported, so that
the total export quantity increased significantly.

Thematic analysis 18
Figure 11 gives the diagrammatic course of both the import and export quantity in the period 2004 - 2010.
Figure 11: diagram of the total import and export quantity of vegetable
agricultural products in the period 2005 - 2010
The most optimal situation is when of course the progress of the export quantity exceeds that of the
import quantity.
If the trend of 2010 is continued, including the groups of vegetables and tubers, prepared vegetables,
fruit and other plant parts and the flower cultivation, the conclusion could be drawn that Suriname is on
the right track.

Thematic analysis 19
Table 10: overview of the total import quantities (in Srd 1,000) of vegetable agricultural products in
the period 2004 - 2010
DESCRIPTION UNIT 2004 2005 2006 2007 2008 2009 2010
VALUE:
Vegetables and tubers SRD1000 11,714 12,957 17,622 12,454 19,238 18,445 27,690
Vegetable fats and oils ,, 23,708 34,377 27,878 32,216 53,082 38,122 43,815
Prep. of vegetables, fruits and other plant parts ,, 15,321 19,359 18,867 21,214 24,627 27,565 31,641
Coffee, tea, maté and spices ,, 2,983 2,804 3,398 3,198 5,358 3,172 3,792
Cocoa and cocoa products ,, 3,658 4,117 4,515 5,087 5,816 6,697 303
Sugar and confectionery ,, 20,701 26,411 30,289 29,937 35,816 35,457 48,560
Products for human consumption * ,, 38,653 46,026 54,869 74,481 64,746 66,935 25,396
Grains ,, 10,182 12,013 14,691 14,143 28,388 15,243 27,515
Flour, starch, wheat gluten ,, 19,690 19,684 22,409 28,433 38,121 34,569 25,292
Oil containing seeds and fruits ,, 9,102 9,553 4,510 2,049 2,837 2,504 2,416
Preparations of grains, flour, starch ,, 13,333 14,796 17,103 18,454 24,224 23,581 13,615
Beverages, alcohol-containing fluids and
vinegar ,,
24,191 43,617 42,363 41,370 41,595 52,136 50,971
Flower cultivation ,, 590 813 543 629 518 1,868 662
Fruit ,, 2,702 3,985 4,810 5,653 6,143 6,905 9,387
TOTAL VALUE AGRICULTURAL
PRODUCTS SRD1000 196,528 250,512 263,867 289,318 350,509 333,199 311,055
*: extracts, scents, concentrates, yeast, sauces, preparations for soup, consumption ice cream and other products for human
consumption.
Source : Agricultural statistical data 2004-2009
Figure 12: diagram of the import and export values of 2004 - 2010

Thematic analysis 20
2 PADDY
2.1 Acreage under cultivation and production of dry paddy Table 11: overview of the amount of acreage under cultivation (in ha) and the quantity of paddy
production (in tons) in the period 2000-2010
DESCRIPTION UNIT 2000 2001 2002 2003 2004 2005 2006 2007 2008 2009 2010
PADDY ACREAGE:
Standing Acreage ha 49,350 49,350 49,350 49,350 50,790 50,790 50,790 50,790 50,790 50,790 50,790
Area under cultivation: Spring ,, 24,385 23,637 17,630 25,885 21,583 23,022 21,769 21,521 19,903 26,255 26,840
Fall ,, 17,610 27,149 22,420 26,540 27,437 22,541 22,463 20,566 23,751 28,237 26,715
TOTAL AREA UNDER
CULTIVATION ha 41,995 50,786 40,050 52,425 49,020 45,563 44,232 42,087 43,654 54,492 53,555
Total area under cultivation
of which: ha 41,995 50,786 40,050 52,425 49,020 45,563 44,232 42,087 43,654 54,492 53,555
- Small-scale agriculture ,, 18,207 19,381 17,052 24,365 23,950 23,027 23,589 23,135 24,223 24,193 25,542
- Factory farming ,, 23,788 31,405 22,998 28,060 25,070 22,536 20,643 18,952 19,431 30,299 28,013
Total area under cultivation
according to region:
- Nickerie ,, 37,925 45,978 36,473 48,606 45,695 42,984 41,766 40,311 41,648 52,371 51,660
- Other districts ,, 4,070 4,808 3,577 3,819 3,325 2,579 2,466 1,776 2,006 2,121 1,895
PADDY PRODUCTION:
- Spring tons 93,750 93,260 68,192 93,920 67,710 79,149 89,579 90,322 83,980 110,560 118,624
- Fall ,, 69,905 98,055 88,913 99,765 106,780 84,806 93,080 88,690 98,897 118,810 108,062
TOTAL PRODUCTION tons 163,655 191,315 157,105 193,685 174,490 163,955 182,659 179,012 182,877 229,370 226,686
Total production of which: tons 163,655 191,315 157,105 193,685 174,490 163,955 182,659 179,012 182,877 229,370 226,686
- Small-scale agriculture ,, 75,887 78,975 71,140 97,810 89,515 89,970 101,960 101,627 103,299 102,272 114,322
- Factory farming ,, 87,768 112,340 85,965 95,875 84,975 73,985 80,699 77,385 79,578 127,098 112,364
Total production by region:
- Nickerie ,, 150,115 175,776 144,140 181,883 163,466 155,300 174,212 173,485 175,284 221,751 219,551
- Other districts ,, 13,540 15,539 12,965 11,802 11,024 8,655 8,447 5,527 7,593 7,619 7,135
Source : Agricultural statistical data 2004-2009
In table 11 a distinction is made in spring and fall season The planting in the spring season is the period
from the second week of November until end of December and the fall is from the second week of May
to end of June.
As these periods depend strongly on the weather circumstances, and Suriname is also subject to
climatological changes, the periods can fall these days earlier or later.
The distinction in small-scale farming and factory farming has to do with the acreage size. Farms
having an acreage size of 0.1-12 ha fall under - Small-scale agriculture while farms having an acreage
size larger than 12 ha fall under - Factory farming.

Thematic analysis 21
Table 11 shows that the major part of paddy production takes place in the District of Nickerie.
Remarkably, the difference in area under cultivation between farms in small-scale farms and factory
farms is not significant (Figure 13) and that even if less is planted by the small-scale farms sometimes
their harvests are larger than the factory farms (Figure 14).
The reason for this could be that the companies in factory farming do not work efficiently or hardly
efficiently so that an optimum production is not obtained.
Figure 13: overview of the area under cultivation (in ha) in the small-scale and factory farms over the
period 2000-2010
Figure 14: overview of the paddy production (in tons) in the small-scale and factory farms over the
period 2000-2010
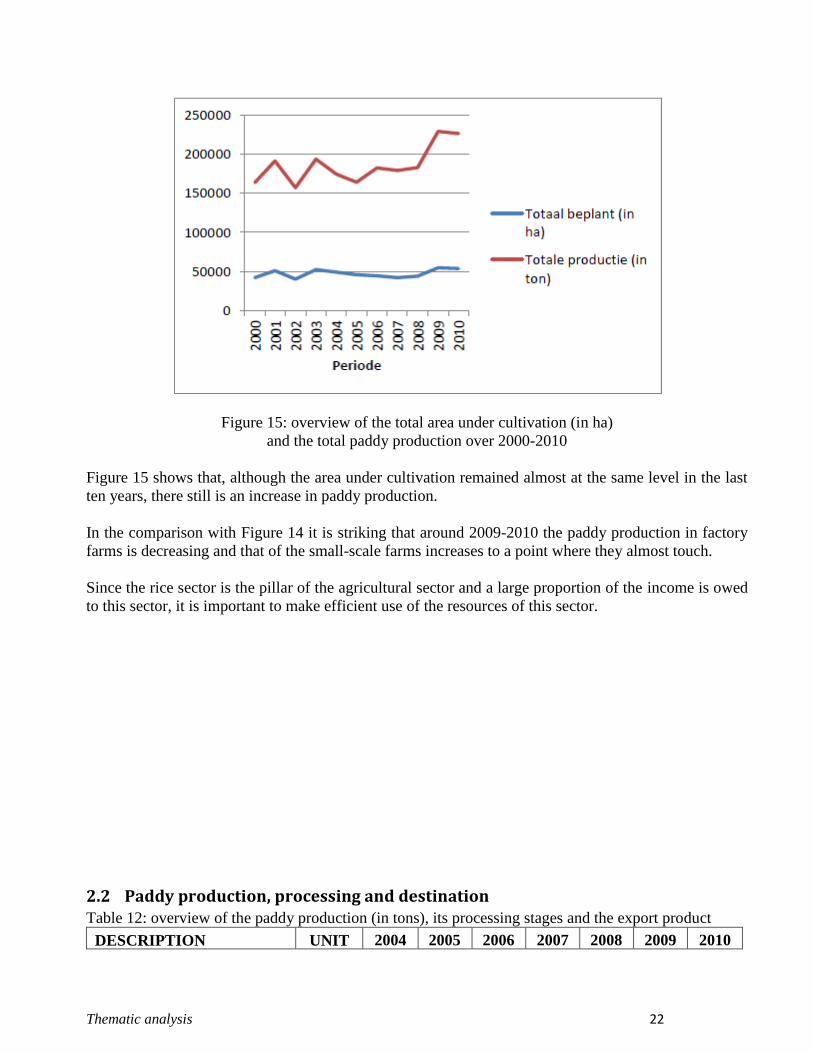
Thematic analysis 22
Figure 15: overview of the total area under cultivation (in ha)
and the total paddy production over 2000-2010
Figure 15 shows that, although the area under cultivation remained almost at the same level in the last
ten years, there still is an increase in paddy production.
In the comparison with Figure 14 it is striking that around 2009-2010 the paddy production in factory
farms is decreasing and that of the small-scale farms increases to a point where they almost touch.
Since the rice sector is the pillar of the agricultural sector and a large proportion of the income is owed
to this sector, it is important to make efficient use of the resources of this sector.
2.2 Paddy production, processing and destination Table 12: overview of the paddy production (in tons), its processing stages and the export product
DESCRIPTION UNIT 2004 2005 2006 2007 2008 2009 2010

Thematic analysis 23
1. Standing Acreage ha 50,790 50,790 50,790 50,790 50,790 50,790 50,790
2. Area under cultivation ,, 49,020 45,563 44,232 42,087 43,654 54,492 53,555
3. Cropping intensity ,, 0.97 0.90 0.87 0.83 0.86 1.07 1.05
4. Wet paddy (21% humidity) tons 190,076 178,600 198,975 195,002 199,212 249,858 246,935
5. Wet paddy (14% humidity
91.8% of wet paddy) ,, 174,490 163,955 182,659 179,012 182,877 229,370 226,686
(Control) ,, 174,490 163,955 182,659 179,012 182,877 229,370 226,686
6. Sowing seed 140 kg/ha ,, 6,863 6,379 6,192 5,892 6,112 7,629 7,498
7. Animal fodder + transport
losses (4% of 5) ,, 6,980 6,558 7,306 7,160 7,315 9,175 9,067
8. Dry paddy prior to
processing (5-
(6+7) ,, 160,647 151,018 169,160 165,959 169,450 212,566 210,121
9. Chaff and husking losses ,, 38,555 36,244 40,598 39,830 40,668 51,016 50,429
10. Cargo deliveries (8-9) ,, 122,092 114,774 128,562 126,129 128,782 161,550 159,692
11. Export Cargo* ,, 17,883 20,992 10,941 16,567 28,069 28,849 36,409
12. Remaining cargo for
domestic processing (10-11) ,, 104,209 93,782 117,621 109,562 100,713 132,701 123,283
13.
White rice (82% broken of
12) ,, 85,451 76,901 96,449 89,841 82,585 108,815 101,092
14. Export white rice (various
broken) ,, 34,397 14,885 30,521 35,933 24,572 23,092 53,003
15. Tot. domestic cons. +
stocks (13-14) ,, 51,054 62,016 65,928 53,908 58,013 85,723 48,089
16. Sharps (18% of 12) ,, 18,758 16,881 21,172 19,721 18,128 23,886 22,191
17. Export value rice products SRD1000 33,260 24,742 32,017 42,853 90,477 58,950 105,213
18. Total export (11+14) tons 52,280 35,877 41,462 52,500 52,641 51,941 89,412
19. % Export Cargo % 34.2 58.5 26.4 31.6 53.3 55.5 40.7
20. % Export white rice % 65.8 41.5 73.6 68.4 46.7 44.5 59.3
Source : Agricultural statistical data 2004-2009
Table 12 provides a clear overview of the paddy production (wet and dry paddy) and their breakdown
into components.
The processing chain of paddy is as follows:

Thematic analysis 24
Figure 16: paddy processing chain

Thematic analysis 25
2.3 Export quantities and values of rice and export quantities according to
destination country Table 13: overview of the export quantity (in tons) and the export value (in Srd) of paddy products in
the period 2005-2009
DESCRIPTION UNIT 2005 2006 2007 2008 2009
2010
QUANTITY:
White rice tons 13,974 30,136 31,733 24,217 22,597
Broken rice ,, 911 385 4,200 355 495
Cargo rice ,, 20,992 10,941 16,567 27,199 28,758
Parboiled rice ,, - - - 870 91
TOTAL tons 35,877 41,462 52,500 52,641 51,941
VALUE:
White rice SRD1000 10,461 23,945 28,912 41,376 27,009
Broken rice ,, 905 536 2,123 850 1,162
Cargo rice ,, 13,376 7,536 11,818 46,725 30,606
Parboiled rice ,, - - - 1,526 173
TOTAL SRD1000 24,742 32,017 42,853 90,477 58,950 AVERAGE EXPORT VALUE/ TON
White rice SRD 749 795 911 1,709 1,195
Broken rice ,, 993 1,392 505 2,394 2,347
Cargo rice ,, 637 689 713 1,718 1,064
Parboiled rice ,, - - - 1,754 1,901
Source : Agricultural statistical data 2004-2009
Table 13 shows that the export quantity of white rice has fallen in the past years while cargo rice
exports increased. Broken rice and parboiled rice are a small part of the export quantity. At the time of
drawing up of this report the data for the year 2010 were not yet available.

Thematic analysis 26
Figure 17a: development of the export quantity Figure 17b: overview of the average
(in tons) for the various paddy products export value (in Srd) for the
in the period 2005-2009 various paddy export products in the
period 2005-2009
Figure 17a and 17b show the development of the export quantity in tons and export values in
Surinamese dollars in the period 2005 to 2009.
From Table 13, Figures 17a and 17b can be concluded that although more white rice is exported than
broken rice, the average export value of broken rice is still higher, almost twice as high as white rice.
It is notable that the average export value of white rice in 2009 is the lowest compared with the other
products.
Table 14 shows that paddy products are being exported to the Caribbean, countries in South America,
Europe, and a very small part to some countries in North and Central America.

Thematic analysis 27
Table 14: Overview of the export quantities (in tons) by country of destination
DESTINATION COUNTRY
REGION AND COUNTRY: UNIT 2005 2006 2007 2008 2009 2010
Caribbean
Aruba tons 94 1,072 2,241 143 141
Dominican Republic ,, 225 50 - - -
Guadeloupe ,, 253 276 923 1,993 542
Haiti ,, 500 10,152 12,128 5,600 2,218
Jamaica ,, 3,188 5,450 7,412 6,798 11,046
Martinique ,, 1,056 748 792 354 313
The Netherlands Antilles ,, 3,506 25 1,549 32 50
Trinidad ,, 52 313 138 1,049 719
Other ,, 1,625 200 - - 24
TOTAL tons 10,499 18,286 25,183 15,969 15,053
South America
Brazil ,, 105 25 245 - -
French Guiana ,, 442 387 622 495 889
Guyana ,, 1,503 11,740 8,006 7,000 11,910
Other ,, - - - - -
TOTAL tons 2,050 12,152 8,873 7,495 12,799
North and Central America
Belize ,, - 50 - - -
US ,, - - - 250 -
Other ,, 2,230 - 20 - -
TOTAL tons 2,230 50 20 250 0
Europe
Belgium ,, 303 50 - - 175
Germany ,, - - 626 25 -
France ,, 1,260 1,986 1,402 1,274 1,696
The Netherlands ,, 10,317 7,406 13,570 18,684 21,174
Portugal ,, 8,092 1,457 69 8,515 46
Switzerland ,, 253 - - - -
Other ,, 125 75 653 300 998
TOTAL tons 20,350 10,974 16,320 28,798 24,089
Other regions tons 748 0 2,104 129 0
GRAND TOTAL: tons 35,877 41,462 52,500 52,641 51,941
Source : Agricultural statistical data 2004-2009
3 VEGETABLES

Thematic analysis 28
This part of the report will highlight specifically the following vegetables in respect of the area under
cultivation and the production in the period 2000-2010:
- tomato
- cabbage
- beans
- string beans
- tayerblad (arrowleaf elephant ear)
- Amsoi (Brassica chinensis), kaisoi (Brassica juncea), paksoi (Brassica campestris var.
chinensis)
- eggplant
- cucumber
- pumpkin
- sopropo, bitter melon (Momordica charantia)
- okra
- antruwa (Solanum macrocarpum)
- Other vegetables
3.1 Area under cultivation, production and export of vegetables

Thematic analysis 29

Thematic analysis 30
Figure 18 to Figure 29 show the production graphs of different vegetable crops.
All figures show that the size of the area under cultivation has remained virtually constant. All the
more striking is that the production does show large fluctuations. Causes of these changes may lie in
climatic conditions and poor or inefficient management in the field.
Only for the okra crop there is clearly an increasing trend, even though production was down in 2010.
In order to keep production constant, the Ministry of LVV started several years ago with the
Surisombra greenhouse cultivation. Planting is still done in open ground, but somewhat sheltered. This
has the effect of making weather conditions manageable.
Currently, a comparative study is being conducted into the cultivation in Surisombra greenhouses,
hydroponic greenhouses and the traditional way.
3.2 Average consumer prices of agricultural produce Table 15: overview of average consumer prices in the period 2000-2010
DESCRIPTION IN GUILDERS PER KG IN SRD PER KG
2000 2001 2002 2003 2004 2005 2006 2007 2008 2009 2010
VEGETABLES***
Cabbage 1,316 2,434 3,224 3,964 3.72 5.32 4.56 4.89 6.40 5.93 7.13
Beans 2,258 2,781 4,067 4,577 5.48 6.60 6.76 8.14 7.21 8.99 10.51
Tomato 4,099 4,594 6,123 6,217 4.37 7.43 8.71 7.79 7.54 9.44 10.27
Antruwa (Solanum macrocarpum) 644 698 1,031 2,398 2.89 4.23 6.01 5.82 4.32 4.41 6.68
Cucumber 776 1,306 1,650 2,898 2.86 2.42 2.45 2.54 2.20 2.48 2.66
Eggplant 979 730 1,678 2,304 2.74 3.93 3.47 4.04 3.79 4.33 5.55
Pepper 3,085 3,915 7,302 5,694 6.82 5.20 7.04 10.26 7.04 9.17 18.20
Pumpkin 770 671 1,198 1,548 1.58 2.03 2.51 2.60 2.79 2.44 3.28
Sopropo, bitter melon (Momordica charantia) 885 996 2,269 2,180 2.30 3.64 3.39 2.97 3.04 3.53 4.34
Okra 1,312 979 1,623 1,698 2.41 3.13 4.80 4.26 4.70 7.26 9.93
String beans 1,027 1,127 2,366 2,777 3.52 5.13 6.19 6.18 5.98 7.83 10.47
Amsoi, Paksoi and Kaisoi 1,058 1,868 2,062 2,267 2.82 4.26 4.77 6.03 6.88 7.33 7.44
Tayerblad (arrowleaf elephant ear) 1,127 3,298 3,893 4,101 4.59 5.55 6.60 5.87 7.23 9.83 9.23
Other leafy vegetables* 847 1,000 1,273 1,914 2.64 3.86 5.00 5.65 4.87 5.19 6.65
Other annual crops** 640 700 1,186 1,717 4.75 5.35 4.98 5.54 6.44 7.05 8.59
* Bitter greens, American nightshade, Chinese water spinach and red spinach
** Bottle gourd, Chinese okra, lablab bean
***Average consumer prices of the Central Market in Paramaribo
Source : Agricultural statistical data 2004-2009
Table 15 provides an overview of consumer prices charged for the various vegetables in the past ten
years.

Thematic analysis 31
In the period 2000 to 2003, the local currency was the Surinamese guilder which changed in 2004 to
the Surinamese dollar. The value of one Surinamese dollar was 1000 Surinamese guilders.
From the above table it can be concluded that the price increased for most vegetable crops over the
course of the years. The price of the cucumber crop has remained fairly stable while the price of pepper
doubled in the last year.
Consumer prices for fruits, see Table 16, show here and there some fluctuations. The price of the
banana crop remained stable over three consecutive years. For bananas, a decrease can be seen of
about 31%, while pineapple shows a decrease and then an increase of 23 %.
For citrus , there are small fluctuations ranging from 7 % to 11 %.
For the rice crop the consumer price shows a decline since 2008 with 6% in 2009 and 12% in 2010.
Table 16: overview of consumer prices of fruits in the period 2000-2010
DESCRIPTION IN GUILDERS PER KG IN SRD PER KG
2000 2001 2002 2003 2004 2005 2006 2007 2008 2009 2010
FRUITS***
Bananas 388 537 638 2,195 2.04 1.56 1.68 1.71 1.31 1.13 1.13
Plantain 1,146 1,132 1,091 2,430 1.75 2.02 2.57 2.40 2.61 3.39 2.33
Pineapple 626 599 1,038 1,971 3.53 4.13 8.66 7.66 7.65 6.60 8.55
Passion fruit 913 1,018 993 2,884 2.46 2.79 3.67 4.53 4.46 6.72 6.58
Coconut 527 708 812 1,052 1.76 1.93 1.30 1.41 2.60 2.63 2.69
Oranges 1,037 932 1,333 2,443 1.95 2.96 4.09 3.47 3.63 4.75 4.38
Mandarin 1,289 1,530 1,703 2,878 2.68 4.40 5.29 4.53 6.58 6.55 6.61
Grapefruit 573 689 821 1,685 1.78 2.25 3.27 3.32 2.80 2.26 2.46
Lime 1,352 2,345 2,829 3,937 5.48 6.15 6.10 9.76 10.22 12.35 11.51
Other citrus fruits
592 639 769 1,713 1.90 2.78 3.43 5.32 7.10 6.70 5.90
Papaya 957 1,518 992 1,669 1.36 2.64 4.33 6.26 5.30 5.78 4.29
Avocado 614 625 725 2,002 3.39 4.13 9.25 8.95 10.87 9.07 9.03
Mango 830 676 939 2,276 3.88 5.65 5.81 6.31 5.30 4.56 4.98
Watermelon 439 614 764 1,074 1.39 1.87 1.90 2.70 3.60 2.86 2.58
RICE***
White rice 298 589 788 1,008 1.05 1.10 1.32 1.31 2.78 2.59 2.27
* Bitter greens, American nightshade, Chinese water spinach and red spinach
** Bottle gourd, Chinese okra, lablab bean
***Average consumer prices of the Central Market in Paramaribo
Source : Agricultural statistical data 2004-2009

Thematic analysis 32
4 BANANAS
4.1 Acreage under cultivation and production of bananas
As already indicated, the banana crop makes up a significant part of the agricultural sector in
Suriname. This crop was in 2010 responsible for around 38% of the export value of agricultural
products.
The banana sector in Suriname is mostly in the hands of the Foundation for the Preservation of the
Banana Sector (SBBS). Production takes place at Jarikaba and in Nickerie.
The bulk of the production is exported to Trinidad.
Table 17: overview of the acreage under cultivation (in ha) of banana in the period 2004-2010
DESCRIPTION UNIT 2004 2005 2006 2007 2008 2009 2010
AREA UNDER CULTIVATION
- Small-scale agriculture ha 76 70 58 52 36 35 43
- Factory farming of which ,, 1,419 1,587 1,854 1,855 1,813 1,928 2,038
- Jarikaba ,, 723 781 880 880 865 957 1059
- Nickerie ,, 696 806 974 975 948 971 979
TOTAL AREA UNDER CULTIVATION ha 1,495 1,657 1,912 1,907 1,849 1,963 2,081
PRODUCTION ,,
- Small-scale agriculture tons 1,527 1,430 1,105 769 620 821 872
- Factory farming of which ,, 33,771 56,400 63,450 70,315 88,104 81,446 93,400
- Jarikaba ,, 18,834 22,200 22,842 32,960 43,983 41,186 44,300
- Nickerie ,, 14,937 34,200 40,608 37,355 44,121 40,260 49,100
TOTAL PRODUCTION tons 35,298 57,830 64,555 71,084 88,724 82,267 94,272
HARVESTED ACREAGE ha 589 1,296 1,593 1,554 1,542 1,682 2,061
Prod/ha of harvested acreage tons 59.9 44.6 40.5 45.7 57.5 48.9 45.7
Source : Agricultural statistical data 2004-2009
Table 17 provides an overview of the area under cultivation in hectares and the production of bananas
in tons. The banana production was in 2004 in the hands SURLAND which was experiencing great
problems around 2003. The production that year was nil. After reorganization of the company into
SBBS a new start was made with the production.
Figure 30 shows the variation of the harvested area and the production per hectare of harvested area.
The harvested area has increased over the years while production per hectare has remained almost
stable. The total production has increased which is reflected in Table 17.

Thematic analysis 33
4.2 Export of bananas Table 18: quantity (in tons) of exported bananas and the value involved (in Srd)
DESCRIPTION UNIT 2004 2005 2006 2007 2008 2009 2010
Quantity tons 20,121 38,388 47,005 57,135 65,750 58,132 70,239
Value SRD1000 14,759 28,664 35,196 46,219 63,447 73,608 67,987
Export value per ton SRD 734 747 749 809 965 1,266 968
Source : Agricultural statistical data 2004-2009
Table 18 and Diagram 31 clearly show that the quantity of exported bananas has increased over the
years by approximately 10,000 tons per year. Only in 2009 a decrease occurred. It is striking that
especially in 2009, despite the decrease, the export value was higher.
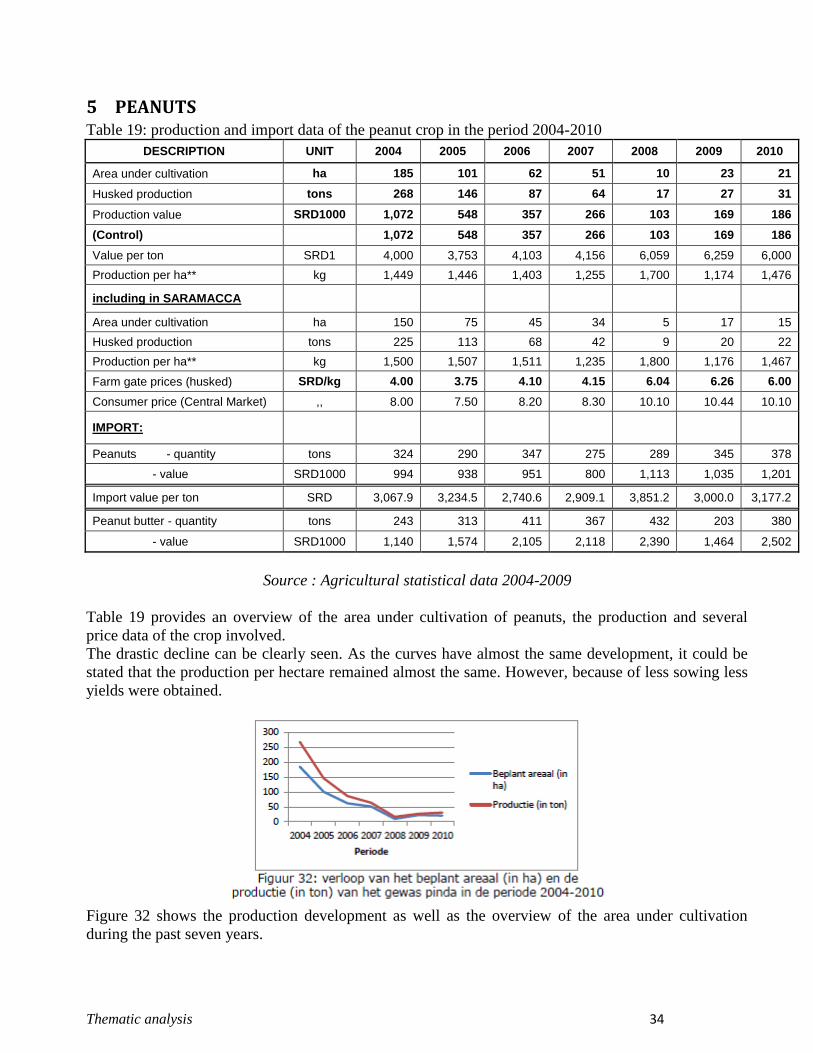
Thematic analysis 34
5 PEANUTS Table 19: production and import data of the peanut crop in the period 2004-2010
DESCRIPTION UNIT 2004 2005 2006 2007 2008 2009 2010
Area under cultivation ha 185 101 62 51 10 23 21
Husked production tons 268 146 87 64 17 27 31
Production value SRD1000 1,072 548 357 266 103 169 186
(Control)
1,072 548 357 266 103 169 186
Value per ton SRD1 4,000 3,753 4,103 4,156 6,059 6,259 6,000
Production per ha** kg 1,449 1,446 1,403 1,255 1,700 1,174 1,476
including in SARAMACCA
Area under cultivation ha 150 75 45 34 5 17 15
Husked production tons 225 113 68 42 9 20 22
Production per ha** kg 1,500 1,507 1,511 1,235 1,800 1,176 1,467
Farm gate prices (husked) SRD/kg 4.00 3.75 4.10 4.15 6.04 6.26 6.00
Consumer price (Central Market) ,, 8.00 7.50 8.20 8.30 10.10 10.44 10.10
IMPORT:
Peanuts - quantity tons 324 290 347 275 289 345 378
- value SRD1000 994 938 951 800 1,113 1,035 1,201
Import value per ton SRD 3,067.9 3,234.5 2,740.6 2,909.1 3,851.2 3,000.0 3,177.2
Peanut butter - quantity tons 243 313 411 367 432 203 380
- value SRD1000 1,140 1,574 2,105 2,118 2,390 1,464 2,502
Source : Agricultural statistical data 2004-2009
Table 19 provides an overview of the area under cultivation of peanuts, the production and several
price data of the crop involved.
The drastic decline can be clearly seen. As the curves have almost the same development, it could be
stated that the production per hectare remained almost the same. However, because of less sowing less
yields were obtained.
Figure 32 shows the production development as well as the overview of the area under cultivation
during the past seven years.

Thematic analysis 35
The drastic decline can be clearly seen. As the curves have almost the same development, it could be
stated that the production per hectare remained almost the same, but because of less sowing there was
less yield.
Figure 33 provides an overview of the quantity of peanuts that are locally produced and the quantity
that is imported.
It goes without saying that the import of peanuts is many times higher than the local production. This
indicates that there is indeed a demand for this crop. It is recommended to determine the cause of the
low local production and how the government can anticipate on this.
Surinamese peanut farmers should in fact be able to easily supply the local market for 100% On the
other hand, the interests of the peanut importers of course, also play a role.
Figure 33 also shows that more and more peanuts were imported in the past four years, excluding the
import of peanut butter.

Thematic analysis 36
6 CITRUS FRUITS Table 20: overview of production and import data of the citrus fruits in the period 2004-2010
DESCRIPTION UNIT 2004 2005 2006 2007 2008 2009 2010
AREA UNDER CULTIVATION:
Oranges ha 1,252 1,307 1,280 1,321 1,216 1,420 1,414
Grapefruit ,, 114 117 113 107 110 105 113
Pomelo ,, 89 131 140 151 125 123 120
Mandarin*** ,, 72 60 69 74 44 40 37
Lime ,, 10 8 15 28 24 23 22
Tangelo ,, 24 24 24 23 35 38 39
Other citrus fruits** ,, 122 177 173 194 160 153 141
Total citrus fruits (exclusive of orange and grapefruit )
,, 317 400 421 470 388 377 359
TOTAL AREA UNDER CULTIVATION ha 1,683 1,824 1,814 1,898 1,714 1,902 1,886
PRODUCTIVE ACREAGE ha 1,500 1,612 1,630 1,690 1,370 1,435 1,415
PRODUCTION:
Oranges tons 12,400 13,039 13,610 13,651 13,454 12,709 15,138
Grapefruit ,, 974 927 921 879 1,141 1,252 1,314
Pomelo ,, 780 743 1,301 1,746 1,543 1,253 1,216
Mandarin ,, 648 600 690 676 440 400 411
Lime ,, 141 93 215 428 392 368 316
Tangelo ,, 240 240 240 230 351 380 566
Other citrus fruits** ,, 1,068 1,174 1,824 2,007 1,799 1,607 1,517
Total citrus fruits (exclusive of orange and grapefruit )
,, 2,877 2,850 4,270 5,087 4,525 4,008 4,026
TOTAL PRODUCTION tons 16,251 16,816 18,801 19,617 19,120 17,969 20,478
EXPORT CITRUS FRUITS
Export quantity tons 172 80 92 69 43 11 159
Export value SRD1000 152 74 99 74 72 15 195
Export value per ton SRD 883.7 925.0 1,076.1 1,072.5 1,674.4 1,363.6 1,226.4
Source : Agricultural statistical data 2004-2009
Table 20 demonstrates that the area under cultivation of citrus trees has changed little or not over the
past years. The area under cultivation increased by approximately 10% in 2010 compared to 2004.
The production in 2010 increased by approximately 20% compared to 2004.
Figure 34 shows the distribution of the quantity of citrus fruits produced and the export quantity in the
period from 2004 to 2010.

Thematic analysis 37
It is clear that only a small part of the quantity of citrus fruits produced is being exported.
The question then presents itself: what is done with the remaining production?
This because of the fact that locally, citrus fruits are scarcely or not found on the local market. It can be
found, but at a relatively high price.
7 TUBERS Table 21: overview of production data of tubers in the period 2000-2010
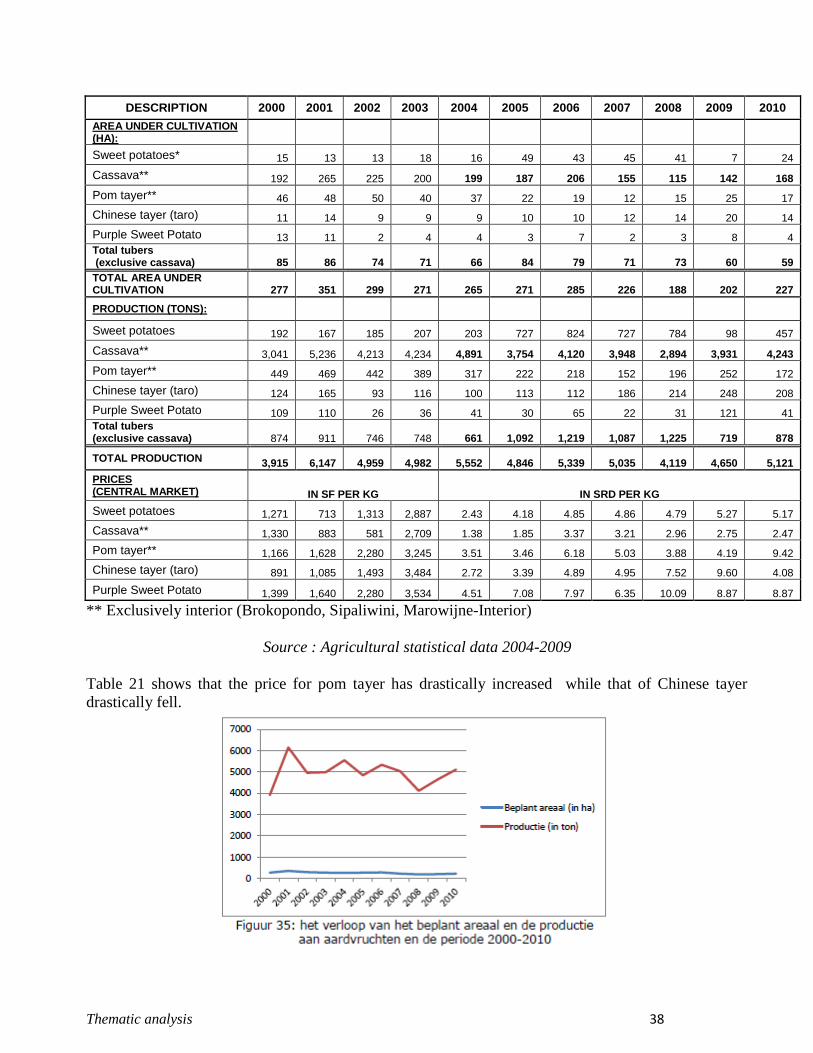
Thematic analysis 38
DESCRIPTION 2000 2001 2002 2003 2004 2005 2006 2007 2008 2009 2010
AREA UNDER CULTIVATION (HA):
Sweet potatoes* 15 13 13 18 16 49 43 45 41 7 24
Cassava** 192 265 225 200 199 187 206 155 115 142 168
Pom tayer** 46 48 50 40 37 22 19 12 15 25 17
Chinese tayer (taro) 11 14 9 9 9 10 10 12 14 20 14
Purple Sweet Potato 13 11 2 4 4 3 7 2 3 8 4
Total tubers (exclusive cassava) 85 86 74 71 66 84 79 71 73 60 59
TOTAL AREA UNDER CULTIVATION 277 351 299 271 265 271 285 226 188 202 227
PRODUCTION (TONS):
Sweet potatoes 192 167 185 207 203 727 824 727 784 98 457
Cassava** 3,041 5,236 4,213 4,234 4,891 3,754 4,120 3,948 2,894 3,931 4,243
Pom tayer** 449 469 442 389 317 222 218 152 196 252 172
Chinese tayer (taro) 124 165 93 116 100 113 112 186 214 248 208
Purple Sweet Potato 109 110 26 36 41 30 65 22 31 121 41
Total tubers (exclusive cassava) 874 911 746 748 661 1,092 1,219 1,087 1,225 719 878
TOTAL PRODUCTION 3,915 6,147 4,959 4,982 5,552 4,846 5,339 5,035 4,119 4,650 5,121
PRICES (CENTRAL MARKET) IN SF PER KG IN SRD PER KG
Sweet potatoes 1,271 713 1,313 2,887 2.43 4.18 4.85 4.86 4.79 5.27 5.17
Cassava** 1,330 883 581 2,709 1.38 1.85 3.37 3.21 2.96 2.75 2.47
Pom tayer** 1,166 1,628 2,280 3,245 3.51 3.46 6.18 5.03 3.88 4.19 9.42
Chinese tayer (taro) 891 1,085 1,493 3,484 2.72 3.39 4.89 4.95 7.52 9.60 4.08
Purple Sweet Potato 1,399 1,640 2,280 3,534 4.51 7.08 7.97 6.35 10.09 8.87 8.87
** Exclusively interior (Brokopondo, Sipaliwini, Marowijne-Interior)
Source : Agricultural statistical data 2004-2009
Table 21 shows that the price for pom tayer has drastically increased while that of Chinese tayer
drastically fell.

Thematic analysis 39
Figure 35 shows that although the area under cultivation hardly differs in the past 10 years, the
production of tubers fluctuates significantly.

Thematic analysis 40
8 SOURCES: Report: Doorrekening Fiscale voorzieningen voor de agrarische sector (2008).
Annual Report LVV: 2005, 2006, 2007, 2008.
Agricultural Statistics 2004 - 2009
Statistical Analysis Fifth Agricultural Census Suriname 2008

Thematic analysis Animal Husbandry
Thematic analysis
Animal Husbandry

Thematic analysis Animal Husbandry
2
List of Contents
1. General ...................................................................................................................................................... 3
1,1 Land use .............................................................................................................................................. 3
1.2 Farms and animal species ................................................................................................................... 4
1.3 Farm acreage ....................................................................................................................................... 8
1.4 Meat processing and consumption ...................................................................................................... 8
Average prices at the farm gate and consumer prices ......................................................................... 9
2. Cattle ....................................................................................................................................................... 11
2.1 Dairy cattle ........................................................................................................................................ 11
Areas where farms are concentrated. .................................................................................................. 11
Operational Systems. .......................................................................................................................... 11
Sector .................................................................................................................................................. 12
Products according to importance. ...................................................................................................... 12
Most important issue within the subsector. ......................................................................................... 13
Herd composition of dairy cattle ......................................................................................................... 14
Veterinary care for dairy cattle ........................................................................................................... 17
2.2 Beef cattle ......................................................................................................................................... 19
Herd composition of cattle for slaughter ............................................................................................. 21
Gender ratio of cattle for slaughter ..................................................................................................... 23
Veterinary care for animals for slaughter............................................................................................ 24
3. Pigs .......................................................................................................................................................... 25
Veterinary care for pigs....................................................................................................................... 28
4. Poultry ..................................................................................................................................................... 30
Market for poultry products ................................................................................................................ 32
Veterinary care for poultry .................................................................................................................. 34
5. Small ruminants ...................................................................................................................................... 35
Veterinary care for sheep .................................................................................................................... 41
Goats ................................................................................................................................................... 42
Veterinary care for goats ..................................................................................................................... 44
Sources. ....................................................................................................................................................... 46

Thematic analysis Animal Husbandry
3
1. General
1.1 Land use
Of the total surface available for agricultural production, having a size of 63,989.48 ha, 9,583.67
ha (15%) consists of natural grassland and 4,429.37 ha (7%) of pastures. In addition, 6,624.39 ha
(10%) of fallow land is included, that for shorter or longer periods is also used to graze
ruminants.
Fig 1.1 Land use in Suriname
Assuming the fact that grassland (natural and cultivated) is used to feed ruminants, and in this
census a total of 36,693 cattle, sheep and goats were included, one arrives at a country average of
0.26 ha per head of ruminants. However, since a sheep or goat eats less than a cow, it is more
precise to work with Adult Bovine Units (ABU). One cow is equal to 1 sheep or goats, which
can is equal to one ABU. According to below table there are 29,131 ABU on 13,965 ha grassland
what boils down to on average 0.48 ha per ABU or 2.09 ABU per hectare.
In the coastal plain of Suriname one can count on 2.5 to 3 ABU per ha very well maintained
grassland (Bastiaansen, 1995), which means that 1 ABU indicates a need of 0.3 to 0.4 ha
grassland. The reality is that pastures in general are poorly maintained, and the maximum
allowable cattle density is certainly lower.
The fact that only 32 % of the total pasture is cultivated (cultivated pasture) indicates that in the
largest part of cases a cattle density of 2.5 to 3 ABU per hectare cannot be achieved.
The cultivated pasture has to be maintained by regular mowing and fertilization, in which system
the animals are moved to another field according to a rotation system. These measures are also
often refrained from.
In the districts of Paramaribo and Coronie very high cattle densities are measured. The cattle
density of almost 6 ABU per hectare can be explained because of the absence of pasture in
Greater Paramaribo. Most ruminants are fastened on (tethered) roadside and empty lots. In

Thematic analysis Animal Husbandry
4
Coronie a cattle density of 26 ABU per hectare is measured. Here as well, we find few pastures
that may carry the name, and the animals are grazed on fallow land and along the roadsides. See
below table.
Table 1.1 Types of grass lands and average cattle density ruminants per district
DISTRICT
Nat grass Cult grass
Tot
Grassland Beef ABU S/G ABU Tot ABU Ha/ABU ABU/Ha
PARAMARIBO 127.78 1.06 128.84 700 52 752 0.17 5.84
WANICA 2,466.82 579.05 3,045.87 7,763 374 8,137 0.37 2.67
NICKERIE 1,800.43 293.92 2,094.35 7,322 177 7,499 0.28 3.58
CORONIE 18.11 18.11 464 12 476 0.04 26.29
SARAMACCA 1,651.30 4.68 1,655.98 2,858 74 2,932 0.56 1.77
COMMEWIJNE 1,191.28 3,540.14 4,731.42 8,242 121 8,363 0.57 1.77
MAROWIJNE 11.18 0.21 11.39 10 9 19 0.60 1.67
PARA 2,268.84 10.11 2,278.95 932 21 953 2.39 0.42
TOTAAL
COASTAL
PLAIN 9,535.74 4,429.17 13,964.91 28,291 840 29,131 0.48 2.09
Source : Statistic data Fifth Agricultural Census 2008-2009
In conclusion we can state that in principle enough grassland is available for the ruminants,
however, an increase of the quantity and quality of the grasslands could be achieved by standard
grassland management measures.
1.2 Farms and animal species
Of the total of 7,246 farms with cattle or poultry 1,009 (14%) have dairy cattle, 1,011 (14%)
have animals for slaughter, 570 (8%) have sheep, 462 (6%) have goat, 155 (2%) have pigs and
4,039 (56%) are poultry farms.
It should be noted that most farms have more than one animal species.
Fig 1.2 Number of cattle and poultry farms
Table 1.2 Number of animals according to types of livestock per district on the baseline day
DISTRICT TYPES OF LIVESTOCK

Thematic analysis Animal Husbandry
5
DAIRY CATTLE
ANIMALS FOR
SLAUGHTER SHEEP GOATS PIGS
PARAMARIBO 200 500 470 50
WANICA 4,563 3,200 2,169 1,575 3,354
NICKERIE 3,470 3,852 1,059 708 575
CORONIE 207 257 116 5 626
SARAMACCA 450 2,408 437 305 3,753
COMMEWIJNE 284 7,956 560 649 157
MAROWIJNE 10 34 56
PARA 605 327 125 86 510
TOTAL COASTAL PLAIN 9,779 18,510 4,970 3,434 8,975
Source : Statistic data Fifth Agricultural Census 2008-2009
The above table provides the cattle figures per livestock species as provided by the breeders
during the agriculture census. It should be noted that the numbers provided do not correspond to
reality. Underreporting of almost 50% may be assumed.
As most important reason can be stated that the livestock farmers did not report the correct
number of animals on their farms.
As the census was done by means of a structured interview, no literal “count” was performed by
the interviewer.
Livestock farmers have maybe resorted to this as they were afraid that the data of this census
would be provided to the Tax Authority of the Republic of Suriname. The Post Enumerator
Survey (PES) also did not demonstrate any relevant differences in the livestock figures.
An overview of the number of farm animals in Suriname, as used by the Ministry of Agriculture,
Animal Husbandry and Fisheries (LVV) is provided in the below table.
Table 1.3 Size of livestock herd 2004-2009
DESCRIPTION UNIT 2004 2005 2006 2007 2008 2009
SIZE OF LIVESTOCK:
Total cattle pcs. 43,240 38,235 43,495 43,595 49,035 53,610
Total pigs ,, 26,065 28,640 28,090 28,240 27,127 28,838
Total other cattle (water buffaloes) ,, 479 640 752 1,210 750 1,024
Total goats and sheep ,, 13,335 12,390 12,565 12,150 12,500 13,000
Total chicken and other poultry 1000 pcs. 4,696 4,929 4,599 6,387 5,272 5,910
Source : Agricultural statistical data 2004-2009
A comparison between tables 1.2 and 1.3 on the basis of the year 2008 provides a picture of the
differences in the animal numbers provided during the agricultural census and the regular data
collection of the Statistics Department of the Ministry of LVV.
Table 1.4 Comparison of number of animals per livestock species
Animal type 2008
AG Stat
Data 5LBT Deviation

Thematic analysis Animal Husbandry
6
Total cattle pcs. 49,035 28,288 42.30%
Total pigs ,, 27,127 8,975 66.90%
Total other cattle (water buffaloes) ,, 750 130* 82.60%
Total goats and sheep ,, 12,500 8,404 32.70%
Total chicken and other poultry 1000 pcs. 5,272 484 90.80%
*Only male animals included
Average 63.00%
In the comparison it is striking that an underscore of on average 63% for all animal species can
be demonstrated, having as highlights water buffaloes and chicken and other poultry.
An explanation for the significant deviation within water buffaloes is the fact that for the
agricultural census only the male animals were included. When we assume that for each male
animal there are also 2 female animals, the deviation percentage amounts to 48%. A possible
explanation for the large deviation in chicken and other poultry is given in Chapter 4 Poultry.
A breakdown of the number of farms with the number of animals per district, as included in the
agricultural census, is treated for each animal species in a table.
Table 1.5 Comparison Ag census 1959, Ag census 1980 and Ag census 2008
Cattle Pigs
Farms Number Ave. Farms Number Ave.
AC 59 7,725 35,286 4.57 1,000 6,003 6.00
AC 81 7,183 50,499 7.03 628 18,665 29.72
AC 08 2,011 28,288 14.07 155 8,975 57.90
Poultry Small ruminants
Farms Number Ave. Farms Number Ave.
AC 59 13,045 289,965 22.23 3,006 14,270 4.75
AC 81 11,099 1,159,999 104.51 2,577 12,055 4.68
AC 08 3,629 484,000 133.37 1,032 8,404 8.14
When comparing the number of farms and animals included in 3 agricultural censuses, more in
particular of 1959, 1981 and 2008 especially the strong decline in the number of farms is
striking. In addition, the farms have become steadily bigger in number of animals.
It should therefore be expected that the number of jobs in the agricultural sector has significantly
declined over the years.
Table 1.6 Most prevalent farm sizes and age groups of cattle breeders
Number of animals/
farm % male
%
women Age male Age female

Thematic analysis Animal Husbandry
7
Dairy cattle 3 to 4 83 17 45-54 55-64
Animals for
slaughter 5 to 9 87 13 45-54 35-44
Pigs 5 to 9 83 17 45-54 45-54
Chicken for
slaughter 10 to 49 90 10 45-54 35-44
Egg-laying
chicken 10 to 49 90 10 45-54 45-54
Backyard
chicken 10 to 49 82 18 45-54 >65
Ducks 10 to 49 88 12 45-54 45-54
Sheep 5 to 9 85 15 45-54 35-44
Goats 10 to 19 83 17 45-54 55-64
It appears from the above table that the largest part of the male cattle farmers consist of males in
the age group 45 to 54 years.
Females on the contrary in age group 35-44 years are more prevalent in the subsectors animals
for slaughter, chicken for slaughter and sheep. In the age group 55-64 years there are relatively
more women employed in the subsectors dairy cattle and goats. Most women in the highest age
group older than 65 years are found in the subsector backyard chicken.
The average gender ratio between cattle farmers is 85.6 % male to only 14.4 % female. For the
whole agricultural sector this is 83 % male to 17 % female. It is to be expected that relatively
more women are active in the vegetable and fruit growing sector than in animal husbandry.
The subsectors of animal husbandry in which women are better represented than average are
dairy cattle, pigs, and backyard chicken.
It should be clear that livestock production in Suriname is performed for a significant part by
relatively small farms with a small number of animals.

Thematic analysis Animal Husbandry
8
1.3 Farm acreage
Distributie bedrijfsarealen herkauwers
Klasse bedrijfsareaal
<0.1 0.1-0.19 0.2-0.49 0.5-0.99 1.0-1.99 2.0-2.99 3.0-3.99 4.0-4.99 5.0-9.99 10.0-19.9920.0-49.9950.0-99.99100.0-199.99'200.0-499.99 >500
Aan
tal be
dri
jve
n
0
100
200
300
400
500
600
700
aantal bedrijven
Fig 1.3 Farm acreage for cattle farms per size category.
The above diagram shows that most cattle farms with ruminants owns less than 2 hectares of
land to perform their activities. This number of 1751 farms is 58% of the total number of farms
with ruminants (3036). It should be noted that most farms keep different types of animals. It
should be clear that the number of animals that can be kept on such a small farm surface, is also
limited.
In addition, other agricultural activities, such as vegetables and fruit growing, as well as housing
occur all on the same farm acreage.
The limitation in providing the most important (and cheapest) source of food for the cattle
(grass) is for that reason logical. Shortages of grass are then solved by having the animals graze
on fallow land, or grass is cut in other locations and supplied to the animals.
This suboptimal rough fodder provision immediately leads to a reduced production and higher
cost prices.
1.4 Meat processing and consumption
The largest concentration of butchers can be found, as to be expected, in and around Paramaribo.
There are 66 butcheries at present, 33 of which sell only beef, eight only pork and the remaining
25 are mixed butcher’s shops. In addition to these meats, almost all butcher’s shops sell meat
products (sliced cold meats) and chicken or chicken parts.
Nickerie has three butcher’s shops, Coronie and Saramacca have one each and Para has two.
In addition to the butcher’s shops in the districts, meat and meat products are transported by two
butchers from Paramaribo to the West (Nickerie and Coronie) and by two butchers from
Paramaribo to the East (Commewijne and Marowijne).
The average per capita meat consumption in 2009 divided in local production and import is
represented in the below table.

Thematic analysis Animal Husbandry
9
Table 1.7 Average per capita meat consumption 2009
Meat type local (kg) import (kg) total (kg)
Beef 3.85 2.7 6.55
Pork 3.58 1.34 4.92
Sheep and goat meat 0.03 0.09 0.12
Poultry 15 33.49 48.49
Eggs (pieces) 95 1 96
It should be noted that imported beef consists for 65% of salt beef, the remainder of canned beef.
Only a limited quantity of fresh beef is being imported, only for the more expensive segment to
provide local restaurants and hotels.
The total import of pork consists for 33 % of fresh pork, for 47 % of preserved pork and for 20 %
of salt pork tail.
The import of poultry consists for 91 % of fresh chicken and chicken parts and for 9 % of
preserved poultry. Lokale productie en importper hoofd van de bevolking
2009
Producten van dierlijke origine
Rundvlees Varkensvlees Kippenvlees Eieren
Kilo
gra
mm
en e
n a
an
tal stu
ks
0
20
40
60
80
100
lokaal
import
Fig. 1.4 Local production and import meat, meat products and eggs
The level of self-sufficiency for fresh beef is 92 %, for fresh pork 89 %, for sheep and goat meat
25 %, for poultry 33 % and for consumption eggs 99 %.
Above figures indicate that there is a lot of room to expand various preserved meats and
preparations.
Average prices at the farm gate and consumer prices
The below table provides and overview of the trends in farm gate prices and consumption prices
in butcher’s shops.

Thematic analysis Animal Husbandry
10
Table 1.8 Average consumer prices in SRD
2006 2007 2008 2009
Beef (kg) 20.58 20.49 20.54 20.31
Pork (kg) 17.65 20.65 24.11 19.61
Sheep / goat meat (kg) 25 25 40 37.5
Poultry (kg) 8.37 8.78 11.68 12.76
Eggs (pieces) 0.37 0.49 0.5 0.72
Table 1.9 Average farm gate prices SRD
2006 2007 2008 2009
Beef (kg slaughtered weight) 9.75 10.00 10.50 10.50
Pork (kg life weight) 5.00 7.50 8.50 7.75
Sheep/ goat (kg slaughtered weight) 9.75 9.75 12.50 12.00
Below diagram Fig. 1.5 provides an image of the differences between average carcass prices and
consumer prices. It should be clear that big margins are used for the exploitation of butcher’s
shops in Suriname, for which the average margin for beef is 2.0 times the carcass price, for pork
on average 2.4 times the carcass price, and for sheep even on average 2.8 times the carcass price.
It should be mentioned that part of this margin is used to pay for purchasing life animals from the
field. Buyers of live cattle make their living from the margin on the purchase price and the sale
price to the butcher’s shop.
This system, however, increases the price for the consumer and lowers the income for the
producer (livestock farmer). Karkas prijzen en consumenten prijzen
2006-2009
Jaar
2005 2006 2007 2008 2009 2010
Prijz
en in S
RD
0
10
20
30
40
rund karkas
varken karkas
schaap/geit karkas
rund consument
varken consument
schaap/geit consument
Fig. 1.5 Carcass prices and consumer prices of 3 types of meat

Thematic analysis Animal Husbandry
11
2. Cattle
2.1 Dairy Cattle
Areas where farms are concentrated.
It can be concluded that the majority of the milk production is from the neighborhood Pad van
Wanica, followed by the neighborhood Domburg. According to the classification system, used
by the Melkcentrale Paramaribo (MCP), the neighborhood Pad van Wanica includes: Indira
Gandhiweg and side-roads, the Lelydorp area and surroundings, Javaweg and surroundings,
Rijsdijkweg and surroundings, etc.
The neighborhood Domburg includes: the Houttuin Area, Livorno, Highway, Boxel and
Domburg. Wanica contributes annually about 55% of the total milk that is delivered to the MCP,
while Domburg is responsible for approximately 20% on an annual basis (Statistics Melk
Centrale Paramaribo).
The cattle farms register of LVV shows that the concentration of especially small dairy cattle
farms can be found in the administrative jurisdiction Wanica-B. The medium-sized to large dairy
farms can be found in the Para area.
Operational Systems.
Dairy farming takes place in a large number of small and a small number of (medium to) large
farms. In contrast to the animals for slaughter sector, in most cases a limited area is grazed, as
the cattle has to come back daily to the stable to be milked.
Grazing occurs in general, with additional feed consisting of supplemental feed and also often
cut grass. In a few large farms zero grazing takes place, with the animals being provided for in
their needs in the stables. In these cases, but also on the small farms, the grass is in most cases
cut outside the farm.
The cattle is in most cases kept in a natural and unimproved pasture, whether or not following a
rotation system. Management and maintenance of the pasture in most cases leave a lot to be
wished for, and can be improved. As the surface of pasture per cow is less than in the cattle for
slaughter sector, it is necessary that the grass on the dairy farms is of better quality. This
necessitates a better management of the pasture as well as supplemental feeding of the dairy
cattle.
On the small family farms with insufficient land, there is often continuous grazing or tethering
and little attention is paid to grassland management.
On the larger farms (> 20 ha) where land is a less limiting factor, a rotation system is often
applied. In these cases some attention is paid (although not optimally) to grassland maintenance
and management. Supplemental feed consists in these cases of: sharps, factory feed, bananas, etc.
Rarely cut grass is given as supplemental feed.

Thematic analysis Animal Husbandry
12
On the large, professional farms the (often imported) milk cows are provided with grass and
supplemental feed in the stables. In addition, the animals graze in the field.
Milking by hand is done generally. Mechanized milking is often only used on larger farms
having a bigger dairy herd.
Sector
The major part of the local raw milk is processed by the MCP. One could say that MCP buys
almost 80% of the totally produced raw milk (Doorrekening Fiscal facilities, Jaarverslag LVV
2008).
The remaining quantity is for: own consumption of the farmer, farm gate sales for customers of
the farmer, as well as processing by milk processors, including Nuprocess NV and Rudisa
Beverages and Juices NV.
Products according to importance.
The most important and prime product of the sector is raw milk. Other (by) products in this
sector are young cattle, especially bull calves.
Table 2.1 Supply of farm milk, import milk powder and production MCP 2004-2009
DESCRIPTION UNIT 2004 2005 2006 2007 2008 2009
MELKCENTRALE
PRODUCTION:
Purchase of farm milk 1000 l 4,401 5,684 5,847 6,065 5,120 4,935
Milk powder ,, 6,768 5,475 3,905 3,687 2,694 2,403
TOTAL PROCESSED 1000 l 11,169 11,159 9,752 9,752 7,814 7,338
Pasteurized milk ,, 9,229 8,835 7,667 6,935 6,304 5,794
Milk products ,, 1,698 1,698 1,310 1,413 1,308 1,529
Share of milk powder % 61 49 40 38 34 33
VALUE:
Purchase of farm milk SRD 1000 7,042 9,094 10,340 11,523 9,728 9,377
Milk powder ,, 6,497 4,654 4,686 7,457 4,241 3,379
Milk powder per liter SRD 1 0.96 0.85 1.20 2.02 1.57 1.41
Farm milk per liter ,, 1.60 1.60 1.77 1.90 1.90 1.90
IMPORT MILK POWDER
- Quantity ton 1,365 1,259 1,150 1,031 1,272 657
- Value SRD 1000 9,533 10,157 9,937 13,136 15,255 5,100
- Value per ton SRD 6,984 8,068 8,641 12,741 11,993 7,763
SHARE MELKCENTRALE
Process. milk pwdr quantity ton 846 622 592 380 359 355
Source : Agricultural statistical data 2004-2009

Thematic analysis Animal Husbandry
13
Boerenmelk leveringen en Import melkpoederMelk Centrale Paramaribo
Jaar
2003 2004 2005 2006 2007 2008 2009 2010
Aanta
l to
nnen m
elk
peoder
0
200
400
600
800
1000
Aanta
l lit
ers
boere
nm
elk
x 1
000
4200
4400
4600
4800
5000
5200
5400
5600
5800
6000
6200to
tale
pro
ductie M
CP
x 1
000 l
7000
8000
9000
10000
11000
12000
Import melkpoeder
Levering boerenmelk
Totale productie MCP
Fig. 2.1 Relationship between farm milk supply and import of milk powder by MCP
Above diagram clearly shows that with an increase of the supply of farm milk, the quantity of
milk powder imported decreases. Although this from a viewpoint of food security is a positive
development, it has financial consequences for the dairy processor. The purchase price of a liter
of raw milk of SRD 1.90 is higher than the price of a liter of milk made out of dissolved milk
powder (SRD 1.41, 2009). The cost price of a dairy product based on farm milk will for that
reason be higher than of the same product produced with milk powder.
In addition, there is the issue of the microbiological quality of the milk, which in case of farm
milk does not alway meet the highest standards, while milk powder is sterilized and thus of a
very high microbiological quality. See also below.
Most important issue within the subsector.
The issue with regard to the raw feed supply (and the availability of land) can be described as the
most important problem of the sector. Quantitatively and qualitatively inadequate raw feed
supply results in a strong dependence on raw feed or factory feed.
The shortage in sufficient and qualitative raw feed (that one tries to compensate somewhat by
supplemental feed: sharps, factory feed, green bananas) results in milk having a high cost price
and a low fat content. In the majority of the cases there is an imbalanced ration that insufficiently
covers the needs of the animals. The result is inefficiency: lower productions, shorter lactation
period, higher cost price or lower milk fat content.

Thematic analysis Animal Husbandry
14
As a result of the high farm gate price local raw milk can compete hardly with cheaper
subsidized milk powder including from the EU. Continuation of this situation can lead to the
local production being outcompeted from the market.
Herd composition of dairy cattle
Veestapel opbouwvrouwelijke melkrunderen
0 1 2
aa
nta
l d
iere
n
0
2000
4000
6000
8000
< 2 jr
2-4 jr
> 4 jr
koe
Fig. 2.2 Herd composition of female dairy cattle
If we look at the proportions provided between ages of animals in the national herd we should
conclude that the ratio between young animals < 2 years and animals in production (> 2 Year) is
not correct. There should proportionally be more young animals on the farms, both for
replacement and for growth. With these numbers one can conclude that the herd of female dairy
cattle will decline.
When evaluating table 2.2 expansion and loss of the female part of the dairy herd it can be seen
that of the 1402 animals that were added to the herd through birth and purchase, 569 were lost
through death and other losses. This is 41% of the total expansion. With such losses it is not
difficult to conclude that there is no growth of the dairy cattle herd.
As already stated earlier, the number of dairy cattle counted during the agricultural census is
underreported. A total number of 7129 female animals older than 2 years was included, of which
4989 animals are not providing dairy on the baseline day.
The supply of raw farm milk over the year 2008 was 5,120,000 liters of milk. Assuming that
80% of the milk production was supplied to the MCP and 20% is purchased at the farm gate, the
total milk production over 2008 can be estimated at around 6,400,000 liters of raw farm milk.
A lactation period of a dairy cow is estimated at 220 days, with an average milk production of 7
liters per cow per day.
Based on this it can be assumed that 2500 animals have to be milked continuously per day.

Thematic analysis Animal Husbandry
15
The number of lactating animals included in the agricultural census was 2140, which
demonstrates that for this category of farm animals underreporting of 8.6% can be assumed.
Table 2.2 Expansion and losses of female dairy cattle
DISTRICT
TOTAL
EXPANSION SALES/LOSSES
BIR
TH
S
PU
RC
HA
S
ED
/GIF
T
SO
LD
M1
M2
EC
/G
OL
PARAMARIBO 70 10 20
WANICA 597 134 175 98 92 8 134
NICKERIE 220 8 48 13 12 8 8
CORONIE 45 16 3 2 3
SARAMACCA 69 35 29 12 8 35
COMMEWIJNE 27 102 2 4 1 102
MAROWIJNE
PARA 94 1 15 8 6 1
TOTAL COASTAL PLAIN 1,122 280 285 148 141 19 280
EXPANSION=EXPANSION BIRTHS=BIRTHS SALES/LOSSES: SOLD
PURCHASED/GIFT= PURCHASED/GIFT M1=DIED< 3MNTHS
M2=DIED≥ 3MNTHS
C/G=OWN
CONSUMPTION/GIFT
OT=OTHER LOSS
If the discrepancy between the number of lactating animals is less than 10%, a completely
different picture is obtained for milk production.
According to the agricultural census 2140 lactating animals produced a total of 1,628,500 liters
of milk in 2008. This is an average of 760 liters per animal per year. An average milk production
of 7 liters per cow per day, would only give a lactation period of 110 days. This is very unlikely.
A lactation period of 220 days would give a milk production of only 3.5 liters per cow per day.
This is also very unlikely.
One can reasonably assume that the dairy cattle farmer has reported a much (50%) lower milk
production than is really the case.

Thematic analysis Animal Husbandry
16
The data of MCP over the year 2008 provides us with a total milk supply of 5,120,000 liters for
the districts of Paramaribo, Wanica, Saramacca and Commewijne.
The agricultural census recorded only 1,546,138 liters in the same districts. This is a difference
of 70%.
Although it is a fact that many cattle farmers do not keep any form of administration, it should be
possible to provide an close estimate of the liters of milk supplied to MCP on the basis of the
settlement slips that each dairy farmer receives from MCP.
It should be noted that depending on the purchase price of farm milk, animals from dairy cattle
herds are transferred to cattle for slaughter hers, and vice versa. In case of a low milk price
(according to the livestock farmer) animals that no longer produce, are included in the cattle for
slaughter herd so that it produces one cow for slaughter.
Thus it is not possible to give a precise separation between animals belonging to the dairy cattle
herd and the animals belonging to the cattle for slaughter herd. During the interviews the farmer
was asked for the number of animals that mainly belong to the dairy cattle herd and the animals
that mainly belong to the cattle for slaughter herd.
Table 2.3 Farms and dairy cattle per farm per district
DISTRICT
Dairy
cattle
Farms
Number
of animals
Animals/
farm
PARAMARIBO 40 200 5.00
WANICA 658 4563 6.93
NICKERIE 156 3470 22.24
CORONIE 23 207 9.00
SARAMACCA 36 450 12.50
COMMEWIJNE 46 284 6.17
MAROWIJNE 0 0 0.00
PARA 43 605 14.07
TOTAAL COASTAL
PLAIN 1,002 9,779 9.76
When looking at above Table 2.3 the large number of animals per farm in Nickerie, Para and
Saramacca is striking. This is where the larger dairy cattle farms are established, while the
largest part of the supply of farm milk to MCP is done by farms that are located in the District of
Wanica and which are on average 58% smaller than the large farms in Nickerie. Para and
Saramacca. See also Table 2.3 and Diagram 2.3.
It may be concluded that the larger part of the milk supply to MCP is taken care of by smaller
farms with on average 7 dairy cows per farm.
The production of these small farms is, however, not of such a nature that a reasonable income
can be earned. That is why there is a constant call to increase the purchase price of raw farm
milk, that is however already high, as compared to milk made from milk powder.

Thematic analysis Animal Husbandry
17
In addition, it should be stated that a number of 840 cows were “counted” of households that do
not meet the minimum criteria to be called a farm in the sense of the Fifth Agricultural Census
2008-2009.
For the interior 7 farms were recorded that owned together 57 dairy cows. A milk production of
3000 liters was reported.
Table 2.4 Supply of farm milk to the Melk Centrale Paramaribo
SUPPLY OF FARM MILK TO
THE MELKCENTRALE N.V.
Indira Gandhiweg 1000 l 2,177 2,854 2,969 3,339 2,975 2,958
Uitkijk ,, 525 673 683 809 658 610
Kwatta ,, 318 374 357 343 311 302
Domburg / Houttuin / Livorno ,, 1,196 1,568 1,629 1,362 963 876
Meerzorg ,, 185 215 209 212 213 189
TOTAL SUPPLY OF FARM MILK 1000 l 4,401 5,684 5,847 6,065 5,120 4,935
Aandeel leveringen boerenmelkper lokatie
Jaar
2004 2005 2006 2007 2008 2009
Aanta
l lit
ers
boere
nm
elk
x 1
000
0
1000
2000
3000
4000
5000
6000
7000 ind ghandi
uitkijk
kwatta
domburg/houttuin
meerzorg
Fig. 2.3 Share of deliveries of farm milk to MCP per location
Veterinary care for dairy cattle
Within the agricultural census attention was also paid to the veterinary care for the national cattle
herd. Parts of the composite table will be discussed for each species of animal to which it relates.
Table 2.5 Veterinary care for dairy cattle

Thematic analysis Animal Husbandry
18
DISTRICT
PRIMARILY DAIRY CATTLE
1 2 3 4 5 6 7 8 9
PARAMARIBO 30 30
WANICA 70 185 3 411 57 262 50 278
NICKERIE 3 32 1 1 34 3 22 8 36
CORONIE 10 2 1 3 9
SARAMACCA 4 6 1 1 10 6 6 2 8
COMMEWIJNE 5 12 23 2 8 8 10
MAROWIJNE
PARA 2 14 23 3 24 6 31
TOTAL COASTAL PLAIN 84 259 2 5 533 71 353 77 372
TYPE OF VETERINARY CARE: 1= ARTIFICIAL INSEMINATION
2= ANTIBIOTICS
3= CASTRATION
4= HORMONES
5= LARVICIDE
6= MASTITIS INJECTION
7= PARASITE CONTROL
8= VACCINATION
9= VITAMINS AND MINERALS
Table 2.5 shows that of all dairy cattle farms (1002) 53% use a larvicide to fight the larvae of the
South American blow fly (Cochliomyia hominivorax). These larvae are also called screw worm,
and the fly and its larvae are found all over Suriname. This fly lays eggs around open wounds,
out of which screw-like larvae develop that can feed themselves with live tissue and wound
fluids.
Fighting these larvae is done by preventing and treating wound infections, for which the larvae
are removed from the wound and the wound is also treated with a spray (Matabicheiras Aerosol,
also called “smearex”). (Bastiaansen, 1995)
Parasite control (against internal and external parasites) is given at 35% of the farms.
Administration of vitamins and minerals and of antibiotics is practiced on respectively 37% and
26% of the farms.
It is striking that only on 7% of the farms injections of the udder is practiced to fight mastitis
(udder infection), while the occurrence of mastitis on milk farms is generally accepted. This
udder infection is also an important cause of the bad microbiological quality of the milk.

Thematic analysis Animal Husbandry
19
2.2 Beef cattle
The areas where beef cattle farms are concentrated are in the Districts of Wanica, Commewijne
and Saramacca.
Table 2.6 Areas of concentration and animals per farm
DISTRICT
Animals
for
slaughter
Farms
Number of
animals
Animals/
farm
PARAMARIBO 80 500 6.25
WANICA 470 3200 6.81
NICKERIE 73 3852 52.77
CORONIE 27 257 9.52
SARAMACCA 140 2408 17.20
COMMEWIJNE 196 7956 40.59
MAROWIJNE 2 10 5.00
PARA 21 327 15.57
TOTAAL COASTAL
PLAIN 1,009 18,510 18.34
These districts comprise 79.9% of the beef cattle farms and 73.3% of all animals for slaughter in
Suriname. From the data can further be concluded that Wanica does have the largest number of
beef cattle farms, but that the average number of animals present per farm is 6.8. In Commewijne
the average is 40.6 animals, however, we should not forget that this gap (of one average 5 – 10
animals per farm to more than 40) could be the result of some large farms (having 300 – 5000
animals) that are located in that district. The animals for slaughter population on farms in
Saramacca is on average 17.2. In Saramacca as well there are several medium-sized farms with
100 – 250 animals.
The general picture of the farms in the districts and Paramaribo is that the majority of the farms
keep 5 – 10 animals for slaughter. If the farms have small pastures (< 2 ha), especially small
groups of bulls – in most cases purchased from other farms – are held in stables. In case of larger
pastures (8 – 10 ha) the animals for slaughter are kept in general on unimproved pastures. Fallow
land that has been like that for a longer period is also used for this.
The beef cattle farms are in general family farms, in which the meat production is most
important. In the case of fattening the animals in stables, the manure is also sold, especially to
horticulture farms.

Thematic analysis Animal Husbandry
20
Table 2.7 Registered slaughters of cattle, including water buffaloes
2005 2006 2007 2008 2009
Number Par’bo/ Halal slaughterhouses 2,710 0 0 0 0
Nickerie 105 105 78 137 91
Coronie 7 5 9 7 4
Surebeef 4,674 7,133 7,882 9,085 9,621
Para 147 154 178 189 310
Commewijne 0 0 0 0 27
Home slaughters 4 1,302 572 389 669
Total 7,647 8,699 8,719 9,807 10,722
Trend (1980=100) 94.50 107.50 107.75 121.19 132.50
Slaughter weight Par’bo/ Halal slaughterhouses 426,842 0 0 0 0
(kg) Nickerie 9,810 9,810 8,775 8,350 9,735
Coronie 617 437 899 460 294
Surebeef 876,858 1,331,689 1,449,367 1,618,150 1,702,688
Para 23,469 27,177 29,230 29,936 54,870
Commewijne 0 0 0 0 4,779
Home slaughters (*) 600 240,870 105,181 69,285 118,413
Total 1,338,196 1,609,983 1,593,452 1,726,181 1,890,779
Trend (1980=100) 114.17 137.36 135.94 147.27 161.31
Average weight Rural 175.00 185.08 182.76 176.02 176.35
(kg) Trend 120.81 127.77 126.17 121.51 121.74
Distribution Par’bo/ Halal slaughterhouses 31.9% 0.0% 0.0% 0.0% 0.0%
(by weight) Nickerie 0.7% 0.7% 0.6% 0.5% 0.5%
Coronie 0.1% 0.0% 0.1% 0.0% 0.0%
Surebeef 65.5% 89.2% 90.9% 93.7% 90.1%
Para 1.8% 1.8% 1.9% 1.7% 2.9%
Commewijne 0.0% 0.0% 0.0% 0.0% 0.3%
Home slaughters 0.0% 8.3% 6.6% 4.0% 6.3%
Table 2.7 shows that the number of slaughtered animals is experiencing a steady growth since
2005. In 2009 40% more animals were slaughtered than in 2005.
The average weight per carcass remained in 2009 almost similar to 2004 after a remarkable
increase to 185 kg in 2006.

Thematic analysis Animal Husbandry
21
Geregistreerde slachtingen en gemiddeld karkasgewichtRunderen
Jaar
2005 2006 2007 2008 2009
Aanta
l die
ren
0
2000
4000
6000
8000
10000
12000
gem
iddeld
gesla
cht gew
icht (k
g)
174
176
178
180
182
184
186
slachtingen
gemiddeld geslacht gewicht
Fig 2.4 Slaughters and average carcass weight cattle
Herd composition of cattle for slaughter
Veestapel opbouwslachtrunderen
Geslacht
Aa
nta
l d
iere
n
0
2000
4000
6000
8000
10000
12000
14000
< 2 jr
2-6 jr
> 6 jr
koeien stieren
Fig. 2.5 Herd composition of cattle for slaughter

Thematic analysis Animal Husbandry
22
The herd composition of cattle for slaughter as shown in the diagram in fig. 2.5 is striking, it is
very clear that there are less male animals than female animals. This, however, can be easily
explained as the most important product of this agricultural activity is the production of meat,
and as for the maintenance of the herd less male animals are required, these are slaughtered in
larger numbers than the female animals.
According to below tables, which show the expansion and losses over the year 2008, it appears
that a total of 589 animals were reported as being the total mortality and other losses. This is
18% of the expansion through births and purchases.
Compared to the 41% loss through mortality and other causes for dairy cattle, this percentage of
18 appears to be reasonable.
However, it should be stated that the general mortality of cattle for slaughter can be estimated to
be higher than for dairy cattle, as the monitoring of births on farms for animals for slaughter is
notoriously bad, because of the extensive production systems. The figures obtained from the
count paint a completely different picture.
As total purchases is reported 825 male animals and 720 female animals, which is a total 1545
animals. This is in sharp contrast to the registered slaughters which amount to a total of 9807.
The reporting of sold animals during the census is only 16% of the realization over the year
2008. Again the fear that the data of the census will be used for taxation purposes must have
been the reason for this gross “underreporting”.
In addition, for the interior 2 farms with animals for slaughter were included with a total of 3
animals.
Table 2.8 Expansion and losses of male cattle for slaughter
DISTRICT
TOTAL
EXPANSION SALES/LOSSES
BIR
T
HS
P
UR
CH
A
SE
D/
GIF
T
SO
L
D
M1
M2
EC
/G
OL
PARAMARIBO 50 50
WANICA 243 157 159 31 32 24 12
NICKERIE 102 23 40 47 8 4 6
CORONIE 21 3 4 3 1 2 2
SARAMACCA 154 55 127 28 22 4 20
COMMEWIJNE 782 139 443 87 28 7 7
MAROWIJNE 1
PARA 13 7 2 2
TOTAL COASTAL PLAIN 1,366 384 825 198 91 41 47

Thematic analysis Animal Husbandry
23
Table 2.9 Expansion and losses of female cattle for slaughter
DISTRICT
TOTAL
EXPANSION SALES/LOSSES
BIR
T
HS
PU
R
CH
A
SE
D/
GIF
T
SO
L
D
M1
M2
EC
/G
OL
PARAMARIBO 40 10
WANICA 153 108 82 16 46 2 25
NICKERIE 90 2 10 23 6 0 2
CORONIE 26 5 4 3 2 1 1
SARAMACCA 127 24 61 9 10 2 1
COMMEWIJNE 676 245 554 59 37 3
MAROWIJNE 2
PARA 17 4 9
TOTAL COASTAL PLAIN 1,131 388 720 120 101 5 32
Gender ratio of slaughter cattle
One given that is used to determine the growth or decline of a herd is the gender ratio of the
slaughtered cattle. A reasonable proportion with possibilities for growth would by 55% bulls to
45% cows slaughtered.
In the following diagram this gender ration is shown for the year 2009 and the 2 first quarters of
2010 of slaughtered animals by the largest cattle slaughterhouse in Suriname.
It is clear that from the first quarter of 2009, when the gender ratio was % of bulls and % of
cows, afterwards, with the exception of quarter 2009/4, more cows were slaughtered than bulls.
This is an indication that the national herd is suffering loss at slaughter.
Sexe verhouding geslachte runderen
Slachthuis Surebeef 2009-2010
Kwartaal
2009/1 2009/2 2009/3 2009/4 2010/1 2010/2
Aa
nta
l d
iere
n
0
500
1000
1500
2000
2500
3000
stieren
koeien
Fig. 2.6 Gender ratio of cattle slaughtered by Surebeef NV
Table 2.10 (numbers and gender ratios cattle slaughters

Thematic analysis Animal Husbandry
24
Bulls Cows Total % bulls % cows
2009/1 1066 1027 2093 0.51 0.49
2009/2 1026 1180 2206 0.47 0.53
2009/3 1254 1313 2567 0.49 0.51
2009/4 1352 1234 2586 0.52 0.48
2010/1 1045 1365 2410 0.43 0.57
2010/2 1144 1344 2488 0.46 0.54
Veterinary care for animals for slaughter
Table 2.11 Veterinary care for animals for slaughter
DISTRICT
MAINLY ANIMALS FOR SLAUGHTER
1 2 3 4 5 6 7 8 9
PARAMARIBO 30 50 10 40 10 10
WANICA 8 78 3 272 8 178 15 156
NICKERIE 2 19 1 1 10 2 6 1 18
CORONIE 2 2 1 1 1
SARAMACCA 3 12 2 2 59 5 14 5 38
COMMEWIJNE 7 52 5 5 82 7 52 20 58
MAROWIJNE 1 1 1 1
PARA 1 4 8 1 13 2 13
TOTAL COASTAL PLAIN 21 198 8 11 484 33 305 54 295
TYPE OF VETERINARY CARE: 1= ARTIFICIAL INSEMINATION
2= ANTIBIOTICS
3= CASTRATION
4= HORMONES
5= LARVICIDE
6= MASTITIS INJECTION
7= PARASITE CONTROL
8= VACCINATION
9= VITAMINS AND MINERALS
Of the total of 1009 farms with animals for slaughter Matabicheiras Aerosol is used on 48 % of
the farms against screwworm larvae.
30 % of the farms uses parasite control against internal and external parasites; and 29 % of the
farms apply vitamins and minerals. On 20 % of the farms antibiotics is used to fight infections.
In comparison to dairy cattle, less veterinary care is given to cattle for slaughter. This can be
explained by the often more extensive production systems that are used for cattle for slaughter.

Thematic analysis Animal Husbandry
25
3. Pigs The pig sector in Suriname is relatively smaller in terms of breeders (155 farms) and inferior to
the the subsectors Poultry and Beef and Dairy cattle.
The local production usually exceeds the demand for pork within the country. The demand for
pork ham, shoulder and loins, for processing by the hotel and restaurant sector, was in the second
half of the year in most cases more than the local supply, so that the large buyers were required
to import processed meats and meat parts. The import of these products flood the local market,
so that the local breeders or producers cannot sell their animals or produce leading to a decrease
of the farm gate price and adverse effects for the local breeders. This trend occurred in
production year 2008. In production year 2009 the local production was able to meet the demand
for the whole year. Salt pork tail is still being imported.
In the years 2000 the local production of pork experienced a lot of problems from high feed
prices, poor quality and imbalanced feed and inferior breeding races having as a result a poor
growth and carcass quality. Meat quality was not an issue, having as a result low farm gate
prices. Despite this a peak production year occurred in 2005 (24,500 Pigs), but only against the
lowest farm gate price (SRD2.75/kg). With the arrival of VARROSS, the largest slaughterhouse
for pigs, more attention is paid to payment for quality lean meat and classification of the carcass.
The local production remained stable, more in particular around 22,000 Pigs. What did change is
the average slaughter weight, which increased from 65 kg (in 2000) to 70 kg (in 2009). This is
the result of the fact that breeders introduced breeding simultaneously with improved feed
composition, a contribution of a new feed company LNB SURIMIX and shorter growth periods
of the piglets.
In the first half of the year 2008 a problem was found on one of the largest pig farms, more in
particular, piglet mortality resulting in a decreased production of fattening hogs in the second
half of the year. This was solved through import.
Most piggeries and number of pigs are concentrated in the areas around Paramaribo, where
livestock feed companies and the slaughterhouse VARROSS are located.
The pig farmers urgently need support in view of the increasing feed prices (80% of the costs),
labor problems with regard to piglet production and growth, as well as disease prevention
(veterinary care) and the allotment of agricultural areas.
Further guidance is required for breeding (through artificial insemination). Most breeders are
aware that they have to breed races that have a good feed intake and fast growth.
That is why TOPIGS lines are bred a lot, in which TOPIGS 40 sows are bred for a good litter
size and milk production. A terminal boar is in most cases a TEMPO or TYBOR boar for fast
growth and good meat quality.
In 2009 a higher slaughter weight was achieved than in previous years.
Table 3.1 Registered slaughtered pigs

Thematic analysis Animal Husbandry
26
2005 2006 2007 2008 2009
Number Par'bo (VSP/VARROS) 25,213 23,501 22,914 22,300 24,232
Nickerie 224 224 382 482 477
Coronie 148 134 149 139 144
Home slaughters (h) 1 20 20 20 0
Total 25,586 23,879 23,465 22,941 24,853
Trend (1980=100) 172.66 161.14 158.34 154.81 167.71
Slaughter weight Par'bo (VSP/VARROS) 1,749,845 1,645,070 1,583,031 1,520,535 1,726,587
(kg) Nickerie 9,485 9,485 16,905 22,945 24,840
Coronie 6,546 6,194 5,630 5,983 7,802
Home slaughters (*) 50 1,400 1,382 1,382 0
Total 1,765,926 1,662,149 1,606,948 1,550,845 1,759,229
Trend (1980=100) 153.28 144.27 139.48 134.61 152.70
Average weight Rural 69.02 69.61 68.48 67.60 70.79
(kg) Trend 88.78 89.53 88.09 86.95 91.05
Distribution Par'bo (VSP/VARROS) 99.1% 99.0% 98.5% 97.4% 97.6%
(by weight) Nickerie 0.5% 0.6% 1.0% 1.5% 1.4%
Coronie 0.4% 0.4% 0.3% 1.0% 1.0%
Home slaughters 0.0% 0.1% 0.2% 0.1% 0.0%
Veestapel opbouwvarkens
Soort varkens
Aa
nta
l
0
1000
2000
3000
4000
5000
zeugen
beren
biggen
gespeende varkens
Fig. 3.1 Herd composition of pigs
The composition of the pig herd as can be seen in fig. 3.1 gives reason for several comments.

Thematic analysis Animal Husbandry
27
What is most striking is the number of boars compared to the number of sows. This ratio is one
boar to 5 sows. In the Districts of Coronie, Commewijne, Para and Nickerie that have low
numbers of animals per farm, each farm will have its own boar.
The introduction of artificial insemination of pigs in these districts can reduce this form of
inefficiency.
Also for this animal species we see that the number of piglets (2601) and weaned pigs (4154) is
not in proportion to the number of sows (1828). There are on average 1.4 piglets per sow and 2.3
fattening pigs on the farms. These numbers are implausibly low. Again a significant
“underreporting” can be expected here, as it is not possible, with these averages to slaughter a
national production of 22941 animals for the year 2008.
Table 3.2 Stocking rate per district
DISTRICT
Pigs
Farms
Number
of
animals
Animals/
farm
PARAMARIBO 0 0 0.00
WANICA 54 3354 62.11
NICKERIE 18 575 31.94
CORONIE 51 626 12.27
SARAMACCA 5 3753 750.60
COMMEWIJNE 11 157 14.27
MAROWIJNE 0 0 0.00
PARA 16 510 31.88
TOTAAL COASTAL
PLAIN 155 8,975 57.90
From Table 3.2 is clear that the largest piggeries are located in the District of Saramacca and the
smallest in the District of Coronie.
If we compare this to the registered slaughters per district of the largest pig slaughterhouse in
Paramaribo we obtain the same picture. See Table 3.3
Table 3.3 Registered slaughters per district
Number
of farms
Number of
animals
% of total
number of
animals Life weight
Slaughtered
weight
% carcass
dressing
Wanica 61 17,598 0.73 1,483,506 1,241,155 83.6
Saramacca 10 5,921 0.24 536,154 433,352 80.8
Para 8 409 0.02 34,975 29,575 84.6
Coronie 14 294 0.01 23,034 18,718 81.3
Nickerie 1 10 0.00 988 835 84.5

Thematic analysis Animal Husbandry
28
In Wanica 288 animals are slaughtered on average per farm, while in Saramacca 592 animals are
slaughtered per farm. The larger farms in Saramacca have more animals per farm and supply on
average also 2x as much animals as the farms in Wanica.
The maintenance percentage of the animals of Saramacca is almost 3% lower than of animals
from the District of Wanica. This % increases as the animals have a higher life weight. So it is
possible that on average animals supplied from Saramacca have a slightly lower weight.
The discrepancy between the number of farms per district according to the data of the census and
the registered slaughters in the Districts of Wanica and Saramacca is the result of the fact that a
number a smaller breeders did not meet the criteria for piggery, however, they did supply pigs
for slaughter to the largest pig slaughterhouse in the country.
According to the census 54 animals had been reported of households that did not meet the
minimum criteria. In Saramacca this number was 6 animals. Along the whole coastal plain and
Paramaribo this number reached a total of 135 animals.
Of the 11 piggeries in Commewijne no animal is supplied for slaughter to the slaughterhouse in
Paramaribo.
In Commewijne there is no pig slaughterhouse, so it can be fittingly assumed that all animals
there are slaughtered at the farm or in a household.
Veterinary care for pigs
Table 3.4 Veterinary care for pigs
DISTRICT
PIGS
1 2 3 4 5 6 7 8 9
PARAMARIBO
WANICA 4 26 13 3 30 24 11 27
NICKERIE 3 7 1 2 5 6 4 11
CORONIE 13 2 1 1 4 8 16
SARAMACCA 1 4 2 1 3 3 2 1
COMMEWIJNE 2 7 4 2 7 5 3 7
MAROWIJNE
PARA 4 2 6 3 2 5
TOTAL COASTAL PLAIN 10 61 24 9 52 45 30 67
TYPE OF VETERINARY CARE: 1= ARTIFICIAL INSEMINATION
2= ANTIBIOTICS
3= CASTRATION
4= HORMONES
5= LARVICIDE
6= MASTITIS INJECTION
7= PARASITE CONTROL
8= VACCINATION
9= VITAMINS AND MINERALS

Thematic analysis Animal Husbandry
29
The veterinary care for pigs concentrates around the application of vitamins and minerals and
antibiotics, respectively at 43 % and 39 % of the farms that breed pigs. In addition, parasite
control and “smearex” is used on 29% and 33% of the farms.
It is remarkable that only on 24 of the 155 farms is listed that castration is practiced, while in
Suriname this is a very general measure to counteract an undesirable boar scent in the meat of
pigs for slaughter.

Thematic analysis Animal Husbandry
30
4. Poultry
Within the poultry sector a distinction is made between large breeders and individuals that keep
poultry especially for their own use. Large breeders can especially be found in the Lelydorp Area
and in Kwatta. On large farms commercial laying hens and chicken for slaughter are used as well
as commercial feed, while on the smaller farms and especially the so-called backyard farms
Surinamese house poultry, known as osofowru, is used. A phenomenon well-known in Suriname
is the ring system, in which an investor has several people employed that make their location and
labor available, and the investor supplies the chicks, the feed and medicines. After raising the
animals, they are picked up and the farmer is paid based on the number of life animals or their
weight.
Within the sector there are: farms producing breeders, farms producing egg-laying chicken and
chicken for slaughter, feed companies, slaughterhouses and processing companies.
The local production of chicken and eggs experiences competition from import. In the period
between 2003-2008 appeared that local production increased from 29 % to 36% of the market
and the goal is to achieve 50%. It is interesting to known that prior to 1992 no chicken or eggs
were being imported.
Because the feed components, that constitute 75% of the costs for producing a full-grown
chicken, is being imported for 90%, is feed the most expensive component for chicken breeding.
There are local products that could be used when making feed, but currently this is not the case.
Furthermore, as a result of the small population of our country, the scale at which is produced is
very unfavorable.. This means that the actors within the sector should work closely together
instead of compete with each other. A chain approach would offer a solution for many of the
problems that now occur in the sector.

Thematic analysis Animal Husbandry
31
Veestapel opbouwpluimvee
Soort pluimvee
Aa
nta
l x 1
00
0
0
50
100
150
250
300
slachtkippen
leghennen
breeders
huiskippen
doksen
ganzen
overigen
Fig. 4.1 Composition of the poultry stock
Figure 4.1 clearly shows the large numbers of chicken for slaughter in comparison to the
numbers of other poultry species. As expected the egg-laying chicken are a good runner up in
numbers. Both of these poultry types are based on commercial species, and the largest part is
bred on large farms with an intensive management system.
It is striking that the number of duck is larger than the number of backyard chicken. Most ducks
are found in the District of Nickerie.
Table 4.1 Animal population per farm
DISTRICT
Poultry
Farms
Number
of
animals
Animals/
farm
PARAMARIBO 220 9640 43,82
WANICA 1105 315942 285.92
NICKERIE 972 44823 46.11
CORONIE 111 6623 59.67
SARAMACCA 420 61734 146.99
COMMEWIJNE 501 17770 35.47
MAROWIJNE 191 8549 44.76
PARA 109 18725 171.79
TOTAAL COASTAL
PLAIN 3,629 483,806 133.32

Thematic analysis Animal Husbandry
32
When comparing the average animal density for poultry it is clear that Wanica houses 30% of the
poultry farms with 65% of the total number of chicken. Wanica also houses the largest farms
with on average the largest number of animals. In the Districts of Para and Saramacca there are
also large poultry farms present.
In addition to the above number of 483,806 animals, there are yet another 75,069 chicken and
37,283 ducks included of households that did not meet the criteria to be included as a farm.
In the interior yet another 410 farms were counted with a total of 7,522 animals. This makes
poultry farming the only animal husbandry activity of any significance in the interior.
This brings the total of poultry farms for the whole of Suriname to 4039 with a total of 491,328
animals.
This number, however, does not reflect reality. The production of poultry meat per year indicates
that the real number of animals should be much higher.
An alternative manner to determine the size of the poultry stock is as follows: In 2009 7,357 ton
of poultry meat was produced. Assuming an average slaughter weight of 1.5 kg per chicken, that
amounts to 4,900,000 chicken. This number is produced over 6 fattening rounds of 8 weeks each.
At any moment of the year, there are around 977,000 chicken for slaughter present in Suriname.
The number of commercial egg-laying chickens was 160,000. Added to that were 52,000 ducks
and 42,000 backyard chicken, according to the agricultural census.
The poultry stock of chicken for slaughter, egg-laying chicken and barnyard chicken and ducks
is around approximately 1,075,000 animals.
If we deduct from the numbers of the Agricultural Statistics Department (total production over
2008) the number of egg-laying chicken, and distribute the remainder over 6 fattening rounds,
we arrive at 160,000 + 852,000 = 1,012,000 animals present at any moment. This is close to the
size of the above approximation.
Market for poultry products
According to the agricultural census of 2008 228,071 chicken for slaugher were bought in 3
months in 2008. This is a total number of 912,284 animals for the whole year of 2008. With an
average slaughter weight of 1.5 kg per animal, the poultry production over 2008 would only be
1,400 ton.
Reports of brooders and import data of slaughter chicks over the year 2008 show a chicken meat
production of 8,325 ton.
A total egg production of 350,000 pieces over 3 months of the year 2008 was reported. This
amounts to a total egg consumption egg production of 1,400,000 pieces.
The calculation of the number of consumption eggs on the basis of data from the brooders and
import data of egg-laying chicks amounts to around 40,000,000 pieces.
Here again it looks as if the reported sales of livestock products was consciously underreported
by the livestock keepers.

Thematic analysis Animal Husbandry
33
Table 4.2 Production of poultry and consumption eggs 2006-2009
2006 2007 2008 2009
Poultry (ton) 5864 7343 8325 7357
Eggs (x10000
pcs.) 3463 4291 4047 4676
Productie kippenvlees en consumptie eieren2006-2009
Jaar
2005 2006 2007 2008 2009 2010
Kip
pe
nvle
es (
ton
) e
n e
iere
n (
x1
00
00
)
0
2000
4000
6000
8000
10000
kippenvlees
eieren
Fig. 4.2 Production of poultry and consumption eggs
The local production of chicken meat and consumption eggs can be seen in table 4.2 and diagram
4.2.
It can be seen that both the production of chicken meat and the production of consumption eggs
shows a rising trend. Only the year 2009 shows a decline in the production of chicken meat.
Probably because of a deterioration of the competitive position of local producers as compared
with cheaper import products.

Thematic analysis Animal Husbandry
34
Veterinary care for poultry
Table 4.3 Veterinary care for poultry
DISTRICT
POULTRY
1 2 3 4 5 6 7 8 9
PARAMARIBO 30 10 10 10 60
WANICA 233 6 16 45 43 348
NICKERIE 380 25 10 27 15 422
CORONIE 10 1 18
SARAMACCA 80 23 22 23 30 88
COMMEWIJNE 94 25 23 31 35 90
MAROWIJNE 11 2 21
PARA 17 1 7 61
TOTAL COASTAL PLAIN 855 81 82 144 133 1,108
TYPE OF VETERINARY CARE: 1= ARTIFICIAL INSEMINATION
2= ANTIBIOTICS
3= CASTRATION
4= HORMONES
5= LARVICIDE
6= MASTITIS INJECTION
7= PARASITE CONTROL
8= VACCINATION
9= VITAMINS AND MINERALS
Of the total of 3629 farms in the coastal plain in 31% of the cases vitamins and minerals were
administered. Then the administration of antibiotics follows on 24% of the farms.
It is striking that parasite control and vaccination (both necessary actions in the poultry sector)
only takes place on 4% of the farms.
It should be noted that vaccinations are used against several poultry diseases already in the
brooding stage, and this may not be known to the breeder.

Thematic analysis Animal Husbandry
35
5. Small ruminants
The farming of small ruminants in Suriname is practiced only on a modest scale. The number of
farms is not very large and the number of animals per farm is low (less than 10 animals on
average).
Most of the farms with sheep and/or goats are located in the Districts of Wanica, Coronie and
Nickerie.
There is only one farm with a large number of animals located in the interior.
In Suriname sheep and goat are kept exclusively for the meat. These animals are not milked, thus
there is no processing of milk of these animals involved.
In general, there are only a few animals on a farm and specialization in the farming of small
ruminants is very rare.
Small ruminants often are one of the types of animals present on the farm, combinations with
cattle, pigs or poultry and the cultivation of vegetables are widespread.
Small ruminants mostly form only a small part of the earnings and generally get little attention
from the management.
In most cases on the smaller farms, the animals are grazed in a small pasture or roped (tethered)
alongside the road.
At night, the animals are brought inside in a more or less adequate shed in the vicinity of the
home, in particular to guard them against theft and attacks from wild dogs.
On a few larger farms, there are well-built barns, adapted to this animal species, and the feeding
of these animals is often supplemented with sharps or fodder for dairy cattle.
The animals often represent the savings for unexpected expenses or are used to satisfy the need
for meat at big parties, such as weddings.
In general, the animals are bought from the farmers by wholesale buyers, whether or not
employed by one or more slaughterhouses, who then also make arrangements for transport to the
slaughterhouse.
Most of the animals for slaughter are not taken to the slaughterhouse, but are slaughtered at
home. No meat inspection thus takes place.
Sale is mostly on the foot, sometimes on the basis of the weight of the carcass.
The current prices are approximately SRD 12.50 per kg of live weight, or approximately SRD 25
per kg of live weight.
Every year, approximately 17 tons of mutton and goat meat are sold on the local market through
the slaughterhouses. There are no exports.
In spite of the high prices for mutton and goat, this type of farming has not taken off.
The most important reasons for this are: Technical problems with the farming of especially sheep
under Suriname’s humid, warm climate conditions. In particular intestinal parasites are
significant in this.
Small ruminants need significantly more care than cattle, and on many farms, such extra care is
not provided, resulting in high mortality among these animals.
The farmers have great need for training and education.

Thematic analysis Animal Husbandry
36
Table 5.1 Registered slaughtered sheep and goats
2005 2006 2007 2008 2009
Number
Par’bo/ Halal
slaughterhouses 1377 0 0 0 0
Nickerie 7 7 4 8 25
Coronie 3 0 2 0 3
Argema/surebeef 389 1504 1,327 1,353 1,495
Para 37 30 24 46 42
Commewijne 0 0 0 0 6
Home slaughters (h) 0 32 0 0 24
Total 1,813 1,573 1,357 1,407 1,595
Trend (1980=100) 177.6 154.2 132.9 135.6 156.2
Slaughter weight
Par’bo/ Halal
slaughterhouses 6885 0 0 0 0
(kg) Nickerie 55 55 35 45 255
Coronie 41 0 40 0 25
Argema/surebeef 4402 14588 12,435 12,966 15,349
Para 185 285 226 441 428
Commewijne 0 0 0 0 61
Home slaughters (*) 0 304 0 0 245
Total 11,568 15,232 12,736 13,452 16,363
Trend (1980=100) 163.1 215 180 187.1 231.4
Average weight Rural 6.6 9.5 9.4 9.6 10.3
(kg) Trend 95.3 137.2 135.7 138.0 148.1
Distribution
Par’bo/ Halal
slaughterhouses 57.80% 0.00% 0% 0.00% 0.00%
(by weight) Nickerie 0.60% 0.36% 0.27% 0.33% 1.56%
Coronie 0.30% 0.00% 0.31% 0.00% 0.15%
Argema/surebeef 37% 96% 97.60% 96.39% 93.80%
Para 1.60% 1.87% 1.70% 3.28% 2.62%
Commewijne 0% 0% 0% 0.00% 0.37%
Home slaughters 0% 2% 0% 0.00% 1.50%
An increase of the average slaughter weight, together with an increase of the animals offered for
slaughter indicates that the subsector is experiencing a rising trend. However, the potential of this
sector is much bigger and the work will have to continue.
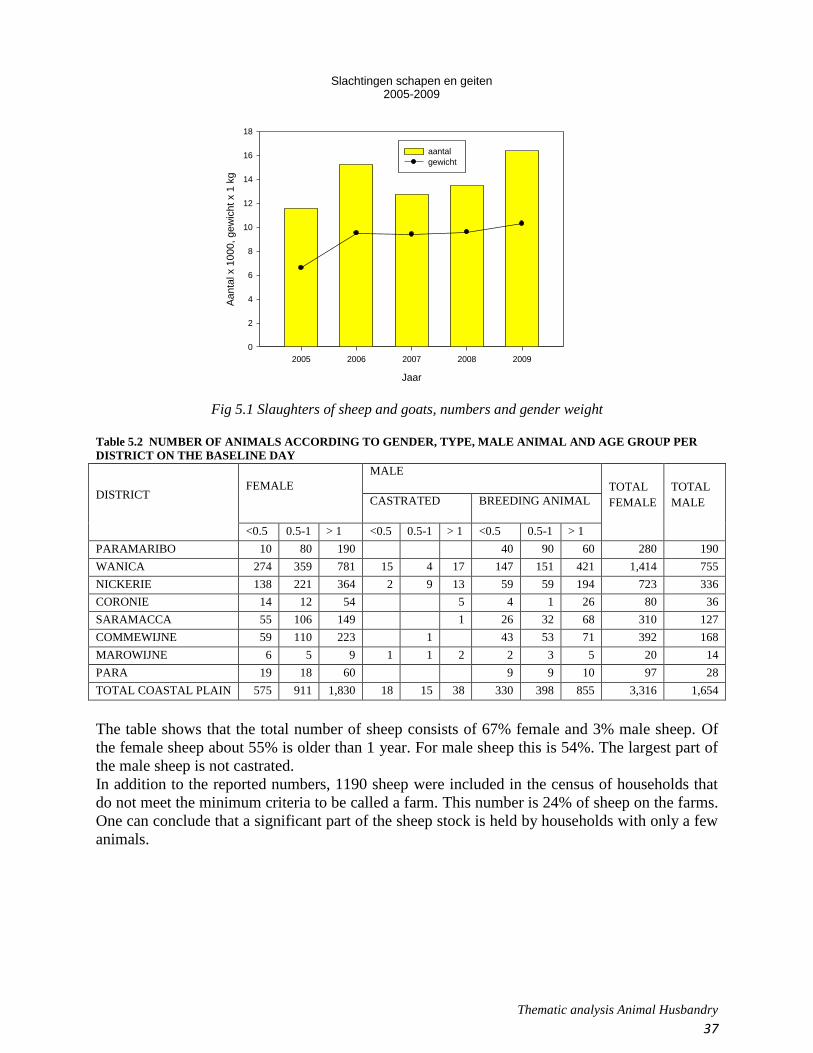
Thematic analysis Animal Husbandry
37
Slachtingen schapen en geiten2005-2009
Jaar
2005 2006 2007 2008 2009
Aa
nta
l x 1
00
0, g
ew
ich
t x 1
kg
0
2
4
6
8
10
12
14
16
18
aantal
gewicht
Fig 5.1 Slaughters of sheep and goats, numbers and gender weight
Table 5.2 NUMBER OF ANIMALS ACCORDING TO GENDER, TYPE, MALE ANIMAL AND AGE GROUP PER
DISTRICT ON THE BASELINE DAY
DISTRICT FEMALE
MALE
TOTAL
FEMALE
TOTAL
MALE CASTRATED BREEDING ANIMAL
<0.5 0.5-1 > 1 <0.5 0.5-1 > 1 <0.5 0.5-1 > 1
PARAMARIBO 10 80 190 40 90 60 280 190
WANICA 274 359 781 15 4 17 147 151 421 1,414 755
NICKERIE 138 221 364 2 9 13 59 59 194 723 336
CORONIE 14 12 54 5 4 1 26 80 36
SARAMACCA 55 106 149 1 26 32 68 310 127
COMMEWIJNE 59 110 223 1 43 53 71 392 168
MAROWIJNE 6 5 9 1 1 2 2 3 5 20 14
PARA 19 18 60 9 9 10 97 28
TOTAL COASTAL PLAIN 575 911 1,830 18 15 38 330 398 855 3,316 1,654
The table shows that the total number of sheep consists of 67% female and 3% male sheep. Of
the female sheep about 55% is older than 1 year. For male sheep this is 54%. The largest part of
the male sheep is not castrated.
In addition to the reported numbers, 1190 sheep were included in the census of households that
do not meet the minimum criteria to be called a farm. This number is 24% of sheep on the farms.
One can conclude that a significant part of the sheep stock is held by households with only a few
animals.

Thematic analysis Animal Husbandry
38
Veestapel opbouwschapen
Geslacht
Aa
nta
l
0
500
1000
1500
2000
2500
3000
3500
< 0.5 jr
0.5-1 jr
> 1jr
Ram Ooi
Fig. 5.2 Herd composition of sheep
The above table shows a very lopsided composition of the sheep herd. Based on the number of
ewes, 2 juvenile animals on average of <0.5 years and 0.5-1 years have to be present. On a
number of 1830 ewes there should be 3660 animals under 1 year of age (male and female
animals). According to the data provided there are only 3,274. This could point at a relatively
high mortality of juvenile animals. According to the data of table Sale and Losses 485 animals
were included under the headings mortality and other. This fits in reasonably with the calculated
shortage of 386 animals that should in fact be present on the farms.
Another aspect that is striking, is the relatively large number of male animals older than 1 year.
For every 30 ewes one ram is required assuming 100% natural servicing, as is still the case in
Suriname. Assuming 1830 ewes older than 1 year, and thus able to reproduce, in principle 61
breeding rams would be required. This number can be doubled because of replacement and
selection. That there are much more adult rams is due to the fact that the farms are very small, on
average only 3.2 ewes per farm, where there are on average 1.5 rams (each farm its own ram).
Part of the adult rams will not be used as breeding animal, but stay to long on the farm because
their growth is stunted, so that many animals do not have a sufficient weight before their first
year.
The foregoing entails that the scarce pasture and feed are used by less productive animals.
It should be noted that also for the small ruminants the number of animals reported most likely
does not reflect reality. The total number reported of 4,970 animals in reality should be closer to
9,000 animals. The number of reported animals indeed corresponds to the general assumption
that the data of the census are around 50% of the actual figures.

Thematic analysis Animal Husbandry
39
For the interior no farms were reported having sheep or goats. There is, however, one company
in the Upper Coesewijne area that does own a significant number number of animals (>250
animals).
Because of the sample method used for the census in the interior, this company has remained out
of side.
Other farms in the interior with sheep and goats are not known. The most important reasons for
this are: unfamiliarity with the breeding, problems with the care, especially with sheep and goats
people are not used to the consumption of sheep and goat meat. It is not a part of the normal
eating pattern.
It should be indicated that especially in the District of Marowijne, there is increasing interest in
the breeding of small ruminants.
The reason for this is the fact that sheep and goat meat in French Guyana appear to be an
attractive option.
Table 5.3 Number of sheep according to expansion, sales/losses per district in 2008
DISTRICT
EXPANSION AND SALES/LOSSES
EXPANSION SALES/LOSSES
BIRTHS PURCHASED/GIFT SOLD M1 M2 OC/G OL
PARAMARIBO 120 50 10 10 20 20
WANICA 582 140 1,669 102 79 44 36
NICKERIE 231 50 50 48 22 25 26
CORONIE 25 9 1 7 4 2 5
SARAMACCA 73 17 11 38 13 13 13
COMMEWIJNE 162 71 109 27 22 6 8
MAROWIJNE 8 2 1
PARA 28 17 4 1
TOTAL COASTAL PLAIN 1,229 339 1,867 236 141 111 108
EXPANSION=EXPANSION BIRTHS=BIRTHS SALES/LOSSES: SOLD=SOLD
PURCHASED/GIFT= PURCHASED/GIFT M1=DIED< 3MNTHS
M2=DIED≥ 3MNTHS
OC/G=OWN CONSUMPTION/GIFT
OL=OTHER LOSS
Table 5.4 Animal population per farm
DISTRICT Sheep

Thematic analysis Animal Husbandry
40
Farms
Number
of
animals
Animals/
farm
PARAMARIBO 70 470 6.71
WANICA 266 2169 8.15
NICKERIE 111 1059 9.54
CORONIE 14 116 8.29
SARAMACCA 46 437 9.50
COMMEWIJNE 46 560 12.17
MAROWIJNE 5 34 6.80
PARA 12 125 10.42
TOTAL COASTAL
PLAIN 570 4970 8.72
Most sheep are found in the District of Wanica, more in particular 44% of the total number of sheep in
the coastal plain and Paramaribo. This number of 2,169 animals is divided over 266 farms having an
average of 8.2 animals per farm.
Nickerie is then the district with most sheep, more in particular 27% of the total. This number of 1059
animals is divided over 111 farms having an average of 9.5 animals per farm.
The largest number of sheep per farm are found in the District of Commewijne with on average 12.2
pieces.

Thematic analysis Animal Husbandry
41
Veterinary care for sheep
Table 5.5 Veterinary care for ruminants
DISTRICT
SHEEP
1 2 3 4 5 6 7 8 9
PARAMARIBO 10
WANICA 53 2 144 4 89 8 92
NICKERIE 1 28 1 2 19 2 6 3 24
CORONIE 4 1 1 3
SARAMACCA 3 11 2 2 15 3 3 2 9
COMMEWIJNE 4 17 4 6 18 5 15 5 16
MAROWIJNE 1 1 1
PARA 1 8 6 8
TOTAL COASTAL PLAIN 8 115 7 12 215 14 120 19 153
TYPE OF VETERINARY CARE: 1= ARTIFICIAL INSEMINATION
2= ANTIBIOTICS
3= CASTRATION
4= HORMONES
5= LARVICIDE
6= MASTITIS INJECTION
7= PARASITE CONTROL
8= VACCINATION
9= VITAMINS AND MINERALS
The veterinary care for sheep concentrates around the application of Smearex against the larvae
of the screw worm fly which is administered at 38 % of the farms. Like the veterinary care for
large ruminants the administration of vitamins and minerals, parasite control and administration
of antibiotics by respectively 27 %, 21 % and 20 % next to the use of larvicide are the most
prevalent actions on farms with sheep.
A figure that makes a person wonder is the fact that 8 farms indicate to use artificial
insemination. This is a technique that for as far as known is not applied in Suriname.

Thematic analysis Animal Husbandry
42
Goats
Herd composition of goats
Veestapel opbouwgeiten
Geslacht
Aa
nta
l d
iere
n
0
500
1000
1500
2000
2500
< 0.5 jr
0.5-1 jr
> 1 jr
geiten bokken
Fig 5.3 Herd composition of goats
As for sheep a lopsided composition of the herd can be concluded also for the goats.
From the below table appears that according to the census the goat herd consists for 65% of
female animals and 35 % male animals.
In addition to the reported numbers (a total of 3434), 1385 goats were included in the census of
households that do not meet the minimum criteria to be called a farm. This is 40% of the total
number of farms with goats.
One can conclude like with the sheep that a significant part of the goat stock is held by
households with only a few animals.
The total number of animals counted during the census of 4819 is not a reflection of the actual
number of animals in the coastal plain and Paramaribo. This should be, like for the sheep, around
9000 animals. The number of animals indicated is again around 50% of the actual number.
Table 5.6 Number of goats according to gender, type, male animal and age group per district on
the baseline day

Thematic analysis Animal Husbandry
43
DISTRICT
GENDER, TYPE MALE GOATS AND AGE GROUP
FEMALE
MALE
TOTAL
FEMALE
TOTAL
MALE CASTRATED
BREEDING
ANIMAL
<0.5 0.5-1 > 1 <0.5 0.5-1 > 1 <0.5 0.5-1 > 1
PARAMARIBO 30 10 10 30 20
WANICA 205 218 562 9 4 13 129 121 314 985 590
NICKERIE 74 124 277 4 1 13 29 70 116 475 233
CORONIE 1 2 2 3 2
SARAMACCA 32 86 104 4 3 14 24 38 222 83
COMMEWIJNE 65 108 252 4 3 70 77 70 425 224
MAROWIJNE 19 7 14 2 3 3 8 40 16
PARA 21 12 32 6 4 11 65 21
TOTAL COASTAL PLAIN 417 555 1.273 23 10 29 251 309 567 2,245 1,189
Table 5.7 Number of goats according to expansion, sales/losses per district in 2008
DISTRICT
EXPANSION AND SALES/LOSSES
EXPANSION SALES/LOSSES
BIRTHS PURCHASED/GIFT SOLD M1 M2 OC/G OL
PARAMARIBO 20
WANICA 440 118 1,571 75 31 32 7
NICKERIE 178 32 43 34 16 30 15
CORONIE
SARAMACCA 53 11 17 11 31 0 2,210
COMMEWIJNE 180 50 78 50 24 10 1
MAROWIJNE 5
PARA 16 10 2 3
TOTAL COASTAL PLAIN 892 211 1,719 172 102 72 2,236
EXPANSION=EXPANSION BIRTHS=BIRTHS SALES/LOSSES: SOLD=SOLD
PURCHASED/GIFT= PURCHASED/GIFT M1=DIED< 3MNTHS
M2=DIED≥ 3MNTHS
OC/G=OWN CONSUMPTION/GIFT
OL=OTHER LOSS
The table shows that the largest expansion of goats takes place through births (almost 81%).
Most losses occur as a result of ‘Other loss’ and more in particular by 52% of the total.
Also for goats it appears that the losses from mortality and “other” (dogs, snakes) are larger than
the sales and own consumption. The losses are even 2.3 times bigger than the expansion and
constitute 73% of the total number of animals reported by the farms having goats.
It should not be surprising that with such numbers a herd will not grow.
Table 5.8 Animal numbers and density per district
Goats

Thematic analysis Animal Husbandry
44
DISTRICT Farms
Number
of
animals
Animals/
farm
PARAMARIBO 10 50 5.00
WANICA 261 1575 6.03
NICKERIE 71 708 9.97
CORONIE 1 5 5.00
SARAMACCA 37 305 8.24
COMMEWIJNE 65 649 9.98
MAROWIJNE 6 56 9.33
PARA 11 86 7.82
TOTAL COASTAL
PLAIN 462 3434 7.43
The above table shows that the largest farms with goats are located in the districts of Nickerie,
Commewijne and Marowijne, while the largest number of farms and number of animals occurs
in the District of Wanica.
Nickerie and Commewijne also have the largest sheep farms and we could say that in these
districts the breeding of small ruminants makes up an important part of the livestock farming.
The largest number of farms and of animals for both types of small ruminants occur, however, in
the District of Wanica.
Veterinary care for goats
Table 5.9 Veterinary care for goats
DISTRICT
GOATS
1 2 3 4 5 6 7 8 9
PARAMARIBO 30 50 10 40 10 10
WANICA 8 78 3 272 8 178 15 156
NICKERIE 2 19 1 1 10 2 6 1 18
CORONIE 2 2 1 1 1
SARAMACCA 3 12 2 2 59 5 14 5 38
COMMEWIJNE 7 52 5 5 82 7 52 20 58
MAROWIJNE 1 1 1 1
PARA 1 4 8 1 13 2 13
TOTAL COASTAL PLAIN 21 198 8 11 484 33 305 54 295
TYPE OF VETERINARY CARE: 1= ARTIFICIAL INSEMINATION
2= ANTIBIOTICS
3= CASTRATION
4= HORMONES
5= LARVICIDE
6= MASTITIS INJECTION
7= PARASITE CONTROL
8= VACCINATION
9= VITAMINS AND MINERALS

Thematic analysis Animal Husbandry
45
Larvicides are used on all goat farms. Parasite control is practiced on 66% of the farms, and the
administration of vitamins and minerals and of antibiotics on respectively 56% and 43% of the
farms that keep goats.
We again see that AI is applied on 5% of the farms, which is considered to be very unlikely.
Although in general, it is assumed that goats are more resilient animals than sheep, the veterinary
care for goats is clearly more significant.
If we make a comparison between the veterinary care of all types of ruminants, we end up with a
picture as is shown in Table 5.10.
Table 5.10 Veterinary care for ruminants
dairy
cattle
animals
for
slaughter sheep goats
Artificial insemination 8 2 1 5
Larvicide 53 48 38 100
Parasite control 35 30 21 66
Vitamins and minerals 37 29 27 56
Antibiotics 26 20 20 43
As can be expected artificial insemination is applied to a large part of the farms with dairy cattle
and to a lesser extent for animals for slaughter. Surprisingly, it was reported that sheep and goats
are also artificially inseminated, while that is not the case.
Smearex is generally used against infestations of the larvae of the screw worm fly, which poses a
real problem to the livestock keepers in Suriname.
One would expect parasite control (especially against intestinal parasites “worms”) on 100% of
the livestock farms, however, the numbers do not meet our expectation.
The administration of vitamins and minerals is a must for livestock farms having a poor quality
pasture and supplemental feed. High percentages should be expected here as well.
On an average of 1 out of 5 livestock farms with ruminants, antibiotics are being used, which can
be considered completely reasonable.

Thematic analysis Animal Husbandry
46
Sources.
Report: Doorrekening Fiscale voorzieningen voor de agrarische sector (2008).
Annual Reports LVV: 2005, 2006, 2007, 2008.
Annual Reports ODVE: 2005,2006,2007,2008,2009
Feasibility studie Melk Collectie Centra. Kalloe Consultany & Agrotec (2009).
Statistics Melkcentrale NV.
Agricultural Statistics 2004-2009, Min LVV
P. Bastiaansen, Veeteelt gids voor Suriname deel 1: Herkauwers, 1995
P. Bastiaansen, Veeteelt gids voor Suriname deel 2:
M. Fleurkens, Impeding factors for increasing mutton production in the coastal area of Suriname,
2005
Second Agricultural Census Suriname 1959
Tables Fourth Agricultural Census Suriname, 1981
Statistical Analysis Fifth Agricultural Census Suriname, 2010