Nguoinamchamlinho 130313000327-phpapp01-130513050024-phpapp01
Upload
kristi-andersonCategory
view
95download
0
THE
ESSENTIALSOF
FINANCEAND
ACCOUNTINGFOR
NONFINANCIALMANAGERS

This Page Intentionally Left Blank
THE
ESSENTIALSOF
FINANCEAND
ACCOUNTINGFOR
NONFINANCIALMANAGERS
EDWARD FIELDS
American Management AssociationNew York • Atlanta • Brussels • Buenos Aires • Chicago • London • Mexico City • San Francisco
Shanghai • Tokyo • Toronto • Washington, DC
Special discounts on bulk quantities of AMACOM books areavailable to corporations, professional associations, and otherorganizations. For details, contact Special Sales Department,AMACOM, a division of American Management Association,1601 Broadway, New York, NY 10019.Tel.: 212-903-8316 Fax: 212-903-8083Web site: www.amacombooks.org
This publication is designed to provide accurate and authoritativeinformation in regard to the subject matter covered. It is sold withthe understanding that the publisher is not engaged in renderinglegal, accounting, or other professional service. If legal advice orother expert assistance is required, the services of a competentprofessional person should be sought.
Library of Congress Cataloging-in-Publication Data has been applied for and ison record at the Library of Congress.
� 2002 Edward FieldsAll rights reserved.Printed in the United States of America.
This publication may not be reproduced,stored in a retrieval system,or transmitted in whole or in part,in any form or by any means, electronic,mechanical, photocopying, recording, or otherwise,without the prior written permission of AMACOM,a division of American Management Association,1601 Broadway, New York, NY 10019.
Printing number Bookz ISBN: 0814471226
10 9 8 7 6 5 4 3 2 1
Contents
Introduction 1
Part 1: Understanding Financial Information
1. The Balance Sheet 152. The Income Statement 383. The Statement of Cash Flows 434. Generally Accepted Accounting Principles: A
Review 515. The Annual Report and Other Sources of
Incredibly Valuable Information 55
Part 2: Analysis of Financial Statements
6. Key Financial Ratios 797. Using Return on Assets to Measure Profit Centers 1058. Overhead Allocations 116
Part 3: Decision Making for Improved Profitability
9. Analysis of Business Profitability 12910. Return on Investment 149
v
vi Contents
Part 4: Additional Financial Information
11. Financing the Business 18112. Business Planning and the Budget 19613. Selected Business Readings 208
Appendix A. Financial Statement Practice 219Answer Key
Appendix B. A Matching Exercise 226Answer Key
Appendix C. Paley Products 236Answer Key
Appendix D. A Matching Exercise 245Answer Key
Glossary 251
Index 283
Introduction
Background
This is a book for businesspeople. All decisions in a business or-ganization are made in accordance with how they will affect theorganization’s financial performance and future financial health.Whether your background is marketing, manufacturing, distribu-tion, research and development, or the current technologies, youneed financial knowledge and skills if you are to really under-stand your company’s decision-making, financial, and overallmanagement processes. The budget is essentially a financialprocess of prioritizing the benefits resulting from business op-portunities and the investments required to implement those op-portunities. An improved knowledge of these financial processesand the financial executives who are responsible for them willimprove your ability to be an intelligent and effective participant.
This book is special for a number of reasons:
1. It teaches what accountants do; it does not teach how todo accounting. Businesspeople do not need to learn, norare they interested in learning, how to do debits and cred-its. They do need to understand what accountants do andwhy, so that they can intelligently use the resulting infor-mation—the financial statements.
2. It is written by a businessperson for other businesspeo-ple. Throughout a lifetime of business, consulting, andtraining experience, I have provided my audiences with
1
2 Introduction
down-to-earth, practical, useful information. I am not anaccountant, but I do have the knowledge of an intelligentuser of financial statements. I understand your problems,and I seek to share my knowledge with you.
3. It emphasizes the business issues. Many financial booksfocus on the mathematics. This book employs mathemat-ical information only when it is needed for the businessdecision-making process.
4. It includes a chapter on how to read an annual report thathelps you use the information that is available there tobetter understand your own company. This chapter alsoidentifies a number of other sources of information in thepublic domain about your competition that may be verystrategically valuable.
5. It includes information on how the finance departmentcontributes to the profitability and performance of thecompany. The financial staff should be part of the busi-ness profitability team. This book describes what youshould expect from them.
6. It contains many practical examples of how the informa-tion can be used, based upon extensive, practical experi-ence. It also provides several exercises, including apractice case study, as appendices.
The book is in four parts:
Part 1, Understanding Financial Information, Chapters 1through 5. In Part 1, the reader is given both an overview anddetailed information about each of the financial statements andits components. A complete understanding of this informationand how it is developed is essential for intelligent use of the fi-nancial statements.
Part 2, Analysis of Financial Statements, Chapters 6 through8. Part 2 describes the many valuable analyses that can be per-formed, using the information that was learned in Part 1. Busi-ness management activities can essentially be divided into twobasic categories:
Measuring performanceMaking decisions
3Introduction
Part 2 describes how to measure and evaluate the perform-ance of the company, its strategic business units, and even itsindividual products.
Part 3, Decision Making for Improved Profitability, Chapters9 and 10. This part describes the key financial analysis tech-niques that managers can use to make decisions about every as-pect of their business. Financial analysis provides valuable toolsfor decision making. However, managers must still make the de-cisions.
Part 4, Additional Financial Information, Chapters 11through 13 and appendices. Part 4 provides further informationabout elements of the financial process that can serve as tools forthe business manager. These include the budget and methods ofobtaining the financing to support the business. Part 4 also in-cludes a glossary and quite a few practice exercises.
Part 1, Understanding Financial Information
Part 1 discusses the financial reports that the company produces.These include:
The balance sheetThe income statementThe statement of cash flows
Each statement is described, item by item. The discussion ex-plains where the numbers belong and what they mean. The en-tire structure of each financial statement is described, so that youwill be able to understand how the financial statements interre-late and what information they convey.
Part 1 also explains how to read and understand an annualreport. The benefits of doing so are numerous. They include:
Understanding the reporting responsibilities of a publiccompanyFurther understanding the accounting processIdentifying and using information about your competitorsthat is in the public domain
4 Introduction
Part 2, Analysis of Financial Statements
Now that we have learned how to read the financial statements,we can understand how they are prepared and what they mean.Part 2 describes management tools that help us to use the in-formation in the financial statements to analyze the company’sperformance. The ratios that will be covered describe the com-pany’s:
LiquidityWorking capital managementFinancial leverage (debt)Profitability and performance
Part 3, Decision Making for Improved Profitability
Part 3 describes a number of tools that can help managers withdecision making. It introduces breakeven analysis, which can beused to evaluate individual products and the product mix.
It also explores fixed cost versus variable cost issues withinthe strategic planning context, such as:
Supply chain managementNew product strategyMarketing strategy
Part 3 also covers return on investment analysis for investmentdecision making. It explains the principle of discounted cash flowand several methods of analysis that employ it:
Internal rate of returnNet present valueProfitability index
It also discusses ways of integrating profitability require-ments with company performance targets and methods of plan-ning and evaluating investments, such as:
5Introduction
Capital expenditure decisionsR&D analysis and justificationAcquiring other companiesMarketing programsStrategic alliances
Part 4, Additional Financial Information
Part 4 describes in considerable detail some additional financialinformation that will benefit the businessperson. It includes dis-cussions of the planning process and the budget, and why theyare so important. It also covers ways of financing the corpora-tion. While this is not a direct responsibility of most members ofthe management team, knowledge of debt and equity marketsand sources of corporate financing is very beneficial.
There are also a number of practice exercises that will rein-force the knowledge gained from the book.
Additional Background
We study financial management because doing so helps us tomanage our business more intelligently.
As mentioned earlier, business management activities maybe divided into two major categories:
Measuring performanceMaking decisions
We measure the performance of products and markets in orderto understand the profitability of the business. Knowledge of ourcompany’s products, markets, and customers enables us to makedecisions that will improve this profitability.
The income statement measures the performance of thebusiness for a period of time, usually a year, a quarter, or amonth. It enables us to determine trends and identify strengthsand weaknesses in the company’s performance.
The balance sheet measures the financial health of the busi-
6 Introduction
ness at a point in time, usually at the end of a month, quarter, oryear. Are we able to finance future growth? Can the companyafford to pay off its debt?
Breakeven analysis helps us to understand the profitabilityof individual products. We can use it to evaluate pricing strategiesand costs. The company uses the results of this analysis in deci-sions concerning outsourcing options, vertical integration, andstrategic alliances.
This book surveys these financial tools. We will providedescriptions and definitions of their components and gain an un-derstanding of how they can help us and why we should under-stand them.
Accounting Defined
Accounting is the process of recording past business transactionsin dollars. Training to become a certified public accountant (CPA)involves learning the rules and regulations of the following orga-nizations:
The Securities and Exchange Commission. This is an agencyof the federal government that, among other things, pre-scribes the methodology for reporting accounting resultsfor companies whose stock is publicly traded. Most privatecompanies adhere to most of these rules except for therequirement that they publish the information.
The Internal Revenue Service. This agency oversees the filingof all corporate tax reports consistent with the tax legisla-tion passed by the U.S. Congress.
The Board of Governors of the Federal Reserve System. Thisexecutive branch federal agency prescribes the reportingand accounting systems used by commercial banks.
Two private accounting organizations are integral to the account-ing profession:
The Financial Accounting Standards Board (FASB). This is aresearch organization that evaluates, develops, and rec-
7Introduction
ommends the rules that accountants should follow whenthey audit a company’s books and report the results toshareholders. The products of the FASB’s efforts are re-ports known as FASB Bulletins.
The American Institute of Certified Public Accountants. Thisis the accountants’ professional organization (trade asso-ciation). It is an active participant in the accounting dia-logue.
The work of all these organizations and the dialogue amongthem, along with the work of the tax-writing committeesof the U.S. Congress, result in what are known as generallyaccepted accounting principles.
Generally Accepted Accounting Principles
The concept of generally accepted accounting principles (GAAP)makes an invaluable contribution to the way in which businessis conducted. When a CPA firm certifies a company’s financialstatements, it is assuring the users of those statements that thecompany adhered to these principles and prepared its financialstatements accordingly.
Why Is This Important?
The use of GAAP provides comfort and credibility. The reader ofthe reported financial statements is typically not familiar with theinner workings of the company. GAAP gives a company’s bank-ers, regulators, potential business partners, customers, and ven-dors some assurance that the information provided in thecompany’s financial statements is accurate and reliable. It facili-tates almost all business dealings.
Why Is This an Issue for the Business Manager?
While accounting principles and practices are critical for the pre-sentation of past history, their mechanics, requirements, andphilosophies are not necessarily appropriate when the business
8 Introduction
manager seeks to analyze the business going forward. To under-stand this issue, we need to define financial analysis.
Financial Analysis
Financial analysis is an analytical process. It is an effort to exam-ine past events and to understand the business circumstances,both internal and external, that caused those events to occur.Knowing and understanding the accounting information is cer-tainly a critical part of this process. But to fully understand thecompany’s past performance, it is important to also have infor-mation concerning units sold, market share, orders on the books,utilization of productive capacity, the efficiency of the supplychain, and much more. Every month, we compare actual per-formance with the budget. This is not an accounting process, itis an analytical process that uses accounting information. Ac-counting is the reporting of the past. The budget reflects man-agement’s expectations for future events and offers a standard ofperformance for revenues, expenses, and profits.
Financial analysis as a high-priority management processalso requires forecasting. A forecast is an educated perception ofhow a decision being contemplated will affect the future of thebusiness. It requires a financial forecast—a financial quantifica-tion of the anticipated effect of the decision on marketing andoperational events, and therefore on cash flow.
Accounting/Forecasting/Budget Perspective
The end result of all the planning efforts in which a companyengages, including forecasting, must be the making of decisions.These many decisions about spending allocations, products, andmarkets are reflected in a voluminous report called a budget.Therefore, the budget is really a documentation of all the deci-sions that management has already made.
The Issues
There are frequently cultural clashes between the accounting de-partment and the rest of the company. This results from the false
9Introduction
assumption that the philosophies and attitudes that are requiredfor accounting are also appropriate in business analysis anddecision making. The budget is not an accounting effort. It is amanagement process that may be coordinated by people withaccounting backgrounds. A forecast need not adhere to account-ing rules. There is nothing in accounting training that teachesaccountants to deal with marketing and operational forecastingand decision-making issues. In addition, to the extent that thefuture may not be an extension of the past, it is conceivable thatpast (accounting) events may not be very relevant.
Accounting is somewhat precise. Forecasting, by its verynature, is very imprecise. When the preparation of the budgetbecomes ‘‘accounting-driven,’’ those preparing it focus on non-existent precision and lose sight of the real benefits of the budgetand its impact on the bigger picture.
Accounting is conservative. It requires that the least favor-able interpretation of events be presented. Business forecastingneeds to be somewhat optimistic. Using a conservative salesforecast usually means that the budget will be finalized at thelower end of expectations. If the forecast is actually exceeded, asit is likely to be, the company will not be totally prepared to pro-duce the product or deliver the services. In short, conservatismin accounting is required. Conservatism in business decisionmaking can be very damaging.
Business is risky and filled with uncertainty. Accounting isrisk-averse.
Resolution
To eliminate these cultural clashes, accountants need to learnmore about the business—its markets, customers, competitivepressures, and operational issues—and all other business man-agers need to learn more about the financial aspects of business.This includes the language of accounting and finance, the finan-cial pressures with which the company must deal, and the fi-nancial strategies that may improve the company’s competitiveposition, operational effectiveness, and ultimate profitability.
10 Introduction
Some Additional Perspectives on the Planning Process
The planning process is a comprehensive management effortthat attempts to ensure that the company has considered all ofthe issues and challenges facing it. The management team willfocus on the company’s strengths and weaknesses as well as onthe resources necessary to properly grow the business comparedwith the resources available.
The financial team is a critical contributor to this process.The following are some of the issues that require managementfocus.
The Customers
Why do our customers buy our products and services? Why dowe deserve their money? These are critical questions that mustbe answered if we are to focus our energies and resources onthose efforts that will sustain growth. We need to expand ourdefinition of ‘‘the highest quality’’ and devote corporate cash andpeople to distinguishing our company from and staying ahead ofthe competition.
Do we really know our customers’ needs, present and future?Are we prepared to support them in their goal of succeeding intheir marketplace? Do they view us as a key strategic partner?After all, we are in business to help our customers make money.If we define our company’s strategic mission accordingly, ourcustomers’ success will be ours. What we do is only a means tothat end.
The Markets
Products and services are provided in numerous markets. Thesemay be defined by:
GeographyProduct applicationQuality and perception of qualityMeans of distributionSelling channel (direct versus distributor)
11Introduction
The process of thinking through the company’s future is anintegral part of budget development. It requires that the manage-ment team be in touch with trends and developments that willenhance or detract from the company’s marketplace position.Periodic ‘‘out of the box’’ reexamination of each of these issuesprovides considerable opportunity for market and profit im-provement.
Resources
People and money must be dedicated to the most profitable,fastest-growing segments of the business. These business seg-ments represent the future of the company and should be prop-erly supported. Are our strategies and practices designed to hangon to the more comfortable past rather than focusing on the fu-ture? Intelligent planning and management controls do not in-hibit creativity and aggressive risk taking. In fact, they ensure thatthe most important opportunities receive the resources that theyrequire if they are to succeed.
The Planning Process
The planning process involves the following elements:
1. Thinking through the future of the business2. Ensuring that members of the management team com-
municate with one another, so that plans and resourcesare consistent
3. Researching markets, competitors, and technologies toassure currency of knowledge
4. Deciding among the identified opportunities and pro-grams
5. Implementing those programs that contribute to thecompany’s strategic position and profitability
6. Developing a budget that documents the plan, each of thedecisions made, and each department’s contribution toachieving company goals
7. Developing intelligent management controls to ensurethat the company gets its money’s worth
12 Introduction
Properly focusing the planning process on the company’sstrengths and weaknesses will help the company to achieve itsstrategic and financial goals. If the company truly understandsits customers’ needs and focuses on helping them to achievetheir goals, its progress will continue.
When all of these factors have been put on the table, man-agement must decide what actions should be taken. The financialteam helps management to determine:
How much the programs will costThe forecast profitability benefits of the programsWhether these forecast achievements are considered ex-cellentHow much the company can afford
These questions are answered through the financial analysisof each proposal. The company will evaluate the plans using re-turn on investment analysis, which is described in Chapter 10 ofthis book. Once the decisions are made, they are documented inthe budget. The budget identifies what will be achieved, bywhom, and how much will be spent.
The financial team will then determine whether the budgetis guiding the company toward the achievement of its goals. Itwill do so through an analysis of the company’s ratios. Ratioanalysis is described in Chapter 6.
Accountants will then record actual events as they occureach month. As described in Chapter 9, they will then comparethe actual revenues and spending with what was budgeted. Thisis called variance analysis. This same chapter also describessome of the operating decisions that will be made in order toenhance performance and assure budget success.
Since the business environment is constantly changing, fi-nancial analysis is an ongoing process. Assumptions must be re-viewed frequently, and action plans must be developed inresponse to changes in these assumptions. Cash must be con-stantly monitored.
With this perspective on the issues involved, Chapter 1 be-gins the discussion of the financial statements.

Part 1
UNDERSTANDING FINANCIAL
INFORMATION

This Page Intentionally Left Blank
Chapter 1
The Balance Sheet
THE BALANCE SHEET IS A representation of the company’s fi-nancial health. It is produced as of a specific point in time, usu-ally the end of the fiscal (accounting) year or month. It lists theassets that the company owns and the liabilities that the com-pany owes to others; the difference between the two representsthe ownership position (stockholders’ equity).
More specifically, the balance sheet tells us about the com-pany’s:
Liquidity: The company’s ability to meet its current obliga-tions.
Financial health: The company’s ability to meet its obliga-tions over the long term; this concept is similar to liquidityexcept that it takes a long-term perspective. It also incor-porates strategic issues.
Financial strength refers to the company’s ability to:
Secure adequate resources to finance its futureMaintain and expand efficient operationsProperly support its marketing effortsUse technology to profitable advantageSuccessfully compete
The balance sheet also helps us to measure the company’s opera-ting performance. This includes the amount of profits and cashflow generated relative to:
15
16 Understanding Financial Information
Owners’ investment (stockholders’ equity)Total resources available (assets)Amount of business generated (revenue)
By analyzing the data in the balance sheet, we can evaluate thecompany’s asset management performance. This includes themanagement of:
Inventory, measured with an inventory turnover ratioCustomer credit, reflected by an accounts receivable mea-sure known as days sales outstanding or collection periodTotal asset turnover, which reflects capital intensity, de-gree of vertical integration, and management efficiency
Mathematical formulas called ratios are very valuable in the ana-lytical process. They should be used to compare the company’scurrent performance against:
Its standards of performance (budget)Its past history (trends)The performance of other companies in a similar business(benchmarking)
Look at the balance sheet of the Metropolitan ManufacturingCompany, shown in Exhibit 1-1, dated as of December 31, 2002.Notice that it also gives comparable figures for December 31,2001. Providing the information for the prior year is called a refer-ence point. This is essential for understanding and analyzing theinformation and should always be included. The third columngives the differences in the dollar amounts between the twoyears. This information summarizes cash flow changes that haveoccurred between December 31, 2001, and December 31, 2002.This very critical information is presented more explicitly in thereport called the sources and uses of funds statement or the state-ment of cash flows. This is described more fully in Chapter 3. (Thenumbers in parentheses in the fourth column refer to the linesin Exhibit 3-1, the Sources and Uses of Funds Statement.)
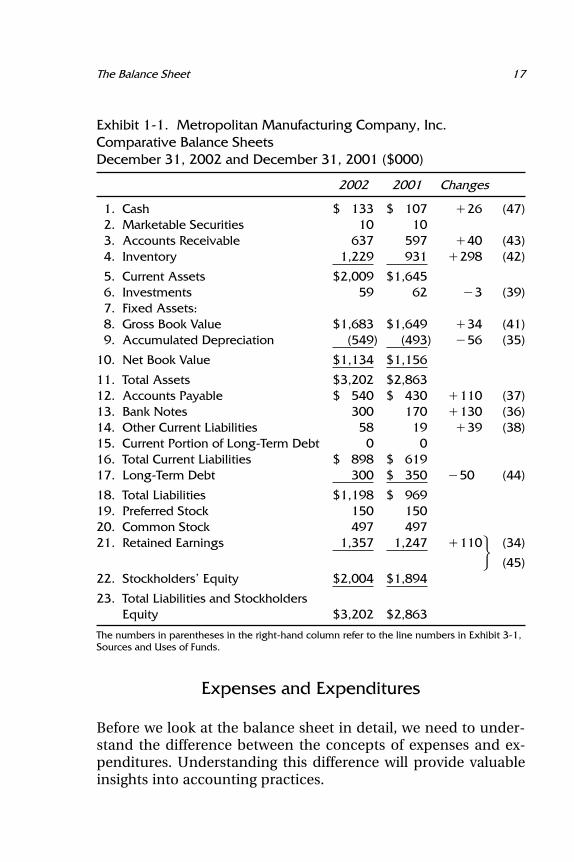
17The Balance Sheet
Exhibit 1-1. Metropolitan Manufacturing Company, Inc.Comparative Balance SheetsDecember 31, 2002 and December 31, 2001 ($000)
2002 2001 Changes
1. Cash $ 133 $ 107 �26 (47)2. Marketable Securities 10 103. Accounts Receivable 637 597 �40 (43)4. Inventory 1,229 931 �298 (42)
5. Current Assets $2,009 $1,6456. Investments 59 62 �3 (39)7. Fixed Assets:8. Gross Book Value $1,683 $1,649 �34 (41)9. Accumulated Depreciation (549) (493) �56 (35)
10. Net Book Value $1,134 $1,156
11. Total Assets $3,202 $2,86312. Accounts Payable $ 540 $ 430 �110 (37)13. Bank Notes 300 170 �130 (36)14. Other Current Liabilities 58 19 �39 (38)15. Current Portion of Long-Term Debt 0 016. Total Current Liabilities $ 898 $ 61917. Long-Term Debt 300 $ 350 �50 (44)
18. Total Liabilities $1,198 $ 96919. Preferred Stock 150 15020. Common Stock 497 49721. Retained Earnings 1,357 1,247 �110� (34)
(45)22. Stockholders’ Equity $2,004 $1,894
23. Total Liabilities and StockholdersEquity $3,202 $2,863
The numbers in parentheses in the right-hand column refer to the line numbers in Exhibit 3-1,Sources and Uses of Funds.
Expenses and Expenditures
Before we look at the balance sheet in detail, we need to under-stand the difference between the concepts of expenses and ex-penditures. Understanding this difference will provide valuableinsights into accounting practices.
18 Understanding Financial Information
An expenditure is the disbursement of cash or a commitmentto disburse cash—hence the phrase capital expenditure. An ex-pense is the recognition of the expenditure and its recording foraccounting purposes in the time period(s) that benefited from it(i.e., the period in which it helped the company achieve revenue).
The GAAP concept that governs this is called the matchingprinciple: Expenses should be matched to benefits, which meansrecorded in the period of time that benefited from the expendi-ture rather than the period of time in which the expenditure oc-curred.
The accounting concepts that reflect this principle includethe following:
DepreciationAmortizationAccrualsReservesPrepaid expenses
Suppose a company buys equipment (makes a capital expendi-ture) for $100,000. The company expects the equipment to last(provide benefit) for five years. This is called the equipment’sestimated useful life. Using the basic concept called straight-linedepreciation (to be discussed later in this chapter), the deprecia-tion expense recorded each year will be:
$100,0005
� $20,000
Each year there will be an expense of $20,000 on the company’sincome statement. Clearly during those five years, no such cashexpenditures were made.
11. Assets
The assets section of the balance sheet is a financial representa-tion of what the company owns. The items are presented at thelower of their purchase price or their market value at the time of
19The Balance Sheet
the financial statement (see the discussion of GAAP in Chapter4). Assets are listed in the order of their liquidity, or the ease withwhich they can be converted to cash.
1. Cash, $133,000
Cash is the ultimate measure of a organization’s short-termpurchasing power, its ability to pay its debts and expand andmodernize its operations. It represents immediately availablepurchasing power. This balance sheet category principally con-sists of funds in checking accounts in commercial banks. Thismoney may or may not earn interest for the company. Its pri-mary characteristic is that it is immediately liquid; it is availableto the firm now. This may also be called Cash and Cash Equiva-lents. Cash equivalents are securities with very short maturities,perhaps up to three months, that can earn some interest incomefor the company.
2. Marketable Securities, $10,000
This category includes the short-term investments that compa-nies make with cash that will not be needed within the next fewweeks or months. As a result of intelligent cash planning, thecompany has the opportunity to earn extra profit in the formof interest income from these securities. Some companies earnsizable returns on this money through careful cash managementand intelligent investment strategies.
The securities that can be placed in this category includecertificates of deposit (CDs), Treasury bills, and commercialpaper. All have very short maturities, usually 90 to 180 days. CDsare issued by commercial banks, Treasury bills are issued bythe U.S. government, and commercial paper is issued by verylarge, high-quality industrial corporations. Purchasing thesehigh-quality securities, which have little or no risk, gives thecompany the opportunity to earn a few percentage points on themoney it does not need immediately.
20 Understanding Financial Information
3. Accounts Receivable, $637,000
When a company sells products to customers, it may receive im-mediate payment. This may be done through a bank draft, acheck, a credit card, a letter of credit, or in the case of a super-market or retail store, cash. On the other hand, as part of theselling process, the customer may be given the opportunity topostpone paying for the products or services until a specified fu-ture date. This is referred to as giving the customer credit. Theaccounting term that describes the dollar amount of services pro-vided or products delivered that have not yet been paid for bythe customer is accounts receivable. This is the amount of moneyowed to the company for products and services that it has al-ready provided but for which payment has not yet been received.It is expected that this money will be received sometime within a30- to 60-day time period.
In order to have accounts receivable, the company needs tohave achieved revenue. Revenue is the amount of money that thecompany has earned by providing products and services to itscustomers. Sometimes cash is received before revenue is earned,as when a customer makes a down payment. Retail stores usuallyreceive their cash when they earn the revenue. However, mostcorporations receive their cash after they earn their revenue, re-sulting in accounts receivable.
4. Inventory, $1,229,000
This represents the financial investment that the company hasmade in the manufacture or production (or, in the case of a retailstore, the purchase) of products that will be sold to customers.For manufactured goods, this amount is divided in three catego-ries: finished goods, work in process, and raw materials.
Finished Goods. These are fully completed products readyfor shipment to customers. The amount shown on the balancesheet includes the cost of purchased raw materials and compo-nents used in the products, the labor that assembled the prod-ucts at each stage of their manufacture (called direct labor), andall of the support expenditures (called manufacturing overhead)
21The Balance Sheet
that helped to add value to the product. Products in this categorycontinue to be owned by the company, and thus to be assets ofthe company, until they are delivered to the customer’s premisesor the customer’s distribution network (vehicles, warehouse) andthe customer agrees to take responsibility for them (the customeraccepts delivery).
Work in Process. Inventory in this category has had somevalue added by the company—it is more than raw materials andcomponents—but it is not yet something that can be deliveredto the customer. If the item has been the subject of any activityby the production line, but is not yet ready for final customeracceptance, it is considered work in process.
Raw Materials. Raw materials are products or componentsthat have been received from vendors or suppliers to which thecompany has done nothing except receive them and place theminto storage for future use. Since the company has not yet putthe raw materials into production, no value has yet been added.The amount presented in this category may include the cost ofbringing the product from the vendor to the company’s ware-house, whether this freight cost is paid separately, itemized inthe vendor’s invoice, or just included in the purchase price.
5. Current Assets, $2,009,000
This is the sum of the asset classifications previously identified:cash, marketable securities, accounts receivable, and inventory,plus a few other, more minor categories. It represents the assetsowned by the company that are expected to become cash (liquidassets) within a one-year period.
Presentation of Current Assets
Accounts receivable is usually presented net of an amount calledallowance for bad debts. This is a statistically derived estimate ofthe portion of those accounts receivable that may not be col-lected. It is based on an analysis of the company’s past ex-perience in collecting funds. This estimate is made and the
22 Understanding Financial Information
possibility of uncollected funds recognized even though thecompany fully expects the balance of every individual account inits accounts receivable list to be collected. All of the amounts inthe accounts receivable balance were originally credit extendedto creditworthy customers who were expected to pay their billson time—otherwise credit would not have been extended. How-ever, it is possible that some of this money will not be collected.
Allowance for bad debts is usually in the range of 1 to 2 per-cent of accounts receivable. The amount is determined by thecompany’s internal accounting staff and is reviewed and revisedannually within the context of actual collections experience.
For Metropolitan Manufacturing Company, the calculationof net accounts receivable is as follows:
Accounts Receivable $647,000Allowance for Bad Debts (10,000)
Accounts Receivable (net) $637,000
Accounting for inventory also has some specific characteristics ofwhich the reader should be aware.
The figure given for inventory is the amount it cost the com-pany to buy the raw materials and components and to producethe product. The amounts presented are based on the account-ing principle lower of cost or market. If the economic value of theinventory improves because of selling price increases, because ofother market conditions, or because the cost of replacing it hasincreased, the inventory figure on the balance sheet does notchange. Inventory is presented at cost, which is lower than mar-ket value at that point in time. However, if the value of the inven-tory decreases because selling prices are soft or because theprospects for its sale have significantly diminished, then the bal-ance sheet must reflect this deteriorated value. In this case,where market value is below cost, the inventory amounts will bepresented at market.
The accounting process necessary to reflect this latter condi-tion is called a writedown. The company would be required towrite down the value of the inventory to reflect the reducedvalue.
23The Balance Sheet
6. Investments (and Intangible Assets), $59,000
There are a number of possible components of these two catego-ries. They include:
Ownership of other companiesPartial equity stakes in other companies, including jointventuresPatentsTrademarksCopyrightsGoodwill
This information is also presented at the lower of cost or market.If the market value of a patent increases by millions of dollarsabove what the company paid for the right to use it or develop it,this very positive business development will not be reflected onthe balance sheet. However, if the asset proves disappointing orif it proves to be without value, this must be reflected by a write-down or write-off. It is not the responsibility of accounting toreflect improved economic value of assets, regardless of the busi-ness certainty of that improvement.
7. Fixed Assets
Fixed assets are assets owned by the company and used in theoperation of its business that are expected to last more than oneyear. They are sometimes called tangible assets. They often repre-sent a substantial investment for the company. Included in thiscategory are:
Land: This land can be the site of an office, factory, or ware-house, or it may be vacant and available for future use.
Buildings: This includes any structures owned by thecompany, such as factories or other production facilities,offices, warehouses, distribution centers, and vehicleparking and repair facilities.
Machinery and equipment: This category includes all pro-duction machinery, office equipment, furniture and fix-
24 Understanding Financial Information
tures, computers, and any other tangible assets that supportthe operations of the company.
Vehicles: Trucks (tractors and trailers), company cars used bysalespeople or other managers, and rail cars owned by thecompany are included in this category.
In order to reduce (somewhat) the accounting burden, compa-nies are permitted to identify a threshold amount below whichan item will be recorded as an expense on the company’s incomestatement, even though the item is expected to provide benefitfor more than one year, is tangible, and therefore would other-wise be considered a fixed asset.
This threshold amount can be as much as several thousandsof dollars. Thus, if the company buys a single desk for $1,000, itmay be considered an expense and charged to the budget ac-cordingly. However, if the company buys twenty of these desks(and the accompanying chairs), the purchase will be recorded asa capital expenditure and the desks treated as a fixed asset on thebalance sheet.
8. Gross Book Value, $1,683,000
This records the original amount paid, at the time of purchase,for the tangible assets that the company currently owns, subjectto the lower of cost or market accounting rule. This amountnever reflects improved economic value, even if, for example, apiece of real estate was purchased thirty years previously and itsmarket value has greatly increased.
9. Accumulated Depreciation, ($549,000)
This is sometimes called the Reserve or Allowance for Deprecia-tion. It is the total amount of depreciation expense that the com-pany has recorded against the assets included in the gross bookvalue.
When tangible assets are purchased and recorded on thebalance sheet as fixed assets, their value must be allocated overthe course of their useful life in the form of a noncash expenseon the income statement called depreciation. When the asset is
25The Balance Sheet
purchased, its useful or functional life is estimated. Using one ofseveral accounting methodologies, the gross book value is thenapportioned over that time period, with the resultant annualamount being called depreciation expense. The accumulated de-preciation amount shown on the balance sheet tells us howmuch has been recorded so far. The concept of an expense beingnoncash is explored later in this chapter.
10. Net Book Value $1,134,000
This is the difference between the gross book value and accumu-lated depreciation amounts. It has little, if any, analytical signifi-cance.
11. Total Assets $3,202,000
This is the sum total of current assets, the net book value of fixedassets, investments, and any other assets the company may own.
Important Accounting ConceptsAffecting the Balance Sheet
Expense and Expenditure
These are distinctly different concepts. Understanding this willprovide valuable insights into accounting practices.
An expenditure is the disbursement of cash or a commitmentto disburse cash. Hence the phrase ‘‘capital expenditure.’’ An ex-pense recognizes the expenditure but records it for accountingpurposes in the time period(s) that benefited from it, i.e., helpthe company achieve revenue.
A basic example is a company that in May pays the rent cov-ering the month of June. The expenditure is in May but the ex-pense is in June because that was the period of time thatbenefited. The GAAP concept that governs this is the matchingprinciple. Expenses should be matched or recorded in the periodof time that benefited from the expenditure rather than when theexpenditure occurred.
26 Understanding Financial Information
The accounting concepts that are affected by this principleinclude:
DepreciationAmortizationAccrualReservePrepaid expense
Accounting for Fixed Assets
Income StatementBalance Sheet (annual expense)
Year 1Gross Book Value $100,000 Depreciation $20,000Accumulated Depreciation (20,000) Expense
Net Book Value $80,000
Year 2Gross Book Value $100,000 Depreciation $20,000Accumulated Depreciation (40,000) Expense
Net Book Value $60,000
In this case, the company makes a capital expenditure of$100,000. The gross book value on the balance sheet will be$100,000. This is a record of what the company paid for the assetwhen it was purchased. During the first year, the annual depreci-ation expense on the income statement will be $20,000.
The accumulated depreciation on the balance sheet is thetotal amount of depreciation expense included on the incomestatement from the time the fixed asset(s) were purchased. Thenet book value is the difference between the two.
Notice that the gross book value remains the same in Year 2.This amount may increase if significant enhancements are madeto the asset, or it may decrease if the asset’s value deteriorates,resulting in a writedown. Generally, however, this amount willremain the same throughout the entire life of the asset.
The accumulated depreciation in Year 2 is the sum total of
27The Balance Sheet
the depreciation expenses recorded in Years 1 and 2. It is cumula-tive.
In Year 5, and for as long after that as the asset is useful, itwill remain on the balance sheet as:
Gross Book Value $100,000Accumulated Depreciation (100,000)
Net Book Value 0
The asset no longer has any ‘‘book’’ value. It is said to be fullydepreciated. Its value to the business, however, may still be sub-stantial. When the asset is ultimately retired, its gross book value,accumulated depreciation, and net book value are removed fromthe balance sheet.
Depreciation Methods. The most common method of de-preciation is called straight-line. It basically involves dividing thegross book value by the number of years in the useful life of theasset. In this example, the annual depreciation expense will be:
$100,0005 years
� $20,000
There are three other methods that are often used. They are:
Double-declining-balanceSum-of-the-years’-digitsPer-unit calculation
Double-declining-balance. Notice that in straight-line de-preciation, depreciation expense for an asset with a 5-year life is20 percent times the gross book value. (If the depreciable lifewere different from 5 years, the calculation would change.) In thedouble-declining-balance method, the initial calculation is madein the same way (in this case, $100,000 � 5 years � $20,000, or20 percent of $100,000), but the percentage is doubled, in thiscase to 40 percent, and the resulting percentage is multiplied bythe net book value. The calculation of the depreciation expensebased upon a gross book value of $100,000 is as follows:
28 Understanding Financial Information
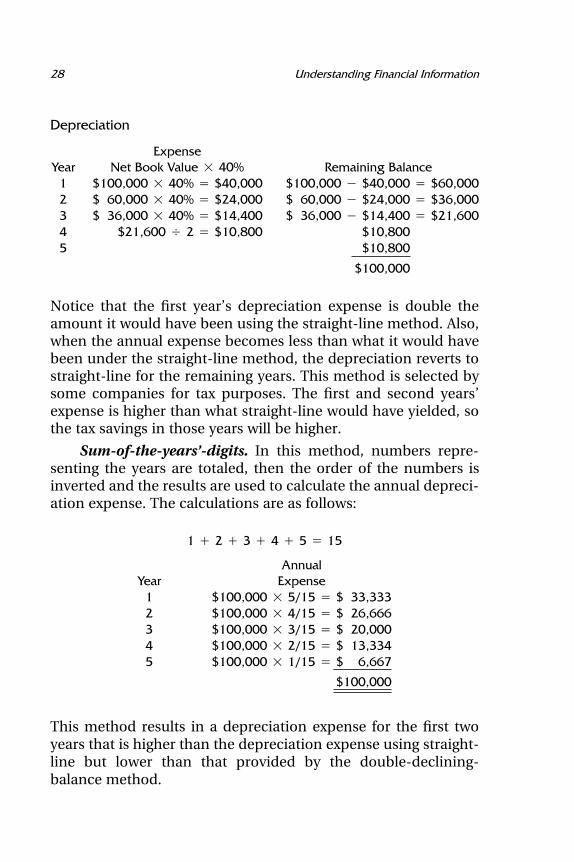
Depreciation
ExpenseYear Net Book Value � 40% Remaining Balance
1 $100,000 � 40% � $40,000 $100,000 � $40,000 � $60,0002 $ 60,000 � 40% � $24,000 $ 60,000 � $24,000 � $36,0003 $ 36,000 � 40% � $14,400 $ 36,000 � $14,400 � $21,6004 $21,600 � 2 � $10,800 $10,8005 $10,800
$100,000
Notice that the first year’s depreciation expense is double theamount it would have been using the straight-line method. Also,when the annual expense becomes less than what it would havebeen under the straight-line method, the depreciation reverts tostraight-line for the remaining years. This method is selected bysome companies for tax purposes. The first and second years’expense is higher than what straight-line would have yielded, sothe tax savings in those years will be higher.
Sum-of-the-years’-digits. In this method, numbers repre-senting the years are totaled, then the order of the numbers isinverted and the results are used to calculate the annual depreci-ation expense. The calculations are as follows:
1 � 2 � 3 � 4 � 5 � 15
AnnualYear Expense
1 $100,000 � 5/15 � $ 33,3332 $100,000 � 4/15 � $ 26,6663 $100,000 � 3/15 � $ 20,0004 $100,000 � 2/15 � $ 13,3345 $100,000 � 1/15 � $ 6,667
$100,000
This method results in a depreciation expense for the first twoyears that is higher than the depreciation expense using straight-line but lower than that provided by the double-declining-balance method.
29The Balance Sheet
Per-unit. The third depreciation method involves dividingthe cost of the fixed asset by the total number of units it is ex-pected to manufacture during its useful life. If a machine is ex-pected to produce 200,000 units of product over its useful life,the per-unit depreciation expense will be calculated as follows:
$100,000200,000 units
� $ 0.50 per unit
If production during the first year is 60,000 units, the annual ex-pense for that first year will be 60,000 � $ 0.50 � $30,000.
In most manufacturing standard cost systems, the deprecia-tion expense per unit is built into the manufacturing overheadrate or burden.
In all methods of calculating depreciation, accounting principlesare not compromised. To summarize:
Useful life determines the number of years.Consistency is required.The total of the depreciation expense is usually equal tothe original investment.
Accounting for Inventory: LIFO Versus FIFO
Accountants in a company that manufactures or sells productsare required to adopt a procedure to reflect the value of inven-tory. The two procedures that are most commonly used areknown as LIFO and FIFO, which stand for last-in, first-out andfirst-in, first-out.
You should understand that this is purely an accounting con-cept. It does not affect the physical management of the productin any way. An example can best illustrate this.
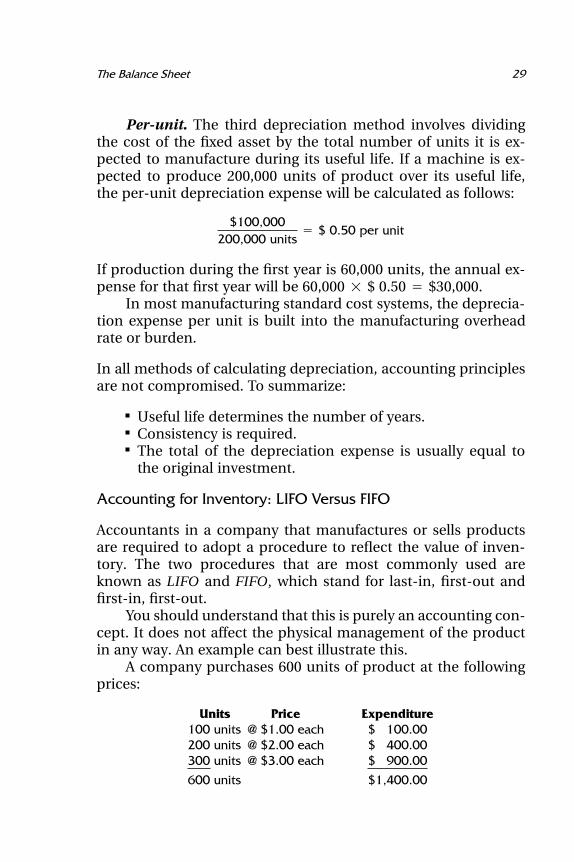
A company purchases 600 units of product at the followingprices:
Units Price Expenditure100 units @ $1.00 each $ 100.00200 units @ $2.00 each $ 400.00300 units @ $3.00 each $ 900.00
600 units $1,400.00
30 Understanding Financial Information
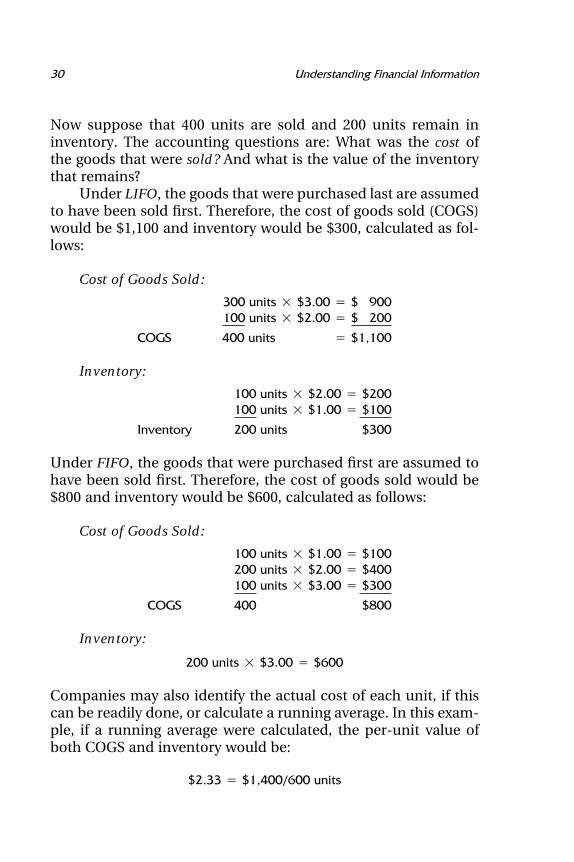
Now suppose that 400 units are sold and 200 units remain ininventory. The accounting questions are: What was the cost ofthe goods that were sold? And what is the value of the inventorythat remains?
Under LIFO, the goods that were purchased last are assumedto have been sold first. Therefore, the cost of goods sold (COGS)would be $1,100 and inventory would be $300, calculated as fol-lows:
Cost of Goods Sold:
300 units � $3.00 � $ 900100 units � $2.00 � $ 200
COGS 400 units � $1,100
Inventory:
100 units � $2.00 � $200100 units � $1.00 � $100
Inventory 200 units $300
Under FIFO, the goods that were purchased first are assumed tohave been sold first. Therefore, the cost of goods sold would be$800 and inventory would be $600, calculated as follows:
Cost of Goods Sold:
100 units � $1.00 � $100200 units � $2.00 � $400100 units � $3.00 � $300
COGS 400 $800
Inventory:
200 units � $3.00 � $600
Companies may also identify the actual cost of each unit, if thiscan be readily done, or calculate a running average. In this exam-ple, if a running average were calculated, the per-unit value ofboth COGS and inventory would be:
$2.33 � $1,400/600 units
31The Balance Sheet
This gives a value of $933 for cost of goods sold and $467 forinventory.
18. Liabilities
Liabilities are the amounts that the company owes to others forproducts and services it has purchased and amounts that it hasborrowed and therefore must repay.
Current liabilities include all monies that the company owesthat must be paid within one year from the date of the balancesheet. Long-term liabilities are those that are due more than oneyear from the date of the balance sheet. Included in current lia-bilities are accounts payable, short-term bank loans, and accruedexpenses (which we have included in other current liabilities).There are no issues of quality in these classifications, only time.The current liabilities and current assets classifications are time-referenced.
12. Accounts Payable, $540,000
Accounts payable are amounts owed to vendors or suppliers forproducts delivered and services provided for which payment hasnot yet been made. The company has purchased these productsand services on credit. The suppliers have agreed to postponethe receipt of their cash for a specified period as part of theirsales process. Normally this money must be paid within a 30- to60-day time period.
13. Bank Notes, $300,000
This amount has been borrowed from a commercial bank orsome other lender and has not yet been repaid. Because theamount must be repaid within one year, it is classified as a cur-rent liability.
14. Other Current Liabilities, $58,000
This category includes all short-term liabilities not included inother categories; they are primarily the result of accruals. At any
32 Understanding Financial Information
given point in time, the company owes salaries and wages to em-ployees, interest on loans to banks, taxes, and fees to outsidersfor professional services. For example, if the balance sheet datefalls on a Wednesday, employees who are paid at the end of eachweek have worked for three days as of the balance sheet date,and so the company owes them three days’ pay. To reflect theexistence of these debts, the company estimates their amounts asof the balance sheet date and records them in an account calledaccrued expenses. The total amount of these charges is recordedon the income statement as an expense, while the liability forthis expense is part of ‘‘other current liabilities.’’
15. Current Portion of Long-Term Debt
This category includes liabilities that had a maturity of more thanone year when the funds were originally borrowed, but that now,because of the passage of time, are due in less than one year.
16. Total Current Liabilities, $898,000
This is the total of all the funds owed to others that are due withinone year of the date of the balance sheet. It includes accountspayable, short-term loans, other current liabilities, and the cur-rent portion of long-term debt.
17. Long-Term Debt, $300,000
Long-term debt is amounts that were borrowed from commercialbanks or other financial institutions that are not due until sometime beyond one year. Their maturity ranges from just over oneyear to perhaps twenty or thirty years. This category may includea variety of long-term debt securities, including debentures,mortgage bonds, and convertible bonds. It may also include lia-bilities to tax authorities, including the IRS, states, and foreigngovernments.
22. Stockholders’ Equity, $2,004,000
Stockholders’ equity represents the cumulative amount ofmoney that all of the owners of the business have invested in the
33The Balance Sheet
business. They accomplished this in a number of ways. Some ofthem purchased preferred shares from the company. For Metro-politan Manufacturing Company, the cumulative amount thatthese investors put in is $150,000. Other investors (or perhaps thesame people) purchased common shares from the company. Thecumulative amount that they put in is $497,000. The third formof investment takes place when the owners of the company leavethe profits of the company in the business rather than takingthe money out of the company in the form of dividends. Thecumulative amount of this reinvestment is represented on thebalance sheet by the retained earnings of $1,357,000.
19. Preferred Stock, $150,000
Holders of this class of stock receive priority in the payment ofreturns on their investment, called dividends. Preferred stockcarries less risk than common stock (to be discussed next) be-cause the dividend payment is fixed and must be made beforeany profit is distributed (dividends are paid) to the holders ofcommon stock. Holders of preferred shares will also have priorityover common shareholders in getting their funds back if the firmis liquidated in a bankruptcy. The holders of preferred shares arenot considered owners of the business. Hence, they generally donot vote for the company’s board of directors. However, a corpo-rate charter might provide that they do get to vote if the preferreddividend is not paid for a certain period of time.
Although preferred shares are sometimes perceived as a‘‘debt’’ of the company without a due date, they are not actuallya debt of the company, but rather are part of equity. Because thepreferred dividend is not an obligation of the company, unlikethe interest paid on long-term debt, these securities are consid-ered to have a higher risk than long-term debt. Because of thishigher risk, the dividend yield on preferred stock will usually behigher than the interest rate that the company pays on long-termdebt.
20. Common Stock, $497,000
The owners of common stock are the owners of the business.This balance sheet line represents the total amount of money
34 Understanding Financial Information
that people have invested in the business since the companybegan. It includes only those stock purchases that were madedirectly from the company. The amount shown is the historicamount invested, not the current market value of the shares. Inmost cases, for each share owned, the holder is entitled to onevote for members of the board of directors. There are some com-panies that have different classes of common stock with differentnumbers of votes per share. This explains why some families orindividuals are able to control very large corporations eventhough they actually own a small minority of the shares.
21. Retained Earnings, $1,357,000
Whenever a company earns a profit for the year, the owners areentitled to remove those funds from the company for their per-sonal use. It is, after all, their money. Profits that are distributedto the stockholders are called dividends. However, if the businessis in need of funds to finance expansion or to take advantage ofother profitable opportunities, the owners may leave all or partof their profit in the company. The portion of total profits of thecompany that the owners have reinvested in the business duringits entire history is called retained earnings.
Collectively, preferred stock, common stock, and retainedearnings are known as stockholders’ equity, or the net worth ofthe business.
23. Total Liabilities and Stockholders’ Equity,$3,202,000
On most balance sheets, the accountants will total the liabilitiesand stockholders’ equity. Notice that this amount is equal to thetotal amount of the assets. While this is something of a formatconsideration, it does have some significance that we can reviewhere.
The balance sheet equation (Assets � Liabilities � Equity)is always maintained throughout the entire accounting process.This equation is never out of balance. If a company stopped re-cording transactions at any point in time and added up the num-
35The Balance Sheet
bers, assets minus liabilities would be equal to stockholders’equity.
The balance sheet equation also holds for any business orpersonal transaction. You cannot buy a house (asset) for $200,000unless the combination of the amount you can borrow (liabili-ties) and the amount you have in your own funds (equity) isequal to $200,000.
Assets � Liabilities � Equity : $200,000 � $150,000 � $50,000
If you can borrow only $150,000 and you don’t have $50,000 incash, you cannot buy the house for $200,000. This analogy is ex-actly applicable to business transactions and the corporate bal-ance sheet.
Types of Short-Term Debt
Revolving Credit. This is a short-term loan, usually from acommercial bank. While it is often ‘‘callable’’ by the bank at anytime, meaning that the bank can require its repayment, it oftenremains open for extended periods of time. It is usually securedby the company’s accounts receivable and inventory. Somebanks require that the company pay off this loan for at least onemonth during the year, probably during its most ‘‘cash rich’’month. Such a loan may also be called a working capital loan.
Zero-Balance Account. This type of short-term workingcapital loan has a very specific feature: Customer payments godirectly to the bank, which uses the funds to reduce the out-standing loan, which benefits the company by reducing its inter-est expense. When the company writes checks, the bank depositsenough funds in the company’s account to cover the payments,increasing the outstanding loan. Hence the checking account al-ways has a zero balance.
Factoring. This is a short-term working capital financingtechnique in which the company actually sells its accounts re-
36 Understanding Financial Information
ceivable to the bank or to a firm called a factoring company. Cus-tomers make payments directly to the bank, which actually ownsthe receivables. This is a fairly expensive form of financing, oftencosting 2 to 4 percent per month. Sometimes the sale of the ac-counts receivable is ‘‘without recourse.’’ This means that thebank assumes the credit risk of collecting the funds from thecompany’s customers.
Types of Long-Term Debt
There are several kinds of securities that a company can issue inorder to acquire debt financing for extended periods of time. Thematurity of these securities is always more than one year and canbe as much as thirty or forty years, or even longer. The intereston these securities is known as the coupon rate.
Debentures. Debentures are corporate bonds whose onlycollateral is the ‘‘full faith and credit’’ of the corporation. In abankruptcy, holders of these bonds would be general creditors.Debentures usually pay interest quarterly or semiannually.
Mortgage Bonds. Mortgage bonds are similar to debentures,except that the collateral on the loan is specific assets, usuallyreal estate. The holders of these securities are said to be ‘‘securedlenders’’ because of the specified collateral.
Subordinated Debentures. These are exactly the same asdebentures except that, in case of bankruptcy, holders of thesesecurities must wait until all holders of mortgage bonds and de-bentures have been financially satisfied. Hence their lien on thecompany’s assets is ‘‘subordinated.’’
Convertible Bonds. These bonds are the same as debenturesexcept that their holders have the option of turning them in tothe company in exchange for a specified number of shares ofcommon stock (converting them). Because there is an ‘‘upside’’growth opportunity for holders of this security (since if the priceof the company’s stock goes up, the shares into which the bondis convertible will increase in value), the coupon rate will usually
37The Balance Sheet
be much lower than the rate on a regular debenture. The com-mon stock price at which conversion is worthwhile is often calledthe strike price. It is much higher than the stock price at the timethe bonds are originally issued.
Zero-Coupon Bond. This is a bond with a long maturity,probably 10 to 20 years. It is very different from other bonds inthat the company pays no annual interest. Instead, it sells thebond at a significant discount from full value. Since the buyerreceives the full value of the bond at maturity, the buyer is effec-tively earning ‘‘interest’’ each year as the value of the bond in-creases. For example, a 10-year, $1,000 bond with a 9 percentinterest rate will be sold for $422.40, which is its present value, orthe amount that, if invested at 9 percent, would equal $1,000 in10 years. If the buyer holds this bond for 10 years, the companywill pay the buyer the full $1,000. The buyer benefits because, ineffect, the interest payments are also invested at the coupon rate,in this case 9 percent, and so the effective interest rate will beslightly higher than that on a regular debenture. Pension fundsthat don’t need the annual cash income find this attractive.(However, income taxes may have to be paid on the interest eachyear, even though no cash is received, so other investors mayfind this feature less attractive.) The seller enjoys the fact that noannual interest payments need be made, giving the firm manyyears to grow its business. Of course, the company must repaythe full $1,000 at maturity.
Chapter 2
The Income Statement
THE INCOME STATEMENT DESCRIBES THE performance of thecompany over a period of time, usually a month or a year. Oftencalled a statement of operations or a profit and loss statement(P&L), this document measures the company’s achievement(revenue) and also the resources (expenses) that were expendedin order to produce that achievement. The income statement issummarized as follows:
Revenue � Expenses � Profit
The difference between revenues achieved and expenses in-curred is called profit or net income.
The following paragraphs describe the details of the incomestatement. As a reference, we have provided a five-year history ofthe Metropolitan Manufacturing Company in Exhibit 2-1. This ispart of the same set of financials as the balance sheet in Chapter1. The numbers refer to the line numbers on the income state-ment.
24. Revenue, $4,160,000
This is the dollar amount of products and services that the com-pany provided to its customers during the year. This is oftencalled sales; in Great Britain, it is called turnover or income. Asale is achieved when the customer takes ownership of and/orresponsibility for the products.
38
39The Income Statement
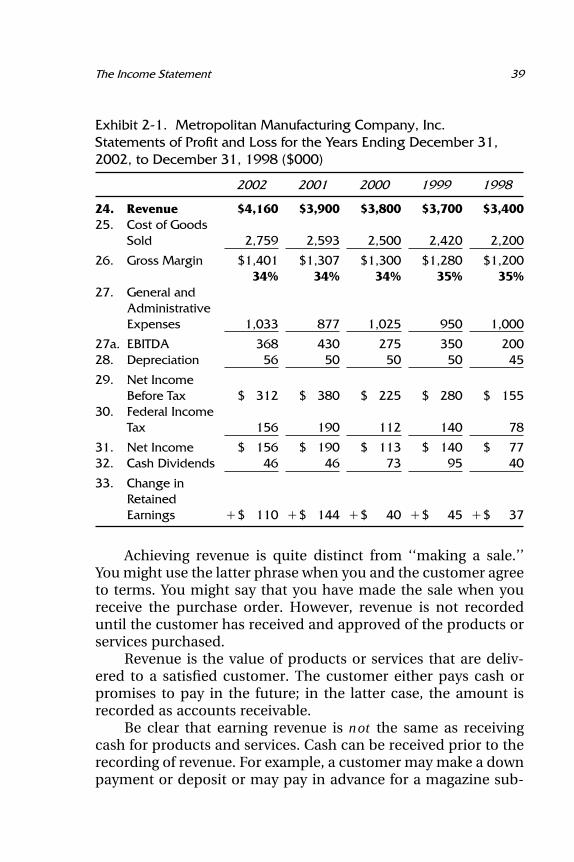
Exhibit 2-1. Metropolitan Manufacturing Company, Inc.Statements of Profit and Loss for the Years Ending December 31,2002, to December 31, 1998 ($000)
2002 2001 2000 1999 1998
24. $4,160 $3,900 $3,800 $3,700 $3,400Revenue25. Cost of Goods
Sold 2,759 2,593 2,500 2,420 2,200
26. $1,401 $1,307 $1,300 $1,280 $1,200Gross Margin34% 34% 34% 35% 35%
27. General andAdministrativeExpenses 1,033 877 1,025 950 1,000
27a. 368 430 275 350 200EBITDA28. 56 50 50 50 45Depreciation
29. Net IncomeBefore Tax $ 312 $ 380 $ 225 $ 280 $ 155
30. Federal IncomeTax 156 190 112 140 78
31. $ 156 $ 190 $ 113 $ 140 $ 77Net Income32. 46 46 73 95 40Cash Dividends
33. Change inRetainedEarnings �$ 110 �$ 144 �$ 40 �$ 45 �$ 37
Achieving revenue is quite distinct from ‘‘making a sale.’’You might use the latter phrase when you and the customer agreeto terms. You might say that you have made the sale when youreceive the purchase order. However, revenue is not recordeduntil the customer has received and approved of the products orservices purchased.
Revenue is the value of products or services that are deliv-ered to a satisfied customer. The customer either pays cash orpromises to pay in the future; in the latter case, the amount isrecorded as accounts receivable.
Be clear that earning revenue is not the same as receivingcash for products and services. Cash can be received prior to therecording of revenue. For example, a customer may make a downpayment or deposit or may pay in advance for a magazine sub-
40 Understanding Financial Information
scription. More commonly, however, businesses receive cashafter the revenue is earned, resulting in accounts receivable. Onetype of business in which the receipt of cash and the recordingof revenue might occur at the same time is the checkout counterat a supermarket.
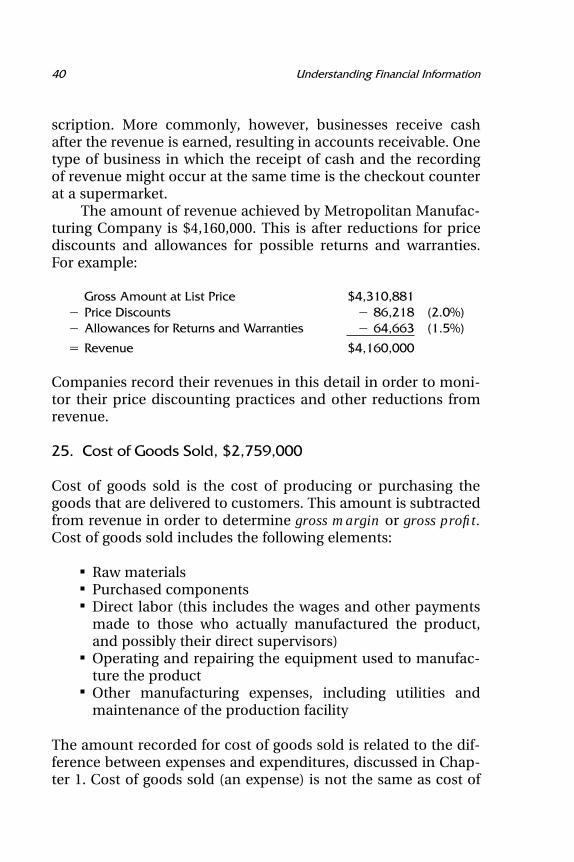
The amount of revenue achieved by Metropolitan Manufac-turing Company is $4,160,000. This is after reductions for pricediscounts and allowances for possible returns and warranties.For example:
Gross Amount at List Price $4,310,881� Price Discounts � 86,218 (2.0%)� Allowances for Returns and Warranties � 64,663 (1.5%)
� Revenue $4,160,000
Companies record their revenues in this detail in order to moni-tor their price discounting practices and other reductions fromrevenue.
25. Cost of Goods Sold, $2,759,000
Cost of goods sold is the cost of producing or purchasing thegoods that are delivered to customers. This amount is subtractedfrom revenue in order to determine gross margin or gross profit.Cost of goods sold includes the following elements:
Raw materialsPurchased componentsDirect labor (this includes the wages and other paymentsmade to those who actually manufactured the product,and possibly their direct supervisors)Operating and repairing the equipment used to manufac-ture the productOther manufacturing expenses, including utilities andmaintenance of the production facility
The amount recorded for cost of goods sold is related to the dif-ference between expenses and expenditures, discussed in Chap-ter 1. Cost of goods sold (an expense) is not the same as cost of
41The Income Statement
production (an expenditure) because of changes in inventory. Ifinventory levels decrease during the period, then the cost ofgoods sold will be higher than the cost of production by theamount of the change in inventory.
26. Gross Margin, $1,401,000
This measures the profitability achieved as a result of producingand selling products and services. It measures manufacturing ef-ficiency and the desirability of the company’s products in themarketplace. Gross margin percentage is another measure of thatperformance.
27. General and Administrative Expenses, $1,033,000
This amount represents the cost of operating the company itself.Included in this category are staff expenses (accounting, com-puter operations, senior management), selling expenses (salaries,travel), promotional expenses (advertising, trade shows) and re-search and development (technological research).
28. Depreciation Expense, $56,000
This is the portion of prior capital expenditures that has beenallocated to the current year and is recorded as an expense inthat year. It does not represent a cash expenditure.
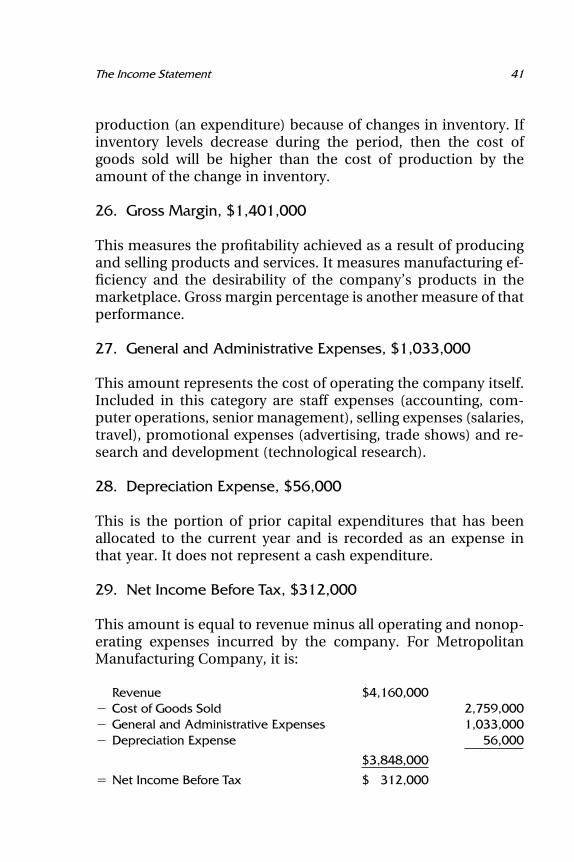
29. Net Income Before Tax, $312,000
This amount is equal to revenue minus all operating and nonop-erating expenses incurred by the company. For MetropolitanManufacturing Company, it is:
Revenue $4,160,000� Cost of Goods Sold 2,759,000� General and Administrative Expenses 1,033,000� Depreciation Expense 56,000
$3,848,000
� Net Income Before Tax $ 312,000
42 Understanding Financial Information
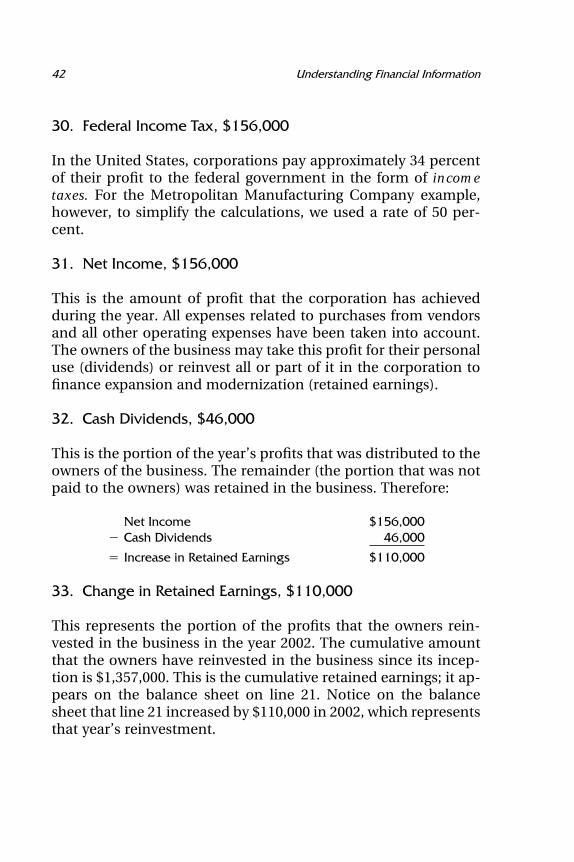
30. Federal Income Tax, $156,000
In the United States, corporations pay approximately 34 percentof their profit to the federal government in the form of incometaxes. For the Metropolitan Manufacturing Company example,however, to simplify the calculations, we used a rate of 50 per-cent.
31. Net Income, $156,000
This is the amount of profit that the corporation has achievedduring the year. All expenses related to purchases from vendorsand all other operating expenses have been taken into account.The owners of the business may take this profit for their personaluse (dividends) or reinvest all or part of it in the corporation tofinance expansion and modernization (retained earnings).
32. Cash Dividends, $46,000
This is the portion of the year’s profits that was distributed to theowners of the business. The remainder (the portion that was notpaid to the owners) was retained in the business. Therefore:
Net Income $156,000� Cash Dividends 46,000
� Increase in Retained Earnings $110,000
33. Change in Retained Earnings, $110,000
This represents the portion of the profits that the owners rein-vested in the business in the year 2002. The cumulative amountthat the owners have reinvested in the business since its incep-tion is $1,357,000. This is the cumulative retained earnings; it ap-pears on the balance sheet on line 21. Notice on the balancesheet that line 21 increased by $110,000 in 2002, which representsthat year’s reinvestment.
Chapter 3
The Statement ofCash Flows
THE THIRD CRITICAL FINANCIAL STATEMENT, along with thebalance sheet and the income statement, is called the statementof cash flows. In the past it was called the sources and uses offunds statement, which is a more accurate description of the in-formation it contains. It describes in summary form how thecompany generated the cash flows it needed (sources) to financeits various financial opportunities and responsibilities (uses) dur-ing the past year. The sources and uses of funds statement forMetropolitan Manufacturing Company is shown in Exhibit 3-1.As you go through it, notice that the line items appear on thebalance sheet in the column labeled ‘‘Changes.’’ In fact, thesources and uses of funds statement describes the changes in thebalance sheet between two successive years, in this case 2002and 2001. What we will do in this chapter is:
1. Present a sources and uses of funds statement.2. Discuss the meaning of each number.3. Describe how each number was developed, relating it
back to its source on the balance sheet.4. Restate the numbers in the statement of cash flows
format.
43
44 Understanding Financial Information
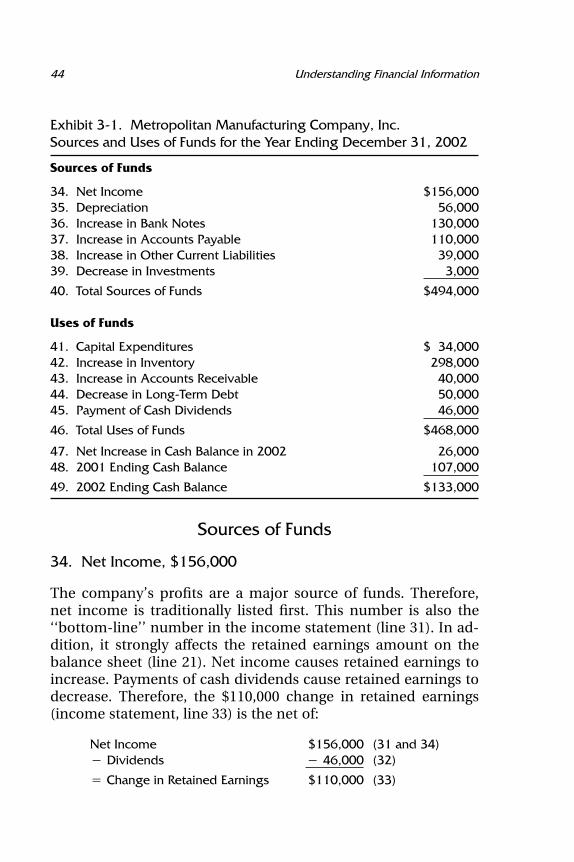
Exhibit 3-1. Metropolitan Manufacturing Company, Inc.Sources and Uses of Funds for the Year Ending December 31, 2002
Sources of Funds
34. Net Income $156,00035. Depreciation 56,00036. Increase in Bank Notes 130,00037. Increase in Accounts Payable 110,00038. Increase in Other Current Liabilities 39,00039. Decrease in Investments 3,000
40. Total Sources of Funds $494,000
Uses of Funds
41. Capital Expenditures $ 34,00042. Increase in Inventory 298,00043. Increase in Accounts Receivable 40,00044. Decrease in Long-Term Debt 50,00045. Payment of Cash Dividends 46,000
46. Total Uses of Funds $468,000
47. Net Increase in Cash Balance in 2002 26,00048. 2001 Ending Cash Balance 107,000
49. 2002 Ending Cash Balance $133,000
Sources of Funds
34. Net Income, $156,000
The company’s profits are a major source of funds. Therefore,net income is traditionally listed first. This number is also the‘‘bottom-line’’ number in the income statement (line 31). In ad-dition, it strongly affects the retained earnings amount on thebalance sheet (line 21). Net income causes retained earnings toincrease. Payments of cash dividends cause retained earnings todecrease. Therefore, the $110,000 change in retained earnings(income statement, line 33) is the net of:
Net Income $156,000 (31 and 34)� Dividends � 46,000 (32)
� Change in Retained Earnings $110,000 (33)
45The Statement of Cash Flows
35. Depreciation Expense, $56,000
In a more formal version of this statement, this item would bepreceded by the heading ‘‘Add Back Items Not Requiring the Dis-bursement of Cash.’’ The explanation of this is related to the dis-cussion of expenses and expenditures in Chapter 1. When netincome was calculated, an expense item was subtracted (lineitem 28) that did not require a cash expenditure during this pe-riod and will never require one in the future. The item is depreci-ation expense. The expenditures related to this expense—i.e.,capital expenditures—have already taken place.
The depreciation expense was subtracted on line 28 for tworeasons. First, generally accepted accounting principles (GAAP)require this. Second, depreciation expense is deductible as anexpense for corporate income tax purposes, and so including itprovides tax benefits. However, for the purposes of the sourcesand uses of funds statement, it is added back because in terms ofcash, it was not a ‘‘real’’ subtraction during this period.
36. Increase in Bank Notes, $130,000
During the year, Metropolitan Manufacturing Company raised$130,000 through additional short-term bank financing. This wasadded to its previously existing short-term bank debt of $170,000.Notice that Metropolitan added to its short-term debt while alsopaying off some long-term debt. By its very definition, the long-term amount that was paid off was not due. If it had been due, itwould have been classified as ‘‘current portion of long-termdebt,’’ which is a current liability. There could be several explana-tions for this financing strategy, but it probably was related tothe difference between short-term and long-term interest rates.Metropolitan probably borrowed short-term funds at a lower in-terest rate and used some of the funds to reduce its long-termloan, which had a higher interest rate.
37. Increase in Accounts Payable, $110,000
When a company buys products and services on credit, the pur-chases are being financed by the supplier, who provides the
46 Understanding Financial Information
product or service but does not receive payment for it at thattime. Overall, an increase in accounts payable shows that thecompany is making more purchases on credit, and so is beingfinanced by its suppliers to a greater degree. This is not an analy-sis of the strategy of buying on credit, which considers havingvendors finance purchases or extending payment periods tolengthy terms as a cheap source of cash. In an accounting reportlike this one, it is merely a statement that the amount of accountspayable is larger than in the past. An increase in accounts pay-able can result from the following actions:
Taking more time to pay billsBuying more products on creditPaying higher prices for credit purchases
38. Increase in Other Current Liabilities, $39,000
Any increase in a liability is a source of funds. Since this categoryis primarily made up of accruals and similar items, it naturallyincreases each year as the company gets larger.
39. Decrease in Investments, $3,000
The company sold some investments that were on the books for$3,000. These investments could have been bonds, long-termcertificates of deposit, or possibly the common stock of anothercompany.
40. Total Sources of Funds, $494,000
This is the sum of:
Net Income $156,000Depreciation 56,000Increase in Bank Notes 130,000Increase in Accounts Payable 110,000Increase in Other Current Liabilities 39,000Decrease in Investments 3,000
$494,000
47The Statement of Cash Flows
Uses of Funds
41. Capital Expenditures, $34,000
The company used $34,000 to add to its fixed assets. This is evi-denced by the increase in the gross book value of fixed assets.Since assets are presented at the lower of cost or market, the onlyexplanation for an increase in gross book value is the purchaseof fixed assets.
42. Increase in Inventory, $298,000
While inventory is sold and replenished many times during thecourse of the year (this is discussed further in Chapter 6), on anet basis, Metropolitan has invested an additional $298,000 ininventory. The increase in the level of inventory could be theresult of any combination of the following:
Replacement costs are greater than the cost of what wassold.Costs have remained the same, but the number of units ininventory has increased.The mix of products on hand has changed in the directionof more expensive products.
It cannot be determined simply from the inventory numberswhether inventory increased because sales forecasts were overlyoptimistic or sales were disappointing. We do not know if it wasraw materials, work in process, or finished goods inventory thatincreased. Analysis of these issues will be necessary. The onlything that is certain is that the financial investment in inventoryhas increased.
43. Increase in Accounts Receivable, $40,000
The company has ‘‘invested’’ this additional amount in financingits customers. This many be the result of any of the following:
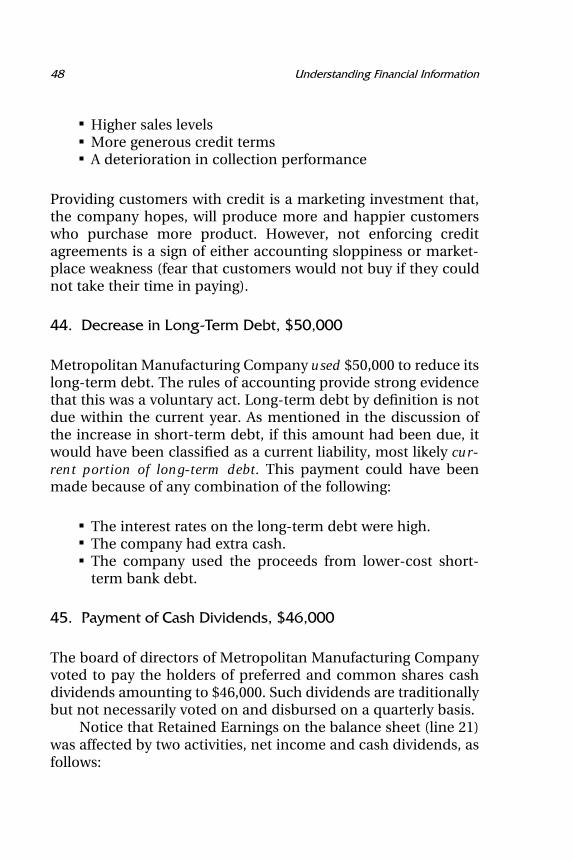
48 Understanding Financial Information
Higher sales levelsMore generous credit termsA deterioration in collection performance
Providing customers with credit is a marketing investment that,the company hopes, will produce more and happier customerswho purchase more product. However, not enforcing creditagreements is a sign of either accounting sloppiness or market-place weakness (fear that customers would not buy if they couldnot take their time in paying).
44. Decrease in Long-Term Debt, $50,000
Metropolitan Manufacturing Company used $50,000 to reduce itslong-term debt. The rules of accounting provide strong evidencethat this was a voluntary act. Long-term debt by definition is notdue within the current year. As mentioned in the discussion ofthe increase in short-term debt, if this amount had been due, itwould have been classified as a current liability, most likely cur-rent portion of long-term debt. This payment could have beenmade because of any combination of the following:
The interest rates on the long-term debt were high.The company had extra cash.The company used the proceeds from lower-cost short-term bank debt.
45. Payment of Cash Dividends, $46,000
The board of directors of Metropolitan Manufacturing Companyvoted to pay the holders of preferred and common shares cashdividends amounting to $46,000. Such dividends are traditionallybut not necessarily voted on and disbursed on a quarterly basis.
Notice that Retained Earnings on the balance sheet (line 21)was affected by two activities, net income and cash dividends, asfollows:
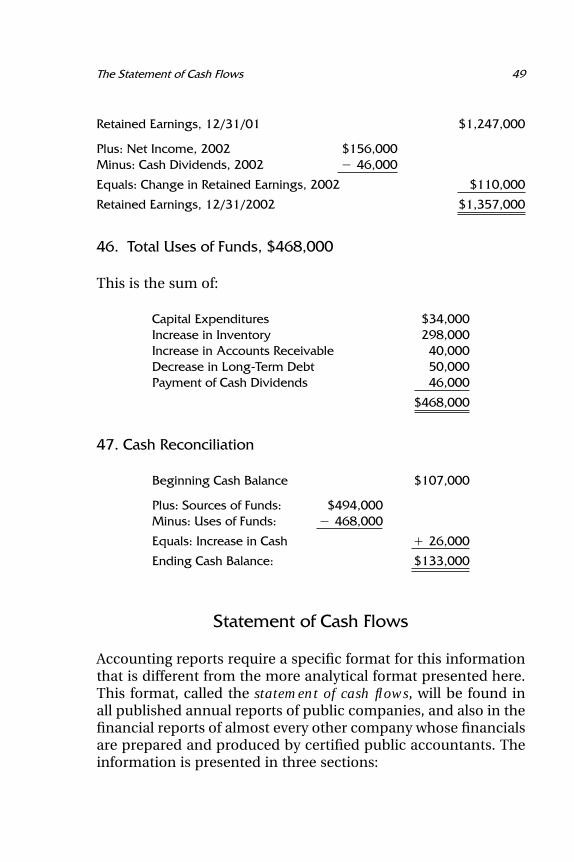
49The Statement of Cash Flows
Retained Earnings, 12/31/01 $1,247,000
Plus: Net Income, 2002 $156,000Minus: Cash Dividends, 2002 � 46,000
Equals: Change in Retained Earnings, 2002 $110,000
Retained Earnings, 12/31/2002 $1,357,000
46. Total Uses of Funds, $468,000
This is the sum of:
Capital Expenditures $34,000Increase in Inventory 298,000Increase in Accounts Receivable 40,000Decrease in Long-Term Debt 50,000Payment of Cash Dividends 46,000
$468,000
47. Cash Reconciliation
Beginning Cash Balance $107,000
Plus: Sources of Funds: $494,000Minus: Uses of Funds: � 468,000
Equals: Increase in Cash � 26,000
Ending Cash Balance: $133,000
Statement of Cash Flows
Accounting reports require a specific format for this informationthat is different from the more analytical format presented here.This format, called the statement of cash flows, will be found inall published annual reports of public companies, and also in thefinancial reports of almost every other company whose financialsare prepared and produced by certified public accountants. Theinformation is presented in three sections:
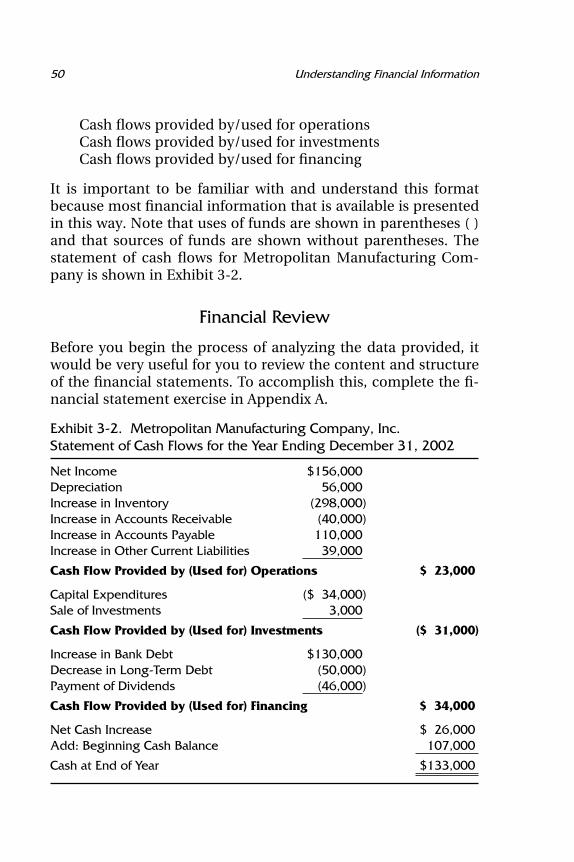
50 Understanding Financial Information
Cash flows provided by/used for operationsCash flows provided by/used for investmentsCash flows provided by/used for financing
It is important to be familiar with and understand this formatbecause most financial information that is available is presentedin this way. Note that uses of funds are shown in parentheses ( )and that sources of funds are shown without parentheses. Thestatement of cash flows for Metropolitan Manufacturing Com-pany is shown in Exhibit 3-2.
Financial Review
Before you begin the process of analyzing the data provided, itwould be very useful for you to review the content and structureof the financial statements. To accomplish this, complete the fi-nancial statement exercise in Appendix A.
Exhibit 3-2. Metropolitan Manufacturing Company, Inc.Statement of Cash Flows for the Year Ending December 31, 2002
Net Income $156,000Depreciation 56,000Increase in Inventory (298,000)Increase in Accounts Receivable (40,000)Increase in Accounts Payable 110,000Increase in Other Current Liabilities 39,000
Cash Flow Provided by (Used for) Operations $ 23,000
Capital Expenditures ($ 34,000)Sale of Investments 3,000
Cash Flow Provided by (Used for) Investments ($ 31,000)
Increase in Bank Debt $130,000Decrease in Long-Term Debt (50,000)Payment of Dividends (46,000)
Cash Flow Provided by (Used for) Financing $ 34,000
Net Cash Increase $ 26,000Add: Beginning Cash Balance 107,000
Cash at End of Year $133,000
Chapter 4
Generally AcceptedAccounting Principles:
A Review
THE ROLE OF THE FINANCIAL Accounting Standards Board(FASB) was briefly described in the introduction. This is a re-search organization, made up primarily of accountants. TheFASB, along with the entire accounting profession, has, overtime, developed a series of rules called generally accepted ac-counting principles (GAAP). In addition, the FASB publishes whatare called FASB Bulletins. These are a series of more than onehundred publications that describe what corporate reportingmethodologies should be. Most of these methodologies havebeen adopted and are now incorporated into accounting prac-tice. A broad analogy is that the GAAP rules are the basic consti-tution and the bulletins are proposed amendments. Here aresome of the GAAP rules.
The Fiscal Period
All reporting is done for predetermined periods of time. Reportsmay be issued for months or quarters and certain reports areissued annually. Accounting fiscal periods usually coincide withcalendar periods, although not necessarily with the calendar
51
52 Understanding Financial Information
year. For example, a company’s fiscal year may be July 1 to June30 or February 1 to January 31.
The Going Concern Concept
When accountants are keeping the books and preparing the fi-nancial statements, they presume that the company will con-tinue to be in existence for the foreseeable future. If there isserious doubt about this, or if the company’s ceasing operationsis a certainty, the financial statements (essentially the balancesheet) will be presented at estimated liquidation value.
Historical Monetary Unit
Accounting is the recording of past business events in dollars.Financial statements, and in fact all financial accounting, reportonly in dollars. While units of inventory, market share, and em-ployee efficiency are critical business issues, reporting on themis not within the realm of financial accounting responsibility.
Financial statements depicting past years are presented asthey occurred. The selling prices of the products and the value ofassets may very well be different today, but reports of past peri-ods are not adjusted.
Conservatism
The principle of conservatism requires that ‘‘bad news’’ be rec-ognized when the condition becomes possible and the amountcan be estimated, whereas ‘‘good news’’ is recognized only whenthe event (transaction) has actually occurred.
One example of this is the allowance for bad debts on thebalance sheet, which is recorded before the losses are actuallyincurred. Another example is reserves for inventory writedowns,which are recorded before the dated or out of style products areactually put up for sale at distress prices. Revenue, however, isnot recorded, no matter how certain it is from a business point
53Generally Accepted Accounting Principles: A Review
of view, until the product is actually delivered or the service isactually provided. Payment in advance, while assuring the cer-tainty of the sale in a business sense, does not change the ac-counting rule. Revenue is recorded only when it is earned.
Quantifiable Items or Transactions
The value of the company’s workforce and the knowledge theworkers possess may in a business sense be the company’s criti-cal competitive advantage. However, because that value cannotbe quantified and expressed in dollars, accounting does not rec-ognize it as an asset. The value of trademarks and franchisenames is also generally not included. Coke, Windows, and Disneyare certainly franchise brand names with worldwide recognition.While the business value of a franchise name can be almost infi-nite if it is maintained, franchise names are not assets on thebalance sheet because that value cannot be quantified.
Consistency
Accountants make many decisions when they are preparing thecompany’s financial statements. These include but are not lim-ited to the choice of depreciation method for fixed assets andthe choice of LIFO or FIFO accounting for inventory. Once thesedecisions have been made, however, later successive financialstatements must employ the same methodology. When a majorchange is made in accounting methodology, the accountantsmust highlight that change and redo past financial statements(the reference points) to reflect that change. Only then can com-parative analysis and trends be valid.
Full Disclosure
When a major change in methodology occurs, accountants musttake steps to be certain that readers of the financial statement
54 Understanding Financial Information
are fully aware of that change and how it affected the financialresults.
Materiality
An event that is material, or significant, is one that may affect thejudgment, analysis, or perception of the reader of the informa-tion. Events that are perceived as material must be disclosed sep-arately and highlighted accordingly. This is a relative concept.Something that is significant in a company with annual revenuesof $20 million might be largely irrelevant in a multibillion-dollarenterprise.
Chapter 5
The Annual Report andOther Sources of Incredibly
Valuable Information
EVERY ANALYST AND BUSINESS MANAGER should be inti-mately acquainted with the information in the public domainthat they can access and use for a variety of purposes. Sourcescited here will include:
The annual reportThe 10K report to the Securities and Exchange Commis-sionThe Public Register, MorningstarThe Wall Street JournalForbes and Fortune magazines and their Web sites
There is an enormous amount of valuable information availablethat everyone should be aware of. Much of it is free.
The Annual Report
The annual report should be read for the many valuable insightsit provides:
55
56 Understanding Financial Information
1. It is a wonderful review of the accounting process andthe concept of generally accepted accounting principles(GAAP).
2. There is much that you can learn about your own com-pany from its annual report. This includes how it per-ceives itself and how it presents itself to the rest of theworld.
3. The information contained in your competitors’ annualreports provides valuable insights into their financial con-dition, performance, and strategies.
Background
The company used as the primary subject of this discussion isDuPont Inc, based in Wilmington, Delaware. This company wasfounded in the United States in 1802. Its European predecessorcompany is even older. Other companies whose annual reportsare referred to in this discussion are the Walt Disney Companyand Merck. Each of these companies must prepare an annualreport and send a copy to each shareholder because its sharesare registered with the Securities and Exchange Commission andare publicly traded. Not all companies are subject to SEC regula-tion; only those whose shares are registered and publicly tradedare subject to them. The size of the company is not an issue here;some very large (multibillion-dollar) companies are private, andsome very small companies have publicly traded shares.
The annual report is a product of many regulatory require-ments, serves as a public relations vehicle, and reflects strongtradition. Many companies include information in their annualreport that is not specifically required. However, because thatinformation has historically been presented every year, it be-comes expected, and omitting it would arouse questions.
Dupont used to be called DuPont Chemical Company. Thecover of its 1998 report provides an announcement of a very stra-tegic repositioning:
DuPont is a science company. We bring science to the mar-ketplace in ways that benefit people and generate value forour shareholders.
57The Annual Report and Other Sources of Incredibly Valuable Information
This is an announcement to:
1. The public. Science has a positive image; chemicals donot.
2. Its employees. DuPont has always been in the forefront asa ‘‘knowledge’’ company. This emphasizes that orienta-tion.
3. Security analysts. Science companies are much more at-tractive to investors than chemical companies. DuPonthas been successfully changing its mix of products. Itsstock will perform better if security analysts and investorsknow of and believe in this repositioning strategy. Sciencecompanies are known for higher margins and highergrowth. The analysts will assume that DuPont can sup-port a higher price/earnings ratio if it is perceived as ascience company.
The inside cover of the annual report provides a highlights sec-tion. It includes summary financial information from the incomestatement and balance sheet along with stock market data—earnings per share and stock prices. DuPont spends over $1 bil-lion a year for research and development and averages more than$5 billion a year in capital expenditures and acquisitions of othercompanies. The company is (and wants us to know that it is)dedicated to knowledge and is a modern and efficient business.
CEO’s Letter to Shareholders
The chief executive officer is required to write a letter to share-holders. This letter includes a description and analysis of all busi-ness events of the past year that have had a significant (readmaterial) impact on the performance and condition of the com-pany. It also includes considerable commentary on how thecompany sees its future.
This letter is reviewed as part of the audit process. It mustpresent all issues in an even-handed manner. Negative as well aspositive events must be presented in a logical, cohesive way sothat the reader will learn useful information. Bad news is oftenpresented early in this letter so that the positive corrective ac-
58 Understanding Financial Information
tions that are already in process can be described. The companywants to convey the idea that management is on top of thingsand knows what has to be done. Management’s credibility is atstake.
In recent years, DuPont has made a major divestiture, ofConoco Oil Company, for which it received more than $4 billionin cash. It has also invested heavily in pharmaceutical busi-nesses. This supports its strategic repositioning away from re-sources and commodities and toward the sciences. Its businessesnow include materials, chemicals, and biological products. Thecompany’s history of innovation includes the invention of nylon.Management hopes that this tradition of innovation will con-tinue.
This letter was written by a team whose profession is de-scribed as ‘‘financial public relations.’’ This internal team, sup-ported by outside consultants, is responsible for all phases ofDuPont’s relationship with its investors and others who are inter-ested in its financial performance; their responsibilities includethe annual report presentation, shareholders’ meetings, commu-nication with security analysts, and general communications.The letter is audited by the company’s outside CPA firm to assureits compliance with GAAP, its accuracy, and its fairness.
Public Relations
Large companies like DuPont have a multitude of interlockingconstituencies. The stockholders, some of whom are often em-ployees, are the voters who elect the board of directors, whichin turn appoints the officials responsible for regulatory issues,including taxes, corporate governance, relationships with theFood and Drug Administration (FDA), and environmental con-cerns. The annual report is also a presentation to the company’scustomers, some of whom may be stockholders. DuPont wantsto influence the way it is viewed by the world. To accomplishthis, it devotes more than ten pages to a description of each of itsbusinesses. The photographs included are intended to conveythe idea that the employees shown are ‘‘just people,’’ buildingshareholder value by helping ‘‘other people.’’ The choice of pho-tographs (and the decision to include them at all) is motivated
59The Annual Report and Other Sources of Incredibly Valuable Information
by public relations considerations and supports the image thecompany is trying to present.
The CEO’s letter in the 1999 annual report of the Walt DisneyCompany has some interesting features. It is addressed to ‘‘Dis-ney Owners and Fellow Cast Members.’’ Employees of all Disneytheme parks are known as cast members. This letter indicatesthat the company holds those cast members in very high esteem.It presents, in a very direct manner, some very pointed themes.
1. Revitalizing underperforming areas (home video and con-sumer products). Right up front, the letter describes anissue in cliche terms and then identifies the focus of thecomment. Disney is focusing on some issues to addressand wants us to know that it knows that these issues needto be addressed.
2. Achieving greater profitability from existing assets (con-trolling costs). The letter describes the need for greaterefficiency and indicates that the company need not re-main in all its current businesses forever. The company’sstrategic sourcing program means more pricing and ser-vice cooperation from vendors who seek to continue inthat capacity.
3. Capital efficiency initiatives to drive long-term growth(how best to invest). Disney has included outside partnersin many of its ventures and to some extent is becoming atheme park management company. This provides morefocus on and cash from its core competencies.
4. Continued product development (being Disney). Disney isan entertainment company that is quite successful in itscross-branding strategy. Its parks, cruises, movies, TV andcable, and consumer products mostly carry the Disneybrand and cross-sell one another.
Management Discussion and Analysis
This section of the annual report provides an extensive, some-what detailed review of the past year. In paragraph form, thecompany discusses its financial results in considerable detail.
60 Understanding Financial Information
DuPont presents considerable information about the results ofeach of its business units. This is referred to as segment reporting.
Many years ago, when companies diversified into somewhatunrelated businesses, it became difficult for analysts to bench-mark these companies against their competitors because theirbusiness identity was difficult to determine. The result was a re-quirement that a company include in its annual report financialinformation for each of its business segments. The latest ac-counting document that specifically requires this information iscalled Statement of Financial Accounting Standards (SFAS) No.131. It is entitled ‘‘Disclosures About Segments of an Enterpriseand Related Information.’’ The resistance on the part of compa-nies to providing this information stems from the companies’desire to avoid providing competitors with valuable information.While segment reporting provides only summary information, itis competitively valuable. DuPont’s segments are:
Agriculture and nutritionNylon enterprisePerformance coatings and polymersPharmaceuticalsPigments and chemicalsPolyester enterpriseSpecialty fibers
DuPont provides revenue and operating income figures for eachsegment and discusses the outlook for the future for each divi-sion. In addition, information is available that considers theassets dedicated to each segment and gives some measure of thesegments’ technology investment. In the pharmaceutical area,DuPont gives us its assessment of the probable success of eachof the company’s research efforts that is in one of the variousphases of clinical trials. It would be interesting to get an assess-ment of the record of success in clinical trials of DuPont’s phar-maceutical competitors. DuPont also reveals that the risk-adjusted hurdle rate the company uses to evaluate capital expen-ditures is 15 percent. The significance of this is discussed inChapter 10 of this book.
For the company as a whole and for each segment, the an-
61The Annual Report and Other Sources of Incredibly Valuable Information
nual report provides a considerable amount of informationabout the company’s expectations for the future. This part of thereport is called an outlook. Management must be very carefulabout this presentation. It might cause existing and potential in-vestors to make decisions about their investments in the com-pany that may have an undesirable outcome. If this discussion ishandled correctly, the company cannot be blamed for this, be-cause it is not giving advice; it is merely presenting manage-ment’s assessment of the future. It provides disclaimers for thisoutlook and carefully states that the company cannot be heldresponsible for the outlook’s accuracy.
Disney’s annual report makes a very clear distinction be-tween management’s outlook for the future and outright predic-tion and advice. It makes the following statement:
The Private Securities Reform Act of 1995 (the Act) providesa safe harbor for forward-looking statements made by or onbehalf of our company. The company and its representativesmay from time to time make written or oral statements thatare ‘‘forward-looking.’’ . . . Management believes that allstatements that express expectations and projections withrespect to future matters, including . . . are made on the basisof management’s views and assumptions, as of the time thestatements were made, regarding future events and businessperformance. There can be no assurance, however, thatmanagement’s expectations will necessarily come to pass.
This is very often referred to as ‘‘safe harbor.’’ Management istrying to give the readers of the annual report its view of thecompany’s future. It is very even-handed in discussing the com-pany’s weaknesses as well as its strengths. Management is rightlyprotected from litigation over these views; if it were not, it couldnot afford to take the risk of presenting its assessment. The an-nual report would become exclusively a compliance documentthat would contain much less valuable information and wouldprovide no sense of the company’s future. Imagine the politicaland legal issues that would arise if the company had to publishits budget. The lawsuits would be unwieldy if the company didn’tmake its numbers. They might even be worse if actual perform-ance exceeded budgeted projections. Therefore, management
62 Understanding Financial Information
simply discusses the company’s future in general terms and isprotected from litigation when it does so. No forecast numbersare provided, and rightly so. Only strategies and issues are in-cluded in the discussion.
With this in mind, consider using your competitors’ annualreports to learn about their strategies and issues.
Report of Independent Accountants
This is a letter written by the company’s outside accounting firm.It is addressed to the stockholders of the company, to whom theaccounting firm reports, and sometimes also to the board of di-rectors. When the company sends out the notice of the annualmeeting, it will include a proxy statement that identifies themajor issues that will be decided by shareholder vote at the an-nual meeting. If a shareholder does not attend the meeting, theshareholder’s vote is not sacrificed. Rather, the shareholder mayvote by ‘‘proxy.’’ (This effectively means that the shareholdermay vote by mail.) One of the questions on the proxy statementis whether the stockholders approve (or not) of the board of di-rectors’ recommendation to renew the contract of the outsideCPA firm or to appoint a different CPA firm. The vote almost al-ways confirms the board’s recommendation. No alternative CPAfirm is presented. However, in circumstances where there havebeen extreme problems with the audit process or with account-ing integrity, the stockholders, in this somewhat democraticprocess, do have the ability to discontinue the CPA firm’s ser-vices.
The Audit Process. The company’s internal accounting staffis responsible for ‘‘keeping the books’’ and producing the finan-cial statements. Larger companies have an organization calledinternal audit that is separate from the accounting staff and, tosome degree, reviews the accounting staff’s work. The 1999 an-nual report of Merck describes the role of the internal auditorsvery well:
To assure that financial information is reliable and assets aresafeguarded, management maintains an effective system of
63The Annual Report and Other Sources of Incredibly Valuable Information
internal controls and procedures . . . an organization thatprovides appropriate division of responsibility, and commu-nications aimed at assuring that Company policies and pro-cedures are understood throughout the organization. . . . Astaff of internal auditors regularly monitors the adequacyand application of internal controls on a worldwide basis.(p. 56)
While these internal auditors are employees of Merck, they func-tion as surrogates for the outside CPA firm and support the exter-nal auditing efforts. Merck’s outside CPA firm is Arthur Andersen,LLP. DuPont and Disney use PricewaterhouseCoopers, LLP.These are both multinational CPA firms with offices in most partsof the world and thousands of partners.
Auditors ensure that transactions were recorded correctly.They verify the accuracy of the financial statements and themany estimates that were made by management. All publiclytraded companies in the United States are required to have theirfinancial statements audited. Most large private companies havetheir financial statements audited, as well. This process is be-coming global, as it facilitates international transactions and ven-tures.
The Letter. The CPA firm writes a letter to the stockholders.Most companies’ letters are the same, but the letter reveals somevery interesting information about the accounting process. It isworthwhile to cite Merck’s 1999 letter:
We have audited the accompanying consolidated balancesheet of Merck & Co . . . and related consolidated statementsof income, retained earnings . . . and cash flows for each ofthe three years. . . . These financial statements are the re-sponsibility of the Company’s management. Our responsibil-ity is to express an opinion on these financial statementsbased upon our audit.
We conducted our audit in accordance with auditingstandards generally accepted in the United States. Thosestandards require that we plan and perform the audit to ob-tain reasonable assurance about whether the financial state-ments are free of material misstatement. An audit includes
64 Understanding Financial Information
examining, on a test basis, evidence supporting the amountsand disclosures in the financial statements. An audit also in-cludes assessing the accounting principles used and signifi-cant estimates made by management
This letter has some very interesting features that provide in-sights into the accounting and audit processes. The first sentencemakes it very clear what role Arthur Andersen played: It audited.The next statement confirms that Merck is responsible for thenumbers. Arthur Andersen expresses an opinion on the financialstatements. This is a very simple term that has been the subjectof an incredible amount of controversy over the years. The letterdoes not refer to a warranty or fact. That is why this letter isoften called ‘‘the opinion letter.’’ Arthur Andersen uses the termassurance later in the letter, just to reinforce its role.
Notice that Arthur Andersen examined the numbers ‘‘on atest basis.’’ The auditing firm does not verify every item in thebooks. Instead, it uses samples: it selects a certain fraction of thecompany’s customers to confirm accounts receivable, selects acertain fraction of vendors to confirm payables, and uses similarmeasures to confirm payroll, inventory, and all other significant(read material) items. The burden is on Merck to prove thatassets are listed at the lower of cost or market and that all otheraccounting principles have been adhered to.
The last statement in the letter confirms that the financialsreflect estimates. Depreciation expense is based upon the esti-mated number of years that the machinery will last. Reserve forbad debts is an estimate of the portion of the accounts receivablethat will not be collected. The pension fund calculation is basedupon projections of how much employees will have earned whenthey retire and how many employees will be eligible. These esti-mates are based on the best available information, but they arenonetheless estimates.
After all of the accounting and auditing work has been done,the CPA firm will provide one of three responses. An unqualifiedopinion really means an opinion without qualification or reserva-tion. It indicates that the company being audited has done a verygood job in keeping its books and preparing its financial state-ments in accordance with generally accepted accounting princi-ples.
65The Annual Report and Other Sources of Incredibly Valuable Information
A qualified opinion means that everything is fine, with oneexception. The company and the CPA are generally in agreement,but they have ‘‘agreed to disagree’’ on one aspect of the presen-tation. This is usually an interpretation of a GAAP issue or theaccounting for a single business event, such as the purchase orsale of a business. The letter will describe the auditors’ positionon the issue in question. If the client company is in serious fi-nancial trouble, to the point that its continuance as an ongoingbusiness is in question, the audit letter will also discuss this issue.
No opinion or an adverse opinion results when the account-ing books are in such disarray that the auditors cannot confirmthe numbers. Control procedures may be poor or absent. Ac-counting irregularities will certainly trigger this result, as will apattern of not adhering to GAAP. As a general rule, changing CPAfirms is not something that a major company does casually. Therelationship between the company and the firm has been builtup over many years and involves a considerable degree of coop-eration and trust. If the CPA firm resigns or is asked to do so, thisis usually evidence of severe disagreements over the accountingprocess or reporting of results. It’s much easier for the CPA firmto reassign accountants than to lose a client if personality or cul-ture is an issue.
Footnotes
The footnotes to the financial statements are a critical part of theannual report presentation and also contain some useful infor-mation:
1. We can learn more about the company’s acquisition, di-vesture, and strategic alliance efforts. There may be possi-ble clues to the company’s strategic direction. Prices oftransactions are sometimes included.
2. We can see how the company manages the risk associatedwith being global. For example, Merck provides an analy-sis that includes currency rates, commodity prices, andinterest rates.
3. We can learn what lines of credit the company has and
66 Understanding Financial Information
what interest rates it is paying on debt securities andearning on its investments in marketable securities.
4. We can learn how the company deals with legal and envi-ronmental issues. For example, Phillip Morris’s annual re-port has an extensive description of the tobacco lawsuits.
5. From the segment reporting section, we can determinethe key ratios for each of a company’s businesses. Thiscan be an excellent way for you to focus in on those seg-ments against which you compete.
Other Important Information in the Annual Report
1. Financial and statistical information for five or ten yearsis often included. This provides a valuable overview of thecompany’s performance and its consistency. It is interest-ing to compare the ten-year history with the behavior ofthe U.S. and global economies during the same period.This may provide some indication of how economicevents affect the company and how the company dealswith this environment.
2. A list of the management team and the board of directorsis given. Which executives are invited to join the boardmay provide an indication of the company’s successionplans. Outside directors who are or were CEOs of othercompanies may become candidates for the top job at thiscompany if the management team does poorly and anoutside perspective is required.
3. The annual report also provides certain corporate infor-mation that appears to be routine. Somewhere at the backthere appears a section that includes:
The place and time of the annual meetingHow to get a 10K reportHow to contact various departments in the companywith questionsWhether the company has dividend reinvestment anddirect stock purchase programsHow to get additional information

67The Annual Report and Other Sources of Incredibly Valuable Information
These don’t seem like startling bits of information, but achievingthese stockholder rights required many years of effort from manypeople. Company management used to be a ‘‘closed system’’ inmany cases. Shareholders had very few rights other than the rightto sell their shares if they were not happy with their investment.What happened over time was the development of a group ofpeople known as shareholder activists. It would be reasonable toassume that company managements used descriptions of thesepeople that were much less friendly. For a long-term perspectiveon this movement, every businessperson should know about theGilbert brothers, John and Lewis (see sidebar).
The Gilbert Brothers—The Original Shareholder Activists
Background
If you saw the movie Wall Street, you saw Michael Douglas asGordon Giecko browbeat the board of directors of a multina-tional company because the directors were arrogant and de-tached from the needs of the stockholders and the company.They were making big salaries and bonuses even though thecompany was not performing well. There were too many seniorexecutives who were not doing much except consuming timeand space. This is not make-believe. In fact the role was mod-eled on two real-life people, John and Lewis Gilbert. Everyonein business and everyone who is interested in the stock marketshould know what they did.
Their Contribution
The Gilbert brothers were born early in the century in very fi-nancially comfortable circumstances. They dedicated their livesto having fun, making money, and creating an environment inwhich companies’ boards of directors and senior managementwere actually accountable to their bosses, the shareholders.They were the original shareholder activists. Among the im-
68 Understanding Financial Information
provements that they caused or contributed to are the followingprinciples:
Members of the board of directors should actually ownshares of stock in the company.Stockholders should receive adequate notice of sched-uled annual meetings.Stockholders should receive audited financial statementsbefore the annual meeting.Annual meetings should be held in a location that is geo-graphically convenient, so that some shareholders canactually attend. An issue in the Transamerica lawsuit, de-scribed later, was that the insurance company held its an-nual meetings in Delaware rather than in California, whereits operations and many shareholders were located. Thetradition of remote locations for annual meetings hasbeen changed.Shareholders can present resolutions for shareholdervote. In 1942, the Securities and Exchange Commissionruled that not only can shareholders present resolutionsfor a vote, but that their proposals must be circulated toother shareholders at company expense.Shareholders can ask questions at annual meetings andactually expect that these questions will be answered. Itwas common in the 1930s for annual meetings to befilled with company employees who would shout downany stockholder who made an unfavorable comment.Senior managers’ compensation should be related to theprofitability of the company. Putting executive pay in theproxy statement had its effect as early as 1937. The chair-man of Bethlehem Steel had to take a pay cut after receiv-ing pressure from the Gilberts. The event receivedheadline coverage from Business Week and the New YorkTimes.Auditors are elected by shareholders, not by manage-ment. Auditors should be present at annual meetings toanswer shareholders’ questions. The concept of internalauditors who would assure the integrity of the company’s
69The Annual Report and Other Sources of Incredibly Valuable Information
financial information was promoted by Lewis Gilbert asearly as the 1930s.Stockholder proposals are included in proxy statements.In 1945, the Gilbert brothers sued Transamerica InsuranceCompany because management refused to include in itsproxy statement proposals that the Gilberts had made.The judge ruled, ‘‘A corporation is run for the benefit ofits stockholders and not only for that of its managers.’’This was a fundamental change in attitude and practice.
These issues seem somewhat obvious in this modern day ofshareholder activism and the availability of seemingly unlimitedamounts of information through the Internet. When Lewis andJohn Gilbert hit their full stride in the 1940s, the opposite wastrue. They are known to have annoyed more than one boardchairman with their questions, stockholder resolutions, andchallenges.
The Effort Continues
Many years ago, the brothers created a foundation, appropri-ately called Corporate Democracy, Inc. A team of ten has beenorganized that travels to many dozens of annual meetings,wherever and whenever they may be held. Meetings that canbe reached only after multiple plane rides and car rentals stilloccasionally occur, but not nearly as frequently as in the past.The team still reports the existence of nonresponsive CEOs. Inaddition to the activities of this team, Securities and ExchangeCommission regulations have increased accountability, and theInternet has vastly expanded the availability of information.However, the effort continues, building momentum for a proc-ess that began many years ago.
The most recent improvement in shareholder rights relatesto a company’s treatment of security analysts, as opposed tothose who are ‘‘just shareholders.’’ Companies traditionally in-vited a select few analysts to very comfortable corporate re-treats, where management would share its thoughts about thecompany’s past performance and its expectations for the futureof the business. This would be followed up with conference calls
70 Understanding Financial Information
and other forms of communication with these select few. In fact,these analysts were often made aware of information before itwas made available to the general public. They could then ad-vise their clients of critical developments before the generalpublic was aware of them. When a public announcement wasfinally made, many of these analysts’ clients had already tradedthe stock. To prevent the perception and the fact that the fa-vored few were privy to valuable, otherwise private information,companies are beginning to invite everyone to listen in on theirconference calls. Major developments are now often announcedto everyone at the same time, either through press releases orthrough SEC filings. All of this has come about because of theoriginal shareholder activists.
The 10K Report
The 10K is an annual report that goes directly to the Securitiesand Exchange Commission. It contains all the reports requiredby regulatory agencies that are contained in the annual report,and more besides. There is no public relations information orphotographs. Some 10K reports contain considerable informa-tion about the directors and executives, similar to what is givenin the proxy statement.
The 10K report of an Internet company that had had a seriesof particularly disappointing years described the future risks thecompany faced in continuing in business:
Uncertainties associated with the company’s limited op-erating historyOperating losses and the potential need for additionalfundsUnproven acceptance (of the company’s products) in a de-veloping marketDependence on continuing use of the InternetReliance on advertising revenues and uncertainty concern-ing the adoption of the Internet as an advertising mediumDependence on a limited number of advertisers
71The Annual Report and Other Sources of Incredibly Valuable Information
New and highly competitive market; low barriers to entryVariations in quarterly results of operations; seasonalityThe need to develop and maintain brand recognitionDependence on key personnel and a shortage of qualifiedinformation technology (IT) peopleThe strain on the company’s resources as a result of con-tinued growthInability to identify potential acquisitions and to integrateoperationsInability to expand and manage international operationsDependence on content providersDependence on strategic alliancesRisk of capacity constraints and systems failuresOnline security risksInability to protect intellectual propertyLiability for informational servicesGovernment regulationConcentration of stock ownershipVolatility of stock pricesThe antitakeover provisions of Delaware corporate law
The full disclosure provisions of GAAP certainly have caused thiscompany to put its cards on the table. It would be helpful if everycompany were this honest and forthright in assessing its future.The company also describes in considerable detail how it is cop-ing with each of these risks. It would be valuable to learn whatyour company and its competitors identify as the risks that mightaffect its chances of being successful in the future.
The Proxy Statement
The proxy statement is the package of information that eachshareholder receives as part of the annual meeting announce-ment. Because most shareholders do not attend the annualmeeting, they are invited to vote by ‘‘proxy.’’ This is a mail-inballot that is essentially the same as an absentee ballot in na-tional elections, with the exception that it also authorizes theperson named in the proxy to vote for the shareholder on any
72 Understanding Financial Information
other matter that comes up at the meeting. Shareholders get tovote for:
The annual contract with the CPA firmMembers of the board of directorsProposals to change corporate bylawsExecutive stock option and incentive plansProposals submitted by shareholders
The votes are always yes or no options, and the proxy almostalways indicates the vote that is recommended by the board ofdirectors. The proxy statement also includes other informationthat is of great interest:
1. Notification of the fact that a list of all shareholders isavailable at corporate headquarters and at the annualmeeting. This is of special interest to shareholder activistslike the Gilberts who seek to arouse interest in a particularissue. It is also valuable to potential acquirers of the com-pany, who need to communicate with shareholders toseek support for their efforts.
2. A list of the members of the board of directors, their affil-iations, and their compensation. Board members may re-ceive an annual retainer, a fee for each board meeting, afee for each committee meeting, stock options, and de-ferred compensation. For Fortune 500 companies, thiscan amount to $100,000 or more annually.
3. The compensation package for each corporate officer, in-cluding deferred compensation and stock options. It is avery positive situation if every director and corporate of-ficer has a stake in the success of the company, and iftheir rewards are commensurate with that success, or itsabsence.
4. A description of executive pension and severance pack-ages. There has been considerable negative press cover-age concerning departed executives who were paid morefor leaving involuntarily than they were compensatedwhen they were employed. The rationale is that their stay-ing with the company would have been more expensive.
73The Annual Report and Other Sources of Incredibly Valuable Information
Other Sources of Information
There are three ways of obtaining a hard copy of an annual re-port. The first is from the company itself. The second is through aservice provided by a company called Public Register. The PublicRegister Annual Report Service can be accessed either by tele-phone or through the company’s web site. The service providesthe annual reports of thousands of companies. The companies inPublic Register’s database are organized by industry, so findingthe report you want is easy and convenient. The web site is www.prars.com and the phone number is 800-4-ANNUAL. Reports areusually received within two business days. This service is free.
The Wall Street Journal has a very similar service. The phonenumber is 800-654-2582. Order forms can also be faxed. It ishelpful to get a hard copy of the listing of companies even if youuse the Wall Street Journal or Public Register Web sites.
The most comprehensive of these services is MorningstarReports. Morningstar is a Chicago-based organization that is aleading provider of investment information, research, and analy-sis. It can easily be accessed through America Online. For DuPontand most other companies, this Web site provides:
A description of the company’s businessesA listing of its officersThree years of financial statements, including the incomestatement, balance sheet, and statement of cash flows, inconsiderable detailSelected financial ratios segmented by category:
Financial strengthManagement effectivenessProfitability
The management effectiveness ratios include return on equityand return on assets. Profitability ratios include gross profit per-centage, operating margin, and return on sales.
The most interesting and helpful section of the report com-pares the ratios of the subject company with the average ratiosfor its industry. The DuPont Company is compared with the aver-age of fifty companies classified as ‘‘Chemical Manufacturing.’’
74 Understanding Financial Information
(Recall, however, that DuPont now considers itself a ‘‘science’’company.) The average performance of all of the Standard &Poor’s 500 companies is also listed. The benchmarking value ofthis information is extraordinary. The ratios are classified intothese categories:
Stock market information, including the price/earnings(P/E) ratio and price/cash flowGrowth rates of revenues and earningsFinancial strengthProfitabilityManagement effectivenessEfficiency
There are fifty ratios in all. To make the information even morevaluable, if that were possible, at the end of the ratios sectionare the stock symbols of the other forty-nine companies in thechemical database. Each of these other companies can also beaccessed.
The Securities and Exchange Commission
The Securities and Exchange Commission (SEC) is a federal gov-ernment, executive branch agency responsible for assuring fair-ness in the securities markets. It was formed by the SecuritiesExchange Act of 1934, known as the ‘‘truth in securities’’ law.This law, together with the Securities Act of 1933 that precededit, requires public companies to provide investors with financialand other significant information about securities being offeredto the public. These laws also prohibit deceit, misrepresentation,and fraud in the sale of securities.
Companies with assets of $10.0 million with securities thatare held by more than 500 shareholders are required to file withthe SEC. By requiring these companies to register their securities,the SEC provides the public with the information they need ifthey are to make informed investment decisions. Investors wholose money can recover damages if they can prove that theybased their investment decision on information that was mis-
75The Annual Report and Other Sources of Incredibly Valuable Information
leading, incomplete, or inaccurate. All SEC filings are availableon the Internet at the SEC web site, www.sec.gov.
SEC rules also govern the solicitation of shareholder votes;proxy statements must be filed with the SEC before the solicita-tion actually occurs.
Anyone who wishes to make a tender offer for more than 5percent of a company’s stock must also file with the SEC. Atender offer is an offer to purchase shares in large quantities.Tender offers are often announced in the Wall Street Journal inan advertisement called a tombstone. Many people or companiesthat anticipate making an unfriendly tender offer (one that thebuyer expects the target company to resist) often purchase 4.99percent of the stock before the event. Once their holdings exceed5 percent and their intentions become public, the stock price willmove up. Therefore, the buyers will keep their holdings belowthe threshold until as late in the process as possible in order tokeep their intentions secret.
The securities laws also govern the actions of insiders. Theterm insider has two meanings. The legal definition is officers,directors, and anyone who holds more than 5 percent of thestock. These insiders may certainly buy and sell shares, but theymust notify the SEC of their transactions. However, anyone whohas critical information not available to the general public, farbeyond just company management, can also be considered aninsider and may not trade the stock on the basis of that informa-tion. Morningstar Reports provides information about manage-ment purchases and sales of company stock.
The SEC also governs the efforts of SROs, or self-regulatedorganizations. Included in this classification are the New Yorkand American Stock Exchanges, the National Association ofSecurities Dealers (NASD), and the regional exchanges. TheseSROs must create and enforce rules for their members that re-quire them to conform to the SEC regulations and must providedisciplinary proceedings for those whose actions are in violationof these rules but fall short of what is considered criminal. Thisensures market integrity and investor protection.

This Page Intentionally Left Blank
Part 2
ANALYSIS OF FINANCIAL
STATEMENTS

This Page Intentionally Left Blank
Chapter 6
Key Financial Ratios
RATIOS ARE MATHEMATICAL CALCULATIONS THAT thecompany can use to evaluate its performance. They help thecompany to determine whether trends are improving or deterio-rating. They are calculated by comparing two numbers with eachother. The most valuable use that can be made of ratios is tocompare the ratios for this year with the same ratios for the previ-ous year and with the ratios of other companies in a similar busi-ness. Ratios also serve as goals for future performance.
Statistical Indicators
Many of us use statistical indicators, many of which are actuallyratios, to monitor the business. These key indicators include:
Output per labor hourCapacity utilizationMarket shareSales ordersAverage length of a production runPassenger revenue miles (airlines)Responses/mailings (direct mail)
Some of these productivity measures are immediate in nature.They can be monitored on an hourly or daily basis, and manage-
79
80 Analysis of Financial Statements
ment can make immediate adjustments in response to them.These are very much ‘‘real-time’’ indicators.
These statistical indicators are very much the domain of in-ternal management. While internal statistical information wouldcertainly be interesting and might be valuable to outsiders, theyhave little or no access to it. Interestingly, in the automobile busi-ness, information concerning units produced, units sold, andavailable inventory are public information. But this is an excep-tion.
First-level line managers in both sales and operations re-quire detailed statistical information on a regular basis—and fre-quently. Operations supervisors fine-tune machinery, redeploylabor resources, and manage the logistics of inventory. Salesmanagers direct daily or weekly sales calls, schedule appearancesat trade shows, and determine immediate customer satisfaction.Senior managers don’t require this degree of detail to carry outtheir responsibilities, and certainly not on an hourly, daily, oreven weekly basis. The higher the manager’s level of responsibil-ity, the more an overview is the necessary perspective. That ex-plains why, as managers progress through the organization’sranks, their concerns and perspectives become more financialand strategic.
Financial Ratios
Financial ratios provide more of an overview. They help manage-ment to monitor the company’s performance over a period oftime, perhaps a week or a month. In order to fully appreciate andproperly use the financial ratios, it is important that the analyst:
Understand the business and its productsAnalyze the company’s performance within the context ofthe economic climateBe aware of the legal and regulatory issues that the com-pany facesLook at the ratios within the context of the competitiveenvironment
81Key Financial Ratios
Be knowledgeable about industry averages and ratio be-havior
People with a wide variety of interests may use financial ratios toanalyze the business. These include:
External
Security analystsPotential and existing stockholdersBankers and other lendersSuppliers and their credit managersCompetitorsRegulators
Internal
Board of directorsSenior managementOperations, sales, finance, human resources, marketingStrategic planners
Each of these groups has its own perspectives and needs. Devel-oping a marketing strategy requires an understanding of thecompany’s financial ability to support growth. Suppliers assessthe company’s ability (not its willingness) to pay its bills in accor-dance with agreed-upon credit terms
Ratios must be evaluated within their context. The value ofstatistical indicators has been discussed. Many business and en-vironmental factors have been identified. As mentioned pre-viously, the most valuable use that can be made of ratios is tolook at them as part of a trend and to compare them with thesame ratios for competitors.
Financial ratios can be divided into four major groupings:
1. Liquidity ratios2. Working capital management ratios3. Measures of profitability4. Financial leverage ratios
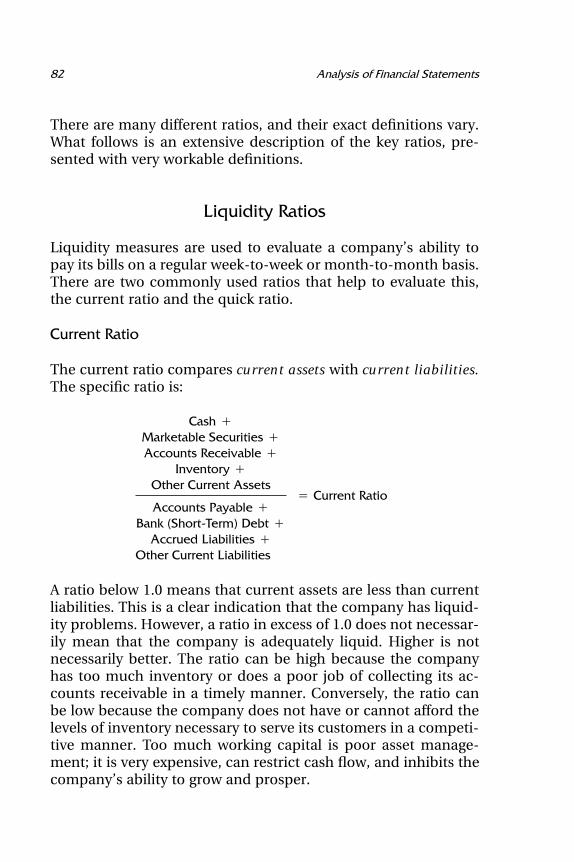
82 Analysis of Financial Statements
There are many different ratios, and their exact definitions vary.What follows is an extensive description of the key ratios, pre-sented with very workable definitions.
Liquidity Ratios
Liquidity measures are used to evaluate a company’s ability topay its bills on a regular week-to-week or month-to-month basis.There are two commonly used ratios that help to evaluate this,the current ratio and the quick ratio.
Current Ratio
The current ratio compares current assets with current liabilities.The specific ratio is:
Cash �Marketable Securities �Accounts Receivable �
Inventory �Other Current Assets
� Current RatioAccounts Payable �
Bank (Short-Term) Debt �Accrued Liabilities �
Other Current Liabilities
A ratio below 1.0 means that current assets are less than currentliabilities. This is a clear indication that the company has liquid-ity problems. However, a ratio in excess of 1.0 does not necessar-ily mean that the company is adequately liquid. Higher is notnecessarily better. The ratio can be high because the companyhas too much inventory or does a poor job of collecting its ac-counts receivable in a timely manner. Conversely, the ratio canbe low because the company does not have or cannot afford thelevels of inventory necessary to serve its customers in a competi-tive manner. Too much working capital is poor asset manage-ment; it is very expensive, can restrict cash flow, and inhibits thecompany’s ability to grow and prosper.
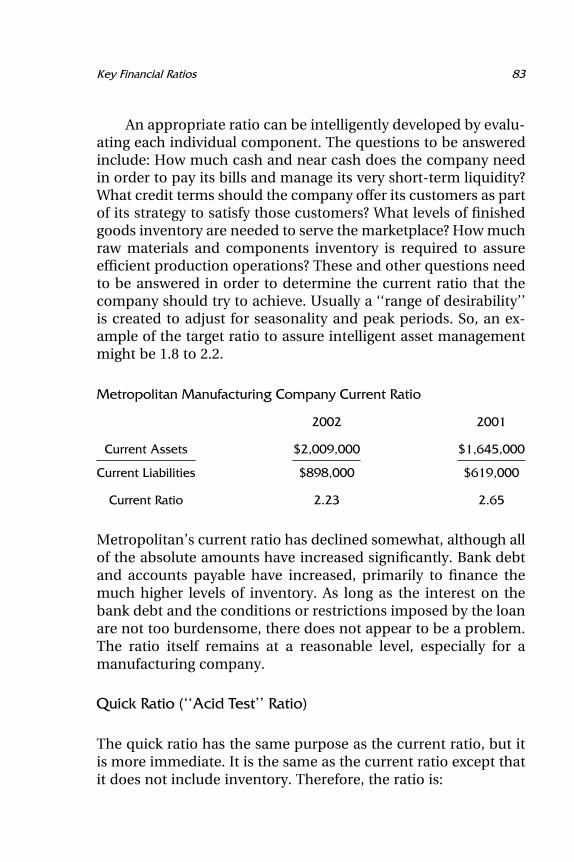
83Key Financial Ratios
An appropriate ratio can be intelligently developed by evalu-ating each individual component. The questions to be answeredinclude: How much cash and near cash does the company needin order to pay its bills and manage its very short-term liquidity?What credit terms should the company offer its customers as partof its strategy to satisfy those customers? What levels of finishedgoods inventory are needed to serve the marketplace? How muchraw materials and components inventory is required to assureefficient production operations? These and other questions needto be answered in order to determine the current ratio that thecompany should try to achieve. Usually a ‘‘range of desirability’’is created to adjust for seasonality and peak periods. So, an ex-ample of the target ratio to assure intelligent asset managementmight be 1.8 to 2.2.
Metropolitan Manufacturing Company Current Ratio
2002 2001
Current Assets $2,009,000 $1,645,000
Current Liabilities $898,000 $619,000
Current Ratio 2.23 2.65
Metropolitan’s current ratio has declined somewhat, although allof the absolute amounts have increased significantly. Bank debtand accounts payable have increased, primarily to finance themuch higher levels of inventory. As long as the interest on thebank debt and the conditions or restrictions imposed by the loanare not too burdensome, there does not appear to be a problem.The ratio itself remains at a reasonable level, especially for amanufacturing company.
Quick Ratio (‘‘Acid Test’’ Ratio)
The quick ratio has the same purpose as the current ratio, but itis more immediate. It is the same as the current ratio except thatit does not include inventory. Therefore, the ratio is:
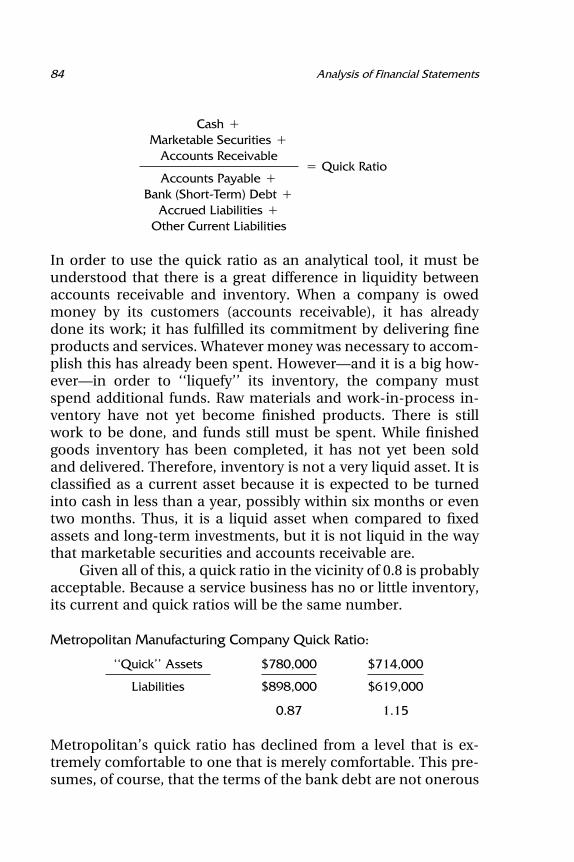
84 Analysis of Financial Statements
Cash �Marketable Securities �
Accounts Receivable� Quick Ratio
Accounts Payable �Bank (Short-Term) Debt �
Accrued Liabilities �Other Current Liabilities
In order to use the quick ratio as an analytical tool, it must beunderstood that there is a great difference in liquidity betweenaccounts receivable and inventory. When a company is owedmoney by its customers (accounts receivable), it has alreadydone its work; it has fulfilled its commitment by delivering fineproducts and services. Whatever money was necessary to accom-plish this has already been spent. However—and it is a big how-ever—in order to ‘‘liquefy’’ its inventory, the company mustspend additional funds. Raw materials and work-in-process in-ventory have not yet become finished products. There is stillwork to be done, and funds still must be spent. While finishedgoods inventory has been completed, it has not yet been soldand delivered. Therefore, inventory is not a very liquid asset. It isclassified as a current asset because it is expected to be turnedinto cash in less than a year, possibly within six months or eventwo months. Thus, it is a liquid asset when compared to fixedassets and long-term investments, but it is not liquid in the waythat marketable securities and accounts receivable are.
Given all of this, a quick ratio in the vicinity of 0.8 is probablyacceptable. Because a service business has no or little inventory,its current and quick ratios will be the same number.
Metropolitan Manufacturing Company Quick Ratio:
‘‘Quick’’ Assets $780,000 $714,000
Liabilities $898,000 $619,000
0.87 1.15
Metropolitan’s quick ratio has declined from a level that is ex-tremely comfortable to one that is merely comfortable. This pre-sumes, of course, that the terms of the bank debt are not onerous
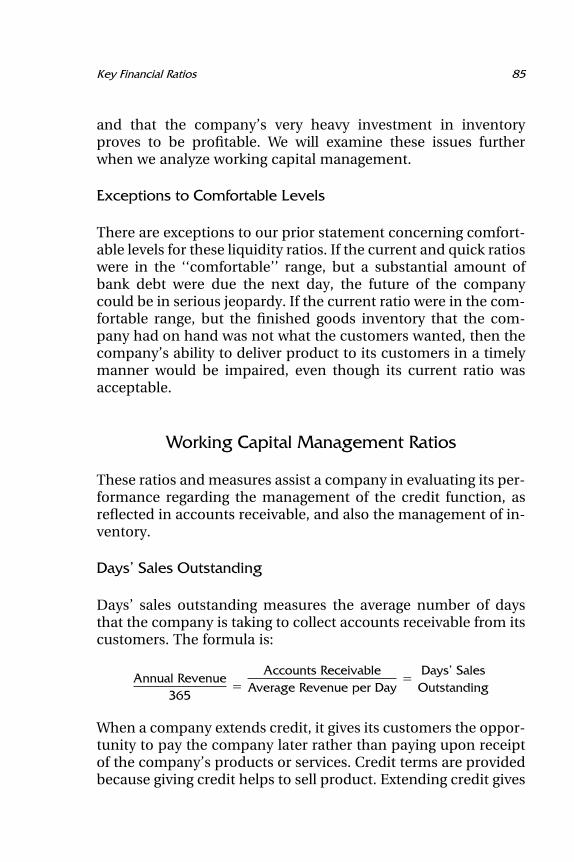
85Key Financial Ratios
and that the company’s very heavy investment in inventoryproves to be profitable. We will examine these issues furtherwhen we analyze working capital management.
Exceptions to Comfortable Levels
There are exceptions to our prior statement concerning comfort-able levels for these liquidity ratios. If the current and quick ratioswere in the ‘‘comfortable’’ range, but a substantial amount ofbank debt were due the next day, the future of the companycould be in serious jeopardy. If the current ratio were in the com-fortable range, but the finished goods inventory that the com-pany had on hand was not what the customers wanted, then thecompany’s ability to deliver product to its customers in a timelymanner would be impaired, even though its current ratio wasacceptable.
Working Capital Management Ratios
These ratios and measures assist a company in evaluating its per-formance regarding the management of the credit function, asreflected in accounts receivable, and also the management of in-ventory.
Days’ Sales Outstanding
Days’ sales outstanding measures the average number of daysthat the company is taking to collect accounts receivable from itscustomers. The formula is:
Annual Revenue365
�Accounts Receivable
Average Revenue per Day�
Days’ SalesOutstanding
When a company extends credit, it gives its customers the oppor-tunity to pay the company later rather than paying upon receiptof the company’s products or services. Credit terms are providedbecause giving credit helps to sell product. Extending credit gives
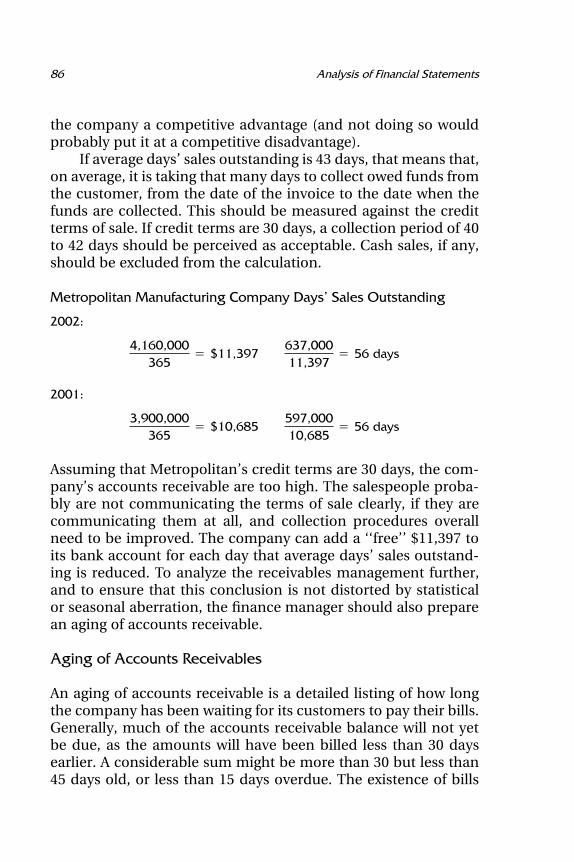
86 Analysis of Financial Statements
the company a competitive advantage (and not doing so wouldprobably put it at a competitive disadvantage).
If average days’ sales outstanding is 43 days, that means that,on average, it is taking that many days to collect owed funds fromthe customer, from the date of the invoice to the date when thefunds are collected. This should be measured against the creditterms of sale. If credit terms are 30 days, a collection period of 40to 42 days should be perceived as acceptable. Cash sales, if any,should be excluded from the calculation.
Metropolitan Manufacturing Company Days’ Sales Outstanding
2002:
4,160,000365
� $11,397637,00011,397
� 56 days
2001:
3,900,000365
� $10,685597,00010,685
� 56 days
Assuming that Metropolitan’s credit terms are 30 days, the com-pany’s accounts receivable are too high. The salespeople proba-bly are not communicating the terms of sale clearly, if they arecommunicating them at all, and collection procedures overallneed to be improved. The company can add a ‘‘free’’ $11,397 toits bank account for each day that average days’ sales outstand-ing is reduced. To analyze the receivables management further,and to ensure that this conclusion is not distorted by statisticalor seasonal aberration, the finance manager should also preparean aging of accounts receivable.
Aging of Accounts Receivables
An aging of accounts receivable is a detailed listing of how longthe company has been waiting for its customers to pay their bills.Generally, much of the accounts receivable balance will not yetbe due, as the amounts will have been billed less than 30 daysearlier. A considerable sum might be more than 30 but less than45 days old, or less than 15 days overdue. The existence of bills
87Key Financial Ratios
more than 45 days old is a sure indicator of customers’ inabilityor unwillingness to pay or of a feeling on the part of customersthat there is no particular pressure to do so.
The aging for Metropolitan Manufacturing Company as ofDecember 31, 2002, is:
Less than 30 days $280,00030–45 days 196,00045–60 days 135,000Above 60 days 36,000
Total $647,000
Metropolitan Manufacturing Company clearly has some problemreceivables. The probability that the company will be able to col-lect those that are over 60 days old is not good. The collectionspeople in the accounting department clearly have challengesahead if they are to get that money. The desirability of continuingto do business with those customers should be evaluated. Thosecustomers whose receivables are in the 45- to 60-day rangeshould receive some attention before they too become a worsen-ing problem. Clearly, Metropolitan Manufacturing must changeits attitude and those of its customers and begin to change someof its philosophies and practices.
Receivables Management Can Be Improved
Reducing accounts receivable without jeopardizing sales volumeis a very effective way for your company to improve its cash flow.The following list gives basic concepts of credit management thatyou should consider when you are negotiating with existing andpotential customers. Not every idea will work in all situations,and some of these ideas may not be appropriate for your busi-ness at all. However, nothing will work if you don’t try it.
1. Be aware that credit is a sales tool. Credit is granted tocustomers (permitting them to defer payment on mer-chandise that they already possess and are benefitingfrom) in order to motivate them to buy and in order toprovide an additional competitive advantage. Put credit
88 Analysis of Financial Statements
extension to the test: Will it affect whether or not the cus-tomer buys from you? Will it motivate the customer tobuy more or buy again? You are entitled to your money.You have earned it; you have spent money to make thesale, and you have provided the customer with the finestproduct or service of its kind.
2. Never make the extension of credit automatic. Train yoursales, service, and delivery people to reinforce your creditstrategies.
3. Cheerfully extend credit if the customer asks for it and de-serves it. Ask the customer how much time he would liketo have. Never extend credit for an automatic 30 or 60days. Some customers will ask for less credit than youwould otherwise have granted. Customers will pay fasterin order to maintain credibility with a very important sup-plier.
4. Train your customers to pay fast. Understanding that oldhabits die slowly, let the quality of your products and ser-vices, rather than your willingness to be a banker, be theirmotive for buying from you.
5. Get the clock ticking. Agreed-upon credit terms shouldstart the day the product is delivered, not the day the in-voice is mailed. Mail out invoices and statements morefrequently. This is effective and is rarely noticed. Give thecustomer the invoice upon delivery, if possible. This re-duces mailing expenses and makes the customer evenmore conscious of the responsibility to pay you fast.
6. Never apologize for asking for your money. You earned itby providing the finest products and services in your mar-ketplace.
7. Search for opportunities to reduce your outstanding receiv-ables. Start slowly, with your new customers and yourleast desirable existing customers. Train them and thosewho work for you. Set yourself a six-month target andwork toward it. Watch your bank account grow.
Inventory Turnover Ratio
The inventory turnover ratio provides a helpful overview of howeffectively the company manages what may be its most valuable
89Key Financial Ratios
asset, its inventory. It describes the relationship between the costof the product sold over the course of a year and the averageinventory the company maintained to support those sales. Theformula for the inventory turnover ratio is:
Cost of Goods SoldAverage Inventory
� Inventory Turnover
The resulting inventory turnover is interpreted as follows:
A turnover of 12 times translates to one month’s inventoryon hand, on average.A turnover of 25 times translates to two weeks’ inventoryon hand, on average.A turnover of 6 times translates to two months’ inventoryon hand, on average.
Of course, determining the appropriate amount of inventory fora company is much more complex than calculating this ratio,however valuable the ratio may be.
The cost of inventory includes the following:
Acquisition costTransportation in and outInsurancePersonal property taxesWarehouse overheadLabor expenseComputer and related expensesInterest expensePhysical deteriorationSeasonal obsolescence
The cost of not having enough inventory or of having the wronginventory includes:
Unhappy customersLost market share
90 Analysis of Financial Statements
Higher production costs in the form of overtime or extrashiftsPurchasing small quantities at short noticePaying extra for accelerated transportation
Finished Goods Inventory. Efficiency of Production. Themore efficient the production operations are, the less finishedproduct a company must maintain. If operations are inefficient,the company will have to have a safety stock of finished productto assure adequate customer service.
Made to Order/Made for Stock. A company that makes prod-uct without an order in hand will have to maintain extra inven-tory because of the uncertainty associated with what productscustomers will demand. A company that makes product in re-sponse to specific orders, especially custom-designed product,will require very little or no inventory on hand other than theinventory that is being accumulated for shipment.
Forecasting Sales. The more effectively a company can pre-dict what its customers will want, the less finished product inven-tory it will require. If there is great uncertainty concerning thecustomers’ needs and/or the directions that the markets willtake, the company will have to keep more product on hand toassure customer service.
Lead Times. The more notice that the customers give thecompany concerning their product requirements, the less extrainventory the company must maintain.
Low-value-added distributors must have adequate suppliesof almost everything on hand in order to serve their customersand be competitive. In fact, their value added is precisely theirhaving everything on hand, ready for immediate delivery orpickup. The ultimate low-value-added business is a supermarket.It changes the nature or content of the product very little; all itdoes is take crates of twelve or more items, open them, and putthe contents on convenient shelves. Its value added is having35,000 of these products in one large, clean, comfortable room.
91Key Financial Ratios
And, a supermarket cannot run out of any essential items andhope to keep its customers happy.
Number of Warehouse Locations. Some companies servetheir entire marketplace from a single warehouse. This is efficientif the marketplace is geographically concentrated and can beproperly served from that one location. It can be effective even ifthe marketplace is national in scope if the product is very valu-able or orders are very large, making transportation a small partof the total cost. It can also be effective if deliveries are not tootime-sensitive, so that surface or ocean transportation can beused.
However, in the absence of any of these conditions, manybusinesses must use a network of warehouses, and perhaps evensatellites of those warehouses, to serve their customers. If a com-pany has warehouses at multiple locations, inventory levels rela-tive to volumes sold will be higher than those of a business witha single warehouse. Safety stocks will also be higher to protectagainst transportation uncertainties. Minimum stocks of eachproduct line must be stored in order to assure customer service.The offset to these higher costs and inventory levels should bemore timely customer service and more efficient transportation,with products being transported in bulk over the long distancesfrom the factory to each warehouse rather than being trans-ported individually over the long distances from the centralwarehouse to each customer. A financial analysis of these alter-natives should be provided to assure cost efficiency.
Raw Materials/Purchased Components. Product Diversity.The greater the variety of products that a company manufac-tures, the greater the amount of raw materials and componentsthat it must keep on hand. For each type of product, the com-pany needs to have a minimum stock of materials and compo-nents on hand. This is especially true when the company’sfinished products have few if any components in common. Com-monality of components contributes considerably to the mini-mization of inventory. An excellent example of this is theautomobile industry. Many different models of cars actually havemany components, including the frames, in common. In fact,
92 Analysis of Financial Statements
there are many different models of cars that are actually the samecar, despite different appearances and perceptions of quality.
Supply Chain Management. Technology has had a dramaticimpact on inventory management and has resulted in drastic re-ductions in all forms of inventory. When a company goes onlinewith its vendors, its product needs are automatically communi-cated to those vendors electronically. This shortens lead times,reduces mistakes, and accelerates the supply process. Greatercompetitive intensity forces suppliers to provide faster delivery ofhigh-quality products. Safety stock can be reduced when qualityproblems are reduced.
Concentration/Diversity of Vendors. Technology, especiallythe business-to-business (B2B) capabilities of the Internet, hascreated both incredible supply chain turmoil and incredible op-portunity at the same time. Internet hookups between vendorand customer give that vendor a considerable competitive ad-vantage, assuming that the vendor’s performance remains at thehighest quality levels. On the other hand, product web sites andtransportation logistics have created a nationwide supply mar-ket. Companies used to buy product from relatively local ven-dors. Now they can access the Internet and locate suppliers allover the country. The intensity of the resulting competition,along with very dependable transportation support from compa-nies like Federal Express and UPS, leads to lower purchase costs,shorter lead times, and less inventory.
Metropolitan Manufacturing Company Inventory Turnover
2002 2001
Cost of Goods Sold $2,759,000 $2,593,000 (line 25)
Ending Inventory* $1,229,000 $931,000 (line 4)
Inventory Turnover 2.24 times 2.79 times
*In general, the inventory figure used is the average of the beginning and ending inventories.In this example, for simplicity, I have used ending inventory.
The inventory turnover ratio for Metropolitan ManufacturingCompany is quite low. This could be because Metropolitan’s
93Key Financial Ratios
business is very inventory-intensive. Perhaps Metropolitan is avery vertically integrated manufacturing company. Or perhapsMetropolitan is in a service-intensive business with short leadtimes, resulting in a need for vast quantities of finished goodsinventory. Or the company could be purchasing raw materialsinventory in large quantities in order to take advantage of quan-tity discounts. If this last alternative is true, Metropolitan’s grossprofit margin should be considerably above the average for itsindustry. Alternatively, the high levels of inventory could be theresult of gross inefficiencies, ineffective purchasing, and overlyoptimistic sales forecasts that are not being achieved. Knowledgeof Metropolitan’s industry, its operations plan, and its competi-tors would be very valuable in reaching an accurate conclusion.
Measures of Profitability
These ratios assist management and others in the evaluation ofthe company’s achievements. They focus on:
Profitability achieved by the management teamAssets invested in the businessRevenue achieved by the businessThe funds that the owners have invested in the business
Some review of terms will be helpful. The line numbers used hereand later in the chapter refer to the financial statements in Chap-ters 1 and 2 (Exhibits 1-1 and 2-1).
24. Revenue: The value of products and services sold.25. Cost of goods sold: The cost of the labor, materials, and
manufacturing overhead used to produce the productssold.
26. Gross profit: Revenue � cost of goods sold (same asgross margin).
27. General and administrative expenses: The cost of op-erating the company itself; this category includes allother support spending necessary to conduct the busi-ness.
94 Analysis of Financial Statements
27a. Earnings before interest, taxes, and depreciation andamortization: This is known by its acronym, EBITDA.
28. Depreciation (and other noncash) expense.29. Net income before taxes.30. Provision for income taxes.31. Net income.
Our analysis of these numbers would be improved if we knewmore about Metropolitan Manufacturing Company, including:
Its business and productsThe competitive environmentIts degree of globalizationThe budget for year 2002 and its plans for subsequent yearsLegal and regulatory issuesWhether it is a public or a private organizationIts capacity utilizationIts fixed cost/variable cost mix
The selection of the numbers to use in the analysis dependsupon:
What is being measuredWho is doing the analysisWhich managers are being measuredStyle and measurement attitude
Issues of Selecting Measurements
The board of directors of the company, as well as security ana-lysts and credit analysts, is concerned with the performance ofthe company as a whole. Therefore, the measure they use to eval-uate company-wide performance will probably be net income.Increasingly, however, security analysts, who are concerned withthe company’s performance within the context of the stock mar-ket, are using EBITDA.
Many people consider the provision for income taxes to bea passive expense. To begin with, the amount of federal income
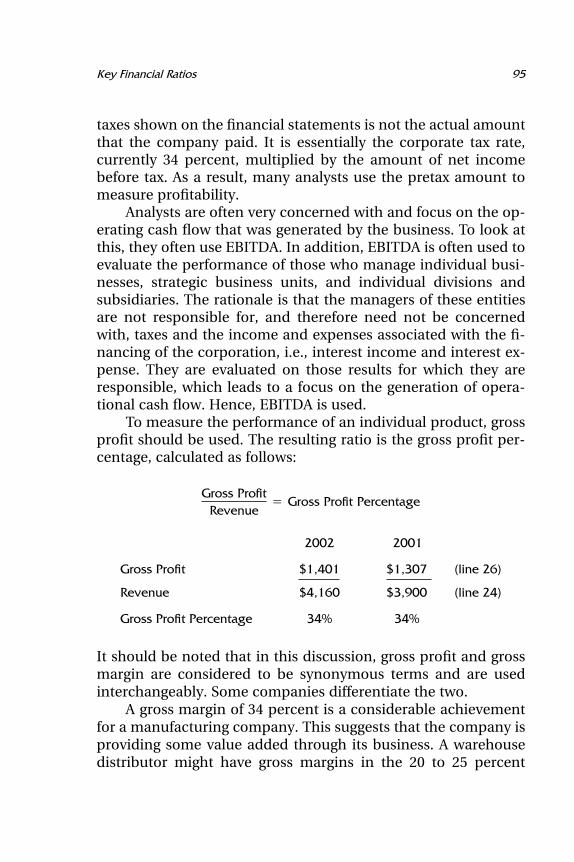
95Key Financial Ratios
taxes shown on the financial statements is not the actual amountthat the company paid. It is essentially the corporate tax rate,currently 34 percent, multiplied by the amount of net incomebefore tax. As a result, many analysts use the pretax amount tomeasure profitability.
Analysts are often very concerned with and focus on the op-erating cash flow that was generated by the business. To look atthis, they often use EBITDA. In addition, EBITDA is often used toevaluate the performance of those who manage individual busi-nesses, strategic business units, and individual divisions andsubsidiaries. The rationale is that the managers of these entitiesare not responsible for, and therefore need not be concernedwith, taxes and the income and expenses associated with the fi-nancing of the corporation, i.e., interest income and interest ex-pense. They are evaluated on those results for which they areresponsible, which leads to a focus on the generation of opera-tional cash flow. Hence, EBITDA is used.
To measure the performance of an individual product, grossprofit should be used. The resulting ratio is the gross profit per-centage, calculated as follows:
Gross ProfitRevenue
� Gross Profit Percentage
2002 2001
Gross Profit $1,401 $1,307 (line 26)
Revenue $4,160 $3,900 (line 24)
Gross Profit Percentage 34% 34%
It should be noted that in this discussion, gross profit and grossmargin are considered to be synonymous terms and are usedinterchangeably. Some companies differentiate the two.
A gross margin of 34 percent is a considerable achievementfor a manufacturing company. This suggests that the company isproviding some value added through its business. A warehousedistributor might have gross margins in the 20 to 25 percent
96 Analysis of Financial Statements
range, while manufacturers of high-end medical products andpharmaceuticals might enjoy margins of as much as 60 to 70 per-cent on some of their products. We should note, however, thatdespite an additional investment in inventory of $298,000 in2002, Metropolitan’s gross margin did not improve.
Return on assets (ROA) measures the profitability of thecompany relative to the total amount of assets the owners haveinvested in the business. These assets include both working capi-tal (cash, marketable securities, accounts receivable, and inven-tory) and fixed assets (capital equipment and land/buildings).The equation for return on assets is:
Net IncomeAssets
� Return on Assets
In addition to measuring the overall performance of the com-pany, return on equity (ROE) measures the company’s ability touse borrowed funds effectively as well as the owners’ money.This will also affect the company’s ability to attract new inves-tors. Without debt, a company’s ROA and ROE will be the same.The more debt is used to expand the business, the greater will bethe improvement in return on equity compared with return onassets. However, excessive reliance on borrowed funds involvesconsiderable risk, as we will see later when we discuss financialleverage. The formula for return on equity is:
Net IncomeStockholders’ Equity
� Return on Equity
Return on sales measures the overall operating efficiency of thecompany. Among the questions that it answers are: Is the pro-duction facility operating effectively? Are the administrative de-partments performing their responsibilities efficiently? Theequation is:
Net IncomeRevenue
� Return on Sales
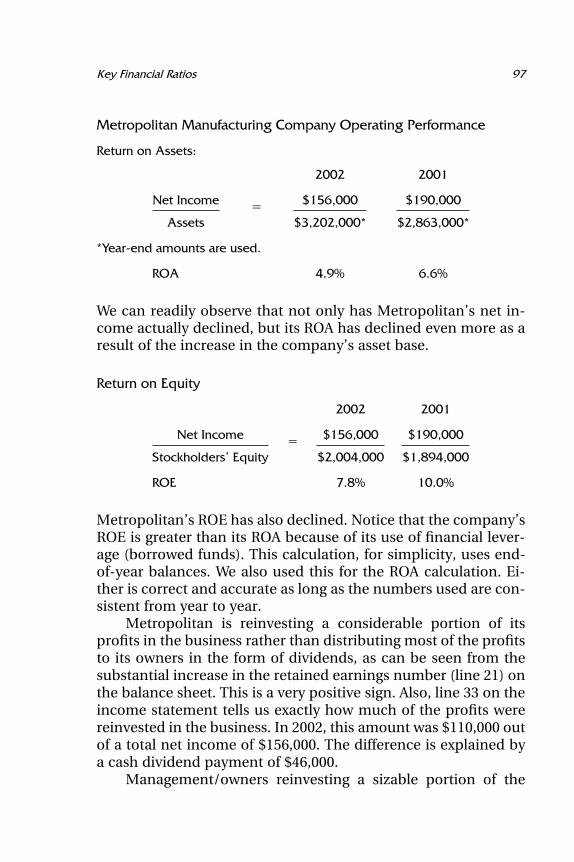
97Key Financial Ratios
Metropolitan Manufacturing Company Operating Performance
Return on Assets:
2002 2001
Net Income $156,000 $190,000�
Assets $3,202,000* $2,863,000*
*Year-end amounts are used.
ROA 4.9% 6.6%
We can readily observe that not only has Metropolitan’s net in-come actually declined, but its ROA has declined even more as aresult of the increase in the company’s asset base.
Return on Equity
2002 2001
Net Income $156,000 $190,000�
Stockholders’ Equity $2,004,000 $1,894,000
ROE 7.8% 10.0%
Metropolitan’s ROE has also declined. Notice that the company’sROE is greater than its ROA because of its use of financial lever-age (borrowed funds). This calculation, for simplicity, uses end-of-year balances. We also used this for the ROA calculation. Ei-ther is correct and accurate as long as the numbers used are con-sistent from year to year.
Metropolitan is reinvesting a considerable portion of itsprofits in the business rather than distributing most of the profitsto its owners in the form of dividends, as can be seen from thesubstantial increase in the retained earnings number (line 21) onthe balance sheet. This is a very positive sign. Also, line 33 on theincome statement tells us exactly how much of the profits werereinvested in the business. In 2002, this amount was $110,000 outof a total net income of $156,000. The difference is explained bya cash dividend payment of $46,000.
Management/owners reinvesting a sizable portion of the
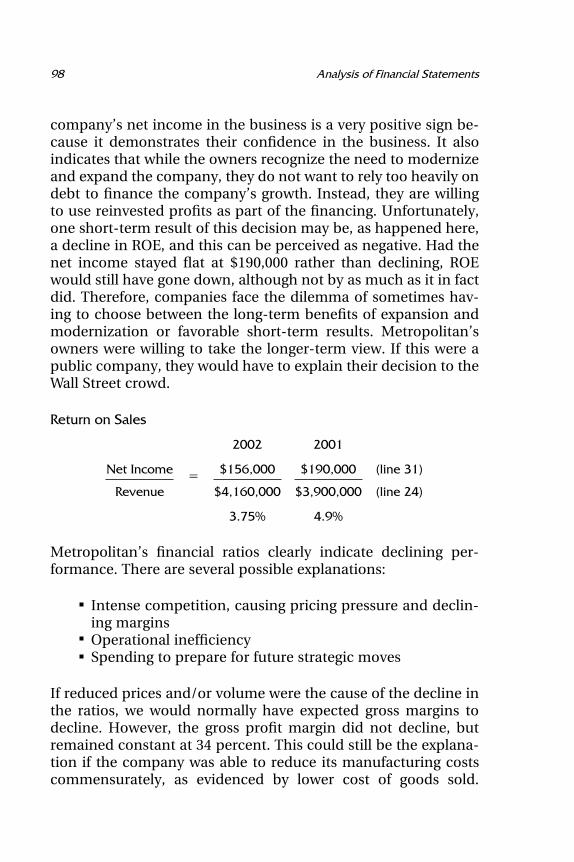
98 Analysis of Financial Statements
company’s net income in the business is a very positive sign be-cause it demonstrates their confidence in the business. It alsoindicates that while the owners recognize the need to modernizeand expand the company, they do not want to rely too heavily ondebt to finance the company’s growth. Instead, they are willingto use reinvested profits as part of the financing. Unfortunately,one short-term result of this decision may be, as happened here,a decline in ROE, and this can be perceived as negative. Had thenet income stayed flat at $190,000 rather than declining, ROEwould still have gone down, although not by as much as it in factdid. Therefore, companies face the dilemma of sometimes hav-ing to choose between the long-term benefits of expansion andmodernization or favorable short-term results. Metropolitan’sowners were willing to take the longer-term view. If this were apublic company, they would have to explain their decision to theWall Street crowd.
Return on Sales
2002 2001
Net Income $156,000 $190,000 (line 31)�
Revenue $4,160,000 $3,900,000 (line 24)
3.75% 4.9%
Metropolitan’s financial ratios clearly indicate declining per-formance. There are several possible explanations:
Intense competition, causing pricing pressure and declin-ing marginsOperational inefficiencySpending to prepare for future strategic moves
If reduced prices and/or volume were the cause of the decline inthe ratios, we would normally have expected gross margins todecline. However, the gross profit margin did not decline, butremained constant at 34 percent. This could still be the explana-tion if the company was able to reduce its manufacturing costscommensurately, as evidenced by lower cost of goods sold.
99Key Financial Ratios
Quantity discounts stemming from larger-quantity purchases ofraw materials and purchased components could have contrib-uted to maintenance of the margins. This probably did happen,since inventory levels were much higher and inventory turnoverwas lower. So perhaps the company protected its 34 percentgross margin through inventory purchases. While we considerthese issues, let’s not lose sight of the fact that revenue did in-crease between 2001 and 2002 by more than 6 percent (line 24).It would be very helpful if we knew whether the increase in reve-nue was explained by price changes, volume changes, mixchanges, new products, or a combination of these. This is criticalinformation that typical financial reports may not provide, butshould.
Notice that annual depreciation expense increased onlyslightly between 2002 and 2001 (line 28), even though the com-pany made capital expenditures amounting to $34,000 (line 41).This suggests that the capital expenditures probably involved re-placement of assets rather than expansion. If there had been anexpansion, annual depreciation expenses would have increased.
General and administrative expenses increased appreciablybetween 2001 and 2002 (line 27). The backup detail would tell uswhether this spending was an investment in the company’s fu-ture, such as expanding the sales organization or increasingspending on research, or whether it was additional spending onimportant, but less critical, added staff.
Financial Leverage Ratios
Borrowing funds to finance expansion or modernization is a verypositive strategy if the terms of the loan are not too burdensome.We certainly don’t want the interest rate to be too high. Perhapsmore important, we want the benefits of the investments to beachieved before the debt becomes due. Many companies haveexperienced financial problems because their bank debts camedue before their investment projects achieved their forecastedbenefits. In such cases, when the loans come due, the companyhas yet to generate the cash flow needed to repay them and as aresult finds itself in a very uncomfortable position. Often theterm of the loan is more critical than the actual interest rate paid.
100 Analysis of Financial Statements
If a company can achieve an after-tax return on investment of 25percent on a project that will reach fruition in three years,whether the cost of the money needed for that project is 9.0 per-cent or 9.5 percent is not going to change the decision to investin the project as long as the loan has a maturity of more thanthree years. If the financing is a one-year bank loan, the companywill not have the cash to repay it and may be forced to cut backthe project and reduce expenses at exactly the wrong time (if it isunable to refinance the loan). So, while the cost of funds is im-portant, you should focus on the repayment schedule, as well.
Debt/Equity Ratio
The debt/equity ratio measures risk from the perspective of boththe company and existing and potential lenders. The primary riskto the company is that both principal and interest payments ondebt are fixed costs. They must be paid even if the company’sbusiness and its cash flow decline. The other risk to the companyis that if its ratios decline, it may violate its loan agreements. Thismight trigger higher interest rates or, worse, calling of the loan.
Long-Term DebtStockholders’ Equity
� Debt/Equity Ratio
Short-term bank debt is also a source of risk. Repayment of thisdebt is also a fixed cost, and its due date is more immediate thanthat of long-term debt. Remember that short-term debt is due inless than one year. Some analysts redefine the debt/equity ratioto include bank debt, as follows:
Bank Debt � Long-Term DebtStockholders’ Equity
�Funded Debt
Stockholders’ Equity
Funded debt refers to funds of all maturities borrowed from fi-nancial institutions. For most manufacturing companies, a debt/equity ratio of more than 0.5 is perceived to be on the borderlineof being risky. This would not be true if the company were apublic utility or a very high-quality commercial real estate com-pany. For manufacturing or service businesses, a funded debt/
101Key Financial Ratios
equity ratio in excess of 0.6 or 0.7 to 1 is interpreted as definitelyapproaching the risky stage.
Interest Coverage
This describes the cushion that the company has between theamount of cash it generates before interest expense and taxesand the amount of interest it must pay on its debt. This marginof safety is usually prescribed by the lending institutions as acondition of making the loan. The desired coverage ratio is basedupon:
The quality of the assets used as collateral, if anyThe profitability history of the companyThe predictability of the company’s earnings
The greater the predictability and certainty of the company’searnings and the higher its growth, the lower the required inter-est coverage ratio will be. The figure used to measure the amountof cash available to pay interest expense is EBITDA.
EBITDAInterest Expense
� Interest Coverage
Sometimes the company is required to make regular paymentsof principal along with the interest. The payment of principalplus interest is called debt service. Such payments are exactly thesame as the monthly payments that individuals make to the bankon a home mortgage, which include principal as well as interest.When a company is required to do this, some analysts and fi-nancial institutions will calculate the coverage ratio to includethe principal payments with the interest. This is called debt ser-vice coverage. Still another version of this ratio also includes leasepayments on the premise that long-term leases are in fact a formof equipment financing. All of these versions are valid and help-ful. Using the same version consistently once the methodologyhas been selected is important.
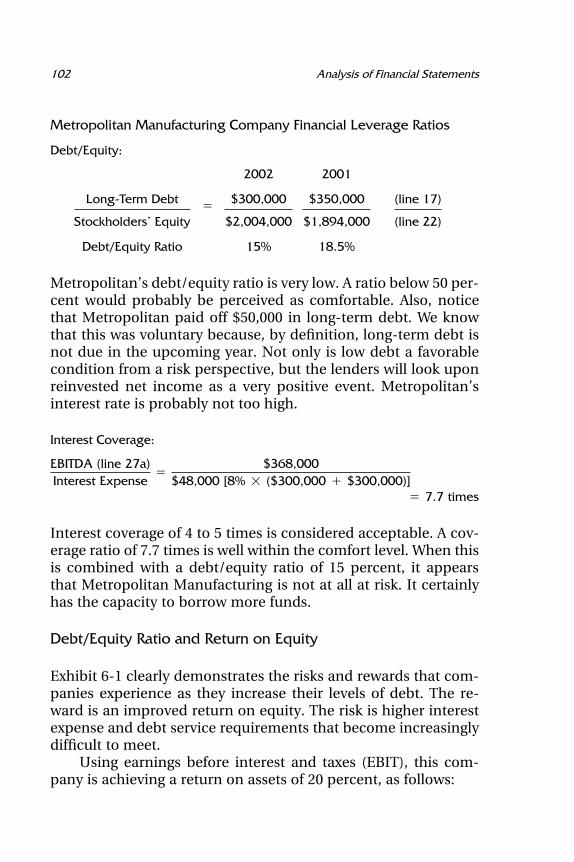
102 Analysis of Financial Statements
Metropolitan Manufacturing Company Financial Leverage Ratios
Debt/Equity:
2002 2001
Long-Term Debt $300,000 $350,000 (line 17)�
Stockholders’ Equity $2,004,000 $1,894,000 (line 22)
Debt/Equity Ratio 15% 18.5%
Metropolitan’s debt/equity ratio is very low. A ratio below 50 per-cent would probably be perceived as comfortable. Also, noticethat Metropolitan paid off $50,000 in long-term debt. We knowthat this was voluntary because, by definition, long-term debt isnot due in the upcoming year. Not only is low debt a favorablecondition from a risk perspective, but the lenders will look uponreinvested net income as a very positive event. Metropolitan’sinterest rate is probably not too high.
Interest Coverage:
EBITDA (line 27a)Interest Expense
�$368,000
$48,000 [8% � ($300,000 � $300,000)]� 7.7 times
Interest coverage of 4 to 5 times is considered acceptable. A cov-erage ratio of 7.7 times is well within the comfort level. When thisis combined with a debt/equity ratio of 15 percent, it appearsthat Metropolitan Manufacturing is not at all at risk. It certainlyhas the capacity to borrow more funds.
Debt/Equity Ratio and Return on Equity
Exhibit 6-1 clearly demonstrates the risks and rewards that com-panies experience as they increase their levels of debt. The re-ward is an improved return on equity. The risk is higher interestexpense and debt service requirements that become increasinglydifficult to meet.
Using earnings before interest and taxes (EBIT), this com-pany is achieving a return on assets of 20 percent, as follows:
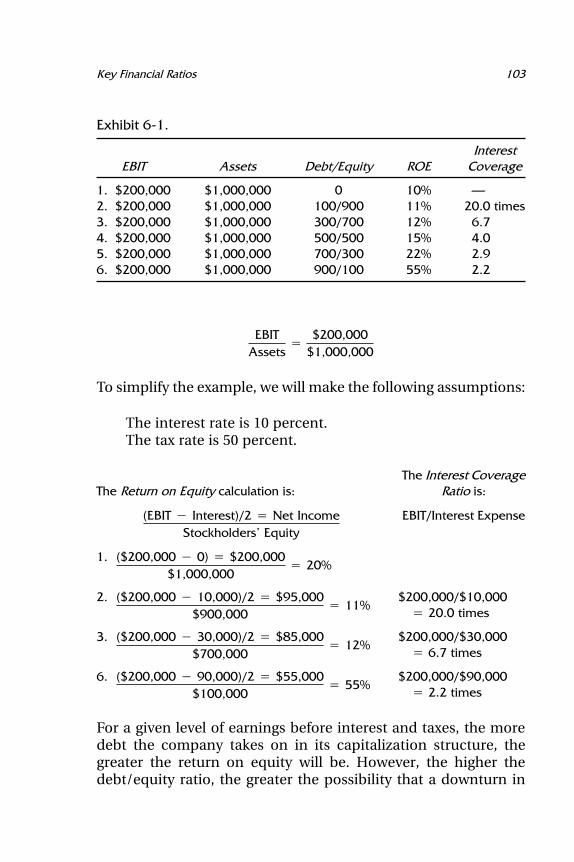
103Key Financial Ratios
Exhibit 6-1.
InterestEBIT Assets Debt/Equity ROE Coverage
1. $200,000 $1,000,000 0 10% —2. $200,000 $1,000,000 100/900 11% 20.0 times3. $200,000 $1,000,000 300/700 12% 6.74. $200,000 $1,000,000 500/500 15% 4.05. $200,000 $1,000,000 700/300 22% 2.96. $200,000 $1,000,000 900/100 55% 2.2
EBITAssets
�$200,000
$1,000,000
To simplify the example, we will make the following assumptions:
The interest rate is 10 percent.The tax rate is 50 percent.
The Interest CoverageThe Return on Equity calculation is: Ratio is:
EBIT/Interest Expense(EBIT � Interest)/2 � Net IncomeStockholders’ Equity
1. ($200,000 � 0) � $200,000$1,000,000
� 20%
2. $200,000/$10,000($200,000 � 10,000)/2 � $95,000$900,000
� 11%� 20.0 times
3. $200,000/$30,000($200,000 � 30,000)/2 � $85,000$700,000
� 12%� 6.7 times
6. $200,000/$90,000($200,000 � 90,000)/2 � $55,000$100,000
� 55%� 2.2 times
For a given level of earnings before interest and taxes, the moredebt the company takes on in its capitalization structure, thegreater the return on equity will be. However, the higher thedebt/equity ratio, the greater the possibility that a downturn in
104 Analysis of Financial Statements
earnings will leave the company unable to meet its interest pay-ment obligations. If a company with the structure shown in line1 has a severe earnings downturn, this will cause extreme unhap-piness among management (and probably shareholders). But thecompany will still continue in business. If a company with thestructure shown in line 6 experiences a similar downturn, it willprobably be in default on its loans.
Companies with very predictable, high-quality earnings canafford a high debt/equity ratio, especially if they have consider-able fixed assets to provide collateral for the loans. Economicconditions and current events aside, examples are commercialreal estate and power utilities. Start-up and Internet companiesgenerally have no earnings at all, or at best very erratic earnings.They generally do not qualify for loans from financial institu-tions.
Chapter 7
Using Return on Assets toMeasure Profit Centers
THE USE OF RETURN ON assets is extremely valuable in themanagement of profit centers. A profit center is a business entitythat is dedicated to a specific market, distribution channel, or setof customers. It has its own strategy and perhaps even its ownbusiness model, the model best suited to making that type ofbusiness successful and profitable. These profit centers may becalled strategic business units (SBUs). Each profit center has itsown balance sheet, for which the unit’s management is respon-sible.
These businesses need not be legal entities, nor do they needto have complete balance sheet responsibility. In many cases,SBUs are responsible only for the asset side of the balance sheet.The corporate parent remains responsible for the liabilities andany stockholder issues. The SBU’s mandate is to achieve a profitand to use the assets for which it is responsible with maximumeffectiveness.
The return on assets analytical model that we are going touse is called the DuPont formula. Its roots can be traced back atleast 75 years, but its age does not diminish its value. In fact, itsdurability says much for its usefulness. The formula can be foundin the archives of the DuPont Chemical Company. Like most an-alytical techniques, it was probably an adaptation of other for-mulas that existed before its time. Nothing is totally new.
105
106 Analysis of Financial Statements
Techniques and formulas evolve and are adapted over time totake advantage of newer ideas and business developments. Theformula is:
(4)(2) (5)
After-Tax Cash FlowRevenue ATCF
(ATCF)ROA � � �Assets Assets
Revenue(1) (6)
(3)
1 and 6. Assets
The profitability of any business is certainly affected by theamount of assets that are dedicated to that business. These assetsinclude cash, accounts receivable, inventory, and fixed assets.
Cash
The size of the working cash balances needed by the businessdepends on its managers’ overall ability to predict and managecash inflows and outflows. In some larger companies, the profitcenters do not manage their cash balances at all. Instead, thesebalances are consolidated at the corporate level to provide amaximum return on the cash invested.
Accounts Receivable
What are the credit terms that the SBU offers when it sells itsproducts or services to its customers? The answer to this questiondepends on the type of business the SBU is in and the competi-tive environment. The accounts receivable on the SBU’s bookswill also be affected by how well the SBU communicates thesecredit terms to its customers and how effectively it enforces thosepolicies.
Inventory
There are a multitude of issues that affect this investment, in-cluding supply chain management, how vertically integrated theoperation is, and how efficiently the operation is run.
107Using Return on Assets to Measure Profit Centers
The degree of vertical integration refers to how much of theoverall production process is done by the company itself ratherthan being outsourced. The more vertically integrated the busi-ness is, the greater the amount of the value-adding process thatis performed by the company. A vertically integrated oil companydrills for the petroleum, owns and operates the refineries, storesthe finished product, and has a major chain of retail gas stationson our nation’s highways. In contrast, there are companies thatonly own and operate retail gas stations; such a company pur-chases the gasoline it sells from outside sources—perhaps fromdistributors, but often from the fully integrated oil companies.(Yes, they may buy from their competitors.) Generally, with someexceptions, the more vertically integrated the company’s opera-tions, the more inventory investment it will have for longer peri-ods of time.
Fixed Assets
The previous discussion of vertical integration also applies to thebusiness’s investment in fixed assets. A company that is verticallyintegrated requires a tremendous investment in fixed assets andincurs significant expense for maintaining them.
The type of business the company is in and how it choosesto conduct that business will also greatly affect its investment infixed assets. A three-shift operation requires less equipment thana two- or one-shift operation producing the same amount. Thequestion, then, is: Why would a company run a one-shift opera-tion, which requires so much extra equipment, when it can oper-ate with less equipment on a three-shift basis? The answer is thatit would not unless there were other factors involved.
A three-shift operation is most applicable to a machine-driven mass-production operation where the products are thesame or similar and value-added labor input is not that critical.Examples are chemical, steel, and paper companies. A businessthat requires very highly skilled labor or that requires extensivesupervision may be most profitable in a one-shift operation.There may not be enough high-quality labor or supervision avail-able to operate around the clock. Custom-designed products re-quire considerable management attention. Also, the businesses
108 Analysis of Financial Statements
in which around-the-clock operations are desirable are oftenthose in which it is prohibitively expensive to stop the machines,and so they must run continuously. A steel furnace cannot beeconomically shut down at 5 .. and restarted the next morning.If a chemical plant were shut down, it would take weeks to cleanup the kettles before they could be restarted—and it could bedone that quickly only if the same exact mixture were being pro-duced.
A three-shift operation can be very efficient if the quality andefficiency of the product is consistent. When very highly skilledworkers are required, the efficiency and quality of the work doneon the second and third shifts might be unacceptable.
Every factor affecting the decision to have a one-, two-, orthree-shift operation will have an impact on the product’s profitmargin. It is in evaluating these factors and making this andother similar decisions that the DuPont formula is so valuable, aswe shall see.
2 and 3. Revenue
Given the assets dedicated to the profit center, how much busi-ness can it generate? The issues here include efficiency, howmuch value added is built into the product, and how much ofthe process is outsourced. Companies that outsource the totalproduction process, such as warehouse distributors, can expandtheir revenues significantly with minimal additional investmentin fixed assets. Only inventory and accounts receivable will needto be increased.
4 and 5. After-Tax Cash Flow (ATCF)
Given the revenue generated by the business (items 2 and 3),how much profit can be achieved? This is related to the type ofbusiness, economies of scale, capacity utilization, and operatingefficiencies. It is greatly affected by the degree of vertical integra-tion and value-added processes.
109Using Return on Assets to Measure Profit Centers
Return on Assets: Its Components
The return on assets ratio is really a combination of two ratios,revenue/assets and ATCF/revenue.
Revenue/assets is called asset turnover. It is conceptually thesame as inventory turnover except that it encompasses all assets.The second ratio, ATCF/revenue, is known as the margin. Multi-plying asset turnover times margin yields the return on assets.The value of the DuPont formula far exceeds that of its individualcomponents, however. Many business decisions cause the tworatios, turnover and margin, to move in opposite directions.Therefore, breaking return on assets into these two ratios notonly provides a valuable tool for measuring the performance ofthe SBU, it also gives the SBU a tool that it can use in makingdecisions.
Here are some examples:
Outsourcing improves turnover but reduces the margin, asprofit that was formerly kept in-house now must be paid to thesupplying vendor.
Vertical integration improves margins because the companykeeps the profit that is achieved at each step of the operation.However, asset turnover declines because additional equipmentwill be needed to produce the product.
Continuous 24-hour operation reduces the amount ofequipment needed; hence turnover improves. Interestingly, mar-gins may also improve because having fewer machine startupsmay improve efficiency. However, if sales don’t keep pace withthe continuous output, inventory may build up dangerously, andmargins may then deteriorate as a result of price cutting to getthe product out the door.
Using the DuPont formula helps in the two main business activi-ties:
Measuring performanceManagement decision making
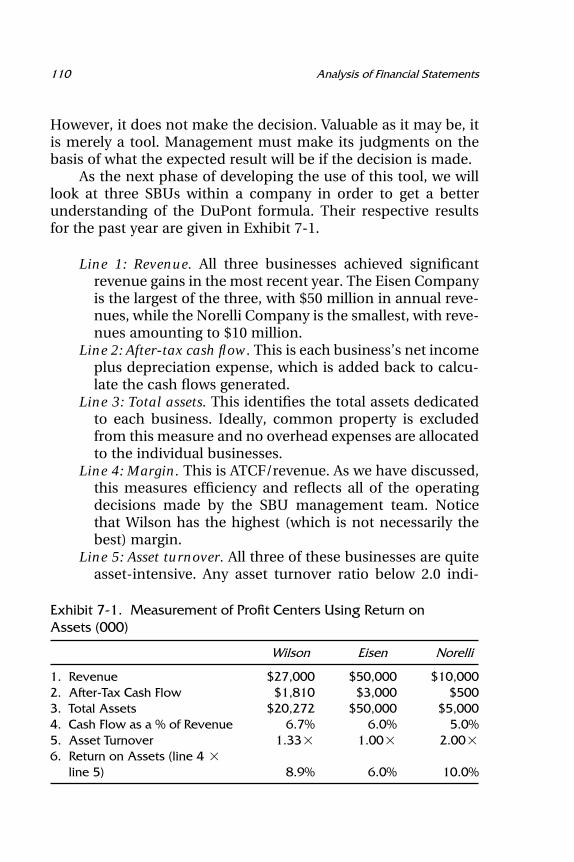
110 Analysis of Financial Statements
However, it does not make the decision. Valuable as it may be, itis merely a tool. Management must make its judgments on thebasis of what the expected result will be if the decision is made.
As the next phase of developing the use of this tool, we willlook at three SBUs within a company in order to get a betterunderstanding of the DuPont formula. Their respective resultsfor the past year are given in Exhibit 7-1.
Line 1: Revenue. All three businesses achieved significantrevenue gains in the most recent year. The Eisen Companyis the largest of the three, with $50 million in annual reve-nues, while the Norelli Company is the smallest, with reve-nues amounting to $10 million.
Line 2: After-tax cash flow. This is each business’s net incomeplus depreciation expense, which is added back to calcu-late the cash flows generated.
Line 3: Total assets. This identifies the total assets dedicatedto each business. Ideally, common property is excludedfrom this measure and no overhead expenses are allocatedto the individual businesses.
Line 4: Margin. This is ATCF/revenue. As we have discussed,this measures efficiency and reflects all of the operatingdecisions made by the SBU management team. Noticethat Wilson has the highest (which is not necessarily thebest) margin.
Line 5: Asset turnover. All three of these businesses are quiteasset-intensive. Any asset turnover ratio below 2.0 indi-
Exhibit 7-1. Measurement of Profit Centers Using Return onAssets (000)
Wilson Eisen Norelli
1. Revenue $27,000 $50,000 $10,0002. After-Tax Cash Flow $1,810 $3,000 $5003. Total Assets $20,272 $50,000 $5,0004. Cash Flow as a % of Revenue 6.7% 6.0% 5.0%5. Asset Turnover 1.33� 1.00� 2.00�6. Return on Assets (line 4 �
line 5) 8.9% 6.0% 10.0%
111Using Return on Assets to Measure Profit Centers
cates a considerable investment in assets relative to theamount of revenue earned with those assets.
Line 6: Return on assets. This is line 4 � line 5. It can also becalculated by dividing line 2 by line 3. Wilson has the high-est margin (line 4) and an asset turnover of 1.33. Its assetintensiveness is compensated for by the higher margin.
Corporate management now has a tool that it can use toevaluate the performance of these three SBUs. The SBU manage-ment teams also have a decision-making tool. The consistent useof this tool provides both clear measurement and an understand-ing of whether decisions will improve the performance of thecompany.
Let us be very clear that we are not trying to compare thethree SBUs with each other. We do not know what businessesthey are in or even if they are in related industries. Eisen Com-pany’s performance within its industry may be superior to Nore-lli Company’s performance within its industry. The corporateteam, however, may use these measures in deciding how muchmoney to allocate to each company in the future.
There are many adaptations of the ROA formula. They areconceptually the same. Here are some of them:
Return on capital employed (ROCE)Return on invested capital (ROIC)Return on assets managed (ROAM)Return on net assets (RONA)
In Exhibit 7-1, after-tax cash flow was used. Net income wouldhave been almost as good. Operating income is often used as themeasure of achievement. This is helpful if corporate manage-ment wants to remove interest expense and taxes from the equa-tion. The premise is that SBUs are not responsible for debtfinancing or corporate income taxes. Therefore, their measure-ment should not include these corporate expenses. Gross profitis a very useful measure when individual products or productlines are being analyzed as profit centers. Some companies andanalysts use EBITDA as the measure of operating performance.This is a pretax cash flow number that recognizes that financing
112 Analysis of Financial Statements
and taxes are issues to be dealt with at the corporate level, not bythe SBU.
Sales Territories
The DuPont formula can also be applied to the management ofsales territories within a profit center. It gives each sales teamthe opportunity to make certain decisions in response to specificcompetitive pressures. It allows for dissimilarities of strategy ifthis is appropriate. Company policies that limit the decisions thatthe SBUs may make can be developed in order to protect thecompany. Within these limits, each sales team remains totallyaccountable for its decisions and performance. A financial re-lationship is created between the sales organization and themanufacturing operation. In this example, there are three salesterritories and one manufacturing entity. To keep the examplesimple, it is a one-product business. Exhibit 7-2 shows the actualresults for a recent year.
1. Actual revenue results are reported.2. Within guidelines set by the company, each territory pur-
chases what it believes it will need. Customer service is-sues and the size and logistics of the territory have a greatimpact on that decision
The sales territories ‘‘purchase’’ the product from thefactory for a predetermined price of $1.00 per unit. Thisis a market-oriented price that provides the factory witha profit.
3. The gross profit is reported. Although each territory paidthe same purchase price of $1.00 (line 2), the sellingprices are different, and therefore the gross profit per-centages are different. The West territory probably sellslarger quantities per order, resulting in lower prices andtherefore lower margins. Central has higher margins thanthe other two territories. This may be explained by supe-rior performance, less competition, or a combination ofthese factors.
4. Territory management expends the funds that it feels arenecessary to sell to and service the marketplace. North
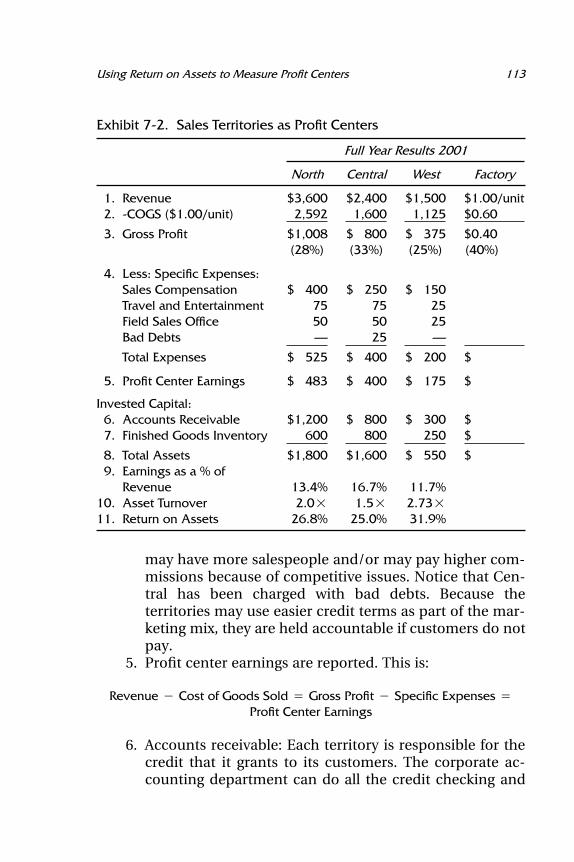
113Using Return on Assets to Measure Profit Centers
Exhibit 7-2. Sales Territories as Profit Centers
Full Year Results 2001
North Central West Factory
1. Revenue $3,600 $2,400 $1,500 $1.00/unit2. -COGS ($1.00/unit) 2,592 1,600 1,125 $0.60
3. Gross Profit $1,008 $ 800 $ 375 $0.40(28%) (33%) (25%) (40%)
4. Less: Specific Expenses:Sales Compensation $ 400 $ 250 $ 150Travel and Entertainment 75 75 25Field Sales Office 50 50 25Bad Debts — 25 —
Total Expenses $ 525 $ 400 $ 200 $
5. Profit Center Earnings $ 483 $ 400 $ 175 $
Invested Capital:6. Accounts Receivable $1,200 $ 800 $ 300 $7. Finished Goods Inventory 600 800 250 $
8. Total Assets $1,800 $1,600 $ 550 $9. Earnings as a % of
Revenue 13.4% 16.7% 11.7%10. Asset Turnover 2.0� 1.5� 2.73�11. Return on Assets 26.8% 25.0% 31.9%
may have more salespeople and/or may pay higher com-missions because of competitive issues. Notice that Cen-tral has been charged with bad debts. Because theterritories may use easier credit terms as part of the mar-keting mix, they are held accountable if customers do notpay.
5. Profit center earnings are reported. This is:
Revenue � Cost of Goods Sold � Gross Profit � Specific Expenses �Profit Center Earnings
6. Accounts receivable: Each territory is responsible for thecredit that it grants to its customers. The corporate ac-counting department can do all the credit checking and
114 Analysis of Financial Statements
administration, but the territory makes the final decisionabout a potential customer’s creditworthiness, subject tosome debate. Therefore, the territory is held accountable.
7. Inventory: Based upon their sales forecasts, territoriesorder product from the factory. The sales territories areresponsible for their forecasts. The inventory that theyhave on their books is a combination of products thatthey did not sell and products that they want availablefor fast delivery. Territories must determine the inventorylevel that they must maintain in order to keep their abilityto deliver competitive. They are each responsible for thisstrategy.
This approach does not require sales territories tophysically manage the product in the warehouse. It does,however, hold them accountable for the levels and mix ofinventory that are maintained on their behalf.
8. Total assets: The working capital (accounts receivable �inventory) managed by the territory.
What is provided here is:
A clear measure of achievementStrategies that are appropriate for each marketplaceLimitations on extremes to protect the companyAccountability for those resources used by each SBU thatare identified as being competitively desirable
Using the DuPont formula, achievement and accountability cannow be measured. Management teams have a decision-makingtool that can really help them.
9. Margin: Earnings as a Percentage of Revenue (Line 5/Line 1)
10. Turnover: Revenue/Assets (Line 1/Line 8)11. Return on Assets: Earnings/Assets (Line 9 � Line 10 or
Line 5/Line 8)
The West territory has the highest return on assets, 31.9 per-cent. While its margins are lower than those of the other territor-
115Using Return on Assets to Measure Profit Centers
ies, its investment in accounts receivables and inventory is verylow. However, while West has a higher ROA, we cannot be surethat it is ‘‘better’’ than the others. There are other issues thatneed to be considered, including: What is the current marketshare and potential in each territory? Is North more successful ina very competitive marketplace, while there is less competitionin West’s marketplace? The DuPont formula is clearly a valuableprofit-oriented resource. It can be a key tool for intelligent salesmanagement.
Notice that the factory is also a profit center. It sells to thesales territories at a predetermined, market-oriented price, sothat it is given credit or held accountable for positive or negativeefficiencies. The factory is responsible for its own assets and ismeasured as an SBU by margin, turnover, and return on assets.It is accountable for its own inventory so that production runscan be planned to maximize its efficiency.
Chapter 8
Overhead Allocations
CORPORATIONS ARE REQUIRED BY GENERALLY accepted ac-counting principles to allocate (mathematically distribute or ap-portion) their overhead expenses to individual profit centerswhen they prepare information for the Internal Revenue Service(absorption accounting in LIFO/FIFO calculations), the Securi-ties and Exchange Commission, and certain industry-specificregulatory authorities. There are numerous criteria that may beused as the basis for this calculation, including revenue, directcost, units produced, direct labor dollars or hours, and squarefootage consumed.
It is presumed, incorrectly, that the methodology that mustbe used for regulatory compliance is also appropriate for intelli-gent management decision making. Nothing could be fartherfrom the truth.
Problems That Arise from Allocation
The process of allocating overhead charges to individual busi-nesses can lead to several problems within a company.
It Fosters Politics
The process of allocating overhead charges to individual busi-nesses fosters political infighting. When an executive shines as a
116

117Overhead Allocations
result of her contribution to the profitability of the business, thisis a positive result. However, when costs are allocated, a managerwho knows how to manipulate the allocation methodology canmake his department’s performance look better by gettingcharges assigned to other operating units. When one profit cen-ter looks good at the expense of another, without the companybenefiting at all, that’s politics.
It Inhibits New Product Introductions
Accounting methodology assigns a portion of the existing over-head to each new product when analyzing its profitability. Thisinflates the cost of the new product and causes the estimate ofits contribution to profit to be severely understated. The analysisof a new product should include only costs that are incrementalfor that new product. Existing overhead that is not affectedshould not be included.
It Understates the Profitability of Business Beyond BudgetedVolume
Overhead allocations are assigned to all products, regardless ofvolume. When sales surpass budgeted expectations, the account-ing department will continue to charge these allocations to theindividual products even though the company has already gener-ated enough business to cover the actual corporate overhead.These fictitious charges will continue to be added until the end ofthe year. This leads to a significant understatement of the actualprofits of each business that has had sales above the budgetednumber and may cause the company to underreward unit man-agers who surpass their sales budgets.
It Inhibits Marketplace Aggressiveness
Incremental business is really more profitable than the account-ing information reveals. Larger customer orders permit longerproduction runs and more efficient raw material purchasing. Tra-ditional accounting information does not recognize this.
The ability to give price breaks on larger orders (volume dis-
118 Analysis of Financial Statements
counting) because of these advantages cannot be recognized be-cause overhead charges are assigned to all products.
It Overstates Savings from Eliminating ‘‘Marginal’’ Products
A company should never eliminate products from its mix exceptunder the following circumstances:
1. The product achieves a negative contribution margin,and there is no opportunity to correct this situation.
2. The product is a quality disaster that will impair market-place perceptions of the entire business.
3. The company is near capacity and needs the space andmachine time for more profitable offerings.
Eliminating a product with a positive cash flow results in theloss of that cash flow. Why is there confusion about this? Becauseour accounting systems tell us that eliminating a product willsave the variable labor costs and the corresponding overhead as-signed to the product. Labor costs, as anyone who has ever man-aged a factory will tell you, are more fixed than variable. Theywill not be reduced appreciably, if at all, when volume declines.And overhead will not be reduced because the building does notget smaller, nor do the staff departments (including accounting).
What About the IRS and GAAP?
Companies should continue to comply with their accounting re-sponsibilities. Nothing that we are advocating here addressesregulatory issues at all. We are simply arguing that marketing andoperating managers should receive the product and performanceinformation that they need in order to make intelligent businessdecisions and judgments.
Effect on Profit of Different Allocation Methods
To explore these issues, let’s look at a company with three profitcenters.
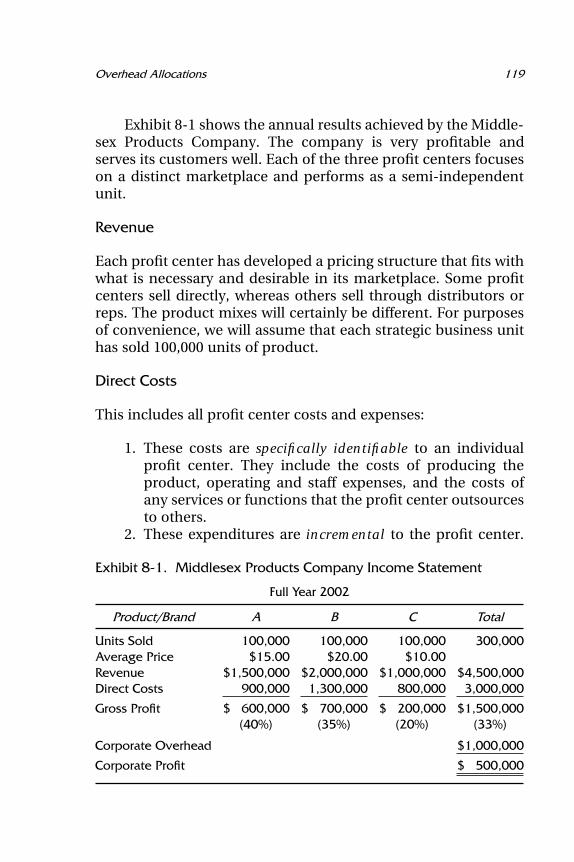
119Overhead Allocations
Exhibit 8-1 shows the annual results achieved by the Middle-sex Products Company. The company is very profitable andserves its customers well. Each of the three profit centers focuseson a distinct marketplace and performs as a semi-independentunit.
Revenue
Each profit center has developed a pricing structure that fits withwhat is necessary and desirable in its marketplace. Some profitcenters sell directly, whereas others sell through distributors orreps. The product mixes will certainly be different. For purposesof convenience, we will assume that each strategic business unithas sold 100,000 units of product.
Direct Costs
This includes all profit center costs and expenses:
1. These costs are specifically identifiable to an individualprofit center. They include the costs of producing theproduct, operating and staff expenses, and the costs ofany services or functions that the profit center outsourcesto others.
2. These expenditures are incremental to the profit center.
Exhibit 8-1. Middlesex Products Company Income Statement
Full Year 2002
Product/Brand A B C Total
Units Sold 100,000 100,000 100,000 300,000Average Price $15.00 $20.00 $10.00Revenue $1,500,000 $2,000,000 $1,000,000 $4,500,000Direct Costs 900,000 1,300,000 800,000 3,000,000
Gross Profit $ 600,000 $ 700,000 $ 200,000 $1,500,000(40%) (35%) (20%) (33%)
Corporate Overhead $1,000,000
Corporate Profit $ 500,000
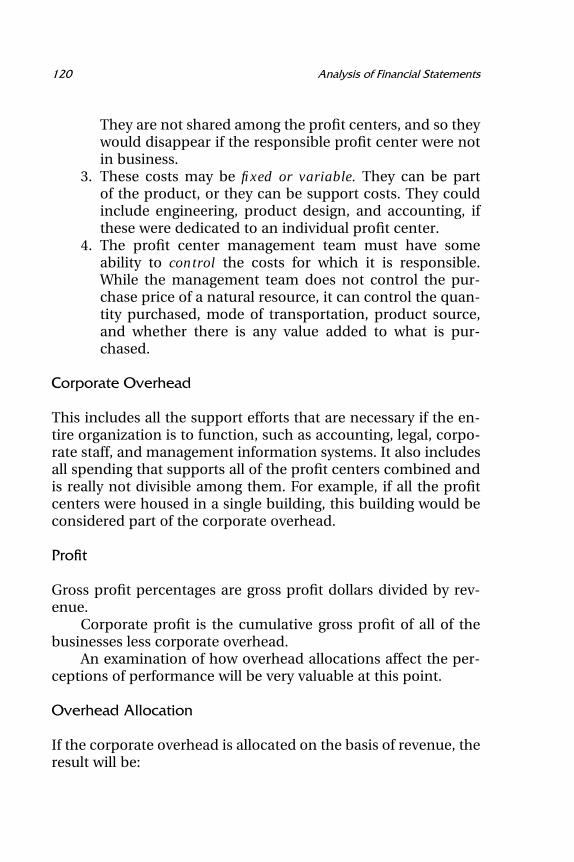
120 Analysis of Financial Statements
They are not shared among the profit centers, and so theywould disappear if the responsible profit center were notin business.
3. These costs may be fixed or variable. They can be partof the product, or they can be support costs. They couldinclude engineering, product design, and accounting, ifthese were dedicated to an individual profit center.
4. The profit center management team must have someability to control the costs for which it is responsible.While the management team does not control the pur-chase price of a natural resource, it can control the quan-tity purchased, mode of transportation, product source,and whether there is any value added to what is pur-chased.
Corporate Overhead
This includes all the support efforts that are necessary if the en-tire organization is to function, such as accounting, legal, corpo-rate staff, and management information systems. It also includesall spending that supports all of the profit centers combined andis really not divisible among them. For example, if all the profitcenters were housed in a single building, this building would beconsidered part of the corporate overhead.
Profit
Gross profit percentages are gross profit dollars divided by rev-enue.
Corporate profit is the cumulative gross profit of all of thebusinesses less corporate overhead.
An examination of how overhead allocations affect the per-ceptions of performance will be very valuable at this point.
Overhead Allocation
If the corporate overhead is allocated on the basis of revenue, theresult will be:
121Overhead Allocations
A B C Total
Gross Profit $600,000 $700,000 $200,000 $1,500,000Overhead 333,000 444,000 223,000 1,000,000
‘‘Profit’’ $267,000 $256,000 ($ 23,000) $ 500,000
Because Profit Center A provided one-third of corporate rev-enue, it is charged for the same proportion of the corporate over-head. Remember that these corporate charges are not basedupon the services that each profit center receives. The amountsallocated support the entire organization collectively.
Notice that on this basis, Profit Center C is losing money.This profit center contributed $200,000 to pay for corporate over-head and achieve corporate profit. It now must revise its strategyto eliminate losses that it neither caused nor can control. A moredamaging result is the feeling on the part of company manage-ment that this unit will never be ‘‘profitable’’ and therefore mustbe eliminated.
If the allocation is based on units sold, Profit Center C willlook even worse:
A B C Total
Gross Profit $600,000 $700,000 $ 200,000 $1,500,000Overhead 333,000 333,000 334,000 1,000,000
‘‘Profit‘‘ $267,000 $367,000 ($134,000) $ 500,000
‘‘Turning around’’ Profit Center C is clearly impossible. Whileremedies for its problems will be proposed, its days are clearlynumbered.
If corporate allocations are based upon direct labor (whichis part of direct costs), all three of the profit centers will beprofitable, as follows:
A B C Total
Gross Profit $600,000 $700,000 $200,000 $1,500,000Overhead 450,000 400,000 150,000 $1,000,000
‘‘Profit’’ $150,000 $300,000 $ 50,000 $ 500,000
122 Analysis of Financial Statements
With this method of allocation, all three profit centers haveachieved a ‘‘profit.’’
Which method is correct? Is Profit Center C profitable or not?The answer depends upon which method of allocation happenedto be selected by the accounting department. All are acceptablein terms of GAAP requirements. The accounting department willstudy the company’s operations and attempt to select themethod or formula that it perceives as being most accurate.However, the results will be the same: Decisions will be basedupon the statistical method selected. Will these decisions im-prove the business, as many expect they will? Let’s look at someof those decisions and focus on what solutions would be in thebest interests of the Middlesex Products Company.
1. Are all profit centers contributing to the profitability of thebusiness?
Absolutely yes. Each of the three has a positive contribution mar-gin. Each is more than covering all of the costs and expensesassociated with its individual business.
2. How should Middlesex management respond to excessive cor-porate overhead?
Not by passing it on to the profit centers and asking them tofigure out a way of paying for it. The best strategy for eliminatingexcessive overhead is to hold those departments accountable fortheir own performance and reduce their budgets and/or expectthem to increase their achievement. Allocating excessive spend-ing to operating units does not solve the problem. Instead, it asksthe profit center teams to solve problems that they did not createand cannot control. Increasing prices and compromising onproduct quality to compensate for others’ inefficiencies are rem-edies that are no longer available.
3. In which businesses should Middlesex management expect im-proved profitability?
Why not all of them? We do not know, however, if each of theprofit centers can improve its profitability to the same degree.Perhaps 20 percent profit growth would be very easy for Profit
123Overhead Allocations
Center B but absolutely impossible for Profit Center C. A 20 per-cent gross profit in Profit Center C’s market might be relativelybetter performance than 40 percent in Profit Center A’s market.We would have to benchmark each profit center against its re-spective competitors to determine what are feasible expecta-tions. Achievement must be evaluated against potential.
4. In theory, what would be the most favorable product mix?
If Profit Center A achieves a gross profit of $6.00 per unit($600,000/100,000 units) and Profit Center C achieves $2.00 perunit, expanding Profit Center A‘s business at the expense of ProfitCenter C would improve gross profit by $4.00 per unit (the grossprofit differential). Keeping these numbers real simple, the rank-ing of these profit centers by gross profit dollars is:
Profit Center B: $7.00 per unitProfit Center A: $6.00 per unitProfit Center C: $2.00 per unit
However, if you rank the profit centers by gross profit percent-age, the ranking changes:
Profit Center A: 40 percentProfit Center B: 35 percentProfit Center C: 20 percent
If you check your company’s financial statements, you will noticethat in most cases, accountants rank product profitability by per-centages, although it is their dollar impact that is most critical.
5. Profit Center C has a gross profit percentage that is below theaverage for the entire Middlesex Products organization. Shouldthat be a cause for divestment?
Middlesex Products Company should never eliminate a businesswith a positive gross profit unless:
a. The lower quality of its products is damaging the otherbusinesses.
124 Analysis of Financial Statements
b. Productive capacity is limited and can be used for moreprofitable businesses.
c. Supporting it requires too much, less profitable invest-ment.
6. If these three businesses are all profitable, why make choices atall?
We do not have to make choices among these businesses if:a. There is adequate capacity to allow all of them to grow.b. The company can afford to provide sufficient financing to
permit all of them to prosper.c. The ROI for this funding exceeds the company’s dis-
counted cash flow hurdle rate (see Chapter 10).
If the answer is no for any of these three parameters, thenproduct mix choices should be made soon. These becomestrategic issues with long-term answers. Perhaps one ofthe profit centers should be sold to finance the others.The profit center with the most promising future shouldbe financed by the cash flow generated by the more ma-ture businesses.
7. How do we evaluate the profitability of a proposed new busi-ness?
Middlesex Products Company is considering the addition ofProduct D. The annual forecast for this new business is as fol-lows:
Annual Sales 100,000 unitsPrice $4.00 per unitDirect Cost $3.00 per unitIncremental Gross Profit $1.00 per unit
Capacity is more than sufficient to allow this product and theother three to grow for the foreseeable future. Product D is a verygood product that has tested well. There might be some cross-selling and other synergistic benefits with the other businesses,but these have not been included.
125Overhead Allocations
a. If Middlesex measures product profitability by grossprofit percentage, the proposal for Product D will be re-jected.
CompanyAverage Product D
Price $15.00 $4.00Direct Cost 10.00 3.00
Gross Profit $5.00 $1.00
Gross Profit % 33% 25%
The gross profit percentage for Product D is below thatfor the company as a whole. Therefore, Product D willbring down the average.
Prioritizing products by their gross profit percentagemay be helpful if the company is near full productive ca-pacity and outsourcing opportunities are not available.Otherwise, Product D will bring down the average and notbe acceptable.
b. If the company allocates nonincremental overhead anddoes so on the basis of units, the proposal to add ProductD will be rejected.
Product D Forecast:
Revenue $400,000Direct Cost 300,000
Gross Profit $100,000
The company overhead of $1,000,000 will now be reallo-cated as follows:
Corporate Overhead $1,000,000Units Sold (including D) 400,000Overhead per Unit $2.50Charge to Product D $250,000Projected ‘‘Loss’’ on
Product D $150,000 ($100,000 � $250,000)

126 Analysis of Financial Statements
c. If Middlesex Products Company is most concerned aboutthe cash flow that will be generated by its decisions, theproposal to introduce Product D will be approved.
Company CompanyWithout With
Product D Product D Product D
Units 300,000 100,000 400,000Revenue $4,500,000 $400,000 $4,900,000Direct Cost 3,000,000 300,000 3,300,000
Gross Profit $1,500,000 $100,000 $1,600,000Corporate Overhead $1,000,000 — $1,000,000
Corporate Profit $ 500,000 $100,000 $ 600,000
Implementing Product D will increase corporate profit from$500,000 to $600,000. Notice that a 10 percent increase in reve-nue results in a 20 percent increase in bottom-line profitability.This is true even though Product D has a gross margin percent-age below the corporate average.
When Middlesex Products Company is reporting its results toothers, adhering to generally accepted accounting principles isboth required and desirable. It promotes uniformity and integrityof the numbers. This is especially helpful to bankers, security an-alysts, and others who rely on the company reports they receive.However, the decisions that will improve the performance andfinancial health of the company are those that improve its cashflow. The methodologies that are best for achieving this objectiveare different from but not necessarily inconsistent with GAAP.These issues should be explored in your company.
Part 3
DECISION MAKING FOR
IMPROVED PROFITABILITY

This Page Intentionally Left Blank
Chapter 9
Analysis of BusinessProfitability
THE DISCUSSION IN THIS CHAPTER will focus on the factorsthat determine the profitability of individual products and helpus to improve the decisions that we make concerning these prod-ucts. We will measure and evaluate the factors that determine theprofitability of a product, including:
Product priceUnit volume soldCosts, both fixed and variableProfitability
The financial tool used to achieve these goals is called breakevenanalysis.
We begin our discussion by looking at the operating budgetfor Raritan Manufacturing Company, which is presented in Ex-hibit 9-1. Raritan has established revenue, spending, and profittargets. Note that the costs are broken down by major categoriesand also separated into their fixed and variable components.Identifying which costs are fixed and which are variable is veryvaluable for effective decision making. To keep the calculationssimple, we will assume that Raritan Manufacturing Company isa one-product business. All of the basic principles of this analysisare equally valid for a multiproduct business. Most of these prin-
129
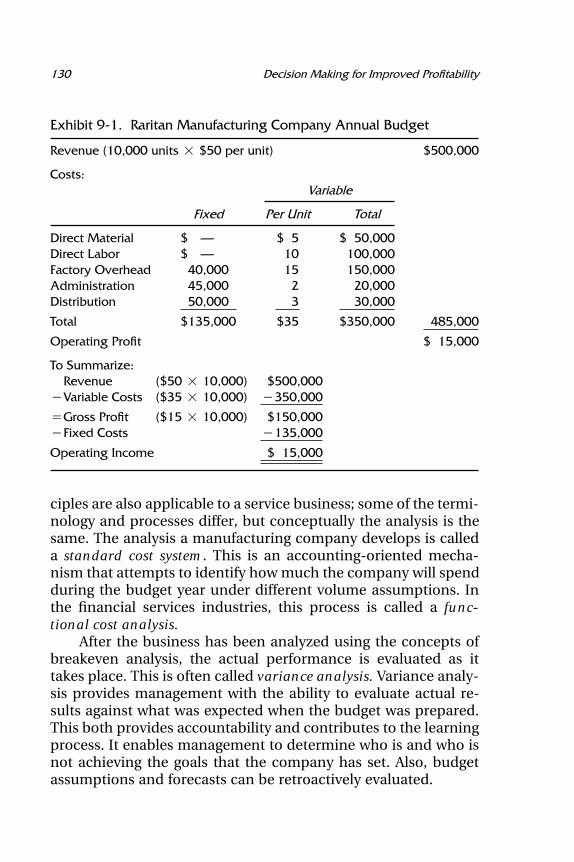
130 Decision Making for Improved Profitability
Exhibit 9-1. Raritan Manufacturing Company Annual Budget
Revenue (10,000 units � $50 per unit) $500,000
Costs:Variable
Fixed Per Unit Total
Direct Material $ — $ 5 $ 50,000Direct Labor $ — 10 100,000Factory Overhead 40,000 15 150,000Administration 45,000 2 20,000Distribution 50,000 3 30,000
Total $135,000 $35 $350,000 485,000
Operating Profit $ 15,000
To Summarize:Revenue ($50 � 10,000) $500,000
�Variable Costs ($35 � 10,000) �350,000
�Gross Profit ($15 � 10,000) $150,000�Fixed Costs �135,000
Operating Income $ 15,000
ciples are also applicable to a service business; some of the termi-nology and processes differ, but conceptually the analysis is thesame. The analysis a manufacturing company develops is calleda standard cost system. This is an accounting-oriented mecha-nism that attempts to identify how much the company will spendduring the budget year under different volume assumptions. Inthe financial services industries, this process is called a func-tional cost analysis.
After the business has been analyzed using the concepts ofbreakeven analysis, the actual performance is evaluated as ittakes place. This is often called variance analysis. Variance analy-sis provides management with the ability to evaluate actual re-sults against what was expected when the budget was prepared.This both provides accountability and contributes to the learningprocess. It enables management to determine who is and who isnot achieving the goals that the company has set. Also, budgetassumptions and forecasts can be retroactively evaluated.
131Analysis of Business Profitability
Chart of Accounts
Almost every company has a numerically based accounting sys-tem that assigns a series of code numbers to every department.This is very helpful for analytical purposes and is also necessaryto comply with generally accepted accounting principles (GAAP).This system ensures that all similar expenses are recorded in thesame manner. When accounting transactions are added up at theend of the month and year, the company can be confident thatall direct labor has been recorded in one account, all travel ex-penses in another, and so on for trade shows, advertising, andevery other expense. There is no other mechanism that will helpus determine how much is actually being spent in each category,which is certainly necessary information. Also, one of the GAAPrequirements is consistency. The chart of accounts provides thatas well. Note that the five categories in Raritan ManufacturingCompany’s budget are summaries of perhaps one or two hun-dred cost and expense codes. And they are only examples. Yourcompany will probably use different categories and may even usedifferent terminology.
Once the chart of accounts is established, the accountantswill examine each and every individual cost category in order toattempt to determine whether the cost is fixed or variable. Theywill often reach simplifying conclusions.
Fixed Costs
Fixed costs are costs that will be the same regardless of the vol-ume produced. They are regular and recurring. The amountspent will not change if volume increases or decreases duringa given period of time. Costs included in the category are staffexpenses, administration, rent, machinery repair, and manage-ment salaries. Note that just because a cost is identified as fixeddoes not mean that it does not change. Rent can change, as cansalaries, employee benefits, and even advertising. These are fixedcosts because the amount spent is not volume-driven, althoughit may be volume-motivated. Advertising and trade shows createrevenue, presumably. If this is true, then perhaps a forecast of
132 Decision Making for Improved Profitability
weak sales should lead to an increase in these marketing invest-ments. Telephone and travel are examples of other expenses thatmay increase when business is soft. Customers may be called andvisited more frequently.
Variable Costs
These costs are volume-driven. They will increase or decrease inresponse to changes in production and distribution volume.Some of the costs in this category are direct labor (productionlabor), materials (components of the product), and certain ad-ministrative and distribution costs.
Development of Fixed-Cost Estimate
It is estimated that during the budget year, Raritan Manufactur-ing Company will spend a total of $135,000 in costs that are iden-tified as fixed. This includes:
Factory Overhead $40,000Administration 45,000Distribution 50,000
Total Estimated Fixed Costs $135,000
Development of Variable-Cost Estimates
Estimates of variable costs are developed with the help of manu-facturing and engineering analyses of the production facility andadministrative departments. Each of the per-unit costs is thenmultiplied by the expected number of units to determine the es-timates of variable costs, by category and in total. This is de-scribed as follows:
Material estimates are based upon engineering specifica-tions, some analysis of production efficiencies, and product mix.Levels of waste and quality rejects are based upon past experi-
133Analysis of Business Profitability
ence, subject to hoped-for and engineered improvements. Afterconsultation with manufacturing staff and, preferably, the peoplewho actually build the product, it is estimated that the materialcost per unit will be:
$5.00 � budgeted 10,000 units � $50,000 materials budget
Direct labor is a very complex cost to estimate. Total expendituresin this area may be affected by:
The use of manual labor versus technology in productionOutsourcing versus internal manufacture/assemblyEfficiencyNumber of shifts plannedEmployee training and turnoverForecast length of production runsWhether the product is market-driven (made to order) orproduction-drivenPlanned overtime and weekend shiftsPremium pay agreements
Other Expenses
The expenses other than direct materials and direct labor—factory overhead, administration, and distribution—have bothfixed and variable components. The basic premise of the ac-counting department and others is that while a portion of theseexpenses is fixed, the balance will increase or decrease along withthe volume experienced by the company.
There is serious controversy concerning this conclusion, es-pecially during any individual budget year, when the managersresponsible would argue that their costs are essentially fixed. Theaccounting department would not increase or decrease the num-ber of its own people on a week-to-week basis depending on thenumber of invoices that have to be sent out. Trucks must covertheir delivery routes whether they are completely or partially full.Managers should examine the standards used by their companyand evaluate whether the behavior assumed by the cost systemreflects their perception of how their costs really behave.
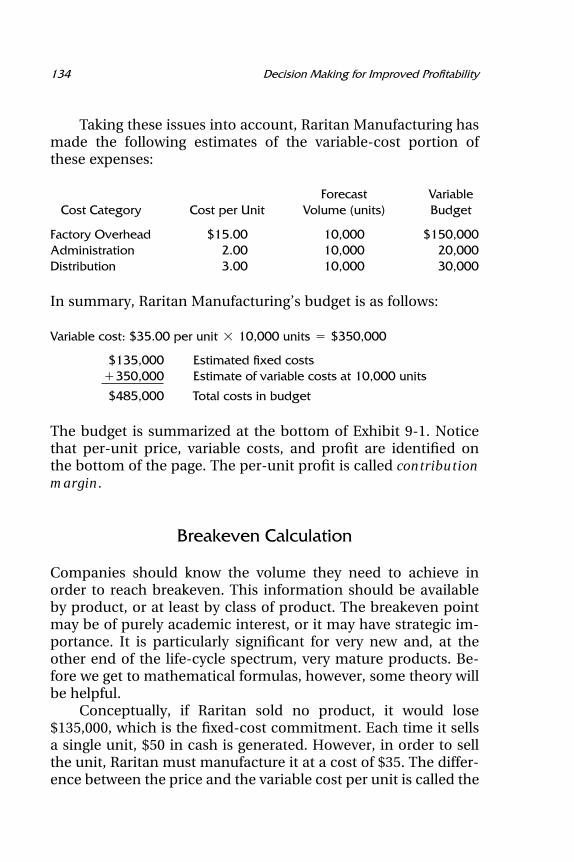
134 Decision Making for Improved Profitability
Taking these issues into account, Raritan Manufacturing hasmade the following estimates of the variable-cost portion ofthese expenses:
Forecast VariableCost Category Cost per Unit Volume (units) Budget
Factory Overhead $15.00 10,000 $150,000Administration 2.00 10,000 20,000Distribution 3.00 10,000 30,000
In summary, Raritan Manufacturing’s budget is as follows:
Variable cost: $35.00 per unit � 10,000 units � $350,000
$135,000 Estimated fixed costs�350,000 Estimate of variable costs at 10,000 units
$485,000 Total costs in budget
The budget is summarized at the bottom of Exhibit 9-1. Noticethat per-unit price, variable costs, and profit are identified onthe bottom of the page. The per-unit profit is called contributionmargin.
Breakeven Calculation
Companies should know the volume they need to achieve inorder to reach breakeven. This information should be availableby product, or at least by class of product. The breakeven pointmay be of purely academic interest, or it may have strategic im-portance. It is particularly significant for very new and, at theother end of the life-cycle spectrum, very mature products. Be-fore we get to mathematical formulas, however, some theory willbe helpful.
Conceptually, if Raritan sold no product, it would lose$135,000, which is the fixed-cost commitment. Each time it sellsa single unit, $50 in cash is generated. However, in order to sellthe unit, Raritan must manufacture it at a cost of $35. The differ-ence between the price and the variable cost per unit is called the
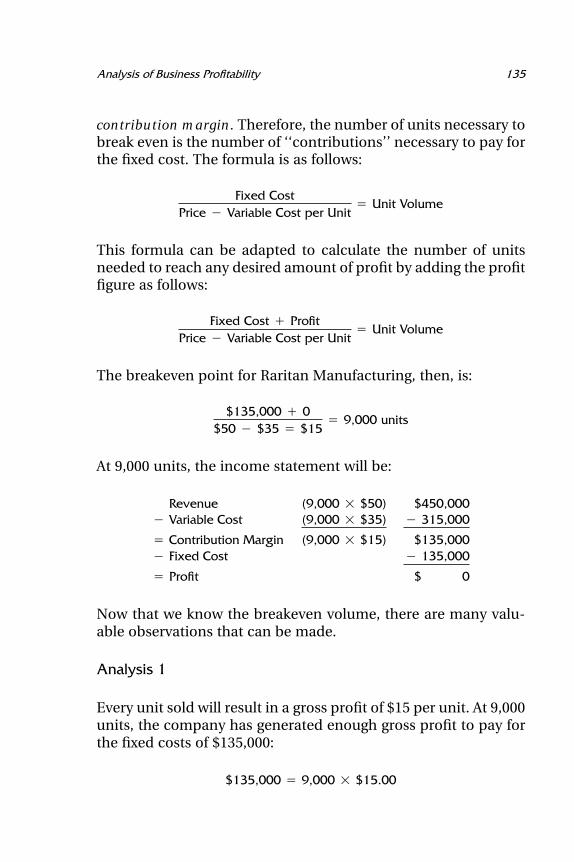
135Analysis of Business Profitability
contribution margin. Therefore, the number of units necessary tobreak even is the number of ‘‘contributions’’ necessary to pay forthe fixed cost. The formula is as follows:
Fixed CostPrice � Variable Cost per Unit
� Unit Volume
This formula can be adapted to calculate the number of unitsneeded to reach any desired amount of profit by adding the profitfigure as follows:
Fixed Cost � ProfitPrice � Variable Cost per Unit
� Unit Volume
The breakeven point for Raritan Manufacturing, then, is:
$135,000 � 0$50 � $35 � $15
� 9,000 units
At 9,000 units, the income statement will be:
Revenue (9,000 � $50) $450,000� Variable Cost (9,000 � $35) � 315,000
� Contribution Margin (9,000 � $15) $135,000� Fixed Cost � 135,000
� Profit $ 0
Now that we know the breakeven volume, there are many valu-able observations that can be made.
Analysis 1
Every unit sold will result in a gross profit of $15 per unit. At 9,000units, the company has generated enough gross profit to pay forthe fixed costs of $135,000:
$135,000 � 9,000 � $15.00
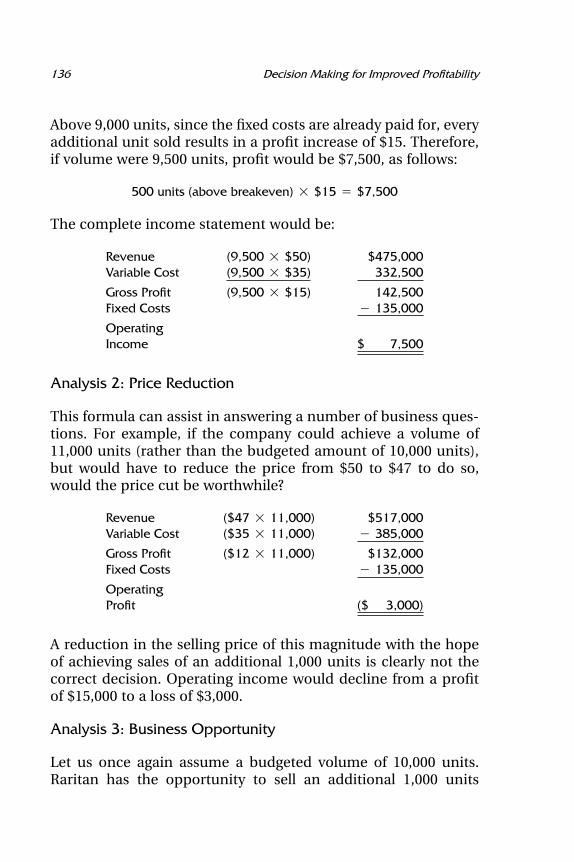
136 Decision Making for Improved Profitability
Above 9,000 units, since the fixed costs are already paid for, everyadditional unit sold results in a profit increase of $15. Therefore,if volume were 9,500 units, profit would be $7,500, as follows:
500 units (above breakeven) � $15 � $7,500
The complete income statement would be:
Revenue (9,500 � $50) $475,000Variable Cost (9,500 � $35) 332,500
Gross Profit (9,500 � $15) 142,500Fixed Costs � 135,000
OperatingIncome $ 7,500
Analysis 2: Price Reduction
This formula can assist in answering a number of business ques-tions. For example, if the company could achieve a volume of11,000 units (rather than the budgeted amount of 10,000 units),but would have to reduce the price from $50 to $47 to do so,would the price cut be worthwhile?
Revenue ($47 � 11,000) $517,000Variable Cost ($35 � 11,000) � 385,000
Gross Profit ($12 � 11,000) $132,000Fixed Costs � 135,000
OperatingProfit ($ 3,000)
A reduction in the selling price of this magnitude with the hopeof achieving sales of an additional 1,000 units is clearly not thecorrect decision. Operating income would decline from a profitof $15,000 to a loss of $3,000.
Analysis 3: Business Opportunity
Let us once again assume a budgeted volume of 10,000 units.Raritan has the opportunity to sell an additional 1,000 units
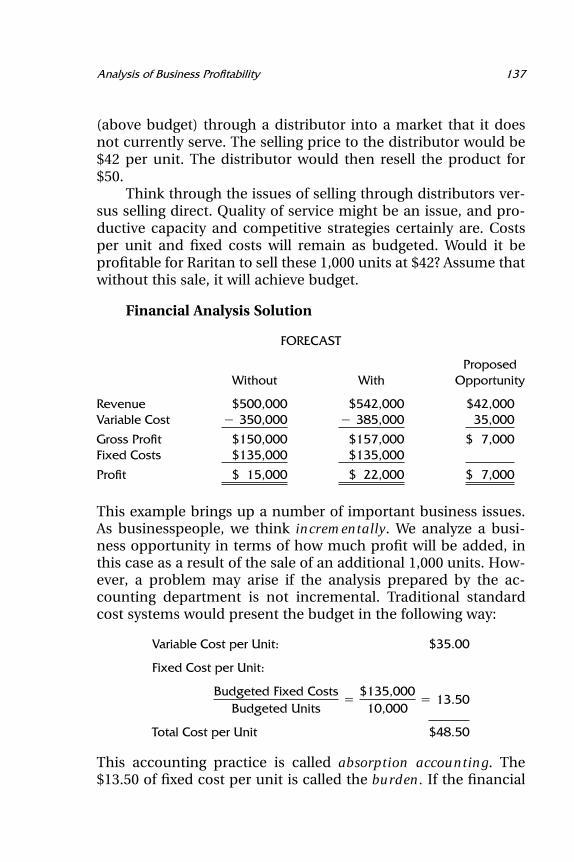
137Analysis of Business Profitability
(above budget) through a distributor into a market that it doesnot currently serve. The selling price to the distributor would be$42 per unit. The distributor would then resell the product for$50.
Think through the issues of selling through distributors ver-sus selling direct. Quality of service might be an issue, and pro-ductive capacity and competitive strategies certainly are. Costsper unit and fixed costs will remain as budgeted. Would it beprofitable for Raritan to sell these 1,000 units at $42? Assume thatwithout this sale, it will achieve budget.
Financial Analysis Solution
FORECAST
ProposedWithout With Opportunity
Revenue $500,000 $542,000 $42,000Variable Cost � 350,000 � 385,000 35,000
Gross Profit $150,000 $157,000 $ 7,000Fixed Costs $135,000 $135,000
Profit $ 15,000 $ 22,000 $ 7,000
This example brings up a number of important business issues.As businesspeople, we think incrementally. We analyze a busi-ness opportunity in terms of how much profit will be added, inthis case as a result of the sale of an additional 1,000 units. How-ever, a problem may arise if the analysis prepared by the ac-counting department is not incremental. Traditional standardcost systems would present the budget in the following way:
Variable Cost per Unit: $35.00
Fixed Cost per Unit:
Budgeted Fixed CostsBudgeted Units
�$135,000
10,000� 13.50
Total Cost per Unit $48.50
This accounting practice is called absorption accounting. The$13.50 of fixed cost per unit is called the burden. If the financial
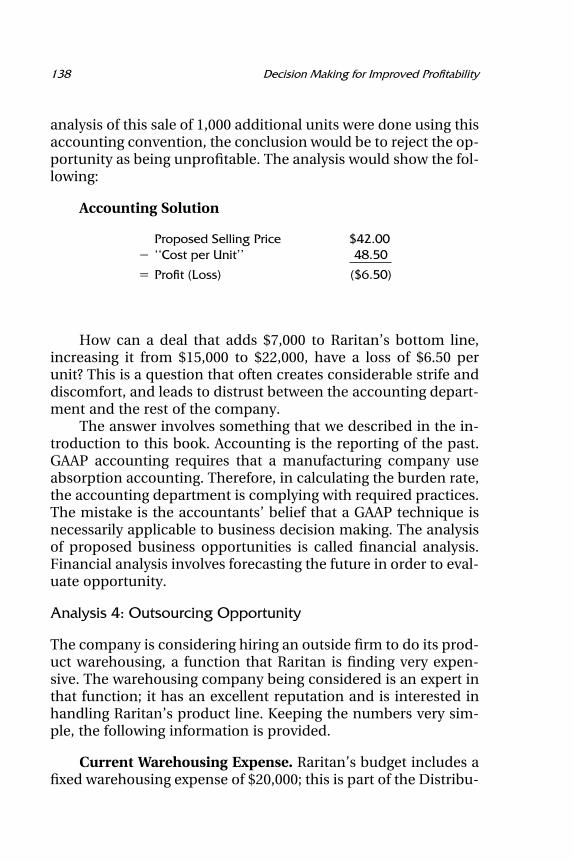
138 Decision Making for Improved Profitability
analysis of this sale of 1,000 additional units were done using thisaccounting convention, the conclusion would be to reject the op-portunity as being unprofitable. The analysis would show the fol-lowing:
Accounting Solution
Proposed Selling Price $42.00� ‘‘Cost per Unit’’ 48.50
� Profit (Loss) ($6.50)
How can a deal that adds $7,000 to Raritan’s bottom line,increasing it from $15,000 to $22,000, have a loss of $6.50 perunit? This is a question that often creates considerable strife anddiscomfort, and leads to distrust between the accounting depart-ment and the rest of the company.
The answer involves something that we described in the in-troduction to this book. Accounting is the reporting of the past.GAAP accounting requires that a manufacturing company useabsorption accounting. Therefore, in calculating the burden rate,the accounting department is complying with required practices.The mistake is the accountants’ belief that a GAAP technique isnecessarily applicable to business decision making. The analysisof proposed business opportunities is called financial analysis.Financial analysis involves forecasting the future in order to eval-uate opportunity.
Analysis 4: Outsourcing Opportunity
The company is considering hiring an outside firm to do its prod-uct warehousing, a function that Raritan is finding very expen-sive. The warehousing company being considered is an expert inthat function; it has an excellent reputation and is interested inhandling Raritan’s product line. Keeping the numbers very sim-ple, the following information is provided.
Current Warehousing Expense. Raritan’s budget includes afixed warehousing expense of $20,000; this is part of the Distribu-
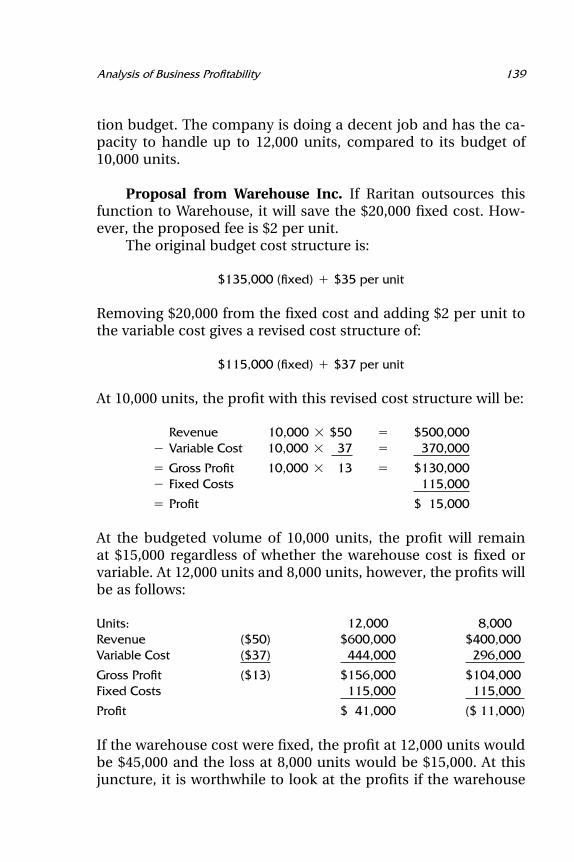
139Analysis of Business Profitability
tion budget. The company is doing a decent job and has the ca-pacity to handle up to 12,000 units, compared to its budget of10,000 units.
Proposal from Warehouse Inc. If Raritan outsources thisfunction to Warehouse, it will save the $20,000 fixed cost. How-ever, the proposed fee is $2 per unit.
The original budget cost structure is:
$135,000 (fixed) � $35 per unit
Removing $20,000 from the fixed cost and adding $2 per unit tothe variable cost gives a revised cost structure of:
$115,000 (fixed) � $37 per unit
At 10,000 units, the profit with this revised cost structure will be:
Revenue 10,000 � $50 � $500,000� Variable Cost 10,000 � 37 � 370,000
� Gross Profit 10,000 � 13 � $130,000� Fixed Costs 115,000
� Profit $ 15,000
At the budgeted volume of 10,000 units, the profit will remainat $15,000 regardless of whether the warehouse cost is fixed orvariable. At 12,000 units and 8,000 units, however, the profits willbe as follows:
Units: 12,000 8,000Revenue ($50) $600,000 $400,000Variable Cost ($37) 444,000 296,000
Gross Profit ($13) $156,000 $104,000Fixed Costs 115,000 115,000
Profit $ 41,000 ($ 11,000)
If the warehouse cost were fixed, the profit at 12,000 units wouldbe $45,000 and the loss at 8,000 units would be $15,000. At thisjuncture, it is worthwhile to look at the profits if the warehouse
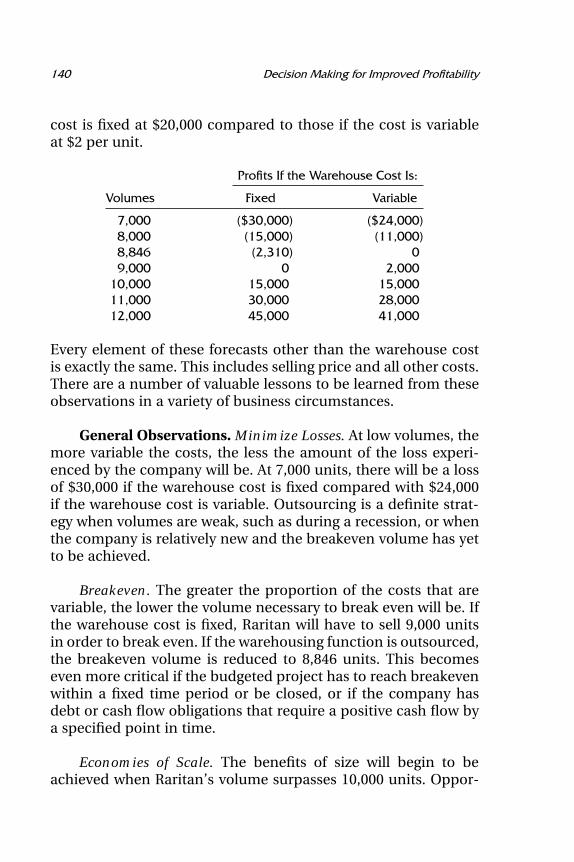
140 Decision Making for Improved Profitability
cost is fixed at $20,000 compared to those if the cost is variableat $2 per unit.
Profits If the Warehouse Cost Is:
Volumes Fixed Variable
7,000 ($30,000) ($24,000)8,000 (15,000) (11,000)8,846 (2,310) 09,000 0 2,000
10,000 15,000 15,00011,000 30,000 28,00012,000 45,000 41,000
Every element of these forecasts other than the warehouse costis exactly the same. This includes selling price and all other costs.There are a number of valuable lessons to be learned from theseobservations in a variety of business circumstances.
General Observations. Minimize Losses. At low volumes, themore variable the costs, the less the amount of the loss experi-enced by the company will be. At 7,000 units, there will be a lossof $30,000 if the warehouse cost is fixed compared with $24,000if the warehouse cost is variable. Outsourcing is a definite strat-egy when volumes are weak, such as during a recession, or whenthe company is relatively new and the breakeven volume has yetto be achieved.
Breakeven. The greater the proportion of the costs that arevariable, the lower the volume necessary to break even will be. Ifthe warehouse cost is fixed, Raritan will have to sell 9,000 unitsin order to break even. If the warehousing function is outsourced,the breakeven volume is reduced to 8,846 units. This becomeseven more critical if the budgeted project has to reach breakevenwithin a fixed time period or be closed, or if the company hasdebt or cash flow obligations that require a positive cash flow bya specified point in time.
Economies of Scale. The benefits of size will begin to beachieved when Raritan’s volume surpasses 10,000 units. Oppor-
141Analysis of Business Profitability
tunities to bring outsourced functions inside can then be ex-plored. Before any investments are made, however, alloutsourcing contracts should be renegotiated to take advantageof the company’s enhanced buying power. Being the low-costproducer is always a desired corporate objective. This can beachieved by continuing to outsource but skillfully taking advan-tage of expanded purchasing power. Below the breakeven point,the cost per unit of outsourcing will almost always be less thanthe cost per unit if the same function is performed internally.This is because of the additional overhead and support that maybe necessary if functions are performed internally.
Financial Strategy for New Businesses
The profitability impact of what we refer to as the fixed-cost/variable-cost mix is directly applicable to the financial strategythat is appropriate for new business startups. Observe howprofits and losses behave with changes in volume from below thebreakeven point to well above it. Within the context of profitabil-ity (read cash flow) behavior, consider the following truisms:
1. The more funds that are dedicated to the core competen-cies of the new business, the greater the business’schance for success. This strongly suggests outsourcing asmany as possible of those functions that are not part ofthe business’s core competencies. Outsourcing reducesoverhead and permits the company to pay for only whatit needs. The more the company tries to accomplish itselfduring these early stages, the greater its fixed costs willbe, and the greater the negative cash flows that will surelyresult.
2. During the early stages of development, the more func-tions that are outsourced, the faster the startup can beginto deliver its product. The early-stage company that at-tempts to provide for its own needs—to vertically inte-grate—must order machinery, hire and train workers andstaff, install the machinery, work out the problems, andthen begin production and delivery. As long as the com-pany can develop relationships with reliable vendors at
142 Decision Making for Improved Profitability
reasonable prices, outsourcing in areas that are not partof the company’s core competencies is much faster andhas fewer potential problems. This permits the criticalfocus to be on the customer.
3. When functions are outsourced in the early stages, thecosts will be highly variable. Having mostly variablerather than fixed costs at these early stages results in min-imizing cash outflows at a most critical time. This allowsadditional cash to be devoted to marketplace opportuni-ties and the company’s core competencies.
4. Outsourcing at the early stages usually results in a higher-quality product. Outside vendors have experience and atrack record of excellence. The company’s only excellenceis in its core competencies and, we hope, its marketingand sales of its expertise. All other responsibilities shouldbe left to outside experts.
5. Keeping costs variable at the early stages expedites theachievement of breakeven. Remember that in the profittable for Raritan Manufacturing, a higher emphasis onvariable costs results in a lower breakeven point (8,846units versus 9,000 units).
6. What happens four or five years later, when having a highlevel of variable costs appears to be counterproductive?In our example, beyond 10,000 units, fixed costs permitthe company to achieve economies of scale. This issueshould be considered during the planning process oncebreakeven volume has been permanently achieved. Priorto that time, the best financial strategy for a startup isto focus its cash and management attention on its corecompetencies. All other functions should be outsourcedto those vendors who are best equipped to provide anexcellent product and service at reasonable prices.
Variance Analysis
Analyzing the variances or differences between budgeted and ac-tual results provides the company with the ability to:
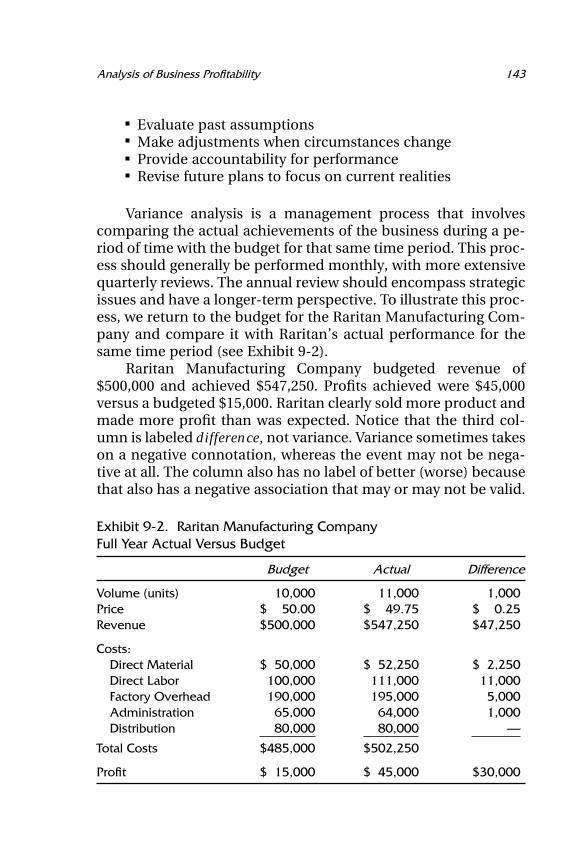
143Analysis of Business Profitability
Evaluate past assumptionsMake adjustments when circumstances changeProvide accountability for performanceRevise future plans to focus on current realities
Variance analysis is a management process that involvescomparing the actual achievements of the business during a pe-riod of time with the budget for that same time period. This proc-ess should generally be performed monthly, with more extensivequarterly reviews. The annual review should encompass strategicissues and have a longer-term perspective. To illustrate this proc-ess, we return to the budget for the Raritan Manufacturing Com-pany and compare it with Raritan’s actual performance for thesame time period (see Exhibit 9-2).
Raritan Manufacturing Company budgeted revenue of$500,000 and achieved $547,250. Profits achieved were $45,000versus a budgeted $15,000. Raritan clearly sold more product andmade more profit than was expected. Notice that the third col-umn is labeled difference, not variance. Variance sometimes takeson a negative connotation, whereas the event may not be nega-tive at all. The column also has no label of better (worse) becausethat also has a negative association that may or may not be valid.
Exhibit 9-2. Raritan Manufacturing CompanyFull Year Actual Versus Budget
Budget Actual Difference
Volume (units) 10,000 11,000 1,000Price $ 50.00 $ 49.75 $ 0.25Revenue $500,000 $547,250 $47,250
Costs:Direct Material $ 50,000 $ 52,250 $ 2,250Direct Labor 100,000 111,000 11,000Factory Overhead 190,000 195,000 5,000Administration 65,000 64,000 1,000Distribution 80,000 80,000 —
Total Costs $485,000 $502,250
Profit $ 15,000 $ 45,000 $30,000
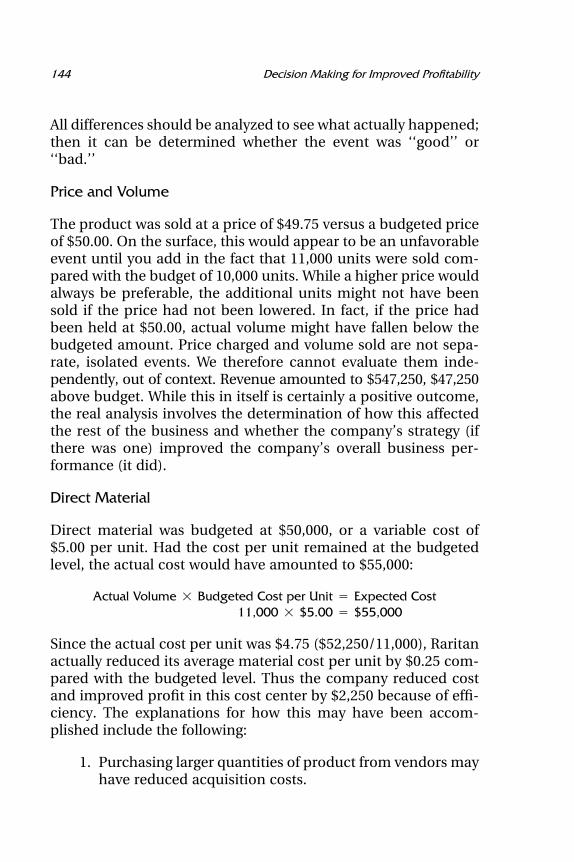
144 Decision Making for Improved Profitability
All differences should be analyzed to see what actually happened;then it can be determined whether the event was ‘‘good’’ or‘‘bad.’’
Price and Volume
The product was sold at a price of $49.75 versus a budgeted priceof $50.00. On the surface, this would appear to be an unfavorableevent until you add in the fact that 11,000 units were sold com-pared with the budget of 10,000 units. While a higher price wouldalways be preferable, the additional units might not have beensold if the price had not been lowered. In fact, if the price hadbeen held at $50.00, actual volume might have fallen below thebudgeted amount. Price charged and volume sold are not sepa-rate, isolated events. We therefore cannot evaluate them inde-pendently, out of context. Revenue amounted to $547,250, $47,250above budget. While this in itself is certainly a positive outcome,the real analysis involves the determination of how this affectedthe rest of the business and whether the company’s strategy (ifthere was one) improved the company’s overall business per-formance (it did).
Direct Material
Direct material was budgeted at $50,000, or a variable cost of$5.00 per unit. Had the cost per unit remained at the budgetedlevel, the actual cost would have amounted to $55,000:
Actual Volume � Budgeted Cost per Unit � Expected Cost11,000 � $5.00 � $55,000
Since the actual cost per unit was $4.75 ($52,250/11,000), Raritanactually reduced its average material cost per unit by $0.25 com-pared with the budgeted level. Thus the company reduced costand improved profit in this cost center by $2,250 because of effi-ciency. The explanations for how this may have been accom-plished include the following:
1. Purchasing larger quantities of product from vendors mayhave reduced acquisition costs.
145Analysis of Business Profitability
2. Longer production runs may have reduced the number ofmachine setups, improving efficiency and reducing prod-uct waste.
Direct Labor
Direct labor is also budgeted as a variable cost. The companyexpected to spend $100,000 but actually spent more, $111,000.Had the cost per unit remained at the budgeted level of $10.00,the company would have spent $110,000. It actually spent $1,000more than that amount.
Actual Volume � Budgeted Cost per Unit � Expected Cost11,000 � $10.00 � $110,000
Actual cost per unit was $111,000/11,000, or $10.09. This $0.09unfavorable difference cost the company $1,000, which is also:
$111,000 � $110,000
This negative event is certainly undesirable. The following factorsshould be considered and evaluated.
1. If higher volumes resulted in longer production runs, thisshould have reduced the number of machine setups. Ifthis were true, average labor cost per unit should havebeen lower than budget rather than higher.
2. If the additional volume were gradual and anticipated,production planning should have provided for the in-crease, and the cost overrun should not have occurred.
3. If the demand for higher volumes were accommodatedby reducing finished goods inventory, then labor costshould not have differed from the budget at all.
4. If the increased volume were a sudden surge, especially ifone or two customers placed orders with short lead times,overtime or weekend work might have been necessary ifthe company was to respond in a timely manner.
5. If the additional volume were from new customers, deliv-ery lead times might have been artificially shortened to
146 Decision Making for Improved Profitability
make a good impression. If these new customers placedsmaller orders in order to test Raritan’s quality or its com-mitment to customer service, labor efficiency would beexpected to decline somewhat.
(Since direct material costs were down and directlabor costs were up, another possible explanation is thatthe cheaper materials were of lower quality, and thusmore labor was required to maintain the quality of thefinal product. Though this is conceptually accurate, thelevels of quality are essentially no longer negotiable.)
Intelligent analysis requires that no judgments be made untilthe cause of the event has been determined. While differencesshould be explained, the effort should not be limited to ‘‘nega-tive’’ variances, and no value judgments should be made untilthe facts are known. Much of direct labor is really fixed. Highervolumes are therefore expected to reduce the average cost perunit. The so-called efficiency explanations really come down tobetter utilization of a relatively fixed cost. This was not Raritan’sexperience.
Factory Overhead
This expense category has both fixed and variable components.Based on production of 10,000 units, Raritan expected to spend$190,000 on this category. Breaking that amount into its fixedand variable portions, the budgeted amount was:
$40,000 � $15 per unit
With actual volume at 11,000 units, it would be reasonable toexpect that expenditures in this category would amount to$205,000:
$40,000 � $15 (11,000) � $40,000 � $165,000 � $205,000
Actual expenditures were $195,000. This suggests efficiencygreater than that reflected in the budget and a positive varianceof $10,000. Explanations for the differences in this and other cat-
147Analysis of Business Profitability
egories must include the perception that a higher percentage ofcost than the standards suggest is really fixed. Other explanationsinclude the benefits of economies of scale associated with thehigher volumes. Further examination of the details of the compo-nents of this category is required. Surface appearances do notsuggest any major problem issues.
Administration
Raritan expected to spend $65,000 in this category based uponthe budgeted volume of 10,000 units. The actual budget is:
$45,000 � $2(10,000) � $65,000
If this category truly has a variable component, it would be ex-pected that at 11,000 units, spending would have amounted to$67,000, calculated as follows:
$45,000 � $2(11,000) � $45,000 � $22,000 � $67,000
The actual spending of $64,000 is even below the original bud-geted amount. We know that technology is improving the effi-ciency of support departments, especially accounting. This mightbe a factor here.
Distribution
There is opportunity for significant efficiencies and economies ofscale in this category, which include warehousing and trucking.Loading additional volume onto delivery trucks costs very littlemore, especially if the product is destined for the same custom-ers. An efficiently organized and managed warehouse should beable to handle significant increases in volume with very little ad-ditional spending. This would not be true if the additional vol-ume were not anticipated, but was very sudden and had shortlead times. Disruptions can be very expensive, however worth-while they may be. The company expected to spend $80,000 inthese categories. The budget is:
$50,000 � $3(10,000) � $80,000
148 Decision Making for Improved Profitability
At the actual volume, total spending on distribution could havebeen $83,000:
$50,000 � $3(11,000) � $50,000 � $33,000 � $83,000
Actual expenditures in this category amounted to $80,000. Thisrepresents an efficiency variance of $3,000.
Further analysis of Raritan’s performance requires that wedig deeper into the details. All categories should be reviewed pe-riodically to identify both positive and negative events; then thenegative events should be corrected and the positive reinforced.The quarterly reviews should be more extensive than themonthly review meetings, unless it is determined at a monthlymeeting that the actual results are a significant departure frombudget assumptions.
Total actual spending amounted to $502,250. Had the actualvariable costs per unit been the same as the budgeted costs, thisamount would have been $525,000. The conclusion here is thatRaritan generally handled the additional business well, func-tioned efficiently, and enjoyed some economies of scale thatwere not necessarily reflected in the budget formulas.
Chapter 10
Return on Investment
AN INVESTMENT IS AN EXPOSURE of cash that has the objec-tive of producing cash inflows in the future. The worthiness ofan investment is measured by how much cash the investment isexpected to generate.
The analysis of return on investment is a financial forecast-ing tool that assists the business manager in evaluating whethera proposed investment opportunity is worthwhile within thecontext of the company’s business objectives and financial con-straints.
What Is Analyzed?
The investments to be analyzed have some of the following char-acteristics:
A major amount of money is involved.The financial commitment is for more than one year.Cash flow benefits are expected to be achieved over manyyears.The strategic direction of the company may be affected.The company’s prosperity may be significantly affected ifthe investment is made or not made.
149
150 Decision Making for Improved Profitability
Why Are These OpportunitiesAnalyzed So Extensively?
Investment decisions should be analyzed carefully because suchanalysis is of assistance in the decision-making process and be-cause the decisions are irreversible, have long-term strategicimplications, are uncertain, and involve considerable financialexposure.
Assistance
Forecasting the future performance of a proposed investment re-quires the analyst to identify all the issues and effects, both posi-tive and negative, associated with the investment. While thisdoes not eliminate risk, it does lead to a more intelligent, better-informed decision-making process. Facts and expectations basedupon research and strategic thinking are incorporated into theforecast. The results of the financial analysis do not make thedecision. People make decisions based upon the best availableinformation. A capital expenditure requires significant funds andcorporate commitment. It is vital that these decisions be well in-formed.
Irreversible
Operating decisions, such as scheduling overtime or purchasinglarger amounts of raw materials, can be changed when the envi-ronment or circumstances change or when it becomes obviousthat a mistake was made. With these decisions, the need for cor-rection can be readily determined and the actual change can beimplemented quickly, with minimal financial penalty. A capitalexpenditure decision, such as purchasing machinery, can alsobe changed. In this case, however, the financial penalty can besubstantial. Having installed equipment sit idle because cus-tomer orders dried up or never materialized can be severely dam-aging. Changes in customer preferences that are not recognizedbefore assets are purchased and installed can be even more dam-aging if the company cannot or is unwilling to admit the mistakes
151Return on Investment
and take corrective actions. The discipline of analysis and fore-casting should minimize the occurrence of this type of event.
Long-Term Strategic Implications
Locating an operation in a certain part of the country or of theworld, building a factory in a certain configuration, and decidingwhat kinds of machines are needed and how many are all deci-sions that will affect the way the company conducts its businessfor many years to come. These decisions may very well contrib-ute to the company’s future prosperity, or the lack of it. Compa-nies can face such risks as:
Critical raw materials becoming depletedRail transportation service being terminatedManpower and/or skills shortages occurring
The discipline of the forecasting process forces companies toidentify, evaluate, and resolve these risks and vulnerabilities.
Uncertainty
The ability to predict the future is becoming more difficult andcomplex for businesses. Markets, customers, competitors, andtechnology have made the need for strategic discipline more crit-ical than ever before.
Financial Exposure
In addition to the uncertainties and risks involved, the sheeramount of funds that must be committed to a major investmentrequires that all available facts and issues be identified and eval-uated. If additional debt is directly or indirectly involved, the an-alytical process is even more critical. Involving banks or othersources of external financing is often very helpful. Banks are risk-averse businesses. They will not lend money unless they are con-vinced of the merits of the proposed investment. Lenders oftenprotect their clients by identifying risks that the clients had not
152 Decision Making for Improved Profitability
identified or had underemphasized. In this situation, the forecastbecomes a selling document as well as a decision-making tool.
Discounted Cash Flow
The financial tool that is used to evaluate investment opportuni-ties is called discounted cash flow (DCF). The different measure-ments that use this tool in some way are:
Internal rate of returnNet present valueProfitability indexPayback period
The types of investments that can be evaluated with this tool are:
Capital expendituresResearch and developmentMajor advertising/promotional effortsOutsourcing alternativesMajor contract negotiations (price, payment terms, dura-tion, specifications)Evaluating new products or businessesBuying another businessStrategic alliancesValuing real estate
The Principles of Discounted Cash Flow
Let’s start out by identifying a number of key conceptual prem-ises of DCF.
0. means period zero, or the starting point of the project.1. means one year from the start of the project.2. means two years from the start of the project, and so forth.
153Return on Investment
A simple example is:
0. ($1,000) cash outflow (parentheses)1. $1,020 cash inflow . . . no parentheses
Clearly this is not a particularly attractive investment, since if themoney were put in a local bank, the return might be 5 percent:
0. ($1,000)1. $1,050
The bank deposit is also risk-free because it is insured by theFDIC or FSLIC.
Therefore, we have already established two basic principlesof DCF:
1. It is measuring profitability.2. Risk issues are incorporated.
Profit $ � Interest $
Now consider the following financial relationship:
0. ($1,000)1. $1,200
If this were the purchase of a stock and its sale one year later, theprofit would be $200. If this were a bank loan, where you bor-rowed $1,000 and repaid $1,200 after a year, the interest wouldobviously be $200.
These are the same concept; the only differences are se-mantic.
ROI % � Interest %
The return on investment (ROI) on the stock purchase and salewould be 20 percent. The interest rate on the loan would also be20 percent, as follows:
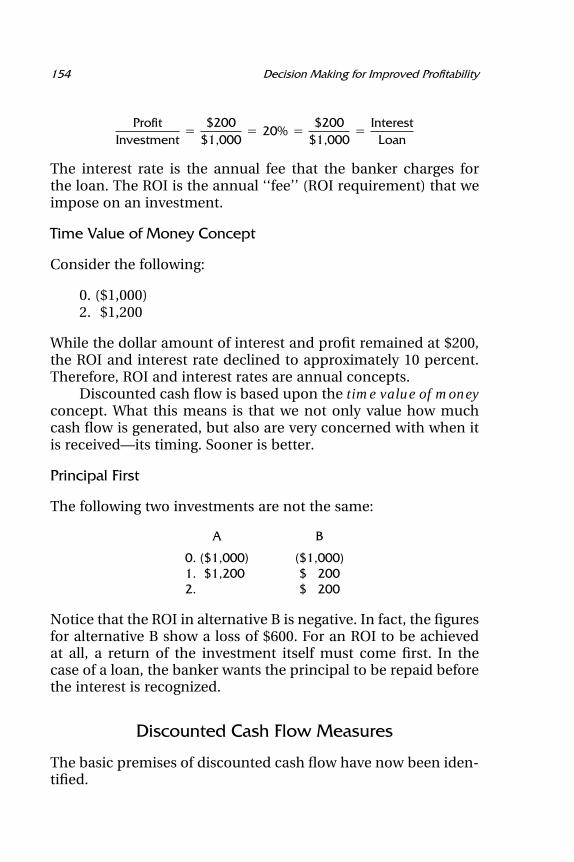
154 Decision Making for Improved Profitability
ProfitInvestment
�$200
$1,000� 20% �
$200$1,000
�InterestLoan
The interest rate is the annual fee that the banker charges forthe loan. The ROI is the annual ‘‘fee’’ (ROI requirement) that weimpose on an investment.
Time Value of Money Concept
Consider the following:
0. ($1,000)2. $1,200
While the dollar amount of interest and profit remained at $200,the ROI and interest rate declined to approximately 10 percent.Therefore, ROI and interest rates are annual concepts.
Discounted cash flow is based upon the time value of moneyconcept. What this means is that we not only value how muchcash flow is generated, but also are very concerned with when itis received—its timing. Sooner is better.
Principal First
The following two investments are not the same:
A B
0. ($1,000) ($1,000)1. $1,200 $ 2002. $ 200
Notice that the ROI in alternative B is negative. In fact, the figuresfor alternative B show a loss of $600. For an ROI to be achievedat all, a return of the investment itself must come first. In thecase of a loan, the banker wants the principal to be repaid beforethe interest is recognized.
Discounted Cash Flow Measures
The basic premises of discounted cash flow have now been iden-tified.
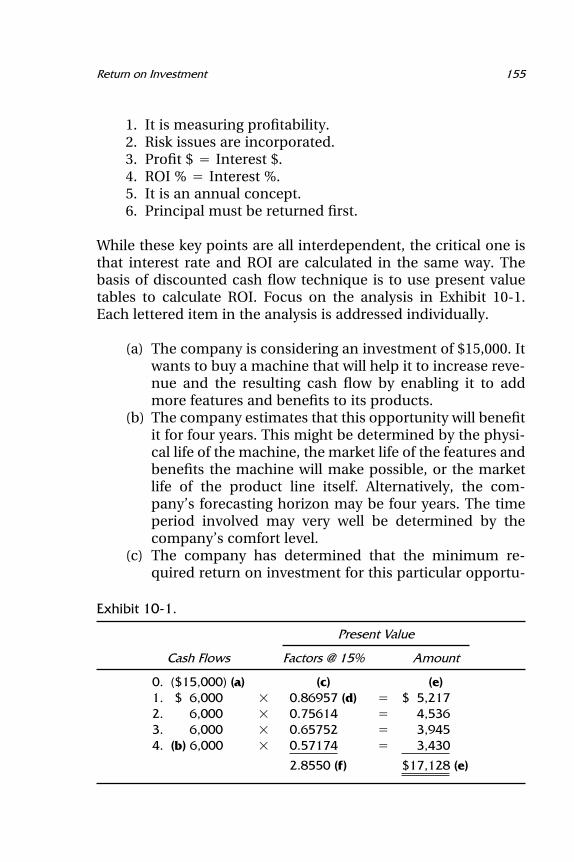
155Return on Investment
1. It is measuring profitability.2. Risk issues are incorporated.3. Profit $ � Interest $.4. ROI % � Interest %.5. It is an annual concept.6. Principal must be returned first.
While these key points are all interdependent, the critical one isthat interest rate and ROI are calculated in the same way. Thebasis of discounted cash flow technique is to use present valuetables to calculate ROI. Focus on the analysis in Exhibit 10-1.Each lettered item in the analysis is addressed individually.
(a) The company is considering an investment of $15,000. Itwants to buy a machine that will help it to increase reve-nue and the resulting cash flow by enabling it to addmore features and benefits to its products.
(b) The company estimates that this opportunity will benefitit for four years. This might be determined by the physi-cal life of the machine, the market life of the features andbenefits the machine will make possible, or the marketlife of the product line itself. Alternatively, the com-pany’s forecasting horizon may be four years. The timeperiod involved may very well be determined by thecompany’s comfort level.
(c) The company has determined that the minimum re-quired return on investment for this particular opportu-
Exhibit 10-1.
Present Value
Cash Flows Factors @ 15% Amount
0. ($15,000) (a) (c) (e)1. $ 6,000 � 0.86957 (d) � $ 5,2172. 6,000 � 0.75614 � 4,5363. 6,000 � 0.65752 � 3,9454. (b) 6,000 � 0.57174 � 3,430
2.8550 (f) $17,128 (e)
156 Decision Making for Improved Profitability
nity is 15 percent. The company may or may not use thesame required level of ROI for all projects. Some compa-nies call the required ROI the hurdle rate (that must be‘‘jumped over’’ by the project). The hurdle rate may ormay not be the same as the company’s cost of capital.There are many different versions of this terminology, sobe careful.
ROI and interest rate are the same. Therefore, 15percent is also the interest rate. The annual fee that thecompany will ‘‘charge’’ the project for the use of thecompany’s money is the equivalent of the annual feethat the bank charges for a loan. The 15 percent is alsothe time value of money (TVOM) of that annual fee. Interms of discounted cash flow technique, the 15 percentis called the factor. ROI, interest rate, TVOM, and factorare four synonymous terms.
(d) These decimals are the present value factors. The deci-mal given for each year is 15 percent less than the deci-mal given for the previous year. These factors can all befound in Table 10-1.
(e) The annual cash flow forecast is multiplied by the pres-ent value factors. The results are the present valueamounts. Through this procedure, each year’s forecastcash inflow is penalized by 15 percent times the numberof years the company will have to wait for that cash in-flow. We are in fact ‘‘discounting the cash flows’’—hencethe name of this technique. The four cash inflows addup to $17,128. This is called the present value of the cashinflows. It is, in fact, the value of the deal. If this companyinvested $17,128 and achieved cash inflows of $6,000 peryear for four years, the ROI would be exactly 15 percent.In this example, the machine cost less than $17,128.Therefore, the return on investment is greater than 15percent.
The specific measures of profitability that can be used to evaluatethis investment are:
Net present valueProfitability indexInternal rate of return
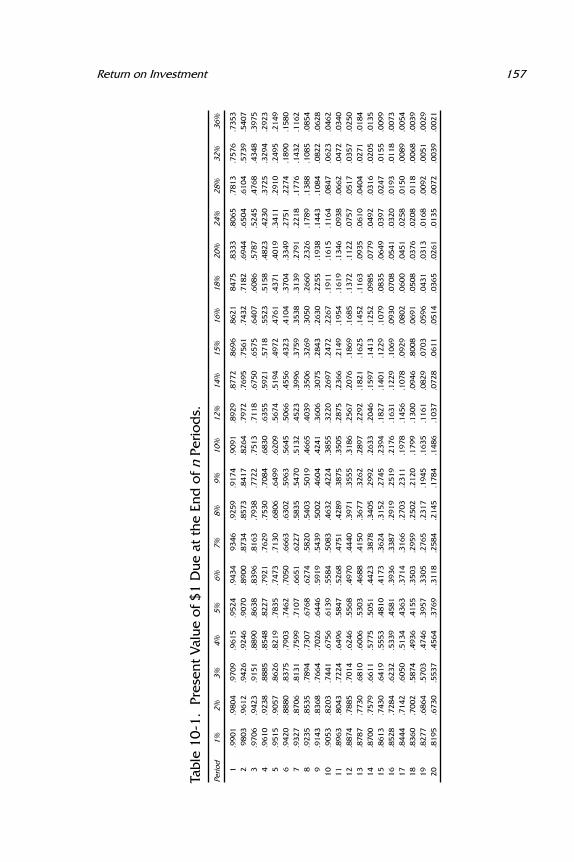
157Return on Investment
Tabl
e10
-1.
Pres
ent
Valu
eof
$1D
ueat
the
End
ofn
Perio
ds.
Perio
d1%
2%3%
4%5%
6%7%
8%9%
10%
12%
14%
15%
16%
18%
20%
24%
28%
32%
36%
1.9
901
.980
4.9
709
.961
5.9
524
.943
493
46.9
259
.917
4.9
091
.892
9.8
772
.869
6.8
621
8475
.833
3.8
065
.781
3.7
576
.735
32
9803
.961
2.9
426
.924
6.9
070
.890
0.8
734
.857
3.8
417
.826
4.7
972
.769
5.7
561
.743
2.7
182
.694
4.6
504
.610
4.5
739
.540
73
.970
6.9
423
.915
1.8
890
.863
8.8
396
.816
3.7
938
.772
2.7
513
.711
8.6
750
.657
5.6
407
.608
6.5
787
.524
5.4
768
.434
8.3
975
4.9
610
.923
8.8
885
.854
8.8
227
.792
1.7
629
.753
0.7
084
.683
0.6
355
.592
1.5
718
.552
3.5
158
.482
3.4
230
.372
5.3
294
.292
35
.951
5.9
057
.862
6.8
219
.783
5.7
473
.713
0.6
806
.649
9.6
209
.567
4.5
194
.497
2.4
761
.437
1.4
019
.341
1.2
910
.249
5.2
149
6.9
420
.888
0.8
375
.790
3.7
462
.705
0.6
663
.630
2.5
963
.564
5.5
066
.455
6.4
323
.410
4.3
704
.334
9.2
751
.227
4.1
890
.158
07
.932
7.8
706
.813
1.7
599
.710
7.6
651
.622
7.5
835
.547
0.5
132
.452
3.3
996
.375
9.3
538
.313
9.2
791
.221
8.1
776
.143
2.1
162
8.9
235
.853
5.7
894
.730
7.6
768
.627
4.5
820
.540
3.5
019
.466
5.4
039
.350
6.3
269
.305
0.2
660
.232
6.1
789
.138
8.1
085
.085
49
.914
3.8
368
.766
4.7
026
.644
6.5
919
.543
9.5
002
.460
4.4
241
.360
6.3
075
.284
3.2
630
.225
5.1
938
.144
3.1
084
.082
2.0
628
10.9
053
.820
3.7
441
.675
6.6
139
.558
4.5
083
.463
2.4
224
.385
5.3
220
.269
7.2
472
.226
7.1
911
.161
5.1
164
.084
7.0
623
.046
211
.896
3.8
043
.722
4.6
496
.584
7.5
268
.475
1.4
289
.387
5.3
505
.287
5.2
366
.214
9.1
954
.161
9.1
346
.093
8.0
662
.047
2.0
340
12.8
874
.788
5.7
014
.624
6.5
568
.497
0.4
440
.397
1.3
555
.318
6.2
567
.207
6.1
869
.168
5.1
372
.112
2.0
757
.051
7.0
357
.025
013
.878
7.7
730
.681
0.6
006
.530
3.4
688
.415
0.3
677
.326
2.2
897
.229
2.1
821
.162
5.1
452
.116
3.0
935
.061
0.0
404
.027
1.0
184
14.8
700
.757
9.6
611
.577
5.5
051
.442
3.3
878
.340
5.2
992
.263
3.2
046
.159
7.1
413
.125
2.0
985
.077
9.0
492
.031
6.0
205
.013
515
.861
3.7
430
.641
9.5
553
.481
0.4
173
.362
4.3
152
.274
5.2
394
.182
7.1
401
.122
9.1
079
.083
5.0
649
.039
7.0
247
.015
5.0
099
16.8
528
.728
4.6
232
.533
9.4
581
.393
6.3
387
.291
9.2
519
.217
6.1
631
.122
9.1
069
.093
0.0
708
.054
1.0
320
.019
3.0
118
.007
317
.844
4.7
142
.605
0.5
134
.436
3.3
714
.316
6.2
703
.231
1.1
978
.145
6.1
078
.092
9.0
802
.060
0.0
451
.025
8.0
150
.008
9.0
054
18.8
360
.700
2.5
874
.493
6.4
155
.350
3.2
959
.250
2.2
120
.179
9.1
300
.094
6.8
008
.069
1.0
508
.037
6.0
208
.011
8.0
068
.003
919
.827
7.6
864
.570
3.4
746
.395
7.3
305
.276
5.2
317
.194
5.1
635
.116
1.0
829
.070
3.0
596
.043
1.0
313
.016
8.0
092
.005
1.0
029
20.8
195
.673
0.5
537
.456
4.3
769
.311
8.2
584
.214
5.1
784
.148
6.1
037
.072
8.0
611
.051
4.0
365
.026
1.0
135
.007
2.0
039
.002
1
158 Decision Making for Improved Profitability
Net Present Value
The net present value is a dollar amount. It is calculated as fol-lows:
Present Value of the Cash Inflows $17,128� Present Value of the Cash Outflows � 15,000 (the investment)
� Net Present Value $ 2,128
A net present value (NPV) that is a positive amount means thatthe actual return on investment exceeds the target rate, in thiscase 15 percent. An NPV that is negative means that the actualROI is below the target. If the NPV is equal to zero, the ROI per-centage used to do the calculation is the actual ROI.
Profitability Index
The profitability index (PI) is the comparison of the actual ROI tothe target ROI. Its calculation is:
Present Value of the Cash InflowsPresent Value of the Cash Outflows
� PI
$17,128$15,000
� 1.14
A profitability index greater than 1.0 means that the actual ROIexceeds the target. A profitability index lower than 1.0 means thatthe actual ROI is below the target. If the PI is exactly 1.0, the ROIpercentage used in the calculation is the actual ROI.
In this example, we now know with certainty that the actualreturn on investment exceeds 15 percent, as the NPV is a positiveamount and the PI exceeds 1.0. The NPV and the PI will nevergive conflicting signals, and there will never be conflicting signalsbetween the NPV and PI and the actual return on investment.Within the realm of normal business forecasting, such conflictingsignals are impossible.
(f ) Notice that in Exhibit 10-1, we repeatedly multiplied$6,000 times each individual annual factor. As an alter-
159Return on Investment
native, we can add up the four annual factors, giving us2.855, and multiply this number by the annual cash flow.Except for differences introduced by rounding, doingone summary multiplication will give the same result asthe individual calculations. The sum of the annual fac-tors is called an annuity factor. Annuity factors can beused only when the annual cash inflows are the sameamount; when cash inflows differ, the present value fac-tors for the individual years must be used. The annuityfactors for different time periods and interest rates havebeen calculated; they can be found in Table 10-2.
Internal Rate of Return
Consider the following formula:
PVCO � PVCI Factor (%, yrs)
This is the formula for the internal rate of return, which is theactual ROI based upon discounted cash flow technique. This for-mula is in all computer software dealing with this technique. Inwords, it reads:
The present value of the cash outflows (investment) will beequal to the present value of the cash inflows when multi-plied by the correct factor.
The correct factor means the factor corresponding to the rightpercentage and the right number of years. We now have a criticalformula in which three of the four parameters are known. Re-turning to the example:
PVCO (investment) $15,000 $15,000 � $6,000 � F (%, 4 yrs)Cash Inflows $ 6,000Number of Years 4
Solving for the factor algebraically, we get $15,000/$6,000, or 2.5.Now we search in Table 10-2 (the annuity table) in the row for 4years until we find the factor 2.5. Notice that for 4 years, at 20
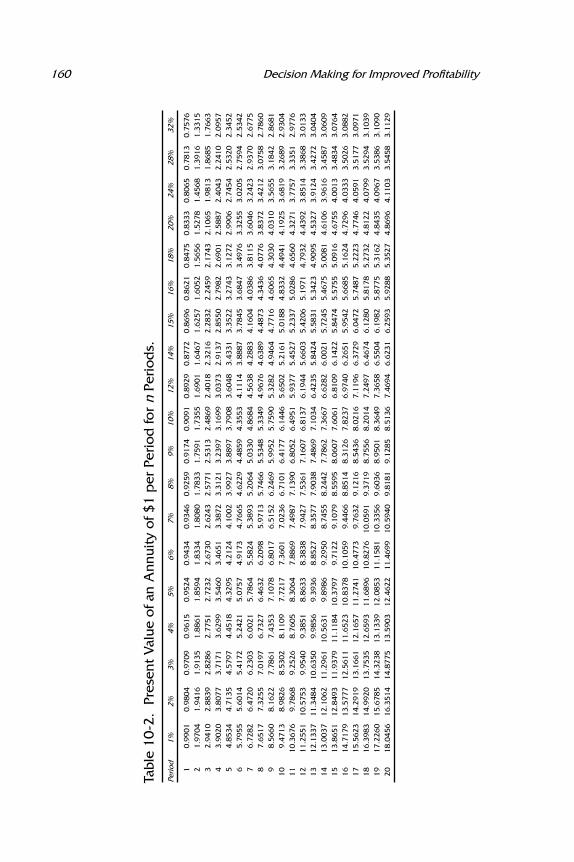
160 Decision Making for Improved Profitability
Tabl
e10
-2.
Pres
ent
Valu
eof
anA
nnui
tyof
$1p
erPe
riod
for
nPe
riod
s.Pe
riod
1%2%
3%4%
5%6%
7%8%
9%10
%12
%14
%15
%16
%18
%20
%24
%28
%32
%
10.
9901
0.98
040.
9709
0.96
150.
9524
0.94
340.
9346
0.92
590.
9174
0.90
910.
8929
0.87
720.
8696
0.86
210.
8475
0.83
330.
8065
0.78
130.
7576
21.
9704
1.94
161.
9135
1.88
611.
8594
1.83
341.
8080
1.78
331.
7591
1.73
551.
6901
1.64
671.
6257
1.60
521.
5656
1.52
781.
4568
1.39
161.
3315
32.
9410
2.88
392.
8286
2.77
512.
7232
2.67
302.
6243
2.57
712.
5313
2.48
692.
4018
2.32
162.
2832
2.24
592.
1743
2.10
651.
9813
1.86
851.
7663
43.
9020
3.80
773.
7171
3.62
993.
5460
3.46
513.
3872
3.31
213.
2397
3.16
993.
0373
2.91
372.
8550
2.79
822.
6901
2.58
872.
4043
2.24
102.
0957
54.
8534
4.71
354.
5797
4.45
184.
3295
4.21
244.
1002
3.99
273.
8897
3.79
083.
6048
3.43
313.
3522
3.27
433.
1272
2.99
062.
7454
2.53
202.
3452
65.
7955
5.60
145.
4172
5.24
215.
0757
4.91
734.
7665
4.62
294.
4859
4.35
534.
1114
3.88
873.
7845
3.68
473.
4976
3.32
553.
0205
2.75
942.
5342
76.
7282
6.47
206.
2303
6.00
215.
7864
5.58
245.
3893
5.20
645.
0330
4.86
844.
5638
4.28
834.
1604
4.03
863.
8115
3.60
463.
2423
2.93
702.
6775
87.
6517
7.32
557.
0197
6.73
276.
4632
6.20
985.
9713
5.74
665.
5348
5.33
494.
9676
4.63
894.
4873
4.34
364.
0776
3.83
723.
4212
3.07
582.
7860
98.
5660
8.16
227.
7861
7.43
537.
1078
6.80
176.
5152
6.24
695.
9952
5.75
905.
3282
4.94
644.
7716
4.60
654.
3030
4.03
103.
5655
3.18
422.
8681
109.
4713
8.98
268.
5302
8.11
097.
7217
7.36
017.
0236
6.71
016.
4177
6.14
465.
6502
5.21
615.
0188
4.83
324.
4941
4.19
253.
6819
3.26
892.
9304
1110
.367
69.
7868
9.25
268.
7605
8.30
647.
8869
7.49
877.
1390
6.80
526.
4951
5.93
775.
4527
5.23
375.
0286
4.65
604.
3271
3.77
573.
3351
2.97
7612
11.2
551
10.5
753
9.95
409.
3851
8.86
338.
3838
7.94
277.
5361
7.16
076.
8137
6.19
445.
6603
5.42
065.
1971
4.79
324.
4392
3.85
143.
3868
3.01
3313
12.1
337
11.3
484
10.6
350
9.98
569.
3936
8.85
278.
3577
7.90
387.
4869
7.10
346.
4235
5.84
245.
5831
5.34
234.
9095
4.53
273.
9124
3.42
723.
0404
1413
.003
712
.106
211
.296
110
.563
19.
8986
9.29
508.
7455
8.24
427.
7862
7.36
676.
6282
6.00
215.
7245
5.46
755.
0081
4.61
063.
9616
3.45
873.
0609
1513
.865
112
.849
311
.937
911
.118
410
.379
79.
7122
9.10
798.
5595
8.06
077.
6061
6.81
096.
1422
5.84
745.
5755
5.09
164.
6755
4.00
133.
4834
3.07
6416
14.7
179
13.5
777
12.5
611
11.6
523
10.8
378
10.1
059
9.44
668.
8514
8.31
267.
8237
6.97
406.
2651
5.95
425.
6685
5.16
244.
7296
4.03
333.
5026
3.08
8217
15.5
623
14.2
919
13.1
661
12.1
657
11.2
741
10.4
773
9.76
329.
1216
8.54
368.
0216
7.11
966.
3729
6.04
725.
7487
5.22
234.
7746
4.05
913.
5177
3.09
7118
16.3
983
14.9
920
13.7
535
12.6
593
11.6
896
10.8
276
10.0
591
9.37
198.
7556
8.20
147.
2497
6.46
746.
1280
5.81
785.
2732
4.81
224.
0799
3.52
943.
1039
1917
.226
015
.678
514
.323
813
.133
912
.085
311
.158
110
.335
69.
6036
8.95
018.
3649
7.36
586.
5504
6.19
825.
8775
5.31
624.
8435
4.09
673.
5386
3.10
9020
18.0
456
16.3
514
14.8
775
13.5
903
12.4
622
11.4
699
10.5
940
9.81
819.
1285
8.51
367.
4694
6.62
316.
2593
5.92
885.
3527
4.86
964.
1103
3.54
583.
1129
161Return on Investment
percent the factor is 2.588, and at 24 percent the factor is 2.404.Therefore, the actual return on investment is between 20 percentand 24 percent. In fact, it is approximately 21 percent. Rememberthat Table 10-2 can be used only if the annual cash inflows arethe same amount. If the annual cash inflows are different, themethod described here will work, but since the formula will in-clude each cash flow amount multiplied by the present value fac-tor for that amount, more trial and error and number crunchingwill be required.
Payback Period
The payback period is the amount of time that it takes for thecash inflows from the investment to be exactly equal to the in-vestment. It is a cash flow breakeven. While it is not a measure ofprofitability, it is a measure of risk. Consideration of the paybackperiod is especially valuable for companies with tight cash flowsituations. While the company does not want to shut off invest-ment completely, it needs to focus on those opportunities thatwill have the greatest positive effect on its cash position. For theopportunity that has been analyzed here, the payback period iscalculated as follows:
InvestmentAnnual Cash Inflows
�$15,000$6,000
� 2.5 years
This measure is sometimes the only tool that companies use toevaluate an opportunity. The problem with it is that, in additionto the fact that it is not a measure of profitability, it treats all cashflows within the payback period equally, without regard to theirtime value, and it ignores all cash flows after the payback period.
Risk
The psychology of corporate investment risk is very differentfrom that of personal investment risk. When we as individualsare contemplating an investment, such as a stock purchase, ourperception of the risk of the investment focuses on the possibility
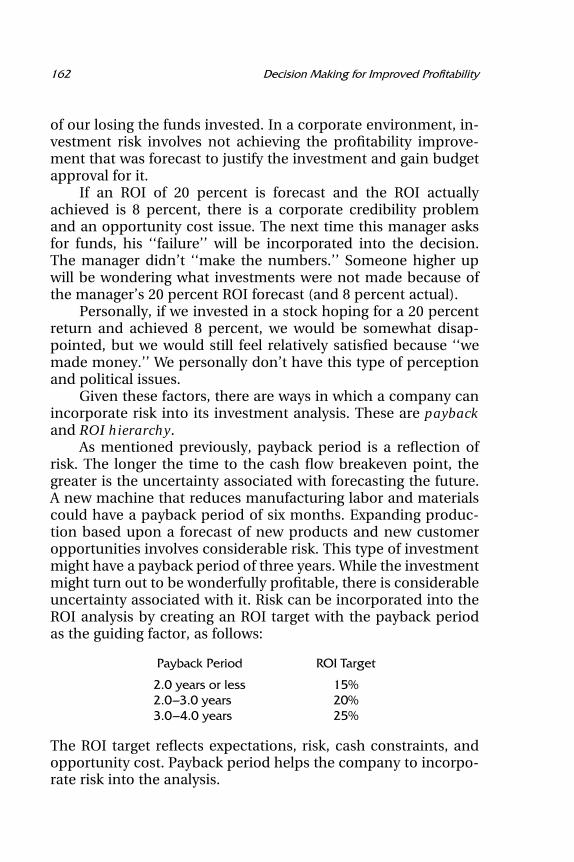
162 Decision Making for Improved Profitability
of our losing the funds invested. In a corporate environment, in-vestment risk involves not achieving the profitability improve-ment that was forecast to justify the investment and gain budgetapproval for it.
If an ROI of 20 percent is forecast and the ROI actuallyachieved is 8 percent, there is a corporate credibility problemand an opportunity cost issue. The next time this manager asksfor funds, his ‘‘failure’’ will be incorporated into the decision.The manager didn’t ‘‘make the numbers.’’ Someone higher upwill be wondering what investments were not made because ofthe manager’s 20 percent ROI forecast (and 8 percent actual).
Personally, if we invested in a stock hoping for a 20 percentreturn and achieved 8 percent, we would be somewhat disap-pointed, but we would still feel relatively satisfied because ‘‘wemade money.’’ We personally don’t have this type of perceptionand political issues.
Given these factors, there are ways in which a company canincorporate risk into its investment analysis. These are paybackand ROI hierarchy.
As mentioned previously, payback period is a reflection ofrisk. The longer the time to the cash flow breakeven point, thegreater is the uncertainty associated with forecasting the future.A new machine that reduces manufacturing labor and materialscould have a payback period of six months. Expanding produc-tion based upon a forecast of new products and new customeropportunities involves considerable risk. This type of investmentmight have a payback period of three years. While the investmentmight turn out to be wonderfully profitable, there is considerableuncertainty associated with it. Risk can be incorporated into theROI analysis by creating an ROI target with the payback periodas the guiding factor, as follows:
Payback Period ROI Target
2.0 years or less 15%2.0–3.0 years 20%3.0–4.0 years 25%
The ROI target reflects expectations, risk, cash constraints, andopportunity cost. Payback period helps the company to incorpo-rate risk into the analysis.
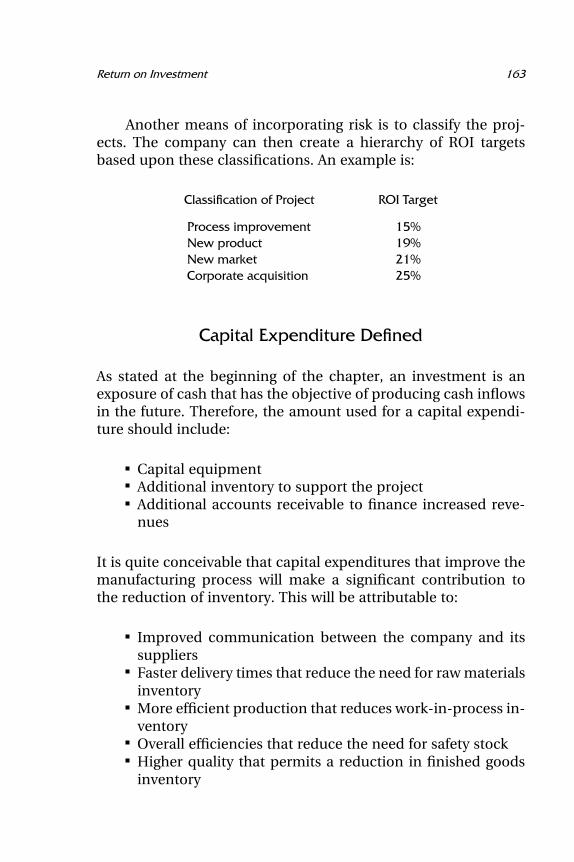
163Return on Investment
Another means of incorporating risk is to classify the proj-ects. The company can then create a hierarchy of ROI targetsbased upon these classifications. An example is:
Classification of Project ROI Target
Process improvement 15%New product 19%New market 21%Corporate acquisition 25%
Capital Expenditure Defined
As stated at the beginning of the chapter, an investment is anexposure of cash that has the objective of producing cash inflowsin the future. Therefore, the amount used for a capital expendi-ture should include:
Capital equipmentAdditional inventory to support the projectAdditional accounts receivable to finance increased reve-nues
It is quite conceivable that capital expenditures that improve themanufacturing process will make a significant contribution tothe reduction of inventory. This will be attributable to:
Improved communication between the company and itssuppliersFaster delivery times that reduce the need for raw materialsinventoryMore efficient production that reduces work-in-process in-ventoryOverall efficiencies that reduce the need for safety stockHigher quality that permits a reduction in finished goodsinventory
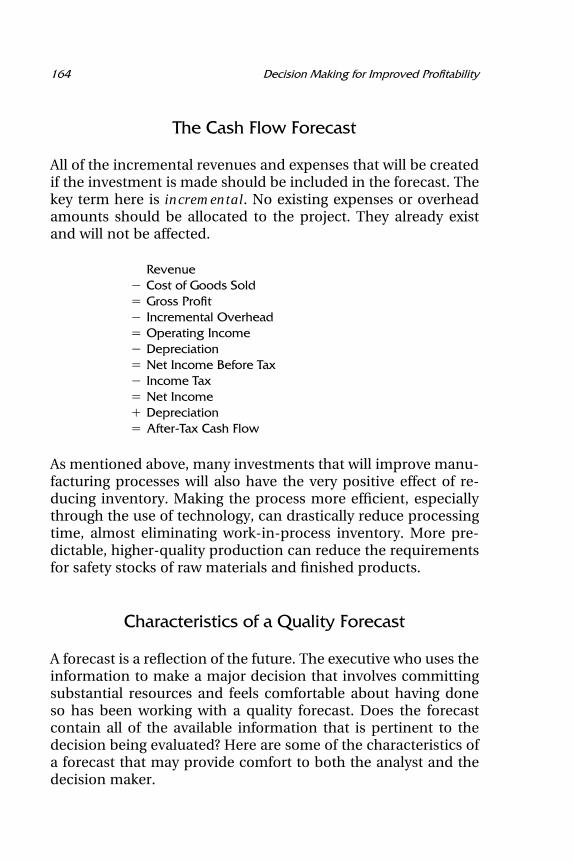
164 Decision Making for Improved Profitability
The Cash Flow Forecast
All of the incremental revenues and expenses that will be createdif the investment is made should be included in the forecast. Thekey term here is incremental. No existing expenses or overheadamounts should be allocated to the project. They already existand will not be affected.
Revenue� Cost of Goods Sold� Gross Profit� Incremental Overhead� Operating Income� Depreciation� Net Income Before Tax� Income Tax� Net Income� Depreciation� After-Tax Cash Flow
As mentioned above, many investments that will improve manu-facturing processes will also have the very positive effect of re-ducing inventory. Making the process more efficient, especiallythrough the use of technology, can drastically reduce processingtime, almost eliminating work-in-process inventory. More pre-dictable, higher-quality production can reduce the requirementsfor safety stocks of raw materials and finished products.
Characteristics of a Quality Forecast
A forecast is a reflection of the future. The executive who uses theinformation to make a major decision that involves committingsubstantial resources and feels comfortable about having doneso has been working with a quality forecast. Does the forecastcontain all of the available information that is pertinent to thedecision being evaluated? Here are some of the characteristics ofa forecast that may provide comfort to both the analyst and thedecision maker.
165Return on Investment
Incrementality
All benefits, expenses, and investments that will change as a re-sult of the decision should be included in the financial forecast.That is the concept of incrementality. This includes indirect ex-penses and the cost of additional support staff. An engineer whomust be added to the team to support the product is incremental.So is marketing research necessary to make some marketplacedecisions. Any spending is incremental as long as it results fromimplementing the decision and will not be incurred if the deci-sion is to not implement the project.
The financial forecast should not include allocations of exist-ing corporate overhead. The purpose of the forecast is to identifythe financial impact that the project will have on the company.
Forecast Time Frame
With a few exceptions, most forecasts should provide a maxi-mum of five years of cash inflows. Because of changes in technol-ogy and global economic turmoil, predicting the future is moredifficult than ever. Even though we hope that the new businesswill last forever, we know that that will not happen. If five yearsof cash inflows do not justify the investment and permit the com-pany to achieve its ROI targets, the risk factors increase substan-tially.
Adding years to the forecast can be a form of analytical ma-nipulation, whether intentional or not. More years of cash in-flows will increase the ROI. Therefore, using a set number ofyears for all forecasts assures comparability and objectivity.
Exceptions will include calculating the ROI on such things aspharmaceutical research or the construction of major oil pipe-lines. These may very well have time horizons of 10 years or evenlonger.
Accounting Rules
The forecast should respect the accounting rules and practicesthat will govern the company’s reporting over the period forwhich the forecast is made. This is particularly important as it
166 Decision Making for Improved Profitability
relates to tax reporting, which will have significant cash flow ef-fects. However, adhering to accounting format requirements isnot critical except insofar as cash flow will be affected. After all,the analysis is forecasting the future, not reporting the past.
External Financing
Cash flow forecasts should assume that the investments will beall cash, and the investments should be included in the forecastat the point when the commitments to acquire assets are made.This is true even if the company expects to get financing for theproject from a bank or even from the equipment vendors. Theproject and the underlying risk begin when the commitments aremade, which may be long before the cash is disbursed. While theuse of external financing sources may be favorable and in factmay be necessary, external financing increases risk. Debt servicepayments are a fixed cost that increases the company’s break-even point.
If external financing is decided upon, the first analysisshould reflect the now hypothetical up-front cash investment.This is called the base case. The ROI calculated on this basisshould exceed the company’s ROI hurdle rate. Analyses of fi-nancing alternatives can then be compared to this base case.Thus, discounted cash flow analysis becomes a tool for evaluat-ing proposals from banks and other lenders. When the externalfinancing is included in the analysis, the ROI will increase sig-nificantly. Financing is in fact postponing cash outflows. The costof that financing will be included in the revised forecast. Thebefore-tax cost of borrowing should be substantially below theafter-tax ROI, thus improving that ROI on the project in its en-tirety.
Working Capital Investment
As we have said, an investment is an exposure of cash that hasthe objective of producing cash flow benefits in the future. If aproject involves business expansion, additional inventory will beneeded in order to produce the additional products, and addi-tional accounts receivable will be needed in order to finance the
167Return on Investment
sales that will be made. Inventory and accounts receivable areinvestments just like the purchase of fixed assets. They should bean integral part of the project analysis.
Economics and Pricing
Forecasts should reflect current product prices and operatingcosts. The company should never rely on higher future sellingprices to justify current investments.
1. Technology is causing prices to be lower rather thanhigher as a business expands. Competition on a globalscale makes every business vulnerable to increased pric-ing pressures.
2. If the project implementation is successful, potentialcompetitors will be attracted and will soon be actual com-petitors. As a result, prices will not be higher. Computers,computer software and operating systems, and pharma-ceuticals are prime examples of this. It is very dangerousto invest in a business on the premise that selling pricesin the future will be higher.
You should look at the annual economic forecasts publishedin the major business publications. These are surveys of thecountry’s top fifty economists. The divergence of their expertanalyses is eye-opening. The range between the most optimisticand the most pessimistic forecasts of GNP, inflation, and unem-ployment is extreme. Most of these forecasts will be wrong. In-credibly, these economists are forecasting only one year in thefuture. If these economists cannot forecast one year accurately,how can we novices impose our economic forecasts on an ROIanalysis and expect to be reasonably accurate? The most effectivemethod of dealing with this uncertainty is to assume that thecurrent economic situation continues, perhaps adjusting it forknown events extending into the next year.
Establishing the ROI Target
Determining what the company will define as an acceptable re-turn on investment is a very important process. The target ROI
168 Decision Making for Improved Profitability
may be the result of intense mathematical modeling or, at theother extreme, simply a continuation of what has worked in thepast. We will simply use the phrase hurdle rate for this target.Using both the term hurdle rate and the term cost of capital couldbe seriously misleading. The ROI target used should reflect:
The cost of raising debt and equity funds, past and futureThe expected risk and the company’s ability to tolerate itAlternative uses of the funds, such as debt reductionThe improved profitability necessary if the company is toattain future goals
Exhibit 10-2 outlines a method of establishing a companyROI target (hurdle rate). It incorporates the factors stated pre-viously. The sequence of events is described by the numbers inparentheses.
1. The company currently has a 10 percent return onassets. Notice that it uses a version of the ratio that em-ploys after-tax cash flow rather than the traditional netincome. The calculation is:
After-Tax Cash FlowAssets
�$1,000
$10,000� 10%
2. The company is developing a strategic plan that will in-clude a financial forecast covering the same time period.It does this for a number of reasons, including gettinganswers to the following questions:
a. What investments can it afford?b. Does the plan achieve the targets?c. How profitable must those investments be?
Targeted return on assets for the year 2004 is determinedto be 11 percent. This represents a significant improve-ment from the level for the current year. It should bebenchmarked against competitors’ returns and shouldreflect cash requirements for debt service and dividendpayments.
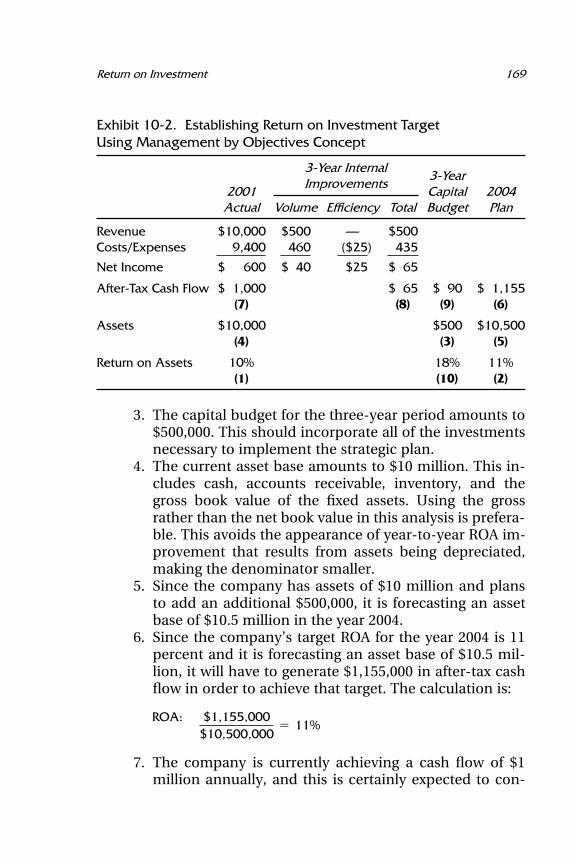
169Return on Investment
Exhibit 10-2. Establishing Return on Investment TargetUsing Management by Objectives Concept
3-Year Internal3-Year
Improvements2001 Capital 2004Actual Volume Efficiency Total Budget Plan
Revenue $10,000 $500 — $500Costs/Expenses 9,400 460 ($25) 435
Net Income $ 600 $ 40 $25 $ 65
After-Tax Cash Flow $ 1,000 $ 65 $ 90 $ 1,155(7) (8) (9) (6)
Assets $10,000 $500 $10,500(4) (3) (5)
Return on Assets 10% 18% 11%(1) (10) (2)
3. The capital budget for the three-year period amounts to$500,000. This should incorporate all of the investmentsnecessary to implement the strategic plan.
4. The current asset base amounts to $10 million. This in-cludes cash, accounts receivable, inventory, and thegross book value of the fixed assets. Using the grossrather than the net book value in this analysis is prefera-ble. This avoids the appearance of year-to-year ROA im-provement that results from assets being depreciated,making the denominator smaller.
5. Since the company has assets of $10 million and plansto add an additional $500,000, it is forecasting an assetbase of $10.5 million in the year 2004.
6. Since the company’s target ROA for the year 2004 is 11percent and it is forecasting an asset base of $10.5 mil-lion, it will have to generate $1,155,000 in after-tax cashflow in order to achieve that target. The calculation is:
ROA: $1,155,000$10,500,000
� 11%
7. The company is currently achieving a cash flow of $1million annually, and this is certainly expected to con-
170 Decision Making for Improved Profitability
tinue. There are two sources of improvements in thisperformance, internal and external. Internal improve-ments are those actions that the company can take toimprove existing performance that do not require in-vestments or additional capacity. External improve-ments are the benefits resulting from additionalinvestments.
8. Internal improvements are estimated to add $65,000 an-nually to after-tax cash flow. This results from the mar-gins on additional sales volume and improved processefficiency.
9. Cash flow in 2004 must amount to $1,155,000. Subtract-ing from this figure the amount of current cash flow andthe amount estimated to be added by internal improve-ments leads to the conclusion that the annual cash flowgenerated by capital investments must amount to$90,000, as follows:
Target Cash Flow $1,155,000� Amount Already Generated � 1,000,000� Internal Improvements � 65,000
� Amount to Be Generated by Capital Investments $ 90,000
10. To achieve this amount of cash flow, the return on in-vestment for all projects must be at least 18 percent. Thecalculation is:
ATCFCapital Budget
�$90,000
$500,000� 18%
This is not a mathematically perfect model, although its flaws donot diminish its value as a decision-making tool. Projects that areimplemented in the first year of this three-year plan will probablyreach their cash flow potential by year 3. However, larger projectsthat are implemented in the third year of the plan may actuallydetract from the company’s ability to attain the ROA requirementof 11 percent, a project that is implemented in the third year willadd to the asset base but may not yet be adding to the cash flow.Issues such as this will have to be resolved. However, using the
171Return on Investment
18 percent hurdle rate as a guide will result in quite effectivedecision making.
Analytical Simulations
The internal rate of return formula can help managers answermany business questions and evaluate reward/risk issues. To re-view:
PCVO � PVCI Factor (%, yrs)
Example 1: Number of Years.
A company is considering an investment of $10,000 and expectsit to produce annual cash inflows of $4,000. If the company’starget ROI is 20 percent, for how many years must these cashinflows continue if the company is to decide to make the invest-ment?
Using the formula:
$10,0004,000
�$4,000 � F (20%, yrs)
4,000
Remembering your eighth-grade algebra, the factor equals 2.5.
Factor (20%, yrs) � 2.5
We now search Table 10-2 under the 20 percent column until wefind a factor near 2.5. Notice that at three years the factor is 2.107and at four years the factor is 2.589. Therefore, this investmentopportunity must produce cash flows at this level for almost fouryears for the company to achieve its 20 percent ROI target.
This investment model might describe a very high tech in-vestment where the life of the technology itself is in question. Ifthe technology will not continue to be up to date for more thanthree years, then the company may not achieve its investmentrequirements and should invest its funds elsewhere. This modelcan also be used to evaluate fashion items or other investmentswith uncertain futures.
172 Decision Making for Improved Profitability
Example 2: P&L Components
A company is considering an investment of $10,000. The com-pany requires an ROI of 24 percent and expects the investmentto produce cash flows for four years. What annual cash flows arenecessary in order to justify the investment?
$10,000 � Annual Cash Flows � Factor (24%, 4yrs)$10,000 � Annual Cash Flows � 2.404
Annual Cash Flows � $10,000/2.404 � $4,160
Using the cash flow forecasting model, we can now determinewhether the product’s selling price, volumes, and cost structurewill result in annual cash flows of $4,160.
Example 3: Corporate Acquisition
A company is considering the purchase of another company. Itis a ‘‘friendly’’ acquisition to the extent that the buyer and sellerare sharing information and negotiating. How much should thebuyer be willing to pay if it is to achieve its required return oninvestment of 24 percent? The company’s time horizon is tenyears.
1. After-tax cash flows forecast by seller $ 9,0002. Reduction by buyer because seller is optimistic � 2,0003. Synergistic benefits buyer will experience after takeover � 3,0004. Benefits of improved efficiencies that buyer will implement � 2,000
5. Forecast cash inflows achieved by buyer after takeover $12,000
We then apply the ROI formula:
6. Investment � $12,000 � F (24%, 10 yrs)7. $12,000 � 3.6819 � $44,183
The maximum financial exposure that the company can af-ford if it is to receive all of the benefits of owning the subjectcompany and still achieve an ROI of 24 percent on the purchaseis $44,183. This is not the recommended purchase price, how-ever. The recommended purchase price is calculated as follows:
173Return on Investment
Maximum financial exposure $44,183Investment necessary to achieve synergies � 7,000Investment necessary to achieve efficiencies � 3,000
Maximum purchase price $34,183
Some additional notes and comments:Sellers tend to be optimistic because they are trying to sell
something. Therefore, the forecasts they provide have to be dis-counted, as is done on line 2. The biggest reasons for the failureof an acquisition are:
The buyer paid too much.The benefits were not achieved as soon as expected.Unknown problems surfaced after the takeover.
Reducing the amount of cash paid up front improves the ROI.Paying for the business over many years both improves the ROIand reduces risk. This improvement can be greatly enhancedthrough the use of an ‘‘earn-out’’ provision, which involves tyingthe payments to the achievement of the cash inflows that wereforecast. If the seller forecast cash inflows of $9,000 per year, thisis in fact what the buyer is paying for. Tying the buyer’s paymentsto the achievement of that cash flow ensures that the buyer willpay for only those cash flows that are actually achieved. It alsochallenges the credibility of the seller and assures the seller’s ef-forts should the seller remain part of the buyer’s team.
Comprehensive Case Study
This case study will provide an overview of the entire process ofanalyzing an investment opportunity using the discounted cashflow technique. In addition to this overall review, a number ofissues will surface that the analyst should consider. These in-clude working capital investment and the impact that productintroductions may have on other parts of the business.
Woodbridge Manufacturing Company is considering the in-troduction of a new product, an especially ergonomically correctcomputer pad. Sales of one of the company’s existing products
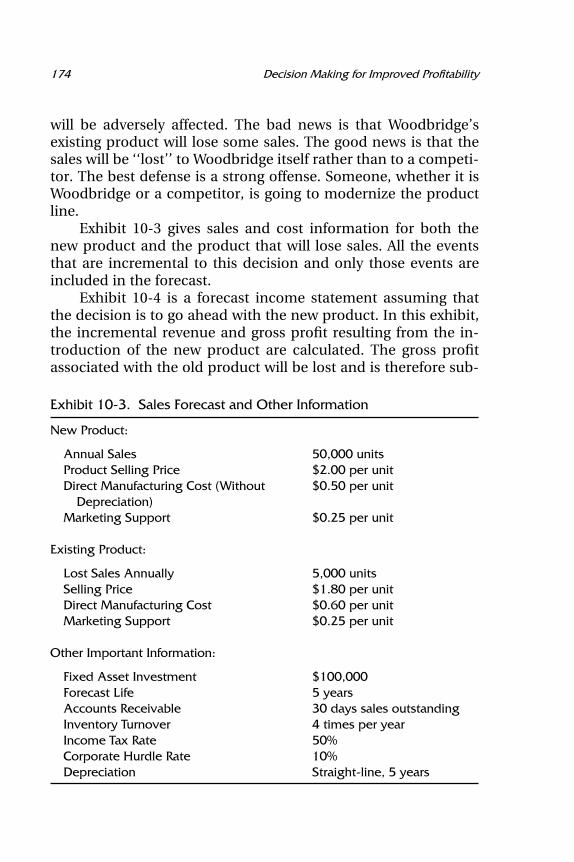
174 Decision Making for Improved Profitability
will be adversely affected. The bad news is that Woodbridge’sexisting product will lose some sales. The good news is that thesales will be ‘‘lost’’ to Woodbridge itself rather than to a competi-tor. The best defense is a strong offense. Someone, whether it isWoodbridge or a competitor, is going to modernize the productline.
Exhibit 10-3 gives sales and cost information for both thenew product and the product that will lose sales. All the eventsthat are incremental to this decision and only those events areincluded in the forecast.
Exhibit 10-4 is a forecast income statement assuming thatthe decision is to go ahead with the new product. In this exhibit,the incremental revenue and gross profit resulting from the in-troduction of the new product are calculated. The gross profitassociated with the old product will be lost and is therefore sub-
Exhibit 10-3. Sales Forecast and Other Information
New Product:
Annual Sales 50,000 unitsProduct Selling Price $2.00 per unitDirect Manufacturing Cost (Without $0.50 per unit
Depreciation)Marketing Support $0.25 per unit
Existing Product:
Lost Sales Annually 5,000 unitsSelling Price $1.80 per unitDirect Manufacturing Cost $0.60 per unitMarketing Support $0.25 per unit
Other Important Information:
Fixed Asset Investment $100,000Forecast Life 5 yearsAccounts Receivable 30 days sales outstandingInventory Turnover 4 times per yearIncome Tax Rate 50%Corporate Hurdle Rate 10%Depreciation Straight-line, 5 years
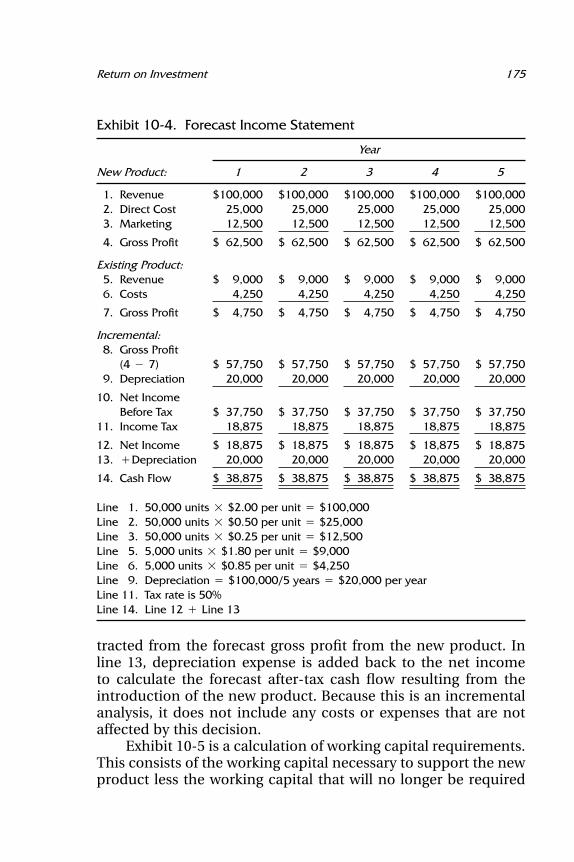
175Return on Investment
Exhibit 10-4. Forecast Income Statement
Year
New Product: 1 2 3 4 5
1. Revenue $100,000 $100,000 $100,000 $100,000 $100,0002. Direct Cost 25,000 25,000 25,000 25,000 25,0003. Marketing 12,500 12,500 12,500 12,500 12,500
4. Gross Profit $ 62,500 $ 62,500 $ 62,500 $ 62,500 $ 62,500
Existing Product:5. Revenue $ 9,000 $ 9,000 $ 9,000 $ 9,000 $ 9,0006. Costs 4,250 4,250 4,250 4,250 4,250
7. Gross Profit $ 4,750 $ 4,750 $ 4,750 $ 4,750 $ 4,750
Incremental:8. Gross Profit
(4 � 7) $ 57,750 $ 57,750 $ 57,750 $ 57,750 $ 57,7509. Depreciation 20,000 20,000 20,000 20,000 20,000
10. Net IncomeBefore Tax $ 37,750 $ 37,750 $ 37,750 $ 37,750 $ 37,750
11. Income Tax 18,875 18,875 18,875 18,875 18,875
12. Net Income $ 18,875 $ 18,875 $ 18,875 $ 18,875 $ 18,87513. �Depreciation 20,000 20,000 20,000 20,000 20,000
14. Cash Flow $ 38,875 $ 38,875 $ 38,875 $ 38,875 $ 38,875
Line 1. 50,000 units � $2.00 per unit � $100,000Line 2. 50,000 units � $0.50 per unit � $25,000Line 3. 50,000 units � $0.25 per unit � $12,500Line 5. 5,000 units � $1.80 per unit � $9,000Line 6. 5,000 units � $0.85 per unit � $4,250Line 9. Depreciation � $100,000/5 years � $20,000 per yearLine 11. Tax rate is 50%Line 14. Line 12 � Line 13
tracted from the forecast gross profit from the new product. Inline 13, depreciation expense is added back to the net incometo calculate the forecast after-tax cash flow resulting from theintroduction of the new product. Because this is an incrementalanalysis, it does not include any costs or expenses that are notaffected by this decision.
Exhibit 10-5 is a calculation of working capital requirements.This consists of the working capital necessary to support the newproduct less the working capital that will no longer be required

176 Decision Making for Improved Profitability
Exhibit 10-5. Working Capital Investment
Inventory Calculation:
Cost of Goods SoldInventory Turnover
� Inventory
Accounts Receivable:
Annual Revenue365
� Average Revenue Per Day
Average Revenue per Day � Days’ Sales Outstanding �Accounts Receivable
New product:
Inventory$0.50 � 50,000 units � $25,000/4 � $6,250Accounts Receivable$100,000
365� $273.98 � 30 � $8,219
Working Capital Investment for New Product $14,469
Existing Product:
Inventory$0.60 � 5,000 units � $3,000/4 � $ 750Accounts Receivable$9,000
365� $24.66 � 30 � $ 740
Working Capital Investment for Existing Product $ 1,490
Incremental Working Capital Investment $12,979
because of reduced sales of the existing product. Inventory calcu-lations are based upon direct costs, while accounts receivable isbased on revenue forecasts.
Exhibit 10-6 is the comprehensive cash flow forecast. It com-bines the investment of $100,000 plus the incremental workingcapital required to support the product with the improved cashflows that are forecast to result from introducing the new prod-
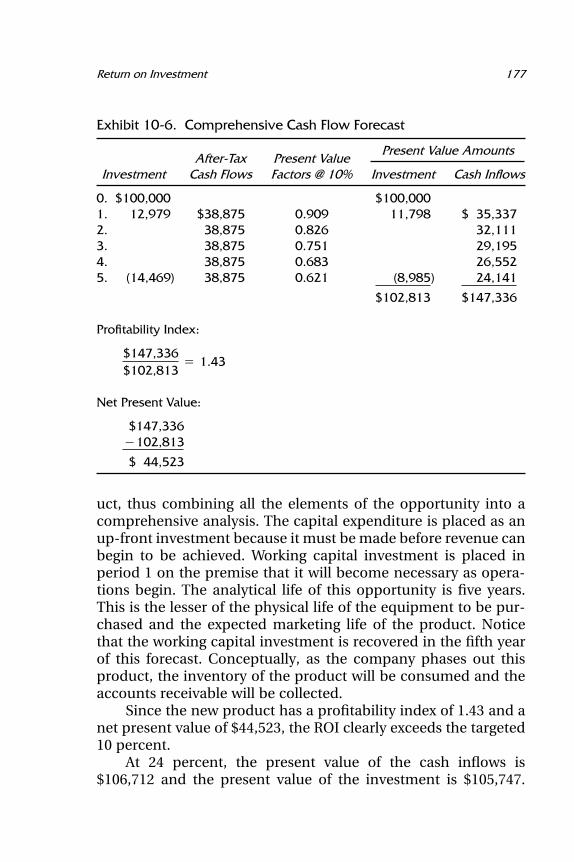
177Return on Investment
Exhibit 10-6. Comprehensive Cash Flow Forecast
Present Value AmountsAfter-Tax Present Value
Investment Cash Flows Factors @ 10% Investment Cash Inflows
0. $100,000 $100,0001. 12,979 $38,875 0.909 11,798 $ 35,3372. 38,875 0.826 32,1113. 38,875 0.751 29,1954. 38,875 0.683 26,5525. (14,469) 38,875 0.621 (8,985) 24,141
$102,813 $147,336
Profitability Index:
$147,336$102,813
� 1.43
Net Present Value:
$147,336�102,813
$ 44,523
uct, thus combining all the elements of the opportunity into acomprehensive analysis. The capital expenditure is placed as anup-front investment because it must be made before revenue canbegin to be achieved. Working capital investment is placed inperiod 1 on the premise that it will become necessary as opera-tions begin. The analytical life of this opportunity is five years.This is the lesser of the physical life of the equipment to be pur-chased and the expected marketing life of the product. Noticethat the working capital investment is recovered in the fifth yearof this forecast. Conceptually, as the company phases out thisproduct, the inventory of the product will be consumed and theaccounts receivable will be collected.
Since the new product has a profitability index of 1.43 and anet present value of $44,523, the ROI clearly exceeds the targeted10 percent.
At 24 percent, the present value of the cash inflows is$106,712 and the present value of the investment is $105,747.
178 Decision Making for Improved Profitability
Therefore, the actual return on investment for this opportunityis just above 24 percent.
Additional Issues:There are many simplifying assumptions that go into a fore-
cast. The first is that the forecast will be achieved. Notice that theworking capital investment is placed in year 1. It could be arguedthat the inventory will be needed before the project starts (inperiod 0), whereas the accounts receivable will begin in year 1.The statement that the working capital investment will be fullyrecovered in year 5 is also speculative. Some analysts use year 6for this recovery, after the project is over. The idea that all of theinventory will be able to be sold at full price in year 5 is alsoquestionable. The solution is to prepare the investment and cashflow forecast with as much objectivity and thought as possible,but to never forget that this is a forecast.

Part 4
ADDITIONAL FINANCIAL
INFORMATION

This Page Intentionally Left Blank
Chapter 11
Financing the Business
BORROWING MONEY IS A VERY positive corporate strategy. Ithelps the company to increase its growth, finance seasonal slow-downs, and invest in opportunities that will ensure its future.However, while the proper financing strategy will support theseobjectives, the wrong financing strategy will make what other-wise would be excellent corporate programs vulnerable to failure.
Business and our global economy are very dynamic. Theyare constantly changing, and the rules are always being rede-fined. Therefore, financing strategies must also be dynamic.What was appropriate for the company six months ago may bevery undesirable now. So, like most other aspects of the business,the company’s financing requires constant monitoring and revi-sion.
Those members of the management team who are responsi-ble for marketing, operations, human resources, and technologyhave no direct responsibility for the company’s relations with thefinancial community, although in a smaller company they mayparticipate in this process when a major project is involved. Allsenior executives of public companies will be called upon to an-swer questions posed by stockholders and the financial commu-nity.
Every major project of the company will ultimately be af-fected by the existence, form, and quantity of the financing thatthe company secures. Budgets are expanded and people arehired because of new financing. Budgets and headcounts are re-duced when financing is not obtained or the terms are onerous.
181
182 Additional Financial Information
This chapter is included in this book because every business-person has an extreme vested interest in financing and financialstrategy.
The main issues affecting financing are its:
MaturityCostConditions and restrictionsPayment scheduleCollateral
There are two classes of financing, debt and equity.
Debt
A company that uses debt to finance its business can engage ineither short-term or long-term borrowing. Short-term borrowinginvolves loans with a maturity of one year or less. It is used tocover current cash needs, such as financing growth, seasonalcash flow needs, and major customer orders. The loans in thiscategory are often called working capital loans, because that iswhat they finance.
Long-term loans have maturities of longer than one year.Companies borrow long-term to finance major capital expan-sions, research and development projects with longer time hori-zons, and real estate.
Short-Term Debt
There are a number of types of both short- and long-term debt,and a number of related elements. We first cover those having todo with short-term debt:
1. Accounts receivable financing2. Factoring3. Inventory financing4. Floor planning5. Revolving credit
183Financing the Business
6. Zero-balance accounts7. Lines of credit8. Credit cards9. Compensating balances
Accounts Receivable Financing. This is an excellent form ofshort-term financing that assists the company in its cash flowmanagement. It involves using part or all of accounts receivableas collateral for short-term loans. The collateral might includeonly specific invoices if some of the invoices are over 90 days oldor if some customers’ credit is not of high quality. (If the latter istrue, maybe these customers shouldn’t be given credit at all.) Byrefusing to lend against these invoices, the bank is protectingitself from lending against the receivables of low-credit-ratedcustomers. At the same time, it is giving the company somesound advice regarding dealings with these customers.
With accounts receivable financing, the company retains thecredit risk if its customers do not pay, and the company is re-sponsible for collecting on its customers’ accounts. Repaymentschedules for this type of financing are highly negotiable. Thecompany should make certain that undesirable inflexibilities arenot built into the repayment terms. There are critical ‘‘shades ofgray’’ between financial discipline and bank-imposed restriction.Banks and other lenders will typically create a line of credit equalto between 70 and 90 percent of qualified accounts receivable.
Factoring. In this financing alternative, the company actu-ally sells its qualified accounts receivable to the bank or an inde-pendent factoring company at a discount from the face value.The company receives immediate cash for its invoices. The in-voices will direct the customers to pay the funds directly to thebank or factoring company (the factor).
This form of financing is expensive compared with alterna-tive forms. In addition, it may lead customers to misjudge thefinancial position of the company and conclude that it is havingfinancial difficulties. The factor may have the right to take theinitiative and call overdue accounts directly.
Factoring can cost between 2 and 5 percent per month. Thiscould significantly cut into margins, especially if the borrower is
184 Additional Financial Information
in a low-margin business. However, if the terms of sale are cur-rently 2/10, n/30, factoring may be a desirable alternative. Sellingon terms of 2/10, n/30 means that the customer can take a 2percent discount off the invoice amount if the invoice is paidwithin 10 days of the invoice date, and in any event paymentsare expected within 30 days. With these terms, customers willeither take the 2 percent discount or delay payment for up to30 days. If factoring can be accomplished at 2 percent and thecompany can get its cash immediately, factoring is an attractivealternative.
Accounts receivable can be sold to a factor with or withoutrecourse. If the sale is without recourse, the buyer of the accountsreceivable (the factor) assumes the full credit risk. If the customerdoes not pay, the factor loses the money. If the sale is with re-course, the company assumes ultimate responsibility for creditlosses if the customer does not pay. Selling without recourse isvery expensive. Because only very high-quality receivables qual-ify for this form of financing, there is rarely a credit loss. So sellingwithout recourse rarely pays. Companies can actually buy creditinsurance that protects them against credit loss.
Inventory Financing. Usually only finished goods and rawmaterials inventory qualify as a form of collateral. There is nomarket for work in process. Lenders will usually provide financ-ing in the amount of one-half of the collateral that qualifies. Thisis a good form of financing to cover the cost of fulfilling a verylarge order from a high-quality customer, or perhaps, in a sea-sonal business, to cover a period of high cash needs that will befollowed by a period of high cash inflows.
Using inventory as collateral requires fairly sophisticated in-ventory control methods, including systems support. This im-poses corporate self-discipline, which the company should haveanyway.
Floor Planning. Floor planning is a special form of inventoryfinancing that is very common in the retail sale of very high-priced products, such as boats, cars, and appliances. With thisform of financing, it is the vendor and its products that must becredit-qualified. The lender buys the products from the manufac-
185Financing the Business
turer and places them in the retailer’s store and supporting ware-house, in effect lending them to the retailer.
The lender retains title to the products. When the product issold by the retail dealer, the dealer must first pay the lender inorder to get title, which it can then transfer to the purchasingcustomer. This may be a simultaneous transaction, so that theretailer just receives the difference between the selling price andthe loan amount.
Floor planning is often provided by a finance companyowned by the manufacturer. The manufacturer and its associatedfinance company will provide various ‘‘bargains’’ to induce theretailer to overload on inventory. This smooths out the manufac-turing process and places a lot of product in the dealer’s show-room, which presumably will help sales. Slow-moving product isoften provided to the dealer at zero financing cost as a way forthe manufacturer to handle excess inventory.
As a business lesson, count the number of cars in a dealer’slot, calculate the estimated value of those cars (maybe the num-ber of cars � $20,000), and multiply that by 1 percent per month(the interest the dealer has to pay on the loan). You can get anidea of how many cars a dealer must sell each month just tocover its floor plan interest expense.
Revolving Credit. This is basically a working capital loanwith accounts receivable and inventory as collateral. The maxi-mum amount of the loan is based on a formula tied to high-quality inventory and accounts receivable. For example, the max-imum amount might be 75 percent of accounts receivable lessthan 60 days old and 50 percent of finished goods and raw mate-rials inventory less than 60 days old. This formula forces the com-pany to make regular payments and reduce the outstanding debtwhen the inventory is used and the receivables are collected.
Because of the pressure to repay and the constant monitor-ing of working capital, it would be very dangerous for a companyto use this form of funding to support long-term projects. Somebanks require what is known as a ‘‘cleanup’’ period. This meansthat for some period of time, perhaps one month per year, theloan balance must be zero.
186 Additional Financial Information
Zero-Balance Accounts. This type of account may very wellbe required by another loan agreement. In a ‘‘regular’’ loan, theborrower collects funds from its customers, deposits the funds inthe company checking account, and makes some sort of paymentto the lender for principal and interest on the loan. With a zero-balance feature, the loan and the checking account are con-nected. When customer payments are deposited in the checkingaccount, the funds are automatically used to reduce the loan bal-ance and pay the interest that is due. Since the account balanceis therefore zero, when the company writes checks, these checksincrease the loan balance.
This feature is very similar, conceptually, to the overdraftprivileges attached to individuals’ checking accounts (althoughindividuals usually decide how much of the funds they depositshould be used to reduce the loan balance, subject to a minimummonthly payment). This feature can be very beneficial to thecompany because float is reduced to zero. Customer paymentsautomatically reduce the loan balance. The interest rate may alsobe advantageous because the bank knows that as the companyreceives payments from its customers, the loan will be repaid.Also, the company borrows only the exact amount it requires.
Lines of Credit. A line of credit is not a loan, it is a veryfavorable method of securing a loan. The cliche describing thisarrangement is ‘‘borrow when you don’t need it so that you willhave it when you do.’’
Suppose that a company is considering expansion plans or amajor expenditure, to take place sometime within the next sixmonths. The company’s balance sheet is strong, and its need forthe loan is uncertain, or at least not immediate. The companycan go to the bank and arrange for a line of credit. This is anadvance reservation that makes funds available, to be used onlyif and when they are needed.
The advantages of a line of credit are:
The loan is arranged at the timing of the borrower.The funds are available; they can be used or not, at thechoice of the borrower.The company is in a position to make major purchase
187Financing the Business
commitments knowing that this and maybe other financ-ing options are available.It provides considerable purchase price bargaining power.Interest payments do not begin until the funds are actuallyneeded.
The company will pay a reservation fee, probably in therange of 1 percent of the total line. Payment terms, interest, andother fees and collateral requirements will be the same as thoseon any other loan and are always negotiable. This is conceptuallythe same as a homeowner’s equity line of credit.
Credit Cards. More and more customer orders are beingplaced by phone or by computer over the Internet. Allowing thecustomer to pay by credit card accomplishes a number of things:
It eliminates accounts receivable, thus eliminating the waitfor the money and the associated paperwork.The customer’s creditworthiness need not be evaluated.There will be no overdue receivables.The customers can take as much time as they want to pay.
For smaller orders, waiting for customer payments and mak-ing the often inevitable collection phone calls eliminates theprofit. Although the company must pay the credit card fee, whichis approximately 2 percent, accepting credit cards will makesmall orders profitable.
Compensating Balances. Requiring compensating balancesis a bank strategy that increases the effective cost of borrowingmoney without increasing the stated interest rate. A compensat-ing balance means that the borrower is required to keep a certainminimum balance in the checking account at all times.
If a company borrows $1,000,000 for one year at 10 percent,the interest rate is obviously 10 percent. If, however, a 10 percentcompensating balance is required, the borrower has the effectiveuse of only $900,000. This results in an effective rate of 11 per-cent. If the borrower really needs $1.0 million, it must borrowapproximately $1.1 million.
188 Additional Financial Information
Along with loan origination fees, collateral audit fees, searchfees, and other such charges, compensating balances are a costof borrowing and can be negotiated.
Long-Term Debt
The following types of long-term debt are covered here:
1. Term loans2. Bonds3. Debentures4. Mortgage bonds5. Convertible bonds6. Senior debt7. Subordinated debt8. Junk bonds
Term Loans. This is the form of long-term debt most fre-quently used by businesses. It is a loan from a bank to a companythat is used to finance expansion efforts. It has a fixed maturitydate, frequently five to seven years from the date of the loan. Thecompany will repay the loan in monthly installments of principaland interest. Spreading the payments of the principal over thelife of the loan is called loan amortization. The monthly pay-ments of principal and interest are called debt service. The amor-tization of the principal can take place over a period that is longerthan the loan period. With this arrangement, the remaining prin-cipal is due at the end of the loan period. That ending balance iscalled a balloon payment.
Bonds. A bond has many characteristics similar to those of aterm loan. The differences are:
1. A bond is a negotiable instrument that can be bought andsold like common stock.
2. A bond is usually sold to the public through a public offer-ing registered with the Securities and Exchange Commis-sion.
189Financing the Business
Bonds are usually sold in units of $1,000. A bond that is selling atits face value is said to be selling at par. The interest rate is calledthe coupon. After these securities are issued, their prices fluctu-ate in accordance with economic conditions. The prices of manyof these securities are quoted daily in all major financial publica-tions. Bonds are usually interest payments only with principalrepaid at maturity.
Debentures. A debenture is a bond with only ‘‘the full faithand credit’’ of the company as collateral. Other than the creditrating and creditworthiness of the debtor, there is no specific col-lateral. The owners of these bonds, therefore, are classified asunsecured creditors.
Mortgage Bonds. A mortgage bond differs from a debentureonly in that there is specific collateral to back up the security.Owners of these bonds are known as secured lenders. Because ofthis collateral, the interest rate should be lower than that on adebenture.
Convertible Bonds. This is a type of debenture with a veryinteresting feature. If a company does not have a high credit rat-ing and therefore does not qualify for a reasonable interest rate, itwould be prohibitively expensive for that company to sell bonds.Remember that investors and lenders have very different risk/reward relationships. An investor may take a very high risk in thehope of experiencing a very high reward. A lender can nevermake more that the interest rate, and thus a lender that takes avery high risk may lose everything without having the prospectof a high reward. The convertible bond changes the risk/rewardrelationship for the lender.
The bond is sold at a relatively low interest rate, perhaps7 percent rather than the 12 percent that the company wouldotherwise have to pay. The owner of the bond has the right toconvert the bond into shares of common stock at a later date.The company enjoys an affordable interest rate and can now ex-pand its business. The owners of the convertible bonds get someinterest and share in the rewards of success if the company doeswell and the price of the stock increases to above a predeter-
190 Additional Financial Information
mined threshold price called the strike price. Prices of convertiblebonds are listed in the bond price tables in major financial publi-cations with the extra symbol CV.
Senior Debt. This is a debenture issue that gives its holderspriority over the holders of all other debenture issues in receivinginterest payments and access to the company’s assets in case ofa bankruptcy.
Subordinated Debt. Holders of this type of debt have prior-ity below that of the holders of senior debt. Because of this sec-ondary position and the resulting higher risk position, holders ofthis debt will receive a higher interest rate than the holders ofsenior debt.
Junk Bonds. The creditworthiness of most companies andtheir securities is rated by various agencies such as Standard &Poor’s and Moody’s. Generally bonds with the three or four high-est ratings are classified as investment grade. Bonds in this cate-gory are recommended for pension funds and very conservativeinvestors.
Bonds that do not qualify for these high ratings have a muchsmaller pool of available buyers. As a result, they must pay con-siderably higher interest rates, and so they are classified as ‘‘highyield.’’ As a company’s creditworthiness declines, the yield on itsbonds increases at an increasing rate because of the incremen-tally greater risk. When bonds reach a very-high-yield, lower-quality status, they are known as ‘‘junk’’ bonds.
Equity
Selling common and preferred shares is essentially a permanentform of financing. It is also a form of financing that requires norepayment. In addition to raising funds, equity may also be is-sued for the purpose of expanding ownership of the stock, reduc-ing concentration of voting power, and making the stock moreliquid for stock market purposes.
There are three particularly important categories under the
191Financing the Business
general heading of stockholders’ equity that deserve attentionhere:
1. Venture capital2. Preferred stock3. Common stock
Venture Capital
Investors who supply venture capital are usually financing notmuch more than an idea, perhaps supported by a business plan.To obtain this type of financing, the founders of a company mustbe people who have some sort of track record or credentials indi-cating that they can effectively span the gap between idea andmarketable product. Venture capital financing is most frequentlyavailable to high-tech ideas.
Venture capital financiers are a very valuable source of early-stage investment funds. The companies they finance are not can-didates for any sort of bank borrowing unless the principals ortheir backers are high-net-worth individuals who are willing topersonally guarantee the loans.
People seeking venture capital financing will have a numberof fundamental issues to deal with. Venture capital investors willwant a large piece of the equity so that if the company is success-ful, its success will pay for their probable other failures. They willbe intimately involved in how their money will be spent. On theother hand, the company founders may very well not have anyalternative, and also may not have the managerial and marketingskills to create a viable business. Therefore, unless the companyfounders have an ‘‘angel’’ investor, venture capital is a very valu-able option.
An ‘‘angel’’ investor is usually a high-net-worth individualwho finances many start-ups that may not appear attractive tomore traditional investment firms. Such an investor often men-tors the start-up’s management team and provides necessarymanagement and marketing skills.
Preferred Stock
Preferred stock is a hybrid class of equity that is usually associ-ated with mature businesses with considerable, predictable cash
192 Additional Financial Information
flow. The company may have very high investments in fixedassets and may have limited ability to raise money through debtissues. Preferred shareholders receive an indicated, not guaran-teed dividend. In periods when cash is tight, holders of preferredstock receive their full dividend before common shareholderscan receive any dividend. Preferred stockholders generally arenot entitled to vote, unlike common shareholders, but they mayhave an option to convert their stock into common stock. Whileinterest payments on debt are tax-deductible for the issuer, pre-ferred dividends are not. Thus, for the company this is a fairlyexpensive form of financing.
Common Stock
A company that is going public for the first time will do an initialpublic offering, or IPO. By going public, the company can bothraise a considerable amount of cash and create a market for thestock. This means that the stock held by the existing owners (thecompany’s founders and venture capitalists) will become a liquidasset, enabling them to eventually sell some of it. Going publicis very expensive. SEC filings and legal expenses can cost manyhundreds of thousands of dollars. In addition, the equity of exist-ing owners will be diluted, possibly to the point where they willlose effective control.
Many public companies issue additional shares to investorsover the years to raise funds, improve the liquidity of the stock,and make shares available to employees.
Some Guidance on Borrowing Money
When a company borrows money, whether it is to finance anexpansion, to cover working capital needs, or to acquire anotherbusiness, preparation is required. It is important to understandthat payments of principal and interest will often be requiredeach month.
1. Interest payments are a tax-deductible expense and willappear on the income statement. Repayments of princi-
193Financing the Business
pal are not an expense, will not appear on the incomestatement, and are not tax-deductible.
2. Only the principal portion of the unpaid balance will ap-pear on the balance sheet; it will appear as a current lia-bility if it is due within one year or as a long-term debt ifit is due in more than one year, or it may be split betweenthe two categories. Interest is never a liability on the bal-ance sheet unless a payment is overdue. This will be re-ferred to as an accrued liability.
3. As previously mentioned, the key issues to be negotiatedwhen arranging a loan are:
The amount: When the company is planning the project,a cash flow forecast is necessary, both for analyticalpurposes and also to present to the bank. Don’t ask forless money than you really need. This may impairrather than improve your negotiating ability. Some peo-ple believe, incorrectly, that asking for a smalleramount will enhance their chances of having the loanapproved. However, being inadequately funded willhurt the project and may require you to cut back at atime when you are trying to build the business. This isvery counterproductive.
The interest rate: Evaluate the issue of a fixed rate versus avariable rate. A variable rate may be tied to the Londoninterbank offer (LIBOR) rate or the prime rate. For ex-ample, it may be quoted as ‘‘prime � 2,’’ which meanstwo percentage points above the prime rate. If it is tiedto a prime rate, make sure that you know whose primerate will be used. Will it be your bank’s prime rate orthe rate quoted by the large money center banks, suchas Citi, Chase, or Bank of America? Understand thatwhen interest rates are moving higher, they generallymove quickly. This is in the bank’s best interest. Wheninterest rates are declining, they are often ‘‘sticky,’’meaning slow to move.
The years of payments: The questions involved here are,‘‘What is the maturity date of the loan?’’ and ‘‘Over howmany years will the loan be amortized?’’ The first of
194 Additional Financial Information
these questions indicates how many years of principaland interest payments you will have to make. Makesure that the project being financed will achieve its po-tential before the maturity date of the loan. Also, if theproject is projected to achieve a positive cash flow inthree years, where will the company get the cash itneeds to make payments in the first and second years?Payments must be scheduled (read minimized) in sucha way that they are very low in the early years and thenincrease in the latter years. This permits the loan to berepaid with the cash flows generated by the project it-self. If the maturity and the number of years of amorti-zation are not the same, a balloon payment will berequired, as mentioned previously.
Fees, compensating balances, and restrictions: Incorporateall fees into the loan. That saves cash for the projectand postpones the payments over the life of the loan.Remember that a compensating balance reduces theamount that is actually available for the project.
Collateral: Keep it to a minimum. Try not to pledge all ofyour assets. Doing so restricts your future flexibility andcreates greater vulnerability should cash flows not growas fast as expected. Banks usually have loan/collateralformulas. Find out what these formulas are early in thediscussions.
4. When negotiating, use your banker as an adviser. Her ad-vice is free, and she is often very knowledgeable. Bankers’conservatism serves as a protective mechanism. Yourcompany has needs and will make substantial profitsafter your project succeeds. The bank has needs, as well.But its upside profitability is limited to the interest rate itcan achieve on the loan.
5. Learn how to use the amortization schedule. An examplefollows:
Loan Amount $100,000Time to Pay 5 yearsInterest Rate 8.5%
195Financing the Business
The monthly payment will be $2,051.65. Total payments over the60 months will be $123,099, broken down as follows:
Principal $100,000Interest 23,099
Total $123,099
The payments during the first two years will be mostly interest.In fact, after the first year, the amount of principal still owed willbe more than $83,000.
The number of years of amortization can be more critical tosuccess than the actual interest rate. If the same $100,000 loanhas an interest rate of 9.5 percent (100 basis points or 1 percent-age point higher) but is for a seven- rather than a five-year term,the monthly payment will be reduced to $1,634.40. To improvecash flows during the early years, a higher interest rate but longerterm will be beneficial.
Consider a twenty-year amortization with a seven-year bal-loon. This means that the monthly payments of principal andinterest are calculated as if this were a twenty-year loan. If thisloan had a 10 percent interest rate, the monthly payment wouldbe reduced to $965.02. What this means, however, is that afterseven years, the principal amount will still be $84,072.45, and thisballoon payment is due at that time. This could be dangerous ifthe company has the cash to repay the loan in the early years butdiverts the funds to other uses rather than preparing to repay.When the balloon comes due, the company’s negotiating poweris limited or nonexistent. The best strategy might be to arrangethe twenty-year amortization and then begin to prepay after ayear or two. The company can also prearrange a schedule of twoyears of reduced payments and then extra payments for yearsthree through seven, after which the loan will be fully paid off.
Chapter 12
Business Planningand the Budget
THE PLANNING PROCESS IS A cohesive management effort thatorganizes management knowledge, mobilizes the company’s re-sources, and focuses those resources on achieving the company’sgoals. The first phase of this annual effort is somewhat strategicin nature. It might be best done off site because it requires man-agers to think about the business and to brainstorm ideas. Adatabase of past information is helpful because there is much tobe learned, both positive and negative, from what has happenedin the past. Considerable research is required in the areas of:
MarketsTechnologyThe economic environmentCompetitionHuman resource issuesOrganizational development
S.W.O.T. Analysis
S.W.O.T. stands for strengths, weaknesses, opportunities, andthreats. It is a form of management self-examination to ensurethat all of the issues facing the company have been brought to
196
197Business Planning and the Budget
the surface. The results of this self-examination should be actionplans that identify:
1. Strengths: The best opportunities available to the com-pany. Is the company dedicating adequate resources tothese opportunities? Are marketing and operational ef-forts synchronized? The company must make certain thatits strengths are translated into competitive advantageand improved profitability.
2. Weaknesses: Issues that make the company vulnerable toloss of market share and reduced profitability.
3. Opportunities: Actions that the company can take to im-prove its performance and achieve its goals.
4. Threats: Those internal and external vulnerabilities thatcan damage the company’s future.
The SWOT analysis should cover a variety of areas, including:
ManagementProductsFinancial strengthMarket positionTechnologyOperationsDistributionEconomic environment
In summary, this effort is a corporate self-examination ofwhere you are, where you want to go, and how will you get there.On the basis of this analysis, action plans indicating what actionsshould be taken now in order to attain the desired future shouldbe developed. The planning process does not eliminate risk. Itattempts to ensure that the right risks are taken for the right rea-sons to attain the desired goals. Resource allocation is a key com-ponent of this effort. Will the most important projects beproperly funded? Can crises be anticipated and unforeseenevents dealt with?
198 Additional Financial Information
Planning
There are a number of reasons why planning is necessary:
The future is not an extension of the past.The rate of change in the marketplace will continue to ac-celerate.Technological progress is taking place at an extraordinaryrate.Regulatory issues require constant attention.Population changes, demographics, and geographic shiftsrequire constant adjustment of marketing strategies.Global competition is common in almost every industry.Business success/failure experience is changing.Organizations and the workforce are becoming more com-plex.
Types of Planning
Here are the types of planning that companies engage in andsome key issues involving each:
Strategic: What businesses is the company in, and what busi-nesses should it be in?
Marketing: Why do customers buy the company’s products,and why should they? This should also include discussionsof pricing, quality, and service strategies.
Sales effort: Should the company sell through a dedicatedorganization, through distributors, or via the Internet?How can marketplace awareness of the company’s prod-ucts be improved?
Operations: What is the supply chain strategy? How cantechnology improve customer service and reduce inven-tory at the same time? What functions can be more effi-ciently outsourced? How will demographic changes affectthe workforce in the future?
Financial: How much free cash flow does the company ex-pect to generate? What are the internal (capital expendi-
199Business Planning and the Budget
tures) and external (debt service) demands made uponthese funds?
Requirements for Effective Planning
There are a number of elements that are required if planning isto be effective.
1. Management must provide:Conspicuous supportActive participation
2. Goals must be quantifiable. In addition, if they are to beuseful, goals must be:
Time-relatedMeasurableAttainableSimple to calculateRealistic
3. This is a profit center effort with staff support.4. Performance expectations should be reflected in the
budget.5. The effort should be relatively flexible and simple. It
should not constrain creativity, judgment, and risk taking.
Planning and Management
For planning to be effective, profit center managers need to have:
A clear understanding of their job responsibilitiesGood leadership through constant, clear communicationof plans, goals, and directionThe opportunity to participate in planning and decisionmakingRecognition of their achievementsA performance appraisal system that gives them the op-portunity to discuss advancementProfessional working conditions that are conducive to pro-ductivity and effectiveness
200 Additional Financial Information
Compensation that is related to their accomplishmentsand responsibilityThe opportunity to take normal business risks in a nonpu-nitive environment, without fear of excessive reprisals
Human Tendencies in Planning
There are a number of human tendencies that can interfere withor restrict the company’s planning process.
Optimism: The belief that performance will improve overthe next few monthsShort-term orientation: An emphasis on quarterly andmonthly goals and reviews, with the period beyond thefirst year deemphasizedOversimplifying the environment:Not anticipating competitive reactions to the company’s
movesAssuming that the past will extend into the futurePoint forecasting rather than forecasting a range of out-
comesUnwillingness to face tough issues:Postponing corrective actions in the hope that the problem
will disappearDevoting attention to issues that are interesting but not
criticalAmbiguity in strategic definition:Overstating cash flow expectationsUnderstating capital needsHaving inadequate strategic coordinationMinimizing the difficulty of change:Entering new, relatively unknown marketplacesNot adequately planning and testing new ventures
Reasons Why People Resist Planning
There are a number of reasons why people resist the planningprocess:
201Business Planning and the Budget
They have an unclear understanding of the benefits thatcan result.Planning is time-consuming.Planning requires intuitive thinking rather than doing.The process requires writing plans and sharing them withothers.The process involves accountability; it creates an environ-ment in which they will be measured and critiqued.People often define themselves by what they do ratherthan by how they contribute to the organization’s profit-ability and success.
Significant Planning Guidelines and Policies
Planning guidelines and policies are statements or ground rulesthat provide a framework for management decisions and actionsthat are related to the achievement of organizational objectives.
The framework established by these guidelines and policiesalso affects decisions made within the context of the strategicplan. It is not concerned with day-to-day decisions as long asthose decisions are consistent with strategic objectives.
This framework, in general, serves three important purposes:It (1) provides guidelines, (2) establishes limitations, and (3) fo-cuses direction.
The framework is important for planning in a number ofways:
1. It helps to sharpen and define the organization’s missionand focus.
2. It eliminates the need to make the same decisions repeat-edly.
3. It ensures that efforts are not expended in areas that arenot acceptable to senior management.
4. It provides measurable parameters for performance thatcannot be violated without triggering a managerial re-sponse.
What follows are some examples of policies and policy state-ments, from a variety of corporate perspectives, that help to illus-
202 Additional Financial Information
trate these points and can serve as models for anyone whose jobit is to create and draft policies.
Financial
The company will reinvest at least 60 percent of its net incomein the business.
It is the company’s objective to pay a regular dividend to com-mon shareholders on a quarterly basis.
Corporate Development
The company will not enter businesses in which the marketgrowth rate is less than 15 percent.
All acquisitions of other companies, whether in whole or part,must have the approval of the board of directors.
Companies will be acquired only if their markets are knownto senior management and there are synergistic benefits tothe relationship.
Our corporate image and purpose shall always be main-tained. We will consider only opportunities for investmentor acquisition that will maintain or enhance our corporateimage of progressiveness, technical excellence, customercommitment, and merchandising preeminence in the saleof quality products and services. New opportunities will notbe considered if they will in any way compromise the repu-tation for being an ethical company with due regard tohuman and social responsibilities that we have worked sohard to achieve and maintain. Our employees commandrespect for their business abilities, integrity, fairness, andhumanity.
Investment, whether capital expenditure or corporate acqui-sition, requires a return on equity of 20 percent or greater.This serves to enhance our current expectations for corpo-rate performance.
Corporate
The company will prepare a three-year strategic plan and anannual budget.
203Business Planning and the Budget
The company will establish goals for each of these documents,measure the performance of its staff against these parame-ters, and incorporate these evaluations into its compensa-tion plans.
It is company policy to comply with all OSHA and EPA regula-tions. We will develop training programs that will assurecompliance without the need for outside audit. The com-pany will make certain that employee safety is always em-phasized and never compromised in all of its activities.
It is the company’s policy to comply with generally acceptedaccounting principles in the preparation of information forany regulatory agency, financial institution, or any otherinterest that may receive this information.
Some Additional Issues
Budgets should be developed by those who have the responsibil-ity for their achievement, subject to the requirements and expec-tations of the organization.
A budget need not be completely detailed in every respect inorder to be effective and valuable. The level of detail should begoverned by the value of the information being developed.
Every excellent plan is almost out of date by the time it isbeing used. The value of the planning process is the thinking,research, and communication that the process fosters.
The coordinator of the budget process should have consider-able knowledge of the business, its products, and its markets.While accounting and finance are important areas of knowledge,developing the budget is a management challenge rather than anaccounting responsibility.
A Guide to Better BudgetsStart simple.Have each function and area of responsibility prepare itsown budget, consistent with corporate goals, objectives,constraints, and policies.
204 Additional Financial Information
Recognize that effective budgets require senior manage-ment approval and the endorsement of the organization.Understand that having a budget improves the perform-ance of the entire organization and each of its parts—really.Understand that a budget is developed to ensure that everydepartment head is working toward the same goal, withknowledge of the department’s resources and constraints.Recognize that the budget department does not create thebudget. It is simply a coordinator, consultant, and adviser.Arrange educational meetings to ensure an understandingof the process and the expectations for it. Do this at leasttwice during the process.Make certain that interdepartmental relations are coordi-nated. Departments cannot perform well without the co-operation of other departments. Make certain that theseinterdependencies are properly documented.Ensure that expenditures above a specific thresholdamount that are included in the budget are supported withproper documentation and financial analysis.Incorporate into the budget procedure specific require-ments covering approval for nonbudgeted expendituresand cost overruns.To sell the budget concept, select one department or profitcenter manager to convey the value of developing an intel-ligent budget. Demonstrate how the budget has improvedthe performance of this manager’s organization. The wordwill spread among the manager’s peers.Express budget procedures in writing. Document corpo-rate targets, policies, and constraints and convey them toeveryone who is involved in the process. Update this docu-mentation frequently.Provide each involved department with information on thedepartment’s past financial and statistical history, knowneconomic factors, and the accounting chart of accounts inorder to properly prepare the department for effective par-ticipation.Classify the expenditures of individual departments care-
205Business Planning and the Budget
fully. Do not arbitrarily allocate common costs to individ-ual profit centers.Budget product and service costs on a per-unit basis if pos-sible. Be realistic.Do not create theoretical models that make accountabilityunachievable.Prepare budgets that incorporate alternative environmentsand competitive factors. Have a fallback plan available foremergencies; identify best- and worst-case scenarios. Thisenhances the thought process.Base the sales forecast on realistic expectations. Like allother budgets, it should be achievable, but a challenge.Establish production plans in accordance with a detailedforecast. Incorporate purchasing and inventory strategiesand product pricing expectations.Incorporate the cash flow improvements from the capitalexpenditure budget into the operating budget. These areinterrelated parts of the planning process.Develop and share the positive and negative elements ofpast budget efforts into the current process. Learn fromboth the successes and the mistakes.Make sure that reports of actual performance are providedto responsibility centers in a timely manner, with the ap-propriate level of detail.Never forget that a budget and its forecast components areestimates. Precision does not count.Improve the quality and effectiveness of the process con-tinuously. Make sure that everyone knows that you are fo-cusing on this issue. Solicit and accept feedback fromparticipants.
Preparation of the Budget
Sales Planning
Consider the historical patterns of behavior for your customers,your markets, your products, and your competitors. The successof your company depends on the success of your customers.
206 Additional Financial Information
Company sales will be affected by the economy. Identifyhow future economic events will affect your business. This in-cludes looking at consumer outlook, inflation, taxes, politicalevents, and the business cycle.
Ask the sales organization for its input. The salespeopleknow the customers and markets better than anyone else. Sales-people are optimistic, by their stereotypical nature. On the otherhand, they have been known to ‘‘low-ball’’ forecasts in order tominimize quotas. Somehow, given the balance between thesetwo forces, a consensus forecast by the sales team usually pro-vides very usable information.
Identify all known or anticipated events that will affect yourmarket in the upcoming year. This should include competitorsentering or leaving the market and product additions and elimi-nations. Industry trade shows are an excellent source of this in-formation: Look at what is and what is not being featured. Whatshows companies take booths at is often an indicator of thosecompanies’ perceived strategic identity.
The sales and marketing teams should identify the level ofcustomer service that is necessary if the company is to achievea competitive advantage. Strategies involving inventory and theentire supply chain should be based upon customer service ex-pectations.
Operations Planning
Capacity should be defined based upon the expected productmix. This will provide insights into pricing decisions and deci-sions as to whether to pursue marginal business.
Product mix capability and flexibility are very important.How rapidly machinery can be changed between products willprovide guidance for determining required minimum orders andthe extent to which discounts should be offered for very largeorders.
The company should consider the number of shifts to beoperated. This depends on both the relative efficiency of eachshift and the size of an ideal production run. If machine change-over is expensive, working four 10- or 12-hour shifts will be more
207Business Planning and the Budget
cost-effective than working five 8-hour days. Overtime can bebuilt into the schedule.
Technology can make a major contribution to improving theefficiency of the overall operation. Establishing computerizedhookups among customer orders, machine and workforce sched-ules, and raw material logistics will:
Improve customer serviceAccelerate billing and cash flowReduce work-in-process inventory and timeReduce raw materials inventoryUsually pay for itself in less than a year
The capital budget can be prepared after all of the previouslymentioned analyses have been performed. Return on investmentanalysis and the capital budget are discussed at some length inChapter 10.
You should consider outsourcing less important resource-consuming operations. This will free up assets, cash, and peoplefor more important activities.

Chapter 13
Selected Business Readings
THIS CHAPTER CONTAINS THREE ARTICLES dealing withthemes that are appropriate for this book for several reasons:
1. They advocate management thinking that can be charac-terized as:
Contrarian‘‘Out of the box’’Nontraditional
Many companies are managed from an accounting-orientedperspective. There are certain approaches, such as conservatismand being risk averse, that are appropriate for the accountingdepartment but may be less so for other areas. In those areas,‘‘out of the box,’’ nontraditional management styles are often de-sirable and necessary. Many of the techniques of financial analy-sis that are described in this book support the more contrariancorporate strategies.
2. These articles tie in with the planning and budget processdescribed in Chapter 12. They discuss a number of issuesthat surface during the development of the budget. WhileChapter 12 describes many practices that make the proc-ess work successfully in corporations, these articles iden-tify in greater analytical detail what the outcomes of thebudget process should be.
208
209Selected Business Readings
‘‘Profitability During Tough Times’’ offers some insights into howto thrive in a highly competitive environment. It advocates con-trarian thinking and strategy development and offers some spe-cific insights into how to focus on the real issues and break outof the traditional mold.
‘‘Do the Right Thing’’ recognizes that companies sometimesneed to retrench on expenses and redirect their focus. It suggestssome specific actions that companies can take that will enablethem to successfully respond to difficult periods without damag-ing the core competencies of the organization.
‘‘Recession � Opportunity’’ focuses specifically on positiveactions that companies should take when the psychological toneof the economy turns negative. The pressure to go along with thetraditional responses is enormous. Resisting this pressure, how-ever, can be very profitable.
Profitability During Tough Times
Many of the strategies that were appropriate and effective in thepast are no longer above reproach. In fact, we have learned overthe years that the global marketplace is a dynamic place, full ofturmoil; therefore, rethinking of past assumptions and engagingin out-of-the-box thinking is always required. Organizationsneed to address this constant change, focus on the state of theworld, both as it exists now and as it may be in the future, andraise their performance to new levels of effort and achievement.
Recent Progress
Product quality is no longer an issue. It is almost impossible tojustify a multilevel pricing structure by offering different levels ofproduct quality. Market segmentation now focuses on differ-ences in features and support. Differences in product perform-ance are acceptable. Differences in performance quality are not.
Responsive Service
You will gain competitive and profit advantages by compressingthe supply chain from your suppliers to your company to your
210 Additional Financial Information
customers. The amount of time required for this sequence ofevents has a substantial effect on your inventory, accounts re-ceivable, profitability, and ultimately cash flow. Service levels areaffected as well, which may in turn affect your market share andsales growth.
Competitive Pricing
In many cases, competitive pricing means price reductions. Thisera of pricing pressure is not going to change any time soon.Asking the customer to pay for our inefficiencies is not an option.Many industries are experiencing price deflation and will con-tinue to do so. This means that companies must find new waysto maintain their profit margins. The successful ones will becomemore efficient, find more value-added features to add to theproduct, and focus on new markets and distribution channelsin order to remain competitive. Have you priced out a personalcomputer lately?
Companies will need to make a great effort to distinguishthemselves from their competition. The new realities includevery low interest rates, economic turmoil in Asia, essentially zeroinflation, and a single global economy. However, a company’sprofitability can be enhanced, even during tough times. Theserealities can serve as a competitive advantage if you refocus theattention of the organization on the fundamental realities of suc-cessful business:
1. Why are we special?2. Why do we deserve to exist?3. Why should customers buy our products?4. Why do we deserve to have our customers’ money?
Attitudes and Strategies for Success
We exist to help our customers sell their products to their cus-tomers at a significant profit to both of us. This is called strategicpartnering.
We need to help our customers solve problems and to focus
211Selected Business Readings
on their opportunities rather than merely providing products.Anyone can sell products. This is called consultative selling.
Our prosperity is enhanced as we improve our customers’ability to compete in their marketplace.
We know enough about our customers’ businesses and mar-kets so that we can provide products and ideas that will makeour customers special.
Our people know no limits to their efforts.
Specific Action Strategies
The fundamental ingredients have not changed; only the envi-ronment in which we need to make things happen is different.Not only is thinking out of the box necessary, but I am no longercertain that there are many ‘‘boxes’’ remaining. Here are somestrategies that are available to you:
Invest in sales professionals and their training and support.High-quality marketplace visibility is the most profitableinvestment your company can make.
Accelerate the development of innovative products and ser-vices. Focus your company’s resources, both people andmoney, on those products and services that offer the op-portunity for significant financial reward. Persistence isvaluable—but not when it implies refusing to change di-rection when success is not available if you go on as youare.
Learn more about the current economic environment andthe persistent global turmoil. How can you benefit? Thishas implications for both buying and selling. Change isgood because it creates opportunities for those who areprepared and ready to take action.
Expand your marketplace support to include participation intrade shows and industry showcases, advertising in well-directed journals, and use of other media to communicatewith existing and potential customers. Keep your custom-ers aware of your constantly improving capabilities. If youhave nothing new to say to your customers, your competi-tors will.
212 Additional Financial Information
Streamline the performance of your administrative support.Use technology in ways that let you derive its maximumvalue. Use experts to fill in and eliminate the knowledgegaps in your organization.
Do the Right Thing
Companies have worked hard at restructuring themselves in re-sponse to the dramatic changes that have occurred in the econ-omy and in their marketplaces in recent years. Here are a fewthoughts concerning some of the serious errors companies havecommitted in their efforts to change:
Mistake 1: Laying Off Only Lower-Level Support Staff
Personnel decisions are made by senior and middle manage-ment—who, of course, are not going to choose themselves foroutplacement. As a result, the company ends up with many‘‘chiefs’’ but not enough ‘‘Indians.’’ Six-figure executives spendtheir time typing, photocopying, and faxing when they should bemeeting with customers and planning strategies.
Executives should prioritize entire programs, products, andmarkets according to profitability and opportunity. Maintainingor even increasing the number of support staff and expandingtheir responsibilities makes more time available to executives todevelop the business. Leave the more routine tasks to those whoare best trained (and appropriately paid) to perform them.
Mistake 2: Seeing the Future as an Extension of the Past.
During times of marketplace turmoil and uncertainty, somecompanies seek out those programs, strategies, and attitudesthat worked well in the past. This provides a level of organiza-tional comfort and eases the tensions associated with change.However, sticking to what has always worked well may, in fact,be perpetuating approaches that are no longer valid as a result ofnew market conditions.
There should be no sacred cows when the company under-
213Selected Business Readings
achieves. Reexamine and reprioritize all of the company’s opera-tions and activities.
Mistake 3: Not Recycling Past Ideas That Merit CurrentConsideration
Whether an idea is profitable or not depends on both the timingof its implementation and the management support it receives.Something that did not work seven years ago may have consider-able merit now.
The market may currently need some products and servicesthat it did not need in the past. List, explore, and give consider-ation to all ideas. With input from everyone concerned, make alist of all possible courses of action. Some resurrected fundamen-tals or past failures may in fact save the day.
Mistake 4: Reducing Price Rather Than Adding Value
Giving the customer a price discount may result in a sale. It canalso encourage the customer either to expect further discountsin the future or to ask, ‘‘If you can afford to reduce the price now,does that mean that you were gouging me in the past?’’
Your objective is to create a loyal market, not merely to makea sale. Pressures to reduce the price are lessened when you addvalue to the sale. Value-added features could include:
Faster deliveryHigher qualityEducating customers on product applicationsUser conferencesFocus groups for product improvementImproved customer service
These activities enhance your competitive position.Getting a new customer is very difficult. Keeping an existing
customer happy is a great challenge. Getting back a customer thatyou have already lost is almost impossible.
214 Additional Financial Information
Mistake 5: Ignoring the 80 Percent/20 Percent Rule
You need to realize that 20 percent of your customers account for80 percent of your revenue, and 20 percent of your products re-sult in 80 percent of your shipments. Less positively, 20 percentof your employees account for 80 percent of your absenteeism,and 20 percent of your customers are responsible for 80 percentof your overdue accounts receivable.
Companies confuse activity with productivity and produc-tivity with effectiveness. They try to be all things to all people.Every order receives fanatical attention from exhausted, over-worked people who hope and believe that if they can just workharder, things will improve. Focus your energies on the activitiesthat are most important. The least important 80 percent of allcorporate activity results in only 20 percent of the achievement.Do not dilute the effort and compromise the performance of themost important tasks by expending too much energy on thatleast important 80 percent. Intelligent corporate prioritizing andtime management ensures that the most important work getsdone.
Achievement � Productivity � Effectiveness � Profitability
Mistake 6: Holding On to Sacred Cows
The entire business should be evaluated periodically, perhaps atbudget time. Is each of the product lines and markets still provid-ing its expected contribution? Is any product line or market con-suming an inordinate share of corporate resources, beyond whatis justified by present and expected future performance? Whatother, more profitable ventures can be implemented with under-productive resources? Should we really be in this business?
Recession � Opportunity
There is a lot of talk these days about how this period of prosper-ity cannot last forever. This is certainly a true statement, becausenothing lasts forever. The fact is that many public companies
215Selected Business Readings
have already begun to report reduced earnings. There are manyexplanations for this.
1. Companies that sell to Asia or Europe have already beenexperiencing a recession. Those with heavy investmentsin the Far East have certainly been having severe prob-lems for the past few years. The Japanese stock market isdown over 60 percent from its highs in the early 1990s.The strong American dollar (until recently) has forcedU.S.-based exporters to make difficult choices concerningmarket share and profitability. The issue facing many is,given the price pressures, should they sell at reducedmargins and keep the business, or is selling at low mar-gins not worth the effort?
2. The absence of inflation on a global scale has helpedsome companies, but hurt others. Oil drilling companiesand companies in other businesses involving the produc-tion of commodities have been in a significant recessionfor quite some time. Some agriculturally based businesseshave been so successful at improving productivity thatthey have excess capacity and their production is farabove what the market needs.
3. Overbuilding of capacity in some very capital-intensiveindustries has resulted in a Darwinian selection processamong competitors. It is very difficult for these compa-nies to adjust to weak demand and rapid technologicalchange.
4. Companies that have a relatively fixed way of doing busi-ness have been unable or slow to respond to the newmethods of doing business that have come about becauseof technological changes. These new business modelshave affected the supply chain and attitudes about out-sourcing, and have redefined or actually created a rela-tionship between the original supplier and the ultimatecustomer.
5. Disintermediation has drastically affected all supplier/customer relationships. An intermediary is a middleman,someone who is in between. A traditional wholesaler ordistributor buys from the manufacturer and sells to the
216 Additional Financial Information
retailer, who in turn sells to the consumer. A retail storeis an example of an intermediary. Sometimes the inter-mediary’s only contribution to the process is buying inlarge quantities and being willing to sell in smaller quanti-ties. In effect, these intermediaries are inventory manag-ers who provide extended credit terms.
Technology is permitting a direct relationship be-tween the manufacturer and the customer. We can buycars and airline tickets on the Internet, and we can tradestocks and bonds as well. We used to get all of these thingsthrough intermediaries—car dealers, travel agents, andstockbrokers. The reduction in the role and value of theseintermediaries is called disintermediation.
Action Plans for Success
So the question that arises is, ‘‘What happens if there is a reces-sion? How will it affect the company, and what should we do?’’
1. Don’t panic or overreact. Think strategically, with per-spective. Across-the-board expense reductions are usu-ally counterproductive. They penalize the most efficientdepartments, result in higher-level people doing less pro-ductive work, and exacerbate the problem of keepingyour focus on the most profitable place for your invest-ment dollars.
2. Refocus on your customers. What do they want from you,what do they expect of you, and why do they buy fromyou? What is the real value that you offer? Examine howtechnology will enable you to reposition yourself in thesupply chain. Help your customers lower their inventoryand reduce delivery times.
3. Enhance your marketing efforts. The best opportunity togain market share is when your competitors are reducingtheir sales forces, trade show appearances, advertising,and promotional efforts. Potential customers are morewilling to consider a change, and your competitors’ pres-ence is being reduced.
4. Identify and pursue new applications for your organiza-
217Selected Business Readings
tion’s skills and capabilities. There are many companiesout there that are not perceived as traditional customersfor your industry. Go after them. You may be the only onewho will. Change is an almost universally accepted fact oflife these days, and any organization that resists changewill fail. We are all someone else’s outsource. What kindof businesses would consider your products or servicesvaluable?
Who are your competitors? They may not all be com-panies that look like yours. The list of competitors may bechanging constantly as companies and supply chains areredefined. Competition is defined by contribution andvalue added, not by the physical appearance of those whocompete. The biggest threat to Barnes & Noble book-stores is Amazon.com. This is a classic concept calledmarketing myopia that was first identified many years agoby Theodore Levitt of the Harvard Business School.
5. Collect those receivables. Enhance your cash flow. This iseveryone’s responsibility. The faster the money comes in,the more money you will have available, sooner, for rein-vestment. Sell off underperforming assets, including in-ventory, fixed assets, and products, to raise and redirectcash flow.
6. Have your management team do a S.W.O.T. analysis. Thisis an incredibly valuable corporate self-assessment ofwhere in the global economy your company currently isand where it needs to be. S.W.O.T. stands for strengths,weaknesses, opportunities and threats. Such an analysisenables the company to identify and focus on all of thepositive and negative issues that need to be dealt with.This should be an annual effort that precedes budgetpreparation. Refer back to Chapter 12 for more discussionon this.
Strategic Issues and the Global Economy
Our domestic economy has not experienced any noteworthy in-flation for quite a few years. The inflation indexes—the consumerprice index (CPI) and the producer price index (PPI)—are statisti-
218 Additional Financial Information
cal averages that reflect real economic events. However, they alsotend to mask divergent trends that the casual observer may notdetect, but that in fact have considerable impact on certain sec-tors of our economy. The prime example here is the serious de-cline in the price of oil, and its reversal again more recently.
As a result of the strength of our domestic economy, the dol-lar has been very strong relative to other currencies. As a result,imports have become less expensive. However, our competitiveposition globally is subject to very inflexible price ceilings. If thedollar weakens, the impact on the statistical averages, and alsoon the domestic economy, will be very bearish.
Imports will become relatively more expensive. The higherlevels of inflation shown by the indexes might cause the FederalReserve to increase interest rates, leading to a much lower stockmarket, declining individual net worth, less consumer spending,and more business caution—in other words, a recession.
Incredible technological advances in information, manufac-turing, and agriculture have improved our productive capacityand the efficiencies of our business practices to an extraordinarydegree. Technology, corporate ambition, and competitive pres-sures have caused the business relationships in which our com-pany is involved—its sources of supply and its customers—to betruly global. To be successful, we must revisit the fundamental,age-old business questions: How do we add value to our custom-ers? How well do we serve them? How efficiently and effectivelydoes our company perform?
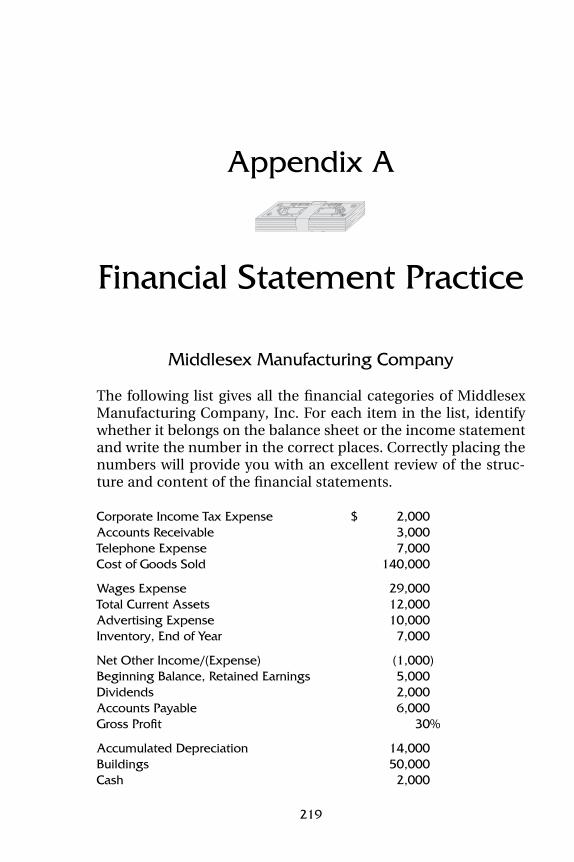
Appendix A
Financial Statement Practice
Middlesex Manufacturing Company
The following list gives all the financial categories of MiddlesexManufacturing Company, Inc. For each item in the list, identifywhether it belongs on the balance sheet or the income statementand write the number in the correct places. Correctly placing thenumbers will provide you with an excellent review of the struc-ture and content of the financial statements.
Corporate Income Tax Expense $ 2,000Accounts Receivable 3,000Telephone Expense 7,000Cost of Goods Sold 140,000
Wages Expense 29,000Total Current Assets 12,000Advertising Expense 10,000Inventory, End of Year 7,000
Net Other Income/(Expense) (1,000)Beginning Balance, Retained Earnings 5,000Dividends 2,000Accounts Payable 6,000Gross Profit 30%
Accumulated Depreciation 14,000Buildings 50,000Cash 2,000
219
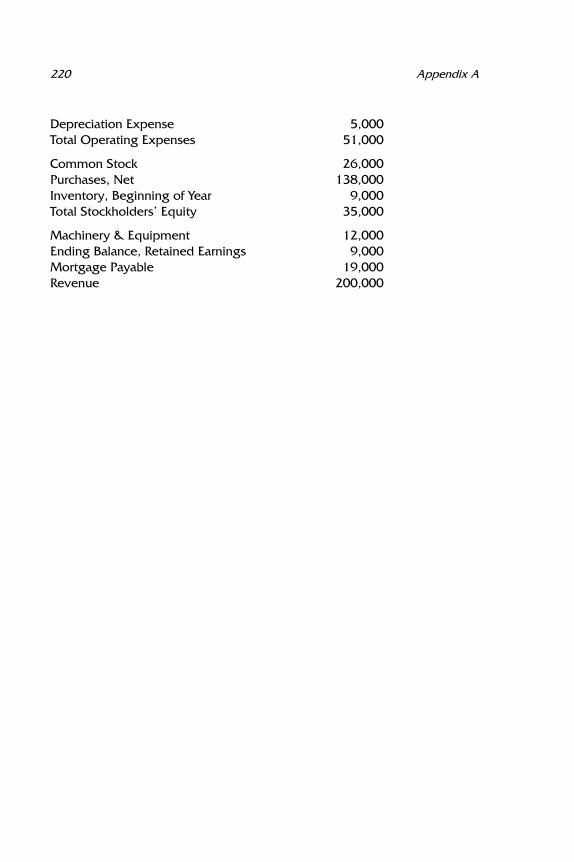
220 Appendix A
Depreciation Expense 5,000Total Operating Expenses 51,000
Common Stock 26,000Purchases, Net 138,000Inventory, Beginning of Year 9,000Total Stockholders’ Equity 35,000
Machinery & Equipment 12,000Ending Balance, Retained Earnings 9,000Mortgage Payable 19,000Revenue 200,000
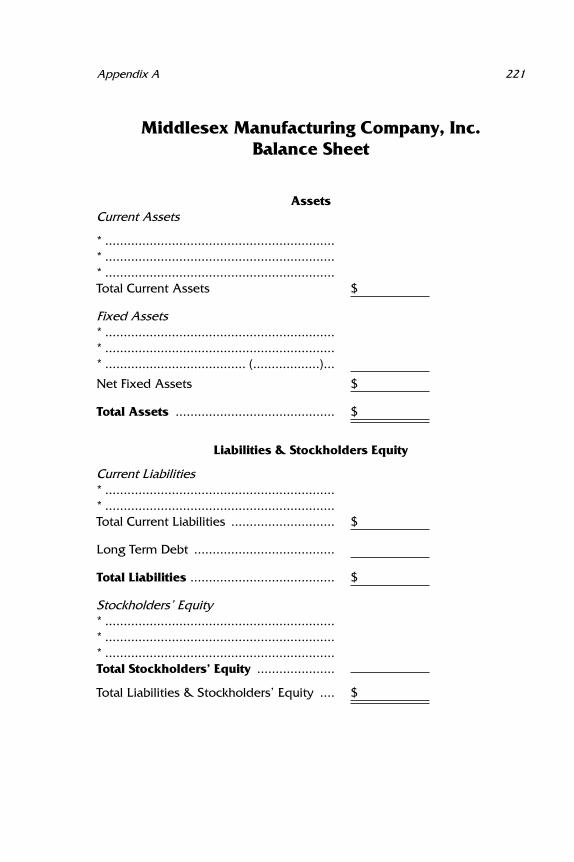
221Appendix A
Middlesex Manufacturing Company, Inc.Balance Sheet
AssetsCurrent Assets
* ..............................................................* ..............................................................* ..............................................................Total Current Assets $
Fixed Assets* ..............................................................* ..............................................................* ...................................... (..................)...
Net Fixed Assets $
Total Assets ........................................... $
Liabilities & Stockholders Equity
Current Liabilities* ..............................................................* ..............................................................Total Current Liabilities ............................ $
Long Term Debt ......................................
Total Liabilities ....................................... $
Stockholders’ Equity* ..............................................................* ..............................................................* ..............................................................Total Stockholders’ Equity .....................
Total Liabilities & Stockholders’ Equity .... $
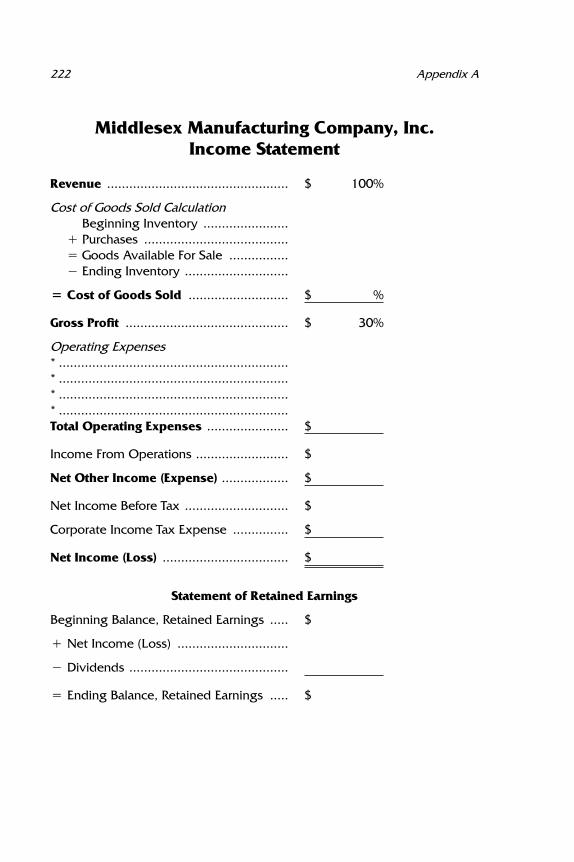
222 Appendix A
Middlesex Manufacturing Company, Inc.Income Statement
Revenue ................................................. $ 100%
Cost of Goods Sold CalculationBeginning Inventory .......................
� Purchases .......................................� Goods Available For Sale ................� Ending Inventory ............................
� Cost of Goods Sold ........................... $ %
Gross Profit ............................................ $ 30%
Operating Expenses* ..............................................................* ..............................................................* ..............................................................* ..............................................................Total Operating Expenses ...................... $
Income From Operations ......................... $
Net Other Income (Expense) .................. $
Net Income Before Tax ............................ $
Corporate Income Tax Expense ............... $
Net Income (Loss) .................................. $
Statement of Retained Earnings
Beginning Balance, Retained Earnings ..... $
� Net Income (Loss) ..............................
� Dividends ...........................................
� Ending Balance, Retained Earnings ..... $

Appendix A Answer Key
223
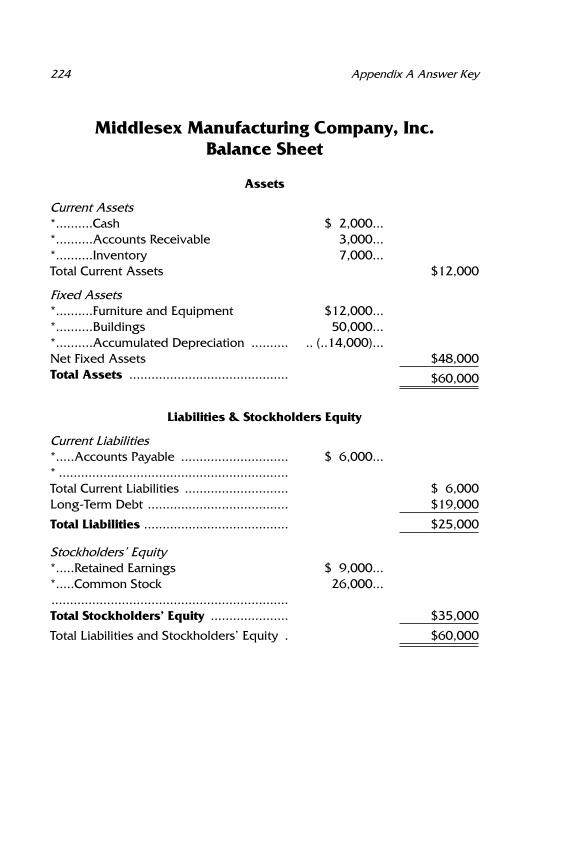
224 Appendix A Answer Key
Middlesex Manufacturing Company, Inc.Balance Sheet
Assets
Current Assets*..........Cash $ 2,000...*..........Accounts Receivable 3,000...*..........Inventory 7,000...Total Current Assets $12,000
Fixed Assets*..........Furniture and Equipment $12,000...*..........Buildings 50,000...*..........Accumulated Depreciation .......... .. (..14,000)...Net Fixed Assets $48,000Total Assets ........................................... $60,000
Liabilities & Stockholders Equity
Current Liabilities*.....Accounts Payable ............................. $ 6,000...* ..............................................................Total Current Liabilities ............................ $ 6,000Long-Term Debt ...................................... $19,000
Total Liabilities ....................................... $25,000
Stockholders’ Equity*.....Retained Earnings $ 9,000...*.....Common Stock 26,000...................................................................Total Stockholders’ Equity ..................... $35,000
Total Liabilities and Stockholders’ Equity . $60,000
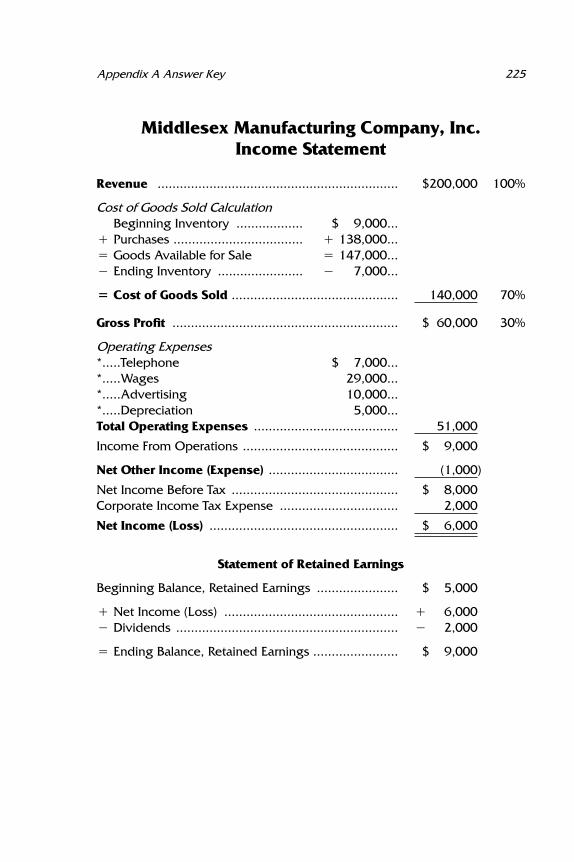
225Appendix A Answer Key
Middlesex Manufacturing Company, Inc.Income Statement
Revenue ................................................................. $200,000 100%
Cost of Goods Sold CalculationBeginning Inventory .................. $ 9,000...
� Purchases ................................... � 138,000...� Goods Available for Sale � 147,000...� Ending Inventory ....................... � 7,000...
� Cost of Goods Sold ............................................. 140,000 70%
Gross Profit ............................................................. $ 60,000 30%
Operating Expenses*.....Telephone $ 7,000...*.....Wages 29,000...*.....Advertising 10,000...*.....Depreciation 5,000...Total Operating Expenses ....................................... 51,000
Income From Operations .......................................... $ 9,000
Net Other Income (Expense) ................................... (1,000)
Net Income Before Tax ............................................. $ 8,000Corporate Income Tax Expense ................................ 2,000
Net Income (Loss) ................................................... $ 6,000
Statement of Retained Earnings
Beginning Balance, Retained Earnings ...................... $ 5,000
� Net Income (Loss) ............................................... � 6,000� Dividends ............................................................ � 2,000
� Ending Balance, Retained Earnings ....................... $ 9,000
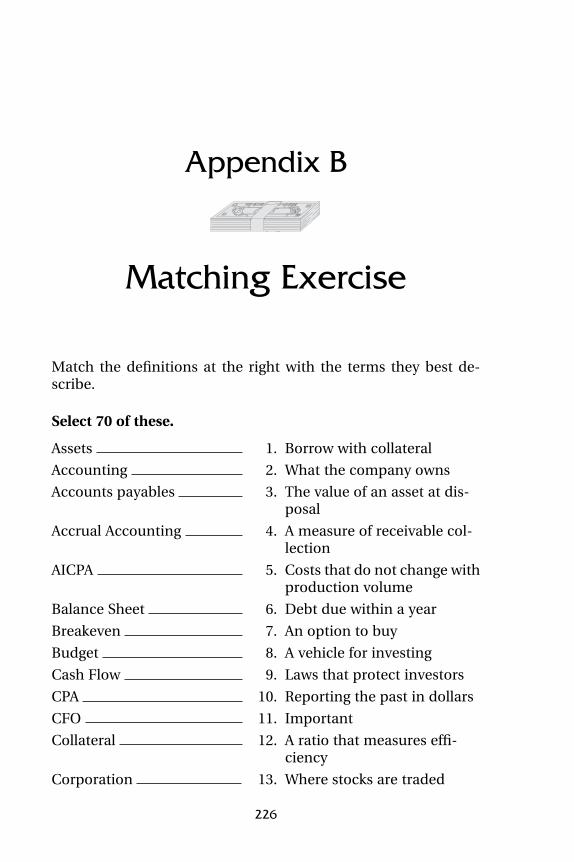
Appendix B
Matching Exercise
Match the definitions at the right with the terms they best de-scribe.
Select 70 of these.
Assets 1. Borrow with collateral
Accounting 2. What the company owns
Accounts payables 3. The value of an asset at dis-posal
Accrual Accounting 4. A measure of receivable col-lection
AICPA 5. Costs that do not change withproduction volume
Balance Sheet 6. Debt due within a year
Breakeven 7. An option to buy
Budget 8. A vehicle for investing
Cash Flow 9. Laws that protect investors
CPA 10. Reporting the past in dollars
CFO 11. Important
Collateral 12. A ratio that measures effi-ciency
Corporation 13. Where stocks are traded
226
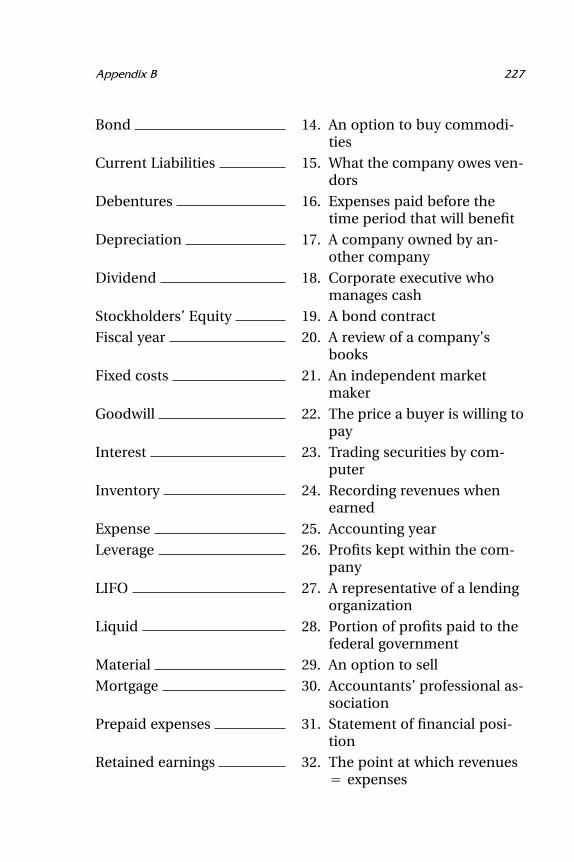
227Appendix B
Bond 14. An option to buy commodi-ties
Current Liabilities 15. What the company owes ven-dors
Debentures 16. Expenses paid before thetime period that will benefit
Depreciation 17. A company owned by an-other company
Dividend 18. Corporate executive whomanages cash
Stockholders’ Equity 19. A bond contract
Fiscal year 20. A review of a company’sbooks
Fixed costs 21. An independent marketmaker
Goodwill 22. The price a buyer is willing topay
Interest 23. Trading securities by com-puter
Inventory 24. Recording revenues whenearned
Expense 25. Accounting year
Leverage 26. Profits kept within the com-pany
LIFO 27. A representative of a lendingorganization
Liquid 28. Portion of profits paid to thefederal government
Material 29. An option to sell
Mortgage 30. Accountants’ professional as-sociation
Prepaid expenses 31. Statement of financial posi-tion
Retained earnings 32. The point at which revenues� expenses

228 Appendix B
Sinking fund 33. The premium over fair mar-ket value paid for an acquisi-tion
Variable costs 34. A documentation of the fi-nancial planning process
Revenue 35. The fee paid to a lender for aloan
Ratio 36. Funds set aside to pay debt
IRS 37. Costs that fluctuate with pro-duction volume
Controller 38. A person who helps you buystock
Direct 39. A liquidity ratio
Subsidiary 40. Comparing the performanceof competitors
Salvage value 41. Borrowing money to buysecurities
Profitability ratios 42. Selling stock not currentlyowned
FIFO 43. A company’s chief accoun-tant
EBIT 44. Ratios to measure perform-ance
Benchmarking 45. Agent who helps buyers andsellers
Quick ratio 46. The price at which a sellerwill sell
13D 47. A security offering announce-ment
Turnover 48. A group of investors
Days’ Sales Outstanding 49. Net income � depreciation
Treasurer 50. Certified Public Accountant
Banker 51. Chief Financial Officer
Stockbroker 52. The annual report to the SEC
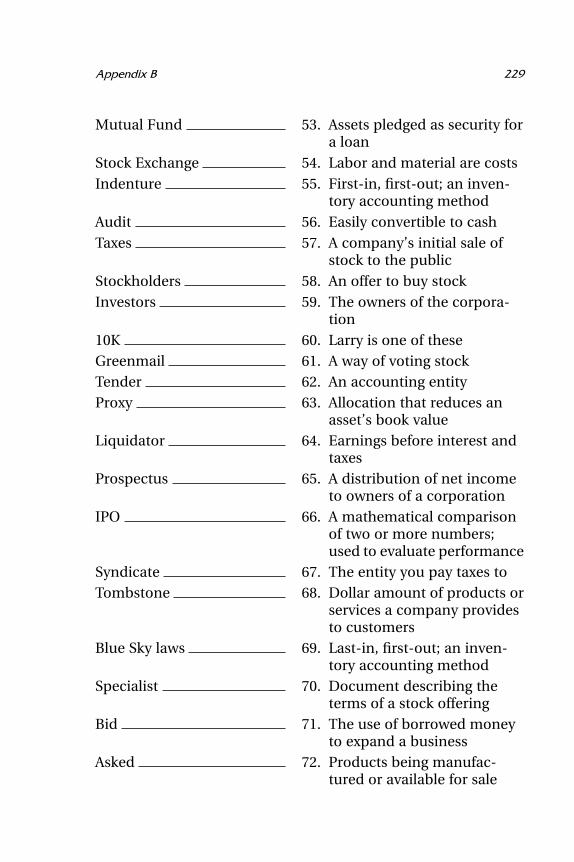
229Appendix B
Mutual Fund 53. Assets pledged as security fora loan
Stock Exchange 54. Labor and material are costs
Indenture 55. First-in, first-out; an inven-tory accounting method
Audit 56. Easily convertible to cash
Taxes 57. A company’s initial sale ofstock to the public
Stockholders 58. An offer to buy stock
Investors 59. The owners of the corpora-tion
10K 60. Larry is one of these
Greenmail 61. A way of voting stock
Tender 62. An accounting entity
Proxy 63. Allocation that reduces anasset’s book value
Liquidator 64. Earnings before interest andtaxes
Prospectus 65. A distribution of net incometo owners of a corporation
IPO 66. A mathematical comparisonof two or more numbers;used to evaluate performance
Syndicate 67. The entity you pay taxes to
Tombstone 68. Dollar amount of products orservices a company providesto customers
Blue Sky laws 69. Last-in, first-out; an inven-tory accounting method
Specialist 70. Document describing theterms of a stock offering
Bid 71. The use of borrowed moneyto expand a business
Asked 72. Products being manufac-tured or available for sale
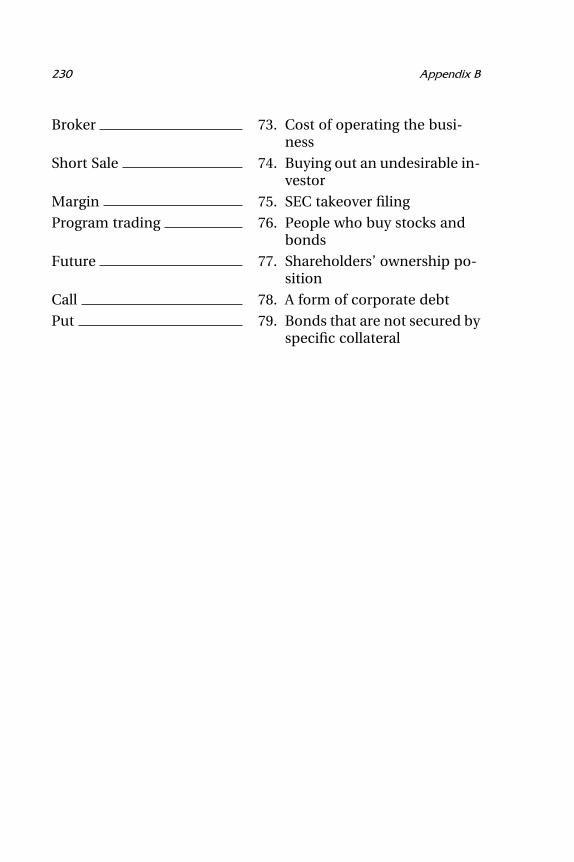
230 Appendix B
Broker 73. Cost of operating the busi-ness
Short Sale 74. Buying out an undesirable in-vestor
Margin 75. SEC takeover filing
Program trading 76. People who buy stocks andbonds
Future 77. Shareholders’ ownership po-sition
Call 78. A form of corporate debt
Put 79. Bonds that are not secured byspecific collateral
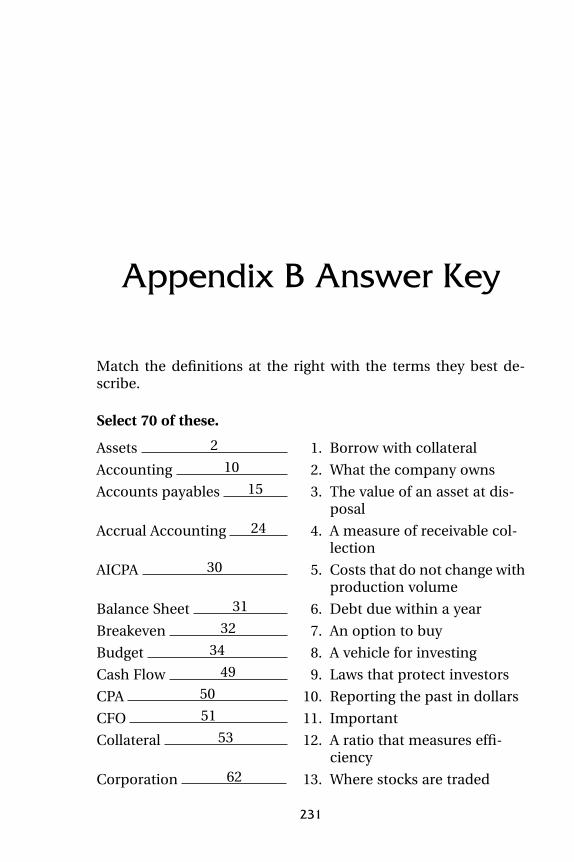
Appendix B Answer Key
Match the definitions at the right with the terms they best de-scribe.
Select 70 of these.
Assets 1. Borrow with collateral2
Accounting 2. What the company owns10
Accounts payables 3. The value of an asset at dis-15posal
Accrual Accounting 4. A measure of receivable col-24lection
AICPA 5. Costs that do not change with30production volume
Balance Sheet 6. Debt due within a year31
Breakeven 7. An option to buy32
Budget 8. A vehicle for investing34
Cash Flow 9. Laws that protect investors49
CPA 10. Reporting the past in dollars50
CFO 11. Important51
Collateral 12. A ratio that measures effi-53ciency
Corporation 13. Where stocks are traded62
231
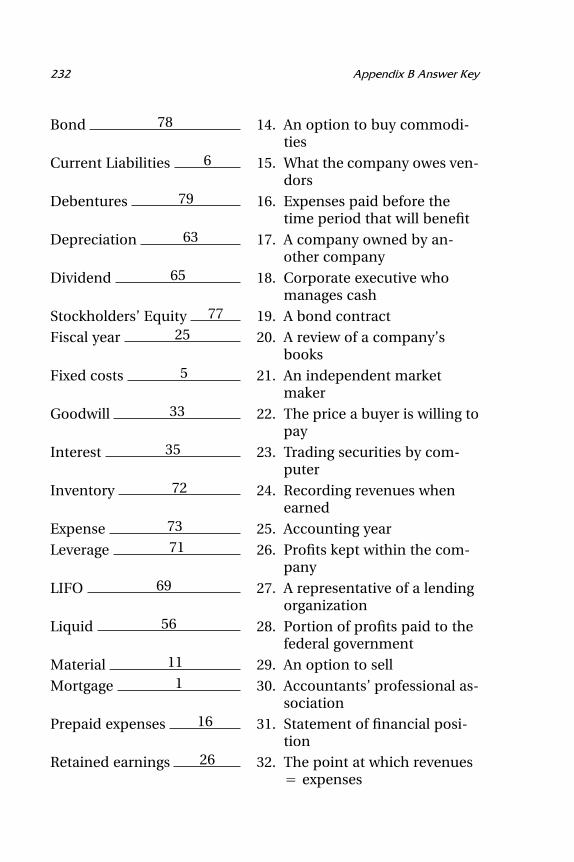
232 Appendix B Answer Key
Bond 14. An option to buy commodi-78ties
Current Liabilities 15. What the company owes ven-6dors
Debentures 16. Expenses paid before the79time period that will benefit
Depreciation 17. A company owned by an-63other company
Dividend 18. Corporate executive who65manages cash
Stockholders’ Equity 19. A bond contract77
Fiscal year 20. A review of a company’s25books
Fixed costs 21. An independent market5maker
Goodwill 22. The price a buyer is willing to33pay
Interest 23. Trading securities by com-35puter
Inventory 24. Recording revenues when72earned
Expense 25. Accounting year73
Leverage 26. Profits kept within the com-71pany
LIFO 27. A representative of a lending69organization
Liquid 28. Portion of profits paid to the56federal government
Material 29. An option to sell11
Mortgage 30. Accountants’ professional as-1sociation
Prepaid expenses 31. Statement of financial posi-16tion
Retained earnings 32. The point at which revenues26� expenses
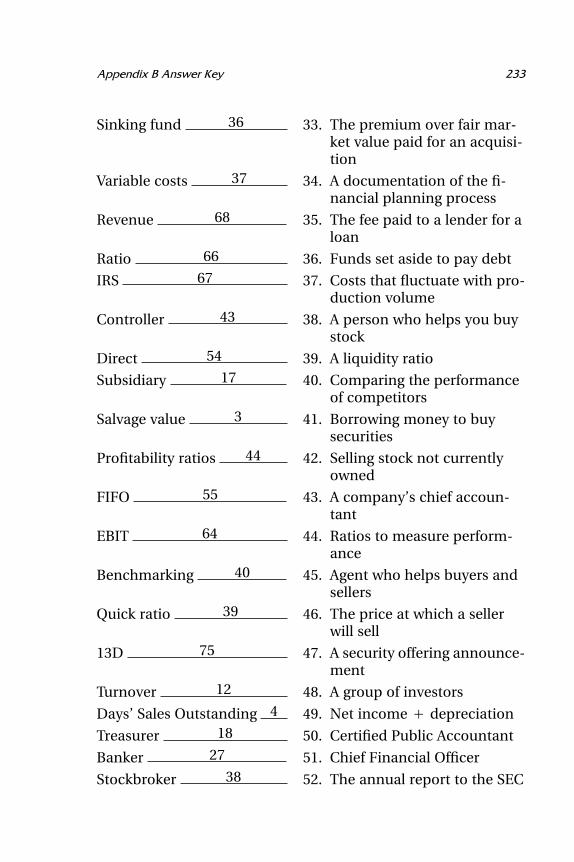
233Appendix B Answer Key
Sinking fund 33. The premium over fair mar-36ket value paid for an acquisi-tion
Variable costs 34. A documentation of the fi-37nancial planning process
Revenue 35. The fee paid to a lender for a68loan
Ratio 36. Funds set aside to pay debt66
IRS 37. Costs that fluctuate with pro-67duction volume
Controller 38. A person who helps you buy43stock
Direct 39. A liquidity ratio54
Subsidiary 40. Comparing the performance17of competitors
Salvage value 41. Borrowing money to buy3securities
Profitability ratios 42. Selling stock not currently44owned
FIFO 43. A company’s chief accoun-55tant
EBIT 44. Ratios to measure perform-64ance
Benchmarking 45. Agent who helps buyers and40sellers
Quick ratio 46. The price at which a seller39will sell
13D 47. A security offering announce-75ment
Turnover 48. A group of investors12
Days’ Sales Outstanding 49. Net income � depreciation4
Treasurer 50. Certified Public Accountant18
Banker 51. Chief Financial Officer27
Stockbroker 52. The annual report to the SEC38
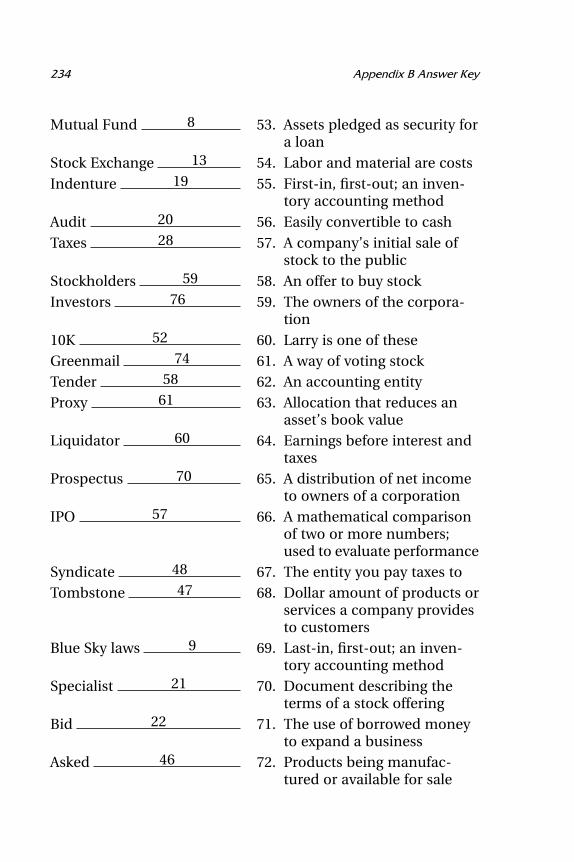
234 Appendix B Answer Key
Mutual Fund 53. Assets pledged as security for8a loan
Stock Exchange 54. Labor and material are costs13
Indenture 55. First-in, first-out; an inven-19tory accounting method
Audit 56. Easily convertible to cash20
Taxes 57. A company’s initial sale of28stock to the public
Stockholders 58. An offer to buy stock59
Investors 59. The owners of the corpora-76tion
10K 60. Larry is one of these52
Greenmail 61. A way of voting stock74
Tender 62. An accounting entity58
Proxy 63. Allocation that reduces an61asset’s book value
Liquidator 64. Earnings before interest and60taxes
Prospectus 65. A distribution of net income70to owners of a corporation
IPO 66. A mathematical comparison57of two or more numbers;used to evaluate performance
Syndicate 67. The entity you pay taxes to48
Tombstone 68. Dollar amount of products or47services a company providesto customers
Blue Sky laws 69. Last-in, first-out; an inven-9tory accounting method
Specialist 70. Document describing the21terms of a stock offering
Bid 71. The use of borrowed money22to expand a business
Asked 72. Products being manufac-46tured or available for sale
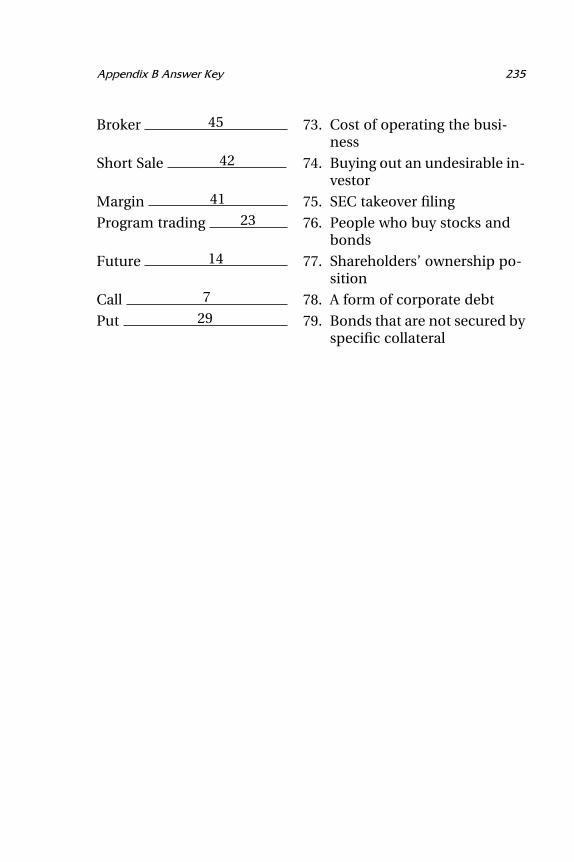
235Appendix B Answer Key
Broker 73. Cost of operating the busi-45ness
Short Sale 74. Buying out an undesirable in-42vestor
Margin 75. SEC takeover filing41
Program trading 76. People who buy stocks and23bonds
Future 77. Shareholders’ ownership po-14sition
Call 78. A form of corporate debt7
Put 79. Bonds that are not secured by29specific collateral
Appendix C
Phase 1PALEY PRODUCTS
Robert Eng, vice president and loan officer of the First NationalBank of Chicago, Illinois, was recently alerted to the deterioratingfinancial position of one of its clients, Paley Products, by thebank’s newly installed computerized loan analysis program. Thebank requires quarterly financial statements (balance sheet, in-come statement, and sources and uses of funds) from each of itsloan customers. The data from the financial statements are en-tered into a spreadsheet program that calculates the key ratios,charts trends, and compares the ratios and trends with those ofother firms in the same industry. If any of the company’s ratiosare significantly inferior to the industry average, the computerproduces an exception report and highlights the problem. If theterms of the loan agreement require either that certain levels ofassets be maintained or that a minimum of certain ratios beachieved, the output report will identify deficiencies.
Paley Products is a manufacturer of a full line of computercomponents. In addition to its regular products, Paley marketsspecial lines of products for both the home and school markets,some of which are also appropriate for seasonal gift items. Itsworking capital needs have been financed primarily throughloans from First National Bank, which has provided Paley Prod-ucts with a line of credit amounting to $300,000. In accordance
236
237Appendix C
with common banking practices, the line of credit agreementprovides that the loan be paid in full each July.
The first financial analysis of Paley Products had revealed adownward trend in certain performance ratios, below what wasdeemed acceptable for the component manufacturing industryas reflected by the industry averages, although no specific ratiothat was identified in the loan agreement was in violation. How-ever, subsequent analyses continued to reflect this downwardtrend. Mr. Eng had previously discussed his concern with FrankPaley, president of Paley Products, but no corrective action ap-peared to have been taken. The latest analysis showed the cur-rent ratio below the required 2.0 specified in the loan agreement.This conclusion was based on the financial information con-tained in Exhibits C-1, C-2, and C-3. According to provisions inthe loan agreement, First National Bank could call the loan atany time after the ratio requirements had been violated. Thecompany would then have ten days to correct the problem, payoff the loan, or face foreclosure proceedings. The day of reckon-ing had arrived. While Mr. Eng had no intention of actually en-forcing the contract to its fullest at this time, he did intend to usethe provisions of the loan agreement to get Mr. Paley to takesome decisive actions over the coming months to improve thecompany’s financial picture.
Exhibit C-1. Paley Products, Inc. Income Statements for the YearsEnding December 31,
1999 2000 2001
Revenue $2,652,000 $2,754,000 $2,856,000Cost of Goods Sold 2,121,600 2,203,200 2,284,800
Gross Profit $ 530,400 $ 550,800 $ 571,200
General and AdminstrativeExpenses $ 204,000 $ 224,400 $ 244,800
Depreciation 81,600 102,000 122,400Miscellaneous 40,800 85,700 122,400
Net Income Before Taxes $ 204,000 $ 138,700 $ 81,600
Income Taxes @ 35% 71,400 48,545 28,560
Net Income $ 132,600 $ 90,155 $ 53,040
238 Appendix C
Exhibit C-2. Computer Component Manufacturing Industry FinancialRatios, 2001
Quick Ratio 1.0Current Ratio 2.7Inventory Turnover 7.0Average Collection Period 32 daysTotal Asset Turnover 2.6�Fixed Asset Turnover 13.0�Return on Assets 11.7%Return on Net Worth 23.4%Debt Ratio 50.0%Profit Margin on Sales 4.5%
Industry averages have been constant during this time period. Thesenumbers are based on year-end amounts.
Higher costs, especially increases in the costs of certain out-sourced materials and in the wages of highly skilled technicians,have led to a decline in Paley Products’ margins over the years.Sales increased during this time period because of aggressivemarketing programs. Competition within various segments ofthe computer industry is continuing to grow more intense, bothtechnologically and financially.
Mr. Paley received a copy of the latest analysis from thebank, along with a blunt statement that the bank would insist oncomplete retirement of the loan unless corrective actions wereimplemented. Although he did not totally agree with the bank’sassessment of his company’s financial condition and was notfully certain of what his future course should be, Mr. Paley beganto develop a ‘‘recovery’’ plan. He immediately concluded thatsales growth could not continue without an increase in the bankline of credit from the current $300,000 to $400,000. Also, a prog-ress payment of $100,000 for construction in progress was duethe following year. Mr. Paley felt a sense of urgency despite thefact that his relationship with First National Bank of Chicago hadbegun many years earlier.
The ratio calculations that the bank used are given in ExhibitC-4. Calculate each of the ratios and think about the perform-ance concerns that these trends reflect.
239Appendix C
Exhibit C-3. Paley Products, Inc. Comparative Balance Sheets,December 31,
1999 2000 2001
Cash $ 61,000 $ 28,600 $ 20,400Accounts Receivable 245,000 277,400 388,000Inventory 306,000 510,000 826,200
Current Assets $612,000 $ 816,000 $1,234,600
Gross Book Value $600,000 $ 730,500 $ 826,300
Accumulated Depreciation (371,400) (473,400) (595,800)
Net Book Values:Land and Building 49,000 130,600 122,400Machinery 151,000 118,300 102,000Other Fixed Assets 28,600 8,200 6,100
Total Assets $840,600 $1,073,100 $1,465,100
Bank Notes Payable $ — $ 102,000 $ 286,000Accounts Payable 98,000 155,000 306,000Accruals 49,000 57,000 77,500
Current Liabilities $147,000 $ 314,000 $ 669,500
Mortgage 45,000 40,800 36,700
Common Stock 365,000 365,000 365,000Retained Earnings 283,600 353,300 393,900
Liabilities � Equity $840,600 $1,073,100 $1,465,100
Phase 2
Here is Mr. Paley’s proposed improvement program:
PALEY PRODUCTS, INCPROFIT IMPROVEMENT PROGRAM, 2002
Revenue: �3% growthGross margin: 20%Expenses: Same amounts as prior yearDays’ sales outstanding: Improve to 40 days
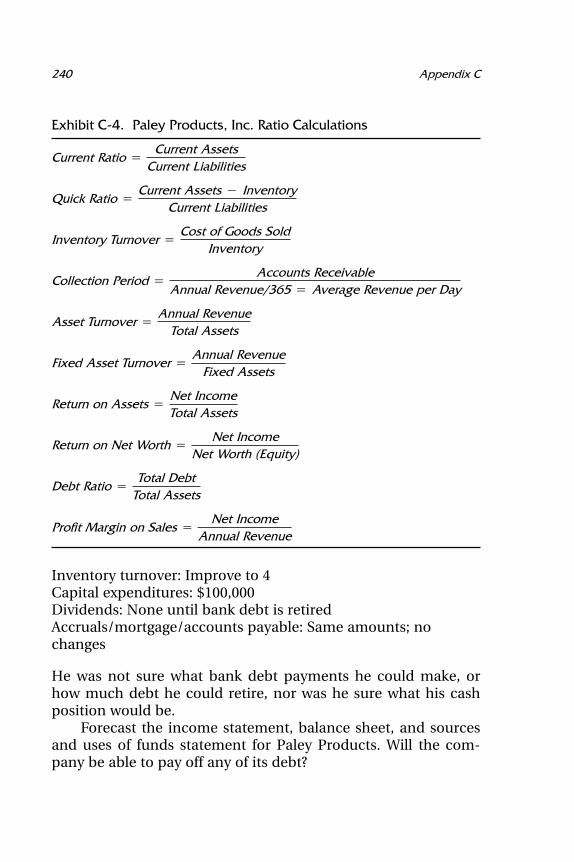
240 Appendix C
Exhibit C-4. Paley Products, Inc. Ratio Calculations
Current Ratio �Current Assets
Current Liabilities
Quick Ratio �Current Assets � Inventory
Current Liabilities
Inventory Turnover �Cost of Goods Sold
Inventory
Collection Period �Accounts Receivable
Annual Revenue/365 � Average Revenue per Day
Asset Turnover �Annual Revenue
Total Assets
Fixed Asset Turnover �Annual Revenue
Fixed Assets
Return on Assets �Net IncomeTotal Assets
Return on Net Worth �Net Income
Net Worth (Equity)
Debt Ratio �Total Debt
Total Assets
Profit Margin on Sales �Net Income
Annual Revenue
Inventory turnover: Improve to 4Capital expenditures: $100,000Dividends: None until bank debt is retiredAccruals/mortgage/accounts payable: Same amounts; nochanges
He was not sure what bank debt payments he could make, orhow much debt he could retire, nor was he sure what his cashposition would be.
Forecast the income statement, balance sheet, and sourcesand uses of funds statement for Paley Products. Will the com-pany be able to pay off any of its debt?
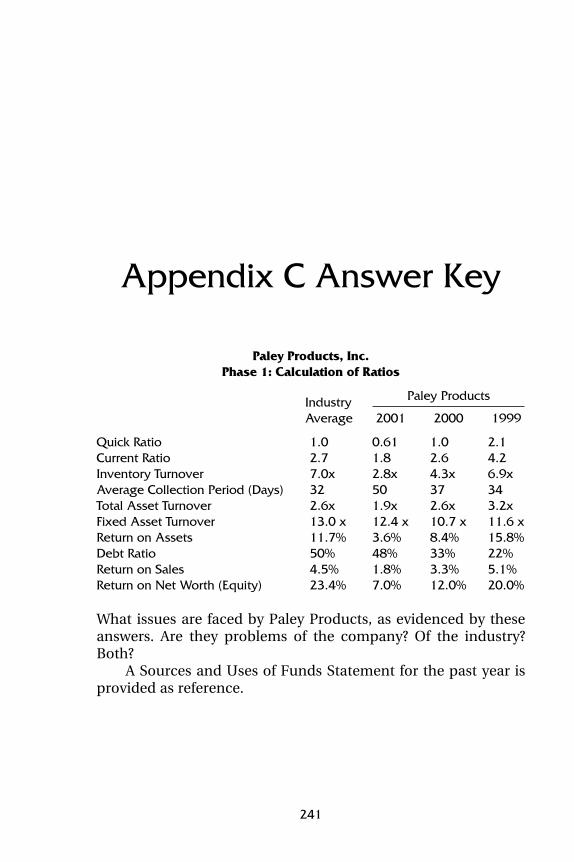
Appendix C Answer Key
Paley Products, Inc.Phase 1: Calculation of Ratios
Paley ProductsIndustryAverage 2001 2000 1999
Quick Ratio 1.0 0.61 1.0 2.1Current Ratio 2.7 1.8 2.6 4.2Inventory Turnover 7.0x 2.8x 4.3x 6.9xAverage Collection Period (Days) 32 50 37 34Total Asset Turnover 2.6x 1.9x 2.6x 3.2xFixed Asset Turnover 13.0 x 12.4 x 10.7 x 11.6 xReturn on Assets 11.7% 3.6% 8.4% 15.8%Debt Ratio 50% 48% 33% 22%Return on Sales 4.5% 1.8% 3.3% 5.1%Return on Net Worth (Equity) 23.4% 7.0% 12.0% 20.0%
What issues are faced by Paley Products, as evidenced by theseanswers. Are they problems of the company? Of the industry?Both?
A Sources and Uses of Funds Statement for the past year isprovided as reference.
241
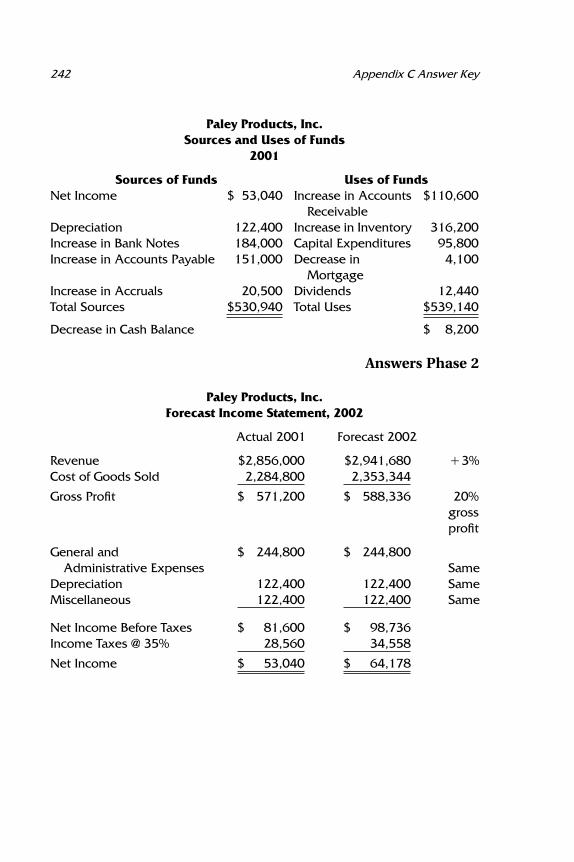
242 Appendix C Answer Key
Paley Products, Inc.Sources and Uses of Funds
2001
Sources of Funds Uses of FundsNet Income $ 53,040 Increase in Accounts $110,600
ReceivableDepreciation 122,400 Increase in Inventory 316,200Increase in Bank Notes 184,000 Capital Expenditures 95,800Increase in Accounts Payable 151,000 Decrease in 4,100
MortgageIncrease in Accruals 20,500 Dividends 12,440Total Sources $530,940 Total Uses $539,140
Decrease in Cash Balance $ 8,200
Answers Phase 2
Paley Products, Inc.Forecast Income Statement, 2002
Actual 2001 Forecast 2002
Revenue $2,856,000 $2,941,680 �3%Cost of Goods Sold 2,284,800 2,353,344
Gross Profit $ 571,200 $ 588,336 20%grossprofit
General and $ 244,800 $ 244,800Administrative Expenses Same
Depreciation 122,400 122,400 SameMiscellaneous 122,400 122,400 Same
Net Income Before Taxes $ 81,600 $ 98,736Income Taxes @ 35% 28,560 34,558
Net Income $ 53,040 $ 64,178
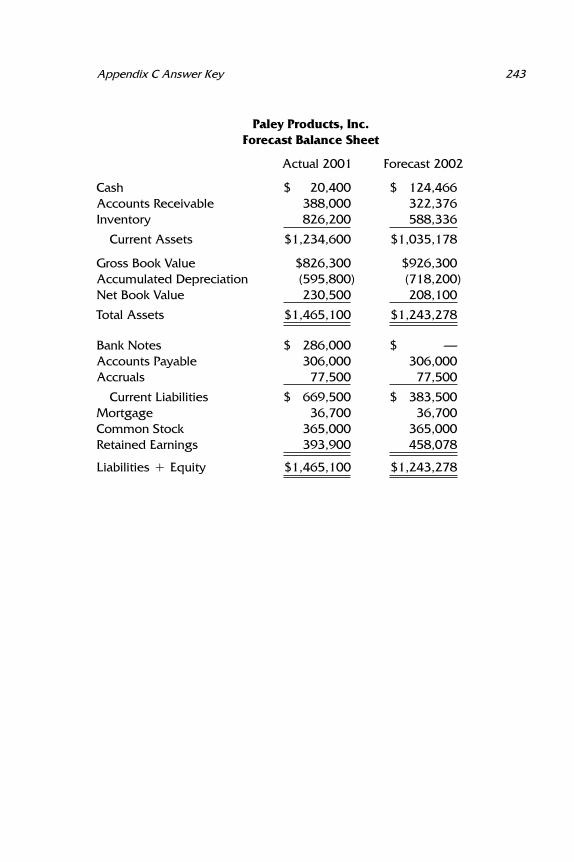
243Appendix C Answer Key
Paley Products, Inc.Forecast Balance Sheet
Actual 2001 Forecast 2002
Cash $ 20,400 $ 124,466Accounts Receivable 388,000 322,376Inventory 826,200 588,336
Current Assets $1,234,600 $1,035,178
Gross Book Value $826,300 $926,300Accumulated Depreciation (595,800) (718,200)Net Book Value 230,500 208,100
Total Assets $1,465,100 $1,243,278
Bank Notes $ 286,000 $ —Accounts Payable 306,000 306,000Accruals 77,500 77,500
Current Liabilities $ 669,500 $ 383,500Mortgage 36,700 36,700Common Stock 365,000 365,000Retained Earnings 393,900 458,078
Liabilities � Equity $1,465,100 $1,243,278
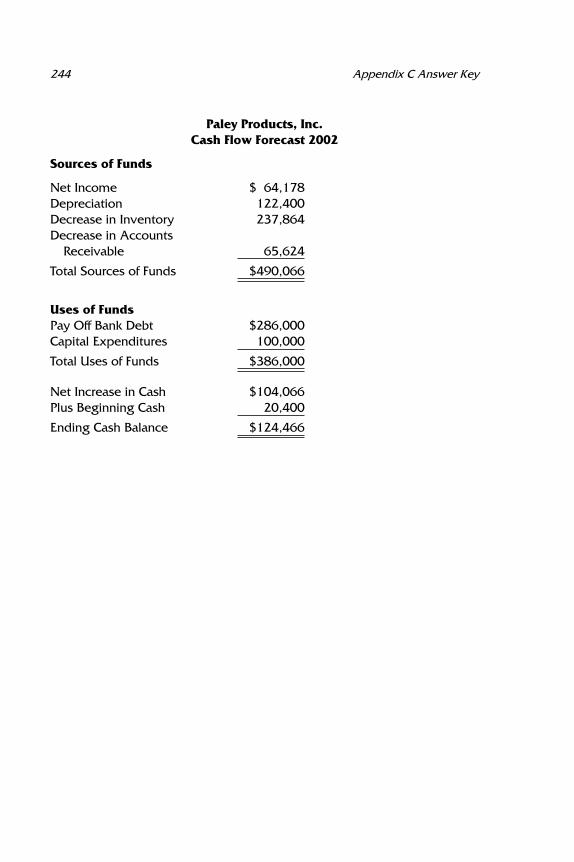
244 Appendix C Answer Key
Paley Products, Inc.Cash Flow Forecast 2002
Sources of Funds
Net Income $ 64,178Depreciation 122,400Decrease in Inventory 237,864Decrease in Accounts
Receivable 65,624
Total Sources of Funds $490,066
Uses of FundsPay Off Bank Debt $286,000Capital Expenditures 100,000
Total Uses of Funds $386,000
Net Increase in Cash $104,066Plus Beginning Cash 20,400
Ending Cash Balance $124,466
Appendix D
Matching Exercise
Exhibit D-1 gives ten sets of ratios and other financial informa-tion. The names of ten companies, representing different indus-tries, are given below. Match each set of financial informationwith the company that produced it.
1. Con Edison: A major power utility based in New YorkCity
2. AIG: A global insurance and related services company3. Continental Airlines4. WPP: A global advertising agency5. Nordstrom: An upscale department store chain, selling
mostly clothing6. Right Associates: A management consulting firm7. Sara Lee: A food, coffee, and tea company8. Merck: A pharmaceutical and medical products com-
pany9. A&P: A supermarket chain
10. I.T.T. Educational Services: A nationwide chain of overseventy accredited colleges and technical schools
245
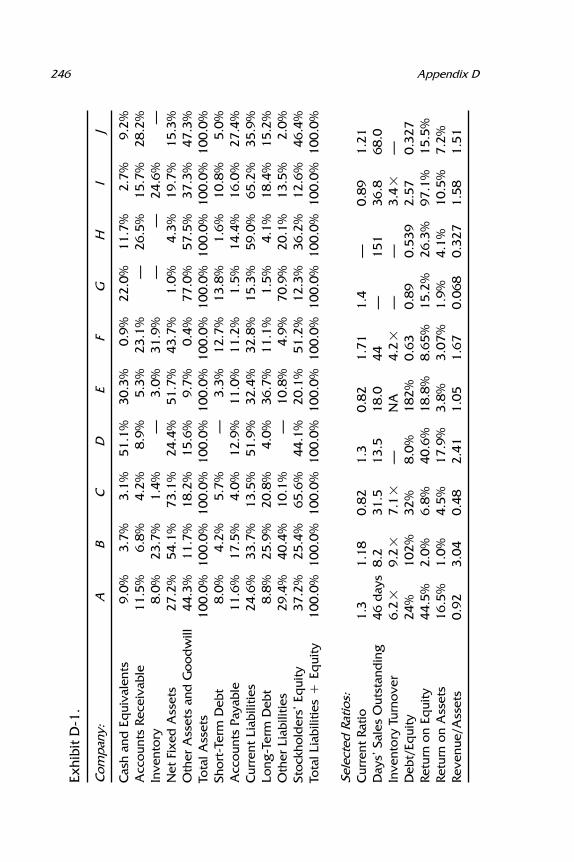
246 Appendix DEx
hibi
tD
-1.
Com
pany
:A
BC
DE
FG
HI
J
Cas
han
dEq
uiva
lent
s9.
0%3.
7%3.
1%51
.1%
30.3
%0.
9%22
.0%
11.7
%2.
7%9.
2%A
ccou
nts
Rece
ivab
le11
.5%
6.8%
4.2%
8.9%
5.3%
23.1
%—
26.5
%15
.7%
28.2
%In
vent
ory
8.0%
23.7
%1.
4%—
3.0%
31.9
%—
—24
.6%
—N
etFi
xed
Ass
ets
27.2
%54
.1%
73.1
%24
.4%
51.7
%43
.7%
1.0%
4.3%
19.7
%15
.3%
Oth
erA
sset
san
dG
ood
will
44.3
%11
.7%
18.2
%15
.6%
9.7%
0.4%
77.0
%57
.5%
37.3
%47
.3%
Tota
lAss
ets
100.
0%10
0.0%
100.
0%10
0.0%
100.
0%10
0.0%
100.
0%10
0.0%
100.
0%10
0.0%
Shor
t-Te
rmD
ebt
8.0%
4.2%
5.7%
—3.
3%12
.7%
13.8
%1.
6%10
.8%
5.0%
Acc
ount
sPa
yabl
e11
.6%
17.5
%4.
0%12
.9%
11.0
%11
.2%
1.5%
14.4
%16
.0%
27.4
%C
urre
ntLi
abili
ties
24.6
%33
.7%
13.5
%51
.9%
32.4
%32
.8%
15.3
%59
.0%
65.2
%35
.9%
Long
-Ter
mD
ebt
8.8%
25.9
%20
.8%
4.0%
36.7
%11
.1%
1.5%
4.1%
18.4
%15
.2%
Oth
erLi
abili
ties
29.4
%40
.4%
10.1
%—
10.8
%4.
9%70
.9%
20.1
%13
.5%
2.0%
Stoc
khol
der
s’Eq
uity
37.2
%25
.4%
65.6
%44
.1%
20.1
%51
.2%
12.3
%36
.2%
12.6
%46
.4%
Tota
lLia
bilit
ies
�Eq
uity
100.
0%10
0.0%
100.
0%10
0.0%
100.
0%10
0.0%
100.
0%10
0.0%
100.
0%10
0.0%
Sele
cted
Ratio
s:C
urre
ntRa
tio1.
31.
180.
821.
30.
821.
711.
4—
0.89
1.21
Day
s’Sa
les
Out
stan
din
g46
day
s8.
231
.513
.518
.044
—15
136
.868
.0In
vent
ory
Turn
over
6.2�
9.2�
7.1�
—N
A4.
2�—
—3.
4�—
Deb
t/Eq
uity
24%
102%
32%
8.0%
182%
0.63
0.89
0.53
92.
570.
327
Retu
rnon
Equi
ty44
.5%
2.0%
6.8%
40.6
%18
.8%
8.65
%15
.2%
26.3
%97
.1%
15.5
%Re
turn
onA
sset
s16
.5%
1.0%
4.5%
17.9
%3.
8%3.
07%
1.9%
4.1%
10.5
%7.
2%Re
venu
e/A
sset
s0.
923.
040.
482.
411.
051.
670.
068
0.32
71.
581.
51
Appendix D Answer Key
Here are the companies that match the sets of financial state-ments. For each company, a few of the ratios and other financialinformation that should have led you to match the company tothe correct set of financial statements are mentioned.
A. Merck
The company has excellent margins and profitability ratios.Days’ sales outstanding is high because the company sells to hos-pitals. It has very little long-term debt and a very comfortablecash level.
B. A & P
Because most of the company’s sales are for cash, accounts re-ceivable is very low. Low margins are typical of this industry. Thehigh revenue/assets ratio reflects high inventory turnover, butA&P also owns its own buildings. Food inventory has a very highturnover, but staples do not.
C. Con Edison
As a utility, this company is very fixed-asset-intensive with a rea-sonably good collection period.
247
248 Appendix D Answer Key
D. I.T.T. Educational Services
This is a very profitable, well-run business. Most funds are col-lected in advance (tuition), and inventory is nonexistent. Thecompany has low debt and high profitability ratios.
E. Continental Airlines
Airlines are very fixed-asset-intensive. The low level of receiv-ables reflects collections from travel agencies and prepurchase oftickets. Inventory is low because the major part of it is fuel, whichis basically purchased when needed. High debt is commonamong airlines because of the need to finance airplane pur-chases.
F. Nordstrom
The level of inventory turnover reflects the seasonality of thebusiness. Margins are quite good for a retail operation. Days’sales outstanding reflects self-financing of Nordstrom creditcards.
G. AIG
The company has no inventory or receivables, as premiums arecollected in advance. It is very cash-rich (as a result of invest-ments). The high level of nondebt liabilities reflects benefit re-serves.
H. WPP Advertising Agency
The company has a very high level of receivables, reflecting thefact that work is billed after it is completed and the difficultyof collecting for an intangible service. High goodwill reflects theacquisition of companies with few tangible assets.
249Appendix D Answer Key
I. Sara Lee
The company has reasonable margins. The high return on equityreflects the high debt/equity ratio and prior years’ losses, whichreduced equity. The inventory level reflects large raw materialspurchases and the fact that much of the finished product is fro-zen before sale.
J. Right Associates
This company has high receivables because it bills much of itswork only after the work is completed. It has no inventory. Otherassets are mainly goodwill resulting from acquisitions.

This Page Intentionally Left Blank
Glossary
10K The annual report that every issuer of public securities,every company whose stock is listed on any stock exchange,and any company with 500 or more shareholders must sub-mit to the Securities and Exchange Commission. The 10K issimilar to the annual report that every shareholder receives;it contains a complete set of financial statements and morebackup detail, but no photographs or ‘‘public relations’’ typeinformation.
Accelerated Cost Recovery System (ACRS) A depreciationmethodology prescribed by the Internal Revenue Service. Ithas been modified a number of times since it was first intro-duced; the version currently prescribed is known as theModified Accelerated Cost Recovery System (MACRS). Itshortens the depreciable lives of equipment but providesless than the full straight-line deduction the first year. Thedepreciable lives prescribed by MACRS are changed fre-quently as the technological lives of equipment becomeshorter. The use of MACRS is required by the IRS for tax re-porting but is not acceptable under GAAP for financial re-porting.
Accounting The reporting of the past in dollars. Accounting re-cords business transactions after they occur. When all ofthese transactions are recorded, the results are compiled(added up) and summarized in what we know as financialstatements.
251
252 Glossary
Accounts Payable The amount the company owes to its suppli-ers for products and services that it has already received, buthas not yet paid for. Accounts payable is a short-term liabil-ity, meaning that it is due in less than one year; it is probablydue within 30 to 60 days from the date of the balance sheet.
Accounts Receivable The amount of money that the companyis owed by its customers for products and/or services that ithas provided but for which it has not yet been paid. It is acurrent asset, meaning that it is due in less than one year; itis probably due within 30 to 60 days of the balance sheetdate.
Accounts Receivable Financing A form of borrowing in whichthe company uses accounts receivable as collateral for loansprovided by banks or commercial finance companies.
Accrual Accounting The accounting methodology used by es-sentially all public corporations and almost all private com-panies. With this methodology, revenues are recorded whenthe money is earned and expenses are recorded when theresource is consumed, without regard to when cash is re-ceived or spent. The alternative methodology is doing theaccounting on a cash basis. This means that revenue is re-corded when the cash is received and expenses are recordedwhen the bills are actually paid.
Acid Test Ratio (Quick Ratio) See Quick Ratio.Acquisition Generally, the purchase of one company by an-
other. The transaction can be for cash, stock, debt, or anycombination of these.
Administrative Expenses What the company spends on itssupport staff and the infrastructure that that support staffneeds in order to contribute to the company’s success. In-cluded in the support staff are:
AccountingLegalHuman resourcesManagement information systems
The supporting infrastructure includes such things as:
The corporate headquartersOffice suppliesThe computer system
253Glossary
Aging Schedule A detailed listing of how long the company hasbeen waiting for its customers to pay their bills. This is ananalytical tool that helps management to gauge the effec-tiveness of the company’s accounts receivable collection ef-forts. While days’ sales outstanding (DSO) identifies theaverage age of receivables, it may mask specific problem sit-uations. The aging schedule of a company that sells with 30-day payment requirements might be:
0–30 days Not yet due30–45 days Should be received soon45–60 days Indicative of a problem; put on credit watch60–75 days Very serious; consider stopping shipmentsAbove 75 days Collection in doubt
AICPA The accountants’ professional organization. The initialsstand for American Institute of Certified Public Accountants.
Amortization For investments, the accounting mechanism forapportioning an investment in an intangible asset over theyears of its productive (useful) life. Intangibles that are am-ortized include copyrights, licenses, trademarks, and good-will. Each year a commensurate share of the wholeinvestment will be included as a noncash expense on theincome statement. This concept is very similar to deprecia-tion expense, except that depreciation is for fixed (tangible)assets.
For a loan, an arrangement whereby fixed monthly pay-ments that include principal and interest are calculated.Each payment includes interest for the period and a suffi-cient amount of principal to retire the loan after the speci-fied number of payments. A loan that is amortized over 20years will have 240 equal monthly payments.
Angel Financing A form of venture capital that finances astartup at its earliest stages. The business is probably onlyan idea at this point. There may be a business plan, but notnecessarily. The ‘‘angel’’ is probably a wealthy friend or rela-tive, although it may be a venture capital firm if the idea
254 Glossary
involves a high-tech concept developed by someone with atrack record in the field. The angel provides cash and man-agement expertise in exchange for a portion of the equity.
Asset-Based Lending Borrowing funds from a bank or otherfinancial institution using the company’s assets as collateralfor the loan. A home mortgage is a form of asset-based lend-ing that uses real estate as collateral. Working capital loansuse accounts receivable and inventory as the collateral asset.
Using assets as collateral is often the only way a smallerbusiness can borrow from a commercial bank. It can alsoresult in lower interest rates and fees because it reduces thelender’s risk.
Assets Those resources owned by the company. These are clas-sified as follows:
Very liquid:Cash and cash equivalentsShort-term marketable securities
Working capital:Accounts receivableInventory
Tangible or fixed assets:LandBuildingsMachinery and equipmentVehicles, furniture, and fixtures
Intangible or financial assets:Ownership of other companiesOther equity or debt investmentsCopyrightsPatentsTrademarksGoodwill
Audit A review and critique of the company’s accounting sys-tem, its control procedures, and the actual accounting proc-
255Glossary
ess by a disinterested party. The elements reviewed includethe recording of events and the preparation of the financialstatements. The audit process also involves gaining assur-ance that the numbers presented in those financial state-ments are reasonably accurate.
A certified audit is performed by an outside, indepen-dent CPA firm that is hired by the stockholders. Such a firmsometimes achieves these objectives by supervising peoplecalled ‘‘internal auditors.’’ These internal auditors are em-ployees of the company but are supervised by the CPA firm.
Audit Letter (Certification Letter) The letter written by the CPAfirm to the stockholders that provides assurance (or createsdoubt) that the audit was performed correctly and that thereis a reasonable certainty that the financial statements arepresented accurately.
The letter appears in the company’s annual report andshould be read. It alludes to the complexities and uncertaint-ies of the accounting process. It is often the focal point oflitigation because of differing views of what it does and doesnot promise.
Balance Sheet A financial statement prepared by the companyat the end of every fiscal period that presents the company’sassets, liabilities, and stockholders’ equity at a point in time.The balance sheet equation is:
Assets � Liabilities � Equity
Banker’s Acceptance A bank-originated corporate credit in-strument that is often used to finance product import activi-ties. It helps the importer to be sure that it will get what itordered and the seller to be sure that it will be paid when theproduct is ‘‘accepted’’ by the importer.
Bankruptcy The unhappy experience that results from a com-pany’s inability to pay its bills. It can be:
Involuntary, when creditors petition the court to declarethe debtor insolvent
Voluntary, when the debtor company files the petition
256 Glossary
Under Chapter 7 (of the bankruptcy code), the court ap-points a trustee with broad powers to take actions, whichusually lead to the liquidation of the firm’s assets and cessa-tion of its operations.
Chapter 11 permits the company to continue operating.The company and its creditors will work together to try tosalvage the business and their relationships. Payment sched-ules and settlements are negotiated, and debt is restruc-tured. Creditors will often provide new loans and credit tothe company in the hope that it will survive and prosper.
Basis Point A finance and banking term that means 1/100 ofone percent. One full percentage point equals 100 basispoints. When the Federal Reserve reduces interest rates by1/2 percent, it has reduced the rates by 50 basis points.
Bill of Lading The documentation that supports the shipmentof products.
Billing Cycle The interval between the times that companiessend out invoices. It can be as short as a day or as long as amonth. Companies should examine their customers’ pay-ment practices and shorten the billing cycle if doing so willaccelerate payments. This decision should also reflect theadministrative costs of sending out invoices, a cost that fre-quently may be ignored.
Board of Directors The governing body of a corporation. It iselected by and accountable to the stockholders. It hires thesenior executives of the organization (who may also be di-rectors) and holds them accountable for business perform-ance and financial integrity.
Bond A corporate debt security that is sold to the public or byprivate placement in order to raise funds. The maturity isusually between 5 and 30 years. The coupon rate is the statedrate of interest when the bond is issued. Corporate bondsare usually sold in units of $1,000; a bond that is selling at itsface value is said to be selling at par. The price of a bond willoften fluctuate in response to market conditions during theyears in which the bond is outstanding. However, the corpo-ration is obligated to refund the full par value of the bond atmaturity.
Book Value An accounting term that describes the original pur-
257Glossary
chase cost of fixed assets less the accumulated depreciationcharged against those assets. In this regard, book value andnet book value are synonymous terms.
The term book value is also used to describe the stock-holders’ equity section of the company’s balance sheet. Thetotal amount of equity shown on the balance sheet dividedby the number of common shares outstanding is referred toas the book value per share:
Stockholders’ EquityCommon Shares Outstanding
� Book Value per Share
In stock market analysis, the market price of a share of thecommon stock is then compared with the book value pershare, which is used as a benchmark to establish the ‘‘pre-mium’’ at which the shares are selling.
Breakeven Analysis A financial analysis technique that in-volves studying the relationships among a product’s sellingprice, variable and fixed costs, and production volume andtheir cumulative impact on business profitability. The spe-cific formula is:
Volume �Fixed Cost � Profit
Price per Unit � Variable Cost per Unit(Contribution Margin)
See Chapter 9 for a full discussion of this procedure.Budget Essentially, a financial process of prioritizing the bene-
fits resulting from business opportunities and the invest-ments required to implement those opportunities. Each yearthe company undertakes what we shall call the planningprocess. Management thinks about and plans for the future,and makes strategic, operational, and spending decisions. Itbasically allocates cash to those departments, projects, mar-kets, and endeavors that it believes will add the most valueto the business. When all of these decisions have been made,they are recorded in a document called the budget. There-fore, the budget is essentially a documentation of the plan-ning process. It serves as a record, guide, and standard of
258 Glossary
performance against which to measure and evaluate futureresults.
Capital A generic term that describes the total resources avail-able to the company. It is sometimes used to describe totalassets. For example, one might say that a cash-rich companyis ‘‘well capitalized.’’ This means that the company has ade-quate resources to finance its future. A company that is un-dercapitalized is one that does not have adequate resources.
Capital Assets Usually synonymous with fixed or tangibleassets. This includes:
LandBuildingsMachinery and equipmentFurniture and fixturesVehicles
Capital Budget The portion of the budget process in whichmanagement focuses specifically on the company’s fixedasset needs.
Capital Expenditure The expenditure or disbursement of fundsfor the purpose of purchasing fixed assets.
Capital Gain The delightful experience that results from sellingan asset held for more than one year at a profit. Revisions intax laws keep the exact definition of short- and long-termcapital gains changing, but the concept does not change.
Capital Lease A long-term contract in which the lessee or userof a fixed asset essentially assumes ownership, along withpossession. The issues considered in deciding whether alease is in fact a capital lease are:
The life of the asset compared to the life of the leaseTransfer of titleExistence of an option to purchase the asset at a bar-gain priceThe total amount of lease payments compared withthe market value of the asset
If the structure and terms of the lease meet certain criteria,the lessee or user may have to include the asset on the com-
259Glossary
pany’s balance sheet even though the company does nottechnically ‘‘own’’ it.
Capital Stock Common stock of the company.Capital Structure The proportions in which the company’s
assets are financed by lenders (debt) and by stockholders(equity). It addresses, conceptually, whether the companyhas too much risk (debt) and the degree to which the ownershave invested (common stock) and reinvested (retainedearnings) in the business.
Capitalization Defined as long-term debt plus stockholders’equity.
Cash Flow The overall amount of cash generated by the com-pany that is available to the company to manage the busi-ness. It is sometimes also expressed as:
Net Income� Depreciation� Cash Flow
Cash Flows, Statement of A required financial statement inevery annual report and 10K. It provides a summary of allcash flows generated and used, categorized as:
Operating activitiesInvesting activitiesFinancing activities
Cash Management A company’s operation of the payment andcollections functions. This can include short-term investing.The goal is to accelerate the receipt of cash, wisely disbursefunds to the company’s advantage, and achieve interest in-come while minimizing administrative expenses.
Certificate of Deposit (CD) An investment security issued by acommercial or other bank. The denominations of thesesecurities can be as little as $1,000 or as large as millions ofdollars. Companies often buy these securities as investmentsbecause they provide quite good interest income and are rel-atively safe. Their maturity can be as short as one month oras long as many years.
260 Glossary
Certified Public Accountant (CPA) A person who is welltrained in GAAP and related accounting matters and haspassed state CPA exams. CPAs are licensed to provide audit,tax, and other accounting advisory services to companies asan independent, disinterested party.
Chief Financial Officer (CFO) The top financial executive inthe company. The CFO is responsible for all treasury, con-trollership, and regulatory compliance functions. As thechief financial analyst for the company, this person can be avalued business adviser to the entire management team.
COGS See Cost of Goods Sold.Collateral Assets pledged as security for a loan. If payments are
not made, the creditor can take possession of the assets andsell them to satisfy the debt. A house is collateral on a homemortgage. If there is specific collateral on a loan, the bank orother creditor is described as a secured lender.
Collection The process of ensuring that customers who owethe company funds for products and services that the com-pany provided pay in a timely manner. The process also in-cludes processing payments received and depositing thefunds in a bank rapidly.
Commercial Loan Funds borrowed from a commercial bank.Commercial loans are usually short-term, covering seasonalneeds, large orders, and other temporary cash requirements.
Commercial Paper Promissory notes issued by very large,high-quality corporations. Commercial banks often pur-chase these investment-grade securities from their clientcompanies in lieu of making a commercial loan. Large in-dustrial corporations sometimes purchase these securities,as do investment companies and mutual funds. Their matur-ity is always short-term. Because the buyer has a high-quality negotiable instrument, the interest rate is oftenbelow the prime rate.
Common Stock Shares of ownership in a corporation. Ownersof the shares usually have the right to vote for members ofthe board of directors and on other issues, although somecompanies’ stock does not have a one-share, one-vote rela-tionship. The dollar amount of common stock shown on the
261Glossary
balance sheet is the historical amount that the owners paidwhen they purchased the stock from the company.
Compensating Balance A minimum balance that bank loan cli-ents must maintain in their checking accounts at all times.Because not all of the amount borrowed is available to theborrowing company, the existence of a compensating bal-ance results in an interest rate that is considerably higherthan the stated loan rate.
Completed Contract Method An accounting procedure usedfor long-term, multiperiod contracts in which the profitachieved is not recognized until the work is completed. Thecompleted contract method is usually used in the construc-tion industry and by defense contractors.
Consideration Something of value that is provided by a partyto a contract. Consideration is an essential part of every con-tract; each party must provide something of value (consider-ation) for the contract to be valid. A very common form ofconsideration is cash.
Consignment Sale A method of selling products in which thevendor (the consignor) places its products on the premisesof a customer entity (the consignee). Although the consigneepossesses the product and must assure its safety, it remainsthe property of the consignor. When the product is sold to athird party, it becomes the property of that purchaser andis subject to whatever credit terms were agreed upon. Thismethod is most common in a retail environment, especiallywhen the product’s marketability is unproven.
Contribution Margin The price of the product less the variablecost to produce it. This term is sometimes used interchange-ably with the terms gross margin and gross profit. It may beexpressed on a per-unit basis or be given for the entire prod-uct line in dollar or percentage terms.
Convertible Securities Bonds or preferred shares issued by acompany that can be exchanged for common shares undercertain terms and conditions.
Correspondent Bank A bank that serves as a depository or pro-vides check clearing or other services for smaller commercialbanks.
Cost Accounting The accounting practice of measuring the
262 Glossary
cost incurred to produce a unit of product by cost element—direct labor, direct materials, and supporting overhead.
Cost Allocation An accounting methodology in which a portionof manufacturing overhead is charged to each unit of prod-uct that passes through the facility. The mathematical ap-portionment may be based on:
Units of productionLabor hoursPounds of material inputsMachine hours
Cost allocation is required by GAAP accounting and is builtinto the standard cost system. It is also called absorptionaccounting. The portion of the overhead charged to eachunit is often called the burden.
Cost of Goods Sold (COGS) The cost of producing the productsthat are delivered to customers to create revenue. In a manu-facturing company, COGS would include:
Direct labor: The amounts paid to the people who ac-tually create and assemble the productMaterials: The cost of all the inventory that goes intothe productManufacturing overhead: Some portion of the spend-ing that supports the assembly process
Credit Department The department that qualifies and moni-tors the creditworthiness of customers, sends out invoices,and does the accounting for customer collections. It is usu-ally part of the controller’s office.
Current Assets The assets on the balance sheet that are ex-pected to become cash within one year from the date of thatbalance sheet. These assets include:
CashMarketable securitiesAccounts receivable
263Glossary
InventoryPrepaid expenses
Current Liabilities The liabilities of the company that are duewithin one year from the date of the balance sheet. Theyinclude:
Accounts payableBank debtCurrent portion of long-term debt
Current Portion of Long-Term Debt Liabilities that had a ma-turity of more than one year when the funds were originallyborrowed, but that now, because of the passage of time, aredue in less than one year. It is similar to the principal portionof the next twelve monthly payments on your home mort-gage.
Current Ratio A measure of corporate liquidity. It is calculatedas:
Current AssetsCurrent Liabilities
� Current Ratio
Current Yield The rate of interest earned on the purchase priceof a bond, whether or not the bond is purchased at facevalue. The formula is:
Annual Interest IncomePurchase Price of the Bond
� Current Yield
Days’ Sales Outstanding A measure of how much time, on av-erage, is being required for the company to receive the cashit has earned from its customers. The time begins when theinvoice is sent and ends when the check is received.
Annual Revenue365
� Average Revenue per Day
Accounts ReceivableAverage Revenue per Day
� Days’ Sales Outstanding
264 Glossary
Debenture A type of corporate bond secured only by the fullfaith and credit of the debtor company, not by specific col-lateral. In a bankruptcy, holders of these bonds would begeneral creditors.
Debt Amortization See Amortization.Debt/Equity Ratio
Long-Term DebtStockholders’ Equity
� Debt/Equity Ratio
This is a measure of risk for both the company and its cur-rent and future creditors.
Debtor A person or company that owes money to another.Deferred Charges An asset account, sometimes part of ‘‘other
assets.’’ This is an accumulation account into which pay-ments for future benefits are placed. These cash outlays willbe converted into expenses gradually as the operationsbegin. Examples are start-up costs of a new business and up-front fees associated with stock and bond offerings.
Deferred Revenue A short- or long-term (or both) liability ona company’s balance sheet. It results from the company’sreceiving payments in advance for services or products thathave not yet been provided. The company now ‘‘owes’’ thatamount of services or products to its customer. This ‘‘debt’’will be satisfied when those services or products are pro-vided. For example, a magazine subscription results in de-ferred revenue for the publisher because the payment isreceived in advance; it will be converted into actual revenueas issues of the magazine are delivered.
Deferred Taxes Tax liabilities of the company. Most companiespay less in taxes in any one year than the corporate incometax rate because of differences between the accountingmethodology used in the published financial statements andthat used in filings with the IRS. The difference between thetwo amounts, deferred income taxes, appears as a currentliability and/or a long-term debt on the company’s balancesheet. An increase in this liability is evidence that the com-pany actually paid less in taxes than is indicated in the in-come statement. Notice that on the income statement, the
265Glossary
caption reads ‘‘Provision for income taxes’’ and represents34 percent of the pretax amount. Most companies’ actual taxrate is in the 20 to 25 percent range.
Demand Deposit Funds on deposit in a bank that the owner ofthe funds can withdraw without notice. The owner of thefunds may access these funds easily, usually by writing acheck. A checking account in a commercial bank is a com-mon example of a demand deposit.
Demand Loan A bank loan that has no fixed maturity. The loanmust be repaid ‘‘on demand,’’ meaning that the lender can‘‘demand’’ the funds from the borrower without notice orreason.
Depreciation A noncash expense that results from the appor-tionment of a capital expenditure over the useful life of theasset. It is the prime example of the concept that an expenseand an expenditure are not the same.
Direct Costs Those costs of producing a product or service thatare absolutely essential if the product is to be made or theservice to be provided. In creating a product, the labor thatmakes the product and the material that becomes the prod-uct are true direct costs. Some supporting costs in the fac-tory are also classified as direct in a company’s standard costsystem.
Dividend A payment to holders of preferred and commonshares. Dividends are usually a distribution of net income.
Dividend Payout Ratio The portion of net income that is paidto shareholders as a dividend.
Dividend PaymentNet Income
� Payout Ratio
Due Diligence Conceptually, ensuring that the informationthat was presented is true. Before making a loan, a bank does‘‘due diligence’’ to make certain that the collateral (receiv-ables, inventory, or real estate) is actually worth the statedvalue. In the acquisition of another company, the buyer doesdue diligence to make certain that the seller’s representa-tions are accurate and that the buyer’s company is getting
266 Glossary
what it paid for. This is very similar to a home inspectionbefore the closing.
Earnings per Share (EPS) The portion of the company’s netincome that is attributable to each share of outstandingcommon stock. It is calculated as follows:
Net Income � Preferred DividendsCommon Shares Outstanding
� Earnings per Share
Earnings per Share (EPS) Fully Diluted A calculation of earn-ings per share that includes the following in the number ofcommon shares outstanding:
Earned or vested stock options that have not yet beenexercised
Shares that would result from conversion of any con-vertible securities
Primary earnings per share is the EPS calculated without in-cluding the effects of potential dilution.
EBIT Earnings before interest and taxes.EBITDA Earnings before interest, taxes, and depreciation and
amortization. This is the equivalent of operating income ona cash basis.
Economic Order Quantity (EOQ) The amount of product thatthe company should buy each time it makes a purchase.Buying in massive quantities will probably reduce purchasecost per unit but will increase inventory, inventory risk,warehouse expense, and financial carrying costs. Buyingonly the minimum amount needed will reduce thoseinventory-related costs and the related risk. It will, however,result in increased purchase cost per unit and make thecompany more vulnerable to stock-outs. EOQ techniques as-sist management in balancing these issues to identify themost efficient amount to purchase at one time and how fre-quently to make these purchases.
The way this quantity is calculated is changing becauseof the technological connection between customer and sup-plier. But the concept still has validity.
267Glossary
Electronic Data Interchange (EDI) A computerized connec-tion between customer and supplier that permits more eco-nomic control of inventory and more efficient supply chainmanagement.
Electronic Payments Transfers of cash between banks that areaccomplished without the actual writing of checks. Float isessentially eliminated because checks need not clear. Directdeposit of your payroll check is an excellent example of this.
Escrow Money or other property held by a disinterested party,known as an escrow agent, until the conditions of a contractare fulfilled. The closing on a house is an escrow process,especially when funds are held for a while after the meetingbecause one of the parties has not satisfied all of the condi-tions.
Factoring Selling accounts receivable to a third party, usually abank factoring department or a finance company. The creditrisk can be sold with the paper (factoring without recourse)or be kept by the company until the funds are collected (fac-toring with recourse). This is a very expensive form of finan-cing. It is often used by clothing manufacturers anddistributors.
FASB Financial Accounting Standards Board. A professional ac-counting organization that researches accounting and re-porting issues and recommends revisions to accounting andreporting rules. The products of the FASB’s efforts are calledFASB Bulletins.
Federal Funds Rate Interest rate charged by banks when theylend to each other.
Federal Reserve System An independent agency of the execu-tive branch of the U.S. government that is responsible,among other things, for regulating many activities of com-mercial banks. Through its monitoring of the money supply,it has vast influence on interest rates and on overall eco-nomic and business activity. The Federal Reserve System hasa board of governors in Washington, D.C., and thirteen re-gional banks that focus on issues relating to the economiesof their respective regions.
Finance Charge Interest payments on borrowed funds and therelated fees for arranging the loans.
268 Glossary
Finance Company A private, for-profit organization that lendsmoney to companies. It may originate those loans on behalfof banks or actually make the loans itself. These loans canthen be sold to banks or other finance companies. Financecompanies often function as factors.
Fiscal Year An accounting year. It may or may not coincidewith the calendar year.
Fixed Assets Assets owned by the company and used in the op-eration of its business that are expected to last more thanone year; also called tangible assets. They include:
Land and buildingsMachinery and equipmentFurniture and fixturesVehicles
All of these assets except land are subject to depreciation.Fixed Costs Costs that a company incurs that are not directly
sensitive to volume changes.Float Funds in transit between banks. From the time a check is
written and sent until the receiver deposits the check andthe check clears, neither the sender nor the receiver has theuse of the money. The depository bank has free use of themoney until the check clears. No corporation can write acheck on funds that have not yet cleared.
Footnotes That section of the annual report (or any financialstatement package) that provides greater detail than the fi-nancial statements themselves. The notes describe variousaccounting procedures and policies, and provide consider-able critical backup information necessary for understand-ing the financial statements.
Foreign Currency Translation Gains and losses that the com-pany experiences on investments and debts that are denom-inated in foreign currency as a result of changes in the valueof that foreign currency relative to the dollar.
Freight on Board (FOB) The concept that determines exactlywhen title to goods that have been shipped transfers to therecipient. FOB Origin means that the receiver owns and isresponsible for the product from the time it leaves the sell-
269Glossary
er’s premises. FOB Destination means that the shipper re-mains responsible until the product reaches the customer.
General and Administrative Expense All the staff expenses andother supporting expenses necessary to operate the busi-ness. Among the many expenses included might be:
Building rentStaff salariesCosts of operating the accounting and legal depart-ments
General Ledger The summary set of accounting books thatcontains consolidated information on each account. Thegeneral ledger serves as the basis for the preparation of fi-nancial statements.
Generally Accepted Accounting Principles (GAAP) The generalprinciples and rules that govern the efforts of the accountingprofession. Their focus is on the way in which accountinginformation is prepared and reported.
Goodwill The amount of money that the company paid to ac-quire other companies in excess of the value of the tangibleassets acquired as part of the transaction. This accountingdefinition of goodwill is not at all related to the more com-mon use of the term to describe the market value of the com-pany’s reputation. Goodwill appears as a long-term asset onthe company’s balance sheet.
Gross Margin
Revenue� Cost of Goods Sold� Gross Margin
Gross margin is sometimes called, but is not necessarily al-ways the same as, gross profit.
Hurdle Rate The minimum ROI that companies require beforethey will approve a capital expenditure proposal.
Income Statement A report of revenues, expenses, and profitthat describes a company’s performance during a fiscal pe-riod.
270 Glossary
Indirect Costs Costs that are not attributable to a single areabut support the entirety of the business.
Industrial Revenue Bond A long-term bond issued by a munic-ipal government on the behalf of a company. The proceedsare loaned to the company for the purpose of facilitiesexpansion and, more importantly (from the government’spoint of view), job creation. The government agency usuallysells the bond to a bank. The use of these bonds providestax advantages for the investor, interest rate benefits for thecompany, and job creation opportunities for the munici-pality.
Initial Public Offering (IPO) The first offering of a company’scommon stock to the public. It requires registration with theSecurities and Exchange Commission and is usually under-written by investment bankers.
Insolvency A serious financial condition resulting from a com-pany’s inability to pay its bills. It often results in bankruptcy.
Installment Credit Loans that are repaid through fixed periodicpayments of principal and interest.
Institute of Management Accountants A professional and edu-cational association whose membership includes accoun-tants and financial analysts.
Intangible Assets Assets that cannot be seen or touched butmay have considerable value. Evidence of these assets mayliterally be only a piece of paper. Examples are investmentsin other companies, licenses, copyrights, and trademarks.
Interest The fee paid to a lender for funds borrowed.Internal Rate of Return The actual return on investment (ROI)
based upon the discounted cash flow method of investmentanalysis. Using time value of money concepts, it is calculatedby equalizing the present value of the cash inflows (PVCI)and the present value of the cash outflows (PVCO). The for-mula, which appears in all computer software that calculatesROI, is:
PVCO � PVCI � F (%, yrs)
where F is the present value factor corresponding to the ROIpercentage (%) and the number of years in the project fore-cast (yrs).
271Glossary
Internal Revenue Service (IRS) The part of the Treasury De-partment of the U.S. government that is responsible for theadministration and collection of taxes and the enforcementof the tax laws as prescribed by Congress.
Inventory The financial investment that the company hasmade in the manufacture or production (or, in the case of aretail store, the purchase) of products that will be sold tocustomers. There are two primary methods of accounting forInventory:
LIFO, or last-in, first-outFIFO, or first-in, first-out
Invoice A notification to a customer that the customer owes thecompany money for products and services provided. It maycontain some details of the sale and certainly should com-municate a due date.
Lease A contract to obtain the use of an asset over an extendedperiod of time. This often results in the lessee (user) owningthe asset after the lease ends.
Lender A provider of loans.Lessee The party that leases an asset from the owner, who is
the lessor.Letter of Credit A bank document issued on behalf of the buyer
of a product that guarantees that the seller will be paid upondelivery of the product. This eliminates the seller’s creditrisk. Letters of credit are often used in international transac-tions. They are a form of banker’s acceptance.
Letter of Intent A document, bordering on a contractual prom-ise, that specifies certain actions that will be taken by thewriter if certain conditions are met. Banks write letters ofintent before they make loans, and buyers of businesses maywrite such a letter before entering the due diligence process.
Leverage (Financial) The use of borrowed funds to expand thebusiness and increase its profitability.
Leveraged Buyout The use of the assets being purchased ascollateral for the loan that will finance that purchase. Theterm is usually applied to the purchase of a company; how-ever, conceptually, the purchase of a house is also a lever-
272 Glossary
aged buyout, as the collateral for the loan is the house beingpurchased. The collateral must be of high quality, and theborrower’s ability to repay the loan needs to be demon-strated.
Lien An attachment of an asset, often used as collateral for aloan. The lien can be involuntary, resulting from a borrow-er’s inability to pay bills.
Line of Credit Arranging for a loan in advance of the time thefunds are required. This ensures that they will be available ifand when they are needed. It saves interest expense becausethe funds are not actually borrowed until they are required.
The existence of a line of credit demonstrates the com-pany’s borrowing power and financial strength. Informationabout the company’s lines of credit is often found in thefootnotes of a public company’s annual report.
Liquidity The ability of the company to pay its bills on a regularbasis and maintain the working capital levels necessary tosupport the business.
Lockbox A payment mechanism. Customers send their pay-ments to a post office box located near the company’s bank.The bank collects the payments from the box and depositsthem in the company’s checking account. The company isthen immediately notified of the deposit by the bank. Thisaccelerates the clearing process, reduces float, and increasesthe company’s interest income.
London Interbank Offered Rate (LIBOR) A benchmark interestrate that is used in many contracts and variable-rate loans.It is the interest rate that European banks charge each otherfor interbank loans. It is very similar to the American federalfunds rate.
Long-Term Debt Borrowed funds that are not due until morethan one year from the date of the balance sheet.
Lower of Cost or Market An accounting principle that governsthe reporting of assets on the company’s balance sheet.Assets are presented at their historical cost or their currentmarket value, whichever is lower. GAAP rules do not permitreflection of improved market value of assets on certified fi-nancial statements.
Management Discussion and Analysis A critical, required sec-

273Glossary
tion of a company’s annual report to shareholders. It is aletter from management, usually the CEO, that identifies, de-scribes, and comments on all of the critical events of the pastyear that had a material effect on the past performance oranticipated future performance of the company.
Maturity Date The date on which loans are required to be re-paid.
Mezzanine Financing Financing that companies use on an in-terim basis pending a stock issue or refinancing. Since it isoften subordinated to other debt, it will usually have a higherinterest rate.
Milestone Accounting A method of recognizing revenue andbilling the customer during a multiperiod contract. Whenthe product is delivered, its value, and therefore the amountof the invoice, is readily determinable. In a long-term con-tract such as a construction contract, however, identifyingwhen money is earned is not as clear. In milestone account-ing, the company and the customer establish a predeter-mined series of events, the achievement of which permitsthe company to bill. These milestones might occur monthlyor be based upon some other measure of completion.
Minority Shareholders Shareholders who own too few sharesto have any control over or influence on the activities ofmanagement or the future of the company.
Mortgage Bonds Long-term debt of the company that is se-cured by specific assets, usually real estate.
Net Book Value See Book Value.Net Income Bottom-line profit, recorded after all costs, ex-
penses, and taxes have been subtracted from revenue.Net Present Value The present value of the cash inflows from
an investment minus the present value of the cash outflows;a discounted cash flow measure for evaluating an invest-ment. A positive net present value indicates that the invest-ment opportunity being measured is more profitable thanthe company’s minimum ROI requirement.
Note, Promissory A written agreement to repay a debt plus in-terest at a certain date or on demand.
Operating Income A company’s profit before one-time events,
274 Glossary
other income and expenses, and corporate taxes. It is usuallydefined as:
Revenue� Cost of Goods Sold� Gross Profit� Selling, General, and Administrative Expenses� Depreciation and Amortization� Operating Income
Operating Lease A contract giving the lessee the use of a fixedasset for a relatively short period of time. The lessee or userassumes little or no responsibility for the asset and has nointention of buying it. Renting a car at the airport for twodays is an operating lease.
Operating Margin A company’s operating income as a percent-age of revenue:
Operating IncomeRevenue
� Operating Margin %
This is a measure of a company’s operating performance. Itis widely used and is an excellent measure of profit centerperformance.
Outsourcing Hiring outside people or another company to ac-complish work or produce product. Buying componentsfrom a supplier for in-house assembly is ‘‘outsourcing’’ theproduction of those components. Hiring a law firm, an in-surance consultant, or computer software developers forspecific projects are all forms of outsourcing. The companyusually gets better expertise than what it can afford inter-nally and does not end up with unneeded employees afterthe project is completed.
Overdraft Account An account at a commercial bank that givesthe company the privilege of writing checks for more thanits balance. It is essentially a line of credit attached to theaccount that gives the company some cash flexibility andensures that its checks will not bounce.
Overhead Costs of doing business that are not directly related
275Glossary
to the actual manufacturing process. This includes all costsfor the corporate staff. Conceptually, there is considerableoverlap between overhead and general and administrativeexpenses.
Paid-In Capital The total amount that the shareholders haveinvested in the company in either common or preferredstock in excess of the par value of the shares. Many compa-nies’ stock does not have a par value. Therefore, these com-panies do not have any paid-in capital. The par value ofcommon or preferred stock has no operational or stock mar-ket significance, with the exception that it might become im-portant if the company should become bankrupt.
Par Value A nominal or face value given to a bond or share ofstock. Par for a bond is usually $1,000. Par value for a com-mon share is a purely arbitrary amount. It has no relation towhat the price was when the shares were originally sold orto their current market value.
Performance Bond A form of insurance purchased by the partyto a contract who is undertaking to do some work; it pro-vides a guarantee to the other party that the work will bedone. It offers financial assurance and protection if terms ofthe contract are not fulfilled.
Preferred Dividend Distribution of a portion of net income tothe holders of preferred shares. Like all dividends, these divi-dends are not tax-deductible for the company.
Preferred Stock A hybrid class of stockholders’ equity. Ownersof these shares receive a dividend that, unless the companyis in financial distress, is essentially fixed. They do not nor-mally have the right to vote (for the board of directors), butthey have priority in receiving dividends in that their divi-dends must be paid before anything can be paid to the hold-ers of common shares.
Prepaid Expenses Expenses that are paid before the time pe-riod that will benefit. For example, insurance premiumsmight be paid in advance at six-month intervals. The pay-ment is a current asset on the balance sheet. The amountpaid is then amortized, with one-sixth of the amount beingcharged to each of the monthly periods as an expense.
276 Glossary
Price/Earnings Ratio The relationship between the price of acompany’s stock and the company’s earnings per share:
Common Stock PriceEarnings per Share
� Price/Earnings Ratio
To the extent that the stock market is a rational business, theprice/earnings ratio reflects the market’s perception of thecompany’s future prospects for earnings growth. The higherthe ratio, the more positive is the market’s outlook for thestock.
Prime Rate The interest rate that commercial banks charge onloans to their largest, most creditworthy customers.
Principal The face amount of any debt, without inclusion offuture interest payments.
Pro Forma Statement A financial statement that incorporatesinformation other than actual accounting information. Abudget is a pro forma statement, as is a forecast.
Profit Center An independent organization within a companythat has a readily identifiable market and core competencies.Its performance is usually measured by its revenues, ex-penses, and profitability. The profit center is often responsi-ble for the assets that are available for its use.
Property, Plant, and Equipment A term that is usually synony-mous with fixed assets. It is sometimes used to refer to thegross book value, and at other times to the net book value.
Quick Assets Cash and near-cash assets, including short-termmarketable securities and accounts receivable.
Quick Ratio A ratio that assists management in assessing thecompany’s liquidity position. The formula is:
Cash � Marketable Securities � Accounts ReceivableAccounts Payable � Bank Debt
� Acid Test/Quick Ratio
This ratio basically compares near-cash assets with currentliabilities (those that are due within the next year). The ratiodiffers from the current ratio in that inventory is excluded.Finished goods inventory still has to be sold and delivered.
277Glossary
Raw materials and work in process inventory require addi-tional effort and expenditure just to be completed. So interms of their ability to be turned into cash, there is a widegap between accounts receivable and inventory.
Because service businesses have little or no inventory,their quick and current ratios will be the same.
Ratio A mathematical comparison of two or more numbers. Itassists management in evaluating some area of companyperformance. A ratio can be fully financial, such as returnon equity (ROE), or statistical, such as capacity utilization ororder backlog.
Reserves Allowances for future negative events. Accounting re-quires recognition of bad news as soon as the possibilityarises, but permits recognition of good news only after it ac-tually occurs.
One example of a reserve is the allowance for bad debts.A company knows that its accounts receivable are some-times not 100 percent collectible. It statistically determinesthat, over time, 1 percent of its funds have not been fullycollected. Therefore, the company creates a reserve in theamount of 1 percent of accounts receivable, the allowancefor bad debts, which is subtracted from accounts receivableon the balance sheet. Another type of reserve would be setup by a retail store that has Christmas products left over inJanuary. Knowing that the product will have to be sold atbelow normal prices, it will create a reserve for the estimatedlosses that it will experience on this sale.
Retained Earnings The cumulative amount of the company’snet income that the owners have reinvested in the businessduring its entire corporate history. It is part of stockholders’equity on the balance sheet. Corporate net income can ei-ther be retained or be paid out as dividends to holders ofpreferred and common shares. The cumulative total of theamounts not paid out as dividends is the Retained Earningsaccount on the balance sheet.
Return on Equity A ratio that measures the overall perform-ance of the company. It reflects profitability, efficiency, andthe effective use of debt. The ratio is traditionally:
278 Glossary
Net IncomeStockholders’ Equity
� Return on Equity (ROE)
Rollover A delay in making principal payments on a loan. Itcould be a positive action to extend the duration of existingloans for a longer period, or it could take place because thedebtor does not have the cash to make the payments. Thebank will dictate the terms of the rollover if it is necessitatedby debtor weakness. Alternatively, a strong company maymake a rollover a condition of a future client relationshipwith the bank. The connotation of the term rescheduling isalmost always debtor weakness.
Sales A very vague, often misinterpreted term. Revenue is a pre-cise concept; it is the amount recorded on the income state-ment when the company earns money by providingproducts and services to the customer. Sales sometimesmeans revenue. It can also mean customer orders, which arenot yet revenue. If the production operation is busy, somemight say that ‘‘sales are going well.’’ ‘‘Business is excellent’’might mean that there are many customer inquiries. This isnot sales (orders), deliveries (revenue), or cash (collections).
Secured Loan Borrowing funds using specific assets as collat-eral for the loan. A mortgage is a secured loan because realestate is pledged as collateral. Accounts receivable financingis another form of secured loan. In a bankruptcy, a securedlender has first priority on the pledged asset to satisfy thedebt before the remainder of the proceeds become availableto the general (unsecured) creditors.
Securities and Exchange Commission (SEC) A U.S. govern-ment agency with oversight responsibility for the securitiesindustry. Among its many responsibilities, it specifies thesubstance of a public company’s annual report and 10K,oversees the fairness of stock trading, and monitors insiders’buying and selling of their company’s shares.
Standard Cost System An accounting mechanism that pro-vides information necessary to determine how much it coststhe company to produce its products. It requires definite as-sumptions concerning volumes, efficiency, and product mix.In a manufacturing environment, it is the basis for the ac-counting system.
279Glossary
Stock Option A contract that gives the owner the right to pur-chase a predetermined number of shares of a company’sstock at a specified price. It is a very common form of execu-tive compensation at public companies. Earned options arepart of the dilution effect in the company’s earnings pershare calculation.
Subordinated Debenture A corporate bond on which, shouldthe company issuing it have financial difficulties becomebankrupt, the payment of interest and repayment of princi-pal will have a lower priority than the payment of interestand repayment of principal on senior debentures.
Supply Chain Management The strategies associated withsourcing and receiving purchased products and the relatedmanagement of raw material and components inventory.Technological advances have drastically improved informa-tion and communication, leading to lower inventories andimproved efficiency at all phases of the process.
Term Loan A long-term debt; traditionally, one that has a ma-turity of one to five years.
Three Cs of Credit: Capacity, Collateral, Character The tradi-tional criteria that bankers use when evaluating a loan appli-cation.
Treasury Management The entire range of responsibilities forcash within a company. Among the treasurer’s many respon-sibilities are cash collections, the mobilization of the fundsinto usable form, investment of funds, and also future plan-ning.
Treasury Stock Company stock that was issued to the publicand subsequently repurchased by the company on the openmarket. In the equity section of the balance sheet, the stockappears as negative shares outstanding at the cost of the re-purchase rather than the current market value. Once trea-sury stock has been purchased, it can be retired to improveearnings per share or held for resale later.
Variable Costs Costs that a company incurs that will be sig-nificantly affected by changes in production volume. For ex-ample, the number of workers necessary to produce theproduct will certainly be affected by how much productneeds to be produced. The amount of material, components,
280 Glossary
and parts needed will fluctuate with volume on a directcause-and-effect basis. Therefore, these are variable costs.
Venture Capital A form of financing used in the early stages ofa company’s life. At best, the company being financed prob-ably has little or no track record and products that are notyet market-proven. Or the company may be at a still earlierstage; it may have developed a business plan and productprototype, or it may be only an idea. This is a highly specula-tive and risky form of investing.
Warrant A security giving the holder the right to buy stock inthe company. Stock options are given to employees, whereaswarrants are often given to lenders or investors as an induce-ment to do a transaction. Options are nontransferable,whereas warrants may have an independent value and mayalso be marketable securities.
Working Capital A term usually used to refer to cash and othercurrent assets such as marketable securities, accounts re-ceivable, and inventory. Sometimes working capital is de-fined as being synonymous with current assets. Other times,it is defined as:
Current Assets � Current Liabilities � Working Capital
The term is sometimes used as a generalized reference to acompany’s overall liquidity condition. For example, some-one might say, ‘‘The company has adequate working capi-tal,’’ meaning that it has adequate cash-related assets to runthe business.
Zero-Based Budgeting A budgeting philosophy and techniquethat requires a company to regularly rethink and reevaluateall aspects of how it conducts its business. It was first prom-ulgated in a Harvard Business Review article and was madefamous by then Governor Jimmy Carter of Georgia.
Technology has made it possible to include this conceptin our regular annual budget process. Having become com-fortable with change, companies do rethink their ways ofdoing business. They outsource less important, resource-consuming activities and focus on their core competencies.This was the basis of zero-based budgeting: It deemphasized

281Glossary
last year’s spending in developing the current year’s budgetrequirements.
Zero-Coupon Bond A corporate bond that pays no annual cashinterest but is sold at a discount from face value such that,if the bond is held to maturity, it will yield the indicated,competitively priced, interest rate. During its life, the priceof this bond will fluctuate in accordance with market condi-tions. As it gets closer to maturity, the bond price will gravi-tate toward its face amount. A U.S. savings bond is a form ofzero-coupon bond.

This Page Intentionally Left Blank
Index
absorption accounting, 137–138accounting
defined, 6regulation of, 6–7
accounting rules, 8–9, 165–166accounts payable, 31, 45–46accounts receivable, 20, 22
aging, 86–87factoring, 35–36, 183–184financing, 183improving management of, 87–
88, 217issuing credit and, 20, 22, 48,
85–88, 106in profitability analysis, 106,
113–114as use of funds, 47–48
accumulated depreciation, 24–25,26–27
acid test ratio, 83–85acquisition analysis, 172–173adverse opinions, 65after-tax cash flow (ATCF), in
profitability analysis, 108, 110aggressiveness, overhead alloca-
tion and, 117–118aging of accounts receivable,
86–87
283
allowances, 21–22, 40American Institute of Certified
Public Accountants (AICPA), 7American Stock Exchange, 75amortization, 188, 194–195‘‘angel’’ investors, 191annual meetings, 62, 68annual report, 55–70
background portion, 56–57footnotes to financial state-
ments, 65–66letter to shareholders, 57–59management discussion and
analysis (MD&A), 59–62other important information in,
66–67other sources of information,
73–74report of independent accoun-
tants, 62–65annuity factor, 159Arthur Andersen, LLP, 63, 64assets, 18–31
accounts receivable, see ac-counts receivable
cash, 19current, 21–22, 82–83
284 Index
assets (continued)depreciation and, 24–25, 26–29,
94, 99fixed, 23–29, 47, 107–108gross book value of, 24, 26intangible, 23, 188, 194–195inventory, see inventoryinvestments, 23marketable securities, 19net book value of, 25return on, 96, 97–98, 105–115,
169–171total, 25
asset turnover, 109, 110–111auditors, see independent accoun-
tants
background of company, 56–57bad debt allowance, 21–22balance sheet, 15–37
assets on, 18–31defined, 5–6, 15expenses versus expenditures,
17–18, 25–31, 45liabilities on, 31–32, 34–37marketable securities on, 19,
35–37role of, 15–16stockholders’ equity on, 32–35
balance sheet equation, 34–35balloon payments, 188bank deposits, 153bank notes, 31, 45bankruptcy, subordinated deben-
tures in, 36base case, 166Bethlehem Steel, 68board of directors
in annual report, 66cash dividends and, 48election of, 33, 58performance of company and,
94
proxy statement and, 72shareholder activists and, 67–70
bonds, 188–189convertible, 36–37, 189–190junk, 190mortgage, 36, 189zero-coupon, 37
book valuegross, 24, 26net, 25
breakeven analysis, 129–148chart of accounts and, 131defined, 6fixed costs and, 131–132,
134–142of new business opportunity,
136–138of outsourcing opportunity,
138–141of price reduction, 136of sales volume, 135–136variable costs and, 132–133,
134–142variance analysis and, 130,
142–148budgets
accounting rules and, 8–9capital, see capital expendituresdefined, 8guidelines for, 203–205in planning process, 12, 203–
207, 214variance analysis and, 130,
142–148buildings, 23burden, 137–138business segments, see profit cen-
ters
callable loans, 35capital budget, see capital expen-
ditures
285Index
capital expenditures, 17–18,198–199
defined, 163as use of funds, 47see also return on investment
(ROI)cash, 19
in profitability analysis, 106revenue versus, 39–40
cash dividends, 33, 34, 42, 48–49cash equivalents, 19cash flow
after-tax (ATCF), 108, 110discounted (DCF), 152–161see also statement of cash flows
cash flow forecast, 164–167, 177,193
cash reconciliation, 49certificates of deposit (CDs), 19certified public accountants
(CPAs), 6, 62–65chart of accounts, 131cleanup period, 185collateral, 194collection period, 16commercial paper, 19common stock, 33–34, 192compensating balances, 187–188,
194compensation packages, 72competitor analysis, 217Conoco Oil Company, 58conservatism principle, 52–53consistency principle, 53consultative selling, 211contribution margin, 134–135convertible bonds, 36–37, 189–190Corporate Democracy, Inc., 69corporate overhead, 120corporate profit, 120cost of capital, 167–171cost of goods sold (COGS), 30–31,
40–41, 93
coupon, 189coupon rate, 36credit, 20, 22, 48, 85–88, 106credit analysts, 94, 190credit cards, 187current assets, 21–22, 82–83current liabilities, 31–32, 82–83
accounts payable, 31bank notes, 31, 45current portion of long-term
debt, 32, 48other, 31–32, 46
current ratio, 82–83, 85customers
annual report and, 58focus on, 216in planning process, 10
days’ sales outstanding, 16, 85–86debentures, 189
defined, 36subordinated, 36
debt/equity ratio, 100–104debt financing, 182–190
guidance on borrowing money,192–195
long-term debt, 182, 188–190short-term debt, 182–188
debt service, 101, 188, 192–193,194–195, 198–199
debt service coverage, 101decision-making, 8
see also return on investment(ROI)
depreciation, 26–29, 94, 99accumulated, 24–25, 26–27defined, 24–25double-declining balance,
27–28per-unit, 29straight-line, 27, 28sum-of-the-years’-digits, 28
286 Index
depreciation expense, 41, 45direct costs, overhead allocation
and, 119–120, 121–126direct labor, 20–21, 121–122
in variable-cost estimates, 133variance analysis of, 145–146
direct material, variance analysisof, 144–145, 146
discounted cash flow (DCF),152–161
defined, 152measures of, 154–161principles of, 152–154
discounts, 40, 98–99, 213disintermediation, 215–216distribution, variance analysis of,
147–148diversity
product, 91–92vendor, 92–93
divestiture, 58dividends
cash, 33, 34, 42, 48–49as use of funds, 48–49
double-declining balance depreci-ation, 27–28
DuPont formula, 105–115components of, 105–112development of, 105–106sales territories and, 112–115
DuPont Inc., 56–67, 73–74
earnings before interest, taxes anddepreciation, and amortiza-tion (EBITDA), 94, 95, 101,111
earnings before interest and taxes(EBIT), 102–104
economic forecasts, 167, 217–218economies of scale, 140–141,
147–148efficiency, 90, 107–108, 146,
147–148
80/20 rule, 214employees, 57, 58, 59equity financing, 190–192estimated useful life, 18expenditures
defined, 17–18, 25expenses versus, 17–18, 25–31,
45expenses
defined, 18, 25expenditures versus, 17–18, 25–
31, 45external financing, 166
factor, 156factoring, 35–36, 183–184factory overhead, 20–21, 146–147FASB Bulletins, 7, 51federal income taxes, 42, 94–95Federal Reserve System, 6, 218FIFO inventory accounting, 29–31,
116Financial Accounting Standards
Board (FASB), 6–7, 51financial analysis, 8–9, 138financial planning, 198–199financial ratios, 79–104
external users of, 81internal users of, 81leverage, 99–104liquidity, 82–85profitability measures, 93–99,
105–115, 149–178ratios, defined, 79statistical indicators versus,
79–80uses of, 16working capital management,
85–93financial strength, defined, 15–16financing strategy, 181–195
debt, 182–190, 192–195equity, 190–192
287Index
finished goods inventory, 20–21,90–91, 184
first-in, first-out (FIFO) account-ing, 29–31, 116
fiscal period principle, 51–52fixed assets, 23–24, 26–29
in profitability analysis, 107–108as use of funds, 47
fixed costsin breakeven analysis, 131–132,
134–142fixed-cost estimate, 132
floor planning, 184–185footnotes, 65–66forecasts
accounting rules and, 9in breakeven analysis, 137–138cash flow, 164, 177, 193characteristics of quality,
164–167defined, 8economic, 167, 217–218return on investment, 149–178sales, 9, 90, 174, 205
franchise names, 53full disclosure, 53–54full faith and credit, 36fully depreciated assets, 27functional cost analysis, 130
general and administrative ex-penses, 41, 93, 99, 147
generally accepted accountingprinciples (GAAP), 51–54, 65,71, 118, 122, 131, 138
conservatism, 52–53consistency, 53fiscal period, 51–52full disclosure, 53–54going concern concept, 52historical monetary unit, 52importance of, 7–8
matching principle, 18, 26–27materiality, 54quantifiable items or transac-
tions, 53Gilbert, John and Lewis, 67–70, 72global economy, 217–218going concern principle, 52gross book value, 24, 26gross margin, 40, 41, 95–96, 110gross margin percentage, 41gross profit, 40, 93, 95, 111, 112gross profit percentage, 95, 120,
123–124, 125
historical monetary unit principle,52
hurdle rate, 156, 167–171
income statement, 38–42cost of goods sold and, 40–41defined, 5expenses and, 41gross margin and, 41net income and, 42retained earnings and, 42revenue and, 38–40taxes and, 41–42
income taxes, 42, 94–95incrementality, 164, 165independent accountants, 62–65
audit process, 62–63letter to stockholders, 63–65
inflation, 215, 217–218initial public offering (IPO), 192insiders, 75intangible assets, 23, 188, 194–195interest coverage, 101–102, 103interest rate, 156, 193, 210, 218internal rate of return (IRR), 159–
161, 171–173Internal Revenue Service (IRS), 6,
116, 118
288 Index
inventory, 16, 22, 84defined, 20FIFO accounting, 29–31, 116LIFO accounting, 29–31, 116in profitability analysis, 106–
107, 114types of, 20–21as use of funds, 47
inventory financing, 184–185inventory turnover ratio, 16, 88–
93, 99investments, 23
defined, 149short-term, 19as source of funds, 46see also return on investment
(ROI)
junk bonds, 190
land, 23last-in, first-out (LIFO) account-
ing, 29–31, 116lead times, 90–91letter to shareholders
CEO, 57–59independent accountant, 63–65
leverage ratios, 99–104debt/equity, 100–104interest coverage, 101–102, 103return on equity, 102–104
liabilities, 31–32, 34–37current, 31–32, 45, 82long-term, 31, 32
LIFO inventory accounting, 29–31,116
lines of credit, 186–187liquidity, defined, 15liquidity ratios, 82–85
current ratio, 82–83, 85exceptions to comfortable lev-
els, 85quick ratio, 83–85
loan amortization, 188long-term debt, 36–37, 100–101,
102, 182, 188–190current portion, 32, 48as use of funds, 48
long-term liabilities, 31, 32lower of cost or market, 22, 23
machinery and equipment, 23–24made for stock, 90made to order, 90management discussion and anal-
ysis, 59–62manufacturing overhead, 20–21,
146–147marginal products, 118marketable securities
as assets, 19as liabilities, 35–37
marketing myopia, 217marketing planning, 198, 216–217markets, in planning process,
10–11matching principle, 18, 26–27material, in variable-cost esti-
mates, 132–133materiality principle, 54maturity, 32, 193–194Merck, 56, 62–64Moody’s, 190Morningstar Reports, 73, 75mortgage bonds, 36, 189
National Association of SecuritiesDealers (NASD), 75
net book value, 25net income, 42
reinvestment of, 34, 42, 97–98as source of funds, 44
net income before taxes, 41, 94, 95net present value (NPV), 158net worth, 34
289Index
new business/productsbreakeven analysis of, 136–138case study analysis, 173–178financial strategy for, 141–142overhead allocation and, 117profitability analysis of, 124–126
New York Stock Exchange, 75no opinions, 65
operations planning, 198, 206–207other current liabilities, 31–32, 46outlook, 61–62outsourcing, 109, 138–142, 207overhead
manufacturing, 20–21, 146–147in variable-cost estimates,
133–134overhead allocation, 116–126
based on direct costs, 119–120,121–126
based on revenue, 119, 120–126impact on profits, 118–126IRS and GAAP, 118problems of, 116–118
par, 189payback hierarchy, 162payback period, 161, 162per-unit depreciation, 29planning process, 8, 10–12,
196–207budgets in, 12, 203–207, 214customers in, 10elements of, 11–12guidelines and policies for,
201–203human tendencies in, 200–201importance of, 198markets in, 10–11requirements for effective plan-
ning, 199–200resistance in, 200–201
resources in, 11, 197S.W.O.T. analysis in, 196–197,
217types of planning, 198–199,
205–207political infighting, 116–118preferred stock, 33, 191–192present value, 37present value of cash inflows, 156price
competitive pricing, 210discounts and allowances, 40,
98–99, 213economic forecasts and, 167reduction in, breakeven analysis
of, 136value added versus, 213in variance analysis, 144
PricewaterhouseCoopers, LLP, 63product diversity, 91–92product mix, 123profit, see net incomeprofitability, 129–178
breakeven analysis and, 6,129–148
financial ratios and, 93–99, 105–115, 149–178
gross margin, 40, 41, 95–96, 110internal rate of return and,
159–161net present value and, 158overhead allocation and,
116–126payback period and, 161, 162profitability index and, 158–159statistical measures of, 79–80during tough times, 209–212
profitability index (PI), 158–159profit and loss statement, see in-
come statementprofit centers
defined, 105
290 Index
profit centers (continued)overhead allocation and, 11,
116–126planning process and, 199–200return on assets, 105–115segment reporting by, 59–61
proxy, 62, 71–72proxy statement, 62, 68, 69, 71–72Public Register Annual Report Ser-
vice, 73public relations, 58–59
qualified opinions, 65quantifiable items or transactions,
53quantity discounts, 98–99quick ratio, 83–85
raw materials inventory, 21, 84,91–93, 184
recession, 214–218reference point, 16regional exchanges, 75reinvestment, 34, 42, 97–98resources, in planning process, 11,
197restructuring, 212–214retained earnings, 34
cash dividends and, 42, 48–49change in, 42
return on assets (ROA), 96, 97–98,105–115, 169–171
return on equity (ROE), 96, 97,102–104
return on investment (ROI),149–178
capital expenditure defined, 163case study, 173–178cash flow forecast, 164–167discounted cash flow in,
152–161importance of, 150–152
investments to be analyzed, 149risk in, 151–152, 153, 161–163simulations of, 171–173target, 167–171
return on sales, 96, 98–99revenue, 20, 38–40
defined, 93overhead allocation and, 119,
120–126in profitability analysis, 108,
110, 112revolving credit, 35, 185risk
planning process and, 197return on investment and, 151–
152, 153, 161–163ROI hierarchy, 162, 163
safe harbor, 61safety stocks, 91sales
days’ sales outstanding, 16,85–86
forecasting, 9, 90, 174, 205return on, 96, 98–99revenue versus, 38–39
sales forecast, 9, 90, 174, 205sales planning, 198, 205–206sales territories, 112–115sales volume
breakeven analysis of, 135–136variance analysis of, 144
savings, overstatement of, 118secured lenders, 36Securities Act of 1933, 74Securities and Exchange Commis-
sion (SEC), 6, 56, 68, 69, 70,74–75, 116, 188, 192
Securities Exchange Act of 1934,74
security analysts, 57, 69–70, 94segment reporting, 59–61
291Index
self-regulated organizations(SROs), 75
senior debt, 190shareholder activists, 67–70, 72short-term debt, 35–36, 100,
182–188short-term investments, 19sources and uses of funds state-
ment, 16, see statement ofcash flows
sources of funds, 44–46standard cost system, 130Standard & Poor’s, 190statement of cash flows, 16, 43–50
format of, 49–50sources of funds, 44–46uses of funds, 47–49
Statement of Financial Account-ing Standards (SFAS), 60
statement of operations, see in-come statement
statistical indicators, 79–80stockholders
CEO letter to, 57–59independent accountant letter
to, 63–65stockholders’ equity, 32–35,
190–192common stock, 33–34, 192preferred stock, 33, 191–192retained earnings, 34venture capital, 191
straight-line depreciation, 27, 28strategic business units (SBUs),
see profit centersstrategic partnering, 210–211strategic planning, 198strike price, 37, 189–190subordinated debentures, 36subordinated debt, 190succession plans, 66sum-of-the-years’-digits, 28
supply chain, 92S.W.O.T. analysis, 196–197, 217
tangible assets, 23–24tender offers, 7510K report, 70–71term loans, 188territory management, 112–115three-shift operation, 107–108time value of money (TVOM), 154,
156tombstones, 75total assets, 25, 110, 114total asset turnover, 16total current liabilities, 32trademarks, 53Transamerica Insurance Com-
pany, 68, 69Treasury bills, 19turnover ratios
asset, 109, 110–111inventory, 16, 88–93, 99
unqualified opinions, 64uses of funds, 47–49
value added, 90–91, 107, 210, 213variable costs
in breakeven analysis, 132–133,134–142
variable-cost estimate, 132–134variance analysis, 130, 142–148vehicles, 24vendors
diversity of, 92–93floor planning and, 184–185
venture capital, 191vertical integration, 106–107, 109
Wall Street Journal, 73, 75Walt Disney Company, 56, 59, 61,
63warehouse locations, 91
292 Index
warehousing, 138–141working capital investment, 166–
167, 176working capital loans, 35, 182–188working capital management ra-
tios, 85–93aging of accounts receivable,
86–87days’ sales outstanding, 85–86
improving receivables manage-ment, 87–88
inventory turnover ratio, 16, 88–93, 99
work-in-process inventory, 21, 84writedown, 22, 23
zero-balance accounts, 35, 186zero-coupon bonds, 37