
Theatrical Market Statistics - WikiLeaks · theatrical market statistics 2010. ... remains a highly...
16
theatrical market statistics 2010
-
Upload
truongthuy -
Category
Documents
-
view
228 -
download
0
Transcript of Theatrical Market Statistics - WikiLeaks · theatrical market statistics 2010. ... remains a highly...
theatrical market statistics
2010
2
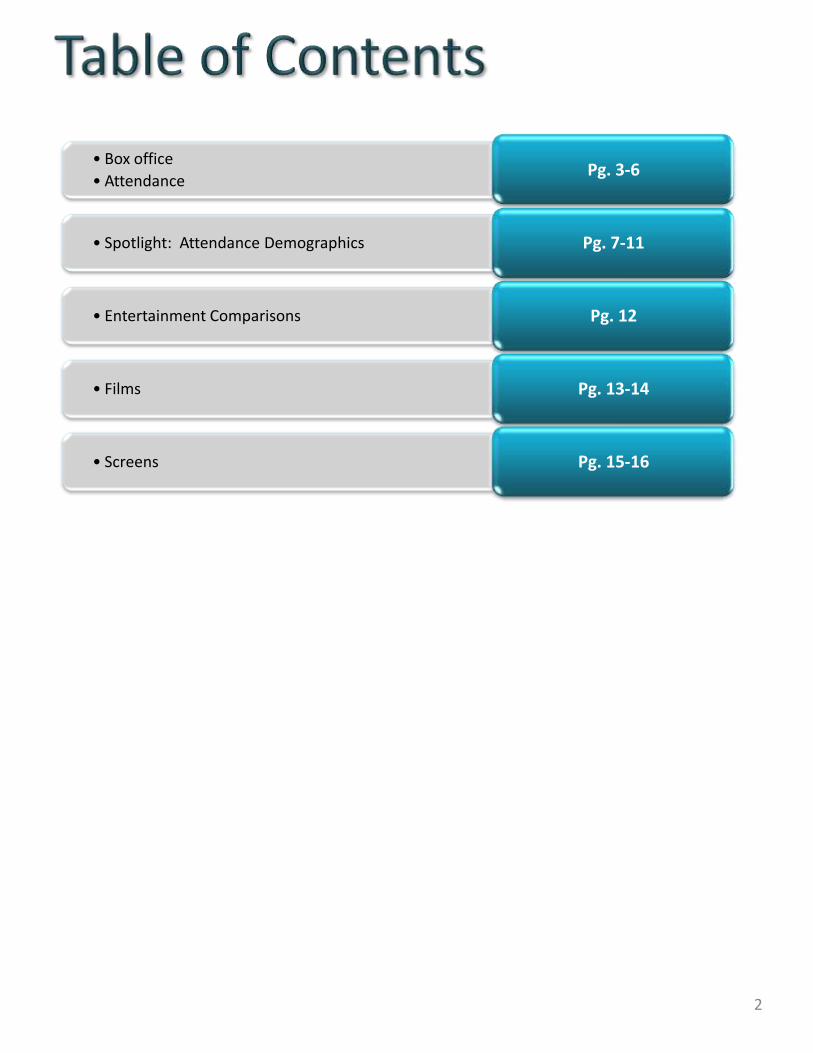
• Box office
• AttendancePg. 3-6
• Spotlight: Attendance Demographics Pg. 7-11
• Entertainment Comparisons Pg. 12
• Films Pg. 13-14
• Screens Pg. 15-16
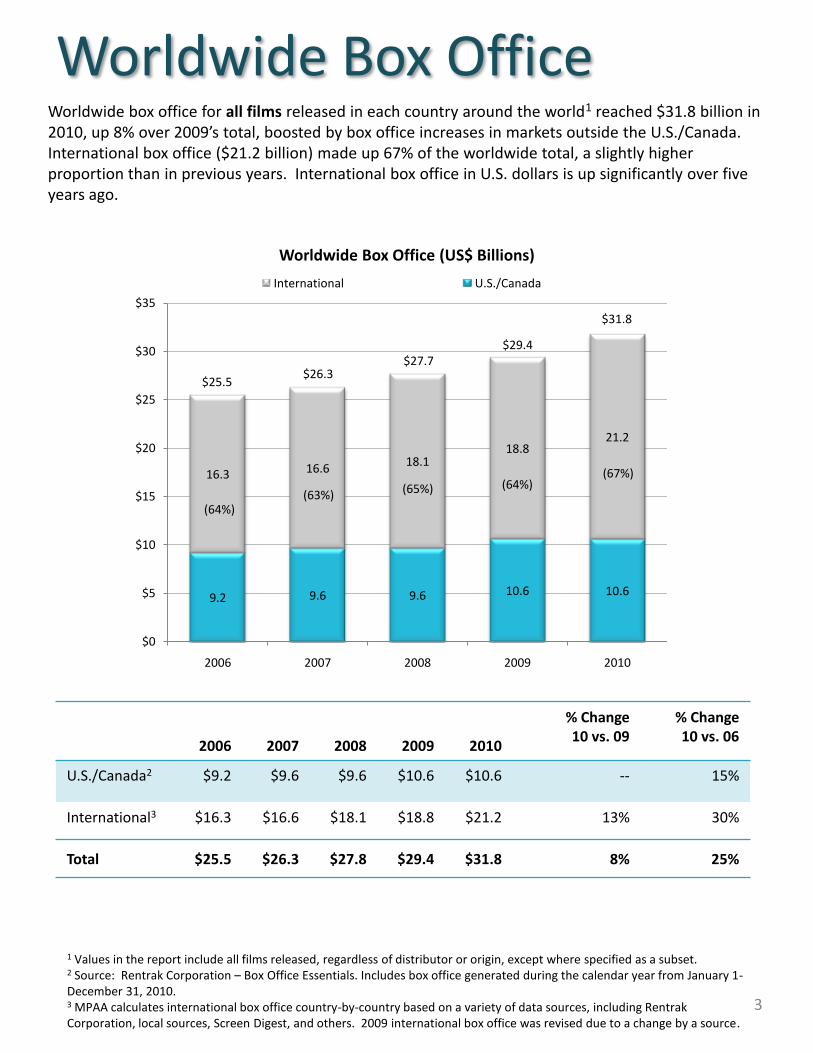
Worldwide box office for all films released in each country around the world1 reached $31.8 billion in 2010, up 8% over 2009’s total, boosted by box office increases in markets outside the U.S./Canada. International box office ($21.2 billion) made up 67% of the worldwide total, a slightly higher proportion than in previous years. International box office in U.S. dollars is up significantly over five years ago.
Worldwide Box Office
2006 2007 2008 2009 2010
% Change10 vs. 09
% Change 10 vs. 06
U.S./Canada2 $9.2 $9.6 $9.6 $10.6 $10.6 -- 15%
International3 $16.3 $16.6 $18.1 $18.8 $21.2 13% 30%
Total $25.5 $26.3 $27.8 $29.4 $31.8 8% 25%
Worldwide Box Office (US$ Billions)
3
1 Values in the report include all films released, regardless of distributor or origin, except where specified as a subset.2 Source: Rentrak Corporation – Box Office Essentials. Includes box office generated during the calendar year from January 1-December 31, 2010.3 MPAA calculates international box office country-by-country based on a variety of data sources, including Rentrak Corporation, local sources, Screen Digest, and others. 2009 international box office was revised due to a change by a source.
9.2 9.6 9.6 10.6 10.6
16.3 16.618.1
18.821.2
$0
$5
$10
$15
$20
$25
$30
$35
2006 2007 2008 2009 2010
International U.S./Canada
$25.5
$27.7$26.3
$31.8
$29.4
(63%) (65%)
(64%)
(67%)(64%)
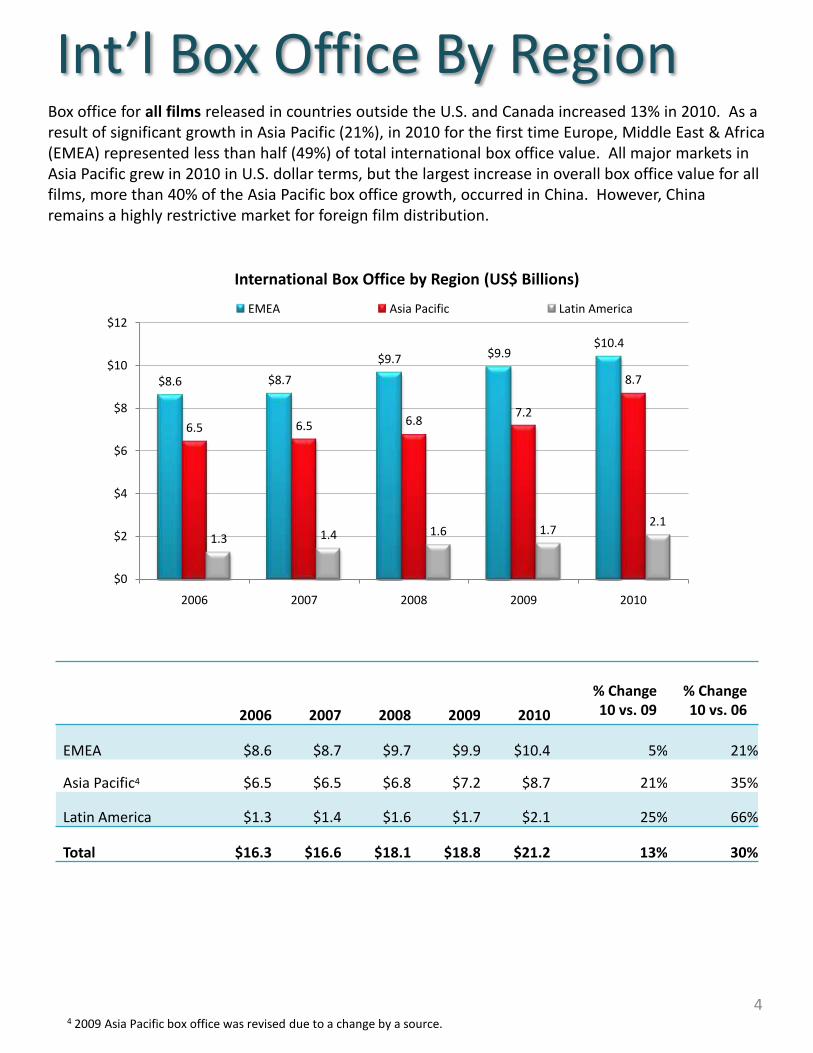
Box office for all films released in countries outside the U.S. and Canada increased 13% in 2010. As a result of significant growth in Asia Pacific (21%), in 2010 for the first time Europe, Middle East & Africa (EMEA) represented less than half (49%) of total international box office value. All major markets in Asia Pacific grew in 2010 in U.S. dollar terms, but the largest increase in overall box office value for all films, more than 40% of the Asia Pacific box office growth, occurred in China. However, China remains a highly restrictive market for foreign film distribution.
Int’l Box Office By Region
International Box Office by Region (US$ Billions)
2006 2007 2008 2009 2010
% Change10 vs. 09
% Change 10 vs. 06
EMEA $8.6 $8.7 $9.7 $9.9 $10.4 5% 21%
Asia Pacific4 $6.5 $6.5 $6.8 $7.2 $8.7 21% 35%
Latin America $1.3 $1.4 $1.6 $1.7 $2.1 25% 66%
Total $16.3 $16.6 $18.1 $18.8 $21.2 13% 30%
44 2009 Asia Pacific box office was revised due to a change by a source.
$8.6 $8.7
$9.7 $9.9$10.4
6.5 6.5 6.87.2
8.7
1.3 1.4 1.6 1.72.1
$0
$2
$4
$6
$8
$10
$12
2006 2007 2008 2009 2010
EMEA Asia Pacific Latin America
Spotlight: U.S./Canada 3D Box Office (US$ Billions) and 3D Film Releases5
$-
$2
$4
$6
$8
$10
$12
2006 2007 2008 2009 2010
3D box office 2D box office
1% 2% 11% 21%
$9.2$9.6 $9.6 $10.6 $10.6
1%
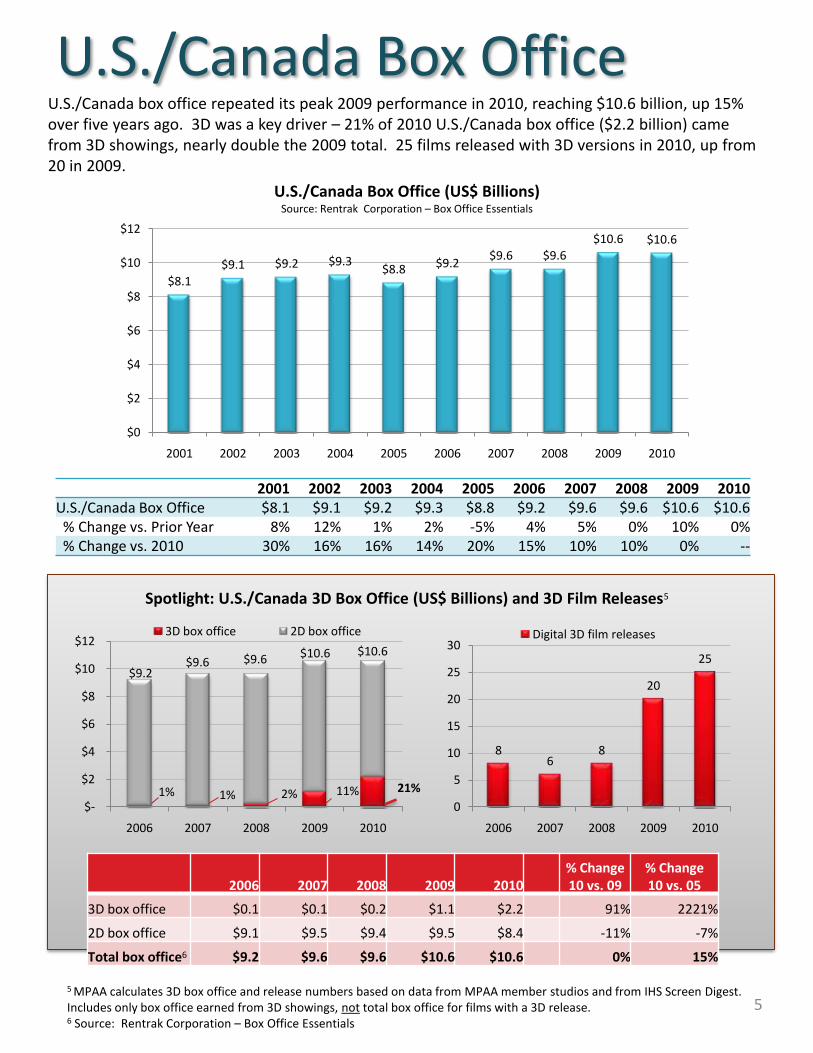
U.S./Canada box office repeated its peak 2009 performance in 2010, reaching $10.6 billion, up 15% over five years ago. 3D was a key driver – 21% of 2010 U.S./Canada box office ($2.2 billion) came from 3D showings, nearly double the 2009 total. 25 films released with 3D versions in 2010, up from 20 in 2009.
U.S./Canada Box Office
U.S./Canada Box Office (US$ Billions) Source: Rentrak Corporation – Box Office Essentials
2001 2002 2003 2004 2005 2006 2007 2008 2009 2010U.S./Canada Box Office $8.1 $9.1 $9.2 $9.3 $8.8 $9.2 $9.6 $9.6 $10.6 $10.6% Change vs. Prior Year 8% 12% 1% 2% -5% 4% 5% 0% 10% 0%% Change vs. 2010 30% 16% 16% 14% 20% 15% 10% 10% 0% --
2006 2007 2008 2009 2010% Change 10 vs. 09
% Change 10 vs. 05
3D box office $0.1 $0.1 $0.2 $1.1 $2.2 91% 2221%
2D box office $9.1 $9.5 $9.4 $9.5 $8.4 -11% -7%
Total box office6 $9.2 $9.6 $9.6 $10.6 $10.6 0% 15%
5
$8.1
$9.1 $9.2 $9.3$8.8 $9.2
$9.6 $9.6$10.6 $10.6
$0
$2
$4
$6
$8
$10
$12
2001 2002 2003 2004 2005 2006 2007 2008 2009 2010
5 MPAA calculates 3D box office and release numbers based on data from MPAA member studios and from IHS Screen Digest. Includes only box office earned from 3D showings, not total box office for films with a 3D release.6 Source: Rentrak Corporation – Box Office Essentials
86
8
20
25
0
5
10
15
20
25
30
2006 2007 2008 2009 2010
Digital 3D film releases
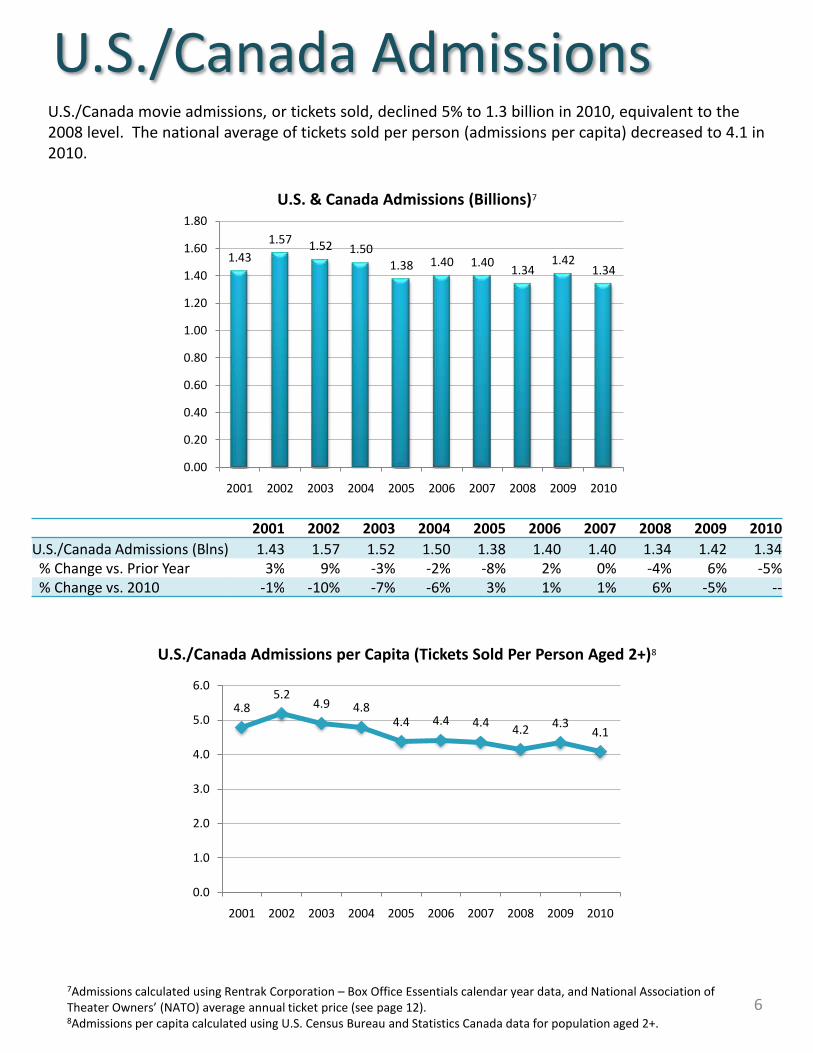
U.S./Canada movie admissions, or tickets sold, declined 5% to 1.3 billion in 2010, equivalent to the 2008 level. The national average of tickets sold per person (admissions per capita) decreased to 4.1 in 2010.
U.S./Canada Admissions
U.S. & Canada Admissions (Billions)7
U.S./Canada Admissions per Capita (Tickets Sold Per Person Aged 2+)8
6
2001 2002 2003 2004 2005 2006 2007 2008 2009 2010
U.S./Canada Admissions (Blns) 1.43 1.57 1.52 1.50 1.38 1.40 1.40 1.34 1.42 1.34% Change vs. Prior Year 3% 9% -3% -2% -8% 2% 0% -4% 6% -5%% Change vs. 2010 -1% -10% -7% -6% 3% 1% 1% 6% -5% --
1.43
1.57 1.52 1.501.38 1.40 1.40
1.341.42
1.34
0.00
0.20
0.40
0.60
0.80
1.00
1.20
1.40
1.60
1.80
2001 2002 2003 2004 2005 2006 2007 2008 2009 2010
4.85.2
4.9 4.84.4 4.4 4.4
4.24.3
4.1
0.0
1.0
2.0
3.0
4.0
5.0
6.0
2001 2002 2003 2004 2005 2006 2007 2008 2009 2010
7Admissions calculated using Rentrak Corporation – Box Office Essentials calendar year data, and National Association of Theater Owners’ (NATO) average annual ticket price (see page 12). 8Admissions per capita calculated using U.S. Census Bureau and Statistics Canada data for population aged 2+.
32%
2%
10%
47%
47%
51%
11%
0% 20% 40% 60% 80% 100%
Tickets sold
Population
Non-moviegoers Infrequent moviegoers Occasional moviegoers Frequent moviegoers
Spotlight: Attendance Demographics
2010 Demographic Summary9
U.S./Canada Moviegoer Proportion of Population and Tickets Sold
7
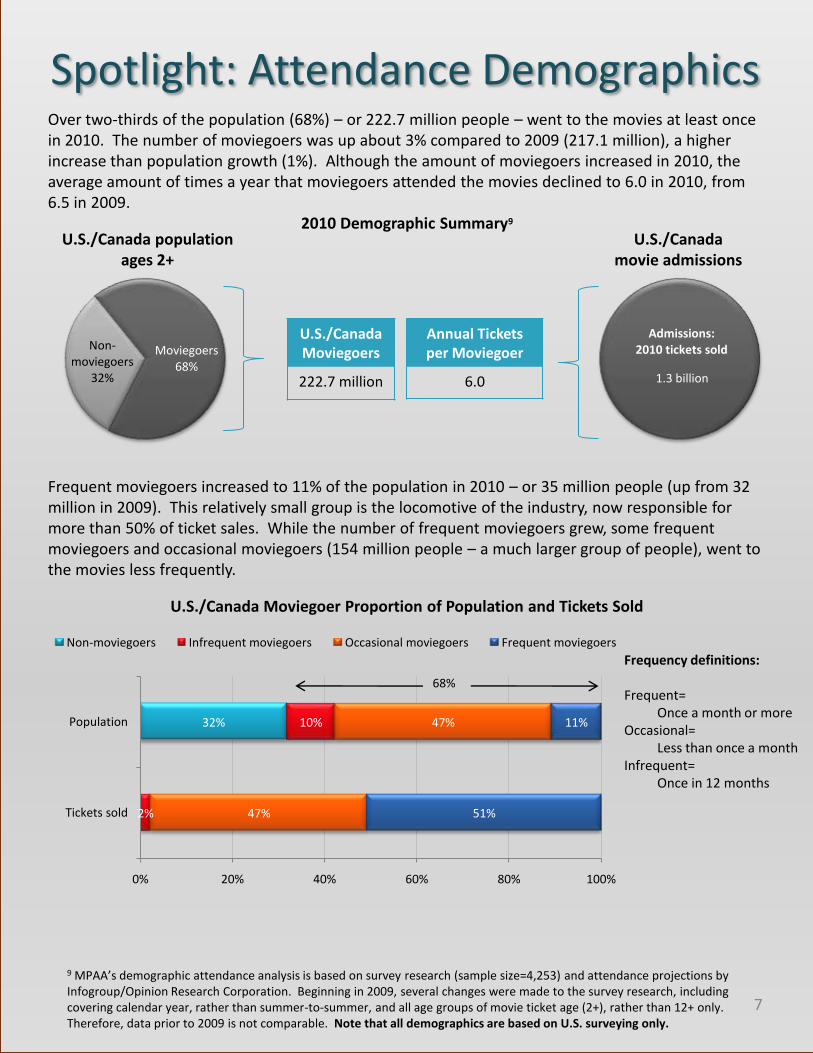
Over two-thirds of the population (68%) – or 222.7 million people – went to the movies at least once in 2010. The number of moviegoers was up about 3% compared to 2009 (217.1 million), a higher increase than population growth (1%). Although the amount of moviegoers increased in 2010, the average amount of times a year that moviegoers attended the movies declined to 6.0 in 2010, from 6.5 in 2009.
9 MPAA’s demographic attendance analysis is based on survey research (sample size=4,253) and attendance projections by Infogroup/Opinion Research Corporation. Beginning in 2009, several changes were made to the survey research, including covering calendar year, rather than summer-to-summer, and all age groups of movie ticket age (2+), rather than 12+ only. Therefore, data prior to 2009 is not comparable. Note that all demographics are based on U.S. surveying only.
U.S./Canada populationages 2+
U.S./CanadaMoviegoers
222.7 million
Annual Tickets per Moviegoer
6.0
U.S./Canada movie admissions
68%
Frequency definitions:
Frequent=Once a month or more
Occasional=Less than once a month
Infrequent=Once in 12 months
Frequent moviegoers increased to 11% of the population in 2010 – or 35 million people (up from 32 million in 2009). This relatively small group is the locomotive of the industry, now responsible for more than 50% of ticket sales. While the number of frequent moviegoers grew, some frequent moviegoers and occasional moviegoers (154 million people – a much larger group of people), went to the movies less frequently.
Moviegoers68%
Non-moviegoers
32% 1.3 billion
Admissions:2010 tickets sold
Spotlight: Frequent Moviegoers
8
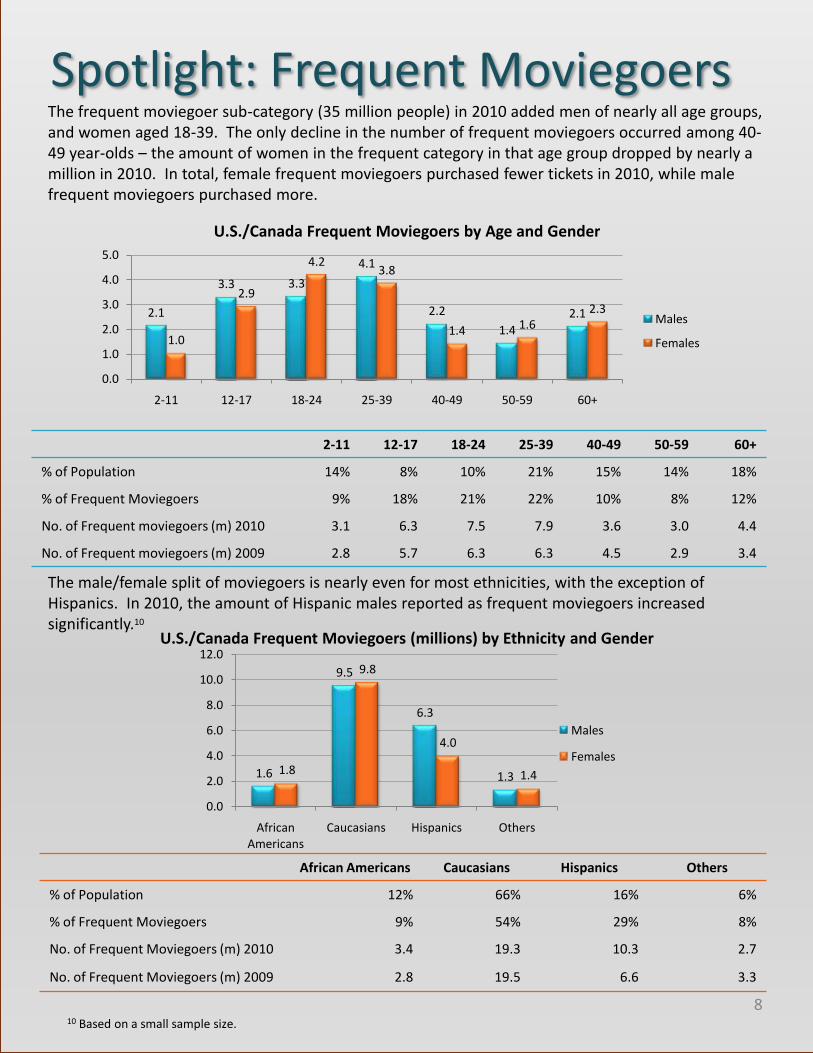
The frequent moviegoer sub-category (35 million people) in 2010 added men of nearly all age groups, and women aged 18-39. The only decline in the number of frequent moviegoers occurred among 40-49 year-olds – the amount of women in the frequent category in that age group dropped by nearly a million in 2010. In total, female frequent moviegoers purchased fewer tickets in 2010, while male frequent moviegoers purchased more.
U.S./Canada Frequent Moviegoers by Age and Gender
2-11 12-17 18-24 25-39 40-49 50-59 60+
% of Population 14% 8% 10% 21% 15% 14% 18%
% of Frequent Moviegoers 9% 18% 21% 22% 10% 8% 12%
No. of Frequent moviegoers (m) 2010 3.1 6.3 7.5 7.9 3.6 3.0 4.4
No. of Frequent moviegoers (m) 2009 2.8 5.7 6.3 6.3 4.5 2.9 3.4
U.S./Canada Frequent Moviegoers (millions) by Ethnicity and Gender
African Americans Caucasians Hispanics Others
% of Population 12% 66% 16% 6%
% of Frequent Moviegoers 9% 54% 29% 8%
No. of Frequent Moviegoers (m) 2010 3.4 19.3 10.3 2.7
No. of Frequent Moviegoers (m) 2009 2.8 19.5 6.6 3.3
The male/female split of moviegoers is nearly even for most ethnicities, with the exception of Hispanics. In 2010, the amount of Hispanic males reported as frequent moviegoers increased significantly.10
10 Based on a small sample size.
1.6
9.5
6.3
1.31.8
9.8
4.0
1.4
0.0
2.0
4.0
6.0
8.0
10.0
12.0
African Americans
Caucasians Hispanics Others
Males
Females
2.1
3.3 3.3
4.1
2.2
1.4
2.1
1.0
2.9
4.23.8
1.4 1.62.3
0.0
1.0
2.0
3.0
4.0
5.0
2-11 12-17 18-24 25-39 40-49 50-59 60+
Males
Females
Spotlight: Attendance Demographics
9
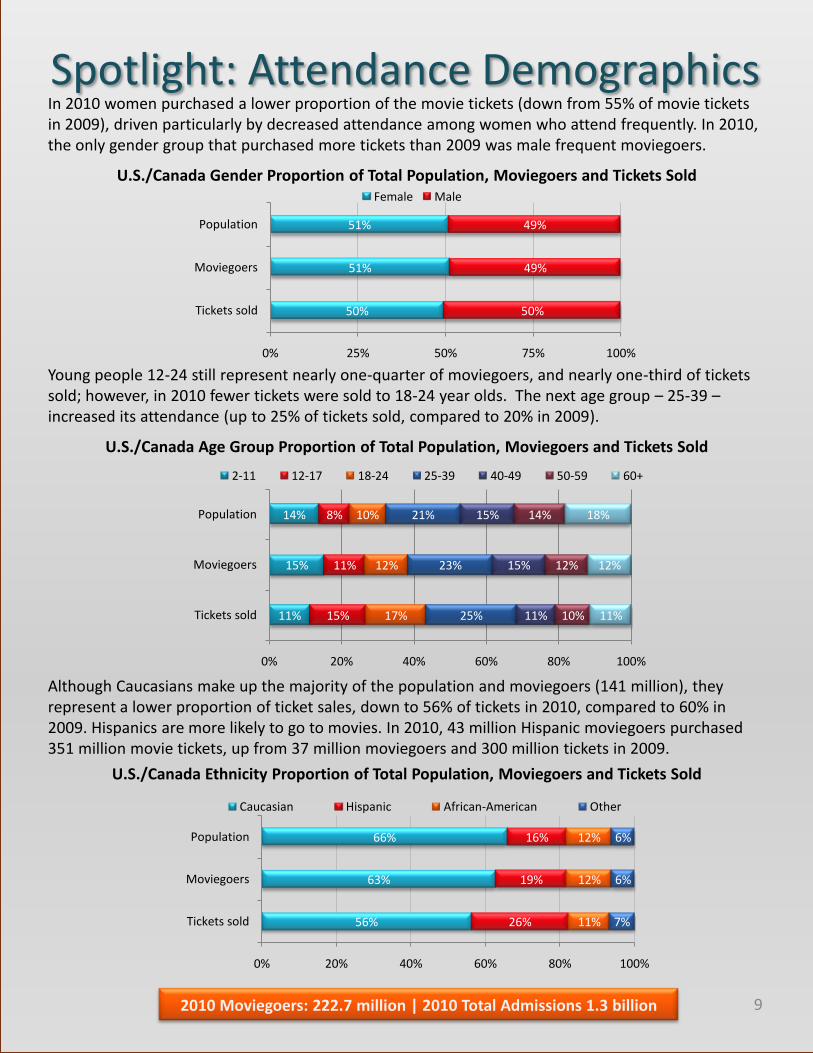
In 2010 women purchased a lower proportion of the movie tickets (down from 55% of movie tickets in 2009), driven particularly by decreased attendance among women who attend frequently. In 2010, the only gender group that purchased more tickets than 2009 was male frequent moviegoers.
U.S./Canada Gender Proportion of Total Population, Moviegoers and Tickets Sold
U.S./Canada Age Group Proportion of Total Population, Moviegoers and Tickets Sold
U.S./Canada Ethnicity Proportion of Total Population, Moviegoers and Tickets Sold
2010 Moviegoers: 222.7 million | 2010 Total Admissions 1.3 billion
Young people 12-24 still represent nearly one-quarter of moviegoers, and nearly one-third of tickets sold; however, in 2010 fewer tickets were sold to 18-24 year olds. The next age group – 25-39 –increased its attendance (up to 25% of tickets sold, compared to 20% in 2009).
Although Caucasians make up the majority of the population and moviegoers (141 million), they represent a lower proportion of ticket sales, down to 56% of tickets in 2010, compared to 60% in 2009. Hispanics are more likely to go to movies. In 2010, 43 million Hispanic moviegoers purchased 351 million movie tickets, up from 37 million moviegoers and 300 million tickets in 2009.
50%
51%
51%
50%
49%
49%
0% 25% 50% 75% 100%
Tickets sold
Moviegoers
Population
Female Male
11%
15%
14%
15%
11%
8%
17%
12%
10%
25%
23%
21%
11%
15%
15%
10%
12%
14%
11%
12%
18%
0% 20% 40% 60% 80% 100%
Tickets sold
Moviegoers
Population
2-11 12-17 18-24 25-39 40-49 50-59 60+
56%
63%
66%
26%
19%
16%
11%
12%
12%
7%
6%
6%
0% 20% 40% 60% 80% 100%
Tickets sold
Moviegoers
Population
Caucasian Hispanic African-American Other
Spotlight: Attendance Demographics
10
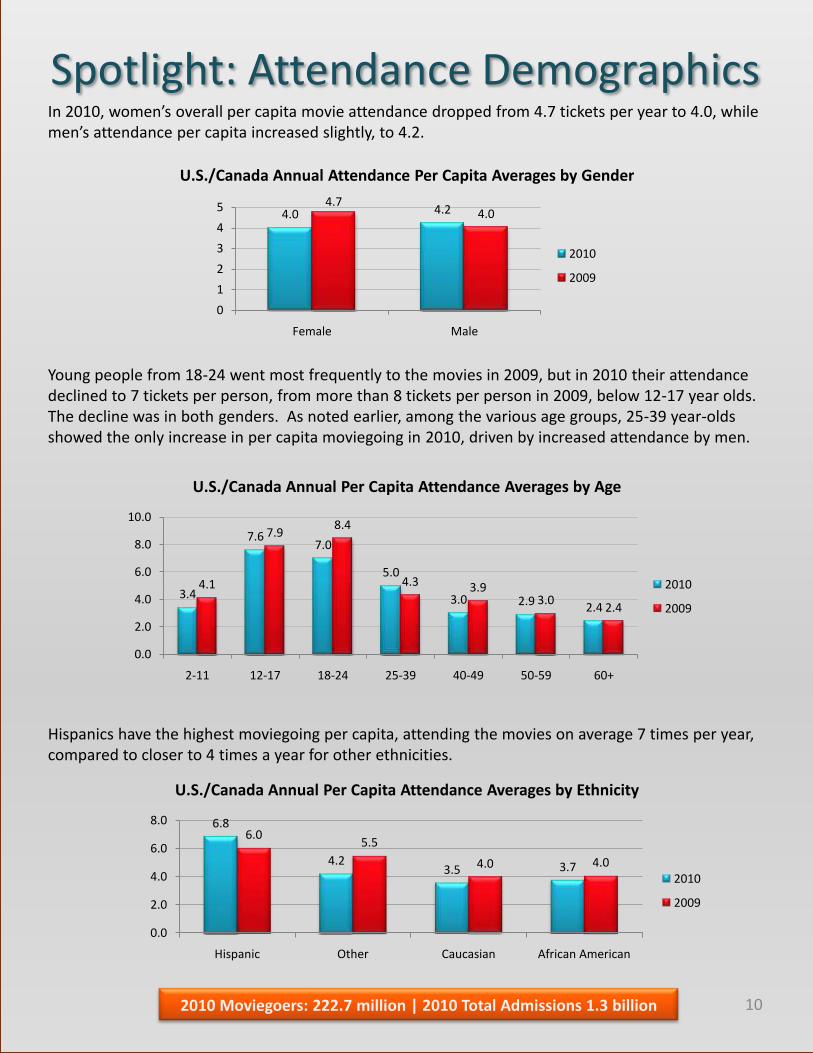
In 2010, women’s overall per capita movie attendance dropped from 4.7 tickets per year to 4.0, while men’s attendance per capita increased slightly, to 4.2.
U.S./Canada Annual Attendance Per Capita Averages by Gender
U.S./Canada Annual Per Capita Attendance Averages by Age
U.S./Canada Annual Per Capita Attendance Averages by Ethnicity
Young people from 18-24 went most frequently to the movies in 2009, but in 2010 their attendance declined to 7 tickets per person, from more than 8 tickets per person in 2009, below 12-17 year olds. The decline was in both genders. As noted earlier, among the various age groups, 25-39 year-olds showed the only increase in per capita moviegoing in 2010, driven by increased attendance by men.
Hispanics have the highest moviegoing per capita, attending the movies on average 7 times per year, compared to closer to 4 times a year for other ethnicities.
2010 Moviegoers: 222.7 million | 2010 Total Admissions 1.3 billion
4.0 4.24.7
4.0
0
1
2
3
4
5
Female Male
2010
2009
6.8
4.23.5 3.7
6.05.5
4.0 4.0
0.0
2.0
4.0
6.0
8.0
Hispanic Other Caucasian African American
2010
2009
3.4
7.67.0
5.0
3.0 2.9 2.4
4.1
7.98.4
4.3 3.93.0
2.4
0.0
2.0
4.0
6.0
8.0
10.0
2-11 12-17 18-24 25-39 40-49 50-59 60+
2010
2009
Spotlight: 3D Attendance
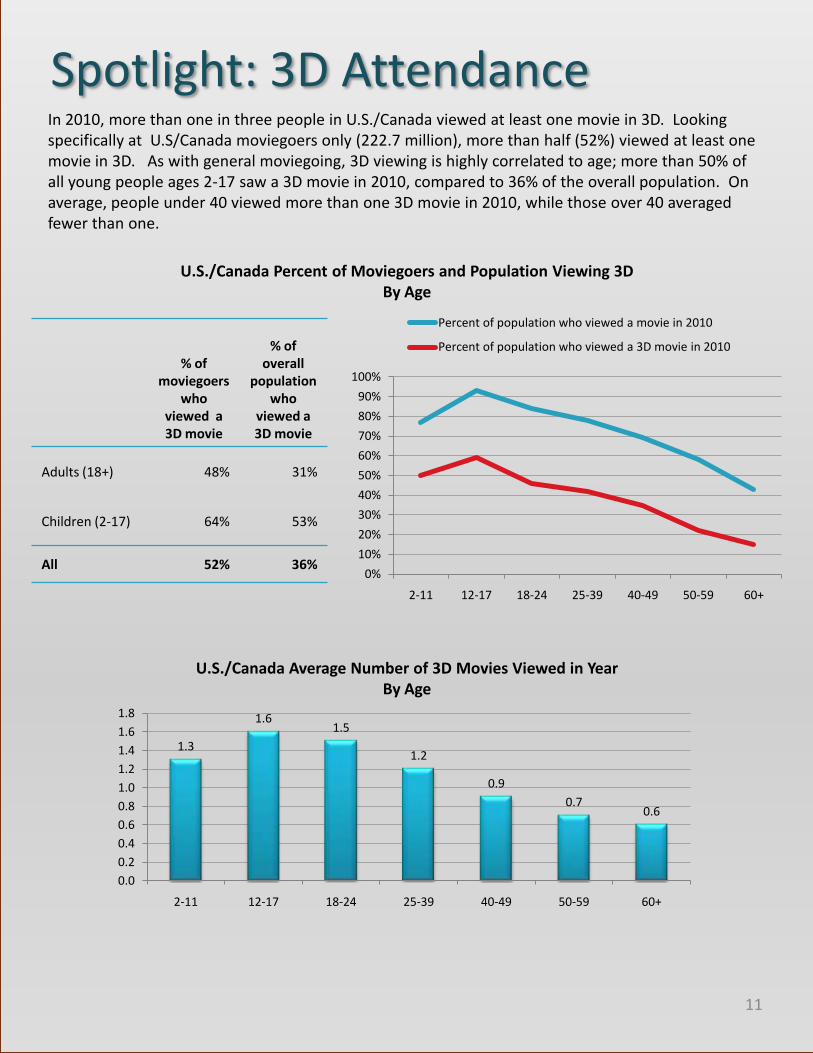
U.S./Canada Percent of Moviegoers and Population Viewing 3DBy Age
11
In 2010, more than one in three people in U.S./Canada viewed at least one movie in 3D. Looking specifically at U.S/Canada moviegoers only (222.7 million), more than half (52%) viewed at least one movie in 3D. As with general moviegoing, 3D viewing is highly correlated to age; more than 50% of all young people ages 2-17 saw a 3D movie in 2010, compared to 36% of the overall population. On average, people under 40 viewed more than one 3D movie in 2010, while those over 40 averaged fewer than one.
0%
10%
20%
30%
40%
50%
60%
70%
80%
90%
100%
2-11 12-17 18-24 25-39 40-49 50-59 60+
Percent of population who viewed a movie in 2010
Percent of population who viewed a 3D movie in 2010
% of moviegoers
who viewed a 3D movie
% of overall
population who
viewed a 3D movie
Adults (18+) 48% 31%
Children (2-17) 64% 53%
All 52% 36%
U.S./Canada Average Number of 3D Movies Viewed in YearBy Age
1.3
1.61.5
1.2
0.9
0.70.6
0.0
0.2
0.4
0.6
0.8
1.0
1.2
1.4
1.6
1.8
2-11 12-17 18-24 25-39 40-49 50-59 60+
MLB, 73.1
NBA, 21.1
NHL, 20.9
NFL, 17.0
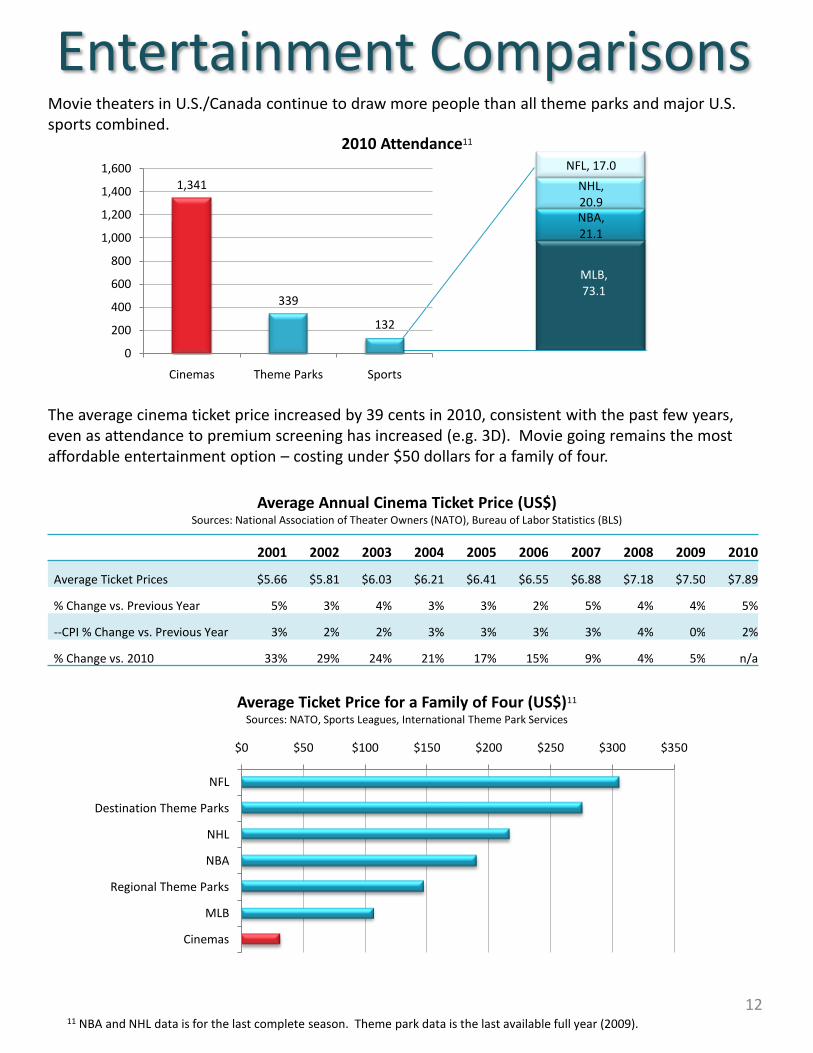
The average cinema ticket price increased by 39 cents in 2010, consistent with the past few years, even as attendance to premium screening has increased (e.g. 3D). Movie going remains the most affordable entertainment option – costing under $50 dollars for a family of four.
Entertainment Comparisons
2001 2002 2003 2004 2005 2006 2007 2008 2009 2010
Average Ticket Prices $5.66 $5.81 $6.03 $6.21 $6.41 $6.55 $6.88 $7.18 $7.50 $7.89
% Change vs. Previous Year 5% 3% 4% 3% 3% 2% 5% 4% 4% 5%
--CPI % Change vs. Previous Year 3% 2% 2% 3% 3% 3% 3% 4% 0% 2%
% Change vs. 2010 33% 29% 24% 21% 17% 15% 9% 4% 5% n/a
2010 Attendance11
Average Annual Cinema Ticket Price (US$)Sources: National Association of Theater Owners (NATO), Bureau of Labor Statistics (BLS)
12
Movie theaters in U.S./Canada continue to draw more people than all theme parks and major U.S. sports combined.
Average Ticket Price for a Family of Four (US$)11
Sources: NATO, Sports Leagues, International Theme Park Services
11 NBA and NHL data is for the last complete season. Theme park data is the last available full year (2009).
1,341
339
132
0
200
400
600
800
1,000
1,200
1,400
1,600
Cinemas Theme Parks Sports
$0 $50 $100 $150 $200 $250 $300 $350
NFL
Destination Theme Parks
NHL
NBA
Regional Theme Parks
MLB
Cinemas
Detail: Films Released Sources: Rentrak Corporation, MPAA
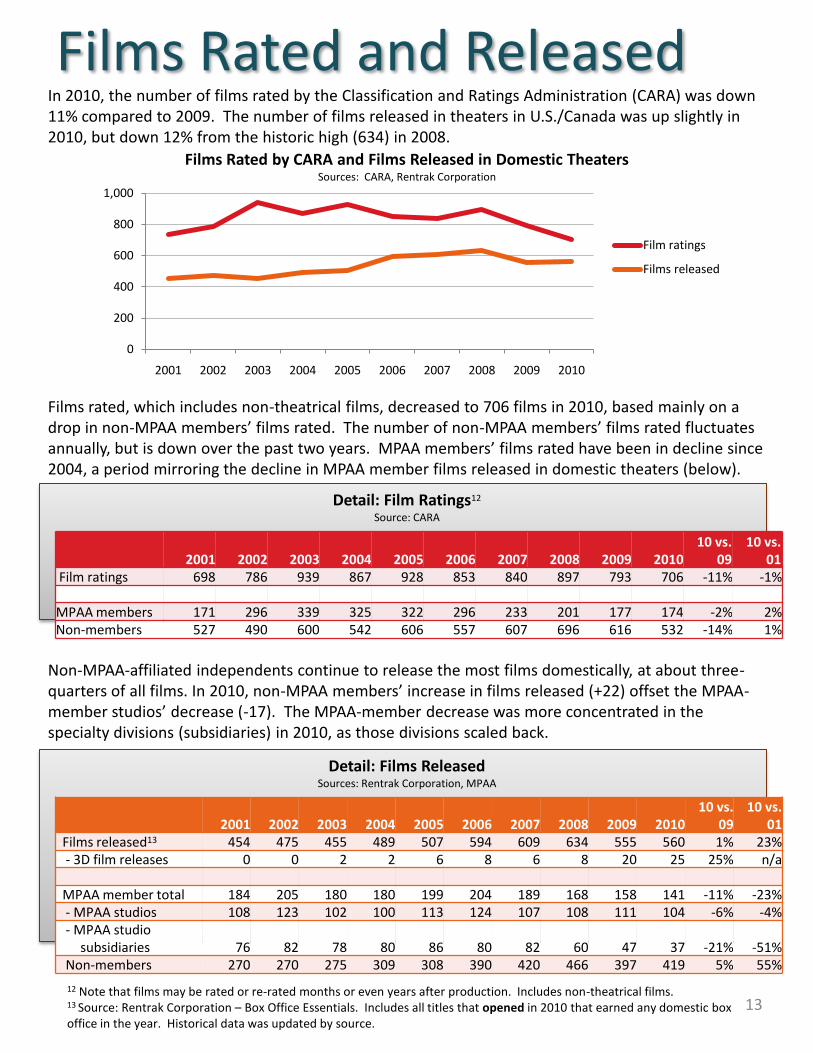
In 2010, the number of films rated by the Classification and Ratings Administration (CARA) was down 11% compared to 2009. The number of films released in theaters in U.S./Canada was up slightly in 2010, but down 12% from the historic high (634) in 2008.
2001 2002 2003 2004 2005 2006 2007 2008 2009 201010 vs.
0910 vs.
01Films released13 454 475 455 489 507 594 609 634 555 560 1% 23%- 3D film releases 0 0 2 2 6 8 6 8 20 25 25% n/a
MPAA member total 184 205 180 180 199 204 189 168 158 141 -11% -23%- MPAA studios 108 123 102 100 113 124 107 108 111 104 -6% -4%- MPAA studio
subsidiaries 76 82 78 80 86 80 82 60 47 37 -21% -51%Non-members 270 270 275 309 308 390 420 466 397 419 5% 55%
13
Films Rated by CARA and Films Released in Domestic TheatersSources: CARA, Rentrak Corporation
12 Note that films may be rated or re-rated months or even years after production. Includes non-theatrical films.13 Source: Rentrak Corporation – Box Office Essentials. Includes all titles that opened in 2010 that earned any domestic box office in the year. Historical data was updated by source.
Non-MPAA-affiliated independents continue to release the most films domestically, at about three-quarters of all films. In 2010, non-MPAA members’ increase in films released (+22) offset the MPAA-member studios’ decrease (-17). The MPAA-member decrease was more concentrated in the specialty divisions (subsidiaries) in 2010, as those divisions scaled back.
Detail: Film Ratings12
Source: CARA
Films rated, which includes non-theatrical films, decreased to 706 films in 2010, based mainly on a drop in non-MPAA members’ films rated. The number of non-MPAA members’ films rated fluctuates annually, but is down over the past two years. MPAA members’ films rated have been in decline since 2004, a period mirroring the decline in MPAA member films released in domestic theaters (below).
2001 2002 2003 2004 2005 2006 2007 2008 2009 201010 vs.
0910 vs.
01Film ratings 698 786 939 867 928 853 840 897 793 706 -11% -1%
MPAA members 171 296 339 325 322 296 233 201 177 174 -2% 2%Non-members 527 490 600 542 606 557 607 696 616 532 -14% 1%
Films Rated and Released
0
200
400
600
800
1,000
2001 2002 2003 2004 2005 2006 2007 2008 2009 2010
Film ratings
Films released
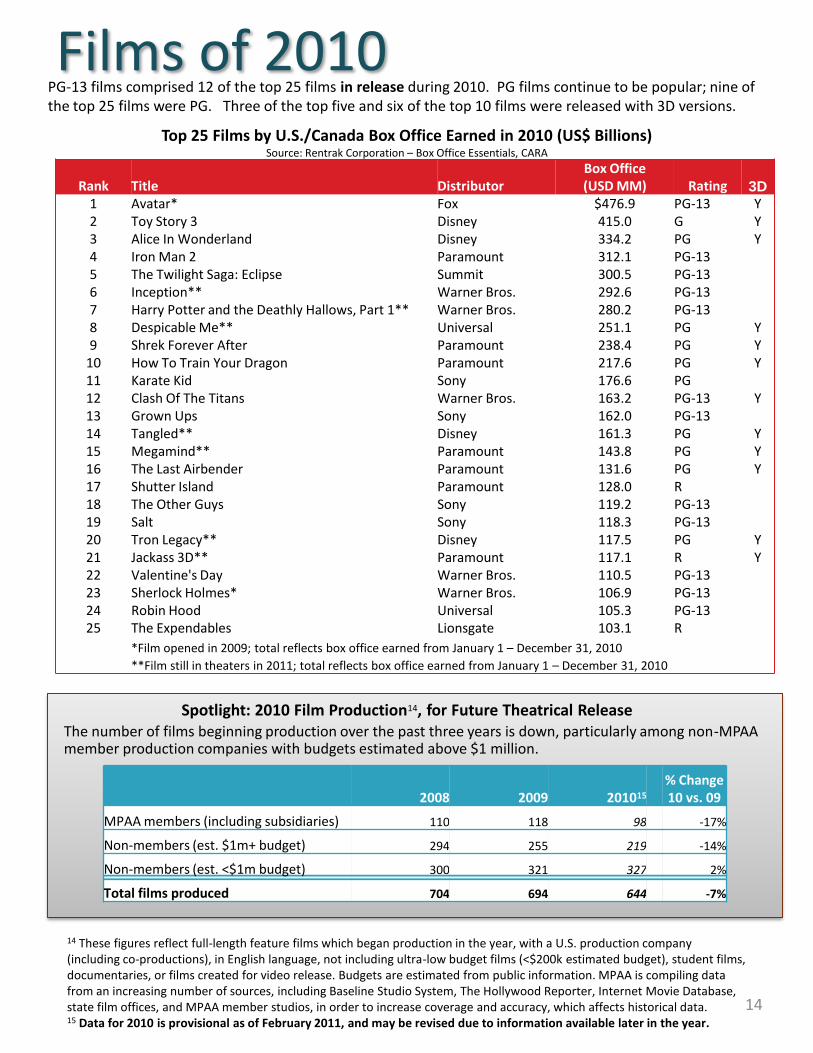
PG-13 films comprised 12 of the top 25 films in release during 2010. PG films continue to be popular; nine of the top 25 films were PG. Three of the top five and six of the top 10 films were released with 3D versions.
Films of 2010Top 25 Films by U.S./Canada Box Office Earned in 2010 (US$ Billions)
Source: Rentrak Corporation – Box Office Essentials, CARA
Rank Title DistributorBox Office (USD MM) Rating 3D
1 Avatar* Fox $476.9 PG-13 Y2 Toy Story 3 Disney 415.0 G Y3 Alice In Wonderland Disney 334.2 PG Y4 Iron Man 2 Paramount 312.1 PG-135 The Twilight Saga: Eclipse Summit 300.5 PG-136 Inception** Warner Bros. 292.6 PG-137 Harry Potter and the Deathly Hallows, Part 1** Warner Bros. 280.2 PG-138 Despicable Me** Universal 251.1 PG Y9 Shrek Forever After Paramount 238.4 PG Y
10 How To Train Your Dragon Paramount 217.6 PG Y11 Karate Kid Sony 176.6 PG12 Clash Of The Titans Warner Bros. 163.2 PG-13 Y13 Grown Ups Sony 162.0 PG-1314 Tangled** Disney 161.3 PG Y15 Megamind** Paramount 143.8 PG Y16 The Last Airbender Paramount 131.6 PG Y17 Shutter Island Paramount 128.0 R18 The Other Guys Sony 119.2 PG-1319 Salt Sony 118.3 PG-1320 Tron Legacy** Disney 117.5 PG Y21 Jackass 3D** Paramount 117.1 R Y22 Valentine's Day Warner Bros. 110.5 PG-1323 Sherlock Holmes* Warner Bros. 106.9 PG-1324 Robin Hood Universal 105.3 PG-1325 The Expendables Lionsgate 103.1 R
*Film opened in 2009; total reflects box office earned from January 1 – December 31, 2010
**Film still in theaters in 2011; total reflects box office earned from January 1 – December 31, 2010
14
Spotlight: 2010 Film Production14, for Future Theatrical Release
2008 2009 201015
% Change 10 vs. 09
MPAA members (including subsidiaries) 110 118 98 -17%
Non-members (est. $1m+ budget) 294 255 219 -14%
Non-members (est. <$1m budget) 300 321 327 2%
Total films produced 704 694 644 -7%
The number of films beginning production over the past three years is down, particularly among non-MPAA member production companies with budgets estimated above $1 million.
14 These figures reflect full-length feature films which began production in the year, with a U.S. production company (including co-productions), in English language, not including ultra-low budget films (<$200k estimated budget), student films, documentaries, or films created for video release. Budgets are estimated from public information. MPAA is compiling data from an increasing number of sources, including Baseline Studio System, The Hollywood Reporter, Internet Movie Database, state film offices, and MPAA member studios, in order to increase coverage and accuracy, which affects historical data. 15 Data for 2010 is provisional as of February 2011, and may be revised due to information available later in the year.
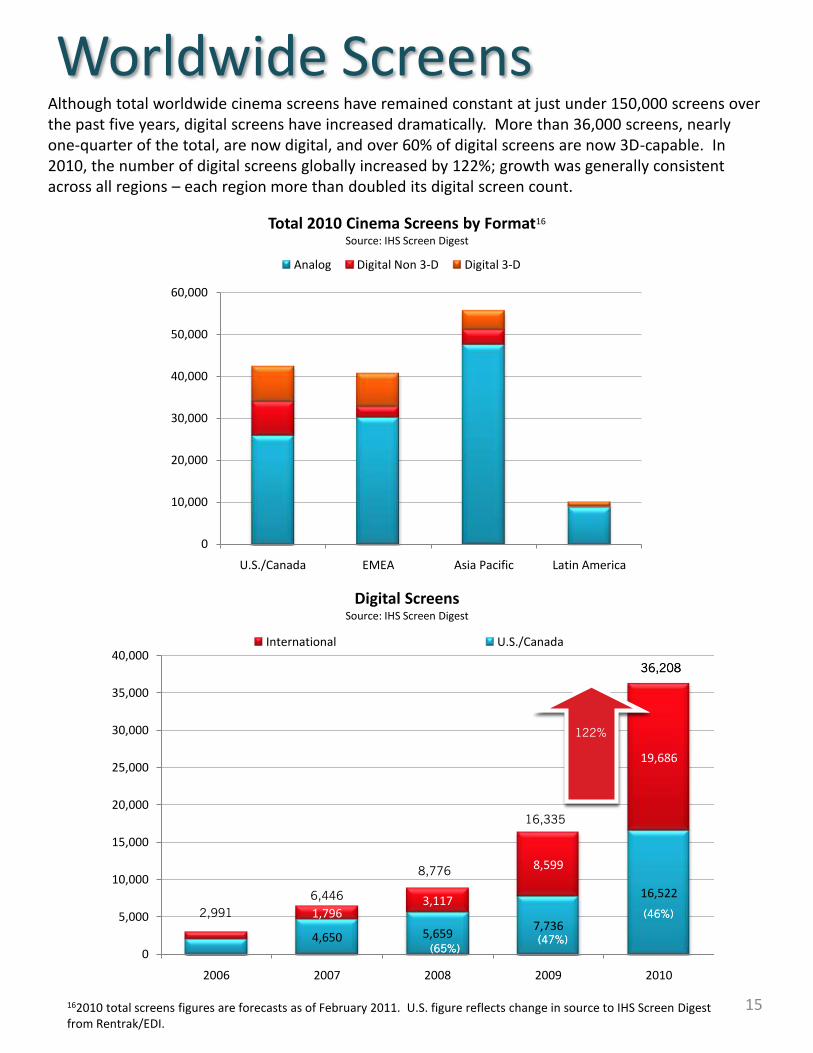
Total 2010 Cinema Screens by Format16
Source: IHS Screen Digest
Although total worldwide cinema screens have remained constant at just under 150,000 screens over the past five years, digital screens have increased dramatically. More than 36,000 screens, nearly one-quarter of the total, are now digital, and over 60% of digital screens are now 3D-capable. In 2010, the number of digital screens globally increased by 122%; growth was generally consistent across all regions – each region more than doubled its digital screen count.
Worldwide Screens
Digital ScreensSource: IHS Screen Digest
15162010 total screens figures are forecasts as of February 2011. U.S. figure reflects change in source to IHS Screen Digest from Rentrak/EDI.
0
10,000
20,000
30,000
40,000
50,000
60,000
U.S./Canada EMEA Asia Pacific Latin America
Analog Digital Non 3-D Digital 3-D
4,650 5,6597,736
16,522
1,7963,117
8,599
19,686
0
5,000
10,000
15,000
20,000
25,000
30,000
35,000
40,000
2006 2007 2008 2009 2010
International U.S./Canada
36,208
16,335
(65%)
(46%)
(47%)
122%
2,991
8,776
6,446
36,208
(65%)
(46%)
(47%)
122%
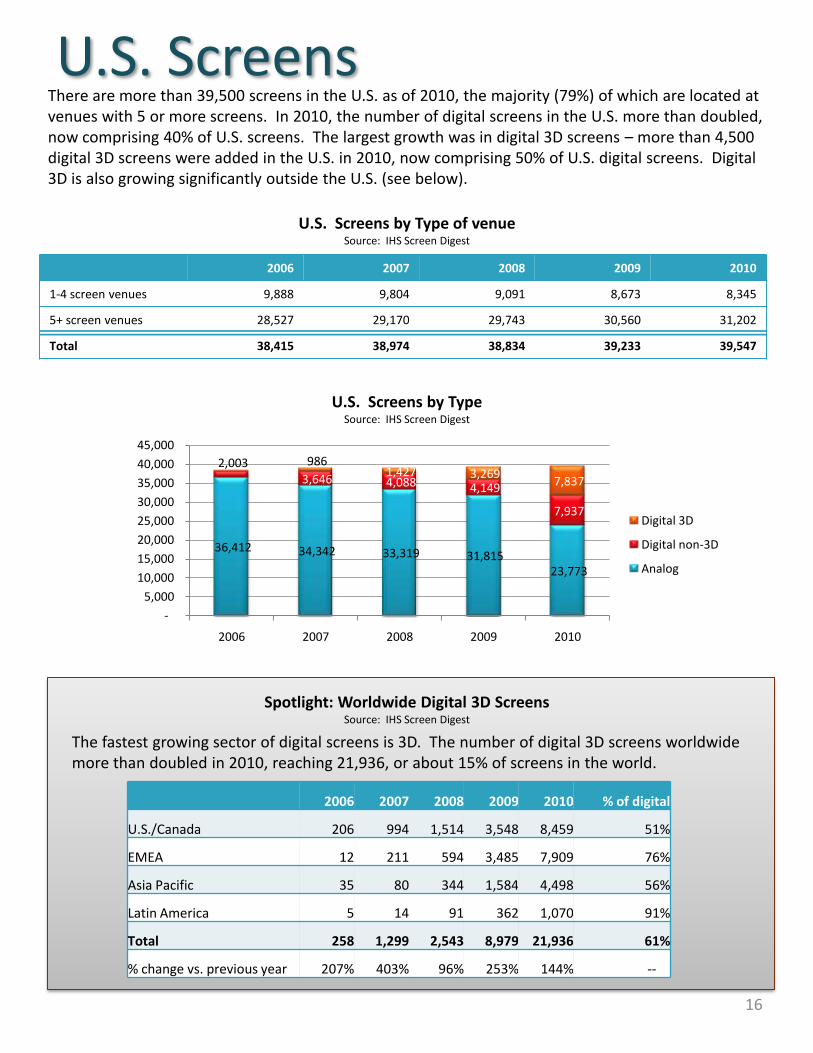
There are more than 39,500 screens in the U.S. as of 2010, the majority (79%) of which are located at venues with 5 or more screens. In 2010, the number of digital screens in the U.S. more than doubled, now comprising 40% of U.S. screens. The largest growth was in digital 3D screens – more than 4,500 digital 3D screens were added in the U.S. in 2010, now comprising 50% of U.S. digital screens. Digital 3D is also growing significantly outside the U.S. (see below).
U.S. Screens by Type of venueSource: IHS Screen Digest
16
2006 2007 2008 2009 2010 % of digital
U.S./Canada 206 994 1,514 3,548 8,459 51%
EMEA 12 211 594 3,485 7,909 76%
Asia Pacific 35 80 344 1,584 4,498 56%
Latin America 5 14 91 362 1,070 91%
Total 258 1,299 2,543 8,979 21,936 61%
% change vs. previous year 207% 403% 96% 253% 144% --
The fastest growing sector of digital screens is 3D. The number of digital 3D screens worldwide more than doubled in 2010, reaching 21,936, or about 15% of screens in the world.
Spotlight: Worldwide Digital 3D ScreensSource: IHS Screen Digest
U.S. Screens
2006 2007 2008 2009 2010
1-4 screen venues 9,888 9,804 9,091 8,673 8,345
5+ screen venues 28,527 29,170 29,743 30,560 31,202
Total 38,415 38,974 38,834 39,233 39,547
U.S. Screens by TypeSource: IHS Screen Digest
36,412 34,342 33,319 31,815 23,773
2,0033,646 4,088 4,149
7,937
986 1,427 3,269
7,837
-
5,000
10,000
15,000
20,000
25,000
30,000
35,000
40,000
45,000
2006 2007 2008 2009 2010
Digital 3D
Digital non-3D
Analog