The Work of Cities: Underemployment and Urban Change in ...
27
The Work of Cities The Work of Cities: Underemployment and Urban Change in Late- 20th-Century America James R. Elliott Sociology Department Tulane University Abstract This research moves beyond preoccupations with deindustrialization, joblessness, and the urban “underclass” to examine the role that cities and urbanization in gen eral have played in the reorganization of production and local labor markets. After reviewing recent work on global cities, new industrial districts, and the “new” social division of labor, the author used Census data to examine the extent and relative causes of rising underemployment in U.S. metropolitan areas during 1950–90. Sever al key findings emerge. First, underemployment increased 35 percent between 1970 and 1990, largely due to shifts in structural rather than personal factors. Second, most of this structural shift occurred within industries, not across them. Third, the consequences of these shifts have been most dramatic at the bottom rather than the top of the urban hierarchy, despite recent claims regarding global cities. Fourth, fac tors associated with the new social division of labor characterized by growing num bers of smaller workplaces and “routine” business service firms offer the strongest empirical explanation for rising underemployment in local metropolitan areas. Implications are discussed. During the 1980s Americans began to worry a great deal about the deindustrialization of their major cities and the possible contributions of this trend to rising joblessness. As scholars analyzed this problem, they produced valuable insights into the transformation of urban economies and the growth of underclass populations trapped in inner-city neigh borhoods that were increasingly devoid of the financial and social rewards of work. This research, however, also obscured the fact that joblessness constitutes only one aspect of economic hardship facing many urban residents. More significant by far, in terms of both absolute numbers and relative growth over recent decades, continues to be low-income employment—work situations that fail to provide workers with socially acceptable earn ings as a result of inadequate worktime, low wages, or a combination of the two. Cityscape: A Journal of Policy Development and Research • Volume 7, Number 1 • 2004 Cityscape 107 U.S. Department of Housing and Urban Development • Office of Policy Development and Research
Transcript of The Work of Cities: Underemployment and Urban Change in ...

The Work of Cities
The Work of Cities: Underemployment andUrban Change in Late-20th-Century America James R. Elliott Sociology Department Tulane University
Abstract This research moves beyond preoccupations with deindustrialization, joblessness, and the urban “underclass” to examine the role that cities and urbanization in general have played in the reorganization of production and local labor markets. After reviewing recent work on global cities, new industrial districts, and the “new” social division of labor, the author used Census data to examine the extent and relative causes of rising underemployment in U.S. metropolitan areas during 1950–90. Several key findings emerge. First, underemployment increased 35 percent between 1970 and 1990, largely due to shifts in structural rather than personal factors. Second, most of this structural shift occurred within industries, not across them. Third, the consequences of these shifts have been most dramatic at the bottom rather than the top of the urban hierarchy, despite recent claims regarding global cities. Fourth, factors associated with the new social division of labor characterized by growing numbers of smaller workplaces and “routine” business service firms offer the strongest empirical explanation for rising underemployment in local metropolitan areas. Implications are discussed.
During the 1980s Americans began to worry a great deal about the deindustrialization of their major cities and the possible contributions of this trend to rising joblessness. As scholars analyzed this problem, they produced valuable insights into the transformation of urban economies and the growth of underclass populations trapped in inner-city neighborhoods that were increasingly devoid of the financial and social rewards of work. This research, however, also obscured the fact that joblessness constitutes only one aspect of economic hardship facing many urban residents. More significant by far, in terms of both absolute numbers and relative growth over recent decades, continues to be low-income employment—work situations that fail to provide workers with socially acceptable earnings as a result of inadequate worktime, low wages, or a combination of the two.
Cityscape: A Journal of Policy Development and Research • Volume 7, Number 1 • 2004 Cityscape 107U.S. Department of Housing and Urban Development • Office of Policy Development and Research

Elliott
Although not all low-income workers live in poverty (thanks largely to increases in dual-earner households), the quality of their work experience clearly affects issues of ongoing public concern. It can be argued that low wages and intermittent employment, for example, devalue the work ethic. Both weak attachment to jobs with low pay and few opportunities for advancement fuel insecurity and threaten family stability. And current efforts to reform ineffective welfare programs increase in complexity, since simply getting a job no longer promises individuals an alternative to economic hardship. Together, these issues underscore the fact that urban underemployment is about more than individual workers. It is about social dynamics and what it means to live and work in America’s urban centers at the beginning of the 21st Century.
The analyses on which this article is based were conducted during 1996–97, with the aim of moving beyond then-current preoccupations with deindustrialization, joblessness, and the urban underclass to consider the role that cities and urbanization in general were playing in the reorganization of production and local labor markets. The first objective was to review alternative perspectives on the changing role of cities in the world economy to establish key, and perhaps competing, explanations for structural shifts in local labor markets, paying particular attention to cities as modes of organization, not simply containers for social and economic life. The second objective was to examine the effects of these shifts on the increasing likelihood of low-income employment (underemployment) among different social groups. Unifying both objectives was a conviction that to understand the structural underpinnings of urban underemployment trends, it would first be necessary to situate cities as meaningful units of social organization—in the context of broader social and economic changes in the organization of production. Once this task had been accomplished, it would then be possible to develop a better empirical understanding of how these events were reshaping job opportunities available to workers at the lowest income level of the new urban economy.
The section below summarizes the alternative theoretical perspectives that were reviewed in pursuit of the first objective and then summarizes the key empirical findings that emerged in pursuit of the second objective. The section concludes with a brief discussion of implications of this research for understanding contemporary urban change and its connections to low-income employment.
Alternative Perspectives on Urban Restructuring During the 1980s and early 1990s the most prominent theory of urban restructuring was the deindustrialization thesis. It argued that shifts in employment from manufacturing to services were destroying large numbers of decent-paying blue-collar jobs in major U.S. cities (see Bluestone and Harrison, 1982; Harrison and Bluestone, 1988). Although millions of new service jobs were emerging to take the place of these old blue-collar jobs, they often required a college degree to earn middle-class incomes and yielded a much more polarized earnings distribution. For example, in 1987 the earnings ratio of college graduates to high school dropouts in the service sector was 3.5 to 1, compared with only 2.4 to 1 in the manufacturing sector (Harrison, 1994). Researchers interpreted these and related statistics to imply that the more service oriented a city became, the greater inequality its local workforce would experience, with much of this inequality driven by falling wages and hours worked among less-educated workers (see Grubb and Wilson, 1992; Lorence and Nelson, 1993; Loveman and Tilly, 1988).
Several factors contributed to the prominence of the deindustrialization thesis during this period. First, these trends were relatively easy to measure. Census data were widely available and easily analyzed to show a correlation between changing industrial structure and rising labor market hardship for the types of workers who had typically been
108 Cityscape

The Work of Cities
employed in manufacturing jobs, namely, men without college degrees. Second, there was a strong sense that the new service economy was rendering all places, particularly cities, superfluous to the organization of production. This view, aptly captured in Bill Gates’s (1995) bestseller The Road Ahead, extolled the power of new technologies to connect and coordinate vast networks of geographically dispersed production sites and, in turn, the ability of growing numbers of Americans to exercise well-documented residential preferences for less densely settled space (Fuguitt and Zuiches, 1975). These factors contributed to a vision of a postindustrial, posturban America, where new service-based prosperity for middle-class Americans would join with social and economic obsolescence of urban economies—apparently to spell the end of major cities as people knew them.
Although consistent with America’s well-documented and long-standing ambivalence toward urban life, this vision of deindustrializing, jobless cities had some important shortcomings. First, it tended to reduce urban restructuring and its impacts on local workers to simple quantitative shifts in employment across industrial sectors. This tendency ignored nuances of earlier deindustrialization arguments regarding corporate power and social contracts. It also failed to incorporate insights from alternative perspectives emerging to understand new postindustrial urban forms. The next section reviews these alternative perspectives to identify key processes and preconditions for empirically evaluating recent underemployment trends. First, research on new industrial districts is discussed, followed by global cities, and finally the new social division of labor.
New Industrial Districts The deindustrialization thesis emphasized the displacement of manufacturing jobs from major urban centers, whereas research on new industrial districts calls attention to the successful reorganization of production within urban manufacturing centers (Scott, 1986, 1988a, 1988b; Storper and Scott, 1989). In the ideal, typical new industrial district, new technologies and foreign competition associated with the new global economy are understood to encourage the proliferation of smaller, more flexible firms that specialize in only one or a few phases of the overall production process. On any given project or product, these smaller, more nimble organizations may cooperate with one another by sharing technology, information, and even workers, only then to turn around and compete fiercely with one another for a larger slice of the next major contract or market opportunity (Harrison, 1991). The overall result of these processes is a “vertical disintegration,” or disbanding, of large manufacturing firms—the hallmark of urban, industrial capitalism— into larger numbers of smaller firms linked via interfirm networks that increase organizational flexibility and ensure the long-term success of local production complexes. Metaphorically, the shift is away from the “large firm as organization” toward an “organization of smaller firms.”
A key idea behind this perspective is that as industrial production systems disintegrate, they do not simply become smaller, more specialized versions of their old selves; instead, they demand more interorganizational transactions. This increased demand, in turn, leads to the formation of and reliance on network linkages among firms, which in turn encourage spatial clustering within economic sectors to cut transaction costs and maximize organizational flexibility. The result of these tendencies is new industrial districts like those organized around computer technology in Silicon Valley and Route 128; aerospace in Los Angeles; oil and gas equipment in Houston; carpet manufacturing in Dalton, Georgia; the mobile home industry in Elkhart, Indiana; and so forth (Porter, 1990). From this perspective urban centers do not become superfluous to the organization of production, but stimulate and contribute to new forms of decentralized production. As Scott (1988a) explains in Metropolis: From the Division of Labor to Urban Form, “On the one side, the
Cityscape 109

Elliott
social division of labor provokes spatial agglomeration as a way of lowering external transaction costs; on the other side, agglomeration encourages further social division of labor and in-migration of new producers, precisely until it lowers these costs.” The end result is that urban manufacturing activities are not so much disappearing as they are being reorganized.
According to Scott (1988a, 1988b) this drive for organizational flexibility within new industrial districts typically coincides with managerial efforts to restructure local labor relations. One way in which both goals are pursued simultaneously is through the externalization, or outsourcing and subcontracting, of peripheral workers, whom firms can rehire or subcontract as needed, thereby matching payments more closely to work performed (see Fevre, 1991; Michon, 1987; Pollert, 1988). “In this manner,” Scott (1988b) explains, “firms can respond flexibly and efficiently to changing economic conditions while at the same time partially depoliticizing the intrafirm wage-profit frontier by denying their least valuable workers long-term security of job tenure.” The result, he writes, is a deepening segmentation of insiders and outsiders within the local labor market, as workers with the most standardized skills become subject to increasing employment instability and declining wages.
Global Cities Research on new industrial districts stresses vertical disintegration and externalization within urban manufacturing complexes, whereas research on the new breed of global cities highlights the growth and development of sophisticated business services, such as managerial consulting, financial advising, information management, and legal counsel, that provide multilocation firms with the organizational resources needed to coordinate and control spatially dispersed production and investment activities in today’s global economy. This body of literature makes several key claims with regard to urban restructuring. First, in the new service economy not all services are created equal. More important than conventional consumer services are professional services that assist large corporations in maintaining their global production activities. It is the rise of these sophisticated business services that constitutes the real shift to a service economy, not the growth of retail services characteristic of earlier periods of mass production. Second, these new professional services are not the inevitable byproducts of today’s globalization of production. Instead, they must be created. Consequently, they are subject to the same agglomeration tendencies characteristic of new industrial districts. Third, innovations in information technology reinforce rather than erode these agglomeration tendencies. These innovations increase the exportability of producer services and encourage their concentration in major urban centers that possess the physical infrastructure necessary for establishing and maintaining global distribution networks (for example, fiber optic networks, satellite links, and advanced telecommunication facilities).
The development of these professional services is now credited with revitalizing many major U.S. cities, but many observers believe that they also contribute, directly and indirectly, to the polarization of local employment opportunities (Mollenkopf and Castells, 1991; Sassen, 1991, 1994). Indeed, Friedmann and Wolff (1982) state, “The primary social fact about world city formation is the polarization of its social class divisions.” In her influential work The Global City, Sassen (1991) explains that the growth of new business services results in a highly bifurcated occupational structure characterized by large numbers of highly skilled, well-paid professionals at one end and at the other end, an expanding pool of poorly paid, easily dismissed ancillary workers who enter data, file reports, and clean cubicles for the new business service elite. Sassen contends that the growth of this new elite also stimulates high-income gentrification within the inner city,
110 Cityscape

The Work of Cities
which counters the capital-intensive suburbanization of earlier decades with the proliferation of small retail and consumer service outlets that serve members of the new elite when they are not at work. The result of these twin processes of professionalization and gentrification is a “new class alignment” that offers less skilled urban workers jobs with inadequate wages and little opportunity for upward mobility. In other words, urban revitalization in the form of new business service networks comes hand in glove with expanding low-income employment.
New Social Division of Labor Although not an explicit theory of urban restructuring, Sayer and Walker’s (1992) treatise on the new social division of labor offers yet another perspective on the links between production changes and employment opportunities in U.S. urban centers. These scholars argue, “What is called the transition to a service economy is best characterized as a widening and deepening of the social and technical division of labor, part of a more general process of industrial evolution and capitalist development.” This process is more difficult to conceptualize than overt patterns of deindustrialization, they argue, because industrial production now involves increasing amounts of “indirect” labor, or work partitioned among smaller, more specialized firms and industries. The result is declining firm size and industrial diversification within and across all sectors of the economy, processes that belie the very integration that this new social division of labor requires.1
As part of this thesis, Sayer and Walker argue that cities now serve as an important “mode of organization” in the realm of production and, as such, facilitate further social divisions of labor by minimizing the costs of movement, providing a built environment that minimizes social distance, and imposing boundaries that limit the deconcentration of increasingly discrete production units. An example of this phenomenon lies in routine, as opposed to sophisticated producer service firms, which have grown in cities throughout the country to sell indirect labor such as clerical support, building maintenance, temporary staffing, and private security to organizations in a wide array of manufacturing and service industries.
Contrary to orthodox economic theory, Sayer and Walker view this new social division of labor not as a neutral force with respect to labor market opportunities, but as a social process that pries apart, elevates, and subordinates groups of workers even as it renders them increasingly interdependent. The underlying argument is that as production tasks become increasingly subdivided across organizational and industrial boundaries, social inequalities between “organizers” and “the organized” increase, as does the number of jobs that have little control, or even access to control, over the broader organization of production. These inequalities, in turn, become reinforced by small companies’ tendency to thrive by doing things that large corporations fail to do well, such as serving local markets, producing specialized goods and services, and exploiting marginal labor forces. Sayer and Walker suggest that these organizational developments contribute to growing inequality and deteriorating employment conditions among workers with little technical or organizational expertise.
Recapitulation How the restructuring of urban economies is understood has profound implications for how trends in urban inequality and low-wage employment are evaluated. Researchers interested in new industrial districts largely tend to understand the restructuring process in terms of vertical disintegration and agglomeration within specialized manufacturing sectors. Researchers interested in global cities see the restructuring process largely in terms of the expansion of new sophisticated producer services that help to coordinate
Cityscape 111

Elliott
increasingly far-flung production and investment activities. The proponents of the new-social-division-of-labor perspective, however, focus on urbanization economies now developing among a growing array of industries, firms, and specialties (including locally oriented business service companies that provide building maintenance, security, and temporary staffing on demand). Each perspective offers its own alternative to the view that cities are deindustrializing, jobless, and superfluous to the organization of production, suggesting that how urban economies are now reinventing themselves contributes to the marginalization of growing numbers of less-educated workers.
Data and Measures Data for the empirical analyses of urban restructuring and low-income employment trends were obtained primarily from the 1950, 1970, 1980, and 1990 Public Use Micro-data Series (PUMS) samples, which are machine-readable files compiled by the U.S. Bureau of the Census (1973, 1983, 1984, 1992a) in conjunction with the national decennial censuses of population and housing. (Data from the 1960 PUMS were excluded because they offer inadequate identifiers for individual metropolitan areas.) To highlight historical changes, the first two sets of analyses examined only the 107 metropolitan areas that could be identified on all 4 PUMS. This restriction effectively truncated observations at lower tiers of the urban system, since newer metropolitan areas typically emerge at the bottom tiers of the urban size hierarchy. Consequently, the results speak more to events within the historic core of the U.S. urban system than to the growth and development of the system as a whole over recent decades.
The measurement of low-income employment drew from Nord and Sheets’ indicator of underemployment (Nord, Phelps, and Sheets, 1988; Nord and Sheets, 1992; Sheets, Nord, and Phelps, 1987). Specifically, it defines low-income employment as the inability of active labor force participants—those who worked at least 15 weeks during the reference year—to earn wages and salaries above 125 percent of the individual poverty threshold ($1,539 in 1950, $2,366 in 1970, and $8,064 in 1990). This measure of low-income employment is distinct from the concept of poverty in two ways. First, only individuals who worked at least 15 weeks during the reference year were included in the estimation procedures; second, individuals, rather than families, served as the primary unit of analysis. Moreover, unlike conventional measures of unemployment, this indicator of low-income employment was based on labor force participation over the previous year, not just the preceding 4 weeks. Thus it included some types of part-time and part-year employment. Furthermore, unlike more traditional measures of inequality, such as the Gini coefficient, the present measure relied on an absolute earnings threshold that did not change across time or place, except to account for national changes in the Consumer Price Index. Such a benchmark provided a widely acknowledged standard that could be readily applied and easily interpreted across a variety of labor market contexts.
The years 1949, 1969, and 1989, for which the first two sets of analyses were conducted, were all at or near peaks within their respective business cycles. Thus they were appropriate for comparison purposes. This fact, however, means that low-income employment rates reported in this research are likely to be low estimates of post-World War II rates, since low-income employment levels are generally expected to decrease during peaks in the business cycle as rising demand for workers pushes up wages.
To maintain the urban literature’s emphasis on changing employment relations, the sample was restricted to civilian workers ages 18–64 years who were neither enrolled in school nor self-employed during the reference year. Across all U.S. metropolitan areas, 12.7 million of these workers were employed in low-income jobs in 1990, as exhibit 1
112 Cityscape

The Work of Cities
Exhibit 1
Discouraged Joblessness, Unemployment, and Low-Income Employment in U.S. Metropolitan Areas: 1990
0
2
4
6
8
10
12
14
Central City Suburbs Total
Mill
ion
s
Discouraged jobless
Unemployed
Low-income employed
Notes: Discouraged jobless are unemployed because no jobs are available. Low-income employment is defined as earnings that fail to exceed 125 percent of individual poverty threshold for respective year ($8,064 in 1990) despite at least 15 weeks of formal employment. Sample includes non-self-employed civilian workers not currently enrolled in school.
Source: U.S. Department of Commerce (1990).
shows. This number was more than 3 times the number of unemployed and more than 25 times the number of discouraged jobless (those who reported no longer looking for work). These data also reveal that low-income employment was not restricted to the central city, or ghetto, since more than twice as many suburban workers as central-city workers reported low-income employment in 1990.
Empirical Analyses This section summarizes three sets of empirical analyses conducted to examine different structural dimensions of low-income employment trends in U.S. metropolitan areas during the post-World War II era. The first uses shift-share techniques to examine the extent to which low-income employment trends may be attributed to shifts of workers across industrial sectors (for example, due to deindustrialization) compared with shifts in employment relations within industrial sectors. To place arguments about global cities and manufacturing centers in a much needed spatial context, the second analysis uses logistic regression to examine the extent to which an individual’s odds of low-income employment vary by location in the urban hierarchy, net of individual-level covariates. The third uses regression analysis to develop a generalizable understanding of the most important structural factors associated with changes in low-income employment in metropolitan labor markets during the 1980s, a decade of intense urban-industrial restructuring.
Cityscape 113
Elliott
Shift-Share Analysis of Low-Income Employment Trends: 1950–90 This analysis used shift-share methodology to examine the extent to which changes in metropolitan, low-income employment during the post-World War II era were primarily a product of job shifts across industries, job shifts within industries, or an interaction of the two. Shift-share methodology was appropriate for these purposes because it emphasizes relative change in industry and employment structures over time rather than absolute growth (or decline) (see Kitagawa, 1955; Singelmann and Browning, 1980).
The sample was divided into six employment categories, constructed by first dividing workers into adequate (above-poverty-level) earnings and inadequate (below-poverty-level) earnings categories. These two categories were then subdivided according to three distinct patterns of hours worked: (1) full time (35 hours per week for 50 or more weeks during the reference year); (2) part time (fewer than 35 hours per week for 50 or more weeks during the reference year); and (3) intermittent (between 15 and 49 weeks during the reference year). The resulting six-category framework was then used to evaluate the changing structure of urban labor markets over time. Although this framework suppressed a great deal of earnings heterogeneity within the adequate employment categories, it was acceptable for this research, which primarily aimed to extend knowledge of labor market restructuring at the lowest income level of the urban economy. In addition, this analysis included 11 major industrial sectors: retail, manufacturing, consumer services, health and education, distributive services and wholesale, petroleum and metal manufacturing, producer services, public administration, agriculture, advanced technology, and construction.
Exhibit 2 shows the percentage of workers in each of the six employment categories in 1950, 1970, and 1990. The results indicate that inadequate, or low-income, employment declined substantially during the 1950–70 period, whereas the share of adequate full-time employment jumped approximately 11 percentage points to 63 percent. In the subsequent period, 1970–90, low-income employment rose in two of the three categories (part time and intermittent), adding approximately 2.7 million people to the ranks of the below-poverty-level workforce.
To determine whether these changes resulted primarily from shifts across or within industrial sectors, the analysis then used shift-share methodology, which is a standardization technique that allows researchers to simultaneously consider changes in multiple rates over time. Exhibit 3 reports the results of this analysis for industrial and employment restructuring in the nation’s 107 core metropolitan areas during the 1950–70 and 1970–90 periods. The first column for each time period represents the net shift that occurred within each employment category after controlling for absolute growth of the total workforce. (Because this technique constrains labor force growth to zero, all net shifts for a given period sum to zero.)
A useful feature of shift-share analysis is that it allows researchers to decompose these net shifts into three additive components: in this case, an industry effect, an employment effect, and an interaction effect. The industry effect refers to changes that can be directly attributed to employment shifts across the 11 major industrial sectors. That is, it indicates the share of the net shift in each employment category attributable strictly to industry shifts during the respective period, assuming no change in employment categories within these industries. The employment effect, in contrast, indicates the share of the net shift in each employment category that would have occurred if there had been only employment shifts within industries, assuming no change in industrial structure. Finally, the interaction effect refers to the joint effect of industry and employment shifts. Conceptually, a large interaction term indicates that neither industry shifts nor employment shifts by themselves had a large effect on the observed change in particular employment categories.
114 Cityscape

Exh
ibit
2
Em
ploy
men
t D
istr
ibut
ion
for
107
Cor
e U
.S. M
etro
polit
an A
reas
: 195
0, 1
970,
and
199
0
Per
cen
t P
erce
nt
Po
int
Ch
ang
e
Em
plo
ymen
t C
ateg
ory
19
50
1970
19
90
1950
–70
1970
–90
Ad
equ
ate
earn
ing
sa 75
.3
Ful
l tim
e (3
5+ h
ours
/wee
k, 5
0+ w
eeks
/yea
r)
51.4
P
art
time
(<35
hou
rs/w
eek,
50+
wee
ks/y
ear)
6.
8 In
term
itten
t (1
5–49
wee
ks/y
ear)
17
.1
Inad
equ
ate
earn
ing
sb
24.7
F
ull t
ime
(35+
hou
rs/w
eek,
50+
wee
ks/y
ear
8.5
Par
t tim
e (<
35 h
ours
/wee
k, 5
0+ w
eeks
/yea
r)
1.1
Inte
rmitt
ent
(15–
19 w
eeks
/yea
r)
15.1
88.6
62.8 5.6
20.2
11.4 2.2
1.3
7.9
85.0
65.2 3.3
16.5
15.0 2.1
2.6
10.3
13.3
–3
.6
11.4
2.
4 –1
.2
–2.3
3.
1 –3
.7
–13.
3 3.
6 –6
.3
–0.1
0.
2 1.
3 –7
.2
2.4
a Exc
eeds
125
per
cent
of
indi
vidu
al p
over
ty t
hres
hold
for
resp
ectiv
e ye
ar (
$1,5
39 in
195
0, $
2,36
6 in
197
0, a
nd $
8,06
4 in
199
0).
b Les
s th
an o
r eq
ual t
o th
resh
old
for
adeq
uate
ear
ning
s.
Sou
rce:
U.S
. Bur
eau
of t
he C
ensu
s (1
973,
198
4, 1
992a
).
Exh
ibit
3
Abr
idge
d S
hift-
Sha
re R
esul
ts fo
r 10
7 C
ore
U.S
. Met
ropo
litan
Are
as: 1
950–
70 a
nd 1
970–
90
1950
–70
1970
–90
Eff
ect
(%)
Eff
ect
(%)
Net
Sh
ift
Net
Sh
ift
Em
plo
ymen
t C
ateg
ory
(h
un
dre
ds)
In
du
stry
E
mp
loym
ent
Inte
ract
ion
(h
un
dre
ds)
In
du
stry
E
mp
loym
ent
Inte
ract
ion
Ad
equ
ate
earn
ing
sa
Ful
l tim
e (3
5+ h
ours
/wee
k, 5
0+ w
eeks
/yea
r)
37,8
42
Par
t tim
e (<
35 h
ours
/wee
k, 5
0+ w
eeks
/yea
r)
–3,9
94
Inte
rmitt
ent
(15–
49 w
eeks
/yea
r)
10,3
07
4.6
87.6
7.
8 10
,788
–6
7.2
165.
6 1.
6 53
.8
126.
5 –6
2.6
–10,
252
1.8
114.
4 –1
6.2
0.5
81.5
18
.0
–15,
640
–18.
7 11
4.8
3.8
Inad
equ
ate
earn
ing
sb
Ful
l tim
e (3
5+ h
ours
/wee
k, 5
0+ w
eeks
/yea
r –2
0,77
5P
art
time
(<35
hou
rs/w
eek,
50+
wee
ks/y
ear)
54
7In
term
itten
t (1
5–19
wee
ks/y
ear)
–2
3,92
7
–2.7
92
.0
10.7
–6
03
–87.
7 11
4.4
73.3
–7
0.2
343.
9 –1
73.7
5,
492
13.2
81
.0
5.8
0.6
83.6
15
.8
10,2
17
31.9
78
.9
–10.
8
a Exc
eeds
125
per
cent
of
indi
vidu
al p
over
ty t
hres
hold
for
resp
ectiv
e ye
ar (
$1,5
39 in
195
0, $
2,36
6 in
197
0, a
nd $
8,06
4 in
199
0).
b Les
s th
an o
r eq
ual t
o th
resh
old
for
adeq
uate
ear
ning
s.
Sou
rce:
U.S
. Bur
eau
of t
he C
ensu
s (1
973,
198
4, 1
992a
).
The Work of Cities
Cityscape 115

Elliott
Three-quarters of all net increases during the 1950–70 period contributed to the relative growth of adequate full-time employment (+37,842), with the remainder contributing almost entirely to increases in adequate intermittent employment (+10,307). Further investigation (not shown) reveals that this relative growth in adequate full-time jobs occurred across nearly all industrial sectors, whereas the growth of adequate part-year jobs occurred largely in the construction and health/education sectors, which typically exhibit seasonal employment patterns. The expansion in adequate employment supports the idea that this period constituted a Golden Age of American capitalism. Yet, less than 5 percent of this expansion was attributable to industrial shifts. Instead, the relative expansion of above-poverty-level employment during the 1950s and 1960s was almost entirely attributable to the restructuring of employment arrangements within major industrial sectors.
The deindustrialization thesis predicts that findings would differ significantly for the 1970–90 period. However, exhibit 3 shows that industry effects again were much weaker than the effects of employment restructuring within industries. For example, the results indicate that shifts within industrial sectors accounted for 81 percent of net growth in low-income, part-time work and for 79 percent of net growth in low-income, intermittent work—6 and 2.5 times the contribution of industrial shifts, respectively. Thus although the 1970s and 1980s were a period of profound urban-industrial transformation, the results of this analysis show that it was a period of even greater change in the organization of employment relations within industries. The next section takes a closer look at the spatial dimensions of these developments.
Low-Income Employment Trends in U.S. Urban Hierarchy: 1950–90 This analysis examined variation in low-income employment in and among cities in different tiers of the U.S. urban hierarchy during the post-World War II era. The investigation was further extended to include separate analyses for different racial and gender groups. Although much research exists on racial and gender differences in earnings and status, few studies have focused explicitly on the role of the urban system in shaping these outcomes. Similarly, many studies have examined the links between urban hierarchy and income inequality (for example, Betz, 1972; Richardson, 1973; Thompson, 1965), but few have focused specifically on low-income employment, and none have investigated the effects of urban position on the likelihood of low-income employment, net of individual characteristics. The purpose of extending prior research on the urban hierarchy and labor market segmentation in these ways is not merely to document which types of metropolitan areas have the highest rates of low-income employment but also to assess the extent to which differences in the urban hierarchy have persisted over time and the degree to which these differences remain systematically ordered among distinct social groups.
A typology developed by Noyelle and Stanback (1983) was used to identify respective tiers in the U.S. urban hierarchy. Although older urban typologies have been criticized for being static and ahistorical (see Bourne, 1982; Pred, 1977), Noyelle and Stanback sought to develop an urban classification system grounded explicitly in post-World War II patterns of economic structure and change. Rather than relying on timeless assumptions about retail and wholesale trade derived from central place theory, Noyelle and Stanback applied Singelmann’s (1978) service classification framework to employment and population data from the 1970s. With these data and a simple clustering algorithm that emphasized industrial structure, organizational centrality, and population size, Noyelle and Stanback developed a new taxonomy of the national urban hierarchy that identified 4 major classes of U.S. metropolitan areas, consisting of 11 constituent types.
116 Cityscape

The Work of Cities
At the top of this hierarchy is the class of nodal centers, consisting of three specific types: national nodes, regional nodes, and subregional nodes. These metropolitan areas are conceptualized as the locus of major economic decisions about new investment and production opportunities throughout the urban system. They are also considered specialized service centers that provide headquarter functions to firms located further down the urban hierarchy. The first and most dominant metropolitan type, national nodes, includes the nation’s four dominant urban centers: New York, Chicago, Los Angeles, and San Francisco. Although Sassen has focused on New York in her research on global cities, other researchers have pointed to related global roles in each of the other national nodes, emphasizing expressions of economic globalization driven by the location strategies of transnational corporations and development of sophisticated corporate-service complexes (for example, Esparza and Krmenec, 1994; Soja, 1995; Walker, 1996).2 Below the nodal centers are the specialized service centers, including functional nodes (such as Detroit, Michigan), government-education centers (such as Washington, D.C.), and education-manufacturing centers (such as New Haven, Connecticut). Below that in the urban hierarchy are production centers, including manufacturing centers (such as Buffalo, New York), industrial-military centers (such as San Diego, California), and mining-industrial centers (such as Duluth, Minnesota). Finally, there are the consumer-oriented centers, including resort-retirement centers (such as Orlando, Florida) and residential centers (excluded from analysis). Exhibit 4 summarizes low-income employment data for urban areas in each category for 1950, 1970, and 1990.3
Exhibit 4
Low-Income Employees, by Location in U.S. Urban Hierarchy: 1950, 1970, and 1990
1950 1970 1990
Location in Urban Hierarchy % n % n % n
Nodal centers Global cities (4) 20.3 416,745 8.8 752,039 11.2 874,832 Regional nodes (19) 28.3 395,880 12.2 1,208,398 14.9 2,114,100 Subregional nodes (16) 36.5 101,539 14.9 328,142 16.1 615,406
Specialized service centers Functional nodes (19) 23.2 190,404 11.4 594,065 15.3 1,019,974 Government-education
centers(13) 29.6 114,774 12.1 268,717 15.1 632,312 Education-manufacturing
centers (4) 27.7 28,519 11.2 58,956 15.2 102,722
Production centers Manufacturing centers (19) 28.9 127,891 11.8 287,778 17.4 497,831 Industrial-military centers (5) 40.8 45,912 14.5 117,798 20.0 380,060 Mining-industrial centers (3) 40.7 14,774 14.9 30,485 23.2 69,275
Consumer-oriented centers Resort-retirement centers (3) 46.8 13,900 15.4 67,867 17.6 233,763 Residential centers NA NA NA NA NA NA
NA = not available.
Notes: Low-income employment is defined as earnings that fail to exceed 125 percent of individual poverty threshold for respective year ($1,539 in 1950, $2,366 in 1970, and $8,064 in 1990). Sample includes non-self-employed civilian workers employed at least 15 weeks during reference year and not currently enrolled in school. Numbers in parentheses are locations in analysis.
Source: U.S. Bureau of the Census (1973,1984, 1992a).
Cityscape 117

Elliott
Exhibit 5
Estimated Logistic Regression Coefficients Predicting Log Odds of Low-Income Employment, by Location in Urban Hierarchy: 1950, 1970, and 1990
1950 1970 1990
Location in urban hierarchy Global city –0.358*** –0.290*** –0.234*** Regional node na na na Subregional node 0.351*** 0.203*** 0.154*** Functional node –0.333*** –0.061*** 0.094*** Government-education –0.005 –0.151*** –0.110*** Education-manufacturing 0.056 –0.003 0.037 Manufacturing –0.028 0.057* 0.183*** Industrial-military 0.563*** 0.141*** 0.211*** Mining-industrial 0.511* 0.410*** 0.641*** Resort-retirement 0.897*** 0.375*** 0.139***
Statistical control variable Gender: female –0.026 1.656*** 1.150*** Race/ethnicity
White na na na African American –0.043 0.595*** 0.238*** Hispanic 0.067 0.412*** 0.381*** Asian 0.206 0.204*** 0.188*** Other na 0.453*** 0.392***
Age (years) 18–24 –0.136** 1.163*** 1.404*** 25–44 –0.003 0.139*** 0.142*** 45–64 na na na
Education High school dropout 0.726*** 0.577*** 1.273*** High school graduate only 0.367*** –0.015 0.638*** Some college na na na
*p < .05, **p < .01, ***p < .001.
na = excluded from model because of insufficient subsample size.
Notes: Constant = –1. 479 (p < .001) for 1950, –3.410 (p < .001) for 1970, and –3.251 (p < .001) for 1990. Low-income employment is defined as earnings that fail to exceed 125 percent of individual poverty threshold for the respective year ($1,539 in 1950, $2,366 in 1970, and $8,064 in 1990). Sample includes non-self-employed civilian workers employed at least 15 weeks during reference year and not currently enrolled in school.
Exhibit 4 shows that low-income employment has indeed varied among metropolitan-area types during the post-World War II era and that rates have been consistently lowest in global cities and consistently highest in metropolitan centers positioned further down the urban hierarchy (that is, industrial-military, mining-industrial, and resort-retirement centers). This finding counters hypotheses drawn from the global-city literature and those drawn from Thompson’s (1965) research regarding the egalitarian spirit of production centers located further down the urban hierarchy. Moreover, between 1970 and 1990 all 10 types of metropolitan areas within the urban hierarchy experienced increases in low-income employment rates. The greatest increases occurred in the three types of production centers, and the smallest increases occurred in resort-retirement centers, followed by the various nodal centers.
The next step was to determine whether these observed differences in the urban hierarchy were statistically significant and whether an individual’s position in the urban hierarchy affected his or her odds of low-income employment, net of personal characteristics related to age, education, race, and gender. Logistic regression analysis was used to address
118 Cityscape

The Work of Cities
these issues. This analysis predicted the log odds of a simple dummy indicator of low-income employment (1 = yes, 0 = no) using a series of binary indicators to identify location in the urban hierarchy (with regional nodes serving as the omitted category). In addition to location in the urban hierarchy, statistical controls were included for gender, race/ethnicity (White, African American, Hispanic, Asian, other), age (<24, 25–44, 45–64), and education (high school dropout, high school graduate, some college).
Exhibit 5 indicates that position in the urban hierarchy significantly affected individuals’ likelihood of low-income employment, net of background factors. For example, model chi-square tests (not shown) indicate that the binary indicators for location in the urban hierarchy significantly improved the statistical fit of the model for all three years (1950, 1970, and 1990). A review of respective coefficients further reveals that most of those corresponding to location in the urban hierarchy were statistically significant (p < .001) for all three years. For 1990 the largest estimated difference occurred between global cities and mining-industrial centers. The odds ratio for this pair of metropolitan-area types is exp(0.234 + 0.641) = 2.4, which indicates that workers in mining-industrial centers were nearly 2.5 times more likely than similar workers in global cities to work in low-income jobs in 1990. In the same year African Americans were only 1.3 ([exp 0.238]) times more likely than Whites to hold low-income jobs, after controlling for the effects of other independent variables in the equation. Thus differences in low-income employment rates across tiers of the urban hierarchy were nearly twice as large as those across the racial hierarchy between African Americans and Whites, all else being equal.
Exhibit 6 plots estimated post-World War II trends for 6 of the 10 metropolitan-area types reported in exhibit 5, using sample means for the entire urban system in respective years to control for compositional differences among respective locations in the urban hierarchy. (Data points for the remaining four urban types fall within the upper and lower limits of those displayed and have been excluded for the sake of visual clarity.) Overall, the graph shows that individuals’ odds of low-income employment throughout the urban hierarchy converged dramatically between 1950 and 1970, then diverged between 1970 and 1990. During this 40-year period, however, the rank order of the different metropolitan-area types remained relatively stable, with workers in global cities consistently experiencing the lowest likelihood of low-income employment and those in mining-industrial centers experiencing the highest likelihood, net of background factors.
These findings imply that, consistent with Richardson’s (1973) earlier research, rates of low-income employment tend to decrease with movement up the urban hierarchy. Although this pattern does not refute the global-city thesis, it does raise questions about its implications for understanding labor market restructuring throughout the urban hierarchy. It also cautions against interpreting the positive relationship between producer services and low-income employment established in prior research (for example, Lorence and Nelson, 1993; Sheets, Nord, and Phelps, 1987) as evidence of disproportionate increases in low-income employment rates at the top of the urban hierarchy. Furthermore, the findings encourage reconsideration of the hypothesis that production centers positioned further down the urban hierarchy foster industrial and institutional arrangements that maximize earnings equality and minimize low-income employment. Not only did production centers exhibit among the highest rates of low-income employment in 1990, they also did so in 1950 and 1970.
To determine whether these spatial patterns apply equally to individuals of different races and genders, the full logistic regression model in exhibit 5 was reestimated separately for White and African-American men and women. These results (not shown) indicate that regardless of race and gender, the odds of low-income employment were consistently lowest toward the top of the urban hierarchy and highest toward the bottom during the
Cityscape 119

Elliott
Exhibit 6
Estimated Odds of Low-Income Employment by Metropolitan-Area Type: 1950–90
1950 1970 19900
0.1
0.2
0.3
0.4
0.5Subregional nodeManufacturing
Est
imat
ed o
dd
s
0.6 Mining industrial
Regional nodeFunctional nodeGlobal city
Notes: Low-income employment is defined as earnings that fail to exceed 125 percent of individual-level poverty threshold for respective year ($1,539 in 1950, $2,366 in 1970, and $8,064 in 1990). Sample includes non-self-employed civilian workers employed at least 15 weeks during reference year and not currently enrolled in school. Data are controlled for gender, race/ethnicity, age, and education. Estimated odds are from exhibit 5, with sample means entered as values for background factors.
entire period of study. Moreover, regardless of urban location, African-American women were more likely to hold low-income jobs than White women, who were more likely to hold low-income jobs than African-American men, who were more likely to hold low-income jobs than White men, controlling for age and education. In other words, what varied throughout the urban hierarchy during the post-World War II era was not the ascriptive ordering of local labor market queues but the relative size of low-income workforces. Together these two patterns indicate that employment quality remains determined, in part, by an individual’s position within two overlapping and hierarchical systems: the urban hierarchy of place and, within places, the social hierarchy of gender and race.
Generalizable Patterns of Urban Restructuring and Low-Income Employment: 1980–90 The final analysis considered here examined which theoretical perspective (deindustrialization, new industrial districts, global cities, or new social division of labor) provided the best generalizable explanation for local changes in low-income employment during the 1980–90 period. The unit of analysis was the metropolitan area, and most of these indicators were operationalized as percentages or ratios of the local labor force or establishment base rather than as absolute numbers. This approach has the advantage of standardizing indicators across metropolitan areas.
The deindustrialization thesis was operationalized as change in the percentage of the local metropolitan-area labor force employed in durable manufacturing, a common measure in the urban inequality literature. To tap changes in organized labor presumed to accompany relative declines in manufacturing employment, a proxy developed by
120 Cityscape

The Work of Cities
Lincoln (1978) and refined by Lorence and Nelson (1993) was used. This proxy calculates the share of all local establishments in the metropolitan area that are classified as labor organizations (unionized workplaces) in U.S. County Business Patterns (according to four-digit Standard Industrial Codes) (U.S. Bureau of the Census, 1982, 1992b). Larger scores imply a stronger presence of organized labor; smaller scores imply the opposite. Although it was a crude measure of the power of local labor organization, this proxy provided information for the complete sample of metropolitan areas and had been shown in prior research to correlate significantly with measures of union membership in cities for which such data were available (Lorence and Nelson, 1993).
The analysis used two of several indicators of vertical disintegration and externalization developed by Scott (1986, 1988a, 1988b) in his research on new industrial districts (see also Kie and Hynes, 1996). The first indicator measured the percentage of local manufacturing establishments that employed 20 or fewer workers. Increases in this indicator are presumed to reflect the movement of manufacturing jobs away from large, vertically integrated firms toward smaller, more flexible workplaces. The second indicator measured the ratio of production to nonproduction workers in the local manufacturing sector. Scott argues that as manufacturing firms externalize production tasks, they also tend to shed mid level managers and support staff rendered redundant by leaner, more specialized production strategies. To measure the pressures of foreign competition, this analysis used trade data from the National Bureau of Economic Research (1996) to compute import-penetration ratios for each manufacturing industry. An import-penetration ratio is calculated by dividing the value of imports by the value of new supply (imports plus domestic shipments). Consistent with prior uses of this indicator (see Nolan, 1986; Schoepfle, 1982; Tigges and Tootle, 1993), industries with import-penetration ratios of 15 percent or higher in 1980 and 1990 were designated as being subject to high levels of foreign competition. The share of workers employed in these industries was then used to indicate the relative pressure of foreign competition facing the local manufacturing sector.
Three indicators were used to examine processes highlighted by the global-city thesis. The first indicator measured the percentage of workers employed in finance, real estate, insurance, and specialized business services (the industrial core of global cities and the presumed engine of the new urban economy). The second indicator, the ratio of establishments in these sectors employing no more than 20 workers to the total metropolitanwide population, was used to assess the proliferation of small retail and consumer service establishments associated with high-income gentrification. This measure provided an indication of the relative density of small consumer-oriented establishments in the metropolitan-area economy. The third indicator, the percentage of foreign-born workers, was used to assess the size of the immigrant labor pool.
Three indicators were also used to assess processes indicative of the new social division of labor. The first indicator, the proliferation of smaller, more specialized establishments, was operationalized as changes in the share of all local establishments employing 20 or fewer workers. This indicator is similar to that used to measure externalization within the local manufacturing sector but applies to developments within all civilian industries, not just manufacturing. The second indicator, routine producer services, measured employment shares in nonsophisticated producer service industries such as building services, personnel supply, and private security. The third indicator, an index of industrial diversity, was used to track the process associated with the social division of labor across local industrial sectors. The index was calculated as 1 – [Σxi
2/(Σxi)2], where xi refers to total employment in the ith of 227 civilian industries identified by the U.S. Bureau of the Census. This index ranges from 0 to 1, with higher scores indicating greater industrial diversity.
Cityscape 121
Elliott
Because labor market structure is a function of the age and educational distribution of the local workforce, as well as organizational characteristics of employers, two additional variables, the percentage of workers ages 18–24 and the percentage of high school dropouts, were included as statistical controls. These two groups are known to have high employment instability and low earnings. The percentage of non-White workers is also a common control variable in studies of interurban inequality, but its high correlation with the percentage of immigrant workers (see global-city indicators above) excluded its use here.
To assess the determinants of metropolitan labor market change, two sets of analyses for both men and women (four in all) were conducted. The first set examined changes in low-income employment between 1980 and 1990 as predicted by values of respective independent variables in 1980. The second set examined the same dependent variable, as predicted by simultaneous changes in respective independent variables between 1980 and 1990. The benefit of conducting both types of analyses is that each illuminates a distinct but related aspect of urban labor market restructuring. The first type examined structural preconditions associated with subsequent changes in local low-income employment rates; the second type examined structural processes presumed to contribute actively to these same changes. The use of both analytical strategies acknowledges that urban development is a circular process mediated by and through the very structural conditions that it helps to produce, sustain, and dismantle over time.
To meet the assumptions of ordinary least squares regression, the dependent variable corresponding to changes in local rates of low-income employment was transformed into log-odds form, where Y’ = ln(Y/1 – Y). An advantage of the log-odds ratio is that it is a continuous variable, whereas untransformed rates are restricted to a range of 0–1 (or 0–100 percent). The interpretation of the regression coefficients is less straightforward when the dependent variable is transformed in this manner, but positive coefficients still imply that increases in given independent variables correspond to increases in the dependent variable and that negative coefficients imply the opposite.
For model estimation, the following two functional forms were specified, which correspond to the two sets of analyses described earlier:
(1) Y1990j = αY1980j + β(X1980j) + ξj (1980-level predictors)
(2) Y1990j = αY1980j + β(X1990j – X1980j) + ξj (1980–1990 change predictors)
Here Y refers to the logged underemployment rate in the jth metropolitan area for the respective year; X1980j refers to the vector of explanatory factors measured in 1980 for the jth metropolitan area; X1990j – X1980j refers to the differences in explanatory factors between 1990 and 1980; and ξj refers to the residual error.
In both models lagged values of the dependent variable in 1980 were used to produce an analysis of change in the respective dependent variable (see Hanushek, 1986). If areas with high rates of low-income employment at the beginning of the period (1980) experienced larger increases after controlling for changes in the variables of substantive interest, then α would be greater than 1. If these same areas experienced smaller increases, all else being equal, then α would be less than 1, indicating regression to the mean over time.
There is a final statistical issue concerning the variance of the error term. Because the respective dependent variables are based on proportions, their variance is inversely proportional to the size of the local population, implying that the model is heteroskedastic.
122 Cityscape
The Work of Cities
To correct this problem, all models were weighted by the average of the square root of the respective metropolitan populations in 1980 and 1990 (see Maddala, 1977). For men metropolitan-area sample populations ranged from 372 to 55,915 in 1990, with a mean of 4,572 and standard deviation of 7,607. For women metropolitan-area sample sizes ranged from 391 to 50,146, with a mean of 4,056 and standard deviation of 6,619. Diagnostic analyses for respective models indicated minimal problems with collinearity.
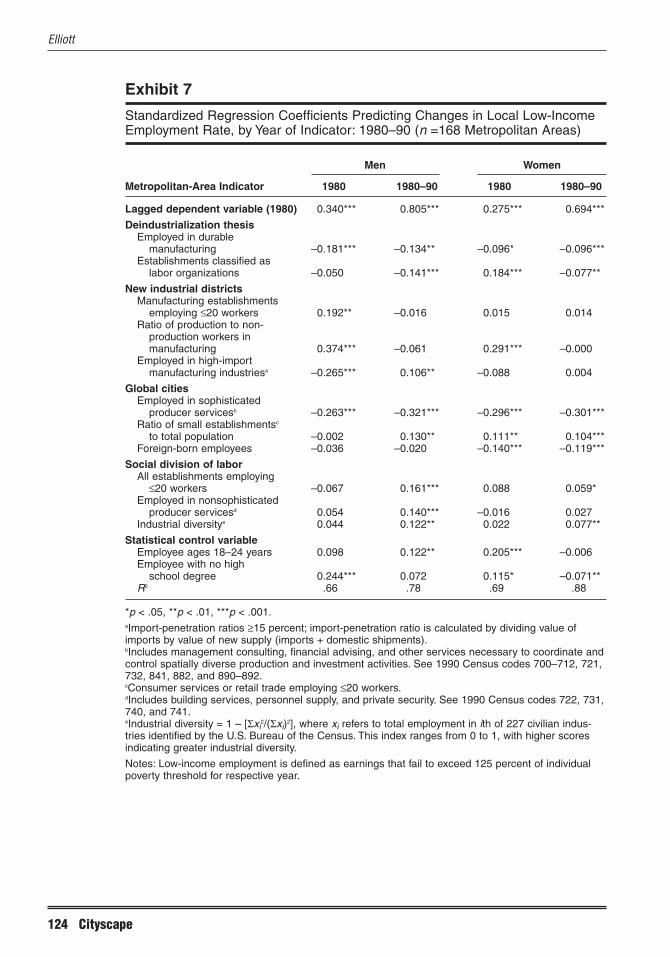
The results of model estimation appear in exhibit 7. Columns 2 and 3 report standardized coefficients for the two equations for men. In general, the deindustrialization thesis argues that areas with relatively large shares of employment in durable manufacturing in 1980 would experience the greatest increases in labor market hardship during the subsequent decade (Sheets, Nord, and Phelps, 1987). However, the results in column 2 offer no support for this expectation, showing that, on average, metropolitan areas with larger durable-manufacturing sectors in 1980 experienced smaller increases in low-income employment during the 1980s than metropolitan areas with smaller durable-manufactur-ing sectors in 1980 (–0.181, p < .001). A stronger and more consistent predictor, by far, is the ratio of production workers to nonproduction workers within the local manufacturing sector (0.375, p < .001). Proponents of the new-industrial-districts thesis would argue that this positive relationship stems from the presence of more efficient production strategies that lend themselves to the polarization of local job opportunities and marginalization of peripheral, low-skill labor. Another structural condition highly correlated with subsequent increases in low-income employment among men was the share of small establishments within the local manufacturing sector. This trend is the other indicator of externalization used in research on new industrial districts. Together these findings indicate that, in general, the organizational structure of the local manufacturing sector was more important than its overall size for explaining increases in low-income employment among men during the 1980s.
One indicator associated with the global-city thesis also showed a strong correlation with changes in local underemployment rates, but not in the expected direction. The results in column 2 of exhibit 7 indicate that relatively large employment shares in sophisticated producer services in 1980 correlated strongly with subsequent decreases in men’s labor market hardship during the 1980s (–0.263, p < .001). This finding is consistent with patterns in the earlier analysis of the urban hierarchy, which showed that nodal centers specializing in these types of producer services generally exhibited lower rates of underemployment than metropolitan areas not specializing in these types of producer services.
The results in column 2 are instructive because they highlight structural preconditions associated with subsequent increases in urban labor market hardship among men. In other words, another way to think about urban restructuring is to assess the effects of changes in these conditions over time—that is, to allow the indicators of organizational structure to covary over time with local underemployment rates. The results of this complementary analytical approach for men, presented in column 3, provide a clearer picture of the links between local organizational change and rising underemployment rates in metropolitan areas during the 1980s.
The first noticeable difference using this analytical approach is that it generally provides less consistent support to the new-industrial-districts thesis. More important than changing proportions of production workers and relative shares of small manufacturing establishments was the expanding share of workers in manufacturing industries that experienced high foreign competition. As expected, this indicator correlated positively with increases in low-income employment (0.106, p < .01). That is, as metropolitan areas employed more men in highly competitive manufacturing sectors, they experienced increases in male underemployment.
Cityscape 123
Elliott
Exhibit 7
Standardized Regression Coefficients Predicting Changes in Local Low-Income Employment Rate, by Year of Indicator: 1980–90 (n =168 Metropolitan Areas)
Men Women
Metropolitan-Area Indicator 1980 1980–90 1980 1980–90
Lagged dependent variable (1980) 0.340*** 0.805*** 0.275*** 0.694***
Deindustrialization thesis Employed in durable
manufacturing –0.181*** –0.134** –0.096* –0.096*** Establishments classified as
labor organizations –0.050 –0.141*** 0.184*** –0.077**
New industrial districts Manufacturing establishments
employing ≤20 workers 0.192** –0.016 0.015 0.014 Ratio of production to non
production workers in manufacturing 0.374*** –0.061 0.291*** –0.000
Employed in high-import manufacturing industriesa –0.265*** 0.106** –0.088 0.004
Global cities Employed in sophisticated
producer servicesb –0.263*** –0.321*** –0.296*** –0.301*** Ratio of small establishmentsc
to total population –0.002 0.130** 0.111** 0.104*** Foreign-born employees –0.036 –0.020 –0.140*** –0.119***
Social division of labor All establishments employing
≤20 workers –0.067 0.161*** 0.088 0.059* Employed in nonsophisticated
producer servicesd 0.054 0.140*** –0.016 0.027 Industrial diversitye 0.044 0.122** 0.022 0.077**
Statistical control variable Employee ages 18–24 years 0.098 0.122** 0.205*** –0.006 Employee with no high
school degree 0.244*** 0.072 0.115* –0.071** R2 .66 .78 .69 .88
*p < .05, **p < .01, ***p < .001. aImport-penetration ratios ≥15 percent; import-penetration ratio is calculated by dividing value ofimports by value of new supply (imports + domestic shipments).bIncludes management consulting, financial advising, and other services necessary to coordinate andcontrol spatially diverse production and investment activities. See 1990 Census codes 700–712, 721,732, 841, 882, and 890–892.cConsumer services or retail trade employing ≤20 workers.dIncludes building services, personnel supply, and private security. See 1990 Census codes 722, 731,740, and 741.eIndustrial diversity = 1 – [Σxi
2/(Σxi)2], where xi refers to total employment in ith of 227 civilian industries identified by the U.S. Bureau of the Census. This index ranges from 0 to 1, with higher scoresindicating greater industrial diversity.
Notes: Low-income employment is defined as earnings that fail to exceed 125 percent of individualpoverty threshold for respective year.
124 Cityscape

The Work of Cities
Again, indicators associated with the global-city literature operated in a direction generally opposite of expectation. Expanding employment in sophisticated producer services was significantly correlated with local declines in low-income jobs among male workers (–0.321, p < .001). Increases in the relative share of small consumer outlets, however, contributed modestly to low-income employment growth (0.130, p < .01).
Indicators associated with the new social division of labor, in contrast, reveal some of the strongest and most consistent correlations with rising low-income employment among men. Specifically, the growth of small establishments throughout all sectors of the local economy exerted the strongest positive (standardized) effect on men’s low-income employment rate (0.161, p < .001). Relative increases in routine producer services also exhibited a significant positive effect on low-income employment, as did industrial diversification. Together, these findings suggest that the structural underpinnings of men’s rising low-income employment during the 1980s involved a broad reorganization of production within all sectors of local economies, that is, a new social division of labor that extended beyond mere deindustrialization.
Research on urban restructuring suggests that these structural forces generally had a stronger and more detrimental impact on men’s job opportunities than women’s (Lorence and Nelson, 1993; Sheets, Nord, and Phelps, 1987). This difference is presumed to exist because women have traditionally been concentrated in local service sectors and small establishments, and therefore the relative expansion of these sectors is unlikely to alter their existing distribution of job opportunities. The results for women, shown in columns 4 and 5 of exhibit 7, challenge this conventional wisdom for the 1980s. The patterns for women were similar to those for men. Furthermore, there was a qualitative difference between the effects of sophisticated and routine producer services. Contrary to the global-city thesis, the relative presence and growth of sophisticated producer services significantly reduced the rate of low-income employment among local men and women employees. The relative presence and growth of routine producer services, however, increased the rate of low-income employment among men but not women. These patterns indicate that gender differences in the effects of producer service expansion on low-income employment were largely a function of routine producer services, not of sophisticated business services or the producer services sector as a whole.
In summary, these analyses illuminate several patterns undocumented in prior research. First, they show that quantitative declines in manufacturing employment were far from the dominant factor explaining increasing low-income employment in U.S. metropolitan areas during the 1980s. In fact, the size and growth of local manufacturing activities appeared to decrease local underemployment rates for both men and women, opposite of what the deindustrialization thesis generally would have predicted. More significant for men were changes in the organization, rather than the size, of the local manufacturing base and the transformation of production units throughout the metropolitan-area economy, as indicated by the relative proliferation of small establishments, growth of routine producer services, and overall industrial diversification. Patterns for women generally paralleled those for men.
Although, overall, these findings do not refute the deindustrialization thesis, they do place it in much-needed perspective. They also caution against applying lessons from global-city research too broadly. Although theorists and policymakers are fond of reporting that all places are becoming more global in nature, neither growth in sophisticated producer services nor immigration appears to increase local rates of low-income employment in U.S. metropolitan areas in general. In fact, the opposite appears to be true. These
Cityscape 125

Elliott
findings make the point that most U.S. cities are neither like New York City nor likely to follow its developmental trajectory. To the extent that places further down the urban hierarchy are involved in the new world economy and to the extent that this involvement contributes to local earnings inequality, the most likely link between the two developments appears to lie in the expansion of locally oriented divisions of labor rather than in the development of new globally oriented service functions.
Discussion and Conclusion Rising rates of low-income employment in major U.S. cities cannot be fully understood by looking strictly at the characteristics and behavior of individual workers. Organizational processes that structure the number and types of jobs available to these workers must also be recognized. This article suggests that one such process involves the changing role of cities in the organization of production and employment. This section reviews the findings of this analysis and their significance, and then addresses three policy questions: Is urban underemployment inevitable? Why is urban underemployment increasing? Would raising the minimum wage help to decrease underemployment?
The most important finding in these analyses is the confirmation that underemployment in U.S. metropolitan areas has been rising in recent decades. By 1990 12.7 million metro-politan-area workers not otherwise enrolled in school or self-employed failed to take home earnings above the individual poverty threshold despite active attachment to the labor force—up 35 percent from 1970, net of labor force growth. If this expansion in low-income employment reflected workers’ growing preference for part-time and part-year work, it would offer little cause for concern. But it does not. By 1990 the bulk of workers experiencing part-time and intermittent underemployment were citing economic, or structural, reasons for their lack of full-time employment, not personal or family reasons (analyses not shown). Moreover, an increasing share of the metropolitan-area underemployed are members of poor families, dispelling the myth that rising low-income employment is driven by secondary workers from middle-class families.
The first set of empirical analyses used to investigate the structural underpinnings of this development revealed that relatively little of the observed changes in underemployment during either the 1950–70 period or the 1970–90 period could be explained by shifts of workers across industrial sectors (for example, from manufacturing to services). Instead, underemployment decline during the 1950–70 period and its subsequent increase during the 1970–90 period derived primarily from the reorganization of employment relations within industrial sectors. This trend held true for the metropolitan-area labor force as a whole and also for constituent racial and gender groups (analyses not shown).
The second set of analyses showed that underemployment trends have varied significantly throughout the urban hierarchy during the post-World War II era. They further show that local underemployment rates have been consistently highest in peripheral manufacturing centers toward the bottom of the urban hierarchy and consistently lowest in metropolitan areas at the very top. This finding stands as an important corrective to recent research on global cities, which implies that underemployment is growing most rapidly and reaching its highest levels in the nation’s leading urban centers—places such as New York, Chicago, and Los Angeles. This simply is not true and has not been for quite some time.
The third set of analyses, which explored the structural determinants of local underemployment trends among a wide range of U.S. metropolitan areas during the 1980s, revealed a number of generalizable insights. First, deindustrialization and vertical disintegration of local manufacturing sectors have exerted mixed and generally weak effects on male and female underemployment. Moreover, supplemental analyses (not shown)
126 Cityscape
The Work of Cities
indicated that these effects are most discernable in small, not large, metropolitan areas. This conditional effect provides further indication that underemployment is rising fastest in places often ignored by researchers of urban-industrial restructuring. With respect to producer services, results also indicate that the growth of sophisticated functions, such as financial services, managerial consulting, and public relations, has generally suppressed underemployment growth within local metropolitan areas, as have relative increases in the sizes of local immigrant workforces. Together, these findings caution against directly applying lessons drawn from new industrial districts and global cities to metropolitan areas in general.
However, there are structural processes that appear to consistently increase the likelihood of rising underemployment across a wide range of places. In addition to relative declines in local labor organizations, the expansion of routine producer services, such as building maintenance, temporary staffing, and private security, positively correlated with rising underemployment for both men and women. This was also true of relative increases in the number of small local establishments, regardless of industrial sector. These developments might be interpreted as part of a more general expansion of the local social division of labor across, as well as within, industrial sectors that is now occurring throughout the urban system. The notion that connections exist between this general process and rising underemployment receives additional support from the finding that local industrial diversification also contributed to increases in local underemployment rates among both men and women during the 1980s. Together, these findings raise several policy-oriented questions.
Is Urban Underemployment Inevitable? Urban centers have long been known for their ability to generate and absorb large shares of low-income employment, yet during the mid-1900s something happened that altered the way Americans viewed these issues: Urban underemployment began to fall dramatically. In hindsight, it is clear that this development reflected the establishment of social contracts among workers and employers in various sectors of the economy and the spread of unionization, but something else occurred as well. As these social contracts emerged, they pushed the issue of urban underemployment away from mainstream concern. Rather than being a class issue, low-income and intermittent work became “traits” associated with marginal social groups. By the late 1960s the underemployed were Liebow’s (1967) African-American street-corner men, and vice versa.
This development combined with the individualistic foundations of American society to mask the structural determinants of low-income employment and even to make the problem seem inevitable. (After all, there will always be some people too undisciplined to fend adequately for themselves.) But if there is a lesson to be learned from the post-World War II era, it should not be that underemployment is endemic to particular social groups but that it has the potential to go down, way down, and the chief obstacle is not economic stagnation. Domestic firms continue to post record profits, just as they did during the 1950s and 1960s.4 Now, however, they share these profits almost exclusively with stockholders and a small class of highly trained professionals, rather than passing them along, however modestly, to workers toward the bottom of the occupational hierarchy.
Why Is Urban Underemployment Increasing? Fully understanding rising urban underemployment requires the recognition of its structural underpinnings. This recognition begins with the point that low-income employment is neither random nor inevitable but to a large extent is managerially designed and organizationally driven. This perspective does not imply that personal initiative is
Cityscape 127

Elliott
inconsequential or that low-income employment is simply a matter of capital exploiting labor. Rather, it acknowledges the fact that most jobs are structured with specific levels of access, pay, and employer commitment long before they are filled by specific workers. Once this point is acknowledged, it becomes easier to see how viewing underemployment strictly in terms of individual characteristics misses a big piece of the puzzle. However, to swing to the opposite extreme and to conclude that underemployment is simply a matter of class exploitation would be equally misleading.
Once the structural explanation is recognized, it becomes clear that businesses face other organizational challenges besides reducing labor costs. Firms must also respond to changing product technologies and market conditions brought on by the new world economy. These responses, in turn, affect the size and structure of urban labor markets, although these responses are often initiated for reasons other than labor cost and control. Chief among these reasons is heightened interfirm competition, or capital-capital relations, which both reflects and constitutes more general processes of economic globalization. These processes are now encouraging widespread experimentation with new ways to divide, integrate, and support modern production systems. It is through, over, and around these new divisions that urban agglomerations remain salient for economic development and help explain the structural determinants of rising underemployment.
As forms of social organization, urban areas both enable and reflect new strategies of capital accumulation, providing industries and firms with social resources needed to maximize flexibility and minimize central control. The outcomes of these processes have not only contributed to the new social division of labor within local metropolitan areas in recent years but also taken many workers out of large, hierarchically structured internal labor markets and redistributed them across an expanding array of industries characterized by smaller workplaces. Appreciating how these developments contribute to urban underemployment requires acknowledging that ownership is not the sole root of economic power. Power also derives from an individual’s positions in the technical and social divisions of labor, that is, from the opportunities afforded and the constraints imposed by the existing modes of integration and coordination.
To view the expanding social division of labor within metropolitan areas through the lens of shifting organizational structures is to see it not only as an integral part of contemporary capitalist and urban development but also as an important social process in its own right. It is a process that pries apart, elevates, and subordinates workers even as it renders them increasingly interdependent. In other words, contrary to claims of classical economics, the division of labor, rather than being neutral, contains within it the seeds of social relations that imply very different levels of control over the organization of production and its rewards. When these levels of control are separated organizationally and spatially into growing numbers of small and industrially diverse workplaces, flexibility may increase, but so does the number of jobs that have little control, or even access to control, over the broader organization of production. In addition, most small companies and establishments survive by doing things that larger companies fail to do well (such as serving local markets, producing specialized goods and services, and exploiting marginal labor forces), further reinforcing this lack of control.
Will Raising the Minimum Wage Help To Decrease Underemployment? One possible strategy for dealing with the problem of rising underemployment might be raising the minimum wage. This strategy would seem to provide a remedy that covers the
128 Cityscape

The Work of Cities
broad range of low-income jobs, thus avoiding the sticky details of collective bargaining, pay structures, and tax codes. Minimum-wage increases are also more palatable ideologically to most Americans than calls for sharpening the progressive redistribution of earnings. For example, in October 1996, when President Clinton proposed to raise the minimum wage by 50 cents to $4.25, polls showed that 80 percent of voters agreed with the initiative. Still, increasing the minimum wage remains a contentious issue among the nation’s political leaders. Although Democratic Senator Edward Kennedy has called it “the overarching issue of our time,” Republican Representative Richard Armey has vowed to fight further increases with “every fiber” of his being (Kilborn, 1997).
Political considerations aside, increases in the minimum wage seem unlikely to lead to substantial declines in underemployment. One reason is that many low-income employers simply ignore the minimum-wage law. Alan Krueger estimates that as many as 3 million workers are paid less than minimum wage. He explains that “violating the minimum-wage laws has a certain economic logic to it because an employer, if caught, usually has to pay only the back wages that are due. Penalties are generally levied only on repeat or extreme violators” (Sherrill, 1997). Enforcement is also weakened by the fact that the U.S. Labor Department’s team of inspectors consists of only approximately 500 inspectors to police more than 6 million (and rising) workplaces with respect not only to mini-mum-wage violations but also to overtime violations, child-labor abuses, and other illegal labor practices.
More important, however, an increase in the minimum wage fails to address rising part-time and intermittent underemployment. To be truly effective, new policies must also review and reform outdated legislation that still presumes a world filled largely by full-time workers with one lifelong employer.5 That is, policymakers must help to create the kind of flexibility that benefits workers as well as employers. This approach means tackling the complex issues pertaining to involuntary part-time jobs, long-term temporary assignments, and multiple-job holding by workers who want and need full-time jobs. Ideally, this effort would address not only annual earnings but also basic social welfare needs, including health care, paid leaves, and pensions, which are still largely assumed to be tied to the traditional employer-employee relationship.
In addressing these issues, the critical question is not whether the emerging patterns of production and labor market flexibility are good or bad, but who will bear their costs and how society can reconcile new forms of organizational flexibility with the lives of urban workers. How society chooses to address these issues will help shape what it means to live and work in America’s major urban centers in the 21st Century.
Acknowledgments This research was conducted with support from a doctoral dissertation research grant in 1996 from HUD’s Office of University Partnerships. In 1997 it received the Katherine DuPre Lumpkin Award for outstanding dissertation from the University of Wisconsin Sociology Department. Special thanks go to committee members who offered valuable feedback on the project: Franklin Wilson, Leann Tigges, Robert Mare, Gary Sandefur, and Peter Eisinger.
Author James R. Elliott is an assistant professor of sociology at Tulane University in New Orleans. Currently he is conducting research on race, gender, and workplace power and on immigrant churning to and through established gateway cities.
Cityscape 129

Elliott
Notes 1. This literature emphasizes the distinction between social divisions of labor that occur
across organizational, or firm, boundaries and technical divisions of labor that occur within them.
2. To emphasize the correspondence between Noyelle and Stanback’s national nodes and contemporary conceptualizations of global cities, the latter term is used throughout the remainder of the study. All other metropolitan-area types retain Noyelle and Stanback’s original labels.
3. A focus on urban hierarchy and low-income employment raises the question of whether the earnings threshold used to determine inadequate, or low-income, employment should be adjusted for interurban variations in the cost of living. This research does not make such cost-of-living adjustments for several reasons: (1) to the extent that they exist, cost-of-living differences among metropolitan areas constitute a key dimension of the urban hierarchy, and thus to correct for these differences would interfere with examining variation in the hierarchy; (2) the purpose of this analysis is to draw attention to the ability of individual workers to earn wages and salaries in the formal economy rather than to assess what these wages and salaries would purchase locally; (3) cost of living is likely to vary as much within a given metropolitan area (for example, between elite suburban communities and working-class inner-city neighborhoods) as among metropolitan-area types, thereby confounding attempts to construct valid measures for given areas over the past four decades; and (4) data on intermetropolitan-area differences in the cost of living are incomplete for 1990 and 1970 and nonexistent for 1950.
4. Former Labor Secretary Robert Riech (1997) estimates that if profits from the 1995 stock market had been equally redistributed, every family in the United States would have received a check for $5,000.
5. Consider the following examples: Taft-Hartley’s ban on secondary boycotts makes it difficult for subcontracted workers to protest collectively against their leasing employer. Federal law allows companies to exclude from their pension plan workers who are employed fewer than 1,000 hours a year. An unemployed worker must meet a minimum-earnings test to qualify for benefits, but in half the states, the average part-time worker does not earn enough to pass the test.
References Betz, D. 1972. “The city as a system generating income inequality,” Social Forces 51:192–199.
Bluestone, Barry, and Bennett Harrison. 1982. The deindustrialization of America: Plant closings, community abandonment, and the dismantling of basic industry. New York: Basic Books.
Bourne, Larry, ed. 1982. Internal structure of the city: Readings on urban form, growth, and policy. 2nd ed. New York: Oxford University Press.
Esparza, Adrian, and Andrew Krmenec. 1994. “Producer services trade in city systems: Evidence from Chicago,” Urban Studies 31(1):29–46.
Fevre, Ralph. 1991. Emerging ‘alternatives’ to full-time and permanent employment. In Poor work: Disadvantage and the division of labor, edited by Phillip Brown and Richard Scase. Bristol, PA: Open University Press.
130 Cityscape

The Work of Cities
Friedmann, John, and Goetz Wolff. 1982. “World city formation: An agenda for researchand action,” International Journal of Urban and Regional Studies 15(1):269–283.
Fuguitt, Glenn, and James Zuiches. 1975. “Residential preferences and population redistribution,” Demography 12(3):491–504.
Gates, Bill. 1995. The road ahead. New York: Viking.
Grubb, W. Norton, and Robert Wilson. 1992. “Trends in wage and salary inequality,1967–88,” Monthly Labor Review (June): 23–39.
Hanushek, Eric A. 1986. “The economics of schooling: Production and efficiency inpublic schools,” Journal of Economic Literature 24:1141–1177.
Harrison, Bennett. 1994. Lean and mean: The changing landscape of corporate power inthe age of flexibility. New York: Basic Books.
———. 1991. “Industrial districts: Old wine in new bottles?” Regional Studies 26(5):469–483.
Harrison, Bennett, and Barry Bluestone. 1988. The great U-turn: Corporate restructuringand the polarizing of America. New York: Basic Books.
Kie, Clayton, and Martin Hynes. 1996. “Where is the disintegration?” Growth andChange (winter): 29–46.
Kilborn, Peter. 1997. A minimal-impact minimum wage. New York Times, 6 April, E5.
Kitagawa, Evelyn. 1955. “Components of a difference between two rates,” AmericanStatistical Association Journal 50 (December): 1164–1194.
Liebow, Elliot. 1967. Tally’s corner: A study of Negro streetcorner men. Boston, MA:Little, Brown.
Lincoln, J. 1978. “Community structure and industrial conflict: An analysis of strikeactivity in SMSAs,” American Sociological Review 43:199–220.
Lorence, Jon, and Joel Nelson. 1993. “Industrial restructuring and metropolitan earningsinequality, 1970–1980,” Research in Social Stratification and Mobility 12:145–184.
Loveman, Gary, and Chris Tilly. 1988. “Good jobs or bad jobs: What does the evidencesay?” New England Economic Review (January/February): 46–65.
Maddala, G.S. 1977. Econometrics. New York: McGraw-Hill.
Michon, F. 1987. “Time and flexibility: Working time in the debate on flexibility,”Labour and Society 12(1):153–174.
Mollenkopf, John, and Manuel Castells, eds. 1991. The dual city: Restructuring NewYork. New York: Russell Sage Foundation.
National Bureau of Economic Research. 1996. NBER trade database: U.S. Imports andExports by 4-digit SIC Industries, 1958–1992. Machine-readable data file. Cambridge, MA: National Bureau of Economic Research.
Cityscape 131

Elliott
Nolan, Richard. 1986. Foreign competition and its regional effects on U.S. manufacturing employment. Staff Report No. AGES860731. Agriculture and Rural Economics Division, Economic Research Service. Washington, DC: U.S. Department of Agriculture.
Nord, Stephen, and Robert Sheets. 1992. Service industries and the working poor in major metropolitan areas in the United States. In Sources of metropolitan growth, edited by Edwin Mills and Mary MacDonald. New Brunswick, NJ: Center for Urban Policy Research.
Nord, Stephen, J. Phelps, and R. Sheets. 1988. “An analysis of the economic impact of the service sector on underemployment in major metropolitan areas in the United States,” Urban Studies 25 (October): 418–432.
Noyelle, Thierry, and Thomas Stanback. 1983. The economic transformation of American cities. Totowa, NJ: Rowman and Allanheld.
Pollert, Anna. 1988. “The flexible firm: Fixation or fact?” Work, Employment and Society 2: 281–316.
Porter, Michael. 1990. The competitive advantage of nations. New York: Free Press.
Pred, Allan. 1977. City systems in advanced economies. New York: Halsted Press.
Reich, Robert. 1997. Locked in the cabinet. New York: Knopf.
Richardson, H. 1973. The economics of urban size. Lexington, MA: Lexington Books.
Sassen, Saskia. 1994. Cities in a world economy. Thousand Oaks, CA: Pine Forge Press.
———. 1991. The global city: New York, London, Tokyo. Princeton, NJ: Princeton University Press.
Sayer, Andrew, and Richard Walker. 1992. The new social economy: Reworking the division of labor. Cambridge, MA: Blackwell.
Schoepfle, Gregory. 1982. “Imports and domestic employment: Identifying affectedindustries,” Monthly Labor Review 105(8):13–26.
Scott, Allen. 1988a. Metropolis: From the division of labor to urban form. Berkeley: University of California Press.
———. 1988b. New industrial spaces: Flexible production organization and regionaldevelopment in North America and Western Europe. London: Pion.
———. 1986. “High technology industry and territorial development: The rise of theOrange County complex,” Urban Geography 7:3–45.
Sheets, Robert, Stephen Nord, and John Phelps. 1987. The impact of services industrieson underemployment in metropolitan economies. Lexington, MA: Lexington Books.
Sherrill, Robert. 1997. A year in corporate crime. The Nation, 7 April, p. 17.
Singelmann, Joachim. 1978. From agriculture to services: The transformation of industrial employment. Beverly Hills, CA: Sage.
132 Cityscape

The Work of Cities
Singelmann, Joachim, and Harley Browning. 1980. “Industrial transformation and occupational change in the U.S., 1960–70,” Social Forces 59(1):246–264.
Soja, Edward. 1995. Postmodern urbanization: The six restructurings of Los Angeles. In Postmodern cities and spaces, edited by S. Watson and K. Gibson. Oxford, UK: Blackwell.
Storper, Michael, and Allen Scott. 1989. The geographical foundations and social regulation of flexible production complexes. In The Power of geography: How territory shapes social life, edited by J. Wolch and M. Dear. Winchester, MA: Unwin Hyman.
Thompson, W. 1965. A preface to urban economics. Baltimore, MD: Johns Hopkins University Press.
Tigges, Leann M., and Deborah Tootle. 1993. “Underemployment and racial competition in local labor markets,” The Sociological Quarterly 34(2):279–298.
U.S. Bureau of the Census. 1992a. Census of population and housing, 1990: Public use microdata sample. Machine-readable data file. Washington, DC: Bureau of the Census.
———. 1992b. U.S. county business patterns 1990. Machine-readable data files. Washington, DC: Bureau of the Census.
———. 1984. Census of population and housing, 1950: Public use microdata sample. Machine-readable data file. Washington, DC: Bureau of the Census.
———. 1983. Census of population and housing, 1980: Public use microdata sample. Machine-readable data file. Washington, DC: Bureau of the Census.
———. 1982. U.S. county business patterns 1980. Machine-readable data files. Washington, DC: Bureau of the Census.
———. 1973. Census of population and housing, 1970: Public use microdata sample. Machine-readable data file. Washington, DC: Bureau of the Census.
U.S. Department of Commerce. 1990. Current population survey. Washington, DC: Bureau of the Census.
Walker, R. 1996. “Another round of globalization in San Francisco,” Urban Geography 17(1):60–94.
Cityscape 133