The Wisdom of the Network: How Adaptive Networks Promote ...The Wisdom of the Network: How Adaptive...
42
The Wisdom of the Network: How Adaptive Networks Promote Collective Intelligence Abdullah Almaatouq 1† , Alejandro Noriega Campero 1† , P. M. Krafft 2 , Abdulrahman Alotaibi 1 , Mehdi Moussaid 3 , Alex (Sandy) Pentland 1* 1 Massachusetts Institute of Technology, Cambridge, MA, USA 2 Oxford Internet Institute, University of Oxford, Oxford, UK 3 Max Planck Institute for Human Development, Berlin, Germany † Authors contributed equally to this work * To whom correspondence should be addressed; E-mail: [email protected] Social networks continuously change as new ties are created and existing ones fade. It is widely noted that our social embedding exerts a strong influence on what information we receive and how we form beliefs and make decisions. However, most empirical studies on the role of social networks in collective in- telligence have overlooked the dynamic nature of social networks and its role in fostering adaptive collective intelligence. It has remained unknown (1) how network structures adapt to the attributes of individuals, and (2) whether this adaptation promotes the accuracy of individual and collective decisions. Here, we answer these questions through a series of behavioral experiments and sup- porting simulations. Our results reveal that social network plasticity, in the presence of feedback, can adapt to biased and changing information environ- ments, and produce collective estimates that are more accurate than their best- performing member. We explore two mechanisms that explain these results: (1) a global adaptation mechanism where the structural connectivity of the network itself changes such that it amplifies the estimates of high-performing members within the group; (2) a local adaptation mechanism where accurate individuals are more resistant to social influence, and therefore their initial belief is weighted in the collective estimate disproportionately. Thereby, our findings substantiate the role of social network plasticity and feedback as key adaptive mechanisms for refining individual and collective judgments. 1 arXiv:1805.04766v4 [cs.SI] 29 May 2020
Transcript of The Wisdom of the Network: How Adaptive Networks Promote ...The Wisdom of the Network: How Adaptive...

The Wisdom of the Network: How Adaptive NetworksPromote Collective Intelligence
Abdullah Almaatouq1†, Alejandro Noriega Campero1†, P. M. Krafft2,Abdulrahman Alotaibi1, Mehdi Moussaid3, Alex (Sandy) Pentland1∗
1Massachusetts Institute of Technology, Cambridge, MA, USA2Oxford Internet Institute, University of Oxford, Oxford, UK
3Max Planck Institute for Human Development, Berlin, Germany† Authors contributed equally to this work
∗ To whom correspondence should be addressed; E-mail: [email protected]
Social networks continuously change as new ties are created and existing onesfade. It is widely noted that our social embedding exerts a strong influenceon what information we receive and how we form beliefs and make decisions.However, most empirical studies on the role of social networks in collective in-telligence have overlooked the dynamic nature of social networks and its rolein fostering adaptive collective intelligence. It has remained unknown (1) hownetwork structures adapt to the attributes of individuals, and (2) whether thisadaptation promotes the accuracy of individual and collective decisions. Here,we answer these questions through a series of behavioral experiments and sup-porting simulations. Our results reveal that social network plasticity, in thepresence of feedback, can adapt to biased and changing information environ-ments, and produce collective estimates that are more accurate than their best-performing member. We explore two mechanisms that explain these results:(1) a global adaptation mechanism where the structural connectivity of thenetwork itself changes such that it amplifies the estimates of high-performingmembers within the group; (2) a local adaptation mechanism where accurateindividuals are more resistant to social influence, and therefore their initialbelief is weighted in the collective estimate disproportionately. Thereby, ourfindings substantiate the role of social network plasticity and feedback as keyadaptive mechanisms for refining individual and collective judgments.
1
arX
iv:1
805.
0476
6v4
[cs
.SI]
29
May
202
0

Intelligent systems, both natural and artificial, rely on feedback and the ability to reorgan-
ize (1, 2). Such systems are widespread, and can often be viewed as networks of interacting
entities that dynamically evolve. Cell reproduction, for example, relies on protein networks to
combine sensory inputs into gene expression choices adapted to environmental conditions (3).
Neurons in the brain dynamically rewire in response to environmental tasks to enable human
learning (4). Eusocial insects modify their interaction structures in the face of environmental
hazards as a strategy for collective resilience (5). Fish schools collectively encode information
about the perceived predation risk in their environment by changing the structural connectivity
of their interaction (2). In the artificial realm, several machine learning algorithms rely on sim-
ilar concepts, where dynamically updated networks guided by feedback integrate input signals
into useful output (6). Across the board, the combination of network plasticity (i.e., the ability
to reorganize) and environmental feedback (e.g., survival, payoff, reputation, in-sample error)
represent a widespread strategy for collective adaptability in the face of environmental changes;
providing groups with a practical and easy-to-implement mechanism of encoding information
about the external environment (2, 5).
The emergent ability of interacting human groups to process information about their en-
vironment is no exception. People’s behavior, opinion formation, and decision-making are
deeply rooted in cumulative bodies of social information, accessed through social networks
formed by choices of whom we befriend (7), imitate (8), trust (9, 10), and cooperate with (11).
Moreover, peer choices are frequently revised, most often based on notions of environmental
cues such as success and reliability, or proxies such as reputation, popularity, prestige, and
socio-demographics (12–15). Human social network ability to reorganize in response to feed-
back has been shown to promote human cooperation (11,15,16) and allows cultural transmission
networks over generations to develop technologies above any individual’s capabilities (17, 18).
It is widely noted, however, that social influence strongly correlates individuals’ judgment
2
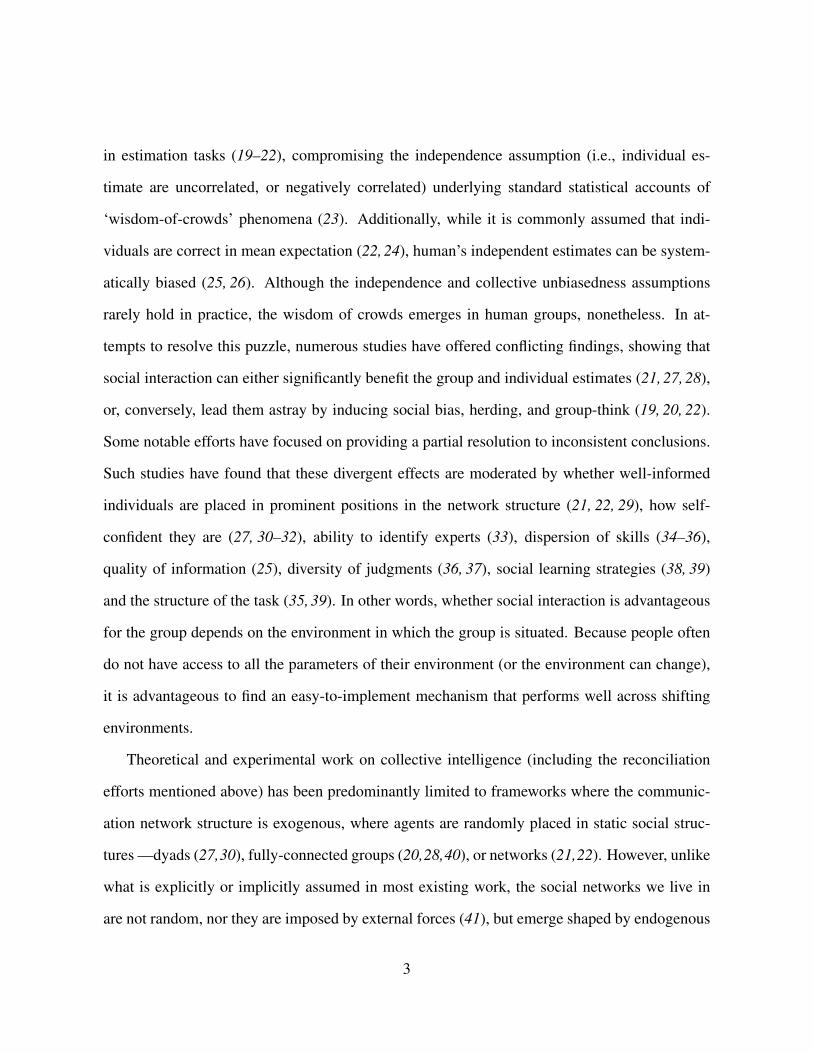
in estimation tasks (19–22), compromising the independence assumption (i.e., individual es-
timate are uncorrelated, or negatively correlated) underlying standard statistical accounts of
‘wisdom-of-crowds’ phenomena (23). Additionally, while it is commonly assumed that indi-
viduals are correct in mean expectation (22, 24), human’s independent estimates can be system-
atically biased (25, 26). Although the independence and collective unbiasedness assumptions
rarely hold in practice, the wisdom of crowds emerges in human groups, nonetheless. In at-
tempts to resolve this puzzle, numerous studies have offered conflicting findings, showing that
social interaction can either significantly benefit the group and individual estimates (21, 27, 28),
or, conversely, lead them astray by inducing social bias, herding, and group-think (19, 20, 22).
Some notable efforts have focused on providing a partial resolution to inconsistent conclusions.
Such studies have found that these divergent effects are moderated by whether well-informed
individuals are placed in prominent positions in the network structure (21, 22, 29), how self-
confident they are (27, 30–32), ability to identify experts (33), dispersion of skills (34–36),
quality of information (25), diversity of judgments (36, 37), social learning strategies (38, 39)
and the structure of the task (35, 39). In other words, whether social interaction is advantageous
for the group depends on the environment in which the group is situated. Because people often
do not have access to all the parameters of their environment (or the environment can change),
it is advantageous to find an easy-to-implement mechanism that performs well across shifting
environments.
Theoretical and experimental work on collective intelligence (including the reconciliation
efforts mentioned above) has been predominantly limited to frameworks where the communic-
ation network structure is exogenous, where agents are randomly placed in static social struc-
tures —dyads (27,30), fully-connected groups (20,28,40), or networks (21,22). However, unlike
what is explicitly or implicitly assumed in most existing work, the social networks we live in
are not random, nor they are imposed by external forces (41), but emerge shaped by endogenous
3

social processes and gradual evolution within a potentially non-stationary social system. The
present study builds on the observation that agent characteristics, such as skill and informa-
tion access, are not randomly located in network structure. Intuitively, groups can benefit from
awarding centrality to—and amplifying the influence of—well-informed individuals. Therefore,
the distribution of agents is often the outcome of social heuristics that form and break ties influ-
enced by social and environmental cues (12–14,42), and therefore, the emergent structure cannot
be decoupled from the structure of the environment. Hence, we hypothesize that dynamic social
influence networks guided by feedback may be central to collective human intelligence, acting
as core mechanisms by which groups, which may not initially be wise, evolve into wisdom,
adapting to biased and potentially non-stationary information environments.
Study Design
To test the hypothesis that dynamic social influence networks guided by feedback may be central
to collective human intelligence, we developed two web-based experiments (i.e., E1 and E2)
and a simulation model to identify the role of dynamic networks and feedback in fostering
adaptive ‘wisdom of crowds.’ In the two experiments, participants from Amazon Mechanical
Turk (NE1 = 719;NE2 = 702) engaged in a sequence of 20 estimation tasks. Each task consisted
of estimating the correlation of a scatter plot, and monetary prizes were awarded in proportion
to performance at the end of the experiment. Participants were randomly allocated to groups of
12. Each group was randomized to one of three treatment conditions in E1 where we varied the
network plasticity or four treatment conditions in E2 where we varied the quality of feedback.
Fig. 1A illustrates the overall experimental design. To assess the generality of our findings and
tune our intuition, we also simulated a dynamical model of interacting agents in a context similar
to our experiments.
4

High Low
r = 0.09 r = 0.09
r = 0.78 r = 0.78 r = 0.78
A
B
r = 0.09
Medium
Task Social learning Feedback
Your answer: 0.3
Correct answer: 0.4
You earned: $0.9
Network plasticity
follow/unfollow
Experiment 1Manipulates plasticity
Experiment 2Manipulates feedback
Shock in signal qualityafter the 10th round
Examples of the experimental task and the signal quality levels
High
Medium
Low
Figure 1: Experimental design. Panel (A) illustrates examples of the scatter plots used in theexperiment. For any given round, all participants saw plots that shared an identical true cor-relation, but signal quality could differ among them. Task signal quality, therefore, could bevaried systematically at the individual level by varying the number of points, linearity, and theexistence of outliers. Participants were not informed about the signal quality they or other parti-cipants were facing. Panel (B) shows an illustration of the experimental design. In experiment 1,the feedback level is fixed (i.e., full-feedback), and network plasticity is manipulated (i.e., staticnetwork versus dynamic network). In experiment 2, plasticity is fixed (i.e., always dynamic net-work), and feedback is manipulated (i.e., no-feedback, self-feedback, and full-feedback). Thecolors of the nodes represent the signal quality. Each participant experienced a constant sig-nal quality level across the first ten rounds; then, at round eleven, we introduced a shock byreshuffling signal qualities to new levels that stayed constant for the remaining ten rounds.
5

Estimation Task: Guess the correlation game
Earlier work demonstrated that estimating the correlation in scatterplots is an intuitive perceptual
task that can be leveraged to investigate various aspects of our visual intelligence (43). We
chose this judgment task for two reasons. First, the task can be carried out rapidly without
requiring participants to have specialized skills (43). Second, the task structure is simple enough
to vary systematically, while still being rich enough to manipulate the quality of the information
provided to the participants. In particular, we used scatter plots with three levels of signal
quality (varying the number of points and adding outliers or non-linearities; see Fig. 1B;). At
every round, all plots seen by participants shared an identical actual correlation, but the quality
of the signal could differ among them (Cf. (44)). The design also allowed the simulation of
a shock to the distribution of information among participants. Specifically, each participant
experienced a constant signal quality level across the first ten rounds; then, at round eleven, we
introduced a shock by reshuffling signal qualities to new levels that remained constant after that.
Participants were not informed about the signal quality they or their peers faced (see SI Section 1
and Figs. S1-S2 for more details).
Experiment 1 (E1): Varies network plasticity; holds feedback
In the first experiment (E1, N = 719), each group was randomized to one of three treatment
conditions: a solo condition, where each individual solved the sequence of tasks in isolation; a
static network condition, in which participants were randomly placed in static communication
networks; and a dynamic network condition, in which participants at each round were allowed
to select up to three neighbors to communicate with. Across all conditions, at each round, par-
ticipants were initially asked to submit an independent guess. Then those in static and dynamic
network conditions entered a social exposure stage, where they could observe the answers of
their network peers, update their own, and see peers’ updated beliefs in real-time. After sub-
6

mitting a final guess, participants in all conditions were given performance feedback. Lastly,
those in the dynamic network condition were allowed to revise which peers to follow in sub-
sequent rounds (see Fig. S3 for the experimental design and Figs. S4-S8 for the online platform
screenshots).
Experiment 2 (E2): Varies feedback; holds dynamic network
In the second experiment (E2, N = 702), each group was randomized to one of four treatment
conditions: a solo condition, where each individual solved the sequence of tasks in isolation,
but this time they were not provided with any performance feedback; a no-feedback condition,
in which participants placed in a network but were not shown any performance feedback; a
self-feedback condition, in which participants were placed in a network and shown their own
performance feedback; and a full-feedback condition, in which participants were placed in a
network and shown performance feedback of all participants (including their own). Participants
in all conditions inE2 were allowed to revise which peers to follow in subsequent rounds, except
for the solo conditions, which acted as our baseline.
Simulation: Varies environmental shock and rewiring rates
Finally, we simulated interacting agents that update beliefs according to a DeGroot process (45),
and rewire social connections according to a performance-based preferential attachment pro-
cess (46) (see SI Section 2 for model details). Using this model, we explored the effect of
plasticity and the quality of feedback to provide further support to our experimental findings,
examine the robustness of our findings under different parameter values, and tune our intuition.
In these simulations, we also explored the interaction between network adaptation rates—a net-
work’s sensitivity to changes in agents’ performance—and the rate of environmental changes.
7

Results
Individual and collective outcomes
We first compared individual- and group-level errors across conditions. Our first result is that
networked groups across studies and conditions significantly outperformed equally sized groups
of independent participants, which is consistent with prior work on complex tasks (47,48) as well
as estimation tasks (21). Fig. 2 show the individual and group error rates—using the arithmetic
mean as group estimate—normalized with respect to baseline errors in the solo condition of
the particular study. Overall, we find that participants in dynamic networks with full-feedback
achieved the lowest error rates in both experiments. The dynamic networks, in the presence
of feedback, gradually adapted over the course of the experiment. The performance edge was
larger in periods where networks had adapted to their information environment (i.e., rounds
[6, 10] ∪ [16, 20]), which we will refer to as the adapted periods.
In particular, in E1 dynamic networks averaged 17% lower individual error (β = −0.038,
z = −4.64, P < 10−5), and 18% lower group error (β = −0.03, z = −3.25, P = 0.001),
compared to participants in static networks. In the adapted periods, dynamic networks reduced
individual error by 36% (β = −0.05, z = −6.56, P << 10−6) and group error by 40%
(β = −0.04, z = −4.44, P < 10−5). See Table S1.
8

Experiment 1: Varying Plasticity Experiment 2: Varying Feedback
Shock
Shock
Shock
Shock
Solo Static network Solo No-feedback Self-feedback
Round Round
A
B
C
D
Dynamic network Full-feedback
Figure 2: Individual and collective outcomes. Groups connected by dynamic influence net-works and provided with feedback incur substantially lower individual errors as shown in Panels(A) and (C) and lower collective errors in Panels (B) and (D). The reduction is notably largerand more significant in periods where networks had adapted to the information environment(i.e., rounds [6, 10] and [16, 20]). Errors are normalized with respect to the errors in the solocondition. Error bars indicate 95% confidence intervals.
Our simulation results corroborate this experimental result. We find that dynamic networks
in the presence of feedback adapted to changes in the information environment by shifting influ-
ence to agents with better information, substantially decreasing individual and group error over
unconnected groups (see Fig. S10).
InE2, having self-feedback marginally reduced the overall individual error (7%; β = −0.015,
z = −1.38, P = 0.17) and significantly in the adapted periods by (21%; β = −0.037,
z = −3.52, P = 0.0004) compared to the no-feedback condition. At the group level, self-
feedback averaged 11% lower error (β = −0.02, z = −1.66, P = 0.096) and 29% in the
9

adapted periods (β = −0.038, z = −2.94, P = 0.003).
On the other hand, the full-feedback condition averaged 20% lower individual error (β =
−0.03, z = −3.3, P = 0.001), and 16% lower group error (β = −0.02, z = −2.25, P = 0.024),
compared to participants in the self-feedback condition. In the adapted periods, full-feedback
reduced individual error by 32% (β = −0.04, z = −4.99, P << 10−5) and group error by 29%
(β = −0.03, z = −2.99, P = 0.0028) compared to groups provided with self-feedback (see
Table S2).
As the full-feedback condition in E2 and the dynamic network condition in E1 are identical
(i.e., both dynamic network and full-feedback), we consider them to be a replication of the same
condition across two studies. We confirm that there are no statistically significant differences
between the two conditions in Table S3.
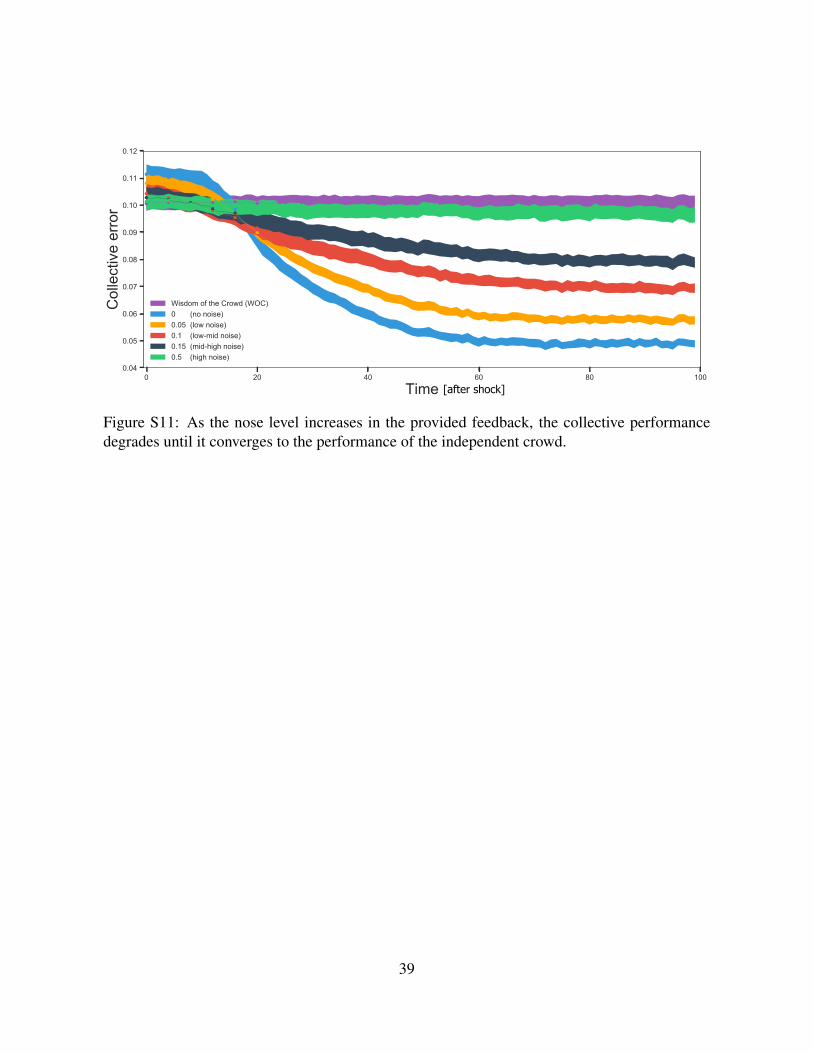
In agreement with these experimental findings, simulations confirmed that high-quality feed-
back is necessary for enabling beneficial group adaptation through social rewiring. Fig. S11
shows that, as we add more noise to the peer performance feedback, the collective performance
of adaptive networks deteriorates until it converges to that of the simple wisdom of crowds (i.e.,
the solo condition).
The ability of the network to adapt
We also examined the interaction term between the experimental condition and the experiment
round index in a generalized mixed-effects linear model. This allows us to see how the errors
across conditions changed as rounds within an experiment elapsed. In particular, a negative
coefficient would indicate that individuals or groups are adapting to their environment relative
to the unconnected groups, while a positive coefficient would suggest maladaptation—that is,
individuals or groups failed to adjust adequately to the environment. Figs. 3A and B show that
when both plasticity (i.e., dynamic network) and feedback (full or partial) are provided, the
10

participants could best adapt to the information environment and reduce their error over rounds
(i.e., negative coefficients; P < 0.05). Only the performance of individuals after the shock in
the no-feedback condition was found to be marginally maladaptive (β = 0.004, P = 0.084),
while individual and collective performance in the static network condition was neither adaptive
nor maladaptive (i.e., flat slope; β = 0;P > 0.4).
Coefficient on Interaction TermError ~ Condition*Round
Shock Shock
A B
Static network No-feedbackSelf-feedback
Dynamic network Full-feedbackConditions:
Indvidual level Group level
Coe
ffici
ent
Figure 3: The ability of the system to adapt. The coefficients on the interaction term condi-tion*round in a mixed effect model to account for the nested structure of the data. Individuals(Panel A) and groups (Panel B) provided with full or partial feedback were able to adapt (i.e.,reduce their error as rounds elapsed) both before and after the shock. Error bars indicate 95%confidence intervals.
11

The performance of the best individual
We found that even the best individual did benefit from network interaction. The best individual
within each group was determined based on ex-post revised estimate performances across all
rounds — that is, based on the quality of the post-social learning estimates. In particular, we
find that the best individuals in the dynamic and static conditions from E1 reduced their overall
error by roughly 20% (P < 10−4). In E2, the best individuals in the full-feedback condition
reduced their error by 30% (P < 10−4), while the best individuals in the self-feedback condition
reduced their error by 21% (P = 0.009) and 15% in the no-feedback condition (P = 0.057).
Mean-variance trade-off
The collective performance of groups was not bounded by that of the best individual. To further
examine this, we generalize the use of group means as collective estimates and the definition
of best individual to analyze the performance of top-k estimates—that is, aggregate estimates
where only the guesses of the k best-performing group members are averaged. In particular,
top-12 estimates correspond to the group mean (i.e., the whole-crowd strategy), and top-1 to the
estimates of groups’ best-performing individual (i.e., best-member strategy). Fig 4 reports the
mean and standard deviation of estimation errors incurred by the entire range of k (i.e., top-k
or the select k crowd strategy), estimates during the adapted periods. Ideal estimates would
minimize both mean error and variability (i.e., towards the (0,0) corner). The qualitative shape
of top-k curves reveals that, as we remove low-performing individuals (from k = 12 to k = 1),
estimates initially improve in both mean and standard deviation. Then, as we further curate
the crowd—roughly—beyond k = 6, top-k estimates trade-off between decreasing mean error
and increasing variability and finally regress in both objectives as k → 1. Roughly speaking,
selecting six members strikes a balance between using the estimates of the best members on
the one hand and taking advantage of the error-canceling effects of averaging on the other (35).
12

Interestingly, we find that the full-group average in dynamic networks got 21% lower error
(P = 0.002; 500 bootstraps) and 46% less variability (P << 10−5; 500 bootstraps) than the
best individual in the solo with feedback condition (i.e., dynamic top-12 vs. solo top-1).
Solo (no feedback)Solo (feedback)Static networkDynamic network
k=12
k=1
k=6
k=12
k=1
k=6
k=12
k=1
k=6
k=12
k=1
k=6
Figure 4: Mean-variance trade-off. Mean and standard deviation of absolute errors incurredby top-k estimates during the adapted periods. Top-12 estimates correspond to the full-groupmean, and top-1 to the group’s best individual. Error bars indicate 95% confidence intervals.
Adaptation and environmental shock rates
Lastly, we explored through simulation the interaction between network adaptation rates—a
network’s rewiring sensitivity to changes in agents’ performance—and the arrival rate of envir-
onmental shocks. Simulations indicated that networks with higher adaptation rates is suitable for
environments with frequent information shocks. Conversely, networks with slower adaptation
rates could leverage more extended learning periods, eventually achieving lower error rates in
13
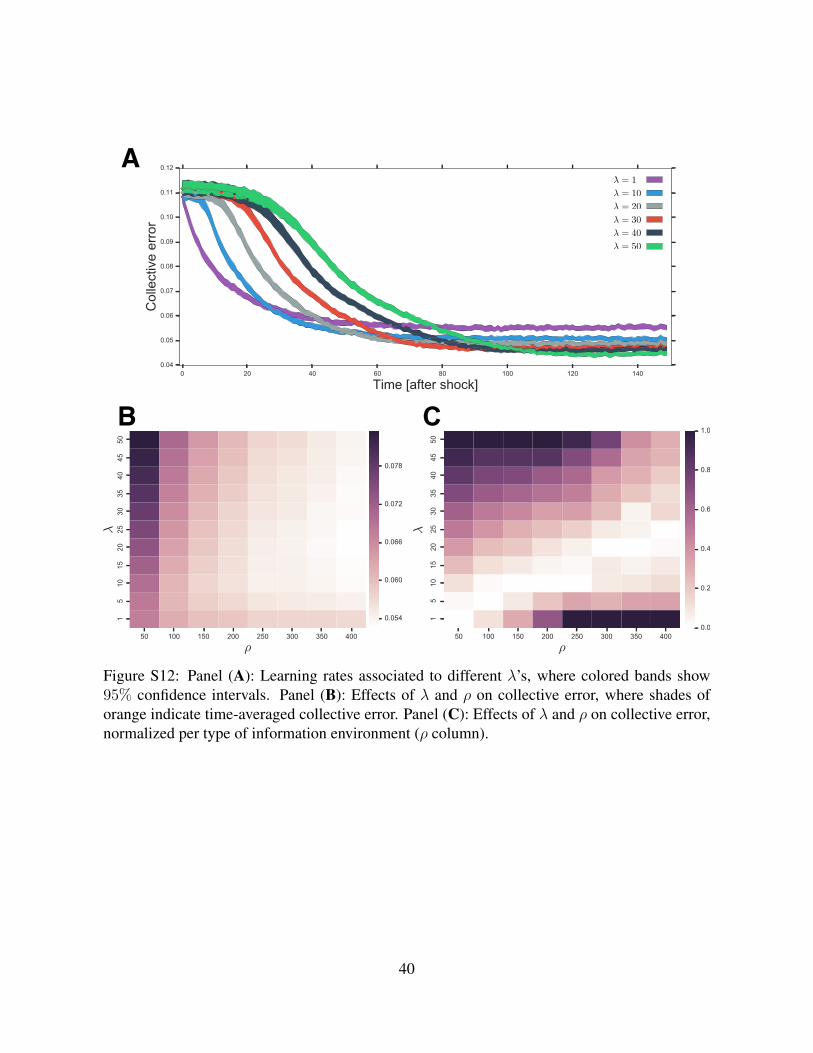
environments with infrequent shocks (see Fig S10). This short-term versus long-term accuracy
trade-off implies that optimal network adaptation rates depend on the pace at which the inform-
ation environment changes (see Fig. S12), analogous to notions of optimal adaptation rates in
natural systems (49) and learning rates in artificial intelligence algorithms (6).
Adaptive Mechanisms
The results support our primary hypothesis that network plasticity and feedback provide ad-
aptiveness that can benefit both individual and collective judgment. We explored two social
mechanisms to explain these results.
Network Centralization
The first mechanism we identify is a global (or structural) mechanism where dynamic net-
works in the presence of high-quality feedback adaptively centralized over high-performing
individuals. This behavior was predicted by abundant evidence from cognitive science and evol-
utionary anthropology, which indicates that people naturally engage in selective social learn-
ing (13, 17, 35, 42)—i.e., the use of cues related to peer competence and reliability to choose
whom we pay attention to and learn from selectively. Figs. 5A and 5B show that participants
in dynamic networks with full-feedback used peers’ past performance information to guide
their peer choices. As rounds elapsed, performance information accrued, and social networks
evolved from fully distributed into centralized networks that amplified the influence of well-
informed individuals. Upon receiving an information shock, the networks slightly decentralized
(β = −0.046, z = −4.042, P < 10−4; see Table S4), entering a transient exploration stage
before finding a configuration adapted to the new distribution of information among participants
(Fig. 5D for an example of the network evolution).
14

Confidence Self-Weighting
Network centralization over high-performing individuals, however, cannot account for all of our
results. First, a centralization mechanism alone would suggest that group members may merely
follow and copy the best individual among them, hence bounding collective performance by that
of the group’s top performer, which we found to be untrue (i.e., even the best individual benefits
from group interaction). Second, we find that even in the absence of feedback, there is still a
correlation between popularity and performance (see Fig. 5B) that is similar to the no-feedback
condition but weaker than the full feedback condition. Therefore, this alone would not explain
why participants in the self-feedback condition inE2 were able to adapt, but not the no-feedback
condition.
However, research on the two-heads-better-than-one effect indicates that, in the more straight-
forward case of dyads, even the best individual can benefit from social interaction (27, 30); and
that the critical mechanism enabling this effect is a positive relationship between individuals’
accuracy and their confidence. This is a plausible local mechanism that can work in conjunc-
tion with both plastic and static networks, as well as with or without feedback. Fig. 5C shows
that participants in the networked conditions had, overall, a positive correlation between the
accuracy of their initial estimates and their self-confidence (measured in terms of resistance to
social influence; see Materials and Methods). Participants were likely to rely on private judg-
ments whenever these were accurate and likely to rely on social information otherwise. This
positive correlation of confidence and accuracy is consistent with what was found in earlier
studies (21, 31). This mechanism allows the participants in the no-feedback conditions to over-
come the absence of feedback by exploiting the round-by-round covariation between their own
internal decision confidence (i.e., how certain they are) and the answers of their peers (50). That
is, if one is confident that they are correct (according to their internal confidence), then they
can be equally confident that any neighbor who disagrees with them is wrong, and accordingly
15

down-weight their estimate in future rounds (or break ties with them). Therefore, confidence
is used as a signal to learn about the reliability of peers, even in the absence of explicit feed-
back, and could explain the positive correlation between popularity and performance. Moreover,
Fig. 5C also shows that, as rounds elapsed, participants in the full- and self- feedback conditions
used the explicit performance feedback to calibrate their accuracy-confidence relation further,
and were able to re-adapt gradually upon the shock.
Round 1 Round 3 Round 8 Round 10
Round 11 Round 13 Round 18 Round 20
Shock [changing the distribution of information quality]
63 Popularity0
8Correlation
Initial estimatesRevised estimates Truth
Round
Shock
A
Shock
B
Shock
C
Static network No-feedbackSelf-feedbackDynamic network Full-feedback
RoundRound
D
Figure 5: Mechanisms promoting collective intelligence in dynamic networks. Panel (A)shows that the network becomes more centralized with time (Freeman global centralization—,i.e., how far the network is from a k). Panel (B) depicts the relation between performance(i.e., average error) and popularity (i.e., number of followers). Panel (C) shows the relationshipbetween the accuracy of the initial estimate and confidence. Error bars indicate 95% confidenceintervals. Panel (D) shows an example of the network evolution in the experiment.
16

Discussion
Existing work on collective intelligence and social influence has not considered several aspects
that are widespread in natural situations: (1) the rewiring of influence networks; (2) the role
of performance feedback; and (3) changing environments (i.e., shocks). We have shown that
dynamic influence networks can adapt to biased and non-stationary environments, inducing in-
dividual and collective beliefs more accurate than the independent beliefs of the best-performing
individual. We also showed that the advantages of adaptive networks are contingent on the pres-
ence and quality of performance feedback.
We acknowledge that the results of laboratory experiments, including ours, rarely translate
directly into the real world. Obtaining conclusions of immediate practical relevance would re-
quire running a far more extensive and complicated series of experiments than the one we have
presented, in which we would vary the available time, group size, task type, group interaction
parameters, and many other potentially moderating variables.
Nonetheless, this study addresses a gap in the literature. Prior work explored the effective-
ness of the wisdom of crowds in either unstructured settings (all subjects are exposed to actions
of others) or static networks, in which subjects are arranged in non-evolving networks by the
experimenter. Additionally, previous work did not study the effect of performance feedback.
The evidence presented here suggests that details of interpersonal communications – both in
terms of the structure of the social interactions and the mechanism of its evolution – can affect
the ability of the system to promote collective intelligence. This is a piece of evidence that
dynamism of the networks has profound effects on the processes taking place on them, allowing
them to be more efficient and enabling them to adapt to changing environments.
The insights here provided design guidelines relevant to real-world collective intelligence
mechanisms, in contexts such as commodity markets, social trading platforms, crowdfunding,
17

crowd work, prediction markets. We expect the adaptive systems view on collective intelligence
to further sprout connections with fields such as social psychology, management science, de-
cision science, evolutionary dynamics, and artificial intelligence, advancing an interdisciplinary
understanding and design of social systems and their information affordances.
Materials and Methods
IRB, Code, and Data
The study was reviewed and approved by the Committee on the Use of Humans as Experimental
participants (COUHES) at MIT. All participants provided explicit consent, and COUHES ap-
proved the consent procedure. The experiment was developed using the Empirica platform (51).
See OSF repository for experiment implementation, replication data, and code.
Statistical Tests
All statistics are two-tailed and based on mixed-effect models that included random effects to
account for the nested structure of the data. Details of the statistical tests in Tables S1-S4.
Resistance to Social Influence
Our measure of resistance to social influence is inspired by the weight of advice (WOA) measure
frequently used in the literature on advice-taking (52). Weight of advice quantifies the degree to
which people update their beliefs (e.g., guesses made before seeing the peer’s guesses) toward
advice they are given (e.g., the peer’s guesses). In the context of our experiments, it is defined
as
WOA := |u2 − u1|/|m− u1|,
where m is the neighbors’ average initial guess of the correlation, u1 is the participant’s initial
guess of the correlation before seeing m, and u2 is the participant’s final guess of the correlation
18
after seeing m. Therefore, our measure for resistance to social influence is simply 1 −WOA.
It is equal to 0 if the participant’s final guess matches the neighbors’ average guess, equal to 0.5
if the participant averages their initial guess and the neighbors’ average guess, and equal to 1 if
the participant completely ignores the neighbors’ average guess.
Network centralization
We used Freeman centrality (53) to quantify the network centralization, which calculates the
sum in differences in centrality between the most central node in the network and all other
nodes; and then divide this quantity by the theoretically largest such sum of differences (a star
network of the same size):
Cx =
∑Ni=1Cx(p∗)− Cx(pi)
max∑N
i=1Cx(p∗)− Cx(pi),
where Cx(pi) is the in-degree (number of followers) of individual i, Cx(p∗) is the in-degree
of the most popular individual, and max∑N
i=1Cx(p∗) − Cx(pi) = [(N − 1)(N − 2)] is the
theoretically largest sum of differences.
References
1. Y. Z. Tsypkin, Z. J. Nikolic, Adaptation and learning in automatic systems, vol. 73 (Aca-
demic Press New York, 1971).
2. M. M. G. Sosna, et al., Proceedings of the National Academy of Sciences (2019).
3. D. H. Erwin, E. H. Davidson, Nature Reviews Genetics 10, 141 (2009).
4. D. A. Gutnisky, V. Dragoi, Nature 452, 220 (2008).
5. N. Stroeymeyt, et al., Science 362, 941 (2018).
19

6. L. Bottou, On-line learning in neural networks 17, 142 (1998).
7. H. Wang, B. Wellman, American Behavioral Scientist 53, 1148 (2010).
8. M. G. Zimmermann, V. M. Eguıluz, M. San Miguel, Physical Review E 69, 065102 (2004).
9. W. S. Chow, L. S. Chan, Information & management 45, 458 (2008).
10. S. Valenzuela, N. Park, K. F. Kee, Journal of Computer-Mediated Communication 14, 875
(2009).
11. D. G. Rand, S. Arbesman, N. A. Christakis, Proceedings of the National Academy of Sci-
ences 108, 19193 (2011).
12. M. Kearns, S. Judd, Y. Vorobeychik, Proceedings of the 13th ACM Conference on Electronic
Commerce (ACM, 2012), pp. 690–704.
13. T. N. Wisdom, X. Song, R. L. Goldstone, Cognitive science 37, 1383 (2013).
14. J. Henrich, M. Chudek, R. Boyd, Phil. Trans. R. Soc. B 370, 20150013 (2015).
15. E. Gallo, C. Yan, Proceedings of the National Academy of Sciences p. 201415883 (2015).
16. A. Harrell, D. Melamed, B. Simpson, Science advances 4, eaau9109 (2018).
17. J. Henrich, The secret of our success: how culture is driving human evolution, domesticating
our species, and making us smarter (Princeton University Press, 2015).
18. M. Muthukrishna, J. Henrich, Philosophical Transactions of the Royal Society B: Biological
Sciences 371, 20150192 (2016).
19. L. Muchnik, S. Aral, S. J. Taylor, Science 341, 647 (2013).
20
20. J. Lorenz, H. Rauhut, F. Schweitzer, D. Helbing, Proceedings of the National Academy of
Sciences 108, 9020 (2011).
21. J. Becker, D. Brackbill, D. Centola, Proceedings of the National Academy of Sciences p.
201615978 (2017).
22. B. Golub, M. O. Jackson, American Economic Journal: Microeconomics 2, 112 (2010).
23. J. Surowiecki, The wisdom of crowds (Anchor, 2005).
24. F. Galton, Nature 75, 450 (1907).
25. B. Jayles, et al., Proceedings of the National Academy of Sciences 114, 12620 (2017).
26. T. Indow, M. Ida, Perception & Psychophysics 22, 265 (1977).
27. B. Bahrami, et al., Science 329, 1081 (2010).
28. J. Navajas, T. Niella, G. Garbulsky, B. Bahrami, M. Sigman, Nature Human Behaviour p. 1
(2018).
29. M. Moussaıd, A. N. Campero, A. Almaatouq, PloS one 13, e0190541 (2018).
30. A. Koriat, Science 336, 360 (2012).
31. G. Madirolas, G. G. de Polavieja, PLoS Comput Biol 11, e1004594 (2015).
32. M. Kearns, S. Judd, J. Tan, J. Wortman, Proceedings of the National Academy of Sciences
106, 1347 (2009).
33. D. V. Budescu, E. Chen, Management Science 61, 267 (2014).
34. S. Aral, M. Van Alstyne, American Journal of Sociology 117, 90 (2011).
21

35. A. E. Mannes, J. B. Soll, R. P. Larrick, Journal of personality and social psychology 107,
276 (2014).
36. S. Bonaccio, R. S. Dalal, Organizational behavior and human decision processes 101, 127
(2006).
37. C. P. Davis-Stober, D. V. Budescu, J. Dana, S. B. Broomell, Decision 1, 79 (2014).
38. D. Barkoczi, M. Galesic, Nature communications 7, 13109 (2016).
39. W. Toyokawa, A. Whalen, K. N. Laland, Nature Human Behaviour p. 1 (2019).
40. A. W. Woolley, C. F. Chabris, A. Pentland, N. Hashmi, T. W. Malone, science 330, 686
(2010).
41. G. Kossinets, D. J. Watts, science 311, 88 (2006).
42. R. Boyd, P. J. Richerson, J. Henrich, Proceedings of the National Academy of Sciences 108,
10918 (2011).
43. R. A. Rensink, G. Baldridge, Computer Graphics Forum (Wiley Online Library, 2010),
vol. 29, pp. 1203–1210.
44. M. Moussaıd, S. M. Herzog, J. E. Kammer, R. Hertwig, Proceedings of the National
Academy of Sciences p. 201611998 (2017).
45. M. H. DeGroot, Journal of the American Statistical Association 69, 118 (1974).
46. A.-L. Barabasi, R. Albert, science 286, 509 (1999).
47. W. Mason, D. J. Watts, Proceedings of the National Academy of Sciences 109, 764 (2012).
48. M. Derex, R. Boyd, Nature communications 6, 8398 (2015).
22

49. M. Kondoh, Science 299, 1388 (2003).
50. N. Pescetelli, G. Rees, B. Bahrami, Journal of Experimental Psychology: General 145, 949
(2016).
51. N. Paton, A. Almaatouq, Empirica: Open-source, real-time, synchronous, virtual lab frame-
work (2018).
52. F. Gino, D. A. Moore, Journal of Behavioral Decision Making 20, 21 (2007).
53. L. C. Freeman, Social networks 1, 215 (1978).
54. D. Prelec, S. Seung, J. McCoy, Nature 541, 532 (2017).
55. P. M. DeMarzo, J. Zwiebel, D. Vayanos, Social Influence, and Uni-Dimensional Opinions
(November 2001). MIT Sloan Working Paper (2001).
56. A. G. Chandrasekhar, H. Larreguy, J. P. Xandri, Work. Pap., Mass. Inst. Technol., Cam-
bridge, MA (2012).
57. R. Dunbar, brain 9, 178 (1998).
23

Supplementary Materials
Access to data and code
All of the data and analysis code are publicly available at the Open Science Framework (OSF)
repository. The study was reviewed and approved by the Committee on the Use of Humans
as Experimental participants (COUHES) at MIT. All participants provided explicit consent
to participants in this study, and COUHES approved the consent procedure. The experiment
was developed using the Empirica (https://empirica.ly/) platform, an open-source “virtual lab”
framework, and a platform for running multiplayer interactive experiments and games in the
browser (51).
1 Details of Experimental Setup
Guess the Correlation Task
Participants were prompted to estimate the correlation from a scatter plot (namely, “Guess the
correlation” game) and were awarded a monetary prize based on the accuracy of their final es-
timate. This estimation task is designed to expose the mechanisms that allow intelligent systems
to adapt to changes in their information environment. We can influence the performance level
of participants by implementing three signal quality levels (e.g., adjusting the number of points
or linearity): high, medium, and low. At every round, all plots seen by participants shared an
identical true correlation, but signal quality levels could differ among them (see Fig. S1). The
allowed us to construct the environment and provided us with the ability to simulate a shock
to the distribution of information among participants. Specifically, each participant experienced
a constant signal quality level across the first ten rounds; then, at round eleven, we introduced
shocks by reshuffling signal qualities to new levels that remained constant after that (see Fig. S2).
Participants were not informed about the signal quality levels they or their peers faced. For a
24

screenshot of the experiment, see Fig. S6, Fig. S7, and Fig. S8.
Experiment 1: Manipulates network plasticity; full feedback
In E1, each group was randomized to one of three treatment conditions:
• solo condition: each participant solved the sequence of tasks in isolation (i.e., no social
information). This condition corresponds to the traditional ‘wisdom of the crowds’ con-
text (23, 54). See Figure S3A.
• static condition: participants were randomly placed in static communication networks.
That means participants will engage in a stage of active social learning, where they are
exposed to their ego-network’s estimates in real-time. See Figure S3B. This context is
analogous to that studied by work at the intersection of the ‘wisdom of crowds’ and social
learning, such as as (20, 22).
• dynamic condition: participants at each round were allowed to select up to three peers to
follow (i.e., get the ability to communicate with) in subsequent rounds. See Figure S3C.
This condition is novel to the work of this dissertation.
Note that in the social learning stage (i.e., in the static and dynamic conditions; see Fig-
ure S3), participants observe in real-time the estimates of the other participants that they are
connected to and can update their estimates multiple times before they submit their final estim-
ate. It is up to the participant to decide how to update their guess to accommodate the informa-
tion and experiences, the opinions and judgments, the stubbornness and confidence, of the other
players. After submitting a final estimate, participants in all conditions were given performance
feedback. That included how much they earned, what was the correct correlation, what was their
guess.
25
Experiment 2: Manipulates feedback; dynamic network
In E2, each group was randomized to one of four treatment conditions:
• solo condition, where each individual solved the sequence of tasks in isolation.
• no feedback condition, in which participants were not shown performance feedback.
• self feedback condition, in which participants were shown their performance feedback.
• full feedback condition, in which participants were shown scores of all participants (in-
cluding their own)
Participants in all conditions (except solo, our baseline) were allowed to revise which peers
to follow in subsequent rounds (i.e., similar to the ‘dynamic network‘ condition in study 1).
Participant Recruitment
All participants were recruited on MTurk by posting a HIT for the experiment, entitled “Guess
the correlation and win up to $10”, a neutral title that was accurate without disclosing the pur-
pose of the experiment. All participants provided explicit consent to participants in this study,
and COUHES approved the consent procedure. All data collected in the experiment could be
associated only with the participant’s Amazon Worker ID on MTurk, not with any personally-
identifiable information. All players remain anonymous for the entire study. At the beginning of
a session, participants read on-screen instructions for the condition they are randomly assigned.
Participants could start the experiment only once they have completed a set of comprehension
questions.
26

2 Numerical Simulations
We implemented numerical simulations where we focus on two conditions: (1) traditional wis-
dom of crowds (i.e., independent actors with individual feedback); and (2) adaptive wisdom of
crowds (i.e., dynamic networks with full feedback). To follow the properties of our framework,
we operationalized social learning as a DeGroot process (45), and propose a performance-based
preferential detachment and attachment model for the network rewiring heuristics.
Notation. Let N = {1, 2, ..., n} represent a group of agents that participate in a sequence of
tasks, indexed by discrete time t. Let G(N,E(t)) be a sequence of directed graphs representing
the influence network at each period t. Let e(t)ij ∈ [0, 1] denote the edge weight of (i, j) at time
t, and M (t) the row-normalized stochastic matrix associated with E(t), i.e., M (t)ij =
e(t)ij∑
h∈N e(t)ih
.
Agents receive private signals s(t)i ∈ [0, 1], for i ∈ N , regarding the true state of the world
ω(t) ∈ [0, 1]. Similarly, we denote agents’ post-social learning beliefs by p(t)i ∈ [0, 1], for i ∈ N .
Private Signals. We depart from the commonly made assumption of collective unbiasedness
of agents’ private signals (20,22,23,55), allowing agents’ signals to be distributed with arbitrary
means and skewness. Let µi = E[si] denote the mean of agent i’s signal, and µ = 1n
∑i µi
be the collective mean of private signals; we are interested on the more general setting of in-
formation environments where µ 6= ω, i.e., where the collective distribution of initial signals
is not centered on the truth. Figure S9 illustrates the difference between unbiased and biased
information environments.
Social Learning Process. Social learning is modeled as a DeGroot process (45), where each
agent updates her belief by taking weighted averages of her own belief (i.e., private signal) and
the beliefs of neighboring agents. Averaging as social learning heuristic has been well studied
empirically and theoretically (22,55), and shown to robustly describe real-world belief updating
better than more optimal rational Bayesian models (56). In particular, we model post-social
27
learning beliefs as the result of a two-stage DeGroot process on private signals, given by
p(t) =(M (t)
)2s(t) (1)
Individual performance is evaluated based on the errors of post-social influence estimates.
Individual cumulative error is defined by:
ε(t)i =
1
λ+ 1
∑r∈[0,λ]
∣∣∣p(t−r)i − ω(t−r)∣∣∣,
where λ controls the number of retrospective periods that performance information is averaged
across.
Agents assess performance of other agents relative to the performance of the best agent in
the group. We define relative error of agent i as π(t)i = ε
(t)i − ε
(t)min , and denote the set of
performance information available to agent i at time t by vector Π(t)i ∈ [0, 1]n with elements
π(t)ij =
{π(t)j for j 6= i
π(t)si for j = i
where π(t)si is the relative error of agent i’s private signal.
Collective error. We are interested on the wisdom of the dynamic network (WDN) error,
εwdn, which captures collective error after selective social learning according to the interaction
network. We compare εwdn against the wisdom of the crowd (WC) baseline, εwc, which captures
collective error of the simple averaging of agents’ initial signals.
ε(t)wdn =
∣∣ω(t) − 1
n
∑i
p(t)i
∣∣ (2)
ε(t)wc =∣∣ω(t) − 1
n
∑i
s(t)i
∣∣ (3)
Influence Rewiring Process. Individuals connect by weighted influence links that are re-
vised over time. We model influence rewiring heuristics that strengthen links when a neighbor
exhibits high performance and weaken or break links when a neighbor performs poorly. Agents
28

can distribute attention among a limited number of peers, captured by parameter κ, which rep-
resents cognitive or infrastructure constraints (e.g., limits on our ability to keep track of social
information and relations (57)). In particular, agents dynamically allocate κ ∈ N shares of their
attention to other agents. Let eijk ∈ {0, 1}, for k ∈ {1, 2, ..., κ}, indicate that i places attention
share k on j, then eij =∑
k eijk and eij ∈ {0, 1, 2, ..., κ}.
Probability of detachment. Probability that agent i detaches from j is a positive function
of i and j’s errors, and given by equation 4. For example, if i’s error is among the lowest of the
group (π(t)i ≈ 0), i is unlikely to rewire her local network. Conversely, if i’s error is significant
(e.g., π(t)i ≈ 1), i detaches from j with probability dependent on j’s error.
β(t)ij =
(π(t)i π
(t)ij
) 12
(4)
Probability of Attachment. High-performing agents are more likely to be followed. Ana-
logous to generalized preferential attachment (46), probability that agent i attaches to j is in-
versely related to j’s error, and given by
α(t)ij =
(1− π(t)
ij
n−∑j
π(t)ij
)2
c (5)
where c is a normalization constant.
Network Evolution. Define i.i.d. random variables b(t)ijk ∼ Bernoulli(β(t)ij
)∀(i, j, k), then
random variables b(t)ij =∑
k b(t)ijke
(t)ijk ∼ Binomial
(e(t)ij , β
(t)ij
)indicate the amount of attention
shares that i detaches from j in period t. Define n-dimensional random vectors a(t)i ∼ Multi-
nomial( ∑
j b(t)ij , α
(t)i
), where α(t)
i is i’s vector of attachment probabilities. Elements a(t)ij ∈
{0, 1, ..., κ} indicate the amount of shares that i attaches to j in period t , and network evolution
is given bye(t+1)ij = e
(t)ij − b
(t)ij + a
(t)ij ∀i, j (6)
29

3 Supplementary Figures
20Round
110
.. .. .... ..
.. .. .... ..
.. .... ..
r=0.09 r= 0.91 r=0.47 r=0.03
..
High
Medium
Low
High signal quality
Medium signal quality
Low signal quality
(A) Examples of the experimental task and the signal quality levels
(B) Information environment
Figure S1: Guess the Correlation Game. An illustrative example of the scatter plots used inthe experiment is shown in Panel (A). The quality of the signal, therefore, could be variedsystematically at the individual level by varying the number of points, linearity, and the existenceof outliers. All participants saw plots that shared an identical true correlation, but signal qualitylevels could differ among them, as shown in Panel (B). Participants were not informed about thesignal quality level they or other participants were facing.
30

20
Information Shock
Round
1 10
Figure S2: Shock to the Information Environment. We provide a change in the environmentafter round 10 by changing the signal quality levels for the participants for the remainder of theexperiment and thereby we simulate non-stationary distributions of information among parti-cipants.
31

Task & private signals
Feedback
𝑡 + 1
Revised answer
Task & private signals
Social learning Feedback
𝑡 + 1
Revised answer
Task & private signals
Social learning Feedback Rewiring
𝑡 + 1
A B
C
Figure S3: Illustration of the experimental conditions in study 1. Panel (A) depicts the Solocondition (i.e., no social information) where participants make independent estimates. Thiscondition corresponds to the baseline wisdom of the crowd context. Panel (B) describes theStatic network condition (i.e., social learning) where participants engage in a stage of interactivesocial learning, where they are exposed to the estimates of a fixed set of peers in real-time.Panel (C) describes the Dynamic network (i.e., selective social learning) condition that adds thepossibility for participants to choose who to follow and be influenced by in the next round.
32

Figure S4: Example of the instructions used in our experiments.
33

Figure S5: Example of the instructions used in our experiments.
34

Figure S6: Participants in all conditions make independent guesses about the correlation of twovariables independently.
35

Figure S7: Participants in the network condition engage in a an active social learning phase,where they are exposed to their ego-network’s estimates in real time.
36

Figure S8: After each task round, participants in the feedback conditions see the appropriatelevel of feedback for the conditions. This figure illustrates the dynamic network condition withfull feedback (i.e., as opposed to no-feedback or only self-feedback). In all of our experiments,the maximum number of outgoing connections is three.
37

Biased Unbiased
Figure S9: Traditional accounts of ‘wisdom of crowds’ phenomena assume unbiased and statist-ically independent signals among agents. In our model, we assume arbitrary (potentially biased)initial signals.
WDNWC
WCWDN
Figure S10: Evolution of collective error: wisdom of the crowd (WC) and wisdom of the dy-namic network (WDN). Panel A) stationary distribution of information among agents. PanelB) non-stationary information environment, shocks to the information distribution introduced att = {100, 200}
38
[after shock]
Figure S11: As the nose level increases in the provided feedback, the collective performancedegrades until it converges to the performance of the independent crowd.
39
A
B C
Figure S12: Panel (A): Learning rates associated to different λ’s, where colored bands show95% confidence intervals. Panel (B): Effects of λ and ρ on collective error, where shades oforange indicate time-averaged collective error. Panel (C): Effects of λ and ρ on collective error,normalized per type of information environment (ρ column).
40
4 Supplementary Tables
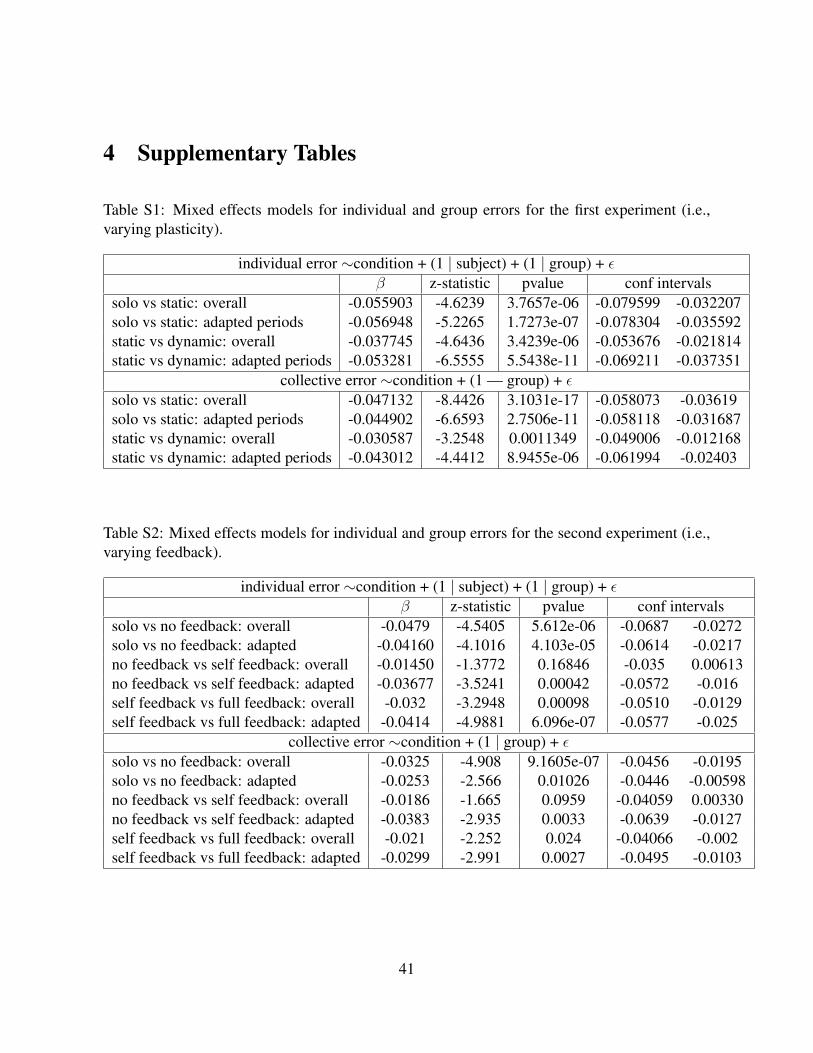
Table S1: Mixed effects models for individual and group errors for the first experiment (i.e.,varying plasticity).
individual error ∼condition + (1 | subject) + (1 | group) + εβ z-statistic pvalue conf intervals
solo vs static: overall -0.055903 -4.6239 3.7657e-06 -0.079599 -0.032207solo vs static: adapted periods -0.056948 -5.2265 1.7273e-07 -0.078304 -0.035592static vs dynamic: overall -0.037745 -4.6436 3.4239e-06 -0.053676 -0.021814static vs dynamic: adapted periods -0.053281 -6.5555 5.5438e-11 -0.069211 -0.037351
collective error ∼condition + (1 — group) + εsolo vs static: overall -0.047132 -8.4426 3.1031e-17 -0.058073 -0.03619solo vs static: adapted periods -0.044902 -6.6593 2.7506e-11 -0.058118 -0.031687static vs dynamic: overall -0.030587 -3.2548 0.0011349 -0.049006 -0.012168static vs dynamic: adapted periods -0.043012 -4.4412 8.9455e-06 -0.061994 -0.02403
Table S2: Mixed effects models for individual and group errors for the second experiment (i.e.,varying feedback).
individual error ∼condition + (1 | subject) + (1 | group) + εβ z-statistic pvalue conf intervals
solo vs no feedback: overall -0.0479 -4.5405 5.612e-06 -0.0687 -0.0272solo vs no feedback: adapted -0.04160 -4.1016 4.103e-05 -0.0614 -0.0217no feedback vs self feedback: overall -0.01450 -1.3772 0.16846 -0.035 0.00613no feedback vs self feedback: adapted -0.03677 -3.5241 0.00042 -0.0572 -0.016self feedback vs full feedback: overall -0.032 -3.2948 0.00098 -0.0510 -0.0129self feedback vs full feedback: adapted -0.0414 -4.9881 6.096e-07 -0.0577 -0.025
collective error ∼condition + (1 | group) + εsolo vs no feedback: overall -0.0325 -4.908 9.1605e-07 -0.0456 -0.0195solo vs no feedback: adapted -0.0253 -2.566 0.01026 -0.0446 -0.00598no feedback vs self feedback: overall -0.0186 -1.665 0.0959 -0.04059 0.00330no feedback vs self feedback: adapted -0.0383 -2.935 0.0033 -0.0639 -0.0127self feedback vs full feedback: overall -0.021 -2.252 0.024 -0.04066 -0.002self feedback vs full feedback: adapted -0.0299 -2.991 0.0027 -0.0495 -0.0103
41
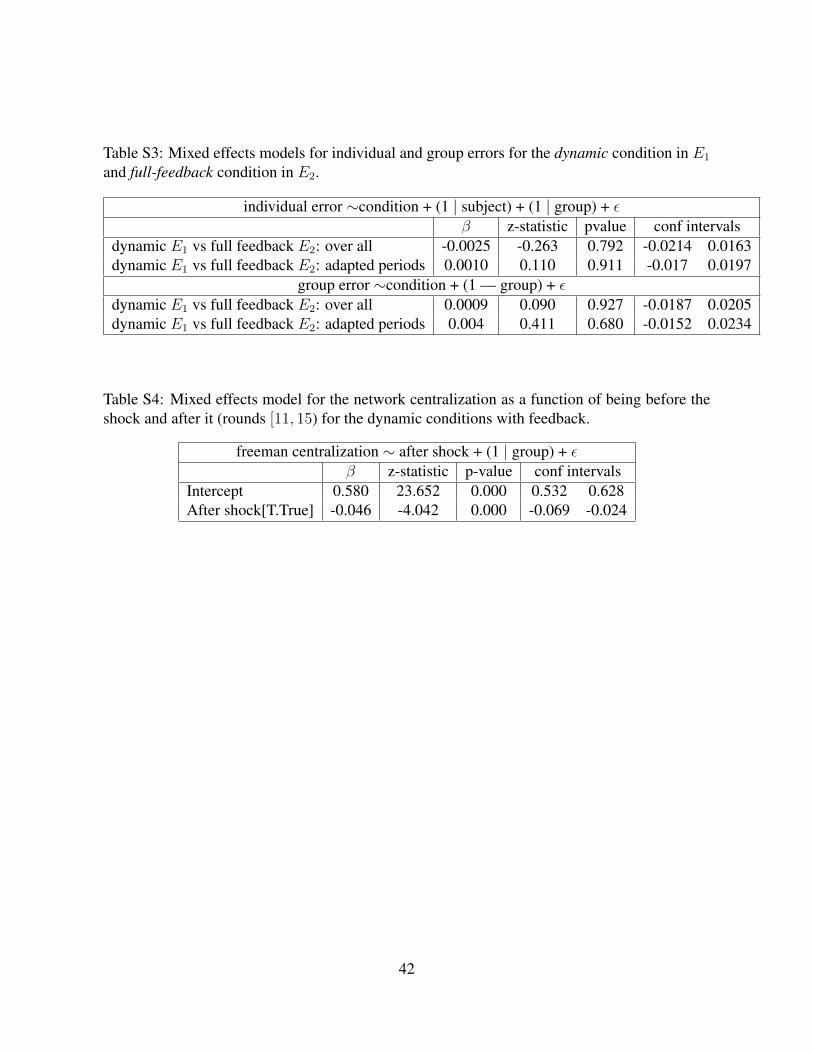
Table S3: Mixed effects models for individual and group errors for the dynamic condition in E1
and full-feedback condition in E2.
individual error ∼condition + (1 | subject) + (1 | group) + εβ z-statistic pvalue conf intervals
dynamic E1 vs full feedback E2: over all -0.0025 -0.263 0.792 -0.0214 0.0163dynamic E1 vs full feedback E2: adapted periods 0.0010 0.110 0.911 -0.017 0.0197
group error ∼condition + (1 — group) + εdynamic E1 vs full feedback E2: over all 0.0009 0.090 0.927 -0.0187 0.0205dynamic E1 vs full feedback E2: adapted periods 0.004 0.411 0.680 -0.0152 0.0234
Table S4: Mixed effects model for the network centralization as a function of being before theshock and after it (rounds [11, 15) for the dynamic conditions with feedback.
freeman centralization ∼ after shock + (1 | group) + εβ z-statistic p-value conf intervals
Intercept 0.580 23.652 0.000 0.532 0.628After shock[T.True] -0.046 -4.042 0.000 -0.069 -0.024
42