A comparative analysis of the observed white dwarf cooling ...

THE ASTROPHYSICAL JOURNAL, 671 :380-401,2007 December 10 CO 2007. The American Astronomical Society. All rights reserved. Printed in U.S.A.
THE WHITE DWARF COOLING SEQUENCE OF NGC 639i
BRAD M. S. HANSEN,2,3 JAY ANDERSON,4 JAMES BREWER,S AARON DOTIER,6 GREG. G. FAHLMAN,S,7 JARROD HURLEY,8 JASON KALIRAI,9 IVAN KING,IO DAVID REITZEL,2 HARVEY B. RICHER,S
R. MICHAEL RlCH,2 MICHAEL M. SHARA,11 AND PETER B. STETSON 12 Received 2007 Febrnary 20; accepted 2007 July 2
ABSTRACT
We present the results of a deep Hubble Space Telescope (HST) exposure of the nearby globular cluster NGC 6397, focussing attention on the cluster's white dwarf cooling sequence. This sequence is shown to extend over 5 mag in depth, with an apparent cutoff at magnitude F814W '" 27.6. We demonstrate, using both artificial star tests and the detectability of background galaxies at fainter magnitudes, that the cutoff is real and represents the truncation of the white dwarf luminosity function in this cluster. We perform a detailed comparison between cooling models and the observed distribution of white dwarfs in color and magnitude, taking into account uncertainties in distance, extinction, white dwarf mass, progenitor lifetimes, binarity, and cooling model uncertainties. After marginalizing over these variables, we obtain values for the cluster distance modulus and age of J.lo = 12.02 ± 0.06 and Tc = 11.47 ± 0.47 Gyr (95% confidence limits). Our inferred distance and white dwarf initial-final mass relations are in good agreement with other independent determinations, and the cluster age is consistent with, but more precise than, prior determinations made using the main-sequence turnoff method. In particular, within the context of the currently accepted ACDM cosmological model, this age places the formation of NGC 6397 at a redshift z '" 3, at a time when the cosmological star formation rate was approaching its peak.
Subject headings: Galaxy: halo - globular clusters: individual (NGC 6397) - stars: luminosity function, mass function - stars: Population II - white dwarfs
1. INTRODUCTION which the estimated cluster ages ('" 16-20 Gyr) were larger than the age of the universe, based on a variety of cosmological tests The oldest known stellar systems in the Milky Way are the (e.g., Bolte & Hogan 1995). However, over the last decade, imglobular clusters. As such, their nature reflects the conditions provements in the distance measurements to globular clusters, under which our Galaxy first formed and offers a unique window particularly using the Hipparcos satellite, have resulted in a IQwerinto the high-redshift universe. Age determination of globular estimate for the mean age of the metal-poor (hence oldest) globclusters by fitting models to the main-sequence turnoff (MSTO) ular clusters (>10.4 Gyr at 95% confidence; Krauss & Chaboyerhas a long and venerable history (Sandage 1953; Janes & Demarque 2003), which is now consistent with the age of the universe es1983; Fahlman et al. 1985; Chieffi & Straniero 1989; VandenBerg timated from microwave background measurements (Spergel et al.et al. 1996 and references therein). For a long period of time, the 2003). As befits a mature method, the accuracy of this MSTO results of these studies led to a so-called cosmological crisis, in method is currently limited by a variety of systematic errors (distance and metallicity uncertainties, atmosphere models that do
I Based on observations with the NASA/ESA Hubble Space Telescope, ob not fit the shape of the turnoff). This method has been carried as tained at the Space Telescope Science Institute, which is operated by the Associ far as it can go with current technology and further significant imation of Universities for Research in Astronomy, Inc., under NASA contract NAS 5-26555. These observations are associated with proposal GO-I 0424. provements must await technical advances, such as improvements
2 Department of Astronomy, University of California Los Angeles, Los Angeles, in distance measurement using the Space Interferometry Mission CA 90095; [email protected], [email protected], [email protected]. (Chaboyer et al. 2002).
J Institute for Geophysics and Planetary Physics, University of California In the past several years, we have embarked on a program to Los Angeles, Los Angeles, CA 90095.
measure the ages of globular clusters by an entirely different 4 Department of Physics and Astronomy, Rice University,. Houston, TX
77005; [email protected]. method-measuring the white dwarfcooling sequence (WDCS) 5 Department of Physics and Astronomy, 6224 Agricultural Road, University and determining the age by modeling the rate at which they cool
of British Columbia, Vancouver, BC, V6T JZ4, Canada; [email protected]. (Hansen et al. 2002,2004). This method also has a distinguished 6 Department of Physics and Astronomy, Dartmouth College, 6127 Wilder history when applied to the stel1ar population in the solar neigh
Laboratory, Hanover, NH; [email protected]. 7 Canada-France-Hawaii Telescope Corporation, P.O. Box 1597, Kamuela, borhood (Winget et al. 1987; Wood 1992; Hemanz et al. 1994;
HA, 96743; [email protected]. Oswalt et al. 1996; Leggett et al. 1998; Hansen 1999; Harris et al. 8 Department of Mathematics and Statistics, Monash University, Clayton, 2006), but it has only recently become possible to apply the same
Victoria 3800; Australia, [email protected]. method to globular clusters because of the extreme requirements 9 Hubble Fellow, Lick Observatory, University of Califomia Santa Cruz, Santa
such measurements place on both resolution and photometric Cruz, CA, 95064; [email protected]. 10 Department of Astronomy, University of Washington, Seattle, WA 98195; depth.
[email protected]. Our initial measurements of the age of Messier 4 (M4), the 11 Department of Astrophysics, Division of Physical Sciences, American closest globular cluster to the Sun, yielded a best-fit age of 12.1 Gyr,
Museum of Natural History, Central Park West at 79th Street, New York, NY, with a 95% lower bound of 10.3 Gyr. This is similar to the accuracy 10024-5 J92; [email protected]. 12 Hertzberg Institute of Astrophysics, National Research Council, Victoria, achieved by the latest MSTO analysis (l2.6~~:~ Gyr) by Krauss &
BC, Canada; [email protected]. Chaboyer (2003). The M4 measurement was performed using the
380

HANS}
o 0 . .. o
I
15
25
30
o 0 ...
•
00
o. \ ...... . .. \ . -.. ... ... o 0 0
. . ,. . o 0
. o
4-o " o :
o 0 0 o ....~ .
:'c, o 0... .. .
o 1 2 3 F606W-F814W
FIG. l.-ACS color-magnitude diagram for our field in NGC 6397. All real point sources are shown (so the extended galaxy population is not shown). Prominent features include a cluster main sequence, a clear main-sequence turnoff, and a clear white dwarf cooling sequence. Most important is the clear evidence for a sharp decline in the number ofwhite dwarfs at magnitudes greater than F814W = 27.6. The detectability of sources at fainter magnitudes is evident from the fainter, bluer population of background galaxies that survive the point source cuts.

No. I, 2007 NGC 6397 WHITE DWARFS 383
~... '"
...
...
..
•.
.. ••
....,.-.. .~.• .-:" ~ . ~.
• «t. _.-4 ••
'10 • \;.
;•
. .
. ~
..
24
22
1.5
26
28
o 0.5 1 F606-F814
ICENXSI>O.02
.... • • . .. .. .. .. ...
• tI ••• , I, •.. . 7" .~~,: -:. e••
'l-:" -.. \ ..' ......)i':,.. .' ,~. ...' . ,• a_a !Ie ........ •
•.
...-.,. -- .. ..-r.: ,.~.' ..' " •• :1,..,- •• .. ' '•• ."~ ..; .......::. ,"..,: . . .. ,. g &0". • '.· ' -.,..~:. ... ':.'· f1'.~ , -.,1_....... .. ... ,.. ,. ,
.• '~?··:'-L'" Jo......: .•~.··'t-L,W:-·· '.,. .••- •• I'·'. .3 .·\. Jf~~"'~t-'::~ ..."" ..
. .It"· .t.-:.. , .. ' . · I ••
• ' ~ /tA.. ~I • ,~••• •••, •. .···r' ".,J.'# "'V .. ). ~.. : ............ ~. ~ .. \,.
• .' .J••• ,.~. • ~ ~.. . \......,~.
o 0.5 1 1.5 F606-F814
FIG. 2.-Lefl: Point sources in the region of the color magnitude diagram that encloses the white dwarfpopulation. Right: The full population ofextended sources in the same region-this is the background galaxy population.
tests to predict the final distribution of colors expected after accounting for observational scatter. We may then characterize how well this fits with the true observed color distribution using the X2 statistic. By varying the value of the true underlying color until we find the minimum of X2 at each magnitude, we may then derive the best-fit color as a function of magnitude-an empirical cooling sequence.
This is shown in Figure 6. This may seem superfluous given that, in subsequent sections we fit model atmosphere colors to the data. However, there are still several issues outstanding in the chemical evolution and atmospheric modeling of white dwarfs, which means that there is some uncertainty in the final model colors (Bergeron et al. 1997; Bergeron & Leggett 2002). So, it is of interest to see what kind of relationship between color and magnitude fits the data independent of theoretical models. In particular we see evidence in Figure 6 (in the form of a turn toward the blue) for the deviation from blackbody trends (Hansen 1998; Saumon & Jacobsen 1999) expected due to collisionally induced absorption by molecular hydrogen in hydrogen-rich white dwarf atmospheres (Mould & Liebert 1978; Bergeron et al. 1995a; Borysow et al. 1997). Below we will see that this empirical relationship is similar to that found from theoretical hydrogen atmosphere
models, suggesting that our sample is dominated by hydrogen atmosphere dwarfs.
Furthermore, this empirical sequence should allow other groups to compare their models to the data. Table 2 gives the best-fit colors as a function of magnitude.
2.6. Distance and Extinction
In both the MSTO and WDCS methods, the determination of the distance to the cluster is a fundamental aspect of the age measurement. The traditional method for globular clusters is to compare the main sequence with local, metal-poor subdwarfs with known parallaxes to determine the distance. We take our default distance to NGC 6397 to be /-La = 12.13 ± 0.15 by Reid & Gizis (1998), who used Hipparcos distances for the subdwarfs in Vand J for their main-sequence fit. This also assumes a reddening E(B - V) = 0.18 for this line of sight. We chose this determination because most other main-sequence distance determinations to NGC 6397 use the B and V bandpasses, so that the Reid & Gizis work is a more direct comparison to the bandpasses used here. We examine this further in § 4.2.
Although we shall later compare to the distance and extinction derived from the main sequence, we prefer to initially detennine
••
25
26
• •
·1 ••
.~:. ~ ..•••.'
•
,
•
••'" ~
• •
• •
• . .. '.
'" ..
. '.
.
.'", •
27
• • •
•
• •
••
• •• •
..'
' . •
•
\e •
•
28 •
., •••
• .. ,
.' • •
• • • • • •
0.5 1 1.5 0.5 1 1.5 0.5 1 1.5 F606W-F814W F606W-F814W F606W- F814W
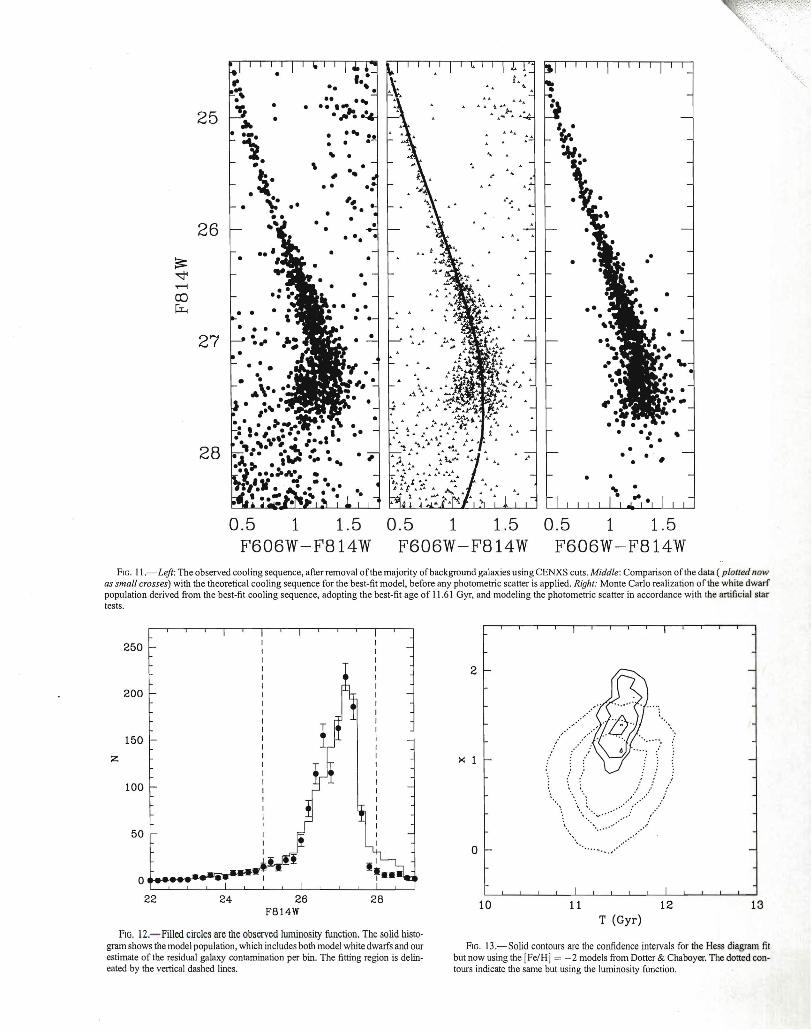
FIG. 11.-Left: The observed cooling sequence, after removal ofthe majority ofbackground galaxies using CENXS cuts. Middle: Comparison of the data (plotted now as small crosses) with the theoretical cooling sequence for the best-fit model, before any photometric scatter is applied. Right: Monte Carlo realization of the white dwarf population derived from the best-fit cooling sequence, adopting the best-fit age of 11.61 Gyr, and modeling the photometric scatter in accordance with the artificial star tests.
250
200
150
z
100
50
0
2
>< 1
o
•
,
....)
,. .,'
" "
.'.' ...... .'
.- ....
22 24 26 28 10 11 12F814W T (Gyr)
FIG. 12.-Filled circles are the observed luminosity function. The solid histogram shows the model population, which includes both model white dwarfs and our FIG. 13.-Solid contours are the confidence intervals for the Hess diagram fit estimate of the residual galaxy contamination per bin. The fitting region is delin but now using the [Fe/H] = -2 models from Dotter & Chaboyer. The dotted coneated by the vertical dashed lines. tours indicate the same but using the luminosity function.
13

~cW~~r--
~~--~.y~~
OA4 ~u.e6n/' ~~ J~.s &. 0- S~~~ Q.
~ ~) !'&1LOO r ~ ~ ~
,d~~~
tki ~ = ',3 : <. ~~
~'"" f>-":/iD.-u NoOe&L ~ ?S. -.k ~ ~~~r~f~
.' .:. ~'
;L78 -"""i~~ WINGET EI' AL 0,07 31S L. 77 ~'8'7) VoL 31.5
9 10 11
-2
-3
0.0 -1.0 -2.0 -3.0 log (lA"
FlO. I.-The white dwarf lumiDolity distribution. Tbc circlcI represent !he obsened DWDber of white dwarfa in each lumiDolity biD; the JOIid !iDe ,hoWl the theoretical distnbution. The vertical am, •• is 10& N (pc-lM.;.l).

KC ~ G03 ~
5
4
3
2
" ,.-:.":• • • • , t 1 Disk . . . . . .. . :.:.:.:.:.:.;. . . .• . . • . . . . . . • I' ~
f '. " ••••••••••••.' .' ,. ", t,. '. •• • • • • • • • • • • • • • • •••• •••••••••• • ' .' .' .' .' .' .' .' .' .' I". " . .. . .. . . . .. . . ..'. . ... . . . . . . . .. . . "
••••••••••• ' .' .' .' .' .' .' .' .' .' .' ,1. .. . . . . . . . .. ...' .' .' ... ,' ....' ..... ..', "o 6 8 10
T (Gyr)
~nmg FIG. 26.- Solid curve indicates the relationship between cosmological red
h the shift z and look-back time for the best-fit flat universe model from Spergel et al. their (2003). The shaded regions indicate white dwarf cooling ages (2 a range) for the atton Galactic disk (Hansen et al. 2002) and NGC 6397 (this paper), and the arrow mnd indicates the lower limit on the age for M4 (Hansen et al. 2004). Above the plot et al. we show two 95% lower limits. The limit marked KC indicates the lower limit for t un the age of the globular cluster system as whole, taken from Krauss & Chaboyer >ased (2003). The limit marked 003 is the 2 a lower limit on the age ofNGC 6397, based
on the results of Gratton et al. (2003). The comparison indicates that our age determination is consistent with, but also more accurate than, the best measurements 11 ("11'"\ n- f-h &> 1\ IfQ'lY, ~ of-\.. ",.1
12 14

~ eki. ,rj~iY k&t.6~
~ S4~ ~ d- ~ meZU -~ &d r ~
~£ ~~d:o'~ -~ eve ~~
~ [~#] > f-O·3 (~Ce., ~)
Dr [tel#'] < - /·0 (Ko sola/')
z
-.5 0 .5 1 1.5 [Fe/H]
FIG. 17.-The hatched area represents a frequency ...lstogram of Rich ( 1988) solution 1[Fe/ H], corrected for the regression relation found here. The solid histogram outline represents the solar neighborhood GK giant distribution found by McWilliam (: 990), smoothed by a Gaussian of (J = 0.25 dex. Note that the bulge giants have a similar mean [Fe/H] but a slightly broad~r distribution and more very metal-poor stars.
20
o~. 10
-1.5 -1

B. Nordstrom et al.: The Geneva-Cop 1010
200
rIJ
~ 150 0+-> rIJ
' o J... Q)
.D
§ 100 z
50
.. , OL..--~=------'-----'----J._.L....--'-----'----'------'----JL..---'-----L.---'-'-""""--I._"----'
-1 -0.5 0 0.5 [Me/H]
Fig. 26. Distribution of metallicities for the volume complete samp] of single stars (full histogram). For comparison the dotted curve sho\\ the reconstructed distribution for G dwarfs from J0rgensen (2000 which is corrected for scale height effects and measurement errors.
However, as pointed out by Edvardsson et al. (1993) then selves, the restriction of their sample to F-type dwarfs autc matically excluded any old, metal-rich stars if such existed, fact that has been overlooked in several later discussions. Th

~ llersdd ~ couds 0/ ~ ~~
~.v:> to -.k "- ""r ~ ~S'~
( k-,y"'& <t-J~ w'V)
@110~~</~~U'~~
ro ~ J ~ ~ ~ a.:o~ od- ~ ~~
~z;d~cr z:4-J~j a/Jj; s~ ~ ?
~> ~~~ ~ ~~ee..-) gtLT:
· ,>:fltV5 ..~ ~ ~$" --,;. ............. ..a ""-~ ..,...-....e
~ ~~~~6-~~t&JJ 0d:-b6~ ~)
~ a.»~ wdL tJk.~ ~ ~~ a.. ~ . . t'
<>/ ~ #R ~~ ~~~ /JL ~t-<L ~s5 -{; G\.
~r:~

-.Llr_ ~.s~ CD~:t:S ~..- CN~-'UI.OIf-
/~~~~~!J~: <s-O pc.. ~S '300 - .350
~~ .s&'cIt4. ~
~ u;,Wl..? ~~ 6z.~~ 4-e. ?

..
9it~ rk6 ~t:- oIJ;cI£c{ ~ o~ c.7a6~
~CL r'k~~ r eV(l tyks !y0 ....
OQ.'\,.. o&r ~ ~ ~ 1981)
S'tjJILS~ I- oiJ.:.v , ~ .s~ cI M ~"U
-- ,("a-et fr-. aa:~ r~ 1IQ.&akJJ~.
~~) s~ CD~~ C$~&Au~)
:S'tlJlVjlRrL UJ- ~ /),1~ ~ ok ~ "l.
tZci, ~.
Q : wIJ-/Jrob~ ~ ~ ~ M~
~ Y'~ .k~<cAD'.-v '# ~~
<U>~ dAr co......zs ? ("¥,4U~ /o~ '~~' PO/lJ~~)

-3 1 -4 , l
, , -.. , , ,t'J I
C) •, , , 1
p., -., I
~ -5 r ""-"" "
bD
,
l 0.- ]
I 1-,-6
_7~---"-""':""'....L...-....l....-J.......L---l..--J.......L.-....l..-.l.-...II.......L---l.........l.......l..-.l.-...II.......L---L..-l---I......J.......J
o 1000 2000 3000 4000 5000 z/pc
Figure 10.22 The space density as a function of distance;; from the plane of l\IS stars with absolute magnitudes 4 < AIv ~ .5, The full lines are exponentials with scale heights ;;0 = 300 pc (at left) and ':0 = 13.50 pc (at right), The dashed curve shows the sunl of
R", these two exponentals.