The White Dwarf Cooling Age of the Open Cluster NGC 2420
33
arXiv:astro-ph/0006033v1 2 Jun 2000 The White Dwarf Cooling Age of the Open Cluster NGC 2420 Ted von Hippel Gemini Observatory, 670 North A’ohoku Place, Hilo, HI 96720, USA email: [email protected] Gerard Gilmore Institute of Astronomy, Madingley Road, Cambridge CB3 0HA, UK email: [email protected] ABSTRACT We have used deep HST WFPC2 observations of two fields in NGC 2420 to produce a cluster CMD down to V ≈ 27. After imposing morphological selection criteria we find eight candidate white dwarfs in NGC 2420. Our completeness estimates indicate that we have found the terminus of the WD cooling sequence. We argue that the cluster distance modulus is likely to be close to 12.10 with E(B-V) = 0.04. With these parameters we find a white dwarf cooling age for NGC 2420 of 2.0 ± 0.20 (1σ) Gyrs. The 0.20 Gyr uncertainty includes errors in the photometry, sequence fitting, precursor time scales, and theoretical white dwarf cooling time scales. Comparing the cluster white dwarf cooling age to ages derived from stellar isochrone fitting we find a preference for ages derived from models incorporating convective overshoot. Subject headings: Galaxy: stellar content – open clusters and associations: individual (NGC 2420) – stars: evolution – white dwarfs 1. Introduction NGC 2420 has been the subject of numerous investigations primarily due to its combination of richness and age. Richness, of course, allows one to find stars in many of the rarer stages of stellar evolution, and in turn make detailed comparisons between stellar evolution models and the properties of either individual stars or the cluster as a whole via the cluster color magnitude diagram (CMD) and luminosity function (LF). NGC 2420 is roughly 2 Gyrs old, placing it on a logarithm age scale approximately evenly between the ubiquitous young open clusters such as the Hyades and the oldest star clusters known, the Galactic globular clusters. Overall, stellar evolutionary theory is in an advanced state with sophisticated predictive abilities, including ages that are rapidly becoming more reliable (e.g. Pols et al. 1998; Dominguez et al. 1999). A number of important uncertainties remain in stellar evolution theory, however. One of the two biggest uncertainties is the calibration between the theoretical temperature - luminosity plane and the observational color - magnitude
Transcript of The White Dwarf Cooling Age of the Open Cluster NGC 2420
arX
iv:a
stro
-ph/
0006
033v
1 2
Jun
200
0
The White Dwarf Cooling Age of the Open Cluster NGC 2420
Ted von Hippel
Gemini Observatory, 670 North A’ohoku Place, Hilo, HI 96720, USA
email: [email protected]
Gerard Gilmore
Institute of Astronomy, Madingley Road, Cambridge CB3 0HA, UK
email: [email protected]
ABSTRACT
We have used deep HST WFPC2 observations of two fields in NGC 2420 to produce
a cluster CMD down to V ≈ 27. After imposing morphological selection criteria we
find eight candidate white dwarfs in NGC 2420. Our completeness estimates indicate
that we have found the terminus of the WD cooling sequence. We argue that the
cluster distance modulus is likely to be close to 12.10 with E(B−V) = 0.04. With these
parameters we find a white dwarf cooling age for NGC 2420 of 2.0±0.20 (1σ) Gyrs. The
0.20 Gyr uncertainty includes errors in the photometry, sequence fitting, precursor time
scales, and theoretical white dwarf cooling time scales. Comparing the cluster white
dwarf cooling age to ages derived from stellar isochrone fitting we find a preference for
ages derived from models incorporating convective overshoot.
Subject headings: Galaxy: stellar content – open clusters and associations: individual
(NGC 2420) – stars: evolution – white dwarfs
1. Introduction
NGC 2420 has been the subject of numerous investigations primarily due to its combination
of richness and age. Richness, of course, allows one to find stars in many of the rarer stages of
stellar evolution, and in turn make detailed comparisons between stellar evolution models and the
properties of either individual stars or the cluster as a whole via the cluster color magnitude diagram
(CMD) and luminosity function (LF). NGC 2420 is roughly 2 Gyrs old, placing it on a logarithm age
scale approximately evenly between the ubiquitous young open clusters such as the Hyades and the
oldest star clusters known, the Galactic globular clusters. Overall, stellar evolutionary theory is in
an advanced state with sophisticated predictive abilities, including ages that are rapidly becoming
more reliable (e.g. Pols et al. 1998; Dominguez et al. 1999). A number of important uncertainties
remain in stellar evolution theory, however. One of the two biggest uncertainties is the calibration
between the theoretical temperature - luminosity plane and the observational color - magnitude
– 2 –
plane. The other of the two biggest uncertainties is the theory of convection (note, however, the
recent advances of Canuto and coworkers, e.g. Canuto 1999; Canuto & Dubovikov 1998), relevant
both near the surfaces of stars with Teff ≤ 6500 and in the cores of stars more massive than the
Sun. Because of its age, and therefore the mass of stars currently evolving off the main sequence,
NGC 2420 provides an important test of the degree of convection in stellar cores. The details of
convection in stellar cores, in turn, have important ramifications throughout astronomy.
Recent work in cosmology and galaxy evolution has led to increased interest in stellar evolu-
tionary ages. For galaxy evolution studies much current effort is being placed on determining the
initial epoch of galaxy building and star formation. All of these studies rely on evolutionary time
scales set by stellar evolution.
Because of the importance of stellar ages we have sought to test stellar evolution theory itself
from outside the traditional approaches. Traditional tests of stellar evolution are based on using
stellar evolution models to reproduce the properties of stars in stellar clusters and binary pairs.
White dwarfs (WDs), on the other hand, can be used as chronometers with almost complete
independence from the theory of main sequence stellar evolution. There is a well-defined relation
between the luminosity and age of a white dwarf (e.g. Iben & Tutukov 1984; Wood 1992; Salaris
et al. 1997), especially during the first few billion years of WD cooling before crystalization effects
become important. White dwarfs have been recognized as potential Galactic chronometers since
at least the proposal by Schmidt (1959) that the age of the Galactic disk could be found via the
luminosity limit of local WDs. Subsequently a number of studies (e.g. Winget et al. 1987; Liebert,
Dahn & Monet 1988; Wood 1992; Oswalt et al. 1996; Leggett, Ruiz & Bergeron 1998) of the WD
LF have measured the age of the Galactic disk. White dwarfs have also been found in clusters
ranging in age from the Pleiades (one WD in this ≈ 70 million year old cluster) to the globular
clusters. White dwarf cooling ages have been derived for numerous young clusters, e.g. NGC 2451
(Koester & Reimers 1985), as well as a few clusters of intermediate age, e.g. Praesepe (Claver
1995), NGC 2477 (von Hippel, Gilmore, & Jones 1995, hereafter paper 1), NGC 2420 (paper 1),
and M 67 (Richer et al. 1998). In addition, lower limits that do not yet test stellar evolution theory
have been derived via WD cooling ages for NGC 188 (von Hippel & Sarajedini 1998) and M 4
(Richer et al. 1997). A number of other open and globular clusters are also known to contain WDs.
For a recent summary of known cluster WDs see the compilation of von Hippel (1998).
Overall, there is a clear consistency between the WD cooling ages and the isochrone ages,
which is comforting to note. Within this overall consistency, however, there are stellar evolution
models with ages that either do or do not closely match the WD cooling ages. In this paper we
make a detailed comparison between the WD cooling age we derive for NGC 2420 and nine modern
isochrone ages. From this comparison we find that models with convective core overshoot are
favored over canonical (no convective core overshoot) models for this cluster.
In order to avoid confusion, we note that some authors (e.g. Trimble & Leonard 1996;
Dominguez et al. 1999) interpreted the WD ages we (von Hippel et al. 1995) derived for NGC
– 3 –
2420 and NGC 2477 as inconsistent with any isochrone ages for these clusters. Certainly, there was
no consistency between the isochrone ages available at that time and our WD age for NGC 2477.
On the other hand, in 1995 there were no modern isochrone studies for NGC 2477. At that time,
the most recently derived age for NGC 2477 (Carraro & Chiosi 1994) was not based on isochrone
fitting, but rather on an isochrone-based calibration of the magnitude difference between the main
sequence turn off and red clump luminosity. An improved WD age with a more detailed analysis
of NGC 2477 will be the subject of a future study. For the present study we focus on NGC 2420,
where the isochrone and WD age comparisons yielded ambiguous results in paper 1. The primary
purpose of paper 1 was to show the power of using WD cooling time scales as an independent test
of ages derived from stellar evolutionary theory. We will show here that the increased reliability
of the observational results for NGC 2420, as well as the large body of new theoretical work for
this cluster, makes it worthwhile to recompare the WD and isochrone ages for this cluster. Finally,
we note that the current paper supersedes paper 1 as it contains more and deeper observations
obtained with an improved observational technique, and it is based on a much-improved under-
standing of the WFPC2 calibration. Paper 1 was based on data taken within three months of the
installation of WFPC2, before calibrations were well-established.
2. Observations and Reductions
We observed a single field in NGC 2420 with the Hubble Space Telescope (HST) and the
then new Wide Field Planetary Camera 2 (WFPC2) in cycle 4. These observations were designed
to find white dwarfs in NGC 2420 to the terminus of the cooling sequence. Limited experience
with WFPC2 at that time resulted in a data set in which hot and warm pixels were hard to
distinguish from faint white dwarf candidates. Our study of the cluster WDs and their implied age
was presented in paper 1. After our experience with the cycle 4 data it became clear that a reliable
determination of the terminus of the WD cooling sequence required dithered observations as well
as twice the number of cluster stars.
In cycle 6 we obtained two additional V-band (F555W) pointings on our cycle 4 field (hereafter,
field 1), each slightly offset from the other and from the cycle 4 pointing. We also obtained new
V- and I-band (F814W) observations of a second field (hereafter, field 2). We obtained a slightly
different set of individual exposure lengths and total exposure times for field 2, based on our
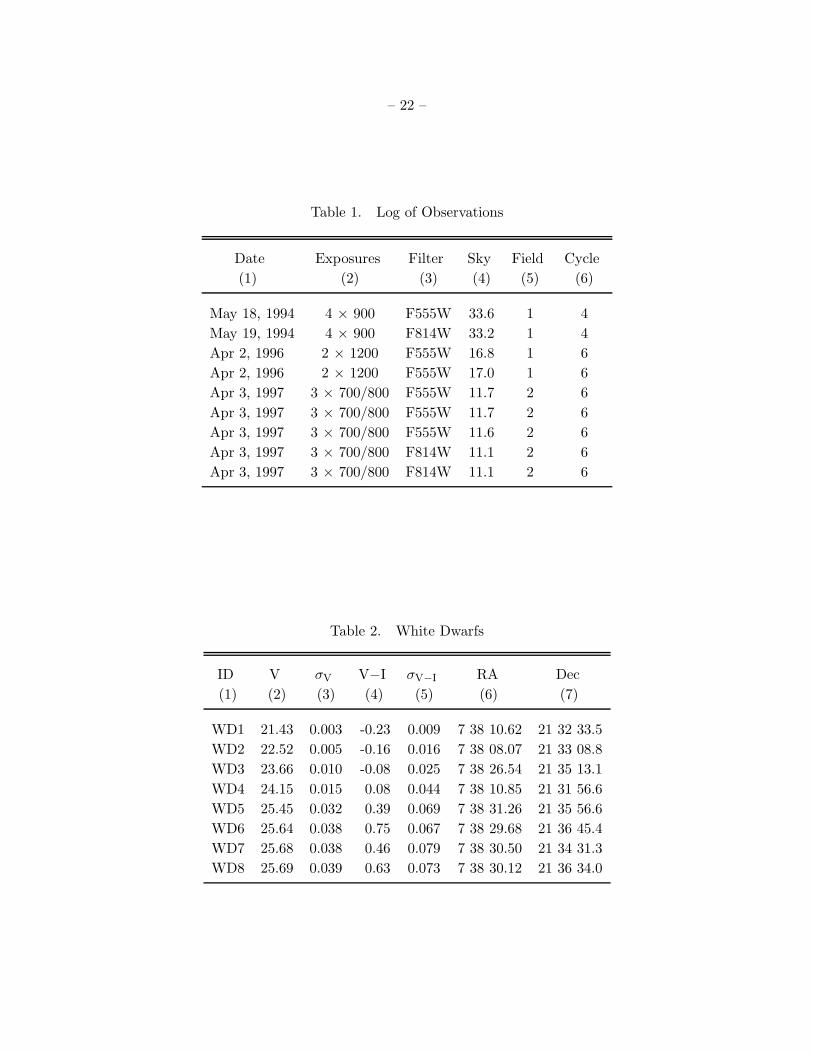
experience with field 1. The details of the observations are given in Table 1. The first column
of Table 1 lists the dates of the nine different NGC 2420 pointings. The second column lists the
number of exposures and the length of each exposure in seconds. The last five entries indicate
three exposures composed of individual exposures of both 700 and 800 seconds. The third column
lists the WFPC2 filter used, the fourth column lists the observed sky value in counts, the fifth
column lists the field identifier we use throughout the text, and the sixth column lists the HST
cycle number in which the observations were made. Fields 1 and 2 are centered 3.4 arc minutes
SW and 1.4 arc minutes NE of the apparent cluster center at 7:38:11.2, +21:33:09.7 (J2000.0) and
– 4 –
7:38:28.5, +21:35:29.1 (J2000.0), respectively.
We recalibrated the entire data set using the Canadian Astronomy Data Centre’s1 archive
pipeline with up-to-date calibration files. Following recalibration, we stacked the aligned images of
each subfield and rejected the cosmic rays with the IRAF2 task CRREJ. Since there were only a
few stars in the PC frames we dropped the PC frames of both fields from all further reduction and
analysis. We then used the drizzle package (Fruchter & Hook 1998) to shift and stack the dithered
WF frames to arrive at a combined V and a combined I frame for each of fields 1 and 2. The
drizzle process rejected most hot pixels and other image defects and produced reasonable stellar
point spread functions (PSFs). The PSFs were sometimes a bit distorted, due probably to the fact
that there were only two or three pointings per filter per field. The effect of the PSF shapes on the
quality of the photometry was small, as will be discussed below. The primary purpose for obtaining
dithered observations and incorporating drizzled reductions was to remove the hot pixels, which
worked well. We employed SExtractor (Bertin & Arnouts 1996) to find and classify sources and
CCDCAP3 (Mighell 1997), an aperture photometry task specifically designed for WFPC2 data, to
derive instrumental magnitudes.
As is well known by now, a number of small corrections must be applied to WFPC2 photometry
to fully remove instrumental artifacts. We endeavored to apply these corrections as best we could
based on the current knowledge of the WFPC2 instrument. The effect of geometrical distortions
on the WFPC2 photometry was corrected by drizzle. To remove the effects of the charge transfer
(in)efficiency (CTE) problem we used the algorithms of Stetson (1998) and Whitmore, Heyer, &
Casertano (1999). The Whitmore et al. CTE algorithm is independent of the so-called “long versus
short exposure effect”, which we corrected using the prescription of Casertano & Mutchler (1998).
Both the Stetson (1998) and Whitmore et al. (1999) plus Casertano & Mutchler (1998) approaches
gave typical corrections rising from ≈ 0.02 mag at V or I = 16 to ≤ 0.10 mag at V or I = 26. While
these two approaches differ in mathematical form and only the latter corrects the time-dependent
nature of the CTE, for our data they both gave very similar results. The mean V magnitude
difference between these two approaches among the faint (V = 22 to 26) stars is ≤ 0.01 mag. We
take this small difference as an indication that we have reliably corrected the effects of CTE, with
an estimated uncertainty in this correction no more than double the difference between these two
prescriptions, i.e. ≤ 0.02 mag.
To determine the photometric drift of the WFPC2 with time we analyzed the relevant calibra-
tion data (see Gonzaga et al. 1999) available via the Space Telescope Science Institute’s web pages.
For the epochs of our observations the corrections were always ≤ 1%, except for WF3 at one epoch
1CADC is operated by the Herzberg Institute of Astrophysics, National Research Council of Canada.
2IRAF is distributed by the National Optical Astronomy Observatories, which are operated by the Association of
Universities for Research in Astronomy, Inc., under cooperative agreement with the National Science Foundation.
3IRAF implementations of CCDCAP are available via the web at the following
site: http://www.noao.edu/staff/mighell/ccdcap/.

– 5 –
(4/2/96), which required corrections of +1.5% and +2.0% in F555W and F814W, respectively. We
chose only to correct these two cases where the photometric drifts had exceeded 1%. Since even
these frames were combined with other frames from epochs with essentially no photometric drift,
the resulting corrections were only 0.005 and 0.0067 mag in F555W and F814W, respectively. The
error on these corrections is likely to be ≤ 0.002 mag.
The fairly large number of well exposed stars on each WF chip allowed us to measure aperture
corrections for each combination of WF chip, filter, and field. The aperture corrections had typi-
cal errors of 0.01 to 0.015 mag. We also investigated whether there were any spatially-dependent
aperture corrections and found none. We did not apply any breathing corrections to the photome-
try. The fact that neither spatially-dependent aperture corrections nor breathing corrections were
necessary was most likely due to the fact that each combined image represented from four to ten
exposures covering always more than one orbit. We also did not apply corrections for the photo-
metric offsets due to pixel size differences at every 34th row (Anderson & King 1999). Although
this correction statistically affects 6% of the stars by 0.01 to 0.02 mag, the manner in which we
combined our photometry with drizzle meant that the 34th row effect would induce errors in 18%
of our photometry, but only by 0.003 to 0.007 mag.
Finally, the data were transformed to the Johnson V and Kron-Cousins I system via the equa-
tions of Holtzman et al. (1995). While the F555W and F814W filters transform well to the standard
V- and I-band system, there is naturally an error associated with this step as well, estimated to
be ≈ 2% (Holtzman et al. 1995). The Holtzman et al. photometric transformations are applicable
over the color range −0.3 < V−I < 1.5, whereas our stars continue to V−I ≈ 3.2. The emphasis in
this paper is on the cluster white dwarfs, which are within the color limits of the Holtzman et al.
transformations.
Our photometry is presented in Figure 1, where the error bars represent only the internal,
statistical photon-counting error. The external systematic error in the important cool WD region
of the color magnitude diagram, near V = 25.6 and V−I = 0.6, is the quadrature sum of the
above errors, and amounts to ≈ 0.03 mag. The dominant sources of systematic error are the CTE
corrections and the photometric transformations.
3. Discussion
3.1. The Color Magnitude Diagram
There are a large number of galaxies and remaining image defects with the approximate color
and magnitude of the faint WDs in NGC 2420 (Figure 1). One of the major motivations for using
HST for this study is the ability of this telescope to resolve nearly every galaxy in the Universe,
when sufficient signal-to-noise is obtained. Thus, if image defects can be eliminated any unresolved
object is almost surely a star. The converse of this is also true, any resolved object, even marginally
– 6 –
resolved, is not a star. For our purposes, we required good galaxy and image defect rejection beyond
the limit of the WD cooling terminus, at V ≈ 25.6. Our data are of sufficient quality to do this,
and the SExtractor classifications provided an easy means of making this separation.
Figure 2 shows the results of the SExtractor morphological classification versus V-band mag-
nitude. The “stellarity index” ranges from 0 (galaxies) to 1 (stars). Careful examination of the
images revealed that all objects with stellarity index ≥ 0.9 are unresolved (i.e. stars). Objects with
stellarity indices between 0.9 and 0.6 are a mixture of unresolved objects, very faint objects, and
image defects. All objects with stellarity index ≤ 0.2 are resolved, although some are not galaxies,
but rather ghost images or part of a diffraction spike. Objects with stellarity indices between 0.5
and 0.2 are a mixture of resolved objects, very faint objects, and image defects. The term image
defects here is meant to include the remaining hot and warm pixels, as well as residual remaining
cosmic rays, ghost images, diffraction spikes, etc.
The large number of definite stars near the top of Figure 2 demonstrates that a star cluster is
present in this field. Contamination by background galaxies becomes significant at V ≈ 25 and near
V = 27 a combination of objects too faint to reliably classify and image defects predominate. Note
also that saturated stars have a stellarity index of somewhat less than 1.0 due to their flat-topped,
broader PSFs. The stellarity index cut of 0.78 is drawn in Figure 2. This choice was somewhat
relaxed from the classification value for a typical well-exposed star since the drizzle processing
created some slightly distorted PSFs. To be considered a star, an object had to have a stellarity
index of ≥ 0.78 in either the V- or the I-band frames. By allowing the classification to be based
on either frame, we were able to bypass some of the reduced classification probabilities due to the
distorted PSFs caused by the drizzle process, as well as take into account that some of the faintest
stars are better observed in one filter than the other, depending on their color. Nonetheless, we
tried to be conservative for each of the stars that matter in this study, i.e. the WDs, and we
additionally examined each of these detections by eye to check for adjacent image defects, crowding
with stars or galaxies, or any other problem that might compromise the morphological classifications
or the photometry. The subject of morphological classification and how one compromises between
ensuring that only stars are counted and ensuring that no stars are missed will be revisited in
Section 3.3. For now we take all objects with a stellarity index ≥ 0.78 as stars and plot them in
Figure 3.
The reader might wonder whether proper motions could be used in this cluster to help differen-
tiate members from non-members. While it is true that our field 1 observations span a period of two
years, all of our field 2 observations were obtained on the same day (see Table 1). Furthermore, the
proper motion of the cluster is known to differ from the mean proper motion of bright (B ≤ 13.5)
stars in this field by ≈ 0.002 arcsec yr−1 (van Altena & Jones 1970), or only 0.04 WF pixels over
a two year baseline. The primary difference between the cluster and field is in the dispersion of
proper motions, with measured values corresponding to 0.014 and 0.064 WF pixels over the two
year baseline for the cluster and field stars, respectively. We were thus not surprised when we were
unable to detect a difference between cluster and field stars in field 1 based on the change in image
– 7 –
centroids. Our typical measuring error appeared to be ≈ 0.1 pixel. These errors could perhaps
be reduced by deriving optimized centroids, but we judged the likely additional information to
be minimal. Fortunately, proper motion information is not required as there are few remaining
contaminating objects, either Galactic field stars or unresolved background galaxies, in the WD
portion of the CMD (Figure 3).
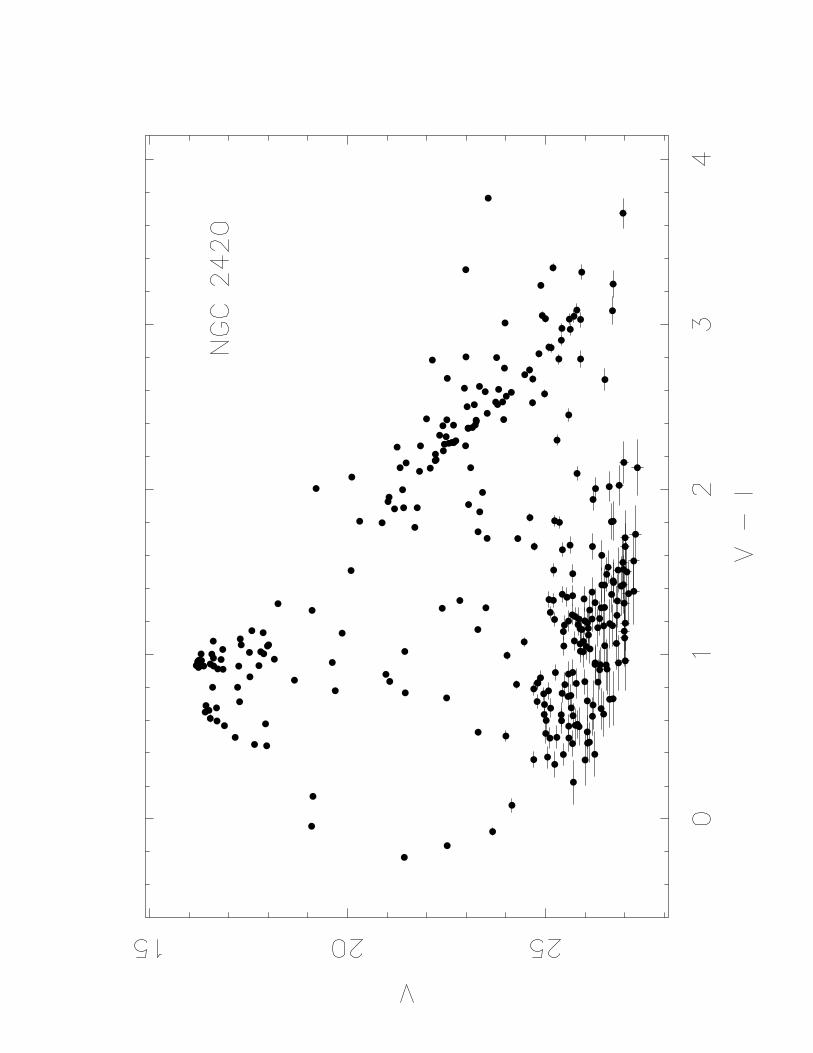
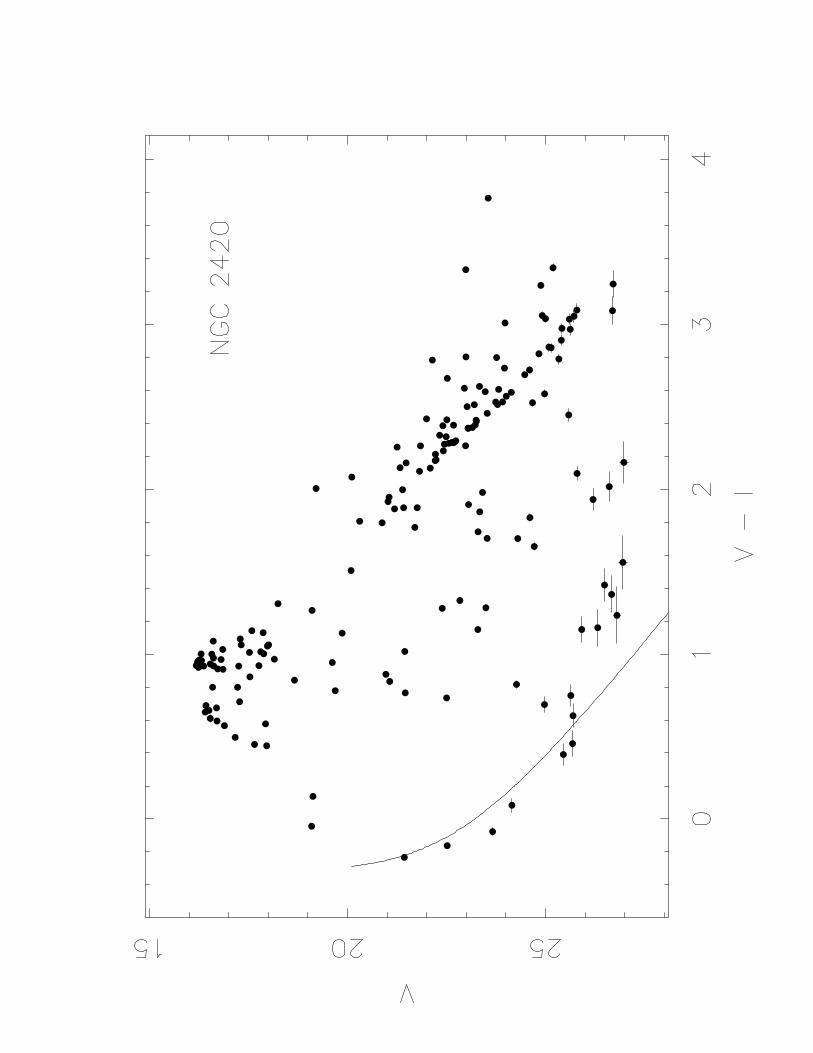
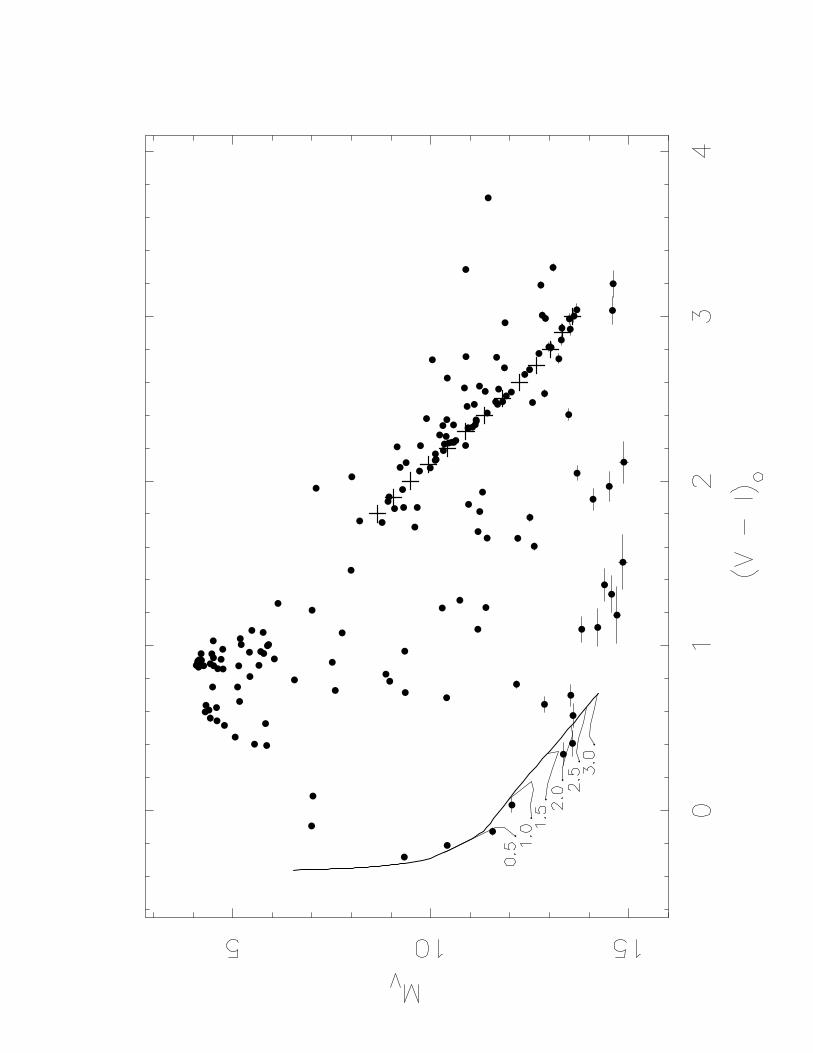
The CMD presented in Figure 3 shows a clear main sequence extending 10 magnitudes from V
≈ 16 to V ≈ 26. The apparent gap in the main sequence from V ≈ 19 to 21 is likely just a statistical
variation in the cluster luminosity function for our two fields, visually exaggerated by the pile up of
saturated photometry near V = 16. Wider field coverage of NGC 2420 would demonstrate whether
this gap is a real and unexpected variation in the cluster LF. Note that the ground-based CCD
photometry of Anthony-Twarog et al. (1990), which covered 20 times as much of the cluster as
our study, does not show this gap, though part of the gap is beyond the limit of their photometry.
Regardless of the astrophysical meaning of the gap, it is not caused by any form of incompleteness
in the HST photometry. Even stars one magnitude fainter than the bottom of the gap are readily
visible to the naked eye in the raw uncombined images even before cosmic ray rejection.
The two separate clumps of saturated stars are the result of our use of exposure times ranging
from 700 to 1200 seconds in F555W. The cluster main sequence binaries are also visible, particularly
between V = 21 and 24. In the lower left of the CMD a series of blue stars from V ≈ 21.4 to 25.6
closely follow the cooling track for a 0.7 solar mass Carbon-Oxygen WD model (Benvenuto &
Althaus 1999). The WD model was placed at a distance modulus of 12.10 (see Section 3.2). There
are also a few dozen stars sprinkled throughout the CMD between the WD sequence and main
sequence. These are Galactic field stars behind the cluster (see the discussion at the end of Section
3.1).
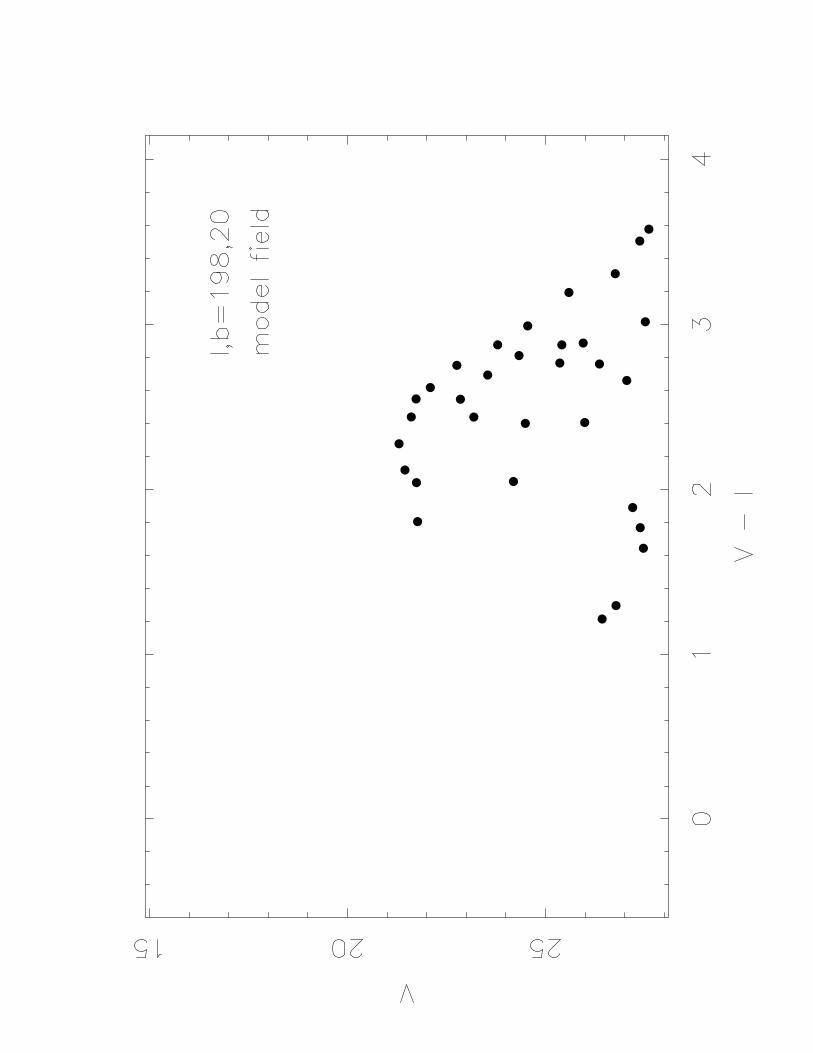
As a final tool to understanding objects in the observed CMD (Figure 3) we employed the
Galaxy model of Reid & Majewski (1993) to create a model CMD for Galactic field stars at the
location of NGC 2420. This model has been tested against north Galactic pole number counts
and color distributions (Reid & Majewski 1993) and against two deep, lower latitude fields (Reid
et al. 1996). The model CMD is presented in Figure 4. Note that the model predicts that there
should be some Galactic field stars near the cluster main sequence and a few more sprinkled in the
region between the main sequence and the WD sequence, roughly as seen in the observed CMD. By
increasing the model normalization by a factor of 10 we find the model predicts that 0.6 Galactic
disk WDs lie somewhere along the observed cluster WD sequence. This implies that there may be
a single interloper somewhere along the cluster WD cooling sequence. The likelihood of a Galactic
WD interloper in the magnitude beyond the observed WD cooling sequence limit is much lower,
however, as only 0.2 WD interlopers are expected in this region. We do not want to over-interpret
this model-dependent estimation of the numbers of WD interlopers, however, i.e. by claiming that
a +4σ enhancement in Galactic WD numbers would be required in this field to contaminate the
WD terminus, since the Reid & Majewski model has never been tested on faint field WDs. We are
simply using these model predictions to argue that it is unlikely that a Galactic field WD is among

– 8 –
the faintest observed WDs in our CMD. We further note that such an interloper need not affect the
derived cluster WD cooling age if the cluster age is determined from WD isochrone fitting, rather
than from just the faintest WD (see Section 3.3).
3.2. Cluster Parameters
The most commonly used values for the distance modulus and reddening for NGC 2420 are
(m−M)V = 11.95 and E(B−V) = 0.05, values largely supported by the data and analysis of
Anthony-Twarog et al. (1990). Anthony-Twarog et al. fit VandenBerg (1985) isochrones to their
photometry. Are results derived from these older models still the most reliable? Indeed, Anthony-
Twarog et al. noted the poor fit between the cluster turn-off region and the VandenBerg (1985)
isochrones. Subsequent reanalysis of the Anthony-Twarog et al. data by Demarque, Sarajedini, &
Guo (1994), incorporating up-to-date stellar evolution models, yielded (m−M)V = 12.05±0.10 and
E(B−V) = 0.045+0.020−0.015. In another reanalysis, Twarog, Anthony-Twarog, & Bricker (1999), in a
detailed study of the red giant clump luminosity in NGC 2420 and other open clusters, employed
stellar evolution models and main sequence fitting to rederive the parameters for NGC 2420. Twarog
et al. argued that (m−M)V = 12.15 and E(B−V) = 0.04. We take these two analyses as being
the most up-to-date and conclusive on the issue of the cluster distance and reddening, and adopt
the mean of their distance moduli, 12.10. The reddening values for the two studies are entirely
consistent, and we adopt E(B−V) = 0.04.4 In the analysis of the WD cooling ages, below, we
will determine WD age as a function of assumed distance modulus since a wide range of distance
moduli have been used in the isochrone fits. The value of the reddening does not affect the cluster
WD ages since the WD isochrone fits depend almost entirely on V luminosity, and not color. It is
comforting to note, however, that the cluster redding is low and consistent in these modern studies.
We derived an independent distance modulus by fitting the open cluster fiducial main sequence
presented by Pinsonneault et al. (1998) to the Anthony-Twarog et al. data. We found a distance
modulus of 11.85 to 12.02 for [Fe/H] = −0.4 and 11.95 to 12.10 for [Fe/H] = −0.3. Our distance
modulus is consistent with that of Twarog et al. (1999) given their assumed metallicity, [Fe/H] =
−0.29. Rather than using the distance modulus we obtained from main sequence fitting, we rely
on the above average distance modulus of 12.10, since the main sequence fitting technique is so
sensitive to the cluster metallicity.
3.3. White Dwarfs
In paper 1 (see Figure 2 of that study) we found five WD candidates in the single HST pointing.
We recovered all five of these WD candidates in our present analysis but only three of them (and
4In paper 1 we adopted (m−M)V = 11.95 and E(B−V) = 0.05.
– 9 –
only one of the faintest three from paper 1) passed our morphological classification. We imposed
tighter constraints in this study since we have both more data and a greater knowledge of our data.
The two objects excluded may very well be cluster WDs and may just have slightly deviant PSFs
due to the drizzle processing. Regardless of the cause, we wanted to minimize suspect objects, and
so do not include these objects in the CMDs of Figures 2 and 3. We note, however, that the V-band
luminosities for these two rejected potential WDs (V = 25.28 and 25.16 in our present data, V =
25.11 and 24.87 in our cycle 4 reductions) are 0.4 mags brighter than the faintest WDs presented
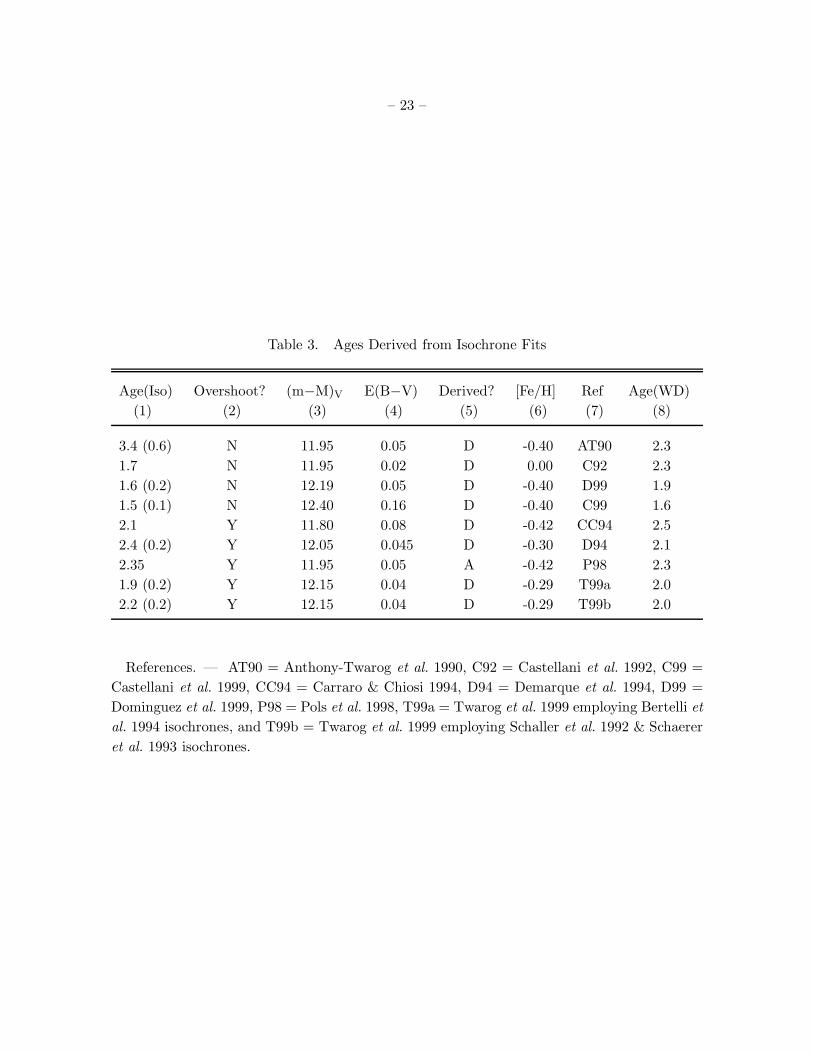
here. Their inclusion would not affect our derived WD age. Our candidate WDs are listed in Table
2. Column 1 lists a WD identification number, ordered by brightness in the V-band. Column 2
lists the object V magnitude, followed by its uncertainty in column 3. Column 4 lists the V−I
color, followed by its uncertainty in column 5. Columns 6 and 7 list the object Right Ascension
and Declination (J2000.0), respectively. The errors in position are expected to be ≈ 0.5 arcsec.
The relative positions of objects in the same WFPC2 field should be significantly more accurate,
≈ 0.1 arcsec.
Of the eight candidate WDs presented in Table 2 and Figures 2 and 3, one candidate (WD4)
had a significantly lower probability (0.71 in V, 0.23 in I compared with our threshold value of
0.78) of being stellar, according to the SExtractor stellarity index. We nonetheless retain this
object since we believe its morphological classification appears non-stellar due to crowding by an
adjacent galaxy. Furthermore, upon carefully examining this object in the V- and I-band images it
appeared that the crowding galaxy had a similar color and is unlikely to greatly change the derived
color of this candidate WD. Since we believe it is a WD and since the hotter WDs hold none of the
weight in the age fit, we present it in our CMDs.
Before applying WD isochrones to our data, we first discuss the inputs required for the WD
isochrones. First, we require a cluster distance modulus to convert apparent magnitudes to ab-
solute magnitudes. Second, we require the evolutionary ages of the precursor stars, including the
time required for them to evolve from the main sequence, through the giant branch, through any
subsequent burning stages, and through the planetary nebula stage, until they become WDs. For
precursor ages we rely on the stellar evolution parameterizations of Hurley, Pols & Tout (2000).
To connect the precursor masses to the WD masses, we employ the initial - final mass relation of
Wood (1992). Other modern studies (e.g. Koester & Reimers 1996; Dominguez et al. 1999) of the
initial - final mass relation are consistent at the level required for our purposes.
It may seem counterintuitive that ages derived via WD luminosities could be independent of
stellar evolution theory since the total age of the WD depends on the precursor ages, but the rapid
evolution of high mass stars means that the precursor time scales have little leverage on the total
age. The WDs that are presently the coolest and faintest in any cluster are those which formed first,
and therefore those which evolved from the most massive progenitors. The first stars to become
WDs had a main sequence mass somewhere between 6 and 8 solar masses with total evolutionary
time scales of ≤ 8 × 10⁷ yrs, i.e. ≤ 5% of the ≈ 2 Gyr ages considered here. In order to quantify
the uncertainty in the WD ages due to the uncertainty in the precursor lifetimes we measured the

– 10 –
difference in total age after adjusted the precursor masses by ±20%. This change in precursor
mass should account for both uncertainty in the initial - final mass relation and uncertainty in the
evolutionary time scales themselves. For example, the Wood initial - final mass relation gives a
precursor of 3.67 solar masses for a 0.7 solar mass WD. The ±20% mass values become 4.40 and
3.06 solar masses and the evolutionary time scales of these stars are 0.160 and 0.412 Gyrs (Hurley
et al. 2000). For a 0.9 solar mass WD the ±20% precursor mass values correspond to evolutionary
time scales of 0.048 to 0.104 Gyrs. These evolutionary time scales vary by a factor of more than
two, yet the effect of these precursor time scale changes, weighted among WDs of different masses,
results in a cluster WD age uncertainty of only −0.05,+0.07 Gyrs. Clearly, for clusters of ≈ 2 Gyr,
realistic uncertainties in precursor time scales are unimportant, and thus the cluster WD age is
essentially independent of stellar evolution theory.
As a check on the reliability of the WD cooling theory itself, we compared the WD cooling
models of different groups. Since the Wood (1992) models were provided to us in the form of WD
isochrones (Ahrens 1999) we use them as our fiducial set. The Benvenuto & Althaus (1999) and
Hansen (1999) models are in the form of cooling tracks for WDs of different masses. To these
cooling models we added the precursor time scales from Hurley et al. (2000), as discussed above.
Within the age range of 1.5 to 2.5 Gyrs, as given by the Ahrens isochrones, we found that the
Benvenuto & Althaus models were systematically older than the Ahrens isochrones by 0.18 Gyr,
and the Hansen models were systematically older than the Ahrens isochrones by 0.05 Gyrs. Rather
than use an average result from the three different sets of models, we use the Ahrens isochrones
to derive our cluster WD age and use the differences between the models as an indication of the
uncertainties in the WD cooling time scales. We estimate the age uncertainty to be ≈ 0.15 Gyrs
within the theoretical models themselves, for clusters between 1.5 and 2.5 Gyrs.
Although we believe the morphology cut we have chosen properly separates stars from galaxies,
we now demonstrate the insensitivity of our results to the chosen morphological cut. The general
issue is somewhat complicated and depends on the goal of the particular study. If we wished to
derive a minimum cluster age then we would need to reject every possible galaxy and use only objects
that are highly likely to be white dwarfs. On the other hand, if we wished to derive a maximum
cluster age then we would need to include any object that might be a cluster white dwarf. Even
without the image morphology information, the shape of the WD LF provides additional guidance,
and as our analysis will show, the minimum and maximum WD age are one and the same for these
data.
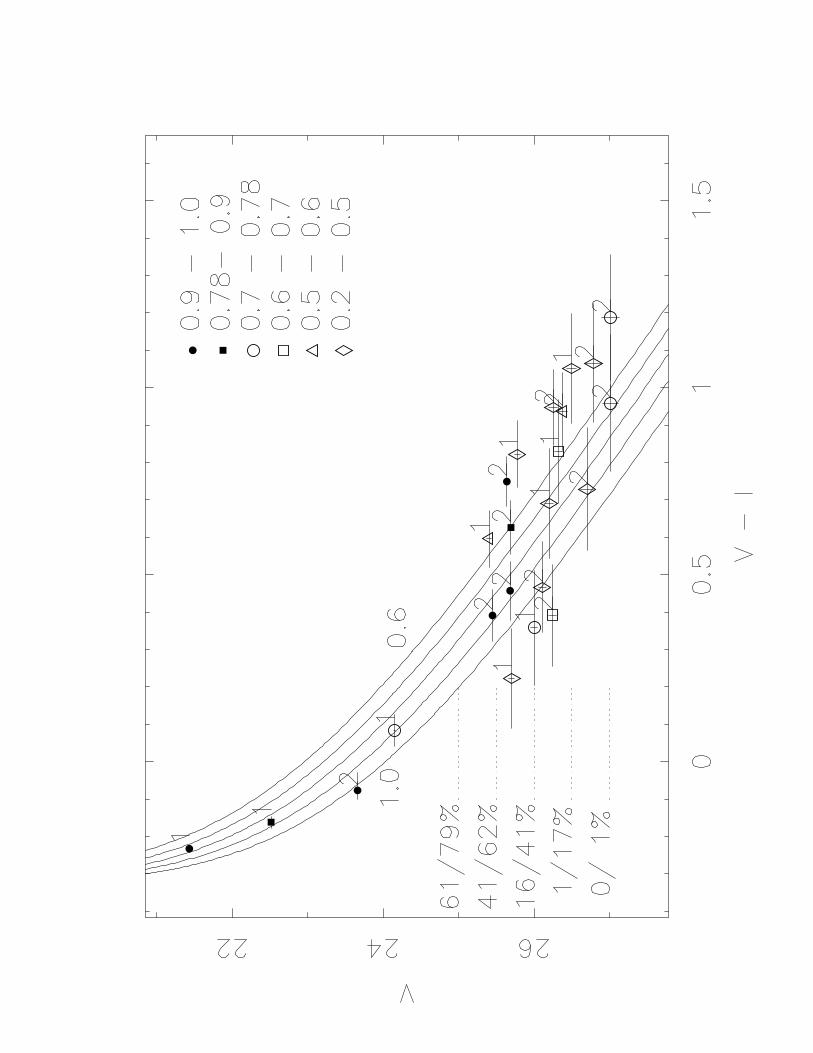
Figure 5 presents all possible candidate WDs in our two fields. These objects are selected
based on their photometric proximity (1.5σ) to the model cooling tracks for 0.6 to 1.0 solar mass
Carbon-Oxygen WDs (Benvenuto & Althaus 1999) placed at the cluster distance. The symbols
indicating the range of the stellarity index value, with the filled symbols indicating the most reliable
WD candidates. Recall that objects with stellarity index ≤ 0.2 are obviously resolved to the eye,
and so we do not include them in Figure 5. In fact, objects within the 0.2 ≤ stellarity index ≤ 0.5
range are almost surely all galaxies or image defects, but we include them in our analysis anyway,

– 11 –
in order to demonstrate that this form of noise will not approximate the shape of a WD LF. The
dotted lines in the lower left of Figure 5 are the probabilities of finding objects as a function of
luminosity, with the first and second numbers indicating completeness in fields 1 and 2, respectively.
Since the completeness levels are different in fields 1 and 2, each object is labeled with the field in
which it was found.
The completeness estimates presented in Figure 5 were determined by scaling artificial star tests
we performed on our cycle 4 data in paper 1 using the Tiny Tim package (Krist 1995). Reproducing
artificial star tests for our combined, dithered and drizzled, cycles 4 plus 6 observations would have
been laborious, but fortunately was unnecessary. The cycles 4 and 6 observations were obtained
with the WFPC2 in exactly the same configuration. Additionally, the faintest stars, i.e. those for
which the issue of completeness is the most relevant, are faint enough that sky noise dominates
shot noise in the object by a factor of two and read noise by a factor of four to six. We were thus
able to scale our earlier completeness simulations to our combined cycle 4 plus 6 data set based
on the new cumulative exposure times and sky values. We note that the limiting depth of our
CMDs is not dictated by the ability of the software to find objects at a limiting flux level, but
rather by the need for sufficient signal-to-noise to obtain reliable morphological classification and a
photometric precision of ≤ 0.15 mag in both V and I. As it turns out, both the needed photometric
and morphological precision lead to essentially the same limiting magnitude. These photometric
and morphological precision cuts are the reason so few objects are seen in Figure 3 fainter than V
= 26, even though Figure 2 shows many objects detected at fainter magnitudes.
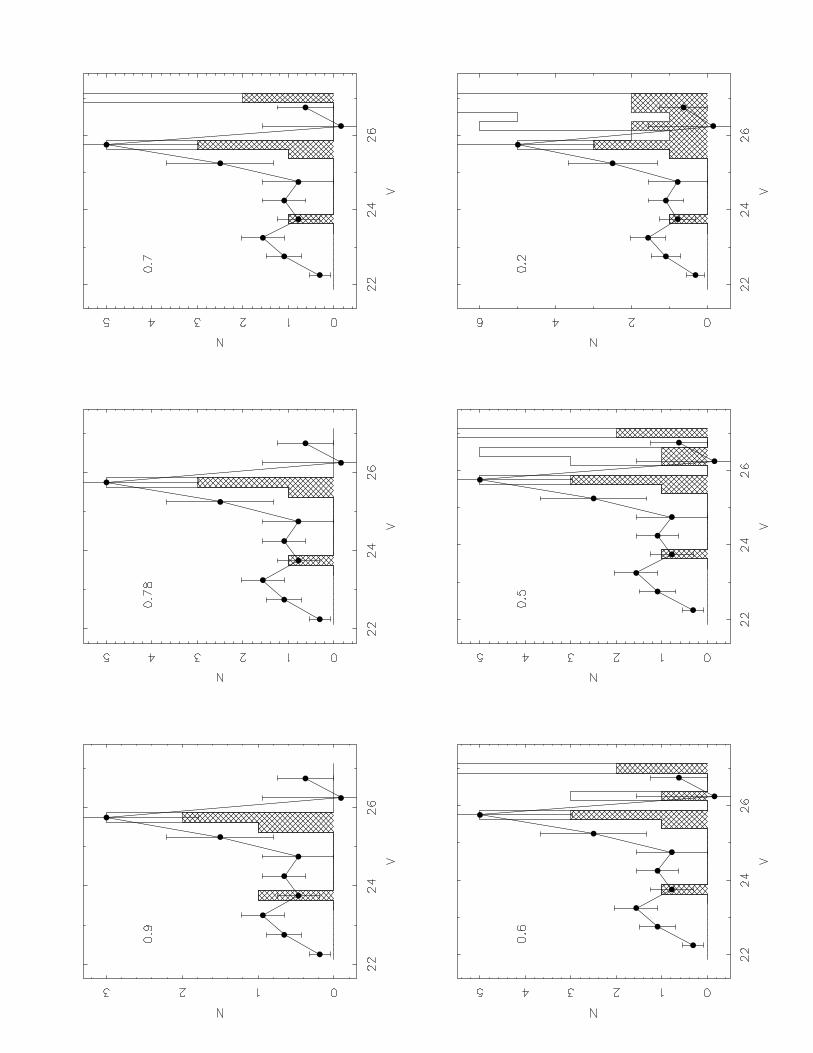
Figures 6a through 6f presents the LFs extracted by lowering the threshold through each
stellarity index cut-off for objects in field 2, with the cut-off values indicated in each panel. The bin
widths are 0.25 mag to preserve the quality of the photometry and the apparent pile-up of objects
near V = 26.6. Only objects in field 2 are presented in Figures 6a-f as the field 2 observations
probe ≈ 0.5 mags fainter than those of field 1. The cross-hatched histogram presents the observed
luminosity functions, whereas the unfilled histogram presents the luminosity functions corrected for
completeness. The final, corrected LF bin of each of panels c through f contains 200 objects. These
panels are not rescaled to view this final bin as the rest of the LFs would be invisible. Overplotted
on each panel is the WD LF derived by Richer et al. (1998) for the ≈ 4 Gyr open cluster M67.
The Richer et al. WD LF is the best open cluster, i.e. single-age burst, WD LF currently available.
They presented their WD LF with bin widths of 0.5 mag. Their error bars are due to both counting
statistics and background subtraction errors. We normalized and slid in V magnitude the Richer et
al. WD LF to match the identified LF peak. While all the panels of Figure 6 suffer from low number
statistics, only Figures 6a and 6b display reasonable LFs. If one were to insist that Figures 6e or
6f contained reasonable WD LFs, two new problems would emerge. First, there should be at least
half a dozen observed candidate WDs in the quarter magnitude bin just beyond the identified WD
LF terminus. Perhaps this is simply due to low number statistics? Second, the LFs of Figure 6e
and 6f would imply twice as many cluster WDs as main sequence stars, which would be more than
an order of magnitude more WDs than seen in any other star cluster or in the solar neighborhood
– 12 –
(von Hippel 1998).
In summary, though we find only four objects that we identify with the WD cooling sequence
terminus, we believe our identification is sound since 1) we believe our morphological selection
criteria are reasonable, 2) relaxing those morphological criteria from 0.78 to 0.7 or 0.6 does not
change the WD LF, and 3) even relaxing the morphological criteria to extreme levels only creates
LFs too absurd to be true cluster WD LFs.
A separate question is whether the cluster could have dynamically ejected its faintest WDs.
Significant dynamical ejection of the oldest WDs is not expected, however, since these WDs have
higher masses than both the younger WDs and the bulk of the main sequence stars. Strictly
speaking, the ages derived from the WD terminus provide not a cluster age, but rather a firm lower
limit to the cluster age, since both photometric incompleteness and stellar ejection could rob the
cluster CMD of its oldest WDs. If stars appear to pile up at an observed WD cooling sequence
terminus, however, it is likely that the cluster age is equal to, or just slightly greater than, the age
implied by the faintest cluster WDs.
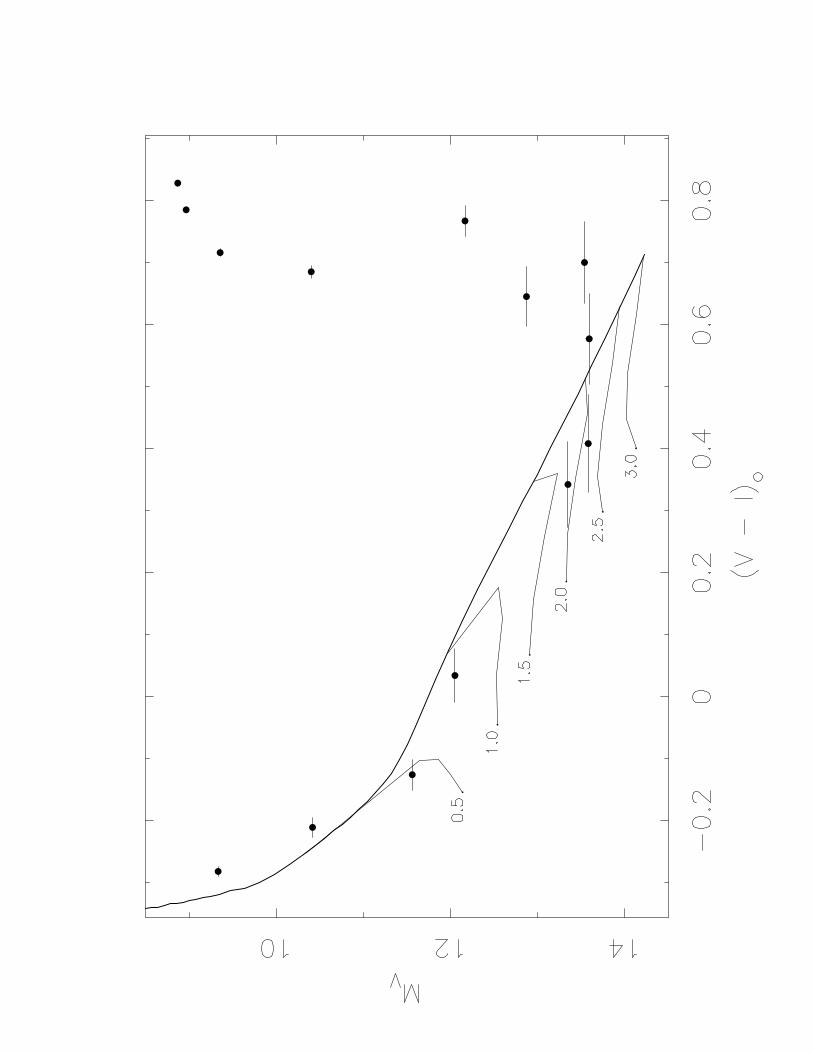
In Figure 7a we present the CMD of Figure 3 with distance and reddening removed.5 The white
dwarf region of the CMD is presented in Figure 7b. Plotted in Figures 7a and 7b are the Ahrens
isochrones abutted to a 0.6 solar mass C-O WD cooling track (Wood 1992) for 0.5, 1.0, 1.5, 2.0, 2.5,
and 3.0 Gyrs. The blue hook at the bottom of each isochrone and among the coolest WD candidates
is the expected result of both the fact that cooling is a function of WD mass and the fact that more
massive WDs are bluer. There appears to be a color offset between the reddest WD candidate and
the Ahrens isochrones of ≈ 0.2 mag, though this offset depends on the assumed cluster distance.
Likewise, the brightest and bluest WD is ≈ 0.03 mag redder than the Ahrens isochrones. The
Ahrens isochrones differ by a few hundredths of a mag in V − I color from the cooling sequences of
Benvenuto & Althaus (1999) and Hansen (1999); e.g., compare the location of these objects to the
WD tracks of both Figure 5 and Figure 7b. The most likely explanation is that the imperfect color
match between the models and candidate WDs is due to a simple combination of random and sys-
tematic photometric errors along with small uncertainties in the cooling track colors. Fortunately,
the WD isochrone fit depends primarily on the theoretically and observationally more precise WD
luminosities, and only secondarily on the colors.
We find a best fit age of 2.0 ± 0.1 Gyrs, not including photometric errors or errors in the
distance modulus. The photometric errors for the faintest WDs range from 0.032 to 0.039, with a
further systematic uncertainty in the calibration of ≈ 0.03 mag. Since all four of the faintest WDs
contribute to the age derivation the total photometric uncertainty is ≈ 0.05 mag, corresponding to
an age uncertainty of ≈ 0.06 Gyrs. Combining the photometric, fitting, precursor, and theoretical
errors in quadrature we arrive at a best fit cluster age of 2.0±0.20 (1σ) Gyrs, for (m−M)V = 12.10
5E(V−I) = 1.21 E(B−V) for the HST F814W filter, based on equations 3a and 3b of Cardelli, Clayton, & Mathis
(1989).

– 13 –
and E(B−V) = 0.04. We do not consider isochrone fits for WDs with Helium atmospheres since
most WDs in this luminosity range have Hydrogen atmospheres. We also do not consider errors in
the distance modulus in deriving a best age for NGC 2420 since it would be unfair to compare a
WD age derived with a certain distance modulus with the various isochrone fitting studies which
have assumed different distance moduli. In our comparisons between the cluster WD and main
sequence ages in the next section we instead derive a best fit age for a range of cluster distance
moduli.
3.4. Isochrone Ages
Determining a best value for the cluster isochrone age is complex. Indeed, the complexity and
importance of the age question is the reason why we have chosen to apply the WD cooling age
technique to this cluster. Because of its age, NGC 2420 is an excellent candidate to test the reality
and, if real, the amount of convective core overshoot in stars of intermediate stellar mass.
In the last decade, numerous studies have addressed the question of convective core overshoot
for NGC 2420 and derived ages with or without this component in their models. Earlier studies
of NGC 2420 predate the entire question of convective core overshoot. Since our goal here is to
compare our WD ages with those stellar evolution ages that are in current use, and in particular
to address the question of convective core overshoot, we consider the isochrone ages derived only
over the last decade. Table 3 summarizes the isochrone fits to NGC 2420 that meet our criteria, in
chronological order first for the studies employing canonical models, then for the studies employing
convective core overshoot. Column 1 lists the derived cluster age in Gyrs with any reported age
uncertainty in parentheses. Column 2 lists whether the stellar evolution model incorporated core
convective overshoot or not. Columns 3 and 4 list the distance modulus and reddening, respectively.
We do not tabulate the uncertainties in distance moduli and reddening since many authors did not
report these uncertainties. Furthermore, the relevant issue for our study is to know what distance
modulus corresponds to the reported age so that we can make the proper comparison between the
WD and isochrone age fits. Column 5 indicates whether the distance modulus and reddening were
derived (“D”) along with the cluster age or adopted (“A”) from other studies. The relevance of
derived versus adopted cluster parameters is that the use of a highly improbably distance modulus
or reddening may be an independent indication of a problem with the isochrone fitting. Column 6
lists the metallicity used in creating the isochrones. Since the metallicity of NGC 2420 is almost
surely within or very close to the range −0.30 to −0.40 (Friel & Janes, 1993), this column helps
to identify where inappropriate stellar evolutionary models may have been applied. Column 7 lists
the reference(s). Column 8 lists the WD age that would be derived for the distance moduli and
reddening listed in columns 3 and 4. These WD ages are not preferred in any way, but rather are
meant to serve as a comparison with the stellar evolution models since nearly every study used a
different distance modulus and reddening.
We now consider each of the isochrone fits listed in Table 3. While theoretical stellar evolution
– 14 –
models differ in numerous ways, including the convective mixing length used in the near-surface
regions, whether or not diffusion is included, the detailed translation from the theoretical temper-
ature - luminosity plane to the observational color - magnitude plane, and in the prescription for
convective core overshoot if used, there remains a clear difference between those studies that do
and do not incorporate core convective overshoot.
For historical comparison, and since so many recent papers adopt some of the parameters
derived by Anthony-Twarog et al. (1990), we report their results here, even though their cluster
parameters (but not their photometry) are now superseded by other studies. As remarked above,
Anthony-Twarog et al. found a problematic fit with VandenBerg’s (1985) isochrones, from which
they derived an age of 3.4 ± 0.6 Gyrs and (m−M)V = 11.95. They assumed [Fe/H] = −0.4
and E(B−V) = 0.05, both of which are reasonable values according to nearly all subsequent efforts.
Anthony-Twarog et al. argued that the poor fit between their photometry and VandenBerg’s models
likely indicated the need for models including core convective overshoot. Given the development in
stellar evolution modeling and input physics in the last fifteen years, particularly updated opacity
tables, the application of VandenBerg (1985) models in the Anthony-Twarog et al. study serves
more as a starting point for the issue of convective core overshoot than as a definitive statement.
This isochrone age is also high by all modern estimates, as our discussion will reveal.
Castellani, Chieffi, & Straniero (1992) use canonical stellar models and derive a cluster age
of 1.7 Gyrs, with E(B−V) = 0.02 and (m−M)V = 11.95. Unfortunately, these results cannot be
directly compared to those of other groups since their study was meant as a test of theory, and
they only compared the NGC 2420 photometry to solar metallicity isochrones. Nonetheless, their
derived age is consistent with the most recent ages derived by other groups using canonical models.
Dominguez et al. (1999) concluded that the complex shape of the main sequence turn-off region
in NGC 2420 is not due to convective core overshoot, as argued by many others, but rather to the
confusing photometric locations of multiple stars.6 With this interpretation they derived an age of
1.6±0.2 Gyrs and (m−M)V = 12.19. Dominguez et al. also noted the consistency of their isochrone
age with the age implied by the coolest WDs we reported in paper 1.
Castellani, degl’Innocenti, & Marconi (1999), in a study of mixing length theory (surface
convection) and models incorporating diffusion but not incorporating core convective overshoot,
derive an age for NGC 2420 of 1.5± 0.1 Gyr, along with E(B−V) ≈ 0.16, and (m−M)V = 12.4. In
this case, the high reddening and distance modulus make their age result suspect.
Carraro & Chiosi (1994) applied their convective core overshoot models to NGC 2420 and
derived an age of 2.1 Gyrs, E(B−V) = 0.08, and (m−M)V = 11.80. For the reasons discussed
above, their distance modulus may be too low, and their reddening value is likely to be modestly
too high.
6The effect of multiple stars on the turn-off region can be independently verified by radial velocity techniques (e.g.
Daniel et al. 1994), but this test has not yet been performed for NGC 2420.
– 15 –
Demarque et al. (1994) fit the photometry of Anthony-Twarog et al. with their updated models
with and without convective core overshoot. They concluded that the photometry required models
with core overshoot, with an overshoot parameter Pmix = 0.23 Hp and age = 2.4± 0.2 Gyrs. Their
distance and reddening determinations, as discussed above, appear to be of high quality.
In a series of papers Pols and collaborators (Schroder, Pols, & Eggleton, 1997; Pols et al.
1997; Pols et al. 1998) tested their canonical and overshoot models against giants of known mass,
double-lined spectroscopic binaries, and open clusters. They recommend the use of convective core
overshoot models for solar metallicity stars with main sequence masses ≥ 1.5 solar masses. This
limit of ≈ 1.5 solar masses scales inversely with metallicity and they note that for the metallicity
of NGC 2420 the limit is probably slightly less than 1.4 solar masses. In their fit to NGC 2420
Pols et al. decisively favor the overshoot models and find an age of 2.35 Gyrs and a turn-off mass
of 1.47 solar masses, after adopting [Fe/H] = −0.42, E(B−V) = 0.05, and (m−M)V = 11.95.
Twarog et al. (1999) find an age of 1.9 ± 0.2 or 2.2 ± 0.2 Gyrs based on either the models of
Bertelli et al. (1994) or Schaerer et al. (1993) and Schaller et al. (1992) respectively, all of which
employ convective core overshoot. While the real goal of the Twarog et al. study was not to
determine the isochrone age of NGC 2420, but rather to study the absolute magnitude of the red
giant branch clump, their careful study appears to yield good isochrone fits, and good values for
the cluster distance and reddening. While the Bertelli et al. isochrone age is the youngest overshoot
age derived for NGC 2420, it is still older than any of the modern canonical isochrone fits.
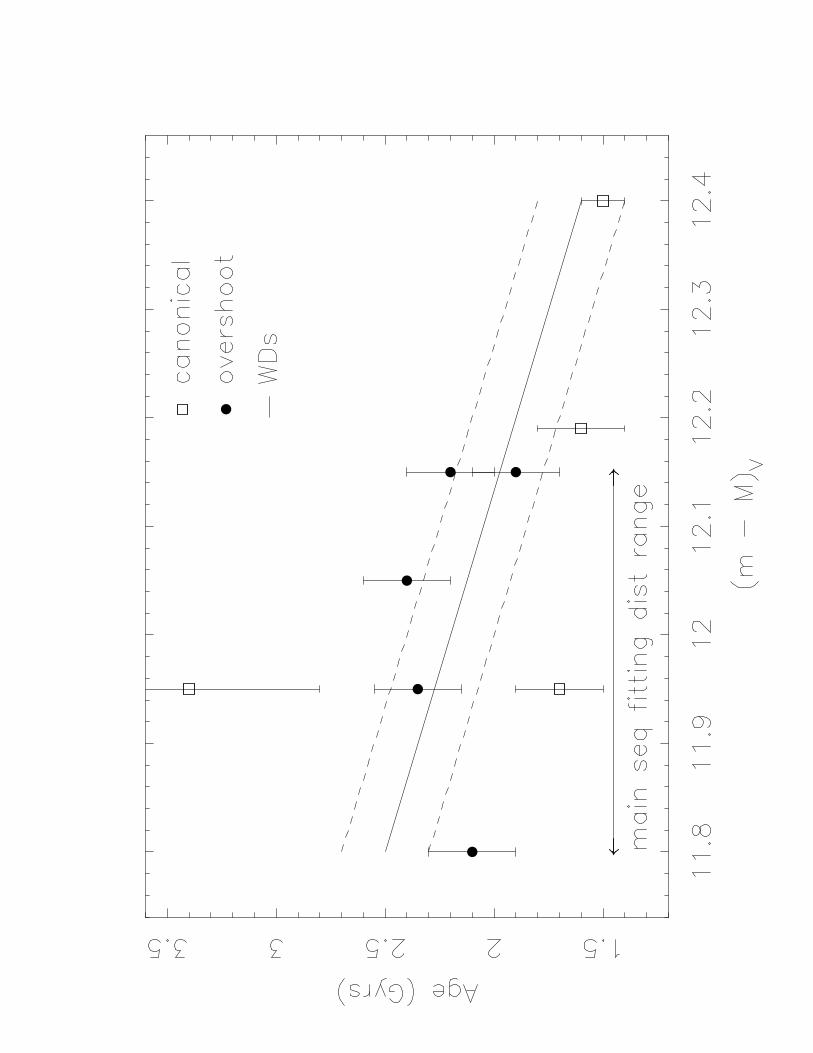
In Figure 8 we present a summary of the modern stellar evolution isochrone ages for NGC
2420 along with our WD cooling age as a function of the assumed distance modulus. The solid
line is our best fit WD cooling age. The two dashed lines represent the ±1σ differences from our
best age of 0.2 Gyrs. The canonical isochrone ages are indicated by the open squares, whereas
the convective overshoot isochrone ages are indicated by the filled circles. We use the age errors
given by the authors when given (see Table 3), and otherwise assume an age uncertainty of ±0.2
Gyrs. Most of the overshoot model ages agree with our WD cooling ages. The canonical models, on
the other hand, produce ages that are generally in conflict with the WD cooling ages. The oldest
canonical model clearly is inconsistent with the WD cooling ages, but this is the now-outdated
model of VandenBerg (1985), and therefore the poor agreement is not surprising. The canonical
model at (m−M)V = 11.95 and 1.7 Gyrs is from the Castellani et al. (1992) study employing solar
metallicity isochrones, so the disagreement here is not surprising either. Of the remaining two
canonical studies (Castellani et al. 1999 and Dominguez et al. 1999), both produce isochrone ages
consistent with the WD cooling ages, though both employ high distance moduli. The distance
discrepancy for the Dominguez et al. study may be minor, however.
As a final note on the comparison between isochrone and WD cooling ages, an incorrect
distance modulus can inappropriately alter the assumed physics involved in stellar evolution, since
the assumed stellar luminosity and thereby the assumed stellar mass depends on the assumed cluster
distance. Therefore, the last word on the question of canonical versus core overshoot models for

– 16 –
this cluster may have to await a precise and agreed-upon determination of the cluster distance
modulus. In turn, a precise distance modulus is likely to require an improved cluster metallicity
value. In the meantime, since both WD cooling ages and isochrone ages scale similarly with the
assumed distance, we have applied the fairest comparison we can. Once a precise cluster distance
modulus is determined, our WD photometry provides a strict consistency check of any isochrone
fitting.
3.5. The Limit of the Main Sequence
While our observations were designed to measure the luminosities of the faintest cluster WDs,
they also revealed a CMD that probes the cluster main sequence from V = 16 to 26. This apparent
magnitude range corresponds to the mass range of 1.2 to 0.15 solar masses, based on the empirical
mass - luminosity calibration of Henry & McCarthy (1993). We do not derive a cluster luminosity
function or initial mass function from these data, as done by von Hippel et al. (1996) from the
cycle 4 data, as the increase in numbers of stars does not warrant a re-examination of this subject.
However, the deeper exposures and the larger field of view allowed us to detect candidate cluster
main sequence stars significantly fainter than those studied by von Hippel et al. (1996). Because of
the current interest in comparing the photometric properties of faint main sequence stars in clusters
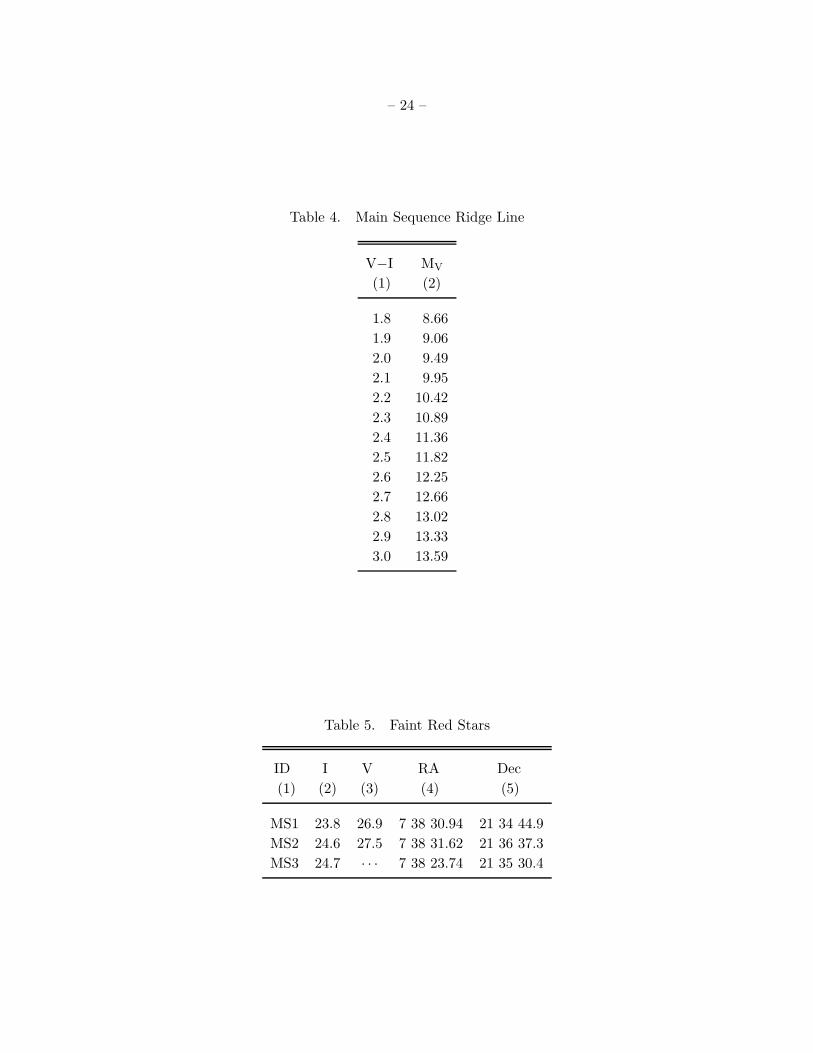
at different metallicity, we tabulate the main sequence ridge line in Table 4. The ridge line was
determined by fitting a fourth-order polynomial to the photometry for those stars that appear to
lie along the well-represented portion of the single-star main sequence, between MV ≈ 9 to 14 (V
≈ 21 to 26, mass ≈ 0.58 to 0.15 solar masses), assuming (m−M)V = 12.10 and E(B−V) = 0.04.
The quality of the fit can be seen by examining Figure 7a, where the ridge line is represented by
“+” symbols. We remind the reader that all of these stars are redder than the red limit of the
Holtzman et al. (1995) photometric transformations, V−I < 1.5.
We can make tentative comments about cluster members of even lower mass than 0.15 solar
masses. At the faint limit of our photometry we found three objects that passed our I-band
SExtractor stellarity index cut at 0.78 (with values of 0.87, 0.95, and 0.96), but which were too
faint in the V-band to provide a reliable centroid, and thus were rejected as poor matches between
the V- and I-band photometry lists. These objects were measured to have I ≈ 23.8, 24.6, and 24.7.
These magnitudes are approximate due to their low signal-to-noise and uncertain color correction.
The V-band photometry is even more uncertain. Table 5 lists the I- and V-band magnitudes for
these three objects, along with their Right Ascension and Declination (J2000.0). The brightest of
these three objects is likely to be a cluster member, based on its position in the CMD. It is, in fact,
the same color as and only 0.2 mag fainter than the two reddest main sequence candidates plotted
in our CMDs. The mass of this object, assuming it is a cluster member, is ≈ 0.12 solar masses,
based on the calibration of Henry & McCarthy (1993). The two fainter objects, if cluster main
sequence stars, would have slightly lower mass, ≈ 0.11 solar masses. Since the completeness level
at these faint magnitudes is only a few percent, it appears likely that NGC 2420 contains many
– 17 –
very faint stars near the Hydrogen-burning limit.
4. Conclusion
We have used deep HST WFPC2 observations of two fields in NGC 2420 to produce a cluster
CMD down to V ≈ 27. After imposing morphological selection criteria we find eight candidate
white dwarfs in NGC 2420. Our completeness estimates indicate that we have found the terminus
of the WD cooling sequence. We argue that the cluster distance modulus is likely to be close to
12.10 with E(B−V) = 0.04. With these parameters we find a white dwarf cooling age for NGC
2420 of 2.0±0.20 (1σ) Gyrs. The 0.20 Gyr uncertainty includes errors in the photometry, sequence
fitting, precursor time scales, and theoretical WD cooling time scales.
We derive cluster WD ages for a variety of distances to directly compare the WD age with
the many main sequence evolution ages for NGC 2420. We find that most of the stellar evolution
models that incorporate convective overshoot derive ages which agree with our WD cooling ages.
The canonical models, on the other hand, largely produce ages that are in conflict with the WD
cooling ages. An exception to this tendency is the canonical isochrone fit of Dominguez et al.
(1999), which results in an age that is consistent with the WD cooling age, but with a distance
modulus that may be too high. The final word on the question of canonical versus core overshoot
models for this cluster may have to await a precise and agreed-upon determination of the cluster
distance modulus, which in turn, will likely require an improved cluster metallicity value.
It is a pleasure to thank Ken Mighell for the use of the CCDCAP photometry package and
for many useful consultations, and Andy Fruchter for guidance with the drizzle package. We thank
Leandro Althaus, Brad Hansen, Jarrod Hurley, and Matt Wood for providing their computer-
readable model calculations or code and for helpful guidance. We also thank Pierre Demarque for
helpful guidance.
Support for this work was provided by NASA through grant number GO-6424 from the Space
Telescope Science Institute, which is operated by the Association of Universities for Research in
Astronomy, Inc., under NASA contract NAS5-26555.
This research has made extensive use of NASA’s Astrophysics Data System Abstract Service.
– 18 –
REFERENCES
Ahrens, T.J. 1999, Master’s Thesis, Fl. Inst. of Tech.
Anderson, J., & King, I.R. 1999, PASP, 111, 1095
Anthony-Twarog, B.J., Kaluzny, J., Shara, M.M., & Twarog, B.A. 1990, AJ, 99, 1504
Benvenuto, O.G., & Althaus, L.G. 1999, MNRAS, 303, 30
Bertelli, G., Bressan, A., Chiosi, C., Fagotto, F., & Nasi, E. 1994, A&AS, 106, 275
Bertin, E., & Arnouts, S. 1996, A&AS, 117, 393
Canuto, V.M. 1999, ApJ, 524, 311
Canuto, V.M., & Dubovikov, M. 1998, ApJ, 493, 834
Cardelli, J.A., Clayton, G.C., & Mathis, J.S. 1989, ApJ, 345, 245
Carraro, G., & Chiosi, C. 1994, A&A, 287, 761
Casertano, S., & Mutchler, M. 1998, WFPC2 Instrument Science Report, 98-02
Castellani, V., Chieffi, A., & Straniero, O. 1992, ApJS, 78, 517
Castellani, V., degl’Innocenti, S., & Marconi, M. 1999, MNRAS, 303, 265
Claver, C.F. 1995, PhD Thesis, The University of Texas at Austin
Daniel, S.A., Latham, D.W., Mathieu, R.D., & Twarog, B.A. 1994, PASP, 106, 281
Demarque, P., Sarajedini, A., & Guo, X.-J. 1994, ApJ, 426, 165
Dominguez, I., Chieffi, A., Limongi, M., & Straniero, O. 1999, ApJ, 524, 226
Friel, E.D., & Janes, K.A. 1993, A&A, 267, 75
Fruchter, A.S., & Hook, R.N. 1998, xxx.lanl.gov/abs/astro-ph/9808087
Gonzaga, S., Ritchie, C., Baggett, S., Whitmore, B. & Mutchler, M. 1999, Standard Star Monitoring
Memo #3
Hansen, B.M.S. 1999, ApJ, 520, 680
Henry, T.J., & McCarthy, D.W. 1993, AJ, 106, 773
Holtzman, J.A., Burrows, C.J., Casertano, S., Hester, J.J., Watson, A.M., & Worthy, G.S. 1995,
PASP, 107, 1065
Hurley, J.R., Pols, O.R., & Tout, C.A. 2000, MNRAS, in press
Iben, I., & Tutukov, A.V. 1984, ApJ, 282, 615
Koester, D., & Reimers, D. 1985, A&A, 153, 260
Koester, D., & Reimers, D. 1996, A&A, 313, 810
Krist, J. 1995, in Astronomical Data Analysis Software and Systems IV, eds. R.A. Shaw, H.E.
Payne, & J.J.E. Hayes, ASP Conference Series, (San Francisco: ASP), 77, 349
– 19 –
Leggett, S.K., Ruiz, M.T., & Bergeron, P. 1998, ApJ, 497, 294
Liebert, J., Dahn, C.C., & Monet, D.G. 1988, ApJ, 332, 891
Mighell, K.J. 1997, AJ, 114, 1458
Oswalt, T.D., Smith, J.A., Wood, M.A., & Hintzen, P. 1996, Nature, 382, 692
Pinsonneault, M.H., Stauffer, J., Soderblom, D.R., King, J.R., & Hanson, R.B. 1998, ApJ, 504,
170
Pols, O.R., Tout, C.A., Schroder, K.-P., Eggleton, P.P., & Manners, J. 1997, MNRAS, 289, 869
Pols, O.R., Schroder, K.-P., Hurley, J.R., Tout, C.A., & Eggleton, P.P. 1998, MNRAS, 298, 525
Schmidt, M. 1959, ApJ, 129, 243
Reid, I.N., & Majewski, S.R. 1993, ApJ, 409, 635
Reid, I.N., Yan, L., Majewski, S., Thompson, I., & Smail, I. 1996, AJ, 112, 1472
Richer, H.B., et al. 1997, ApJ, 484, 741
Richer, H.B., Fahlman, G.G., Rosvick, J., & Ibata, R. 1998, ApJ, 504, L91
Salaris, M., Dominguez, I., Garcia-Berro, E., Hernanz, M., Isern, J., & Mochkovitch, R. 1997, ApJ,
486, 413
Schaerer, D., Meynet, G., Maeder, A., & Schaller, G. 1993, A&AS, 98, 523
Schaller, G., Schaerer, D., Meynet, G., & Maeder, A. 1992, A&AS, 96, 269
Schroder, K.-P., Pols, O.R., & Eggleton, P.P. 1997, MNRAS, 285, 696
Stetson, P.B. 1998, PASP, 110, 1448
Twarog, B.A., Anthony-Twarog, B.J., & Bricker, A.R. 1999, AJ, 117, 1816
van Altena, W.F., & Jones, B.F. 1970, A&A, 8, 112
VandenBerg, D.A. 1985, ApJS, 58, 532
von Hippel, T. 1998, AJ, 115, 1536
von Hippel, T., Gilmore, G., & Jones, D.H.P. 1995, MNRAS, 273, L39 (paper 1)
von Hippel, T., Gilmore, G., Tanvir, N., Robinson, D., & Jones, D.H.P. 1996, AJ, 112, 192
von Hippel, T., & Sarajedini, A. 1998, AJ, 116, 1789
Whitmore, B., Heyer, I., & Casertano, S. 1999, PASP, 111, 1559
Winget, D.E., Hansen, C.J., Liebert, J., van Horn, H.M., Fontaine, G., Nather, R.E., Kepler, S.O.,
& Lamb, D.Q. 1987, ApJ, 315, L77
Wood, M.A. 1992, ApJ, 386, 539
This preprint was prepared with the AAS LATEX macros v5.0.
– 20 –
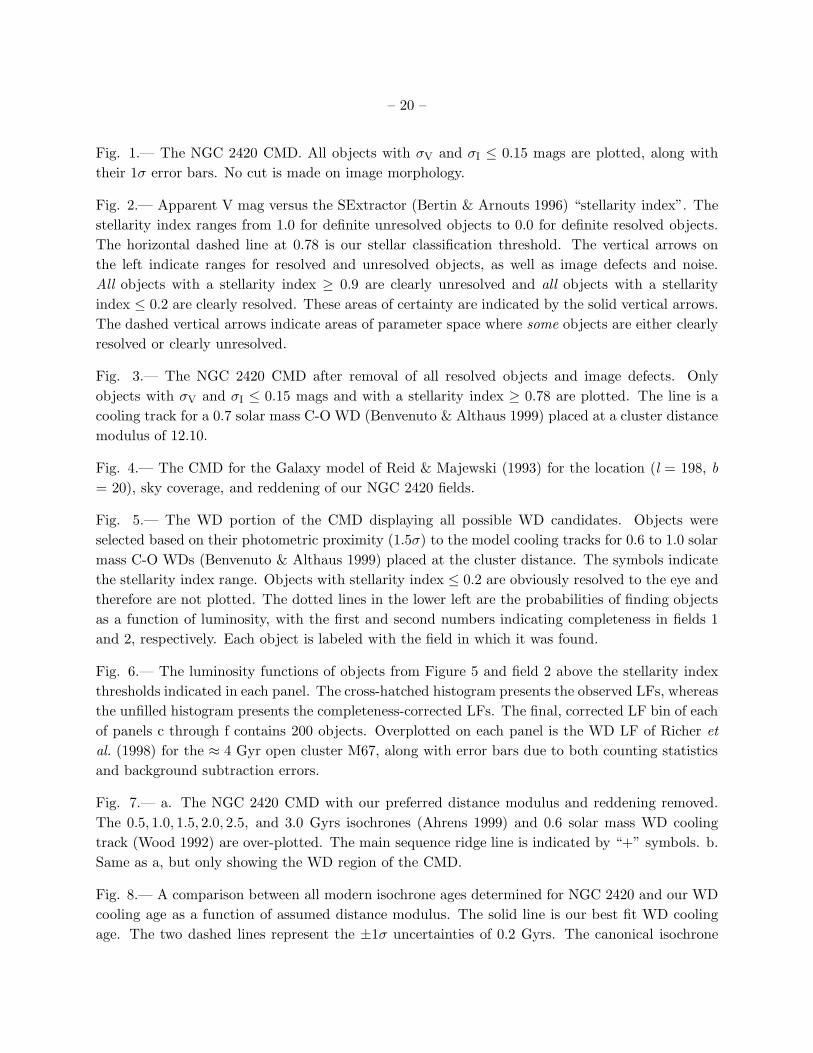
Fig. 1.— The NGC 2420 CMD. All objects with σV and σI ≤ 0.15 mags are plotted, along with
their 1σ error bars. No cut is made on image morphology.
Fig. 2.— Apparent V mag versus the SExtractor (Bertin & Arnouts 1996) “stellarity index”. The
stellarity index ranges from 1.0 for definite unresolved objects to 0.0 for definite resolved objects.
The horizontal dashed line at 0.78 is our stellar classification threshold. The vertical arrows on
the left indicate ranges for resolved and unresolved objects, as well as image defects and noise.
All objects with a stellarity index ≥ 0.9 are clearly unresolved and all objects with a stellarity
index ≤ 0.2 are clearly resolved. These areas of certainty are indicated by the solid vertical arrows.
The dashed vertical arrows indicate areas of parameter space where some objects are either clearly
resolved or clearly unresolved.
Fig. 3.— The NGC 2420 CMD after removal of all resolved objects and image defects. Only
objects with σV and σI ≤ 0.15 mags and with a stellarity index ≥ 0.78 are plotted. The line is a
cooling track for a 0.7 solar mass C-O WD (Benvenuto & Althaus 1999) placed at a cluster distance
modulus of 12.10.
Fig. 4.— The CMD for the Galaxy model of Reid & Majewski (1993) for the location (l = 198, b
= 20), sky coverage, and reddening of our NGC 2420 fields.
Fig. 5.— The WD portion of the CMD displaying all possible WD candidates. Objects were
selected based on their photometric proximity (1.5σ) to the model cooling tracks for 0.6 to 1.0 solar
mass C-O WDs (Benvenuto & Althaus 1999) placed at the cluster distance. The symbols indicate
the stellarity index range. Objects with stellarity index ≤ 0.2 are obviously resolved to the eye and
therefore are not plotted. The dotted lines in the lower left are the probabilities of finding objects
as a function of luminosity, with the first and second numbers indicating completeness in fields 1
and 2, respectively. Each object is labeled with the field in which it was found.
Fig. 6.— The luminosity functions of objects from Figure 5 and field 2 above the stellarity index
thresholds indicated in each panel. The cross-hatched histogram presents the observed LFs, whereas
the unfilled histogram presents the completeness-corrected LFs. The final, corrected LF bin of each
of panels c through f contains 200 objects. Overplotted on each panel is the WD LF of Richer et
al. (1998) for the ≈ 4 Gyr open cluster M67, along with error bars due to both counting statistics
and background subtraction errors.
Fig. 7.— a. The NGC 2420 CMD with our preferred distance modulus and reddening removed.
The 0.5, 1.0, 1.5, 2.0, 2.5, and 3.0 Gyrs isochrones (Ahrens 1999) and 0.6 solar mass WD cooling
track (Wood 1992) are over-plotted. The main sequence ridge line is indicated by “+” symbols. b.
Same as a, but only showing the WD region of the CMD.
Fig. 8.— A comparison between all modern isochrone ages determined for NGC 2420 and our WD
cooling age as a function of assumed distance modulus. The solid line is our best fit WD cooling
age. The two dashed lines represent the ±1σ uncertainties of 0.2 Gyrs. The canonical isochrone
– 21 –
ages are plotted as open squares and the convective overshoot isochrone ages are plotted as filled
circles.
– 22 –
Table 1. Log of Observations
Date Exposures Filter Sky Field Cycle
(1) (2) (3) (4) (5) (6)
May 18, 1994 4 × 900 F555W 33.6 1 4
May 19, 1994 4 × 900 F814W 33.2 1 4
Apr 2, 1996 2 × 1200 F555W 16.8 1 6
Apr 2, 1996 2 × 1200 F555W 17.0 1 6
Apr 3, 1997 3 × 700/800 F555W 11.7 2 6
Apr 3, 1997 3 × 700/800 F555W 11.7 2 6
Apr 3, 1997 3 × 700/800 F555W 11.6 2 6
Apr 3, 1997 3 × 700/800 F814W 11.1 2 6
Apr 3, 1997 3 × 700/800 F814W 11.1 2 6
Table 2. White Dwarfs
ID V σV V−I σV−I RA Dec
(1) (2) (3) (4) (5) (6) (7)
WD1 21.43 0.003 -0.23 0.009 7 38 10.62 21 32 33.5
WD2 22.52 0.005 -0.16 0.016 7 38 08.07 21 33 08.8
WD3 23.66 0.010 -0.08 0.025 7 38 26.54 21 35 13.1
WD4 24.15 0.015 0.08 0.044 7 38 10.85 21 31 56.6
WD5 25.45 0.032 0.39 0.069 7 38 31.26 21 35 56.6
WD6 25.64 0.038 0.75 0.067 7 38 29.68 21 36 45.4
WD7 25.68 0.038 0.46 0.079 7 38 30.50 21 34 31.3
WD8 25.69 0.039 0.63 0.073 7 38 30.12 21 36 34.0
– 23 –
Table 3. Ages Derived from Isochrone Fits
Age(Iso) Overshoot? (m−M)V E(B−V) Derived? [Fe/H] Ref Age(WD)
(1) (2) (3) (4) (5) (6) (7) (8)
3.4 (0.6) N 11.95 0.05 D -0.40 AT90 2.3
1.7 N 11.95 0.02 D 0.00 C92 2.3
1.6 (0.2) N 12.19 0.05 D -0.40 D99 1.9
1.5 (0.1) N 12.40 0.16 D -0.40 C99 1.6
2.1 Y 11.80 0.08 D -0.42 CC94 2.5
2.4 (0.2) Y 12.05 0.045 D -0.30 D94 2.1
2.35 Y 11.95 0.05 A -0.42 P98 2.3
1.9 (0.2) Y 12.15 0.04 D -0.29 T99a 2.0
2.2 (0.2) Y 12.15 0.04 D -0.29 T99b 2.0
References. — AT90 = Anthony-Twarog et al. 1990, C92 = Castellani et al. 1992, C99 =
Castellani et al. 1999, CC94 = Carraro & Chiosi 1994, D94 = Demarque et al. 1994, D99 =
Dominguez et al. 1999, P98 = Pols et al. 1998, T99a = Twarog et al. 1999 employing Bertelli et
al. 1994 isochrones, and T99b = Twarog et al. 1999 employing Schaller et al. 1992 & Schaerer
et al. 1993 isochrones.
– 24 –
Table 4. Main Sequence Ridge Line
V−I MV
(1) (2)
1.8 8.66
1.9 9.06
2.0 9.49
2.1 9.95
2.2 10.42
2.3 10.89
2.4 11.36
2.5 11.82
2.6 12.25
2.7 12.66
2.8 13.02
2.9 13.33
3.0 13.59
Table 5. Faint Red Stars
ID I V RA Dec
(1) (2) (3) (4) (5)
MS1 23.8 26.9 7 38 30.94 21 34 44.9
MS2 24.6 27.5 7 38 31.62 21 36 37.3
MS3 24.7 · · · 7 38 23.74 21 35 30.4


![M101. Lupton, SDSS. · Sextans Sextans A I Leo A NGC 3109 Leo Il Leo NGC NEC 147 Mlll] A ndromeda Galexy M 32 riangu A ndromada Il. Ill and P egasus Dwarf LGsa A quarius Dwarf SagDIG](https://static.fdocuments.net/doc/165x107/5e4f400dca8eff4c483e2d6e/m101-lupton-sdss-sextans-sextans-a-i-leo-a-ngc-3109-leo-il-leo-ngc-nec-147-mlll.jpg)