THE WHAT AND THE WHY OF STATISTICS
26
1 THE WHAT AND THE WHY OF STATISTICS Chapter Learning Objectives 1. Describe the five stages of the research process. 2. Define independent and dependent variables. 3. Distinguish between the three levels of measurement. 4. Apply descriptive and inferential statistical procedures. A re you taking statistics because it is required in your major— not because you find it interesting? If so, you may be feeling intimidated because you associate statistics with numbers, formu- las, and abstract notations that seem inaccessible and complicated. Perhaps you feel intimidated not only because you’re uncomfortable with math but also because you suspect that numbers and math don’t leave room for human judgment or have any relevance to your own personal experience. In fact, you may even question the relevance of statistics to understanding people, social behavior, or society. In this book, we will show you that statistics can be a lot more interesting and easier to understand than you may have been led to believe. In fact, as we draw on your previous knowledge and experience and relate statistics to interesting and important social issues, you’ll begin to see that statistics is not just a course you have to take but a useful tool as well. There are two reasons why learning statistics may be of value to you. First, you are constantly exposed to statistics every day of your life. Marketing surveys, voting polls, and social research findings appear daily in the news media. By learning statistics, you will become a sharper consumer of statistical material. Second, as a major in the social sciences, you may be expected to read and interpret statistical information related to your occupation or work. Even if conducting research is not a part of your work, you may still be expected to understand and learn from other people’s research or to be able to write reports based on statistical analyses. Just what is statistics, anyway? You may associate the word with numbers that indicate COVID-19 hospitalization rates, support for the Black Lives Matter movement, and so on. But the word statistics also refers to a set of procedures used by Statistics: A set of procedures used by social scientists to organize, summarize, and communicate numerical information. 1 Copyright ©2021 by SAGE Publications, Inc. This work may not be reproduced or distributed in any form or by any means without express written permission of the publisher. Do not copy, post, or distribute
Transcript of THE WHAT AND THE WHY OF STATISTICS

1THE WHAT AND THE WHY OF STATISTICS
Chapter Learning Objectives1. Describe the five stages of
the research process.
2. Define independent and dependent variables.
3. Distinguish between the three levels of measurement.
4. Apply descriptive and inferential statistical procedures.
Are you taking statistics because it is required in your major—not because you find it interesting? If so, you may be feeling
intimidated because you associate statistics with numbers, formu-las, and abstract notations that seem inaccessible and complicated. Perhaps you feel intimidated not only because you’re uncomfortable with math but also because you suspect that numbers and math don’t leave room for human judgment or have any relevance to your own personal experience. In fact, you may even question the relevance of statistics to understanding people, social behavior, or society.
In this book, we will show you that statistics can be a lot more interesting and easier to understand than you may have been led to believe. In fact, as we draw on your previous knowledge and experience and relate statistics to interesting and important social issues, you’ll begin to see that statistics is not just a course you have to take but a useful tool as well.
There are two reasons why learning statistics may be of value to you. First, you are constantly exposed to statistics every day of your life. Marketing surveys, voting polls, and social research findings appear daily in the news media. By learning statistics, you will become a sharper consumer of statistical material. Second, as a major in the social sciences, you may be expected to read and interpret statistical information related to your occupation or work. Even if conducting research is not a part of your work, you may still be expected to understand and learn from other people’s research or to be able to write reports based on statistical analyses.
Just what is statistics, anyway? You may associate the word with numbers that indicate COVID-19 hospitalization rates, support for the Black Lives Matter movement, and so on. But the word statistics also refers to a set of procedures used by
Statistics: A set of procedures used by social scientists to organize, summarize, and communicate numerical information.
1
Copyright ©2021 by SAGE Publications, Inc. This work may not be reproduced or distributed in any form or by any means without express written permission of the publisher.
Do not c
opy, po
st, or d
istribu
te

2 ESSENTIALS OF SOCIAL STATISTICS FOR A DIVERSE SOCIETY
social scientists to organize, summarize, and communicate numerical infor-mation. Only information represented by numbers can be the subject of statistical analysis. Such information is called data; researchers use statistical procedures to analyze data to answer research questions and test theories. It is the latter usage—answering research questions and testing theories—that this textbook explores.
THE RESEARCH PROCESS
To give you a better idea of the role of statistics in social research, let’s start by looking at the research process. We can think of the research process as a set of activities in which social scientists engage so that they can answer questions, examine ideas, or test theories.
As illustrated in Figure 1.1, the research process consists of five stages:
1. Asking the research question
2. Formulating the hypotheses
3. Collecting data
4. Analyzing data
5. Evaluating the hypotheses
Figure 1.1 The Research Process
Asking theresearchquestion
Formulating thehypotheses
Collectingdata
Analyzingdata
Evaluating thehypotheses
THEORY
Data: Information represented by numbers, which can be the subject of statistical analysis.
Research process: A set of activities in which social scientists engage to answer questions, examine ideas, or test theories.
Copyright ©2021 by SAGE Publications, Inc. This work may not be reproduced or distributed in any form or by any means without express written permission of the publisher.
Do not c
opy, po
st, or d
istribu
te

CHAPTER 1 • THE WHAT AND THE WHY OF STATISTICS 3
Each stage affects the theory and is affected by it as well. Statistics is most closely tied to the data analysis stage of the research process. As we will see in later chapters, statistical analysis of the data helps researchers test the validity and accuracy of their hypotheses.
ASKING RESEARCH QUESTIONS
The starting point for most research is asking a research question. Consider the following research questions taken from several social science journals:
How does the expansion of police presence in poor urban communities affect educational outcomes?
What does it mean to be a wounded warrior and how does the term impact the way wounded veterans think about themselves?
How do Lebanese women use their informal social networks to engage in political activism for women’s rights?
What factors affect the economic mobility of female workers?
These are all questions that can be answered by conducting empirical research—research based on information that can be verified by using our direct experience. To answer research questions, we cannot rely on reason-ing, speculation, moral judgment, or subjective preference. For example, the questions “Is racial equality good for society?” and “Is an urban lifestyle bet-ter than a rural lifestyle?” cannot be answered empirically because the terms good and better are concerned with values, beliefs, or subjective preference and, therefore, cannot be independently verified. One way to study these questions is by defining good and better in terms that can be verified empiri-cally. For example, we can define good in terms of economic growth and better in terms of psychological well-being. These questions could then be answered by conducting empirical research.
You may wonder how to come up with a research question. The first step is to pick a question that interests you. If you are not sure, look around! Ideas for research problems are all around you, from media sources to personal experi-ence or your own intuition. Talk to other people, write down your own observa-tions and ideas, or learn what other social scientists have written about.
Take, for instance, the relationship between gender and work. As a college student about to enter the labor force, you may wonder about the similarities and differences between women’s and men’s work experiences and about job opportunities when you graduate. Here are some facts and observations based on research reports: In 2018, women who were employed full-time earned about $794 (in current dollars) per week on average; men who were employed full-time earned $993 (in current dollars) per week
Empirical research: A research based on evidence that can be verified by using our direct experience.
Copyright ©2021 by SAGE Publications, Inc. This work may not be reproduced or distributed in any form or by any means without express written permission of the publisher.
Do not c
opy, po
st, or d
istribu
te
4 ESSENTIALS OF SOCIAL STATISTICS FOR A DIVERSE SOCIETY
on average.1 Women’s and men’s work are also very different. Women con-tinue to be the minority in many of the higher-ranking and higher-salaried positions in professional and managerial occupations. For example, in 2017, women made up 18.4% of software developers and 28% of chief executives. In comparison, among all those employed as secretaries and administra-tive assistants, 96% were women. Among all receptionists and information clerks in 2017, 93% were women.2 These observations may prompt us to ask research questions such as the following: How much change has there been in women’s work over time? Are women paid, on average, less than men for the same type of work?
LEARNING CHECK 1.1
Identify one or two social science questions amenable to empirical research. You can almost bet that you will be required to do a research project sometime in your college career.
THE ROLE OF THEORY
You may have noticed that each preceding research question was expressed in terms of a relationship. This relationship may be between two or more attri-butes of individuals or groups, such as gender and income or gender segrega-tion in the workplace and income disparity. The relationship between attributes or characteristics of individuals and groups lies at the heart of social scientific inquiry.
Most of us use the term theory quite casually to explain events and experi-ences in our daily life. You may have a theory about why your roommate has been so nice to you lately or why you didn’t do so well on your last exam. In a somewhat similar manner, social scientists attempt to explain the nature of social reality. Whereas our theories about events in our lives are commonsense explanations based on educated guesses and personal experience, to the social scientist, a theory is a more precise explanation that is frequently tested by con-ducting research.
A theory is a set of assumptions and propositions used by social scien-tists to explain, predict, and understand the phenomena they study.3 The theory attempts to establish a link between what we observe (the data) and our con-ceptual understanding of why certain phenomena are related to each other in a particular way.
For instance, suppose we wanted to understand the reasons for the income disparity between men and women; we may wonder whether the types of jobs men and women have and the organizations in which they work
Theory: A set of assumptions and propositions used to explain, predict, and understand social phenomena.
Copyright ©2021 by SAGE Publications, Inc. This work may not be reproduced or distributed in any form or by any means without express written permission of the publisher.
Do not c
opy, po
st, or d
istribu
te
CHAPTER 1 • THE WHAT AND THE WHY OF STATISTICS 5
have something to do with their wages. One explanation for gender wage inequality is gender segregation in the workplace—the fact that American men and women are concentrated in different kinds of jobs and occupations. What is the significance of gender segregation in the workplace? In our society, people’s occupations and jobs are closely associated with their level of prestige, authority, and income. The jobs in which women and men are segregated are not only different but also unequal. Although the proportion of women in the labor force has markedly increased, women are still con-centrated in occupations with low pay, low prestige, and few opportunities for promotion. Thus, gender segregation in the workplace is associated with unequal earnings, authority, and status. In particular, women’s segregation into different jobs and occupations from those of men is the most immediate cause of the pay gap. Women receive lower pay than men do even when they have the same level of education, skill, and experience as men in comparable occupations.
FORMULATING THE HYPOTHESES
So far, we have come up with several research questions about the income disparity between men and women in the workplace. We have also discussed a possible explanation—a theory—that helps us make sense of gender inequality in wages. Is that enough? Where do we go from here?
Our next step is to test some of the ideas suggested by the gender segre-gation theory. But this theory, even if it sounds reasonable and logical to us, is too general and does not contain enough specific information to be tested. Instead, theories suggest specific concrete predictions or hypotheses about the way that observable attributes of people or groups are interrelated in real life. Hypotheses are tentative because they can be verified only after they have been tested empirically.4 For example, one hypothesis we can derive from the gender segregation theory is that wages in occupations in which the majority of workers are female are lower than the wages in occupations in which the majority of workers are male.
Not all hypotheses are derived directly from theories. We can generate hypotheses in many ways—from theories, directly from observations, or from intuition. Probably, the greatest source of hypotheses is the professional or schol-arly literature. A critical review of the scholarly literature will familiarize you with the current state of knowledge and with hypotheses that others have studied.
Let’s restate our hypothesis:
Wages in occupations in which the majority of workers are female are lower than the wages in occupations in which the majority of workers are male.
Hypothesis: A statement predicting the relationship between two or more observable attributes.
Copyright ©2021 by SAGE Publications, Inc. This work may not be reproduced or distributed in any form or by any means without express written permission of the publisher.
Do not c
opy, po
st, or d
istribu
te
6 ESSENTIALS OF SOCIAL STATISTICS FOR A DIVERSE SOCIETY
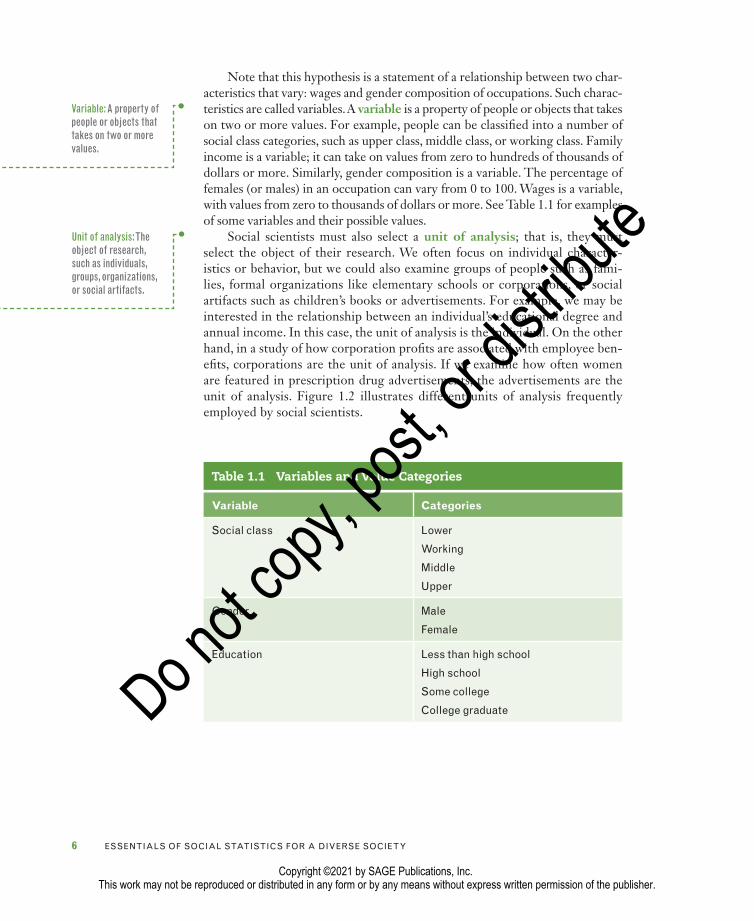
Note that this hypothesis is a statement of a relationship between two char-acteristics that vary: wages and gender composition of occupations. Such charac-teristics are called variables. A variable is a property of people or objects that takes on two or more values. For example, people can be classified into a number of social class categories, such as upper class, middle class, or working class. Family income is a variable; it can take on values from zero to hundreds of thousands of dollars or more. Similarly, gender composition is a variable. The percentage of females (or males) in an occupation can vary from 0 to 100. Wages is a variable, with values from zero to thousands of dollars or more. See Table 1.1 for examples of some variables and their possible values.
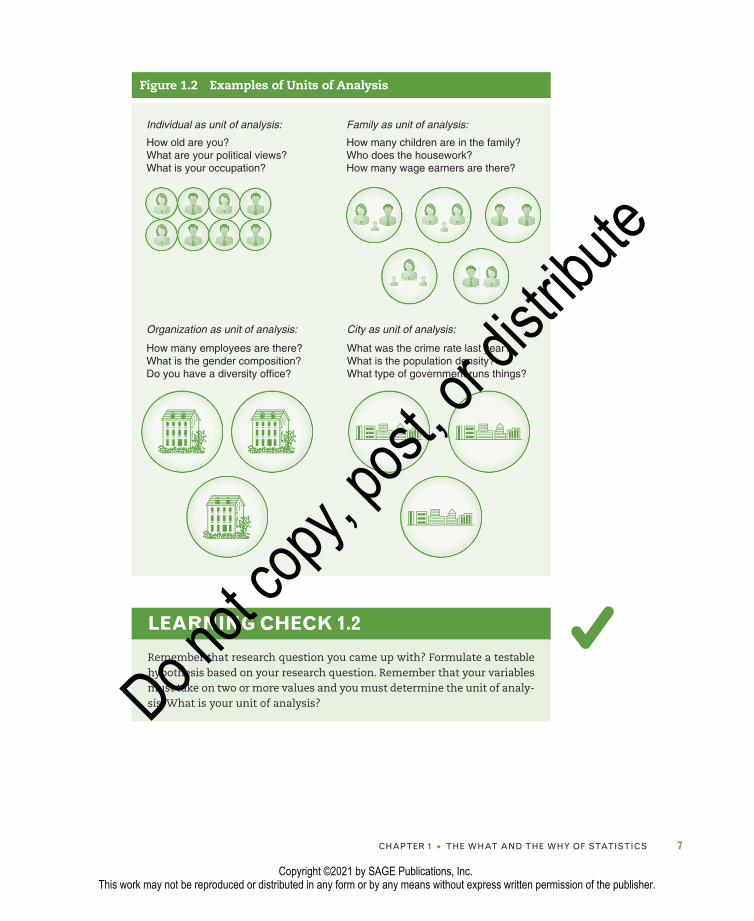
Social scientists must also select a unit of analysis; that is, they must select the object of their research. We often focus on individual character-istics or behavior, but we could also examine groups of people such as fami-lies, formal organizations like elementary schools or corporations, or social artifacts such as children’s books or advertisements. For example, we may be interested in the relationship between an individual’s educational degree and annual income. In this case, the unit of analysis is the individual. On the other hand, in a study of how corporation profits are associated with employee ben-efits, corporations are the unit of analysis. If we examine how often women are featured in prescription drug advertisements, the advertisements are the unit of analysis. Figure 1.2 illustrates different units of analysis frequently employed by social scientists.
Table 1.1 Variables and Value Categories
Variable Categories
Social class Lower
Working
Middle
Upper
Gender Male
Female
Education Less than high school
High school
Some college
College graduate
Variable: A property of people or objects that takes on two or more values.
Unit of analysis: The object of research, such as individuals, groups, organizations, or social artifacts.
Copyright ©2021 by SAGE Publications, Inc. This work may not be reproduced or distributed in any form or by any means without express written permission of the publisher.
Do not c
opy, po
st, or d
istribu
te
CHAPTER 1 • THE WHAT AND THE WHY OF STATISTICS 7
LEARNING CHECK 1.2
Remember that research question you came up with? Formulate a testable hypothesis based on your research question. Remember that your variables must take on two or more values and you must determine the unit of analy-sis. What is your unit of analysis?
Figure 1.2 Examples of Units of Analysis
How old are you?What are your political views?What is your occupation?
Individual as unit of analysis: Family as unit of analysis:
How many children are in the family?Who does the housework?How many wage earners are there?
How many employees are there?What is the gender composition?Do you have a diversity office?
Organization as unit of analysis: City as unit of analysis:
What was the crime rate last year?What is the population density?What type of government runs things?
Copyright ©2021 by SAGE Publications, Inc. This work may not be reproduced or distributed in any form or by any means without express written permission of the publisher.
Do not c
opy, po
st, or d
istribu
te
8 ESSENTIALS OF SOCIAL STATISTICS FOR A DIVERSE SOCIETY
Independent and Dependent Variables: Causality
Hypotheses are usually stated in terms of a relationship between an independent and a dependent variable. The distinction between an independent and a depen-dent variable is important in the language of research. Social theories often intend to provide an explanation for social patterns or causal relations between variables. For example, according to the gender segregation theory, gender segregation in the workplace is the primary explanation (although certainly not the only one) of the male-female earning gap. Why should jobs where the majority of workers are women pay less than jobs that employ mostly men? One explanation is that
societies undervalue the work women do, regardless of what those tasks are, because women do them. . . . For example, our culture tends to devalue caring or nurturant work at least partly because women do it. This tendency accounts for childcare workers’ low rank in the pay hierarchy.5
In the language of research, the variable the researcher wants to explain (“the effect”) is called the dependent variable. The variable that is expected to “cause” or account for the dependent variable is called the independent variable. Therefore, in our example, gender composition of occupations is the independent vari-able, and wages is the dependent variable.
Cause-and-effect relationships between variables are not easy to infer in the social sciences. To establish that two variables are causally related, your analysis must meet three conditions: (1) The cause has to precede the effect in time, (2) there has to be an empirical relationship between the cause and the effect, and (3) this relationship cannot be explained by other factors.
Let’s consider the decades-old debate about controlling crime through the use of prevention versus punishment. Some people argue that special counseling for youths at the first sign of trouble and strict controls on access to firearms would help reduce crime. Others argue that overhauling federal and state sentencing laws to stop early prison releases is the solution. In the early 1990s, Washington and California adopted “three strikes and you’re out” legislation, imposing life prison terms on three-time felony offenders. Such laws are also referred to as habitual or persistent offender laws. Twenty-six other states and the federal government adopted similar measures, all advocating a “get tough” policy on crime; the most recent legislation was in 2012 in the state of Massachusetts. In 2012, California voters supported a revision to the original law, imposing a life sentence only when the new felony conviction is serious or violent. Let’s suppose that years after the measure was introduced, the crime rate declined in some of these states (in fact, advocates of the measure have identified declining crime rates as evidence of its suc-cess). Does the observation that the incidence of crime declined mean that the new measure caused this reduction? Not necessarily! Perhaps the rate of crime had been going down for other reasons, such as improvement in the economy, and the new measure had nothing to do with it. To demonstrate a cause-and-effect relationship,
Dependent variable: The variable to be explained (the “effect”).
Independent variable: The variable expected to account for (the “cause” of) the dependent variable.
Copyright ©2021 by SAGE Publications, Inc. This work may not be reproduced or distributed in any form or by any means without express written permission of the publisher.
Do not c
opy, po
st, or d
istribu
te
CHAPTER 1 • THE WHAT AND THE WHY OF STATISTICS 9
we would need to show three things: (1) The reduction of crime actually occurred after the enactment of this measure, (2) the enactment of the “three strikes and you’re out” measure was empirically associated with a decrease in crime, and (3) the relationship between the reduction in crime and the “three strikes and you’re out” policy is not due to the influence of another variable (e.g., the improvement of overall economic conditions).
Independent and Dependent Variables: Guidelines
Because it is difficult to infer cause-and-effect relationships in the social sci-ences, be cautious about using the terms cause and effect when examining rela-tionships between variables. However, using the terms independent variable and dependent variable is still appropriate even when this relationship is not articulated in terms of direct cause and effect. Here are a few guidelines that may help you identify the independent and dependent variables:
1. The dependent variable is always the property that you are trying to explain; it is always the object of the research.
2. The independent variable usually occurs earlier in time than the dependent variable.
3. The independent variable is often seen as influencing, directly or indirectly, the dependent variable.
The purpose of the research should help determine which is the independent variable and which is the dependent variable. In the real world, variables are nei-ther dependent nor independent; they can be switched around depending on the research problem. A variable defined as independent in one research investigation may be a dependent variable in another.6 For instance, educational attainment may be an independent variable in a study attempting to explain how education influ-ences political attitudes. However, in an investigation of whether a person’s level of education is influenced by the social status of his or her family of origin, educational attainment is the dependent variable. Some variables, such as race, age, and ethnic-ity, because they are primordial characteristics that cannot be explained by social scientists, are never considered dependent variables in a social science analysis.
LEARNING CHECK 1.3
Identify the independent and dependent variables in the following hypotheses:
• Older Americans are more likely to support stricter immigration laws than younger Americans.
(Continued)
Copyright ©2021 by SAGE Publications, Inc. This work may not be reproduced or distributed in any form or by any means without express written permission of the publisher.
Do not c
opy, po
st, or d
istribu
te
10 ESSENTIALS OF SOCIAL STATISTICS FOR A DIVERSE SOCIETY
• People who attend church regularly are more likely to oppose abortion than people who do not attend church regularly.
• Elderly women are more likely to live alone than elderly men.
• Individuals with postgraduate education are likely to have fewer children than those with less education.
What are the independent and dependent variables in your hypothesis?
COLLECTING DATA
Once we have decided on the research question, the hypothesis, and the variables to be included in the study, we proceed to the next stage in the research cycle. This step includes measuring our variables and collecting the data. As research-ers, we must decide how to measure the variables of interest to us, how to select the cases for our research, and what kind of data collection techniques we will be using. A wide variety of data collection techniques are available to us, from direct observations to survey research, experiments, or secondary sources. Similarly, we can construct numerous measuring instruments. These instruments can be as simple as a single question included in a questionnaire or as complex as a compos-ite measure constructed through the combination of two or more questionnaire items. The choice of a particular data collection method or instrument to measure our variables depends on the study objective. For instance, suppose we decide to study how one’s social class is related to attitudes about women in the labor force. Since attitudes about working women are not directly observable, we need to col-lect data by asking a group of people questions about their attitudes and opinions. A suitable method of data collection for this project would be a survey that uses a questionnaire or interview guide to elicit verbal reports from respondents. The questionnaire could include numerous questions designed to measure attitudes toward working women, social class, and other variables relevant to the study.
How would we go about collecting data to test the hypothesis relating the gender composition of occupations to wages? We want to gather information on the proportion of men and women in different occupations and the average earn-ings for these occupations. This kind of information is routinely collected and disseminated by the U.S. Department of Labor, the Bureau of Labor Statistics, and the U.S. Census Bureau. We could use these data to test our hypothesis.
Levels of Measurement
The statistical analysis of data involves many mathematical operations, from simple counting to addition and multiplication. However, not every operation
(Continued)
Copyright ©2021 by SAGE Publications, Inc. This work may not be reproduced or distributed in any form or by any means without express written permission of the publisher.
Do not c
opy, po
st, or d
istribu
te
CHAPTER 1 • THE WHAT AND THE WHY OF STATISTICS 11
can be used with every variable. The type of statistical operation we employ depends on how our variables are measured. For example, for the variable gender, we can use the number 1 to represent females and the number 2 to represent males. Similarly, 1 can also be used as a numerical code for the cat-egory “one child” in the variable number of children. Clearly, in the first example, the number is an arbitrary symbol that does not correspond to the property “female,” whereas in the second example, the number 1 has a distinct numerical meaning that does correspond to the property “one child.” The correspondence between the properties we measure and the numbers representing these prop-erties determines the type of statistical operations we can use. The degree of correspondence also leads to different ways of measuring—that is, to distinct levels of measurement. In this section, we will discuss three levels of measure-ment: (1) nominal, (2) ordinal, and (3) interval-ratio.
Nominal Level of Measurement
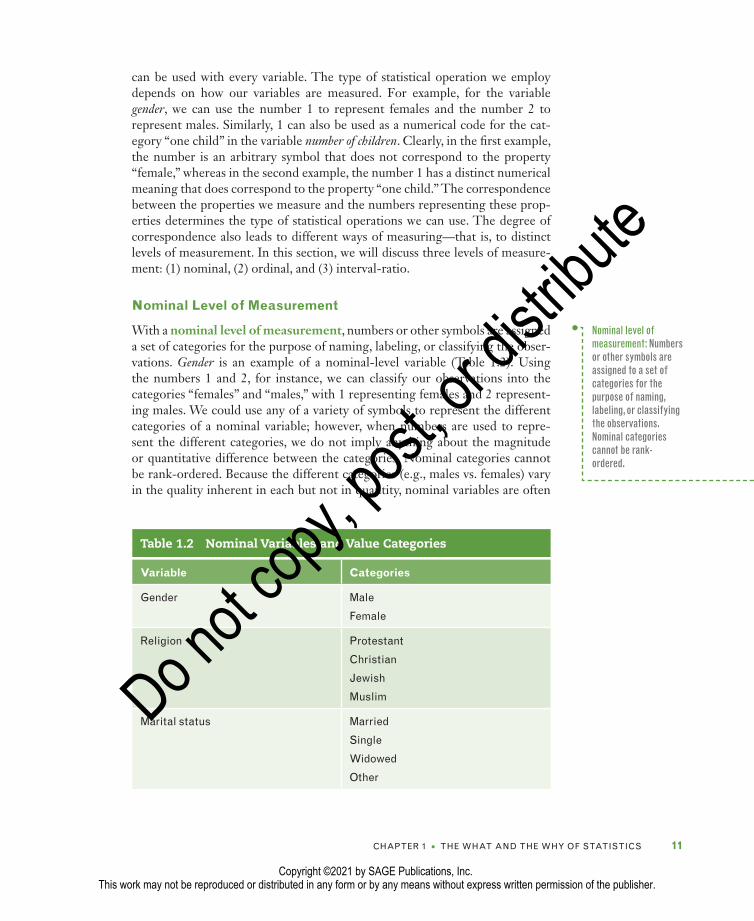
With a nominal level of measurement, numbers or other symbols are assigned a set of categories for the purpose of naming, labeling, or classifying the obser-vations. Gender is an example of a nominal-level variable (Table 1.2). Using the numbers 1 and 2, for instance, we can classify our observations into the categories “females” and “males,” with 1 representing females and 2 represent-ing males. We could use any of a variety of symbols to represent the different categories of a nominal variable; however, when numbers are used to repre-sent the different categories, we do not imply anything about the magnitude or quantitative difference between the categories. Nominal categories cannot be rank-ordered. Because the different categories (e.g., males vs. females) vary in the quality inherent in each but not in quantity, nominal variables are often
Table 1.2 Nominal Variables and Value Categories
Variable Categories
Gender Male
Female
Religion Protestant
Christian
Jewish
Muslim
Marital status Married
Single
Widowed
Other
Nominal level of measurement: Numbers or other symbols are assigned to a set of categories for the purpose of naming, labeling, or classifying the observations. Nominal categories cannot be rank-ordered.
Copyright ©2021 by SAGE Publications, Inc. This work may not be reproduced or distributed in any form or by any means without express written permission of the publisher.
Do not c
opy, po
st, or d
istribu
te

12 ESSENTIALS OF SOCIAL STATISTICS FOR A DIVERSE SOCIETY
called qualitative. Other examples of nominal-level variables are political party, religion, and race.
Nominal variables should include categories that are both exhaustive and mutually exclusive. Exhaustiveness means that there should be enough catego-ries composing the variables to classify every observation. For example, the common classification of the variable marital status into the categories “mar-ried,” “single,” and “widowed” violates the requirement of exhaustiveness. As defined, it does not allow us to classify same-sex couples or heterosexual cou-ples who are not legally married. We can make every variable exhaustive by adding the category “other” to the list of categories. However, this practice is not recommended if it leads to the exclusion of categories that have theoreti-cal significance or a substantial number of observations.
Mutual exclusiveness means that there is only one category suitable for each observation. For example, we need to define religion in such a way that no one would be classified into more than one category. For instance, the catego-ries Protestant and Methodist are not mutually exclusive because Methodists are also considered Protestant and, therefore, could be classified into both categories.
LEARNING CHECK 1.4
Review the definitions of exhaustive and mutually exclusive. Now look at Table 1.2. What other categories could be added to each variable to be exhaustive and mutually exclusive?
Ordinal Level of Measurement
Whenever we assign numbers to rank-ordered categories ranging from low to high or high to low, we have an ordinal level of measurement. Social class is an example of an ordinal variable. We might classify individuals with respect to their social class status as “upper class,” “middle class,” or “working class.” We can say that a person in the category “upper class” has a higher class position than a person in a “middle-class” category (or that a “middle-class” position is higher than a “working-class” position), but we do not know the magnitude of the differences between the categories—that is, we don’t know how much higher “upper class” is compared with the “middle class.”
Many attitudes that we measure in the social sciences are ordinal-level variables. Take, for instance, the following statement used to measure atti-tudes toward working women: “Women should return to their traditional role in society.” Respondents are asked to identify the number representing their degree of agreement or disagreement with this statement. One form in which a number might be made to correspond with the answers can be seen in
Ordinal level of measurement: Numbers are assigned to rank-ordered categories ranging from low to high or high to low.
Copyright ©2021 by SAGE Publications, Inc. This work may not be reproduced or distributed in any form or by any means without express written permission of the publisher.
Do not c
opy, po
st, or d
istribu
te

CHAPTER 1 • THE WHAT AND THE WHY OF STATISTICS 13
Table 1.3. Although the differences between these numbers represent higher or lower degrees of agreement with the statement, the distance between any two of those numbers does not have a precise numerical meaning.
Like nominal variables, ordinal variables should include categories that are mutually exhaustive and exclusive.
Interval-Ratio Level of Measurement
If the categories (or values) of a variable can be rank-ordered and if the mea-surements for all the cases are expressed in the same units and equally spaced, then an interval-ratio level of measurement has been achieved. Examples of variables measured at the interval-ratio level are age, income, and SAT scores. With all these variables, we can compare values not only in terms of which is larger or smaller but also in terms of how much larger or smaller one is compared with another. In some discussions of levels of measurement, you will see a distinction made between interval-ratio variables that have a natural zero point (where zero means the absence of the property) and those variables that have zero as an arbi-trary point. For example, weight and length have a natural zero point, whereas temperature has an arbitrary zero point. Variables with a natural zero point are also called ratio variables. In statistical practice, however, ratio variables are sub-jected to operations that treat them as interval and ignore their ratio properties. Therefore, we make no distinction between these two types in this text.
Cumulative Property of Levels of Measurement
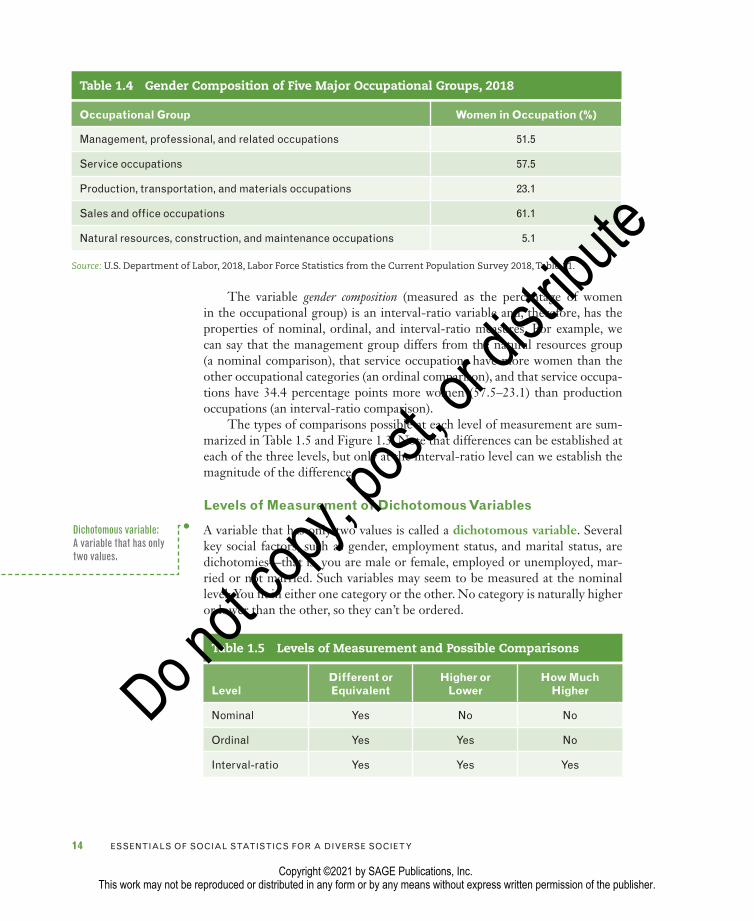
Variables that can be measured at the interval-ratio level of measurement can also be measured at the ordinal and nominal levels. As a rule, properties that can be measured at a higher level (interval-ratio is the highest) can also be measured at lower levels, but not vice versa. Let’s take, for example, gender composition of occupations, the independent variable in our research example. Table 1.4 shows the percentage of women in five major occupational groups.
Table 1.3 Ordinal Ranking Scale
Rank Value
1 Strongly agree
2 Agree
3 Neither agree nor disagree
4 Disagree
5 Strongly disagree
Interval-ratio level of measurement: Measurements for all cases are expressed in the same units and equally spaced. Interval-ratio values can be rank-ordered.
Copyright ©2021 by SAGE Publications, Inc. This work may not be reproduced or distributed in any form or by any means without express written permission of the publisher.
Do not c
opy, po
st, or d
istribu
te
14 ESSENTIALS OF SOCIAL STATISTICS FOR A DIVERSE SOCIETY
The variable gender composition (measured as the percentage of women in the occupational group) is an interval-ratio variable and, therefore, has the properties of nominal, ordinal, and interval-ratio measures. For example, we can say that the management group differs from the natural resources group (a nominal comparison), that service occupations have more women than the other occupational categories (an ordinal comparison), and that service occupa-tions have 34.4 percentage points more women (57.5–23.1) than production occupations (an interval-ratio comparison).
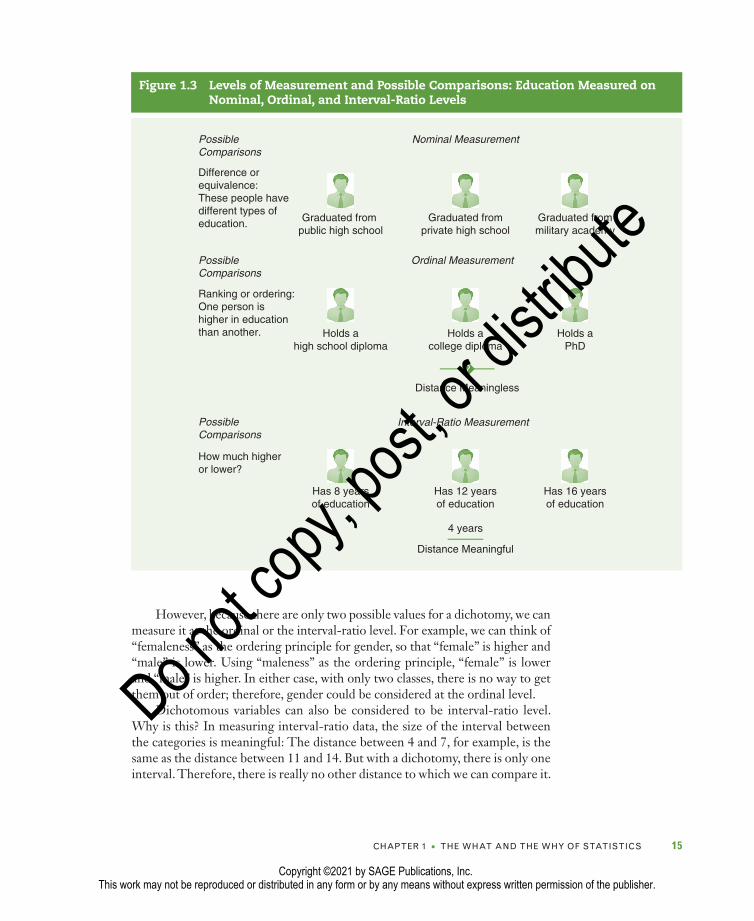
The types of comparisons possible at each level of measurement are sum-marized in Table 1.5 and Figure 1.3. Note that differences can be established at each of the three levels, but only at the interval-ratio level can we establish the magnitude of the difference.
Levels of Measurement of Dichotomous Variables
A variable that has only two values is called a dichotomous variable. Several key social factors, such as gender, employment status, and marital status, are dichotomies—that is, you are male or female, employed or unemployed, mar-ried or not married. Such variables may seem to be measured at the nominal level: You fit in either one category or the other. No category is naturally higher or lower than the other, so they can’t be ordered.
Table 1.5 Levels of Measurement and Possible Comparisons
LevelDifferent or Equivalent
Higher or Lower
How Much Higher
Nominal Yes No No
Ordinal Yes Yes No
Interval-ratio Yes Yes Yes
Table 1.4 Gender Composition of Five Major Occupational Groups, 2018
Occupational Group Women in Occupation (%)
Management, professional, and related occupations 51.5
Service occupations 57.5
Production, transportation, and materials occupations 23.1
Sales and office occupations 61.1
Natural resources, construction, and maintenance occupations 5.1
Source: U.S. Department of Labor, 2018, Labor Force Statistics from the Current Population Survey 2018, Table 11.
Dichotomous variable: A variable that has only two values.
Copyright ©2021 by SAGE Publications, Inc. This work may not be reproduced or distributed in any form or by any means without express written permission of the publisher.
Do not c
opy, po
st, or d
istribu
te
CHAPTER 1 • THE WHAT AND THE WHY OF STATISTICS 15
However, because there are only two possible values for a dichotomy, we can measure it at the ordinal or the interval-ratio level. For example, we can think of “femaleness” as the ordering principle for gender, so that “female” is higher and “male” is lower. Using “maleness” as the ordering principle, “female” is lower and “male” is higher. In either case, with only two classes, there is no way to get them out of order; therefore, gender could be considered at the ordinal level.
Dichotomous variables can also be considered to be interval-ratio level. Why is this? In measuring interval-ratio data, the size of the interval between the categories is meaningful: The distance between 4 and 7, for example, is the same as the distance between 11 and 14. But with a dichotomy, there is only one interval. Therefore, there is really no other distance to which we can compare it.
Figure 1.3 Levels of Measurement and Possible Comparisons: Education Measured on Nominal, Ordinal, and Interval-Ratio Levels
Difference orequivalence:These people havedifferent types ofeducation.
Nominal MeasurementPossibleComparisons
PossibleComparisons
Ranking or ordering:One person ishigher in educationthan another.
PossibleComparisons
Graduated from public high school
Holds ahigh school diploma
Has 8 yearsof education
Graduated frommilitary academy
Holds aPhD
Has 16 yearsof education
Graduated fromprivate high school
Ordinal Measurement
Holds acollege diploma
Distance Meaningless
?
Interval-Ratio Measurement
Has 12 yearsof education
4 years
Distance Meaningful
How much higheror lower?
Copyright ©2021 by SAGE Publications, Inc. This work may not be reproduced or distributed in any form or by any means without express written permission of the publisher.
Do not c
opy, po
st, or d
istribu
te

16 ESSENTIALS OF SOCIAL STATISTICS FOR A DIVERSE SOCIETY
Mathematically, this gives the dichotomy more power than other nominal-level variables (as you will notice later in the text).
For this reason, researchers often dichotomize some of their variables, turning a multicategory nominal variable into a dichotomy. For example, you may see race dichotomized into “white” and “nonwhite.” Though we would lose the ability to examine each unique racial category and we may collapse catego-ries that are not similar, it may be the most logical statistical step to take. When you dichotomize a variable, be sure that the two categories capture a distinction that is important to your research question (e.g., a comparison of the number of white vs. nonwhite U.S. senators).
LEARNING CHECK 1.5
Make sure you understand these levels of measurement. As the course pro-gresses, your instructor is likely to ask you what statistical procedure you would use to describe or analyze a set of data. To make the proper choice, you must know the level of measurement of the data.
Discrete and Continuous Variables
The statistical operations we can perform are also determined by whether the variables are continuous or discrete. Discrete variables have a minimum-sized unit of measurement, which cannot be subdivided. The number of children per family is an example of a discrete variable because the minimum unit is one child. A family may have two or three children, but not 2.5 children. The vari-able wages in our research example is a discrete variable because currency has a minimum unit (1 cent), which cannot be subdivided. One can have $101.21 or $101.22 but not $101.21843. Wages cannot differ by less than 1 cent—the minimum-sized unit.
Unlike discrete variables, continuous variables do not have a minimum-sized unit of measurement; their range of values can be subdivided into increasingly smaller fractional values. Length is an example of a continuous variable because there is no minimum unit of length. A particular object may be 12 in. long, it may be 12.5 in. long, or it may be 12.532011 in. long. Although we cannot always measure all possible length values with absolute accuracy, it is possible for objects to exist at an infinite number of lengths.7 In principle, we can speak of a tenth of an inch, a ten thousandth of an inch, or a ten trillionth of an inch. The variable gender composition of occupations is a continuous variable because it is measured in proportions or percentages (e.g., the percentage of women civil engineers), which can be subdivided into smaller and smaller fractions.
This attribute of variables—whether they are continuous or discrete—affects subsequent research operations, particularly measurement procedures,
Copyright ©2021 by SAGE Publications, Inc. This work may not be reproduced or distributed in any form or by any means without express written permission of the publisher.
Do not c
opy, po
st, or d
istribu
te

CHAPTER 1 • THE WHAT AND THE WHY OF STATISTICS 17
data analysis, and methods of inference and generalization. However, keep in mind that, in practice, some discrete variables can be treated as if they were continuous, and vice versa.
LEARNING CHECK 1.6
Name three continuous and three discrete variables. Determine whether each of the variables in your hypothesis is continuous or discrete.
A C
LO
SE
R L
OO
K 1.1
A Cautionary Note: Measurement Error
Social scientists attempt to ensure that the research process is as error free as possible, beginning with how we construct our mea-surements. We pay attention to two charac-teristics of measurement: (1) reliability and (2) validity.
Reliability means that the measurement yields consistent results each time it is used. For example, asking a sample of individuals, “Do you approve or disapprove of President Donald Trump’s job performance?” is more reliable than asking “What do you think of President Donald Trump’s job performance?” While responses to the second question are meaningful, the answers might be vague and could be subject to different interpretations. Researchers look for the consistency of mea-surement over time, in relationship with other
related measures, or in measurements or observations made by two or more research-ers. Reliability is a prerequisite for validity: We cannot measure a phenomenon if the mea-sure we are using gives us inconsistent results.
Validity refers to the extent to which measures indicate what they are intended to measure. While standardized IQ tests are reli-able, it is still debated whether such tests mea-sure intelligence or one’s test-taking ability. A measure may not be valid due to individual error (individuals may want to provide socially desirable responses) or method error (ques-tions may be unclear or poorly written).
Specific techniques and practices for determining and improving measurement reliability and validity are the subject of research methods courses.
ANALYZING DATA AND EVALUATING THE HYPOTHESES
Following the data collection stage, researchers analyze their data and evaluate the hypotheses of the study. The data consist of codes and numbers used to represent their observations. In our example, two scores would represent each occupational group: (1) the percentage of women and (2) the average wage. If we had collected information on 100 occupations, we would end up with 200
Copyright ©2021 by SAGE Publications, Inc. This work may not be reproduced or distributed in any form or by any means without express written permission of the publisher.
Do not c
opy, po
st, or d
istribu
te

18 ESSENTIALS OF SOCIAL STATISTICS FOR A DIVERSE SOCIETY
scores, 2 per occupational group. However, the typical research project includes more variables; therefore, the amount of data the researcher confronts is con-siderably larger. We now must find a systematic way to organize these data, analyze them, and use some set of procedures to decide what they mean. These last steps make up the statistical analysis stage, which is the main topic of this textbook. It is also at this point in the research cycle that statistical procedures will help us evaluate our research hypothesis and assess the theory from which the hypothesis was derived.
Descriptive and Inferential Statistics
Statistical procedures can be divided into two major categories: (1) descrip-tive statistics and (2) inferential statistics. Before we can discuss the difference between these two types of statistics, we need to understand the terms popula-tion and sample. A population is the total set of individuals, objects, groups, or events in which the researcher is interested. For example, if we were interested in looking at voting behavior in the last presidential election, we would probably define our population as all citizens who voted in the election. If we wanted to understand the employment patterns of Latinas in our state, we would include in our population all Latinas in our state who are in the labor force.
Although we are usually interested in a population, quite often, because of limited time and resources, it is impossible to study the entire population. Imagine interviewing all the citizens of the United States who voted in the last election or even all the Latinas who are in the labor force in our state. Not only would that be very expensive and time-consuming, but we would also probably have a very hard time locating everyone! Fortunately, we can learn a lot about a population if we carefully select a subset from that population. A subset of cases selected from a population is called a sample. The process of identifying and selecting this subset is referred to as sampling. Researchers usually collect their data from a sample and then generalize their observations to the population. The ultimate goal of sampling is to have a subset that closely resembles the characteristics of the population. Because the sample is intended to represent the population that we are interested in, social scientists take sampling seriously. We’ll explore different sampling methods in Chapter 5.
Descriptive statistics includes procedures that help us organize and describe data collected from either a sample or a population. Occasionally, data are collected on an entire population, as in a census. Inferential statistics, on the other hand, make predictions or inferences about a population based on observations and analyses of a sample. For instance, the General Social Survey (GSS), from which numerous examples presented in this book are drawn, is conducted every other year by the National Opinion Research Center (NORC) on a representative sample of several thousands of respondents. The survey, which includes several hundred questions (the data collection interview takes approximately 90 minutes), is designed to provide social science researchers with a readily accessible database of socially relevant attitudes, behaviors, and
Population: The total set of individuals, objects, groups, or events in which the researcher is interested.
Sample: A subset of cases selected from a population.
Sampling: The process of identifying and selecting the subset of the population for study.
Descriptive statistics: Procedures that help us organize and describe data collected from either a sample or a population.
Inferential statistics: The logic and procedures concerned with making predictions or inferences about a population from observations and analyses of a sample.
Copyright ©2021 by SAGE Publications, Inc. This work may not be reproduced or distributed in any form or by any means without express written permission of the publisher.
Do not c
opy, po
st, or d
istribu
te
CHAPTER 1 • THE WHAT AND THE WHY OF STATISTICS 19
attributes of a cross section of the U.S. adult (18 years of age or older) popu-lation. Since 2006, the survey has been administered in English and Spanish. NORC has verified that the composition of the GSS samples closely resembles census data. But because the data are based on a sample rather than on the entire population, the average of the sample does not equal the average of the population as a whole.
Evaluating the Hypotheses
At the completion of these descriptive and inferential procedures, we can move to the next stage of the research process: the assessment and evaluation of our hypotheses and theories in light of the analyzed data. At this next stage, new questions might be raised about unexpected trends in the data and about other variables that may have to be considered in addition to our original variables. For example, we may have found that the relationship between gender compo-sition of occupations and earnings can be observed with respect to some groups of occupations but not others. Similarly, the relationship between these vari-ables may apply for some racial/ethnic groups but not for others.
These findings provide evidence to help us decide how our data relate to the theoretical framework that guided our research. We may decide to revise our theory and hypothesis to take account of these later findings. Recent studies are modifying what we know about gender segregation in the workplace. These studies suggest that race as well as gender shape the occupational structure in the United States and help explain disparities in income. This reformulation of the theory calls for a modified hypothesis and new research, which starts the circular process of research all over again.
Statistics provides an important link between theory and research. As our example on gender segregation demonstrates, the application of statisti-cal techniques is an indispensable part of the research process. The results of statistical analyses help us evaluate our hypotheses and theories, discover unanticipated patterns and trends, and provide the impetus for shaping and reformulating our theories. Nevertheless, the importance of statistics should not diminish the significance of the preceding phases of the research process. Nor does the use of statistics lessen the importance of our own judgment in the entire process. Statistical analysis is a relatively small part of the research process, and even the most rigorous statistical procedures cannot speak for themselves. If our research questions are poorly conceived or our data are flawed due to errors in our design and measurement procedures, our results will be useless.
EXAMINING A DIVERSE SOCIETY
The increasing diversity of American society is relevant to social science. By the middle of this century, if current trends continue unchanged, the United States will no longer be comprised predominantly of European immigrants and
Copyright ©2021 by SAGE Publications, Inc. This work may not be reproduced or distributed in any form or by any means without express written permission of the publisher.
Do not c
opy, po
st, or d
istribu
te
20 ESSENTIALS OF SOCIAL STATISTICS FOR A DIVERSE SOCIETY
their descendants. Due mostly to renewed immigration and higher birthrates, in time, nearly half the U.S. population will be of African, Asian, Latinx, or Native American ancestry.
Less partial and distorted explanations of social relations tend to result when researchers, research participants, and the research process itself reflect that diversity. A consciousness of social differences shapes the research questions we ask, how we observe and interpret our findings, and the conclusions we draw. Although diversity has been traditionally defined by race, class, and gender, other social characteristics such as sexual identity, physical ability, religion, and age have been identified as important dimen-sions of diversity. Statistical procedures and quantitative methodologies can be used to describe our diverse society, and we will begin to look at some applications in the next chapter. For now, we will preview some of these statistical procedures.
In Chapter 2, we will learn how to organize information using descrip-tive statistics, frequency distributions, bivariate tables, and graphic techniques. These statistical tools can also be employed to learn about the characteris-tics and experiences of groups in our society that have not been as visible as other groups. For example, in a series of special reports published by the U.S. Census Bureau over the past few years, these descriptive statistical techniques have been used to describe the characteristics and experiences of ethnic minori-ties and those who are foreign born. Using data published by the U.S. Census Bureau, we discuss various graphic devices that can be used to explore the dif-ferences and similarities among the many social groups coexisting within the American society. These devices are also used to emphasize the changing age composition of the U.S. population.
In Chapter 3, we describe how to calculate and describe the similarities and commonalities in social experiences (measures of central tendency) and the dif-ferences and diversity within social groups (measures of variability). We exam-ine a variety of social demographic variables, including the ethnic composition of the 50 U.S. states.
We will learn about inferential statistics and bivariate analyses in Chapters 4 through 10. First, we review the bases of inferential statistics—the normal distribution, sampling and probability, and estimation—in Chapters 4 to 6. In Chapters 7 to 10, we examine the ways in which class, sex, and ethnicity influ-ence various social behaviors and attitudes. Inferential statistics, such as the t test, chi-square, and the F statistic, help us determine the error involved in using our samples to answer questions about the population from which they are drawn. In addition, we review several methods of bivariate analysis, which are especially suited for examining the association between different social behav-iors and attitudes and variables such as race, class, ethnicity, gender, and religion. We use these methods of analysis to show not only how each of these variables operates independently in shaping behavior but also how they interlock to shape our experience as individuals in society.8
Copyright ©2021 by SAGE Publications, Inc. This work may not be reproduced or distributed in any form or by any means without express written permission of the publisher.
Do not c
opy, po
st, or d
istribu
te
CHAPTER 1 • THE WHAT AND THE WHY OF STATISTICS 21
Whichever model of social research you use—whether you follow a traditional one or integrate your analysis with qualitative data, whether you focus on social dif-ferences or any other aspect of social behavior—remember that any application of statistical procedures requires a basic understanding of the statistical concepts and techniques. This introductory text is intended to familiarize you with the range of descriptive and inferential statistics widely applied in the social sciences. Our emphasis on statistical techniques should not diminish the importance of human judgment and your awareness of the person-made quality of statistics. Only with this awareness can statistics become a useful tool for understanding diversity and social life.
At the end of each chapter, the Data at Work feature will introduce you to people who use quantitative data and research methods in their professional lives. They represent a wide range of career fields—education, clinical psychology, interna-tional studies, public policy, publishing, politics, and research. Some may have been led to their current positions because of the explicit integration of quantitative
data and research, while others are acci-dental data analysts—quantitative data became part of their work portfolio. Although “data” or “statistics” are not included in their job titles, these individu-als are collecting, disseminating, and/or analyzing data.
We encourage you to review each pro-file and imagine how you could use quanti-tative data and methods at work.
DA
TA
AT
W
OR
K
MAIN POINTS
• Social scientists use statistics to organize, summarize, and communicate information. Only information represented by numbers can be the subject of statistical analysis.
• The research process is a set of activities in which social scientists engage to answer questions, examine ideas, or test theories. It consists of the following stages: asking the research question,
formulating the hypotheses, collecting data, analyzing data, and evaluating the hypotheses.
• A theory is a set of assumptions and propositions used for explanation, prediction, and understanding of social phenomena. Theories offer specific concrete predictions about the way observable attributes of people or groups would be interrelated in real
CHAPTER 1 • THE WHAT AND THE WHY OF STATISTICS 21
Copyright ©2021 by SAGE Publications, Inc. This work may not be reproduced or distributed in any form or by any means without express written permission of the publisher.
Do not c
opy, po
st, or d
istribu
te
22 ESSENTIALS OF SOCIAL STATISTICS FOR A DIVERSE SOCIETY
life. These predictions, called hypotheses, are tentative answers to research problems.
• A variable is a property of people or objects that takes on two or more values. The variable that the researcher wants to explain (the “effect”) is called the dependent variable. The variable that is expected to “cause” or account for the dependent variable is called the independent variable.
• Three conditions are required to establish causal relations: (1) The cause has to precede the effect in time, (2) there has to be an empirical relationship between the cause and the effect, and (3) this relationship cannot be explained by other factors.
• At the nominal level of measurement, numbers or other symbols are assigned to a set of categories to name, label, or
classify the observations. At the ordinal level of measurement, categories can be rank-ordered from low to high (or vice versa). At the interval-ratio level of measurement, measurements for all cases are expressed in the same unit.
• A population is the total set of individuals, objects, groups, or events in which the researcher is interested. A sample is a relatively small subset selected from a population. Sampling is the process of identifying and selecting the subset.
• Descriptive statistics includes procedures that help us organize and describe data collected from either a sample or a population. Inferential statistics is concerned with making predictions or inferences about a population from observations and analyses of a sample.
KEY TERMS
data 2dependent variable 8descriptive
statistics 18dichotomous
variable 14empirical research 3hypothesis 5
independent variable 8inferential statistics 18interval-ratio level of
measurement 13nominal level of
measurement 11ordinal level of
measurement 12
population 18research process 2sample 18sampling 18statistics 1theory 4unit of analysis 6variable 6
22 ESSENTIALS OF SOCIAL STATISTICS FOR A DIVERSE SOCIETY
Copyright ©2021 by SAGE Publications, Inc. This work may not be reproduced or distributed in any form or by any means without express written permission of the publisher.
Do not c
opy, po
st, or d
istribu
te

DIGITAL RESOURCES
Access key study tools at https://edge.sagepub.com/ssdsess4e
• eFlashcards of the glossary terms
• Datasets and codebooks
• SPSS and Excel walk-through videos
• SPSS and Excel demonstrations and problems to accompany each chapter
• Appendix F: Basic Math Review
CHAPTER EXERCISES
1. In your own words, explain the relationship of data (collecting and analyzing) to the research process. (Refer to Figure 1.1.)
2. Construct potential hypotheses or research questions to relate the variables in each of the following examples. Also, write a brief statement explaining why you believe there is a relationship between the variables as specified in your hypotheses.
a. Political party and support of a U.S.–Mexico border wall
b. Income and race/ethnicity
c. The crime rate and the number of police in a city
d. Life satisfaction and marital status
e. Age and support for marijuana legalization
f. Care of elderly parents and ethnicity
3. Determine the level of measurement for each of the following variables:
a. The number of people in your statistics class
b. The percentage of students who are first-generation college students at your school
c. The name of each academic major offered in your college
d. The level of support for the Black Lives Matter movement, on a scale from “strong support” to “no support.”
e. The type of transportation a person takes to school (e.g., bus, walk, car)
f. The percentage of community members who tested positive for COVID-19
g. The rating of the overall quality of your campus coffee shop, on a scale from “excellent” to “poor”
CHAPTER 1 • THE WHAT AND THE WHY OF STATISTICS 23
Copyright ©2021 by SAGE Publications, Inc. This work may not be reproduced or distributed in any form or by any means without express written permission of the publisher.
Do not c
opy, po
st, or d
istribu
te

4. For each of the variables in Exercise 3 that you classified as interval-ratio, identify whether it is discrete or continuous.
5. Why do you think men and women, on average, do not earn the same amount of money? Develop your own theory to explain the difference. Use three independent variables in your theory, with annual income as your dependent variable. Construct hypotheses to link each independent variable with your dependent variable.
6. For each of the following examples, indicate whether it involves the use of descriptive or inferential statistics. Justify your answer.
a. The number of unemployed people in the United States
b. Determining students’ opinion about the quality of food at the cafeteria based on a sample of 100 students
c. The national incidence of breast cancer among Asian women
d. Conducting a study to determine the rating of the quality of a new smartphone, gathered from 1,000 new buyers
e. The average GPA of various majors (e.g., sociology, psychology, English) at your university
f. The change in the number of immigrants coming to the United States from Southeast Asian countries between 2010 and 2015
7. Adela García-Aracil (2007)9 identified how several factors affected the earnings of young European higher-education graduates. Based on data from several EU (European Union) countries, her statistical models included the following variables: annual income (actual dollars), gender (male or female), the number of hours worked per week (actual hours), and years of education (actual years) for each graduate. She also identified each graduate by current job title (senior officials and managers, professionals, technicians, clerks, or service workers).
a. What is García-Aracil’s dependent variable?
b. Identify two independent variables in her research. Identify the level of measurement for each.
c. Based on her research, García-Aracil can predict the annual income for other young graduates with similar work experiences and characteristics like the graduates in her sample. Is this an application of descriptive or inferential statistics? Explain.
8. Construct measures of political participation at the nominal, ordinal, and interval-ratio levels. (Hint: You can use behaviors such as voting frequency or political party membership.) Discuss the advantages and disadvantages of each.
24 ESSENTIALS OF SOCIAL STATISTICS FOR A DIVERSE SOCIETY
Copyright ©2021 by SAGE Publications, Inc. This work may not be reproduced or distributed in any form or by any means without express written permission of the publisher.
Do not c
opy, po
st, or d
istribu
te

9. Variables can be measured according to more than one level of measurement. For the following variables, identify at least two levels of measurement. Is one level of measurement better than another? Explain.
a. Individual age
b. Annual income
c. Religiosity
d. Student performance
e. Social class
f. Number of children
CHAPTER 1 • THE WHAT AND THE WHY OF STATISTICS 25
Copyright ©2021 by SAGE Publications, Inc. This work may not be reproduced or distributed in any form or by any means without express written permission of the publisher.
Do not c
opy, po
st, or d
istribu
te

Copyright ©2021 by SAGE Publications, Inc. This work may not be reproduced or distributed in any form or by any means without express written permission of the publisher.
Do not c
opy, po
st, or d
istribu
te