The welfare state - IFS · The welfare state: past, present and future . Benefits have become major...
28
Robert Joyce Cheltenham Science Festival, 7 th June 2019 The welfare state: past, present and future
Transcript of The welfare state - IFS · The welfare state: past, present and future . Benefits have become major...

Robert Joyce
Cheltenham Science Festival, 7th June 2019
The welfare state: past, present and future

Benefits have become major part of welfare state Real-terms spending on working-age benefits
Sources: Benefit expenditure and caseload tables 2018, GDP at Market Prices and Money GDP (BKTL series), Budget 2001 Notes: 1948-1954 GDP based on calendar years. Includes cost of Children’s Tax Credit in 2001/02-2002/03, based on forecasts in Budget 2001
© Institute for Fiscal Studies The welfare state: past, present and future
0
20
40
60
80
100
120 19
78/7
9
1980
/81
1982
/83
1984
/85
1986
/87
1988
/89
1990
/91
1992
/93
1994
/95
1996
/97
1998
/99
2000
/01
2002
/03
2004
/05
2006
/07
2008
/09
2010
/11
2012
/13
2014
/15
2016
/17
2018
/19
2020
/21
2022
/23
£ bn
(201
8-19
pri
ces)
More than trebled
Benefits have become major part of welfare state Spending on working-age benefits
Sources: Benefit expenditure and caseload tables 2018, GDP at Market Prices and Money GDP (BKTL series), Budget 2001 Notes: 1948-1954 GDP based on calendar years. Includes cost of Children’s Tax Credit in 2001/02-2002/03, based on forecasts in Budget 2001
© Institute for Fiscal Studies The welfare state: past, present and future
0%
1%
2%
3%
4%
5%
6%
7%
8%
0
20
40
60
80
100
120 19
78/7
9
1980
/81
1982
/83
1984
/85
1986
/87
1988
/89
1990
/91
1992
/93
1994
/95
1996
/97
1998
/99
2000
/01
2002
/03
2004
/05
2006
/07
2008
/09
2010
/11
2012
/13
2014
/15
2016
/17
2018
/19
2020
/21
2022
/23
% o
f GD
P
£ bn
(201
8-19
pri
ces)
Real terms (left axis)
% of GDP (right axis)
Almost doubled

What are the UK’s benefits for? Working-age benefits spending, by type
© Institute for Fiscal Studies The welfare state: past, present and future
Sources: Benefit expenditure and caseload tables 2018, Budget 2001 Notes: Tax credits include cost of Children’s Tax Credit in 2001/02-2002/03, based on forecasts in Budget 2001. “Other” benefits include Council Tax Benefit and other minor housing-related benefits
-
20
40
60
80
100
120
Out-of-work benefits
Tax credits
Housing benefit
Disability, sickness and incapacity
Other
76%
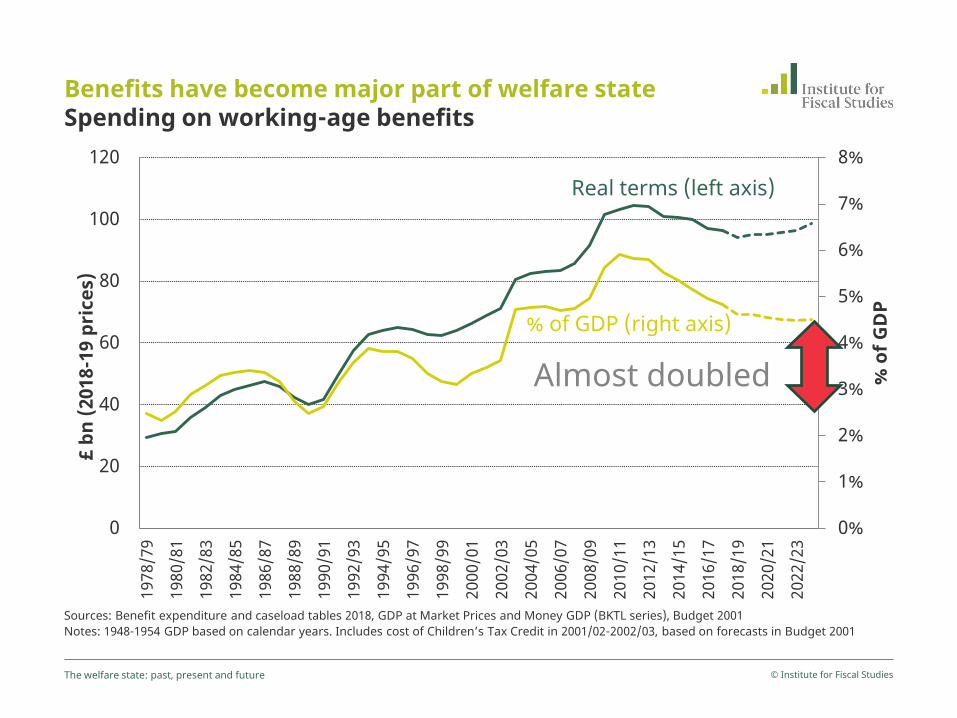
The rise and rise of means-testing Working-age benefits spending, by type
© Institute for Fiscal Studies The welfare state: past, present and future
0
20
40
60
80
100
120
1978/79 1983/84 1988/89 1993/94 1998/99 2003/04 2008/09 2013/14 2018/19 2023/24
£ bn
(201
8-19
pri
ces)
Sources: Benefit expenditure and caseload tables 2018, Budget 2001 Notes: Tax credits included in means-tested benefits. Includes cost of Children’s Tax Credit in 2001/02-2002/03, based on forecasts in Budget 2001. “Other” benefits include Child Benefit, DLA/PIP and other non-means-tested, non-contributory benefits.
Contributory
Means-tested
Other
60%
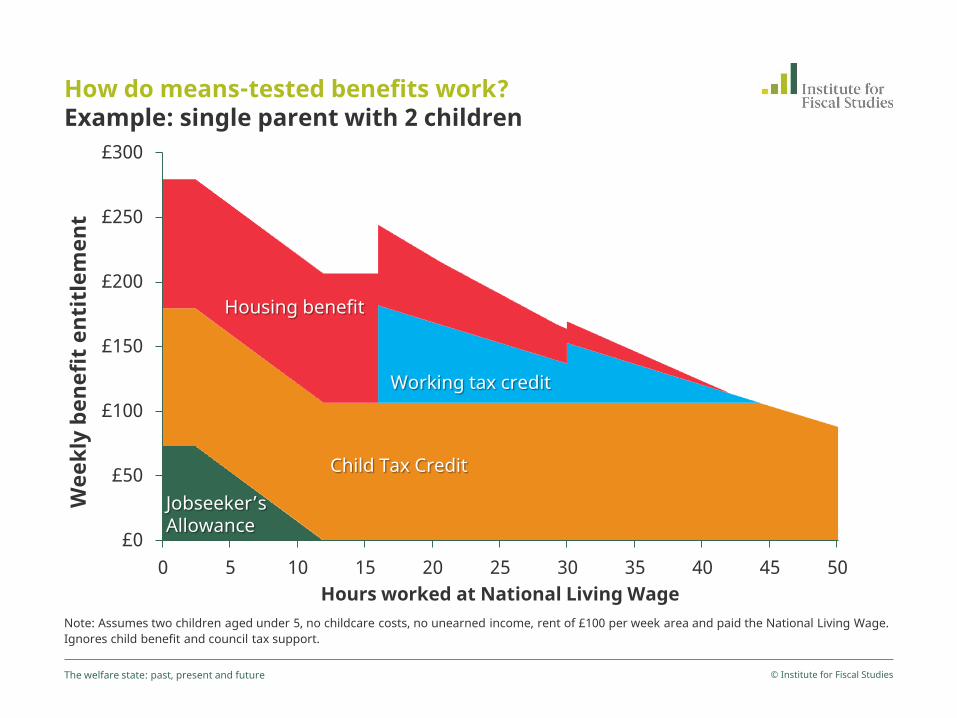
How do means-tested benefits work? Example: single parent with 2 children
© Institute for Fiscal Studies The welfare state: past, present and future
Note: Assumes two children aged under 5, no childcare costs, no unearned income, rent of £100 per week area and paid the National Living Wage. Ignores child benefit and council tax support.
£0
£50
£100
£150
£200
£250
£300
0 5 10 15 20 25 30 35 40 45 50
Wee
kly
bene
fit
enti
tlem
ent
Hours worked at National Living Wage
Jobseeker’s Allowance
Child Tax Credit
Working tax credit
Housing benefit
Universal Credit
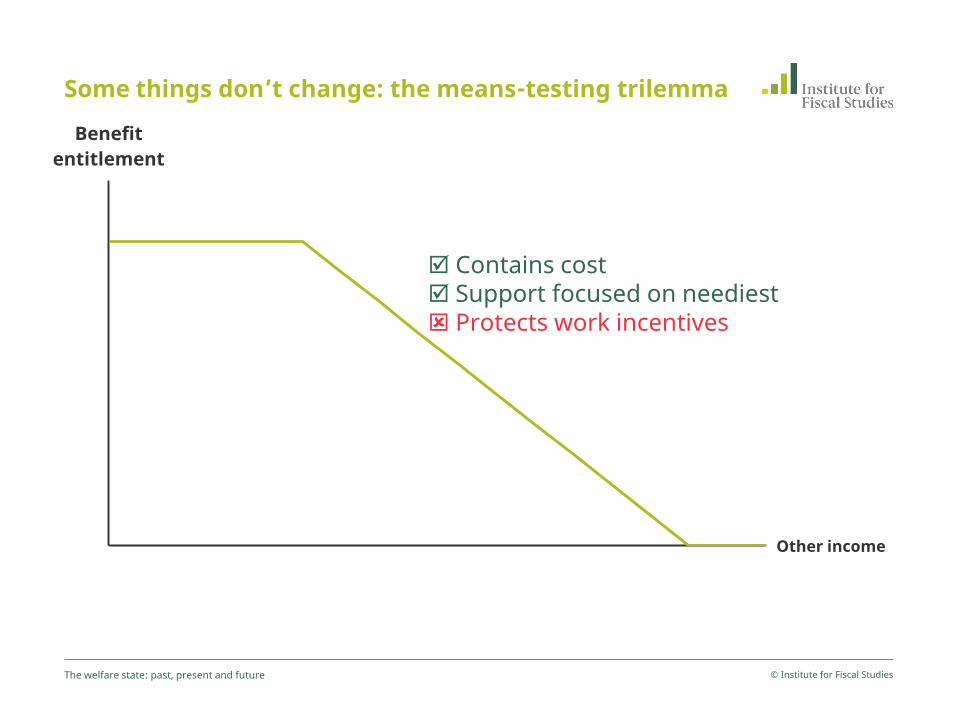
Some things don’t change: the means-testing trilemma
© Institute for Fiscal Studies The welfare state: past, present and future
Benefit entitlement
Other income
Contains cost Support focused on neediest Protects work incentives
Some things don’t change: the means-testing trilemma
© Institute for Fiscal Studies The welfare state: past, present and future
Benefit entitlement
Other income
Contains cost Support focused on neediest Protects work incentives
“Universal Basic Income”
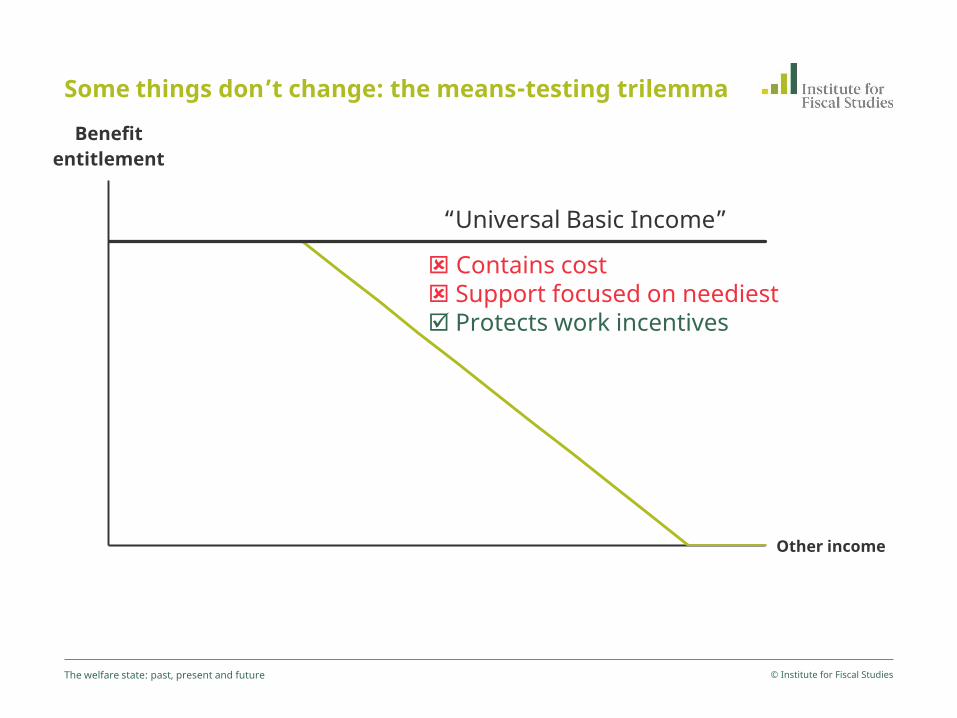
Some things don’t change: the means-testing trilemma
© Institute for Fiscal Studies The welfare state: past, present and future
Benefit entitlement
Other income
Contains cost Support focused on neediest Protects work incentives
“Universal Basic Income”

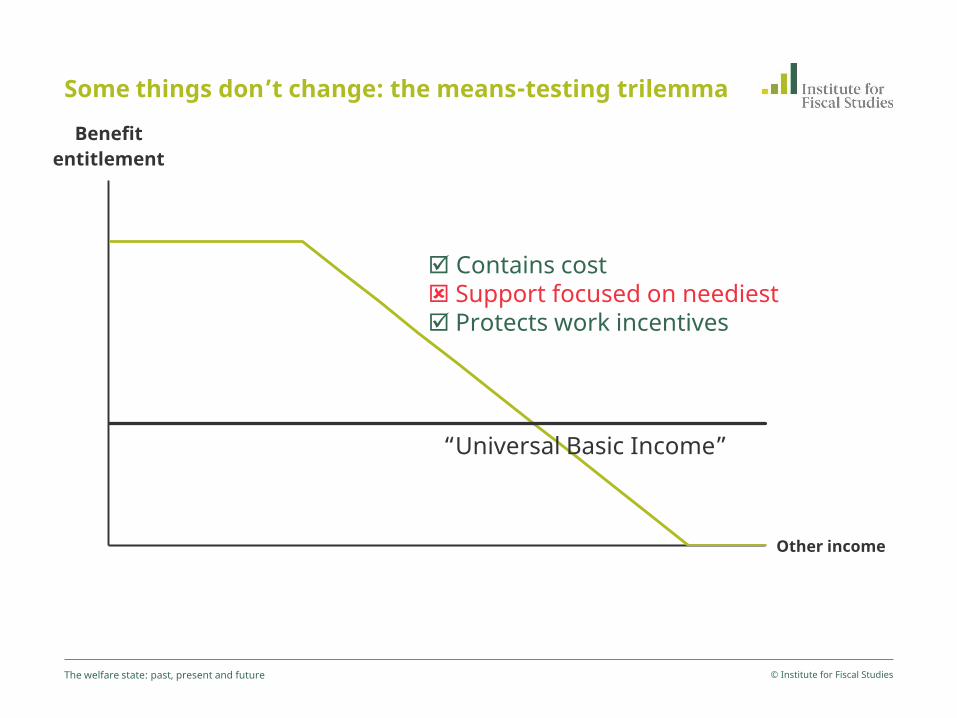
Some things don’t change: the means-testing trilemma
© Institute for Fiscal Studies The welfare state: past, present and future
Benefit entitlement
Other income
Contains cost Support focused on neediest Protects work incentives
“Universal Basic Income”
Very
Can’t x
© Institute for Fiscal Studies The welfare state: past, present and future

3 big challenges
© Institute for Fiscal Studies The welfare state: past, present and future
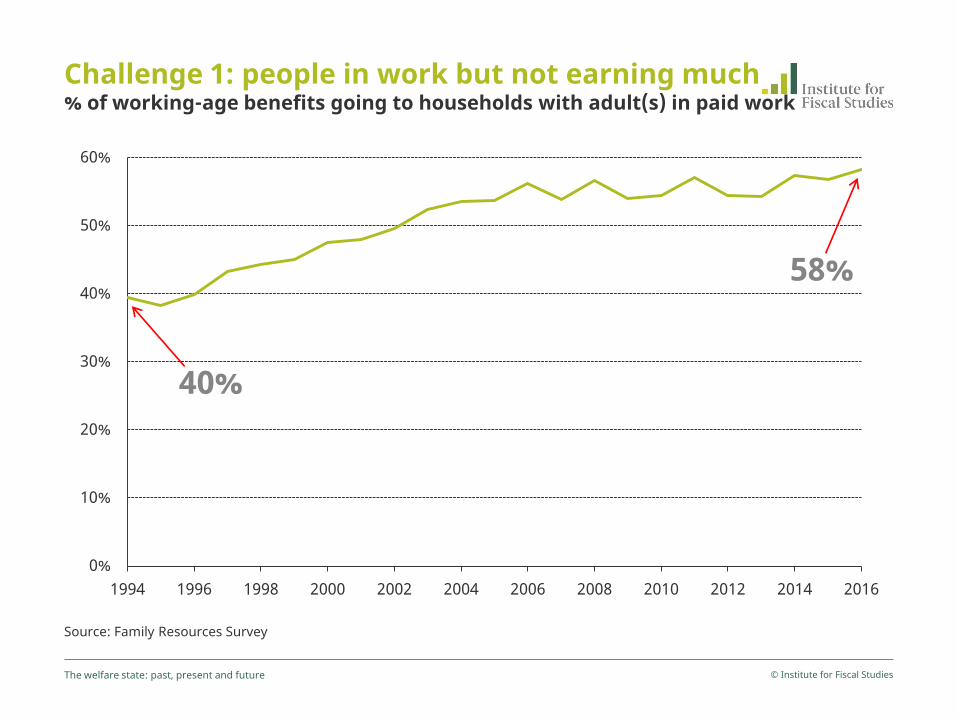
Challenge 1: people in work but not earning much % of working-age benefits going to households with adult(s) in paid work
Source: Family Resources Survey
© Institute for Fiscal Studies The welfare state: past, present and future
0%
10%
20%
30%
40%
50%
60%
1994 1996 1998 2000 2002 2004 2006 2008 2010 2012 2014 2016
40%
58%
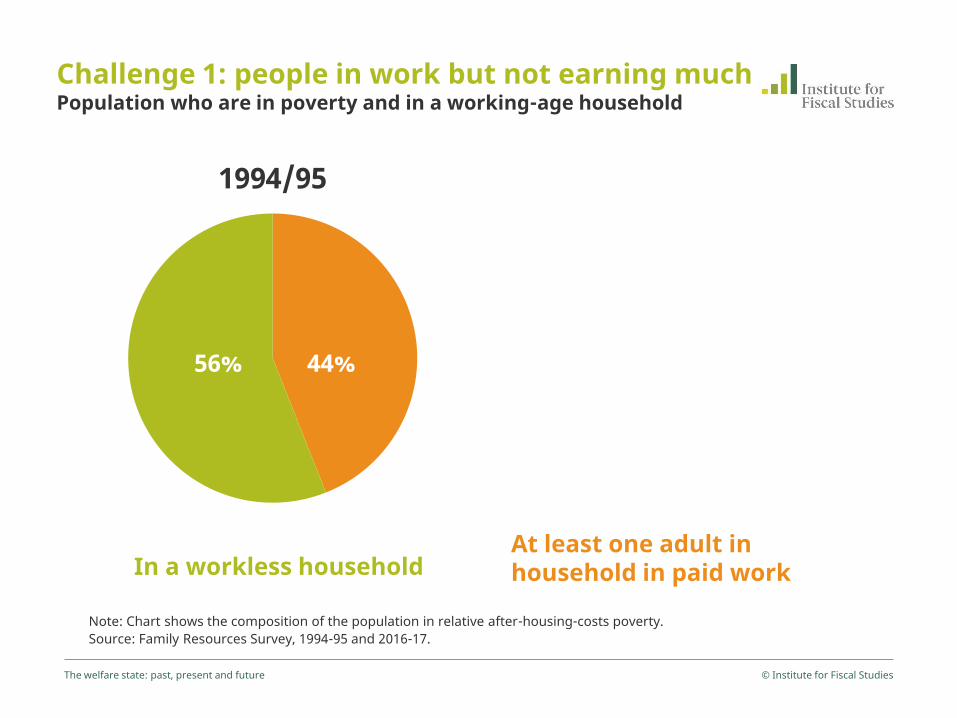
Challenge 1: people in work but not earning much Population who are in poverty and in a working-age household
© Institute for Fiscal Studies The welfare state: past, present and future
Note: Chart shows the composition of the population in relative after-housing-costs poverty. Source: Family Resources Survey, 1994-95 and 2016-17.
1994/95
56% 44%
In a workless household At least one adult in household in paid work
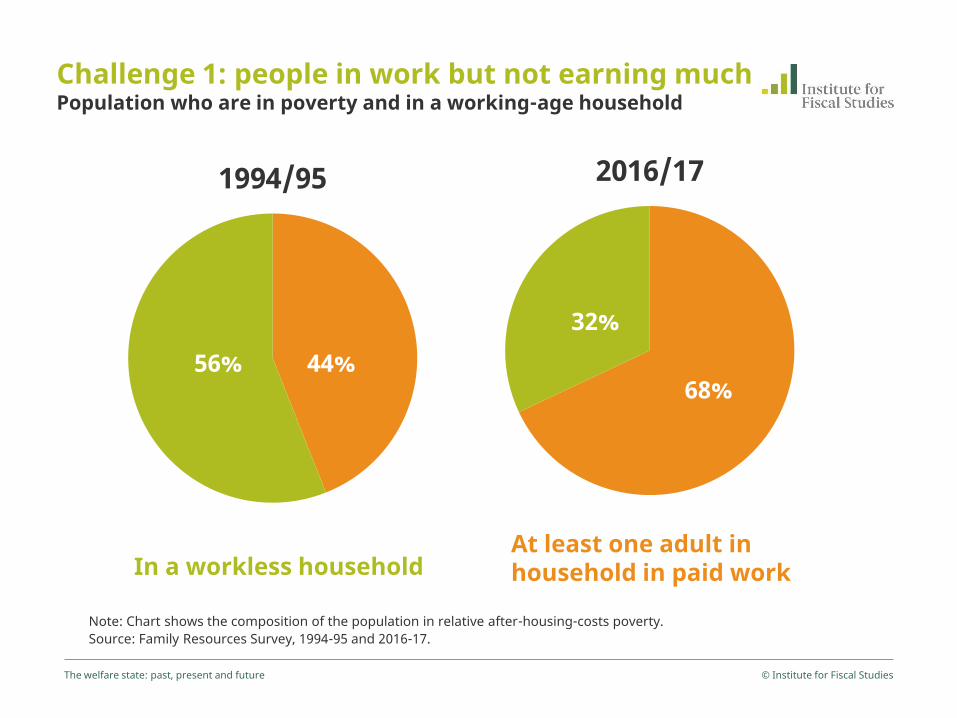
Challenge 1: people in work but not earning much Population who are in poverty and in a working-age household
© Institute for Fiscal Studies The welfare state: past, present and future
Note: Chart shows the composition of the population in relative after-housing-costs poverty. Source: Family Resources Survey, 1994-95 and 2016-17.
In a workless household At least one adult in household in paid work
1994/95
56% 44%
2016/17
68%
32%
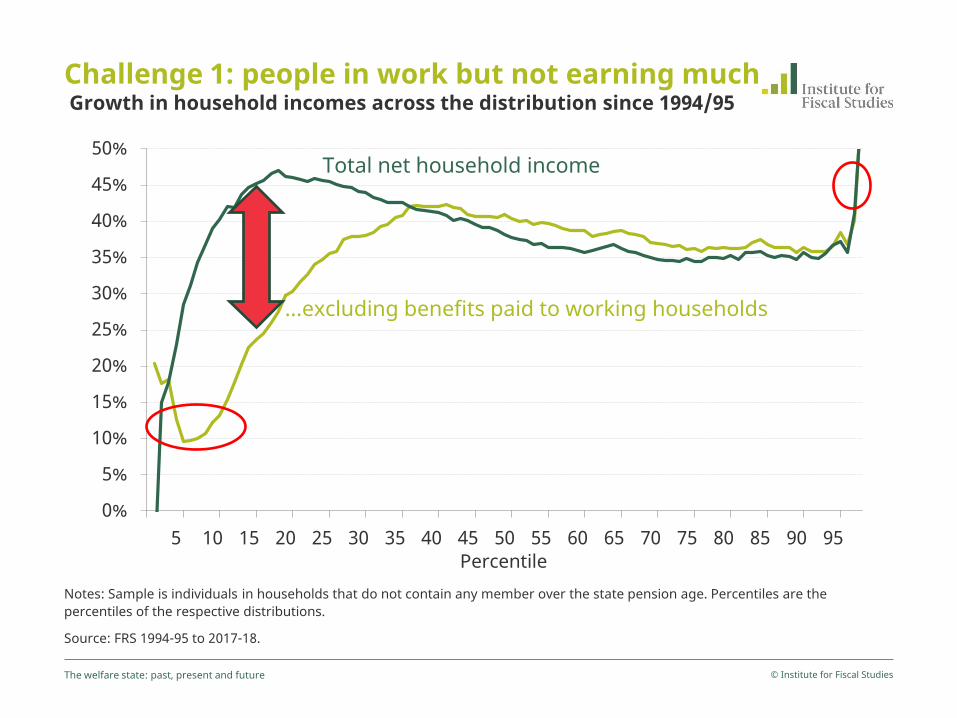
Notes: Sample is individuals in households that do not contain any member over the state pension age. Percentiles are the percentiles of the respective distributions.
Source: FRS 1994-95 to 2017-18.
© Institute for Fiscal Studies The welfare state: past, present and future
0%
5%
10%
15%
20%
25%
30%
35%
40%
45%
50%
5 10 15 20 25 30 35 40 45 50 55 60 65 70 75 80 85 90 95 Percentile
...excluding benefits paid to working households
Total net household income
Challenge 1: people in work but not earning much Growth in household incomes across the distribution since 1994/95

Challenge 2: support for housing costs
Source: DWP benefit expenditure and caseload tables 2018
© Institute for Fiscal Studies The welfare state: past, present and future
0
5
10
15
20
25
30 19
90/9
1 19
91/9
2 19
92/9
3 19
93/9
4 19
94/9
5 19
95/9
6 19
96/9
7 19
97/9
8 19
98/9
9 19
99/0
0 20
00/0
1 20
01/0
2 20
02/0
3 20
03/0
4 20
04/0
5 20
05/0
6 20
06/0
7 20
07/0
8 20
08/0
9 20
09/1
0 20
10/1
1 20
11/1
2 20
12/1
3 20
13/1
4 20
14/1
5 20
15/1
6 20
16/1
7 20
17/1
8
Hou
sing
Ben
efit
(£ b
n, 2
018/
19 p
rices
) Real spending on housing benefit
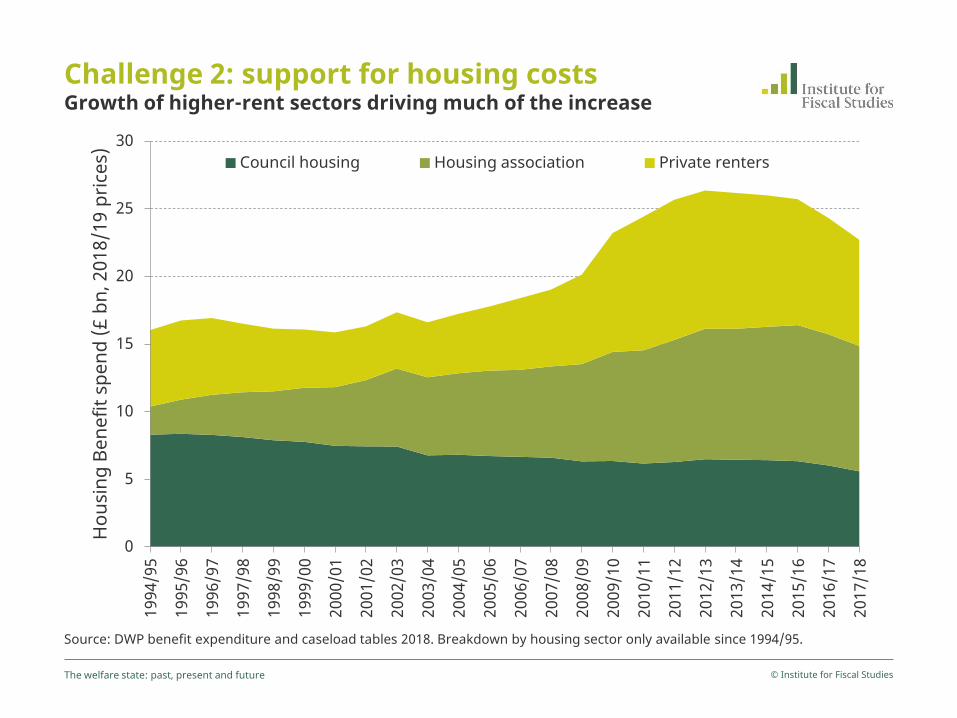
Challenge 2: support for housing costs Growth of higher-rent sectors driving much of the increase
Source: DWP benefit expenditure and caseload tables 2018. Breakdown by housing sector only available since 1994/95.
© Institute for Fiscal Studies The welfare state: past, present and future
0
5
10
15
20
25
30 19
94/9
5
1995
/96
1996
/97
1997
/98
1998
/99
1999
/00
2000
/01
2001
/02
2002
/03
2003
/04
2004
/05
2005
/06
2006
/07
2007
/08
2008
/09
2009
/10
2010
/11
2011
/12
2012
/13
2013
/14
2014
/15
2015
/16
2016
/17
2017
/18
Hou
sing
Ben
efit
spen
d (£
bn,
201
8/19
pric
es)
Council housing Housing association Private renters
Challenge 2: support for housing costs
© Institute for Fiscal Studies The welfare state: past, present and future
£50
£100
£150
£200
£250
£300
£350
£400
£450
£500
£50 £100 £150 £200 £250 £300 £350 £400 £450 £500
Loca
l hou
sing
ben
efit
cap
30th percentile of local rents
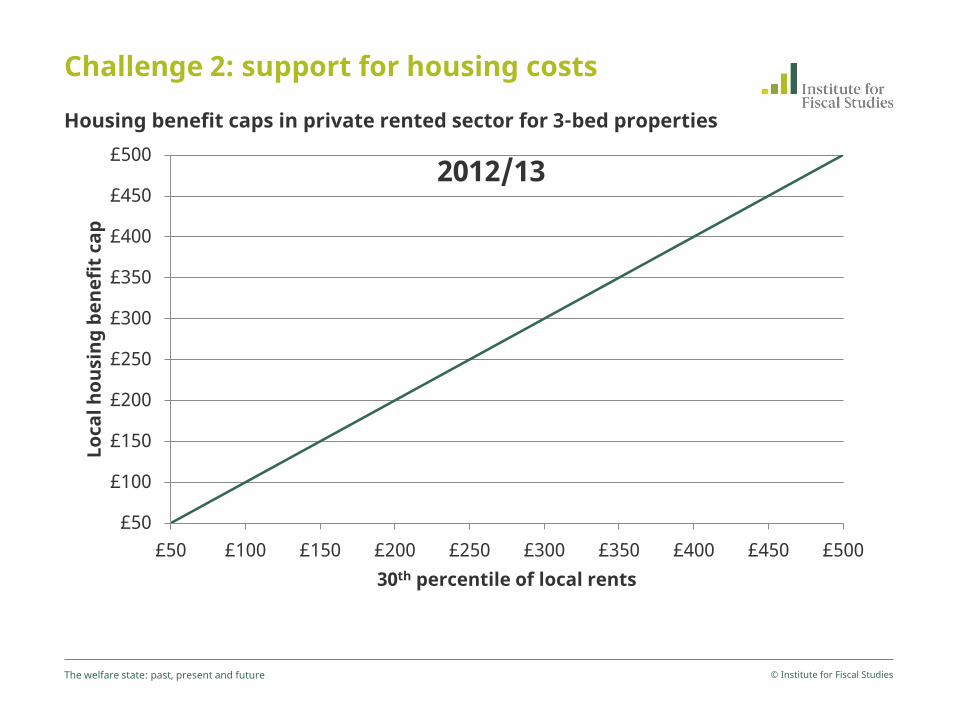
2012/13
Housing benefit caps in private rented sector for 3-bed properties

Challenge 2: support for housing costs
© Institute for Fiscal Studies The welfare state: past, present and future
£50
£100
£150
£200
£250
£300
£350
£400
£450
£500
£50 £100 £150 £200 £250 £300 £350 £400 £450 £500
Loca
l hou
sing
ben
efit
cap
30th percentile of local rents
2012/13
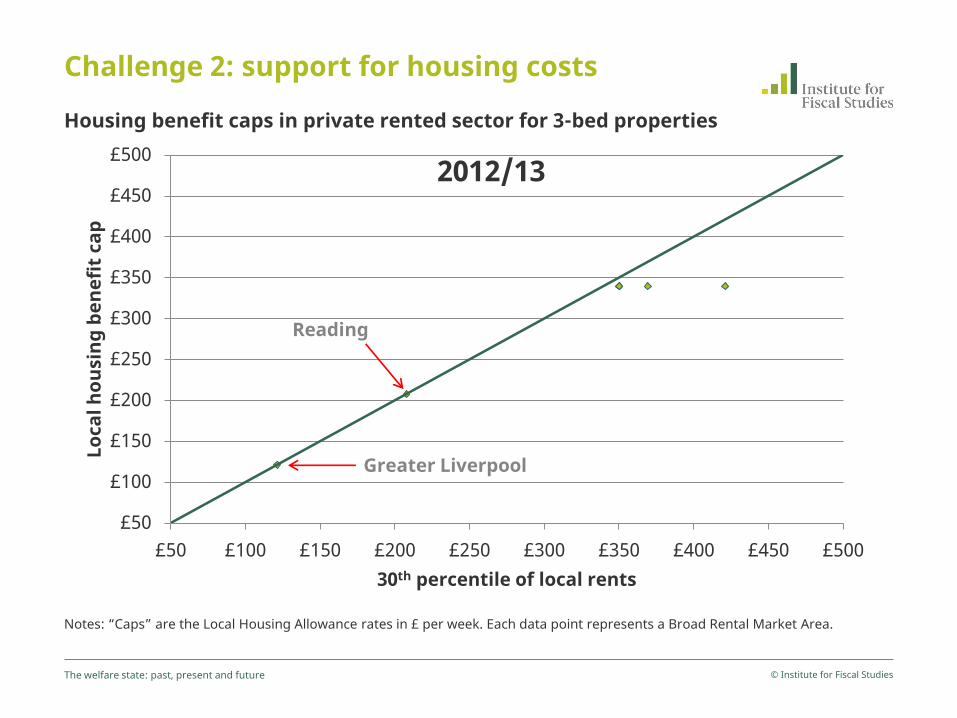
Notes: “Caps” are the Local Housing Allowance rates in £ per week. Each data point represents a Broad Rental Market Area.
Housing benefit caps in private rented sector for 3-bed properties
Greater Liverpool
Reading
Challenge 2: support for housing costs
© Institute for Fiscal Studies The welfare state: past, present and future
£50
£100
£150
£200
£250
£300
£350
£400
£450
£500
£50 £100 £150 £200 £250 £300 £350 £400 £450 £500
Loca
l hou
sing
ben
efit
cap
30th percentile of local rents
2012/13
Notes: “Caps” are the Local Housing Allowance rates in £ per week. Each data point represents a Broad Rental Market Area.
Housing benefit caps in private rented sector for 3-bed properties
Greater Liverpool
Reading

Challenge 2: support for housing costs Housing benefit caps in private rented sector for 3-bed properties
© Institute for Fiscal Studies The welfare state: past, present and future
£50
£100
£150
£200
£250
£300
£350
£400
£450
£500
£50 £100 £150 £200 £250 £300 £350 £400 £450 £500
Loca
l hou
sing
ben
efit
cap
30th percentile of local rents
2016/17
Notes: “Caps” are the Local Housing Allowance rates in £ per week. Each data point represents a Broad Rental Market Area. England only. Source: https://www.gov.uk/government/publications/local-housing-allowance-lha-rates-applicable-from-april-2016-march-2017

Challenge 2: support for housing costs Housing benefit caps in private rented sector for 3-bed properties
© Institute for Fiscal Studies The welfare state: past, present and future
£50
£100
£150
£200
£250
£300
£350
£400
£450
£500
£50 £100 £150 £200 £250 £300 £350 £400 £450 £500
Loca
l hou
sing
ben
efit
cap
30th percentile of local rents
2019/20
Notes: “Caps” are the Local Housing Allowance rates in £ per week. Each data point represents a Broad Rental Market Area. England only. Source: https://www.gov.uk/government/publications/local-housing-allowance-lha-rates-applicable-from-april-2019-to-march-2020
Cherwell Valley HB cap: £194 p/w 30th percentile rent: £206 p/w
Cambridge HB cap: £179 p/w 30th percentile rent: £229 p/w

Challenge 3: incapacity and disability
Note: ‘Incapacity benefits’ include ESA, IB, SDA, invalidity benefit, sickness benefit, and income support on grounds of disability. ‘Disability benefits’ include DLA, PIP, attendance allowance and mobility allowance.
Source: Authors’ calculations using DWP expenditure tables Autumn 2018 and Autumn 2012.
© Institute for Fiscal Studies The welfare state: past, present and future
Real working-age spending, 2010–11 to 2017–18
-27%
-5%
+5%
+49%
-40% -30% -20% -10%
0% 10% 20% 30% 40% 50% 60%
Incapacity benefits Disability benefits
Forecasts at Autumn Statement 2012
Outturns

Challenge 3: incapacity and disability The nature of incapacity has changed radically
0%
1%
2%
3%
4%
5%
6%
1998 1999 2000 2001 2002 2003 2004 2005 2006 2007 2008 2009 2010 2011 2012 2013 2014 2015 2016 2017 2018
% o
n in
capa
city
ben
efits
Age 25-34, low-educated Age 55-59/64, high-educated
Note: Data run to 2018Q3. ‘Low education’ means leaving education at or before the compulsory school-leaving age; ‘high education’ corresponds to leaving education after age 18. For the yellow series, the upper age limit is 59 for women and 64 for men.
Source: Labour Force Survey
© Institute for Fiscal Studies The welfare state: past, present and future
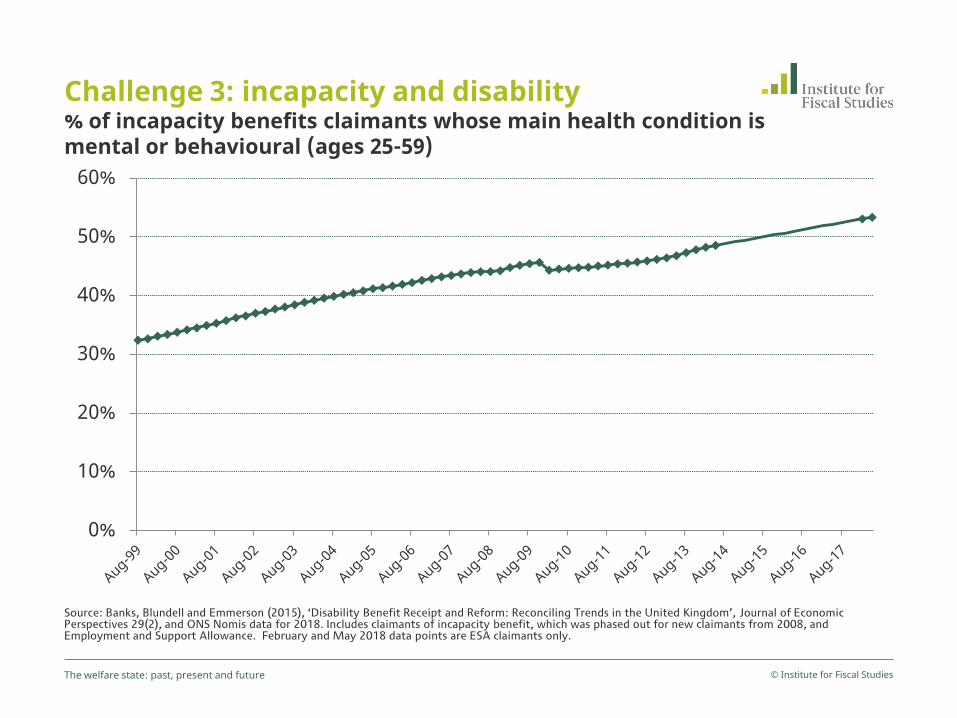
Challenge 3: incapacity and disability % of incapacity benefits claimants whose main health condition is mental or behavioural (ages 25-59)
Source: Banks, Blundell and Emmerson (2015), ‘Disability Benefit Receipt and Reform: Reconciling Trends in the United Kingdom’, Journal of Economic Perspectives 29(2), and ONS Nomis data for 2018. Includes claimants of incapacity benefit, which was phased out for new claimants from 2008, and Employment and Support Allowance. February and May 2018 data points are ESA claimants only.
© Institute for Fiscal Studies The welfare state: past, present and future
0%
10%
20%
30%
40%
50%
60%
Robert Joyce
Cheltenham Science Festival, 7th June 2019
The welfare state: past, present and future