
THE WATE -RESOURCER OSF ÍATÍ AMERICN A AND THE …
267
r» . TODS© WFORfil de G THE WATER -RESOURCES OF ÍATÍN AMERICA AND THE CARIBBEAN — PLANNING, • HAZARDS AND POLLUTION UNITED NATIONS
Transcript of THE WATE -RESOURCER OSF ÍATÍ AMERICN A AND THE …
r» . TODS© WFORf i l d e G
THE WATER -RESOURCES OF ÍATÍN AMERICA AND THE CARIBBEAN — PLANNING, •
HAZARDS AND POLLUTION
UNITED NATIONS


s i ' r y o G o s © íiii^íFOFíitüEi tí© ía C f e m i i
THE WATER RESOURCES OF LATIN AMERICA AND THE CARIBBEAN — PLANNING,
HAZARDS AND POLLUTION
UNITED NATIONS
ECONOMIC COMMISS ION FOR LATIN AMERICA AND THE CARIBBEAN
Santiago, Chile, 1990

LC/G.1559-P
July 1990
The papers included in this publication were prepared by the Water Resources Unit of the Division of Natural Resources and Energy.
U N I T E D N A T I O N S P U B L I C A T I O N
Sales No.: E.90.II.G.8
ISSN 0256-9795 ISBN 9 0 - 1 - I 2 1 I 5 8 - I

CONTENTS
Page
INTRODUCTION 11
Part One
THE FORMULATION OF WATER RESOURCE MANAGEMENT PLANS
Introduction 23 Evolution of and perspective for water resource planning in Latin America and the Caribbean 24
A. REFERENCE FRAMEWORK FOR THE FORMULATION OF NATIONAL PLANS FOR THE MANAGEMENT OF WATER RESOURCES . . 26
1. Objectives and decision-making 26 2. Water regionalization as a basis for harmonization
of water supply and demand 31 3. The relation between the national planning of water
resources, the planning of basins and the formulation of projects 39
B. A COMPARATIVE ANALYSIS OF NATIONAL WATER RESOURCE MANAGEMENT PLANS . . . 43
1. Aims and goals of the plans 44 2. The relative degree of experience in the
formulation of plans 50 3. The organization and methods used for the
formulation of plans 51 4. The structure and content of the plans 52

Page
C. RELATIONSHIP BETWEEN NATIONAL WATER RESOURCE MANAGEMENT PLANS AND OTHER PLANS 58
1. National economic development plans and water resource management plans 58
2. Sectoral and subsectoral plans for water use . . . . 62
D. CONCLUSIONS 83
1. The importance of planning in the region 83 2. Effects of the formulation of plans
on water resource development 84 3. Strategies for strengthening the national and
multisectoral planning of water resources . . . . . 84 4. State of progress in water resource management
planning in Latin America and the Caribbean . . . 85 5. The next steps 92
Part Two
WATER-RELATED NATURAL HAZARDS
Introduction 95
A. THE GEOGRAPHICAL DISTRIBUTION OF NATURAL HAZARDS 97
B. CHARACTERISTICS OF NATURAL HAZARDS . . 97
L Droughts 99 2. Windstorms 102 3. Floods 107 4. Land and mudslides 114 5. Tsunamis 115

Page
C. MEASURES FOR THE MITIGATION OF NATURAL DISASTERS 116
1. Structural measures 116 2. Non-structural measures 119 3. Regional co-operation 124
Part Three
WATER POLLUTION
Introduction 131
1. WATER POLLUTION CAUSED BY POINT-SOURCE WASTE DISCHARGES 132
A. Overall patterns 132 B. Main point-source waste discharges 133
1. Domestic sewage 133
2. Industrial effluents 138
II. NON-POINT SOURCE WATER POLLUTION . . 153
A. Run-off from agricultural land 153
1. Fertilizers 155 2. Pesticides, herbicides, insecticides and
other chemical substances 155 3. The regional situation 159
B. Storm-water run-off 160 C. Percolation of polluted water into groundwater . 160 D. Precipitation of polluted water 163
III. THE IMPACT OF WATER POLLUTION ON HUMAN HEALTH AND WELFARE 164
A. Human wastes and human health 166 B. The consequences of the use of polluted water
for irrigation 168

Page
C. Recreation and health 169
IV. WATER POLLUTION CONTROL 169
A. Laws aimed at controlling water pollution . . . 169 B. Water quality monitoring 173 C. Technological advances in water pollution
control 175
1. Waste treatment 175 2. Biological control of agricultural pests . . . . 177 3. Human resource development 177
D. The work of international organizations . . . . 178
V. CONCLUSIONS 179
Notes 180
Annex 1 -Latin America and the Caribbean: information on water-related natural disasters, 1979-1987 205
Annex 2 -Latin America and the Caribbean: emergency plans and disaster legislation 207
Annex 3 -Latin America and the Caribbean: national organizations in the field of disaster management 211
Annex 4 -List of ECLAC documents in the field of natural disaster damage assessment 214
Annex 5 -Latin America and the Caribbean: estimates of domestic sewage outflow and composition for cities with 100 000 inhabitants or more in 1980, by major hydrographic basins and countries 216
Annex 6 -Installed capacity of selected industries, by water body 225

Page
Annex 7 -Latin America and the Caribbean: mining production, by minerals, countries and years 245
Annex 8 -Latin America and the Caribbean: agricultural chemicals whose consumption and/or sale have been banned, withdrawn, severely restricted or not approved by governments . . 250


INTRODUCTION
Following the United Nations Water Conference held in Mar del Plata, Argentina in 1977, ECLAC was charged with reporting on the application of the Mar del Plata Action Plan. This volume of papers is such a report and provides a review of developments in areas of water resource management in Latin America and the Caribbean. The prime purpose of these reviews is to provide water managers in the region with an insight into developments in water management in countries other than their own and to provide a comparative evaluation of the different national experiences. At the same time, for those outside the region, the intention is to provide a summary of water management developments not available elsewhere.
This book contains three reviews: on the formulation of national water resource plans, on water-related natural hazards, and on water pollution. These particular subjects were chosen because little information was available on them previously. They are also topics of particular interest at the present time. Further reports are in preparation, including an Atlas of water resources and their use, a survey of the financing of investments in the water sector, and a report on the education and training of professionals and technicians. In addition, an evaluation is planned of the progress achieved in the region in the provision of drinking water supply and sanitation during the International Drinking Water Supply and Sanitation Decade.
Present trends in water resource use
Despite the severe economic crisis that has affected the region during most of this decade, the use of the region's water resources has continued to intensify, although not at the rate estimated during the 1970s. The major demands remain those for water supply, for irrigation and for the generation of hydro-electricity.
The continual growth of the population and emigration to the cities are the main factors impelling the increase in both the demand
I I

for drinking water and the use of the water resource for the transportation of wastes. The growth of the population served with drinking water supply and sanitation has not been as fast as was anticipated at the beginning of the decade (figure 1), but in contrast the expansion of demand has been notable.
Over the last twenty years, the area of cultivated land under irrigation has increased by three-quarters, and in some countries —particularly in the Caribbean and Central America— the area has grown much more than this (figure 2).
The installed capacity in hydro-electricity has continued to grow during this decade both absolutely and relatively as a proportion of the total installed electricity generating capacity (figure 3). Expansion in capacity has been largest in the bigger economies, although some of the smaller countries show the fastest relative rates of growth.
The result of the growth of water use is increasing control over patterns of flow of the water resource. Even now, however, the pattern of water use in Latin America and the Caribbean remains characterized by a heavy concentration in coastal areas, with only limited impact on the flows of the major drainage systems. The major human influence on patterns of flow continues to be land use, but the deliberate regulation of flows is growing in significance.
Given these characteristics of contemporary water use, the relevance of the three subjects treated in these reviews is obvious. The increasing intensity of use demands adjustment of management institutions and methods, and the formulation of management plans is one means of introducing such change. The losses from water-related natural disasters have increased as human activities have multiplied and become more capital-intensive, while the increasing concentration of population and the growth of industry have brought in their train the pollution of the region's water resources.
FORMULATION OF WATER RESOURCE MANAGEMENT PLANS
This study examines the formulation of plans for water resource management in Latin American and the Caribbean countries, in order to explore the prospects of an interchange of experiences in the field of water management within the region.
The study is based on a comparative analysis of a number of water resource management plans at different stages of formulation, both national and regional. The documents analysed come from Brazil, Colombia, the Dominican Republic, Ecuador, El Salvador, Honduras, Jamaita, Mexico, Peru and Venezuela. The aim has been to
12

13

Figure 2 LATIN AMERICA AND THE CARIBBEAN: LAND UNDER
IRRIGATION (thousands of hectares)
1SQQQ ^
E2 Caribbean Q Central America ^ South America
1Z0Q0
SOQO
Irrigated land as percentage of cultivated area
12 X
10 X
a X
6 X
4- X
2 X
• X 1989 Latin Amen GO Souih Central Canbbein Amaneo Amenco

14QQQQ MW
Figure 3 NET INSTALLED CAPACITY OF ELECTRIC GENERATING
PLANTS, BY TYPE, 1970-85 Capacity in 1985
12QDQQ MW
1DD0D0 MW
SQQQD MW
SQDQD MW
W Q Q Q MW
2 0 0 0 0 MW
0 MW
100 X
ao K
SO K
4-0 K
20 X
Q 1 S 7 0 1 0 7 8 isao isas
S o u r e a : U n i t e d N o t i o n e , E n o r ¡ y H t c t i a t i c a reirtaook, v o r i o u a r a e a n t y e o n a . New r o r t . S o u t h A m e r i c a C e n t r a l A m o n c a C a r i b b e i n
a n d M e x i c o

compare plans relating to the multisectoral use of water, although the report also reviews a number of sectoral plans, mainly in relation to population, energy and agriculture.
The analysis shows that the countries of the region which have undertaken the formulation of national water management plans follow or have followed a similar methodology of work. This methodology includes the territorial regionalization of the water resource, the calculation of the supply and demand for water by regions, and the formulation of technical and administrative strategies to harmonize water requirements and availability. There is, however, an appreciable difference in the progress made in each country, owing to the years of difference in the initiation of the plans, the different ecological/environmental conditions prevailing in each country, and the different modes of work and other factors, all of which indicate that there is considerable potential for an interchange of ideas on the subject.
An effort has been made to determine the relative usefulness of the formulation of plans, the way in which socioeconomic development plans are related to those for water development, and the form in which plans of national scope are linked with those applying to regions and to river basins. The study includes an analysis of the way in which water resource plans incorporate the environmental dimension. No attempt has been made, however, to evaluate the form in which plans, once completed, have been or are intended to be put into practice.
From the main observations made in the text, it can be said that on the whole the formulation exercise has been useful in the countries which have undertaken it. The chief benefits obtained include: a better knowledge of the availability of water in these countries and in their respective regions; better interinstitutional co-ordination with regard to water; a better knowledge and increased creation of alternatives for the harmonizing of water supply and demand; a better perception of the current and potential conflicts concerning water exploitation; a better prospect of incorporating environmental considerations, and —almost immediately— a large number of options for improving the operation of the water systems already constructed.
The conclusions indicate that the formulation of plans enables the countries to develop water policies in accordance with their socioeconomic development goals, although there is certainly no guarantee or compulsion that these policies will be realized or taken into account in the decision-making process.
16

WATER-RELATED NATURAL HAZARDS
This report provides a review of the regional situation in respect of water-related natural hazards. It includes a discussion of the characteristics of the water-related natural hazards that affect Latin America and the Caribbean, recent experience of disasters caused by such hazards, their effects on social and economic development and the environment, and the disaster-mitigation measures adopted in the region.
Many areas of Latin America and the Caribbean are prone to natural hazards arising from extreme events related to water. The countries of South America are most frequently affected by floods and flood-induced land and mudslides. In contrast, in Central America and the Caribbean the severest natural disasters are usually tropical cyclones. In addition, many areas in all parts of the region are affected by droughts which sometimes last for several years.
Water-related natural disasters inflict heavy damage on the region's economy and cause numerous deaths. Unfortunately, there has been no systematic evaluation of this impact, but a comprehensive picture can be built up from individual examples. In 1979, the hurricanes David and Frederick led to more than 1 400 deaths and caused damage estimated at US$830 million or 16% of GDP in the Dominican Republic. In 1982-1983, a combination of extensive flooding in the coastal areas and extreme drought in the highlands in Bolivia, Ecuador and Peru caused total damage estimated at US$3 478.9 million or 8.5% of GDP. In 1985, a mudslide set off by the eruption of the Nevado del Ruiz volcano in Colombia killed over 23 000 people and injured 5 000 others. In all, in recent years, water-related natural disasters have caused damage estimated at US$11 billion or 1-2% of the region's annual GDP. The devastating effects of natural disasters show a tendency to increase. Several factors contribute to this. In the region the process of population growth and migration of population to cities and other areas of relatively higher risk continues. Population growth is accompanied by increased capital investment and construction of dwellings and other structures in hazardous areas. Finally, the severity of certain water-related disasters has increased due to the man's negative influence on his environment.
The extent of the damage caused by natural disasters in Latin American and Caribbean countries can be reduced by mitigation measures. Structural measures are most frequently used to protect from floods. To reduce the impact of droughts, efforts have been concentrated on improving the availability of water through storage
17
or through the tapping of groundwater. Attention has also been paid to more efficient utilization of water and unconventional water sources. Construction of breakwaters and sea-walls helps mitigate the impact of storms. Structural measures are usually highly capital intensive, however, so that their wider utilization is hampered by the lack of financial resources. Non-structural measures adopted in Latin America and the Caribbean include warning systems, emergency measures, land-use controls and building regulations. Regional forecasting and warning measures are particularly important in the Caribbean and Central America, where the Hurricane Committee co-ordinates national and regional activities related to early hurricane warning and flood forecasting. There is also substantial co-operation in flood forecasting in the River Plate basin, in tsunami warnings in the Pacific and in drought forecasting. Emergency measures, including development of emergency legislation and plans, construction of Disaster Centers, etc., have been adopted to a limited extent. Land use planning measures are applied only in isolated cases within urban areas, although their use is growing. Building regulations are also used in the region as a disaster-mitigation measure, but their impact is limited.
WATER POLLUTION
One of the salient features of the use of the water resources of Latin America and the Caribbean in the second part of the twentieth century has been the emergence of pollution as a significant and alarming problem of many water bodies. Locally, it is a problem that has already reached critical proportions. The most important factors accounting for the increase in pollution include rapid population growth, improvement in the provision of drinking water supply and sewerage services, the expansion of industry and the technification of agriculture —all this unaccompanied by corresponding development of waste treatment facilities and pollution control.
Despite the significance assumed by water pollution in the region, there has been no systematic evaluation of its evolution, its impact on the welfare of the population or its economic consequences. The overall effect of water pollution on water resources is also not known. This report is an attempt to fill this gap through a descriptive survey based on existing reports and information, aimed at providing an overview of the growing water pollution problems and the measures adopted by countries to combat them.
18

The main sources of water pollution in the region are direct discharges of domestic sewage and industrial effluents, with the general cause of pollution being the overall absence of wastewater treatment plants for any but the most toxic industrial wastes. As a result, virtually all effluents are discharged into the nearest water bodies without any treatment. Available information suggests that it is domestic sewage which causes particular health concern. At present, many water bodies, particularly near large urban areas, are heavily contaminated. Recent studies indicate that, on average, faecal coliform contamination is likely to be higher in Central and South American rivers than in other regions of the world. The major industrial waste loads in the region come from the pulp and paper, chemical, petrochemical, petroleum refining and metal-working industries, food processing and textiles. Pollution from mining and petroleum production also affects many rivers and some coastal areas, with pollution from mining being particularly acute in the Andean countries. An important and growing source of pollution is the use of fertilizers and toxic chemicals in agriculture, although their consumption in the region continues to be substantially lower than in developed countries. Pollution by such products is frequently aggravated by significant local abuses in their use and improper application owing in part to the lack of knowledge of soil management techniques.
Water pollution has a significant effect on the welfare of the population and, to a lesser extent, on the economic development of the Latin American and Caribbean countries. The pollution of surface waters by domestic sewage poses serious health problems, particularly to the urban population, in many countries. It is generally accepted that the high rate of infant mortality and the incidence of various intestinal infectious diseases can be attributed at least partially to the pollution of water bodies by human wastes. There are indications that contamination of water bodies in different parts of the region by agricultural chemicals and industrial effluents also represents a hazard for human health. A serious problem is the use of contaminated water for irrigation. Groundwater, which in many areas it is an important source of drinking water and of water for irrigation, is also increasingly affected by pollution.
In the last decade the countries of Latin America and the Caribbean have adopted various measures, including laws to control pollution, water quality monitoring and the wider adoption of wastewater treatment, with the aim of remedying water pollution problems. Many countries seem to possess well-prepared water pollution control legislation but it frequently falls far short of achieving its objectives in practice. Adequate water quaiity
Í9

monitoring networks are still rare, and because most effluents are discharged without any treatment the monitoring of wastewater quality is also limited. Nevertheless, measurement and studies of surface and groundwater quality have made considerable advances in the region. Because of the high costs and other problems related to the introduction of wastewater treatment several countries have centered their efforts on the development of relatively simple and low-cost waste treatment techniques such as stabilization ponds and methods based on the use of local products.
On the whole, while not denying the advances made in the region towards reducing water pollution, the Latin American and Caribbean countries continue to face a steady decline in the water quality of many water bodies, and because of inadequate financial resources, weak implementation of existing legislation and the generalized attitude that preservation of water quality is only a secondary priority, efforts to arrest this decline are still no more than incipient.
20

Part One
THE FORMULATION OF WATER RESOURCE MANAGEMENT PLANS *
This document was published by ECLAC under the symbol LC/G.1391 on 1 April 1986.


Introduction
The importance of planning as a basis for accelerating economic and social development has been a subject of debate since the end of the 1940s.^ The purpose of the present study is to make a preliminary assessment of Latin American experiences in the planning of the utilization and management of water resources in order to: a) decide if it would be justifiable to make a serious attempt at horizontal co-operation, by assessing the existing relations between efforts and decisions in the planning field with regard to the allocation of resources to the water sector and the decisions made on the management (or utilization) of water and allied resources, parts of which depend the attainment of the development goals established in the plans; and b) define the scope of a co-operative effort between national institutions engaged in the planning, management and use of water resources.
The advocates of water resource planning maintain that it is the only way to achieve an integrated approach to the utilization and management of a resource which can satisfy several objectives and be used for multiple ends. Planning enables the long-term reciprocal influences of physical and socioeconomic systems to be taken into account, and thus provides the bases for a flexible management to cope with uncertainty and reduce traditional external effects (environmental repercussions) so as to obtain greater and more sustained economic services from the system of water and related resources. Planning permits the co-ordination of a multiplicity of institutions involved in the exploitation of natural systems (river basins) in which water is a central element, and this in its turn leads to the application of the integrated and flexible decision-making process outlined above.
The sceptics think that the planners of water use overlook the politico-institutional and socioeconomic realities which guide the actual decisions on public resource allocation and the way in which water is used. Hence the plans reflect a technocratic opinion expressed in ideal draft projects which have no relation to the real
23

decision-making process and are therefore not functional. Although these opinions for and against may seem exaggerated they are contrasted in this way in order to elucidate the issues that must be considered.
Evolution of and perspectives for water resource planning in Latin America and the Caribbean
It is premature to express opinions on the future of the planning of water resource management in Latin America and the Caribbean, but there is a clear trend in all the countries towards the formulation of increasingly complete and long-term plans.
Originally, the common trend in the countries of the region was to plan water resources by user sector, especially irrigation, energy generation and the supply of drinking water. Frequently these plans did not form part of national or regional development plans, their sole purpose being to give priority to investments in water projects without taking into accqjmt other a^ects, such as "to incorporate the environmental dimension" in the designing and operation of the projects and in particular to promote the multiple utilization of water resources.
Neither were territorial spaces clearly defined in these plans. The use of water was planned in response to administrative rather than hydrographic limits and it was uncommon for hydrographic basins to be considered as the basis for an integral planning of the utilization of water.
The main problems in the management of water systems in Latin America and the Caribbean are as follows: a) the difficulty encountered in the operation and maintenance of constructed works and the management and conservation of the natural resources included in the project ^reas; b) the excessive sectoralization of activities in the field of water; c) the scant attention paid to social and environmental considerations generated by the project in general; d) the difficulty of sustaining and giving priority to the large investments required for the utilization of water resources; e) the scant attention paid to the use of water in rainfed zones in the agricultural sector.
In order to solve these problems the countries of the region have decided to seek different options for the management, co-ordination and integration of activities associated with water resources. At the outset it was usual to set up commissions formed by representatives of various sectors using water resources. When these commissions became permanent, and ceased to solve possible
24

emergencies, they were gradually transformed into an instance of interinstitutional consolidation. The best-known case is that of Mexico, which in 1926^ formed the National Irrigation Commission, in conjunction with the enactment of a specific law on this priority aspect of water use. At the beginning of 1947, the National Irrigation Commission was raised to the category of Secretariat and there came into being what was then known as the Secretariat for Water Resources (Secretaria de Recursos Hidráulicos) (SRH), today designated the Secretariat (i.e.. Ministry) of Agriculture and Water Resources (SARH). In 1950 there began to appear river basin projects for multiple purposes and subsequently in 1972^ the Commission for the National Water Plan was set up.
In the case of Mexico, the driving and cohesive factor which stimulated the creation of a national water plan was the need to plan the use of irrigation water, owing to the large investments required for this purpose. In other countries, and in line with their particular features, the priority uses have been linked with energy generation, the provision of a drinking water supply and navigation, together with the need to control the quality of water and such phenomena as floods or droughts.
The geographical area of action of these institutions was in accord with these sectoral purposes and frequently their activities were conducted only in certain parts of the territory of a country or in the area of a basin. More recently, however, these limits have been far exceeded in respect of water resource management. Thus, in addition to national plans and individual basin plans, there are binational and multinational plans comprising the integral management of the large^ basins, as for example the River Plate Basin, with the creation of the Intergovernmental Committee of the Countries of the River Plate Basin (CIC). These advances have been associated with an improvement in the co-ordination of interinstitutional activities and in water legislation.'*
These facts serve to show that on some fronts which foster the development of an adequate policy in the field of water utilization, such as planning, management, integration, interinstitutional co-ordination, legislation on water resources and financial negotiation, important progress has been made in Latin America and the Caribbean, and every effort to facilitate this progress will therefore benefit the countries of the region. The nature of these aspects is analysed in the present study.
25

A. REFERENCE FRAMEWORK FOR THE FORMULATION OF NATIONAL PLANS FOR THE MANAGEMENT
OF WATER RESOURCES
1. Objectives and decision-making
In view of the many variables involved in the preparation of a plan for water resource management and considering the diversity of situations, it is necessary to classify and arrange these variables, and particularly to propose solutions in a systematic manner (see table 1). A logical sequence of thought usually applied in analysing systems is the following:®
a) To define and quantify the objective or objectives and give them a temporal dimension; to indicate the beneficiaries and the relation between principal and secondary objectives and the priority among multisectoral objectives.
b) To identify and analyse the geo-socioeconomic environments and territorial spaces within which it is desired to achieve the previously defined objectives.
c) To determine the problems and quantify the obstacles that must be surmounted in order to achieve the objectives within the geo-socioeconomic environment previously identified.
d) To generate solutions for overcoming the restrictions previously determined, to select and place them in order of priority, and to indicate the method of putting them into practice.
Moreover, when it is not possible to know or adequately to identify and define the objectives, the sphere of action, the restrictions or solutions, research must be carried out in order to obtain the necessary information. The sequence of work is carried out in practice in different ways, reflecting the relative conditions prevailing in each case (see table 2).
González Villarreal has given a clear synthesis of the methodology of the planning of water resource utilization (see table 3). His synthesis emphasizes the interrelation and the flow of measures necessary for formulating a plan of this kind in a particular situation.®
The process of decision-making mentioned in the foregoing sequences must necessarily include the time variable. In the plans this variable is designated in different ways, including "horizon", which is a period at the end of which the objective is envisaged. This horizon is usually 25 years. The intermediate periods and intervals up to the limit of the "horizon" are known as "thresholds".
26

Table 5 (concl.)
I ^ T I N AMERICA: TENTATIVE CLASSIFICATION OF THE VARIABLES INVOLVED IN THE FORMULATION OF PLANS FOR WATER RESOURCES
Spatial coverage Politico Hydrographic Sectoral Planning Agents respon- Agents in charge Variables in the Objectives
administrative limits scope horizons sible for Í of the formulation application of the plan limits planning of the plan of the plan
International By water catch- Multisectoral: Short-term: Central State entities Instruments of Economics ment and/or Socio-economic 1 to 4 years planning agency Public plan control:
Binational discharge area Environmental Sectoral plan- enterprises Production Basin or system (control of Medium-term: ning agency Private Tariffs Consumption
National of basins pollution, 5 to 9 years Institute consultant Taxes Expansion of Valleys flooding, etc.) specialized in companies Subsidies cultivated area
Regional Terraces Long-term: water resources Special Quotas Irrigation Hillsides Sectoral 10 to 25 years Public executive Norms/decrees Energy
Provincial or enterprises secretariats Aquaculture State Health Very long-term: (mainly energy. Individuals Livestock use
Agriculture over 25 years drinking water Groups of water-District Energy and sanitation users Municipal Transport
Industrial sectors) Municipalities
International agencies
Local Mining Others to Others
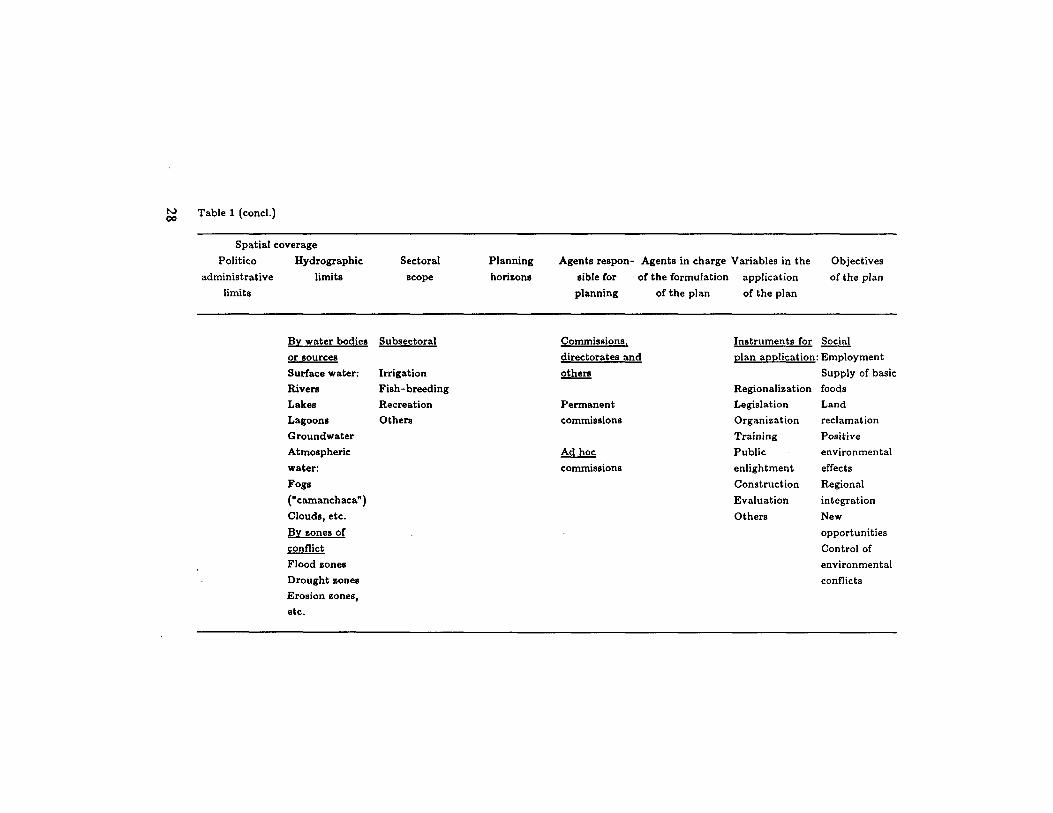
to 00 Table 1 (concl.)
Spatial coverage Politico Hydrographic Sectoral Planning Agents respon- Agents in charge Variables in the Objectives
administrative limits scope horizons sible for of the formulation application of the plan limits planning of the plan of the plan
By water bodies Subsectoral Commissions, Instruments for Social or sources directorates and plan application: Employment Surface water: Irrigation others Supply of basic Rivers Fish-breeding Regionalization foods Lakes Recreation Permanent Legislation Land Lagoons Others commissions Organization reclamation Groundwater Training Positive Atmospheric Ad hoc Public environmental water: commissions enlightment effects Fogs Construction Regional ("camanchaca") Evaluation integration Clouds, etc. Others New By zones of opportunities conflict Control of Flood zones environmental Drought zones conflicts Erosion zones, etc.

Table 4 (concl.)
SEQUENCE FOR IDENTIFYING THE OBJECTIVES OF A PLAN FOR WATER RESOURCE MANAGEMENT, THE MEDIUM IN WHICH TO ACHIEVE
THESE OBJECTIVES. THE PROBLEMS THAT MUST BE OVERCOME FOR THIS PURPOSE AND THE
ALTERNATIVE SOLUTIONS
A. OBJECTIVE
To have a constant supply of water adequate in quantity, quality, place and time to meet the needs of consumption, production and environment and to have protection against adverse effects associated with water resource management.
B. GEO-SOCIOECONOMIC MEDIUM
Hydrographic ba8in(8) or region(s) delimiting the sphere in which it is planned to harmonize water supply and demand to meet the objective(8) indicated above.
C. CONSTRAINTS
Physical and natural: To augment the water supply, increse efficiency in use or minize natural conflicts and in general satisfy water requirements and water conservation conditions. Socioeconomic: a) political and legal, to permit and execute plans in accordance with the interests of society; b) economic and financial, to allocate the economic and other resources needed to carry out the necessary technical measures; c) social and cultural, to implement with due knowledge and preparation of the measures required to achieve the planned objectives, and d) institutional and administrative, to organize and implement the measures in an effective manner.
D. SOLUTIONS
Technical or engineering solutions: To overcome physical or natural problems. Includes activities such as studies of resources, formulation of projects, constructions of hydraulic works, operation and maintenance of hydraulic systems, and management and conservation of basins, water and other natural resources. Political or itdminiatrative solutions: To permit the orderly execution of the technical or engineering solutions. Includes such measures as legislation, planning, financing, training, research. Institutionalization, control, fiscal supervision, rationalization, personnel administration, information, etc.
Source: Axel Dourojeanni, La planificación para el desarrollo, aprovechamiento y manejo de los recursos hidricos. Course on the environmental dimension in development planning, CIFCA/ILPES/ECLAC/UNEP, Santiago, Chile, 20 October to 28 November 1980, document CDA-24.
29

Table 3: THE METHOOeiOeV OF THE PLANNING PROCESS
30

2. Water regionalizatlon as a basis for haimom^tíon of water supply and demaad
A regionalization of water is the first step in the structuring of an adequate framework for using and managing water in a country (see figure 4). This framework serves a double purpose: it makes it possible to find units of study for the harmonization of water supply and demand and also to fix the limits for the operation and management of water systems.^ Within each zone, the initial step is the projection of water demand. Theoretically there should be a national economic development plan and, in addition, sectoral and regional plans as components of the former, which should make it possible to foresee the sectoral demand in each zone or basin. In the absence of such plans, considerable labour will be called for in preparing a description of the socioeconomic characteristics and trends in each zone. There are different methodologies for carrying out this task which have been fully analysed in the reference document,® and also in the methodological bases of the Plans of Venezuela, Mexico and Peru, among others.
In the analysis of the supply of surface and groundwater, it is considered that the most important physical features are the following: precipitation, generated and available run-off, soils, discharges into rivers, hydrology and volume and overloading of aquifers. The preparation of studies on water supply and demand and the balances confer numerous immediate benefits on the country carrying out this work. With this system zones are detected which have water incompatibilities of different kinds: in terms of quantity, quality, place and time and for several thresholds of planning, along with the reasons for the occurrence or possible occurrence of these incompatibilities. In principle, it helps to compile and rationalize quantitative information, usually dispersed, in a data bank, and to co-ordinate activities among agencies which are not accustomed to exchanging information despite their need for it. Equally, it facilitates the finding and priorizing on a global level of a series of actual and potential conflictive situations in the short, medium-or long-term (see table 4).
The problems in harmonizing water supply and demand may be divided into two groups: natural or physical problems and politico-administrative problems. In the same way, the solutions may be divided into those of a technical or engineering type, when these are aimed at solving problems of a physical nature, and solutions of a directive type, when they are designed to overcome problems of a politico-administrative nature.
31

u> N) Figure 4 MAP O F M E X I C O SHOWING T H E W A T E R - P L A N N E D R E G I O N S
S ta t e b o u n d a r y Regional b o u n d a r y
Source: Comisión del Plan Nacional Hidráulico, "Plan Nacional Hidráulico 1981", México, D.F., March 1981. Note: The boundaries and names shown on this map do not imply official endorsement or acceptance by the
United Nations.

Table 4 (concl.)
CONFLICnVE SITUATIONS IN A DIAGNOSIS OF WATER BESOURCE SUPPLY AND DEMAND
Situations Considerations and/or ranges established for classiñcation
1. Main zones of 1. Lowering of levels overexploitation of aquifers 2. Saline intrusion of water migration and resultant effects S. Land subsidence of fissures
2. Zones of prohibition of groundwater use
1. According to agencies responsible for its control
3. Annual losses by overflow' 1. Very high (over 1 000 Mexican pesos per km2) 2. High (from 50 to 999 Mexican pesos per km2) 3. Medium (from 200 to 499 Mexican pesos per
km2) 4. Low (under 200 Mexican pesos per km2)
4. Dams which need a review of their surplus water constructions
1. Indication of capacities
5. Incidence of drought in the last 100 years
1. High (over 12 droughts) 2. Medium (from 7 to 12 droughts) 3. Low (under 7 droughts)
6. Water pollution at basin level
1. Heavily polluted 2. Polluted 3. Good quality
7. Pollution of surface and groundwater at locality level
1. Deficit of dissolved oxygen 2. Nutrients 3. Fats and oils 4. Coliform elements 5. Toxic elements 6. Intrusion
33

Table 4 (concl.)
Situations Considerations and/or ranges established for classification
8. Sediment concentration in rivers and risks of water erosion
1. Over 0.4% of the run-off 2. From 0.1% to 0.4% of the run-off 3. Under 0.1% of the run-off 4. High risk of erosion
9. Identification of conflicts of water supply to localities
1. With actual and future conflict 2. With future conflict 3. With actual conflict but with alternative
non-conflictive sources of supply 4. Without studies of groundwater but with evidence
that it exists 6. Without conflicts up to the year 2000 6. With present conflicts respecting water quality
10. Water balances by basins, zones and/or regions
1. Rain 2. Natural availability (millions of m3) 3. Supply with infrastructure (millions of m3) 4. Demand 5. Extraction (millions of m3) 6. Balance I 7. Natural availability (millions of m3) 8. Balance II 9. Total consumption 10. Consumption and extraction within natural
availability
Source: Plan Nacional Hidráulico de México, México, D.F., 1981.
Finally, the water balance makes known the national, regional and local availability of water (see figure 5 and table 5); the zones of water shortage, the zones where there is no problem of supply, the zones where the supply is committed in other areas, and the zones with a supply which has quality problems for different thresholds and horizons of time. The balance represents a basic contribution to the development of the policies of utilization and management in the short, medium- and long-term.
34

Figure 5 M E X I C O : R E G I O N A L A V A I L A B I L I T Y O F W A T E R
Water shor tage
Available w i t h o u t p r o b l e m s
Available b u t c o m m i t t e d in o t h e r areas
I I Available b u t w i t h p r o b l e m s of qual i ty
Source: Comisión del Plan Nacional Hidráulico, "Plan Nacional Hidráulico 1981", Mexico, D.F., March 1981. Note: The boundaries and names shown on this map do not imply official endorsement or acceptance by the
United Nations.

Stratum Volume mm
run-off recharge Millions of cubic metres
ground ground
North 425 242 406 11 669 4 528 16 197 1980 11 169 3 383 14 552 14 232 10 959 3 383 14 342 1990 14 S96 4 656 19 252 19 355 14 108 4 656 18 764 2000 16 493 5 168 21 661 21 797 15 805 5 168 20 973
Pacific 568 294 546 49 356 4 548 53 904 1980 25 120 5 244 30 364 30 413 23 266 5 244 28 510 North and 1990 45 790 5 718 51 528 50 813 43 757 4 758 48 515 Centre 2000 70 360 6 117 76 477 75 481 68 332 5 073 73 405 Centre 946 265 531 55 475 7 750 63 225 1980 52 010 5 692 57 702 57 565 51 873 5 692 57 565
1990 71 209 6 545 77 754 77 210 70 928 6 282 77 210 2000 95 366 7 564 102 930 102 778 95 123 7 322 102 445
Gulf and 1 716 787 304 277 942 14 218 292 160 1980 72 673 1 308 73 981 53 557 52 249 1 3087 53 557 Southeast 1990 129 639 2 302 131 941 99 743 97 441 2 302 99 743
2000 304 063 3 677 307 740 281 134 277 590 3 877 281 467
Mexican 864 1 589 787 394 442 31 044 425 486 1980 160 972 15 627 176 599 155 767 138 347 15 627 153 974 Republic 1990 261 234 19 241 280 475 247 121 226 234 17 998 244 232
2000 486 282 22 526 508 808 481 190 456 850 21 440 478 290
Table 6
Year Of. Com. Infrastructure Demand Extraction Surface Under- Total Surface Under- Total
ground ground
Pacific North and Centre Centre
Gulf and Southeast
Mexican Republic
568 294 546 49 356 4 548 53 904
946 265 531 55 475 7 750 63 225
1 716 787 304 277 942 14 218 292 160
864 1 589 787 394 442 31 044 425 486
1980 1990 2000
1980 1990 2000
1980 1990 2000
1980 1990 2000
1980 1990 2000
11 169 14 S96 16 493 25 120 45 790 70 360 52 010 71 209 95 366 72 673
129 639 304 063
160 972 261 234 486 282
3 383 4 656 5 168 5 244 5 718 6 117 5 692 6 545 7 564 1 308 2 302 3 677
15 627 19 241 22 526
14 552 19 252 21 661 30 364 51 528 76 477 57 702 77 754
102 930 73 981
131 941 307 740
176 599 280 475 508 808
14 232 19 355 21 797 30 413 50 813 75 481 57 565 77 210
102 778 53 557 99 743
281 134
155 767 247 121 481 190
10 959 14 108 15 805 23 266 43 757 68 332 51 873 70 928 95 123 52 249 97 441
277 590
138 347 226 234 456 850
3 383 4 656 5 168 5 244 4 758 5 073 5 692 6 282 7 322
1 3087 2 302 3 877
15 627 17 998 21 440
14 342 18 764 20 973 28 510 48 515 73 405 57 565 77 210
102 445 53 557 99 743
281 467
153 974 244 232 478 290
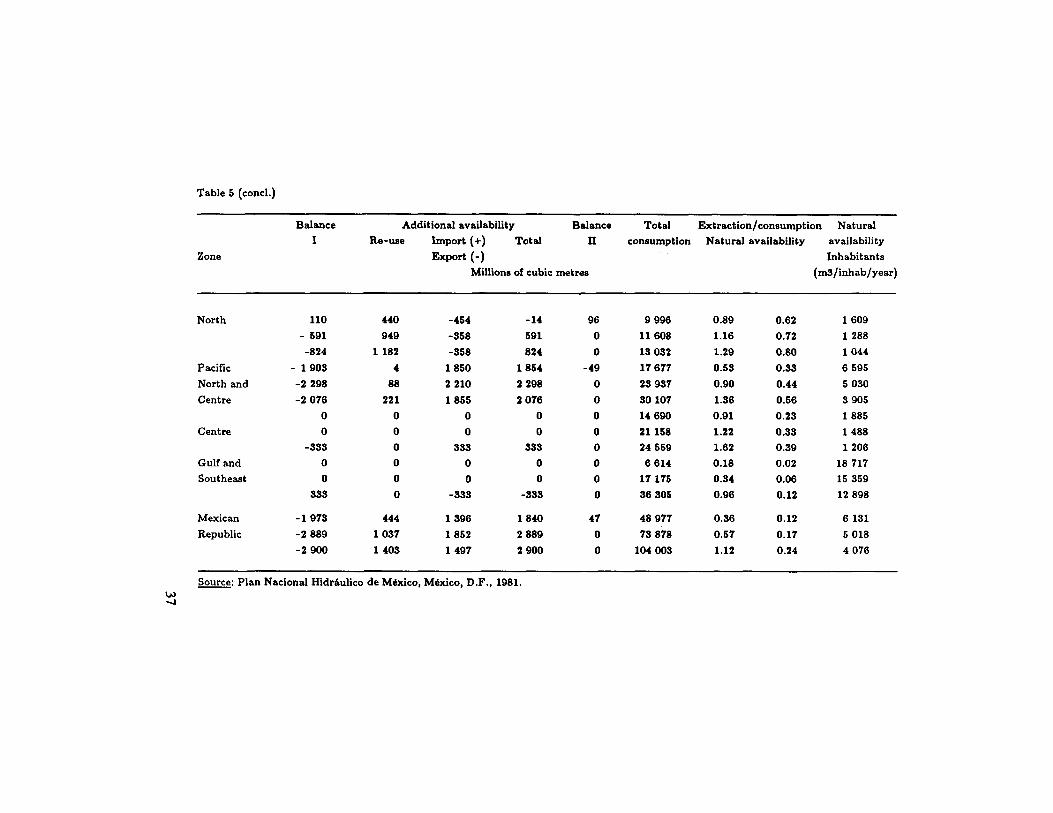
Table 5 (concl.)
Balance Additional availability Balance Total Extraction/consumption Natural I Re-use Import (-f) Total II consumption Natural availability availability
Zone Export ( - ) Inhabitants Millions of cubic metres (mS/inhab/year)
North 110 440 -454 -14 96 9 996 0.89 0.62 1 609 - 691 949 -358 591 0 11 608 1.16 0.72 1 288 -824 1 182 -358 824 0 13 032 1.29 0.80 1044
Pacific - 1 903 4 1 850 1854 -49 17 677 0.53 0.33 6 595 North and -2 298 88 2 210 2 298 0 23 937 0.90 0.44 5 030 Centre -2 076 221 1855 2 076 0 30 107 1.36 0.56 3 905
0 0 0 0 0 14 690 0.91 0.23 1 885 Centre 0 0 0 0 0 21 158 1.22 0.33 1 488
-333 0 333 333 0 24 559 1.62 0.39 1 206 Gulf and 0 0 0 0 0 6 614 0.18 0.02 18 717 Southeast 0 0 0 0 0 17 175 0.34 0.06 15 359
333 0 -333 -333 0 36 305 0.96 0.12 12 898
Mexican - 1 973 444 1 396 1 840 47 48 977 0.36 0.12 6 131 Republic -2 889 1 037 1 852 2 889 0 73 878 0.57 0.17 5 018
-2 900 1 403 1 497 2 900 0 104 003 1.12 0.24 4 076
Source: Plan Nacional Hidráulico de México, México, D.F., 1981. (jj -J

Another aspect worthy of emphasis in the attempt to detect problems of harmonization of water supply and demand is that these problems are both technical or physical and administrative or political in origin. The study of the problems of harmonizing water supply and demand should consider both groups of problems and not be limited to the technical or physical aspects if the aim is to provide better elements of judgement for the formulation of utilization strategies. This is particularly important as a basis for designing the solution strategies. Outstanding in this group of problems are those created by society itself and its organization, such as inefficiency in the use of available water, the disproportionate growth of demand in zones with a water shortage, the lack of ineffectiveness of current legislation, the lack of interinstitutional co-ordination, the scant or non-existent public participation, the unequal budgetary allocations, the lack of specialized personnel, etc.
From the technical or engineering standpoint, the solutions for harmonizing water supply and demand are of two types: those which seek to obtain and deliver new sources of water that meet the requirements of quantity, quality, place and time, and those which aim at the more efficient utilization of the water already obtained or the limitation of its use.
In the first case action is taken on the supply, converting the potential water supply into reality. Usually this is achieved through the construction of water works for the retention, storage, regulation, control, channelling, management, treatment, distribution, recycling and/or disposal of the water. This group also includes the techniques for managing the natural sources of water retention: catchment basins, groundwater, areas of mist, management of snow, desalinization and artificial rain.
In the second case, the main objective is to reduce demand by means of: i) greater efficiency in the use of available water, by improving the performance and maintenance of the systems already constructed and developing techniques for a lower consumption per unit of use, along with the prevention of contamination, and ii) a control of the growth of demand in zones of water shortage. In both cases the participation of the user is essential, so that options for the training of users should also be included.
In order to carry out any of the possible alternatives for increasing supply or reducing demand, technical strategies must be combined with those of management. This latter group includes aspects relating to administrative organization, financing, training, the organization of users and, in fact, everything that will facilitate
38

the execution of measures for the utilization, management, control, preservation and conservation of water.
Obviously the harmonization of water supply and demand must also take into account multisectoral uses of the resource, actual and potential, and not only the sectoral. Although this is obvious from a theoretical standpoint, it is usually ignored in practice, particularly owing to the sectoral origin of water projects. It is only taken into account when conflicts arise regarding its utilization and then "emergency" measures have to be taken.
To sum up, in putting forward solutions for harmonization, it is necessary:
a) To provide, in a proportionate and co-ordinated form, alternative solutions both for increasing water supply and for reducing demand.
b) To provide, in a proportionate and co-ordinated manner, solution strategies not only of a technical and engineering type but also those of management or direction.
c) To provide alternative solutions which will be co-ordinated with all the sectors using water, actual and potential, within the territorial area of the planning.
d) To generate options in accordance with the available resources so that they can be put into practice and be politically feasible, in order that they may be effectively taken into account as elements of decision for social and economic development and environmental management.
3. Tlie relation between the national planning of water resources, the planning of basins and the formulation of projects
The planning of water resources is carried out at successive levels of detail. The data that appear in figures 4, 5 and 6 constitute the basis for strategic decisions on the place within the national water system in which policy intervention should be contemplated. The next level assumes practical decisions as to the manner of intervention in the equation of supply and demand, which entails a more detailed approach within the context of zones or river basins, leading to the identification and formulation of alternative projects. This is usually known as the incorporation of the environmental dimension, which is in effect a process of planning and policies and the formulation of projects adjusted to a broad definition of the system of physical resources which are to be administered along with the potential interactions between this system and the socioeconomic instriutional system within a relatively long temporal honzon.
39

o Figure 6
SEQUENCE OF TECHNICAL ACTIVITIES NEEDED FOR THE DEVELOPMENT AND MANAGEMENT OF A BASIN OR AN AREA WITHIN A BASIN
Order of activity Generic name of activity
Measures included in each activity Resul ta
Preliminary activities
Assessment of the basin (f irst stage)
Inventories
Studies (seitii-detailed and/ or detailed
reconnaissance)
Assessment of the resources
Diagnosis fo r their ut i l izat ion
and conservation
Knowledge of present and
poten t ia l s i tuat ion
Formula t ion of projec ts (second
stage)
Determina t ion of objectives
and goals
Execu t ion of specific studies
Designs and plans fo r execut ion
Economic and financial
analysis and prel iminary
budget
Planning of the f u t u r e si tuat ion
In termedia te activities
Execut ion of projec ts ( third
stage)
Cons t ruc t ion of camps and
auxiliary works
Cons tmct ion of m a j o r and minor infra-
s tructure
E q u i p m e n t of p ro jec t
Incorpora t ion and start ing u p of
system c o n s t m c t e d
Execu t ion of the p ro jec t s in the time p roposed

Figure 6 (concl.)
Operation and maintenance of
s tmctures ( four th stage)
Oiganization of State and/ or enterprise
users
Operation of the structural and auxiliary
systems
Periodic main-tenance of the structures and equipment in
operation
Repair of auxiliary structures and
equipment
Permanent efficient use of the physical
investment
Permanent activities
Management and conservation of
natural resources ( f i f th stage)
Regulation of the basin
use according to its capacity
Management of water soil, crops,
pastures and woods, fauna,
mining, energy, and other resources
Protection of resources
against negative effects
Recovery and rehabilitation
of zones affected by bad use or
natural phenomena
Permanent quality, quanti ty and
frequency of supply of resources of basin or area administrated
Source: CIFCA/ILPES/ECLAC, La planificación para el desarrollo, aprovechamiento y manejo de los recursos hidricos, document No. CDA-24, presented to the Course on the Environmental Dimenáon in Development Planiung, held in Santiago, Chile, between 20 October and 28 November 1980.
aXhe overall effect of all the results is the uninterrupted supply of vifater and production (agricultural, enery-related, etc.) over time.

The most prominent features of the processes of water resource planning within the framework of the integral management of resources are: i) the possibilities of generating alternative uses and preventing undesirable effects; ii) its inevitably unpredictable or uncertain character, particularly in the long-term, and hence the need that it should be dynamic and interactive in order to be able to incorporate new data with the passage of time; iii) the need that it should be formulated by interdisciplinary teams in order to have the required depth and power of integration, and iv) the need that in the formulation and execution of the plans a given geographical area should be covered in a given lapse of time. All these characteristics are mutually complementary, so that the incorporation of the environmental dimension in the planning of water resources should be initiated from the moment when a development aim is put forward which requires the harmonization of water supply and demand.
As regards the first point, it must be stressed that the act of "incorporating the environmental dimension" is an exercise which makes it possible to generate a larger number of options for the utilization of the resources in taking possible chain effects into account, and also to avoid or prepare to control or attenuate undesirable consequential effects. This aspect is emphasized because it is usual to assume that the purpose of "incorporating the environmental dimension" is solely to "control the negative effects" and therefore it is usually associated exclusively with costs, without considering that it may potentially generate an equal or greater number of benefits.
In the second place, it should be borne in mind that planning by definition deals with activities for the future and hence is based on predictions with very differing degrees of certainty. Planning for water resource management is no exception to this unavoidable risk, particularly if the aim is not only to programme the execution of initial measures —such as to decide whether or not to build a dam— but also to undertake this exercise with a prior knowledge of the possible chains or networks of effects which will materialize in the future as a result of this decision. The exercise is, in consequence, largely an "art of planning the unknown" within very variable ranges of uncertainty, ranges which will only be reduced in so far as an increasingly precise knowledge is acquired of the possible chains or networks of effects of each intermediate action in the short, medium-and long-term.
The material impossibility of predicting all the probable consequences of a measure which changes the environment makes it necessary, moreover, to maintain a permanent watch or supervision over the places affected in order to take new measures to deal with
42
unexpected changes. This calls for an administrative system with sufficient capacity and flexibility to react to unexpected situations discovered during the supervision if it is desired that this exercise should be useful.
The best way to formulate plans for the management of natural resources —^minimizing ranges of uncertainty— is to work with professional groups of different disciplines and obtain the direct participation of the potential beneficiaries of the plans.®
In the final analysis, water resource planning must concern itself with the implementation of policies which involve "software", e.g. pricing and tax, and "hardware", e.g. water regulation and distribution structures. In the development of water resource utilization there are three clear and differentiated stages (see figure 6). In the first stage, studies are made and projects formulated; in the second or intermediate stage, the projects is constructed or executed, and in the third stage, permanent or periodic, the water works constructed are put into operation and maintained and the water resources are managed and conserved.
Respecting basin planning, it should be noted that the biophysical features of a river basin form relatively coherent hydroecological system which make them the basic unit for water resource management. For planning to be effective the management plan must be integrated, that is, it must include the co-ordinated and harmonious treatment of all the forms of water use, management and control, such as irrigation, drainage, the production of hydro-electricity, navigation, flood control, erosion control, the management of the flora and fauna of the basin, the domestic and industrial use of water, recreation and the conservation of the environment. It is also essential that it should form part of regional or national development plans.Nevertheless, if the basins are very large, as in the case of the River Amazon or the River Plate, which encompass different political, socioeconomic and cultural frontiers, these areas are inappropriate as units of planning.^^
The units of planning are the same as those described in point B.
B. A COMPARATIVE ANALYSIS OF NATIONAL WATER RESOURCE MANAGEMENT PLANS
This chapter is based on a series of technical studies conducted in Argentina, Bolivia, Cuba, Colombia, Ecuador, El Salvador, Honduras, Trinidad and Tobago, Haiti, the Dominican Republic, Peru, Paraguay, Mexico and Venezuela, as well as information published on the other
43

countries (see table 6). The planning of multisectoral water use at the national level is carried out with varying degrees of advancement in almost all the countries, although an appreciable number have placed greater emphasis on plans of a sectoral national type, mainly concerned with energy or irrigation or integral plans in some selected river basins.
The countries studied which have the more advanced multisectoral national plans are Mexico,^^ Venezuela,^' Peru, ^ and El Salvador, ® of which Mexico, El Salvador and Venezuela have published plans. Next come Ecuador, ® Colombia,^'^ Honduras, ® Jamaica, ® and the Dominican Republic,^" the first has already prepared the basic documents for the realization of long-term plans and Honduras has a plan for the medium-term.
The purpose of this preliminary comparative assessment of these plans is to identify possible spheres of mutual co-operation among national bodies with a view to improving the planning process and highlighting the chain of decisions involved in the development and management of water resources. Some of the factors regarded as of special importance in the attempt to establish some comparisons between the different national plans for the management of available water resources are the following:
a) The aims and goals set forth in the plans for water resource utilization and the way in which they are related to objectives of national or regional development.
b) The relative degree of experience and progress in the formulation and application of plans at national level.
c) The organization and method used for the formulation of national plans.
d) The structure and content of the national plans.
1. Aims and goals of the plans
The situation regarding the formulation of water management plans by countries of the region is given in table 6. In an initial examination of this table it will be observed that the titles of the plans in Spanish differ appreciably in several terms, which does not necessarily indicate changes in the objectives or in the scope of the plans but certainly implies problems of form. Respecting the aims of the plans indicated in the titles, it will be seen that some employ the terms "desarrollo", "ordenamiento" and "aprovechamiento", while others use none of these terms. Moreover, the terms "aguas", "hidráulico", "recursos hidráulicos" and "recursos hídricos" are used as equivalent terms in practice. It is evidently a question of
44
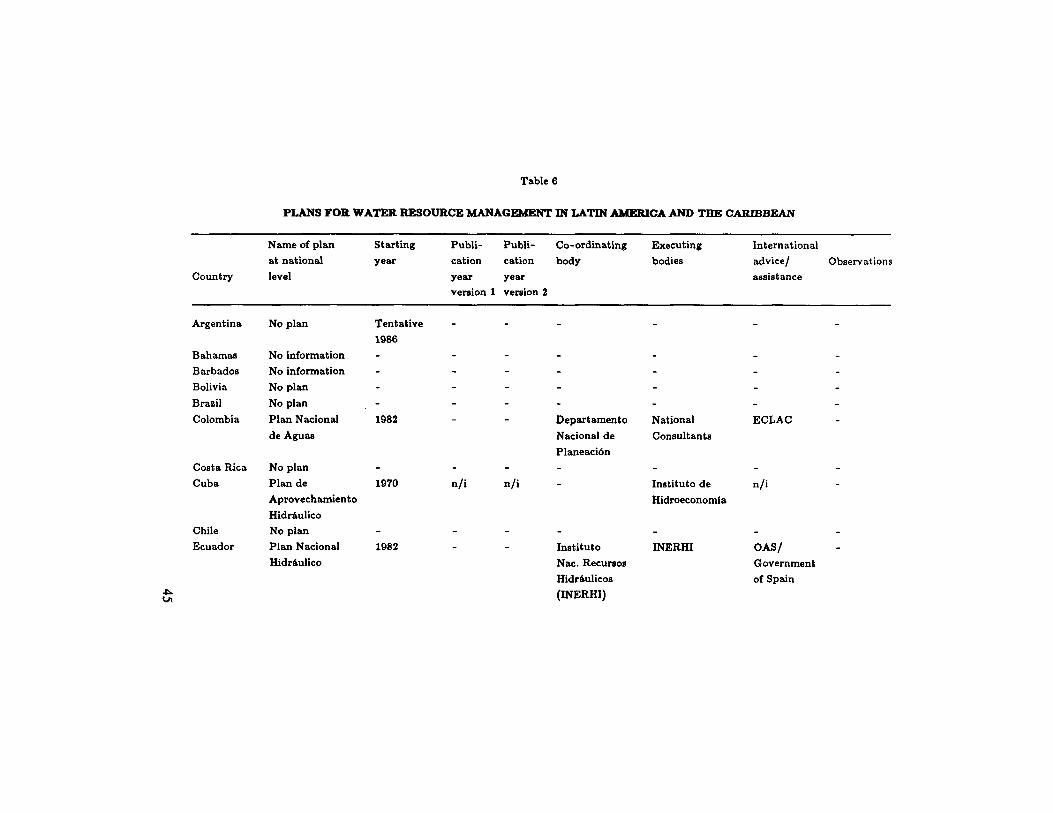
Table 6
PLANS FOR WATER RESOURCE MANAGEMENT IN LATIN AMERICA AND THE CARIBBEAN
Name of plan Starting Publi- Publi- Co-ordinating Executing International at national year cation cation body bodies advice/ Observations
Country level year version 1
year version 2
assistance
Argentina No plan Tentative 1986
- - - - -
Bahamas No information - - - - - -
Barbados No information - - - - - -
Bolivia No plan - - - - - -
Brazil No plan - - - - - -
Colombia Plan Nacional de Aguas
1982 Departamento Nacional de Planeación
National Consultants
ECLAC
Costa Rica No plan - - - - - -
Cuba Plan de Aprovechamiento Hidráulico
1970 n / i n / i Instituto de Hidroeconomla
n / i
Chile No plan - - - - - -
Ecuador Plan Nacional 1982 - - Instituto INERHI CAS/ Hidráulico Nac. Recursos
Hidráulicos (INERHI)
Government of Spain

•u Table 6 (cont. 1)
Name of plan Starting Publi- Publi- Co-ordinating Executing International at national year cation cation body bodies advice/ Observations
Country level year year assistance version 1 version 2
El Salvador Plan Maestro de 1979 1983 _ Ministry of Ministry of UNDP/TAHAL -Desarrollo y Agriculture Agriculture Aprovechamiento de los Recursos Hídricos
Guatemala No plan - - - - - -
Guyana No information - - - - - -
Haiti No plan - - - - - -
Honduras Plan Nacional 1979 1979 - Consejo CONSUPLANE Only short-de Recursos Superior de term plan Hídricos Planificación (1979-1983)
Económica (CONSUPLANE)
Jamaica National Water 1984 - - Water Resources Water Resources UNDP/GovernnRntject Resources Develop- Division Division of Israel document ment Master Plan
Mexico Plan Nacional 1972 1975 1981 Comisión del Comisión del UNDP in first Hidráulico Plan Nacional Plan Nacional phase
Hidráulico Hidráulico

Table 6 (concl.)
Name of plan Starting Publi- Publi- Co-ordinating Executing International at national year cation cation body bodies advice/ Observations
Country level year year assistance version 1 version 2
Nicaragua No information _ _ _ _ _ _ Panama No plan - - - - - -
Paraguay No plan - - - - - -
Peru Plan Nacional de 1977 - - Comisión Multi- Various State Government of Ordenanúento de sectorial del entities Venezuela and Recursos Plan Nacional de OAS Hfdricos Ordenamiento de
los Recursos Hidráulicos
Dominican Republic Suriname Trinidad and Tobago Uruguay Venezuela
No plan
No plan No plan
No plan Plan Nacional de Aprovechamiento de Recursos Hfdricos
1968 1972 Comisión del Plan Working group Nacional de Apro- of State entities vechamiento de los Recursos Hidráulicos
n / i = No information.

language rather than meaning.^^ It would seem that the most appropriate and least restricted of the phraseologies commonly employed, esMcially if one takes into account the desired scope of the plans, is the title "Plan Nacional de Ordenamiento de Recursos Hídricos" or "de Aguas".
In the objectives of the plans analysed two types of orientation can be discerned which are not always identifiable or separable.
a) The plans whose objectives are clearly linked with socio-economic development strategies at national, regional or basin level are of an integral and long-term character.
b) The plans whose objectives are mainly concerned with water resources of a sectoral or subsectoral nature are mainly directed to the priority ranking of projects for water resource utilization but they do not clearly establish their link with global development plans and are for the medium-term.
The definition of the plans and their objectives reflects to some extent the scope attributed to them in each country. The apparently more integral definitions and objectives include the following:
"To establish a rational, equitable and effective utilization of water, in terms of the requirements of the different uses: social (urban, tourist, recreational, etc.), economic (agricultural, industrial, mining, etc.), and natural (flora and fauna) in the country, in accordance with priorities, overcoming the factors which restrict its availability (scarcity, excess, poor quality, etc.) and ensuring ecological equilibrium; all of which calls for a profound knowledge of its spatial and temporal availability".^^
"The national plan for the utilization of water resources is a frame of reference made up of a set of strategies and directives which, within the general policy of development and an adequate legal and institutional management, ensures the rational administration of the resource and therefore establishes a logical and reasonable distribution between the supplies of water and the probable demands ... the plan is conceived as a process which seeks to define and specify the decisions concerning the resource in order to maintain a quantitative and qualitative balance between demand and availability, so as to prevent the conversion of water into a limiting factor in the economic and social development of the country ...". The objective of the said plan is summarized as "... the maintenance of a dynamic balance between supplies and the different demands which may need to be met in the development of the country.^®
48

Other definitions and objectives point in general to the same aspects, such as:
"The general objective of the national water plan is to enable the country to complete or develop the instruments for a coherent, technical and forward-looking planning of the water resource in order to a) meet future demands in respect of supply and quality of water for human consumption, b) ensure the flows and qualities needed for the generation of hydro-electricity, navigation, aquaculture, irrigation, recreation and the sustained improvement of ecosystemic productivity, c) ensure defence against the destructive action of water and protect water and soil from human action when this is detrimental to these resources".^^
The following are also indicated as immediate objectives of a plan: "to increase the knowledge of the country's water resources and their potential, to promote the rational utilization of these resources in order to ensure the water balance, to strengthen institutional aspects and co-ordination in respect of water administration and to train personnel". ®
Some plans indicate as objectives a set of measures designed to achieve water management integrated with land and forestry resources, to promote a better utilization and preservation of water in each of the user sectors, improve water management, improve the participation of the different sectors of the population in the efficient use of the resource, and intensify research and training in order to deal with aspects of the operation and maintenance of hydraulic works and the handling and conservation of the resources through an adequate organization and training of the users and those who are responsible for assisting them. ®
In sum, the intentions set forth in the different plans analysed can be listed as follows:
a) To maintain a dynamic equilibrium between supplies and the different demands for water implicit in the development of the country (water policy).
b) To conserve the ecological balance; to preserve, protect, conserve, and manage the resources efficiently; to make rational use of water, etc. (environmental aspects).
c) To ensure defence against the destructive action of water, to be protected against damaging effects, to control the discharge of water (an aspect relating to the control of natural problems or catastrophes).
d) To improve the management of water and basins; to achieve water management integrated with the resource of land and forests; to organize the users, train them, improve interinstitutional relations in respect of water administration with clear reference to the
49

operation and maintenance of hydraulic works and the management and conservation of water and related resources (efficiency in the use of water and water systems).
e) To increase knowledge of the availability of water resources in the country and of their potential, to undertake research and other aspects associated with the systematic assessment of the water supply.
Ó To determine priorities of investment in projects and activities to harmonize water supply and demand. In general, to give priority mainly to investment projects aimed at increasing the water supply.
Generally speaking, all the plans mention directly or indirectly the first point indicated above. The other aspects are not common to all the plans. For example, only three are categoric in emphasizing the need to improve and stimulate the operational phase of the water systems in order to achieve good water management with user participation.
2. The relative degree of experience in the formulation of plans
In all the countries of Latin America and the Caribbean there is some degree of experience in planning for the management of water or water resources, especially at the sectoral levels of health, agriculture and hydroenergy, on the basis of river basins. This has apparently enabled many governments of the region to execute or initiate the formulation of plans for the management of water resources both multisectoral in character and of national coverage.
Mexico is the country that has gone furthest in this activity, which must be attributed to the special needs of a country with extensive arid zones.^^ Cuba also has a plan which was initiated in 1970.28 jj^gjj (j gjg Venezuela, Peru and El Salvador to be considered. This last country has published the final reports of its planning initiated in 1979. With regard to other countries, the majority have in fact embarked upon the formulation of their plans in a more recent period which includes the last five years; these include Colombia, Ecuador and Honduras, and there are several more which have at least preliminary studies at their command, such as Jamaica^® and the Dominican Republic.
At present Argentina and Brazil have no multisectoral plans at the national level. Both countries, however, have wide experience on the subject, especially as regards large river basins and at sectoral levels, particularly in respect of drinking water, energy and (more
50

recently) irrigation problems. Chile has not programmed the formulation of a multisectoral national plan but is known to possess considerable information and experience in sectoral and basin planning. Similarly, but on different grounds, Uruguay has indicated that its long-term water requirements had already been covered, especially in the energy field, and that its present supply of water made it unnecessary to formulate a plan of this kind.
In Bolivia and Paraguay the user sectors are interested in having a national water plan, but various factors have so far prevented a start being made on its formulation and execution. In Panama, Costa Rica, Guatemala and Nicaragua there are proposals for formulating a long-term plan but for diverse reasons they have not yet materialized.
3. The organi^tioffl aBd methods used for the formulatioo of plans
The plans have usually been initiated in some institution associated with the water sector of the central planning sector. In Peru, for example, it began in the General Water Department (Dirección General de Aguas) of the agricultural sector and was then transferred to the National Planning Institute. In Mexico it was concentrated in the Secretariat for Water Resources. In Ecuador it is prepared through the Ecuadorian Institute for Water Resources (Instituto Ecuatoriano de Recursos Hidráulicos - INERHI). In El Salvador it was initiated in the agricultural and livestock sector and in 1981 a specialized office for water resources was set up in the Ministry of Planning.
Once the initiative has been taken multisectoral commissions are usually set up with one or another of the agency heads as chairman. These commissions are constituted at two levels: at a decision-making level, integrated by representatives of various sectors, and at a technical level, formed in many cases by personnel who have been specially hired for certain tasks. Examples of this are the commissions of Venezuela, Peru and Mexico. The direction of these commissions is distributed in the region among:
a) National planning institutes or their equivalents (Peru, Colombia, Honduras and El Salvador).
b) Secretariats, ministries or institutes for natural resources or the environment (Venezuela).
c) Secretariats or ministries of agriculture or energy or other sectors closely concerned with the field of water (in several countries the agricultural sector is responsible for natural resources).

d) Secretariats or national institutes for water resources or their equivalents (as in the case of Cuba, Ecuador and Mexico, although in this last case the Secretariat of Water Resources was subsequently associated with the Ministry of Agriculture).
The method of carrying out the plan differs from country to country in the region. In some cases the work is entirely carried out by State or semi-State agencies through a distribution of tasks. This is the case, for example, in Ecuador, Peru and Mexico, among others. In other cases the work is conducted partly by the State and partly by one or more consultant firms, as in El Salvador. Lastly, in Colombia the work was assigned almost exclusively to a consultant firm, with the support of the national institutions. In other cases working groups are organized according to tasks as in the case of the Dominican Republic.
Plans have usually been carried out in successive stages or phases, as in Ecuador, El Salvador and Colombia.
In practice the formulation of all the plans analysed has received some form of external assistance. Peru received assistance from the OAS, the Government of Venezuela, ECLAC and ILPES (for its prospective model). Ecuador received assistance from the Government of Spain, UNDP and ECLAC, Colombia from ECLAC, while the Dominican Republic was supported by the IICA through the mediation of the Consultant Warren Hall of Colorado State University. El Salvador received assistance from the UNDP and the consultant firm of TAHAL, while Mexico was aided by the UNDP and the World Bank and Jamaica by the UNDP.
4. The structure and content of the plans
The comparative analysis of the management plans available reveals a general structure incorporating the elements considered in section A. To begin with there is the development of a logical sequence in the definition of objectives, the geographical area involved, and the restrictions and options in respect of action. For example, the "Master Plan for the Development and Utilization of Water Resources in El Salvador" mentions as inevitable tasks in the development of the plan the study of the available resources, the analysis of foreseeable needs, the study of solutions to meet these needs on the basis of the aforesaid resources and, in relation to all the foregoing, the adaptation of the legal and institutional infrastructure to permit the implantation and operation of these solutions in the long term. The "National Plan for Water Resource Management" of Peru®° is more explicit in setting out the following tasks for the execution of
52

the project: a) the preparation of a prospective model which takes the form of a classification of the objectives of the plan through the projection of a future scenario desirable within the economic and social structure as a whole and determined by the policy lines put forward for the country in accordance with the prospects of achieving them; b) the regionalization of water, which comes to be the clarification and delimitation of geo-socioeconomic spheres, generally a basin or a group of river basins; c) the determination of demand by water-related regions and water-using sectors; d) the determination of the potential (supply) of water as a resource; e) the balance between demand and availability; f) specific studies mainly concerned with environment and protection, and g) the formulation of strategies and definition of a national water policy establishing principles and norms and proposing programmes for the utilization, conservation, protection and improvement of water resources.
Absolutely all the countries that have formulated national plans for water resource management, both multisectoral and sectoral, have subdivided the country into regions which have usually been described as hydraulic or hydrographic. In every case, moreover, river basins have been regarded as a starting point for this regionalization and then an attempt has been made to harmonize their natural or physical boundaries with those of a politico-administrative type.
The Peruvian plan has taken as its spatial sphere for water planning the river basins, designated "hydrographic analysis units". The interconnected water systems of one or more basins constitute the "operational areas" and one or more "operational areas" constitute a "hydraulic" (i.e., water-related) region.
Following a similar criterion and also taking the hydrological basin as a basic planning unit, Mexico's water plan divided the country into 14 regions (see figure 4), each of comprises the basin of a large river or several homogenous basins of secondary importance. The regions were divided in their turn into 104 subregions with a view to seeking similar areas from a socio-economic standpoint, which might be regarded as minimum modules of analysis. In the division into subregions political and municipal boundaries were taken into account. The regions were also grouped into four zones: Pacific North and Centre, North, Centre, and Gulf and Southeast. To carry out the aforesaid regionalization —as explained in the Venezuelan plan, which was one of the first to be implemented— several criteria were used, the main one being the hydrographic basin and the operation of water systems, but also including environmental, demographic, economic, social and political criteria.
The progress made in the formulation of plans by a number of countries has already enabled them to place more emphasis on the
53

development of policies and strategies. This can be seen in the Mexican report which, in comparison with other plans whose execution is not so far advanced, recommends concretes measures both in the field of general water management and in respect of specific projects, as part of the strategies derived from the diagnosis. By way of example, figures 7 and 8 give the conceptual schemes developed respectively by Peru and Ecuador. These, as can be seen, reflect a similar structure with different degrees of detail.
The theory underlines the importance of establishing ample time horizons and achieving an institutional co-ordination in the execution of plans, as well as achieving a relationship between plans, resource allocation and water management. In practice it has been found that the best strategy is for the national water management plans to include short-term goals among their objectives and not to limit themselves to medium- and long-term planning. This encourages the governments, which normally have a term of five years, to take more interest in supporting their execution. Generally speaking few plans regard it as beneficial to assess and quantify institutional problems in due depth; their authors frequently confine themselves to the study of physical aspects, which subsequently reduces the possibility of carrying out the plans.
With regard to the linkages of the plans with financial and technical resource allocation and possibly with the management of water and related resources, the plans are generally centered on capital investment policies, at the expense of operational and maintenance policies, etc., which may change the patterns or improve the effectiveness of water use.
To illustrate this point, in a study made in Peru,®^ already outlined in section A, it was pointed out, for example, that in 1979 that country allocated 82% of its total investments in the agriculture and food sector exclusively to the development, use and conservation of water ad soil. Nevertheless, out of this proportion, which indicates the very high priority given by the Peruvian government to this subsector, the State assigned only 0.8% to the assistance of users in the operation and maintenance of the hydraulic systems already constructed and only half this to the management and conservation of water and soil resources (see figure 9). The exception under the latter head is the attention at present devoted to the drainage and reclamation of land on the coast, 30% of which has been affected by progressive salinization as a result of the prevailing natural conditions and irrigation.^^
The distortion in investments is repeated in different degrees in other Latin American countries and in other water-using sectors, especially in the case of drinking water and sanitation, all of which
54

Figure 7 G E N E R A L DESIGN OF THE M E T H O D O L O G Y O F THE N A T I O N A L W A T E R M A N A G E M E N T PLAN O F P E R U ( 1 9 7 7 )
N A T I O N A L W A T E R P O L I C Y ¡NATIONAL S I R A T E Q E ^
R E G I O N S
H Y D R O G R A P H I C U N I T S O F ANALYSIS
P R O S P E C T I V E M O D E L
W A T E R — K R E Q U I R E M E N T S , /
I z . DROGRAPHIC
R E G I O N S O R O P E R A T I O N A L
A R E A S
R E G I O N A L S T R A T E G I E S V
W A T E R SUPPLIES
n
o z
Source: Comisión Mullisectorial del Plan Nadonal de Oidenamiento de los Recursos Hidráulicos, "Plan Nacional de Ordenamiento de Recursos Hidráulicos, Bases Técnicas y Económicas para su Formulación", Lima, Perú, 1977.
vyi

0\ Figure 8
CONCEPTUAL DESIGN OF THE WATER PLAN OF ECUADOR
5Ü3Ó DIAGNOSIS OF DEVELOPMENT
SOCIO-ECONOMIC FRAME PLANNING OF DEVELOPMENT
NATIONAL REGIONAL SECTORAL
5100 DEMOGRAPHY
GOALS OF SUPPLY AND SEWERAGE
5200 AGRICULTURE
GOALS OF SUPPLY AND PRODUCnON
5300 ENERGV
GOALS AND HYDROELEC
TRICITY PARTICIP
ATION
5400 FNDUSTRV
GOALS OF SUPPLY
EFFECTS ON QUALITY
7500 POSSIBLE ADJUSTOENT
OF SOME COALS OF THE NATIONAL OR
REGIONAL DEVELOPMENT PLANS
5500 5600
TRANSPORT ^/ÍCULTURE INSTITU AND OTHERS TIONAL
AND LEGAL STRUCTURE
GOALS
looo ORGANIZATIONAL SUPPORT INSTITUTIONAL STRUCTURE
PLURMNSTITUTIONAL COORDINATION
2000
TECHNICAL SUPPORT, INFORMATION CARTOGRAPHY
5700 {SHORT, MEDIUM AND LONG L
TERM DEMANDS) '
6000 FORMULATION OF WATER PLAN
-^?i00 16200 COMPAWSONOF ¡ ASSESSMENT OF WATER
SUPPLY AND DEMANTI SCHEMES
!
ASIN MANAGEMENT
"Ssoü CONSERVATION
Source: Instituto E
7000 BASES OF WATER PLAN
7100 PROGRAMMING IN THE
SHORT. MEDILM AND LCWG TERM 7200
TECHNICAL. 7300
FINANCIAL, 7400
INSUrUnONAL AND ADMINLSMATLVE
4100 WATER
INFRASTRUCTURE INCLUDES
PROJECTS UNDER STUDY AND
CONSTRUCTION
DIRECT RELATIONSHIP
INDIRECT RELATIONSHIP
Quito, Ecuador, 1981. ,0 «le Recursos HidiáuUcos ONERHI), "Marco general p ú a la clabotadón del plan nacional hidráuUco",

Figure 9 PERCENTAGE DISTRIBUTION OF INVESTMENTS IN
WATER RESOURCES
90.4 %
0.4 %
- J
8.4 % 0.8 % Notit tnvoHtmant budget of the MínÍBlpy of Agnculturo ond Food of Peru, 1070.
H Construction
IÜ Management and conservation
• Operation and maintenance
Administration, studies and others

results in the gradual deterioration not only of the works themselves but, what is still more serious, of the renewable natural resources.
The subject-matter included in each of the plans reviewed follows the same pattern as the conceptual schemes indicated above. Obviously some countries lay more emphasis on certain aspects relatively more important in their countries. Nonetheless, some schemes and contents do not clearly differentiate the phase of diagnosis and procurement of the water balances from the phase of formulation of strategies or water policies resulting from these balances. In general they concentrate more on the water balances, which reduces the value of the plan. Other countries, in analysing water strategies or policies, merely stress the need to programme investment activities in hydraulic works, or sometimes they limit themselves to giving priority to hydraulic projects. This likewise diminishes the value of the effort made, since no consideration is given to other policy options or to an analysis of the possibilities of creating short-term policies aimed at the better use of existing water systems. It is evident that the plans are strongly inclined to formulate policies which facilitate an increase in the water supply, to the detriment of policies for controlling the demand.®' These imbalances tend to correct themselves when the demand for water cannot be satisfied by new supplies of the resource, whether through shortage of water or of money to build new works. In these situations the imbalances have to be reduced through the formulation of policies limiting the use of water or increasing the efficiency of the existing hydraulic systems. These policies are usually adopted in face of situations which are naturally difficult to correct when no steps to prevent them have been taken in advance.
C. RELATIONSHIP BETWEEN NATIONAL WATER RESOURCE MANAGEMENT PLANS
AND OTHER PLANS
1. National economic development plans and water resource management plans
Theoretical plans for water resource management (multisectoral, sectoral or subsectoral) should be formulated in close association with plans for socio-economic development. This co-ordination should also be made between national and regional plans. This harmony is very difficult to achieve in practice, so that it has
58

seemed desirable to make a brief analysis of the subject. The aim is to try to discover, in a very tentative way, the degrees of relationship or integration that exist between water resource management plans and other plans. This has been taken as the starting point for the analysis of the water resource management plans available at national, regional and river-basin level, whether their intention is to plan or programme the execution of sectoral activities or multisectoral, as in the case of Ecuador (figure 10).
Figure 10
G E N E R A L DESIGN O F T H E PLAN F O R THE R A T I O N A L I Z A T I O N O F W A T E R R E S O U R C E S O F E C U A D O R
G E N E R A L D E S I G N O F P L A N
Source: Instituto Ecuatoriano de Recursos Hidráulicos (INERHI), "Plan de racionalización de los recursos hidráulicos" Términos de referencia, Quito, Ecuador, 1983.
The first step of the analysis was to try to identify the more usual difficulties found in co-ordinating socioeconomic development plans with water resource management plans.
Basically, the formulators of the national water resource management plans have had to face the following problems:
i) Lack of socioeconomic development plans in the country, region, microregion, locality and/or basin within which to establish the need to develop a water resource management plan.
59

ii) Socioeconomic development plans too incomplete for the establishment of water requirements and/or priorities for action in this field.
iii) Socioeconomic development plans with planning horizons shorter than those needed to plan the demand for water in the long-term, which is usually over 20 years.
iv) Spheres of socioeconomic development planning (as, for example, districts and communes) which do not coincide with the spheres required for the planning of water resource management (such as river basins).
Similarly, the most usual difficulties of harmonization in formulating a socioeconomic development plan at national or regional level incorporating water as a variable are:
i) Lack of diagnoses to determine the potential and real supply of water for different uses in the spheres of planning for socioeconomic development.
ii) Lack of alternative techniques (projects) for harmonizing water supply and demand at the point in time when the plans for socioeconomic development are being formulated.
iii) Existence of water resource management plans that are incomplete, through being excessively sectoral and limited in their strategies, and therefore unsuitable for use in plans for socioeconomic development.
iv) Lack of information on aspects relating to the administration of water resources, such as organization and the role of the State and of individuals in the administration of water, sources and forms of financing, potential of suitably trained manpower and the like.
The cause of these incompatibilities is the result of the different aims, clients, actors, conceptions and formulators of plans both in the field of water and in that of social and economic development.
The formulators of plans for water resource management at national, regional or water-basin level who have considered development strategies mainly to project their own demands, have resorted to several alternative solutions: recommending the execution of development plans which will serve the turn of information; designing, in co-ordination with the planning sectors, prospective models for water demand for 5, 10 or 20 years, and projecting, without any particular co-ordination, their own sectoral or subsectoral water needs. Most of the water projects in Latin America which aimed at increasing or controlling the supply of the resource unfortunately overlook development plans —even if they are available—and project their activities independently and in response to diverse interests, such as:
60

- Political pressures, mainly regional, to build works for hydroenergy generation, irrigation, flood control and the like.
- Investment interests on the part of State enterprises or departments, mixed or private, which in one way or another "sell" their line of business (sale of hydraulic equipment, pumping equipment, advisory services, etc.).
- Response to international or national "credit lines" which encourage investment with a view to the direct or indirect expansion of water use for certain sectoral purposes or interests, such as credits for irrigation in order to produce a particular crop.
In the first case described, that is, when the water project is in response to regional demands and is on a large-scale, the development planning has been conducted from below upwards, resulting from these demands. A typical evolution is to initiate a subsectoral project in the field of water such as, for example, an irrigation project through pressures from a region, which is then converted into a project of multisectoral water use, which may comprise irrigation, hydroenergy, fish-breeding, flood control and the like, which finally comes to represent a "Regional development project" or one for the "integral development of basins".^^
In other cases, the water plans are formulated in "packets" or "investment lines" at national or regional level, and are aimed at the execution of only one type of activity in the water field, usually small in size but repeated on a large scale, such as small projects for irrigation, drainage, piped water supply, small hydroelectric power stations, etc. These plans, programmes or lines can also have a marked impact on the orientation of the development of certain regions or basins, in which they are applied without previous notice. What is more, it is very rare for these investment "packets" in the subsectoral water field to have any co-ordination among themselves, with the result that three or four investment "lines" can sometimes programme the use of the same water for different purposes.®® These examples, which are very numerous, give rise to several factual conclusions as regards the region:
i) That it is necessary to strengthen all the intersectoral co-ordination systems in order to anticipate the multiple use of water. This measure of co-ordination should be reflected in programmes and plans of work in every basin or water-related region and should be used effectively as an administrative instrument at national, regional or local level.
ii) That these measures of co-ordination should be taken even if only to avoid serious conflicts in the use of water in the short, medium- or long-term and even when there is no immediate purpose
61

of trying to "optimize" investments or the operation of already existing water systems or basin management.
iii) That water utilization for multisectoral purposes has taken place in the region almost always by successive stages and not as a result of previous planning, with the obvious ensuing problems and costs.
iv) That the national plans and programmes put into operation are mainly sectoral or subsectoral and almost always relate to the construction of hydraulic works. The sectors may incorporate multisectoral elements when their design has been completed. Hence the sectoral investment programmes, chiefly for hydroenergy, drinking water and irrigation, have been in many countries the driving and controlling element on the basis of which other activities in the field of water have gradually been developed. This accounts for the enormous influence of sectoral water plans on the national plans for water resource management.
v) It is evident, moreover, that in several countries plans for water resource management which incorporate strategies for reducing, controlling and/or administering the demand for water are very few or non-existent. There is an excessive tendency to build new works rather than to make existing ones function properly or to manage and conserve river basins or catchment areas, or to encourage efficiency among water users.
vi) Finally there is a need to improve the relationship and co-ordination between socioeconomic development plans —especially at regional and basin level— and plans for the management of water resources.
2. Sectoral and subsectoral plans for water use
In order to illustrate these points a review has been made of subsectoral plans in hydroenergy, agriculture and health (see table 7).
a) Plcms for hydroelectric utilization
The South American countries which have completed inventories of hydroenergy resources as an initial phase in the formulation of plans for the use of these resources include Argentina, Brazil, Colombia, Chile, Ecuador, Peru, Uruguay and Venezuela. The Central American countries have similar studies and have also produced a joint project of electrical interconnection which includes hydro-electricity.'® The other countries of the region are also in
62

Table 7
LATM AMEKICA AND THE CARJBBKAM: SECTORAL PLANS FOR WATER USE
Country MuHisectoral national plan
Name Responsible body Plan Year of horizons, formu-
year lation
Argentina Bahamas Barbados Bolivia Brazil
Colombia
Costa Rica Cuba Chile Dominican Republic Ecuador
No
No No
No Yes No No
Yes
Energy-hydroenergy sector
Potencial hidroeléctrico estimado del pals Min. de Economía
O potencial hidroeléctrico do Brasil
Inventario Nacional de Recursos Hidroeléctricos
Plan Maestro de Electrificación
Min. Minas e Energía (ELECTROBRAS) Depto. Nacional de Planificación
Os Instituto Ecuatoriemo de Electrificación (ÍNECEL)
2000 1979
1990 1980
2000 1979
1985 1980

2 Table 7 (cont. 1)
Country Multisectoral national plan
Name Responsible body Plan Year of horizons, formu-
year lation
El Salvador Guatemala Guyana Haiti Honduras Jamaica Mexico Nicaragua Panama Paraguay Peru
Suriname Trinidad and Tobago Uruguay
Venezuela
Yes No
No Yes Yes Yes
No Yes
No
No
Yes
Insti tuto Nacional de Electrificación (INDE)
Evaluación Potencial Hidroeléctrico Nacional
Evaluación Potencial Hidroeléctrico Nacional
Inventario Nacional de Potencial Hidroeléctrico
Adm.Nacional Electric. (ANDE) Min. Energía, Minas, Dirección General Electrificación
Adm. Nacional Usinas y Transporte 2000 Elect. (UTE) Min. Ambiente y Recursos Naturales 1980 Renovables (MARNR)
1979

Table 7 (cont. 2)
Country Multisectoral national plan
Name
Argentina Bahamas Barbados Bolivia
Brazil
No
No
No
Plan Nacional de Riegos
Colombia Costa Rica Cuba Chile Dominican Republic Ecuador
No Yes No No
Yes Plan Nacional de Riegos
0\
El Salvador Guatemala Guyana
Yes No

Agricultural sector
Responsible body Plan Year of horizons, formu-
year lation
Min. Agricultura y Asuntos Campesinos (MACA) Min. Interior/Min. Agricultura 1982/ 1982
1986
Instituto Ecuatoriano Recursos 2000 1979 Hidráulicos (INERHI)

Table 7 (cont. 3)
Country Multisectoral national plan
Name Responsible body Plan Year of horizons, formu-
year lation
Haiti Honduras
Jamaica Mexico Nicaragua Panama
No Yes
Yes Yes
Plan Nacional de Riegos y Drenaje
Plan Nacional de Riegos
Min. Recursos Naturales, Div. Hídricos
Min. Desarrollo Agropecuario
2003 1978
En for-mula-ción
Paraguay Peru
Suriname Trinidad and Tobago Uruguay Venezuela
No Yes
No
No Yes
Plan Maestro de Area de Influencia Yaciretá Min. Agricultura y Ganadería Opciones e inversiones prioritarias en el área de riego^ Min. Agricultura
Instituto Nacional de Desarrollo
1982

Table 7 (cont. 4)
Country Multisectoral national plan
Name Responsible body Plan Year of horizon, formu-
year lation
Name
Health sector Argentina Bahamas Barbados Bolivia Brazil Colombia
Costa Rica Cuba Chile Dominican Republic Ecuador
No
No No
No Yes No No
Yes
Plan Nacional de Acueductos y Alcantarillado
Instituto de Fomento Municipal (INSFOPAL)
Plan Nac. de Agua Potable y Saneamiento Ambiental
Instituto Ecuatoriano de Obras Sanitarias (lEOS)
2000 1980 Plan Multisectorial a nivel de términos de referencia
El Salvador Yes

g Table 7 (concl.)
Country Multisectoral national plan
Name
Guatemala Guyana Haiti Honduras
No
No Yes
Jamaica Mexico Nicaragua Panama Paraguay Peru Suriname Trinidad and Tobago Uruguay Venezuela
Yes Yes
No Yes
No No Yes
' Proyecto Interregional del PNUD: INT/82/001.
Responsible body Plan Year of horizon, formu-
year lation
Name
Plan Multisec-torial 1980-1987

process of forming plans, bearing in mind the ever increasing need to plan energy development. The hydroenergy inventory of the countries mentioned includes, as common elements of study, the following:
- estimation of the total hydroelectric potential of the country; - estimation of the hydroelectric potential of priority basins; - identification of hydrographic basins of special hydroelectric
interest; - compilation of basic information on hydrology, cartography,
and geology for the whole country; - preparation of a catalogue of hydroelectric projects, and - estimation of the investment costs of the projects. The average monthly flow of the rivers important for
hydroenergy of Peru was estimated by using the hydrological model known as the HEC,®' which has been modified for processing in a micro-computer, a system increasingly used in Latin America.®® Argentina has a national plan for the equipment of systems of electric-energy generation in which it is emphasized that the water resource is still one of the most important sources of energy despite the fact that this country has developed several other forms of energy generation. With regard to hydroelectric energy, it is stated that "... according to the latest estimates the conventional hydroelectric potential technically usable in the country ie equivalent to the production of 200 000 kWh per year".'® It is added that this potential would in itself alone suffice to meet the demand for electric energy up to the beginning of the next century.
In Ecuador, at the end of the 1970s, the Ecuadorian Institute for Electrification (INECEL) undertook planning studies for the electrical subsector, of which the basic objectives were to procure sufficient energy for the sustained development of the country and to create an efficient system of energy distribution. The activities oflNECEL included the study of hydroelectric resources, for which basic measures were proposed such as: to obtain topographical maps of the beds of all the rivers and their affluents, to draw up registers of water-flows and precipitations reflecting energy availabilities, and to ascertain the geological conditions of all the river beds. The Master Electrification Plan has a planning horizon of 20 years and adopts as a starting point a thorough knowledge of all hydroelectric resources. This includes a firm plan for the period 1980-1984. The objective of the short-term plan is that by the end of 1984 the country should have an installed capacity of 1 990 000 kW through an increase of 900 000 kW, of which 638 000 kW will be of hydroelectric origin.^" Among the publications of INECEL on the subject of hydro-electricity the following may be mentioned "Catálogo
69

de proyectos hidroeléctricos", March 1983; "Optimización de los recursos hidroeléctricos en el Ecuador", March 1983, and "Modelo matemático de regulación energética de cuencas hidrográficas".
The conclusions of the study on energy for Brazil are somewhat similar to those on Argentina; in fact, the Brazilian study points out that, according to long-term estimates (the first decades of the next century), the role of hydro-electricity will become even more important than at present or in the medium-term, since it is considered on the one hand that, although the cost of electric energy production through hydroelectric power stations will be greater, the cost of production through the use of fuel or nuclear fission will be greater still, and on the other hand, that the estimate of the water potential available may rise considerably in the coming years, which will increase its relative importance.^^
As regards the Central American Isthmus, the Regional Project for the Electrical Interconnection of the Central American Isthmus comprises the study of the development of the electrical systems of the six countries of the Isthmus through the integrated operation of some 60 hydroelectric projects identified in the subregion in conjunction with thermo-electric and geo-thermal plants.^^
Finally, it means repeating that it is hoped both in the near and distant future the generation of hydroelectric energy will increase its importance in the development of the countries. Fortunately the region has a very rich experience in the planning of hydroenergy resources and horizontal co-operation is promising in this field.
As can be seen from the foregoing, the programmes for the construction of hydroelectric power stations are designed and inserted within the national electrification plans, and, more generally, within the energy development plans. Nevertheless, as they are water-using installations, they ought also to be inserted within the general plans for water use so as to achieve integral utilization and avoid conflicts with other sectors interested in water use, such as irrigation, drinking water and sanitation, navigation, etc. This, however, has not occurred up to the present, basically owing to two facts: first, to the abundance of hydroelectric resources spread over wide areas of the continental countries; and, second, as a complement to the first, to the present possibility of transporting electric energy over great distances to the major centres of consumption. In this way it has been generally possible to select the places for energy generation in basins that do not conflict with other uses, some of which, such as water for sanitation (drinking water supply and sewerage) and irrigation, have priority importance over that of energy. At all events, if in a particular place there was simultaneous interest in energy and irrigation (which is another of the more important uses of
70

water), it was usual to reconcile this by appropriate hydraulic works. In general, it has been the use of water for energy that has led to the creation or improvement of irrigation areas in many regions and not the reverse.
The fact that the hydroelectric sector has developed much more dynamically than the other water uses has made a very significant, almost crucial, contribution to the knowledge of the water resource in general by means of:
i) The f ormation of hydrological data banks, most of which are totally computerized.
ii) The development of hydrological models owing to the need to process a large quantity of information, which has compelled the use of computers and has given rise to the ensuing promotion of the preparation of computer programmes.
iii) The execution of a complete inventory of all the surface water resources of the country.
iv) The delimitation of river basins and the knowledge of their geology, which has contributed to the regionalization of the country.
At the same time the advance of the hydroelectric sector has been a factor in the formation of local personnel, trained in the compilation, analysis and processing of data.
The large programmes for the construction of hydroelectric power stations, along with the increasing demands for food and drinking water for the growing population of the region, could lead more and more to situations of conflicting interests. Nonetheless, the criterion prevailing at present in the design of hydraulic projects is that these should fulfill objectives of multiple use and meet the needs of all the possible sectors interested: energy, irrigation, drinking water supply, sewerage, navigation, recreation and flood control.
b) Plans for water use in agriculture
Plans concerned with the rational use of water in agriculture are generally aimed at programming irrigation and drainage activities, even though it is also necessary to incorporate in this classification the programming of measures to improve the use of water through water catchment from rain and mist —which are the basis of agriculture and stock-raising in rainfed agricultural zones— and the control of surface run-off.
Theoretically a national or regional irrigation and drainage plan should enable a government to programme the necessary measures for promoting the development of zones in the country suitable for this
71

purpose, whether by stimulating private investment or adopting measures and making investments on its own account.
Plans of this nature are usually intended to achieve goals relating to a specific number of hectares which have to be irrigated or drained in a country region or basin. In these plans a distinction is made between the new areas to be incorporated and those which are already under irrigation or crops but can be improved. A distinction is likewise made between areas, which, although they receive a certain amount of rainfall or groundwater, need complementary irrigation, and those totally arid areas in which irrigation is the only possible source of water.
An irrigation and drainage plan adequately formulated should form part of a sectoral and agricultural plan and include the programming of physical-technical activities such as studies, projects, works and operation of hydraulic systems. It should also include politico-administrative activities, such as the adaptation of regulations, credits, training, organization and other aspects directed towards the good use and conservation of water in agriculture.
In practice it is difficult to make a large-scale irrigation and drainage plan which will comprise all the aspects mentioned, so that it is usual to resort to the formulation of specific programmes and projects. In this respect it is of interest to outline the different motivations and means that tend to be involved in the promotion of irrigation and drainage development in Latin America and the Caribbean.
Taking as an example only two countries, Peru and Brazil, it can be seen, inter alia, that the motivations and means employed comprise aspects in common, such as:
i) Promotion of the execution of large irrigation and drainage projects based on objectives of regional development and integral development of large basins, such as the irrigation projects of the Companhia do Desenvolvimento do Vale do Sao Francisco, Brazil ® and large irrigation projects on the Pacific coast of Peru.
ii) Promotion of the execution of medium-sized and small irrigation projects based on the stimulation of:
- the utilization of certain soils or geographic areas, such as the PROVARZEAS Project in Brazil;
- the utilization of certain water resources, such as the Project for the Enlargement of the Agricultural Frontier with Utilization of Groundwater, on the coast of Peru;
- the utilization of community participation and the generation of employment, such as the Irrigation Projects with Community Co-operation, in Peru;
- the benefiting of certain geographic areas, such as the
72

Plan for Irrigation Improvement in the Sierra, PLAN MERIS, of Peru;
- the promotion of certain crops through the allocation of credit for irrigation, such as the credits for the sowing of rice in Brazil;
- the promotion of the use of specific technologies, such as the credits destined for the purchase of pumping machinery or equipment for irrigation by sprinkling and dripping;
- the promotion of certain technical or administrative measures, such as, for example, the improvement of the use made of irrigation areas, etc.
This list exemplifies sufficiently clearly that irrigation and drainage are promoted and developed according to very different rationales and patterns and in very different institutions. Although this is not necessarily an adverse factor there are at least some basic aspects that should certainly be considered by the governments if they are to contribute to the orderly development of irrigation and drainage in their countries. Among these aspects the following should be mentioned:
i) To ascertain the potential of the areas suitable for total or complementary irrigation and drainage, including their irrigation needs and availability and the demands for the washing of soils or the drainage of humid zones, in order to rank their utilization in terms of the country's development goals and thereby to select the most suitable projects for investment.
ii) To ascertain the present state of the hydraulic systems already built for irrigation and drainage and the efficacy of their functioning and maintenance so that the government may assist their users, for example, to improve the irrigation or drainage areas.
iii) To ascertain the state of the management and conservation of the water and soil resources of the whole river basin and not only of the perimeters irrigated. In particular the governments should inform themselves of the problems of water-logging, salinization, erosion and contamination, in order to programme activities which will forestall these effects or rehabilitate degraded resources.
iv) To ascertain the way in which the resources of the State are distributed in the promotion of irrigation and drainage: a) by geographic areas, b) within the agricultural sector, c) between research, building of works and operation of systems, and d) between irrigated and rainfed areas, in order to avoid serious distortions in the allocation of these resources.
v) To learn how the legal, institutional, financing, educational and budgetary systems, among others, effectively help to promote and
73

facilitate irrigation and drainage in the country, along with the efficient use of rain water in rainfed zones.
It has been noted that several Latin American countries, aware of the need to foster the use and management of water in agriculture, have developed specific strategies to this end. The countries which have been longest in this field, such as Mexico, Peru, Chile and Argentina, in addition to their traditional policy of irrigation expansion, have now begun to consider the following:
i) A more balanced distribution of resource allocation for irrigation and drainage within their territory, avoiding the excessive benefit of certain regions, as in the north of Mexico and on the coasts of Peru, to the detriment of other regions in the country.
ii) A more equitable distribution of resource allocation for water management among irrigation zones, drainage zones and/or rainfed zones. In particular this last head should be duly considered with a view to improving upper-basin management, collect more rain water with better physical development of the land, and control run-off, erosion and floodings.
iii) The allocation of more resources to the operation and maintenance of existing hydraulic systems, together with the management and conservation of water and soil in the areas of irrigation and drainage, which comprise, as in Peru, the whole of one or more hydrographic basins.
Brazil, whose experience in irrigation and drainage is relatively recent in Latin America, intends to expand its irrigated surface from 1 100 000 to 3 000 000 hectares, for which it has drawn up a draft project called "National Irrigation Plan 1982-1986",^^ which seeks to rationalize this activity at national level, and which constitutes a very positive step towards the promotion of this activity. In some of the States of the Northeast, such as Piaui, there have even been specific programmes for the promotion of the multiple and rational use of water with emphasis on irrigation.^®
In Venezuela irrigation is relatively less important than the drainage zones with an excess of water. Hence the government is more interested in supporting the execution of drainage projects. Venezuela has an area of 1 227 000 hectares drained and 323 000 hectares irrigated.
Practically all the other countries of the region are equally concerned to improve the efficiency of water use in agriculture and it is to be hoped that co-operation among all the governments and specialists of the region will facilitate this objective.'^®
74

c) Drinking water supply plans
For a long time past the Latin American governments have recognized the importance of providing drinking water and sewerage services for their populations as a vital factor for the preservation and improvement of health. There has been considerable progress, particularly in recent years. Thus, for example, whereas 20 years ago only 60% of the urban population and less than 8% of the rural had access to a drinking water supply, in the year 1977 some 75% of the urban population and 34% of the rural had reasonable access to drinking water (although only 43% of the urban and 3% of the rural population had an adequate sewerage system).'*^
More recently, the International Drinking Water Supply and Sanitation Decade, sponsored by the United Nations (1980), was instrumental in causing all the countries of the region to include within their planning activities the development of drinking water and sewerage systems for their populations both urban and rural. Particularly important is the assistance being provided by the World Bank, the World Health Organization and the Pan-American Health Organization in the achievement of the goals of this Decade.
A recent survey conducted by the Pan-American health Organization (PAHO) revealed that all the 20 countries surveyed had set their goals for the International Drinking Water Supply and Sanitation Decade at the end of 1982.
All the countries surveyed have set themselves goals for urban household connection to water systems; nonetheless, less than half have fixed goals for household connections in rural areas, so that the situation of the peasantry remains particularly difficult in the region.
The sewerage systems in the rural area are the least developed and there are no statistical data on the subject in many countries. In the region as a whole, however, the situation is diverse. Three groups of countries can be distinguished in accordance with the proportion of rural population existing now and projected up to 1990: ®
- countries with under 20% of rural population (Argentina, Chile, Uruguay, Venezuela);
- countries with 20% to 35% of rural population (Brazil, Colombia, Cuba, Mexico, and Peru), and
- countries with over 35% of rural population (the remaining countries).
As regards the organization of the drinking water and sewerage sector in the countries of the region the study has revealed that there is generally one institution responsible for supervising measures and planning at national level. Nonetheless, the drinking water and sewerage services of some large cities, such as Mexico,
75

Lima, Bogotá, Guayaquil, Quito, etc., through having services which supply very large communities, as for example Mexico City (14 million inhabitants), have considerable autonomy in the formulation of their plans.
The drinking water supply services for the urban areas of several thousand inhabitants generally depend on the aforesaid institutions or on the municipalities or local governments, while the drinking water and sanitation services for rural populations ranging from a few hundred to a few thousand inhabitants depend on the ministries of health.
This division of duties seems to function very well in all the cases analysed, but it hampers the execution of drinking water supply plans at national level.
The cases of Argentina, Brazil, Colombia and Ecuador are examples of the different ways in which the countries have organized their water supply and sanitation service.
In Argentina the main responsibility for the sector is in the hands of the Ministries of Public Works and of Social Welfare. In the former, the Subsecretariat for Water Resources has legal control of the Empresa de Obras Sanitarias de la Nación and the Servicio Nacional de Agua Potable y Saneamiento Rural. The second includes the Secretariat of State for Public Health, within which the Dirección Nacional de Saneamiento Ambiental is responsible for the preservation of the environment.
The Empresa de Obras Sanitarias de la Nación attends to the needs of 80% of the population which has a drinking water supply service and 90% of that which has sewerage, and is the main body in charge of the implementation of the policies and plans of the National Government for the sector.
The Servicio Nacional de Agua Potable y Saneamiento Rural was established in 1964 and was put in charge of the promotion, supervision and administration of the national plan for rural water supply and sanitation.^® Under this plan, which at present extends to localities of up to 10 000 inhabitants, the intention is:
- in the short-term, to provide a drinking water service for 400 000 inhabitants of rural communities;
- in the medium-term, to meet the water supply needs of 1 700 000 inhabitants;
- in the long-term, to provide services for the whole of the rural population, i.e., for 4 400 000 inhabitants within the next 20 years.
This plan which has the financial support of the Inter-American Development Bank (IDB), has been very successful and has fulfilled its goals, in which an important factor has been the participation of
76

the same rural communities which have benefited from the projects of the plan.®"
In Brazil the Ministry of the Interior has a Departamento Nacional de Obras Sanitarias (DNOS), which acting at the national level —not counting the Polígono de la Sequía— includes the following among its aims and objectives:
i) To establish norms and specifications for the drawing up of projects, the execution of works for the operation and conservation of basic sanitation services, especially a water supply, rainfall drainage and waste disposal; control of the contamination of the sea shore, in masses and water courses; control of erosion, improvement of areas and their protection against drought and flooding.
ii) To prepare studies and projects, as well as to guide, supervise and implement directly or indirectly works and services of irrigation and rural and urban sanitation, both general and basic, in collaboration with the States, territories and municipalities, and public and private bodies, in accordance with the regional development plans.
In the case of Ecuador, the year 1980 saw the beginning of the formulation of the bases of the Ten-Year Plan for the Supply of Drinking Water and Sewerage for the urban and rural zones of the country. For the period 1980-1984 the following goals were envisaged: i) to increase the water supply coverage to 65% of the population in the urban zones and 25% in the rural and, as regards sewerage, to increase the coverage to 80% in the cities and 30% in the countryside; ii) to construct in the urban zones 47 drinking water supply systems and 74 sewerage systems, both for rain drainage and waste disposal, and iii) to execute 400 joint projects of basic rural sanitation.®^
Colombia has the Plan Nacional de Acueductos y Alcantarillados (PLANAL), which contemplates a set of measures aimed at the structuring of a coherent policy at national level and gradually to increase the coverage of the services to all the communities in the country.®^
In conclusion, it may be said that the region has made progress in the preparation of plans and programmes for the rapid growth of water supply and drainage services during the International Drinking Water Supply and Sanitation Decade. The problem of tackling and implementing these plans and programmes, however, is still to be resolved. The recognition that there are numerous obstacles, particularly in respect of available finance and trained personnel for the achievement of these goals, shows that the countries of the region are aware that this challenge is very difficult to overcome. Undoubtedly the financial situation of the sector has been to some
77

extent self-imposed owing to the failure to fix a charge which would adequately recover the costs of the service.®' It has been said that technological innovation would be one solution; it is obviously not the panacea, however, particularly for the solution of the problem of lack of funds. The problem can only be finally solved by means of good administration. This should include the adoption of a stable policy for the sector, the application of long-term strategies for the development of the sector, the provision of well-trained personnel at all levels, but above all the operation of programmes to serve the rural population and the maintenance of rational management practices to conserve existing installations and maximize their utility.®*
d ) Planning at the basin level
There is a long tradition of basin planning in Latin America; at first it was centred almost entirely on the exploitation of the water resources, but recently it has been giving greater consideration to environmental aspects. These considerations are of more recent date, and have been particularly assisted by the Organization of American States (OAS) through its Regional Planning Department. Particularly important is the support given by this organization to the development of international hydrographic basins. From 1960 to 1982 this Department has conducted projects in several countries in the field of watershed development for multiple use®® (table 8). Moreover, each country, using this or some other form of technical assistance or by its own means, has drawn up different plans of development for its hydrographic basins. Different approaches and different emphases have been formulated in accordance with their socioeconomic situations. The following cases are mentioned by way of example or for purposes of comparison.
a) In Ecuador there are numerous study projects for the utilization of basins, in which the water resource has been emphasized:®®
i) Study of the northwestern basins; planning of the exploitation of the land and water resources in the basins of the rivers Esmeralda and Santiago.
ii) Draft plan for the integral development of the basin of the river Pastaza, aimed at formulating a diagnosis of the natural and socioeconomic resources over an area of 22 000 km2, stressing irrigation, drainage and hydro-electricity.
78
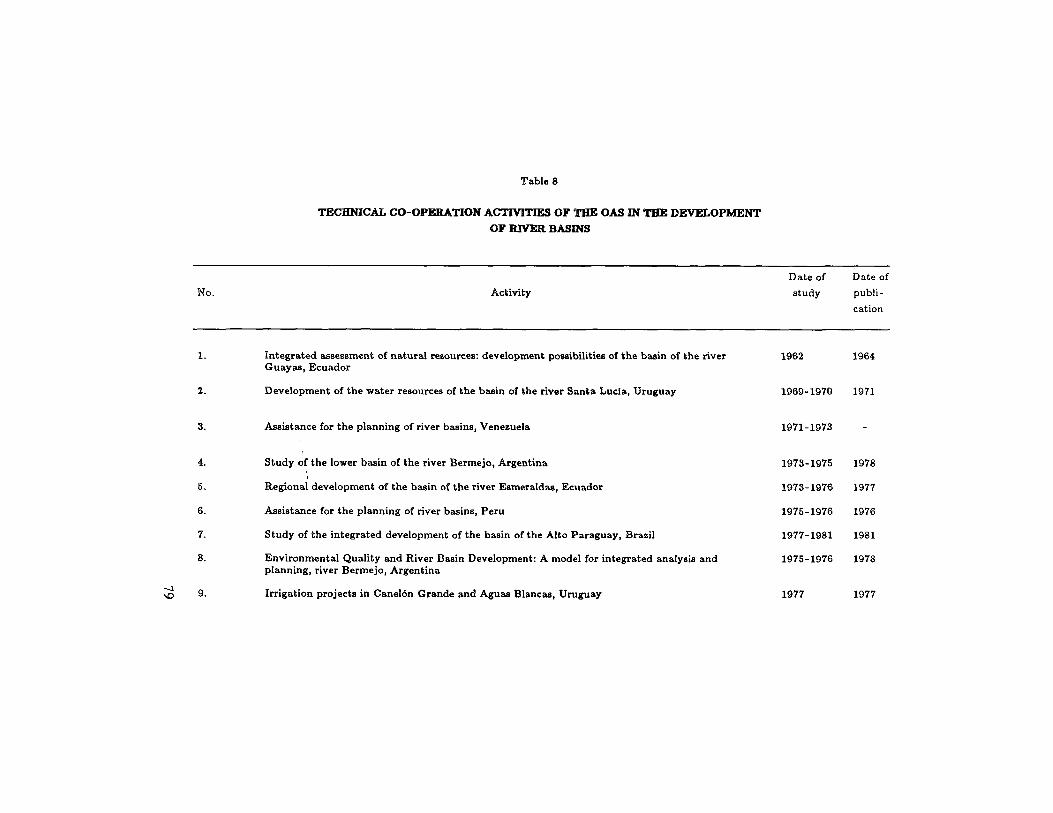
Table 8
TECHNICAL CO-OPERATION ACTIVITIES OF THE OAS IN THE DEVELOPMENT OP RIVER BASINS
No. Activity Date of Date of study publi-
cation
2.
3.
Integrated assessment of natural resources: development possibilities of the basin of the river Guayas, Ecuador
Development of the water resources of the basin of the river Santa Lucia, Uruguay
Assistance for the planning of river basins, Venezuela
1962 1964
1969-1970 1971
1971-1973
4.
5.
6.
7.
8.
Study of the lower basin of the river Bermejo, Argentina \
Regional development of the basin of the river Esmeraldas, Ecuador
Assistance for the planning of river basins, Peru
Study of the integrated development of the basin of the Alto Paraguay, Brazil Environmental Quality and River Basin Development: A model for integrated analysis and planning, river Bermejo, Argentina
1973-1975 1978
1973-1976 1977
1975-1976 1976
1977-1981 1981
1975-1976 1978
VO 9. Irrigation projects in Canelón Grande and Aguas Blancas, Uruguay 1977 1977

No. Activity Date of study
Date of publi-cation
10. Programme for small dams, Dominican Republic 1978-1979 -
11. Integrated development of the Paracatú basin, Brazil 1978-1980 1980
12. Project for the Ja tobá basin, Brazil 1978-1980 1980
13. Project for the integrated development of the Araguaia-Tocantins basin, Brazil 1981
14. Agricultural development under irrigation in the Upper Basin of the River Pilcomayo (MACA), Bolivia
1980-1982
15. Regional Development Planning, Suriname 1979-1981
16. Advisory assistance in regional and physical planning for the Ministry of Planning and Co-ordination (CORDIPLAN), Venezuela
1979-1981
17. River basin planning, Ecuador 1982
Activity Date of Date of study publi-
cation
12.
13.
14.
15.
16.
17.
Project for the Ja tobá basin, Brazil
Project for the integrated development of the Araguaia-Tocantins basin, Brazil
Agricultural development under irrigation in the Upper Basin of the River Pilcomayo (MACA), Bolivia
Regional Development Planning, Suriname
Advisory assistance in regional and physical planning for the Ministry of Planning and Co-ordination (CORDIPLAN), Venezuela
River basin planning, Ecuador
1978-1979
1978-1980
1978-1980
1981
1980-1982
1979-1981
1979-1981
1982
1980
1980
Source: OAS, "Actividades de cooperación técnica", Departamento de Desarrollo Regional, Energía y Recursos Naturales, Washington, D.C., 1981.

iii) Development plan for Region 1, directed to the use of the water resources in the basin of the rivers Santiago and Mira, and a development plan for the provinces of Esmeraldas, Imbabura and Carchi.
iv) Plan for the upper and intermediate basins of the rivers Jubones, Cañar and Paute, including a draft plan for the utilization and management of the hydrographic basins.
v) Hydraulic plan for the Jubones basin, which forms part of the planning project for the hydrographic systems (with the OAS), one of whose objectives is the execution of studies and proposals for the rational development and multiple use of the water resources.
vi) Development plan for the Guayas basin. b) In Brazil, in view of the importance assigned to the integral
development of basins, it has been arranged that the management of water by hydrographic basins or sub-basins should be carried out through an agency which will reconcile the presence of all the parties involved in the water resources, harmonizing the central organs and entities and their counterparts at State and municipal level. This agency is the Special Committee for Integrated Studies on Hydrographic Basins (Comité Especial de Estudios Integrados de Cuencas Hidrográficas (CEEIBH)) formally created in March 1979.
The CEEIBH is in charge of the classification of the water courses of the Union, the integrated study and supervision of the rational use of the water resources of the hydrographic basis of the federal rivers, in the sense of obtaining multiple benefit from each one and minimizing the harmful effects on the ecology of the region.
The members of the CEEIBH are the Secretary of the Special Secretariat for the Environment MINER/SEMA, the Director-General of the National Department for Water Resources and Electric Energy, MME/DNAEE, the Director President of the Brazilian Electric Power Stations S.A., MME/ELECTROBRAS, the Director General of the national Department for Sanitation Works, MINER/DNOS, the Superintendent of the Regional Development Superintendencies in the respective geo-economic area of the hydrographic basin of the federal rivers, and the Secretaries of State nominated by the Governors of the States whose governments have special powers over the control of the environment and water resources in the respective hydrographic basin of the federal rivers.
Moreover, considerable experience has been accumulated as a result of the development project for the basin and valley of the river San Francisco (640 000 km2), which was initiated in 1964.®' This is a multiple-use and far-ranging project. Other projects are those of the Araguaia-Tocantins basins and the Jatoba basin.
81

Particularly in the latter project, the integrated development programme includes, inter alia, utilization of groundwater, fish-breeding, improvement of rainfed agriculture, educational programmes, health, drinking water and sewerage supply services and community development. The Superintendency for the Development of the Northeast Region (SUDENE) and the Government of the State of Pernambuco have initiated the works and assigned the respective funds for the period 1980-1983. The pilot study and its follow-up measures are used to orient a general development strategy for the semi-arid region of the Northeast.®®
c) Colombia also, through its various corporations for regional development, has wide experience in the planning of river basins. One of the oldest of these bodies is the Autonomous Regional Corporation for the Cauca Valley (CVC), which was created in 1954 to develop the upper part of the Cauca Valley and its surrounding areas. At first the CVC centred its efforts on the development of hydroenergy, in order to create resources, but now it conducts multiple projects including flood control, irrigated agriculture and electricity generation as in the case of the Salvajina project.®^
d) In Peru there are several agencies in charge of the study, development and/or management of the resources of the river basins. In this respect, i) various studies have been carried out to assess, at basin level, the natural resources of the country, the study on the coastal basins having now been completed (National Office for the Evaluation of Natural Resources (ONERN); ii) there are special projects for water development at basin level by sectors: for energy, the projects of the basins of the rivers Mantaro and Huallaga; for agriculture (irrigation), the projects of the basins of the Chira-Piura, Puyango-Tumbes, Cajamarca, Mantaro, Alto Vilcanota, Chumbao, etc.; for drinking water and energy, the project for decanting the Mantaro river; iii) the water management is conducted at basin level through the Irrigation Districts which depend on the Ministry of Agriculture; iv) there are special projects for regional development at basin level, such as those of the Huallaga and Alto Mayo; and v) finally, there are systems of control of natural conflicts likewise at basin level, such as those of the Santa Corporation, in the Department of Ancash.
It can be seen that there is a wide range of possibilities for undertaking and carrying out the development of river basins in Latin America and the Caribbean; moreover, several basins have been incorporated for the integral planning of a region, as in the case of the "micro-regions" of Mexico, in which the planning was carried on under the direction of the agency known as the Public Investment
82

Programme for Rural Development (PIDER), which came under the Ministry of Planning and Budget.®"
An important conclusion that can be drawn is that some very intensive and far-reaching work is in progress on the planning of water use at basin level, which because of its character as a biogeographic unit is better suited than plans at national level to produce a really effective development of this resource.
D .
L The importaace of planning in the region
One of the immediate results of the execution of a water utilization plan is to make manifest the role of this resource in the development of a country or region. In order to formulate a plan for the use of water resources this must necessarily form part of the development plans of the country, so that in those countries where there are water problems territorial management must be associated with the regionalization of water, in view of the close relationship between water use and development.®^
The need to prevent conflicts in the use or control of water is certainly more evident in areas which have a high potential growth in respect of population, industry, agriculture, energy, etc., and which are situated in arid or high-altitude zones that have little available water, are subject to droughts or floods and have pollution or other problems. In Latin America this combination of conflictive areas is frequent, owing to the unequal distribution of the resource, to the phenomena which affect them and the growth of demand.
Many of these areas, in their turn, have related problems such as the settlement of communities high above sea-level, which reduces the water catchment area and/or causes the discharge of polluted water to affect communities downstream through the occurrence of long periods of drought interrupted by heavy rains and other extreme phenomena such as landslides or other erosive processes.
Flooding, at least in recent years, has led to the planning of water resource control. The north of Argentina, Paraguay, the south of Brazil, the north of Peru and Ecuador were the areas most widely afflicted in the region. In the Caribbean and the Gulf the hurricane phenomenon is equally well known. In addition, the problems of water pollution control in urban areas are increasingly aqute. These situations leave no doubt as to the need to regulate the use of the resource and thus orient a policy of water control.
83

2. Effects of the formulation of plans on water resource development
According to the comparative analyses of plans and their results, it may be concluded that the drawing up of a national plan for the management of water resources is useful:
- during the process of drawing up the plan, and - once the plan is completed. At the risk of exaggeration, it might be said that the two
stages are equally important. The stage of formulation of the plan is in many cases the first step towards an institutional co-ordination previously non-existent in several countries. A sample of this integration can be found, for example, in the composition of the Commission on the National Plan for Water Resource Management of Peru. Another example of the importance of the preparatory stage can be found in the achievements during the formulation of the Master Plan for Water Resource Development and Utilization of El Salvador. This includes, among other projects, the creation of a specialized water department in the Ministry of Planning in 1981, the drawing up of draft project on Water Law, and the creation of a data bank on water resources. Similar examples of benefits are found in the formulation stage of almost all the plans that seek the active participation of the State agencies and the water users themselves, as in the case of the Water Plan of Mexico.
The fact of possessing a completed plan marks a new stage which is by no means definitive in view of the need for a permanent feedback to the system created. The most important aspect of this stage is the possession of an articulated functional system which facilitates the taking of decisions on the utilization and management of water for development. The form in which the plans are applied in practice must certainly be carefully assessed before their real scope can be determined, a task which will entail a deeper study than the present one.
3. Strategies for strengthening the national and multisectoral planning of water resources
A national plan for water use must necessarily cover the long-term, and embrace a series of economic sectors and the whole territory of the country, which means that it may encounter many obstacles that hinder or delay its preparation and application. To avoid this situation it is suggested that a strategy be adopted which includes the following aspects:
84
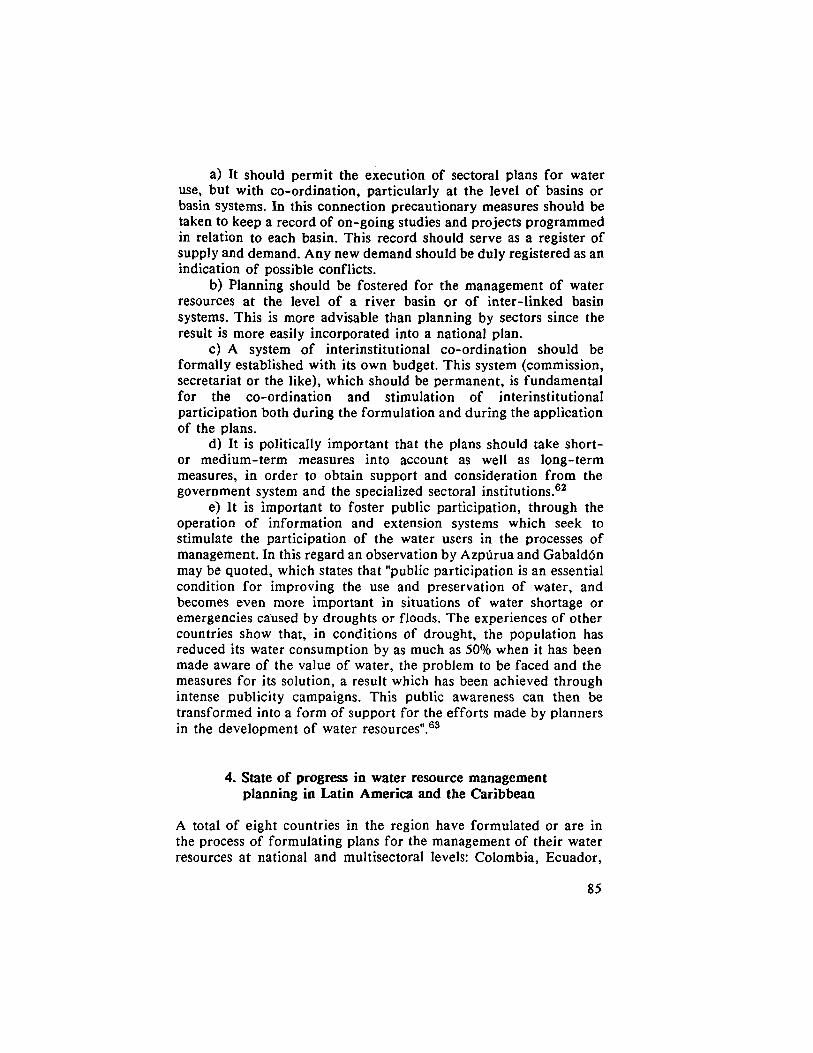
a) It should permit the execution of sectoral plans for water use, but with co-ordination, particularly at the level of basins or basin systems. In this connection precautionary measures should be taken to keep a record of on-going studies and projects programmed in relation to each basin. This record should serve as a register of supply and demand. Any new demand should be duly registered as an indication of possible conflicts.
b) Planning should be fostered for the management of water resources at the level of a river basin or of inter-linked basin systems. This is more advisable than planning by sectors since the result is more easily incorporated into a national plan.
c) A system of interinstitutional co-ordination should be formally established with its own budget. This system (commission, secretariat or the like), which should be permanent, is fundamental for the co-ordination and stimulation of interinstitutional participation both during the formulation and during the application of the plans.
d) It is politically important that the plans should take short-or medium-term measures into account as well as long-term measures, in order to obtain support and consideration from the government system and the specialized sectoral institutions.®^
e) It is important to foster public participation, through the operation of information and extension systems which seek to stimulate the participation of the water users in the processes of management. In this regard an observation by Azpúrua and Gabaldón may be quoted, which states that "public participation is an essential condition for improving the use and preservation of water, and becomes even more important in situations of water shortage or emergencies caused by droughts or floods. The experiences of other countries show that, in conditions of drought, the population has reduced its water consumption by as much as 50% when it has been made aware of the value of water, the problem to be faced and the measures for its solution, a result which has been achieved through intense publicity campaigns. This public awareness can then be transformed into a form of support for the efforts made by planners in the development of water resources".®®
4. State of progress in water resource management planning in Latin America and the Caribbean
A total of eight countries in the region have formulated or are in the process of formulating plans for the management of their water resources at national and multisectoral levels: Colombia, Ecuador,
85

El Salvador, Honduras, Jamaica, Mexico, Peru and Venezuela. Another two countries, Argentina and the Dominican Republic intend to initiate them in the future.
Practically all the countries of the region have formulated one or more plans for the management of their water resources, which have had national but not sectoral coverage. These plans mainly relate to the subsectors of hydroenergy, irrigation and drainage, and drinking water supply and sanitation. The formulation of plans in this last subsector was stimulated by the International Drinking Water Supply and Sanitation Decade.
All the countries of the region have experienced in the formulation of plans for the multiple or sectoral utilization of water at river basin level, both national and international. At national level, for example, there has been the formulation of plans for the development of the valley and basin of the River San Francisco in Brazil; the valley and basins of the River Cauca in Colombia and the basin of the River Guayas in Ecuador.
In some countries sectoral plans, mainly directed to energy or irrigation, have completely dominated strategies in the field of water. In these cases a single sector directs the water management plan and is so strong that it comes to have influence and priority even in the activities of regional or national development.
a) Procedures used in the formulation of plans for water resource management
i) The most frequently used measure has been the creation of "national co-ordination commissions" to formulate the plan. The members of these commissions are usually the directors of the different water-using sectors and have some type of executive secretariat. The head of the commission is generally a representative of the central planning sector or of a body responsible for the management of the resource (agriculture, environment) or of an institute specialized in water resources.
ii) One of the main benefits obtained on the initiation of a plan of national and multisectoral nature is the very fact that a national mechanism to co-ordinate water-resource activities is set up which was previously, non-existent. This applies equally to planning processes in regions or ins river basins.
iii) For a co-ordination commission to be successful it needs: a) to be created and to function at the highest level; b) to have a specific budget to formulate the plan; c) to have an executive secretariat with permanent staff, and d) to have the effective
86

participation of all the sectors involved in the formulation of the plan. As regards this last point, it may be said that if the user sectors do not participate in its formulation it is most unlikely that the plan will be taken into account in practice and the effect of an awareness of the multisectoral use of water will also be lost. Thus it is indispensable that the members of the commission should be the directors or heads of each user sector and not a representative.
b) The structure and content of water-resource management plans at the national and multisectoral levels
i) It has been noted that the structure of the plans follows a uniform pattern: in a first phase the water-related regions are marked out; in a second phase a diagnosis is made which includes the study of the water supply and demand in each region and among water-related regions for different time horizons; and in a third phase, strategies or policies are formulated to harmonize water supply and demand in the short, medium- and long-term.
ii) A plan without strategies or policies for the harmonization of water supply and demand should not be regarded as such. In practice, however, there are numerous documents under the name of plans despite the fact that they merely reach the diagnosis phase. Moreover, several plans which incorporate strategies limit themselves to a consideration of alternatives for increasing the supply of water through giving priority to investment in hydraulic works, and do not present alternatives for the regulation or control of the growth of demand for water, that is, for an increase in efficiency in the use of the systems constructed or a setting of limits to growth in specific urban, industrial or other areas.
iii) The so-called "incorporation of the environmental dimension" in the plans has a varied scope. In actual fact it is not an explicit or integra! incorporation, even when it is directed to the management and control of environmental aspects such as water pollution problems (which affect health), problems of erosion and sedimentation, problems of land salinization, problems of overexploitation of groundwater aquifers and saline intrusion and problems concerning the conservation and preservation of water for ecological purposes.
iv) In almost all the plans, excepting the Water Plan of Mexico, too little consideration is given to the design of strategies for the operation and maintenance of hydraulic works ie existence and the management and conservation of water resources, particularly in the catchment areas of rivers. This is reflected in the meagre budgetary
87

allocation of the governments to the performance of these activities, which contrasts with the high investment assigned to the construction of new hydraulic works.
c) The relative usefulness of water-resource management plans
i) A plan for water-resource management will be useful to the extent that it is used to take decisions which favour the socioeconomic development of a country or region and to avoid or prevent conflicts in the use of water. The policies that can be applied for this purpose, as was mentioned above, are aimed at increasing and controlling the supply of water and managing or controlling the demand.
ii) It is evident, however, that management plans in the region have been formulated or utilized almost exclusively to direct investment policies to increase the water supply and hardly at all to control the demand for water. Hence it can be stated that what has been done hitherto in the field of water-resource management has been insufficient to avoid or prevent conflicts arising from an exponential growth in demands for water and to mitigate the effects of natural phenomena such as floods, droughts, and pollution problems.
iii) Nevertheless, it is clear that the increase in the demands for water in quality and quantity, above all in the large urban centres, can no longer be met merely by the construction of new and more costly hydraulic works. The solution inevitably calls for the application of strategies combining these works with a reduction in the demand. This reduction implies the creation of alternatives for improving the efficiency of water use, along with other more drastic measures to restrict its growth. The countries should draw up and establish this type of alternative in order to achieve a real "management of the resource" in their territories.
iv) Experience shows that despite the availability of national plans for water-resource management, including the most complete and ideal, there has been no guarantee of their application. This is mainly due to the scant political usefulness of the plans, particularly when they suggest measures for controlling demand, as for example, through an increase in water charges, population redistribution, crop displacement, embargoes on the use of groundwater and other types of rationing. As regards the increase of the water supply, the most effective measure has apparently been the formulation and application of management plans for river basins or regions or for water-using
88

sectors. In most of these cases the plan or programme is based on one or more concrete projects which are already accepted by public opinion or existing policies. The plan then serves to make requests viable and to incorporate complementary strategies.
v) It is also clear that measures for restricting demand have been applied in the region only when the situations of conflict in the use of water have become untenable, as in periods of drought and in general when demand exceeds supply. On these occasions strategies are put forward which should have been applied before in order to avoid the problem. This reveals a need for greater political and public awareness, in order to prevent conflictive situations. This promotion of awareness, in order to prevent conflictive situations. This promotion of awareness should therefore be a fundamental part of the formulation of the plans.
vi) It is obvious, that several of the plans are not politically viable because they do not include strategies for a specific government period. Generally speaking they are only concerned with planning-long term measures, without establishing a sufficient nexus between these measures and those of the short- and medium-term, that is, with the government in power. This lessens the political weight of the plan since no account is taken that long-term measures must be initiated in the short-term.
vii) In practice a government has very little choice in the construction of large water projects, mainly because it inherits those already initiated under previous governments, but it can certainly make considerable improvements in the efficacy of water use and carefully programme the commencement of new works. This should be taken into account in order to improve the probabilities of application and facilitate the procurement of support for the implementation of the measures recommended.
viii) None of the above statements invalidate the importance and necessity of drawing up national plans for the management of water resources; on the contrary, they confirm the need. It is obvious, however, that the application of the plans can and should be improved, by implementing, in its context and with greater scope, the phase of formulation of strategies or policies and, within these, by giving more consideration to the strategies for the control of water supply and demand, in order to provide viable alternatives to the policies, and to create a public consciousness of the importance of water as a vital factor for development.
89

d) Linkages between water-resource management plans and socioeconomic development plans
i) In most of the plans for water-resource management studied there has been no clear linkage with those for socioeconomic development. This lack of association is particularly observable in the need felt by the planners to project the demand for water in the medium- and long-term by resorting to the formulation of their own prospective models.
ii) In regions where socioeconomic growth has depended heavily on the control and use of water —as in arid or semi-arid zones or in flood-prone areas— it is noteworthy that the plans have concentrated on creating alternatives for exercising this control. Subsequently, and only when the restriction of water has reached its limits, have plans been undertaken for regional development. In these cases regional planning has been adapted and conditioned to the plans for water management.
iii) In some sector, especially those of energy and agriculture, the perfecting of demand projects has continued along with the selection and ranking of zones in which the projects can be established. In these cases the relationship between water management plans and development plans is more precise. The progress made in the formulation of plans for water resource management by sectors facilitates the improvement of this relationship.
iv) As long as there is a lack of instruments to improve co-ordination between socioeconomic development plans and water resource management plans, it is advisable that there should at least be a record kept of water supplies and demands —actual and projected— in each river basin or water-related region, including all the existing and proposed projects for harmonizing these supplies and demands. The permanent register of projects according to basins will at least help to avoid conflicts on the multisectoral use of water iii the region.
Despite the powerful reasons put forward in favour of planning, there are few signs that this had any significant influence on the policies for the development and management of water and water-related resources or on the application of these policies. Although there are no studies on the linkage of the national plans for water resource management with the decision-taking on policies and their application to the development and management of these resources, specific observations made on what has happened in the water sector in the region would support the opinion of the sceptics, outlined in the introduction to this paper, to the effect that the
90

plans are frequently not inserted in the decision-making process which determines the way in which renewable resources are administered in practice. These observations include the unco-ordinated use for a single purpose of the same water resource by independent users; the scant attention paid to questions which have a bearing on the degradation of the upper river basin; the great importance attached to new capital projects at the expense of the performance and maintenance of existing projects; the tendency to concentrate resources on large projects and to overlook opportunities for achieving a greater dispersion and mobilization of local initiative; the importance given to increasing the supply of water-related services without paying due attention to policies which regulate demand and stimulate an efficient use.
This study has insisted, on the basis of well-founded arguments, on the importance of the planning of water resources at all administrative levels. There must be integration between these levels and the planning itself must be integrated with that of other renewable resources; it is likewise necessary to establish concrete linkages with the national and regional plans for economic development. Very considerable resources are devoted to the planning of water use in the region, although it is far from clear whether the resulting plans lead to the adoption of more efficient decisions on the utilization and management of water from the standpoint of the objectives of economic and social development.
A systematic analysis needs to be made of: i) the way in which water resource planning is carried out; and ii) the relationship between the planning process and the decision-making process which determines, in the first place, the concrete policies aimed at harmonizing supply and demand in respect of water-related services, and, in the second place, the way in which these policies operate in practice for those in the community (intra- and inter-generational) who are winners or losers in the solution of the inevitable conflicts of interest.
"" The analysis of experiences proposed here is regarded as a dynamic process which, form the outset, would assume the participation of the "actors" in the planning of water use and in the formulation and application of a policy in that sector. The first step would consist of a set of national monographs-on the subject. The instruments for this stage would be horizontal co-operation through which a common methodology would be prepared with a group of local consultants from different countries in a short preparatory course. The local consultants, with the help of participants from all
91

the national sectors and international specialists, would carry out the different studies.
The results of this work would be assessed halfway through the period, and, if it were necessary to complement it, the studies carried out for the said purpose would be directed vertically, that is, to the detailed study of specific aspects, or horizontally to obtain a greater geographical spread in the region.
5. The next steps
Interest in planning the management of water resources in Latin America and the Caribbean has certainly been on the increase. This has been mainly due to the increasing conflicts in respect of its development and control. Besides, the rise in the demand for water and the growing difficulties in satisfying it with the hydraulic works conventionally used to obtain and control more water resources —which are becoming more scarce and distant and therefore more costly— have aroused the interest of the countries in improving the operation and maintenance of their already available water systems and in the better management and conservation of their surface and underground catchment areas. This alternative course is only recently being undertaken in many places and hence its effect is still very slight. In addition to the foregoing there is the increasing pressure to give more consideration to the interests of the inhabitants of the regions from which the water is obtained —especially those of the inhabitants of the upper basins and the basins in which large hydroelectric power stations are installed to "export" energy— coupled with those of organizations concerned for the incorporation of greater environmental considerations.
All this, in the present context of a scarcity of economic resources to facilitate new and large investments and of social pressure to provide more equitable access to resource allocation, compels the governments to take effective measures for the regulation of water use. In practice it can be seen that they have been doing this and it is to be hoped that the work will continue and that the experience accumulated will be transmitted from one country to another. To achieve this it is suggested that as a first step a network of horizontal co-operation should be established between the government agencies responsible for the development and conservation of water resources in the region with emphasis on the role of water as an essential resource for development and human life.
92

Part Two
WATER-RELATED NATURAL HAZARDS
This document is a revised version of document "The water resources of Latin America and the Caribbean: Water-Related Natural Hazards published by ECLAC under the symbol LC/L.4l5/Rev 1 28 December 1987. / • •>


Introduction
Natural hazards, understood as extreme natural events producing adverse impacts on man and the environment, and causing physical, ecological, economic and social damage, can be of geological or meteorological origin. Four phenomena —droughts, floods, wind-storms and earthquakes— are estimated to be responsible for more than 90% of all loss of life and damage to man and the environment caused by natural hazards.®^ Most water-related natural hazards are of meteorological origin, but there are exceptions, for example, floods caused by a dam failure as a result of an earthquake. It has been estimated that, worldwide, windstorms and floods led to much greater economic losses between 1980 and 1985 than earthquakes although individually earthquakes are more destructive and cause greater loss of life.
It is probable that the region has been affected by water-related natural hazards during all the history of human settlement. The occurrence of drought can be traced back to, at least, 1052 in the Valley of Mexico and in Brazil references to droughts occur in the earliest reports of European colonists.®® Contemporary, as can be seen from figure 11, the Americas suffer a greater number of hazard events than other regions of the world with the exception of Asia. Moreover, water-related hazards, windstorms and floods, are far more common than earthquakes. Not surprisingly, therefore, many areas of Latin America and the Caribbean are prone to natural hazards arising from extreme events related to water.
95

VO 0\
N u m b fl r
o f
n a t u r 0 1
d I B a B t
ZOO
175
I S O
125
1Q0
Figure 11 MAJOR WINDSTORMS, FLOODS AND EARTHQUAKES:
OCCURRENCE BY REGION, 1980-1985
ABIO AMERICAS Europe Africo
Source: Duaon Zupko, "Economic Impoi i of DiatEterB", UNDRO Newa, JonuoFy/Pebrutfy 19HS, p. 22.
Auatrolio Jt Dceonio

A. THE GEOGRAPHICAL DISTRIBUTION OF NATURAL HAZARDS
The geographical distribution of the occurrence of natural hazards varies within Latin America and the Caribbean in relation to both climate and relief. In general, apart from droughts, which occur in almost all areas of both Central America and the Caribbean, and South America, the relative seriousness of the types of hazards which prevail is as follows:
a) The countries of South America are most frequently affected by floods and land or mudslides induced by floods. In these countries in recent years on average for every 100 persons killed, injured or missing as a result of floods and landslides there was only one killed, injured or missing as a consequence of a windstorm (see annex 1).
b) In Central America and the Caribbean the most severe natural hazards are windstorms (tropical depressions, storms and cyclones or hurricanes), which cause about 50% of all disaster deaths.®® In these countries in recent years, on average for every 100 persons killed, injured or missing as a result of windstorms less than 19 people were killed, injured or missing as a consequence of floods or landslides (annex 1).
B. CHARACTERISTICS OF NATURAL HAZARDS
The damage caused by natural hazards depends on both their intensity (the speed of the wind, the intensity of the rainfall etc.) and their duration, as well as, the nature of the economic and social development in the affected area. Other things being equal, the impact of any natural hazard tends to be more damaging on smaller countries as the destruction from a single event may extend over the entire territory.
Different hazards, droughts, floods, windstorms etc., have different impacts on man and on the environment (table 9). In some cases, however, the impact of two hazards may be similar. For example, the consequences of windstorms and floods can be identical as flooding is a common companion of the storm surge.
97

Table 10
MATRIX OF MAIN ECONOMIC AND SOCIAL EFFECTS OF NATURAL HAZARDS
P r o b a b i l i t y
Wind-storms
Floods Droughts
I. Characteristics of natural hazards 1. Larger affected area 2. Longer duration
VH L
L L
VH VH
n. Damages 1. Industry
Agriculture Infrastructure (a) transport (b) water supply (c) waste disposal Population (a) hunger (b) contamination by
biological and chemical agents
(c) destruction of social infrastructure
2. 3.
4.
VH VH
VH VH
H
H
H
VH
VH VH
VH VH
H
H
VH
VH
L VH
L H H
VH
L
L
m . Main damage-causing factors
surge of water and
wind; torrential rain; see "Flood"
submer-gence;
surge of water
aridity high
tempera-ture
Source. This matrix was compiled party on the basis of material in "Salud ambiental con posterioridad a los desastres naturales", Publicación Científica No. 430, Pan American Health Organization, 1982.
Note : VH - probability is very high; H - probability is high; L - probability is low.
2837

1. Droughts
a) The nature of drought
There is no quantitative definition of drought thai is universally acceptable. In fact the definition of drought can vary according to the purpose for which the definition is required.®' Drought is a relative phenomena and may be defined as an abnormal period during which stream flows are inadequate to supply established uses under a given water management system.®® Drought differs from aridity which is a permanent state by its periodicity. The imbalance between water supply and water demand characteristic of drought can occur in both arid and humid areas. Drought is the most insidious of natural hazards in that it tends to develop slowly and can last for long periods even several years as in the northeast of Brazil.
The four main causes of drought are all operative in Latin America and the Caribbean:®®
i) Widespread and persistent atmospheric subsidence, which results from the general circulation of the atmosphere. Such subsidence tends to be created in subtropical latitudes, the major affected areas include the northeast of Brazil, northern Chile, southern Peru and northern Mexico.
ii) Localized subsidence induced by mountain barriers or other physiographic features. The area affected in Latin America and the Caribbean is limited to Southern Argentina since the phenomenon occurs only in the middle latitudes.
iii) Absence of rain making disturbances, causing dry weather even in the areas of moist air. This phenomena gives rise to the long dry summer of Central Chile and is the cause of droughts that frequently affect the highlands of Peru.
iv) Absence of humid air streams. Some minor areas of South America —northeastern Argentina and neighbouring parts of Bolivia and Paraguay, for example— are quite remote from sources of humidity.
The four main types of drought, permanent, secular, seasonal and contingent, are found in Latin America and the Caribbean:^"
i) The major regions of Latin America and the Caribbean that suffer from permanent drought are: Baja California and the north and northeast regions of Mexico; the Guajira region of Colombia; a broad coastal strip on the Pacific Ocean extending from latitude 4° south in northern Peru to approximately latitude 28° south in Chile, which includes the driest area in the world —the Atacama desert; a large area of southern South America, including part of the Bolivian
99

plateau, an extensive tract of the Chaco (Bolivia, Paraguay and Argentina), and the northeast, central-west and extreme south areas of Argentina.
ii) Secular drought, in which a sequence of drought years alternate with years of adequate rainfall, occurs in tropical sub-humid regions. This type of drought is prevalent in the northeast of Brazil where it occurs with a five to seven year sequence. The most seriously affected area covers about 1.0 million km^ and has a population of 26 million.^^ In this century alone sixteen years have been characterized by droughts.'^
iii) Seasonal drought occurs mainly in semi-arid or sub-humid climates with a short wet season.
iv) Contingent drought is an infrequent water shortage which may occur in a part of the region.
b) The impact of drought on man and the environment
Droughts are frequent both in Latin America and the Caribbean: in recent years significant droughts have occurred in Bolivia, Brazil, Chile, Costa Rica, Cuba, El Salvador, Guatemala, Haiti, Honduras, Jamaica, Mexico, Nicaragua, and Peru among other countries.
Drought produces severe impacts on both man and the environment. Its effect slowly accumulates and has a tendency to persist for extended periods. The paramount environmental consequence of drought is desertification, although this is a complex process which is a result of several cumulative factors in addition to drought including salinization and poor soil management among others. ® The area affected by desertification in South America is shown in table 10.
The more immediate consequences of drought include the following:
i) Famine and shortage of drinking water. For example, in 1985, as a result of the prolonged drought, water rationing was imposed in Havana, Cuba. ^ Severe drought which in 1986-1987 affected EI Salvador has been reported to have caused food shortages leaving 40 000 rural families without food. ® Despite all the measures taken to mitigate the impact of drought in the northeast of Brazil, more than 25 million people can still be affected.
ii) Disease from the use of contaminated water, death of cattle, lack of water for waste disposal, malnutrition, etc., also take their toll. For example, the 1982-1983 drought in Bolivia and Peru led to an increased incidence of gastrointestinal and other diseases in the population of affected areas. ®
100
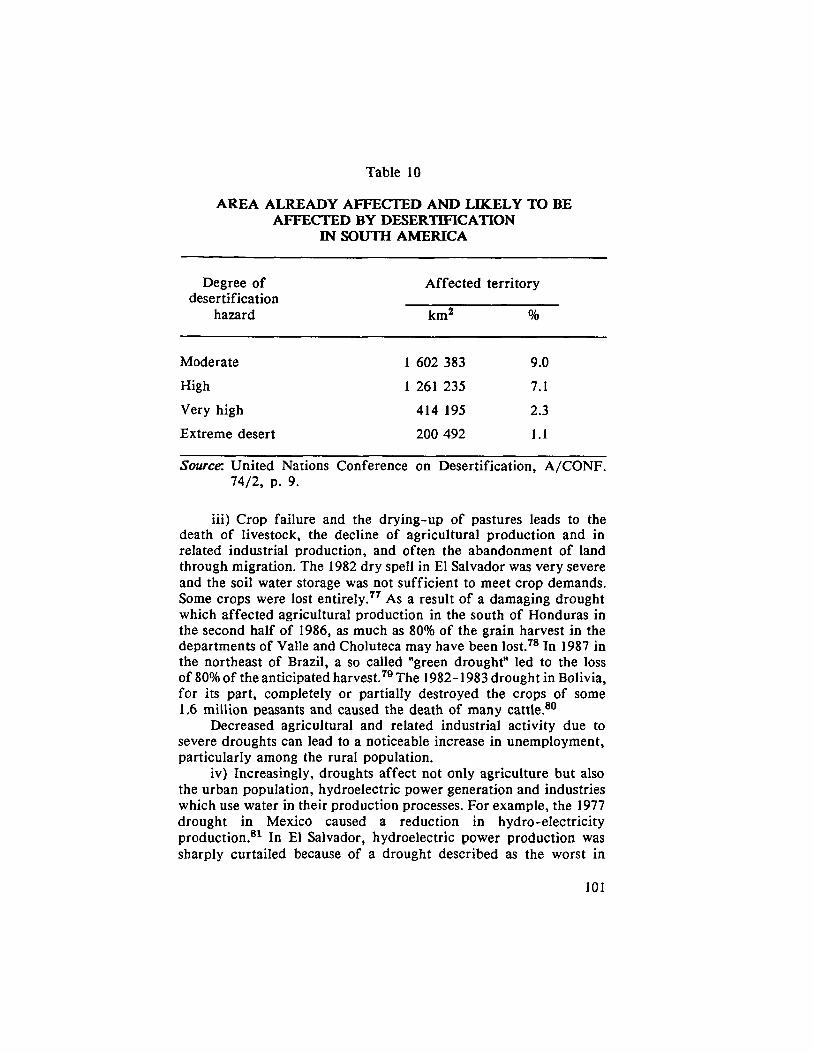
Table 10
AREA ALREADY AFFECTED AND LIKELY TO BE AFFECTED BY DESERTIFICATION
IN SOUTH AMERICA
Degree of Affected territory desertification
hazard km^
Moderate 1 602 383 9.0
High 1 261 235 7.1
Very high 414 195 2.3
Extreme desert 200 492 1.1
Source: United Nations Conference on Desertification, A/CONF. 74/2, p. 9.
iii) Crop failure and the drying-up of pastures leads to the death of livestock, the decline of agricultural production and in related industrial production, and often the abandonment of land through migration. The 1982 dry spell in El Salvador was very severe and the soil water storage was not sufficient to meet crop demands. Some crops were lost entirely.^' As a result of a damaging drought which affected agricultural production in the south of Honduras in the second half of 1986, as much as 80% of the grain harvest in the departments of Valle and Choluteca may have been lost. ® In 1987 in the northeast of Brazil, a so called "green drought" led to the loss of 80% of the anticipated harvest. ® The 1982-1983 drought in Bolivia, for its part, completely or partially destroyed the crops of some 1.6 million peasants and caused the death of many cattle.®"
Decreased agricultural and related industrial activity due to severe droughts can lead to a noticeable increase in unemployment, particularly among the rural population.
iv) Increasingly, droughts affect not only agriculture but also the urban population, hydroelectric power generation and industries which use water in their production processes. For example, the 1977 drought in Mexico caused a reduction in hydro-electricity production.®^ In El Salvador, hydroelectric power production was sharply curtailed because of a drought described as the worst in
101

thirty years and as a result electricity rationing was instituted.®^ Droughts also forced Guatemala and Panama to restrict electricity consumption.®®
Droughts can adversely affect river transport. For example, in Colombia during periods of intense droughts the depth of certain waterways belonging to the Magdalena river basin drastically decreases hampering navigation.®^
The detrimental effect of droughts may be aggravated through the lack of water for the dilution and transport of wastes. This is particularly important in the region since a considerable part of population has no access to a protected source of drinking water (14% of urban population and 55% of rural population)®® and practically all wastes are discharged into the nearest water body without prior treatment.
v) Drought degrades and removes the vegetation cover, induces soil erosion, kills wildlife, destroys some land and water-based ecosystems, etc. It was estimated that during the 1982-1983 drought in Bolivia, 4.8 million hectares of pasture were destroyed by cattle and that some 40% of this area would not recover even under normal meteorological conditions.®®
2. Windstorms
Windstorms are widespread in Latin America and the Caribbean, but the region which suffers most destruction from this hazard is the Caribbean and adjacent areas of Central America and Mexico. In most years this region suffers major economic damage and serious loss of life from tropical cyclones or hurricanes. The discussion of windstorms will concentrate, therefore, on the impact of tropical cyclones on the Caribbean.
a) The nature of tropical cyclones
Tropical cyclones are very intense cyclones, almost perfectly circular in form that develop over warm oceans. In their most extreme manifestation, as a hurricane, wind speeds exceed 118 kilometres per hour and in the region of maximum winds surrounding the eye the speed can reach 260 kilometres per hour. They are the most powerful wind systems found on the globe.®^ Even at lower intensities defined as tropical depressions or tropical storms, tropical cyclones may cause considerable damage.
102
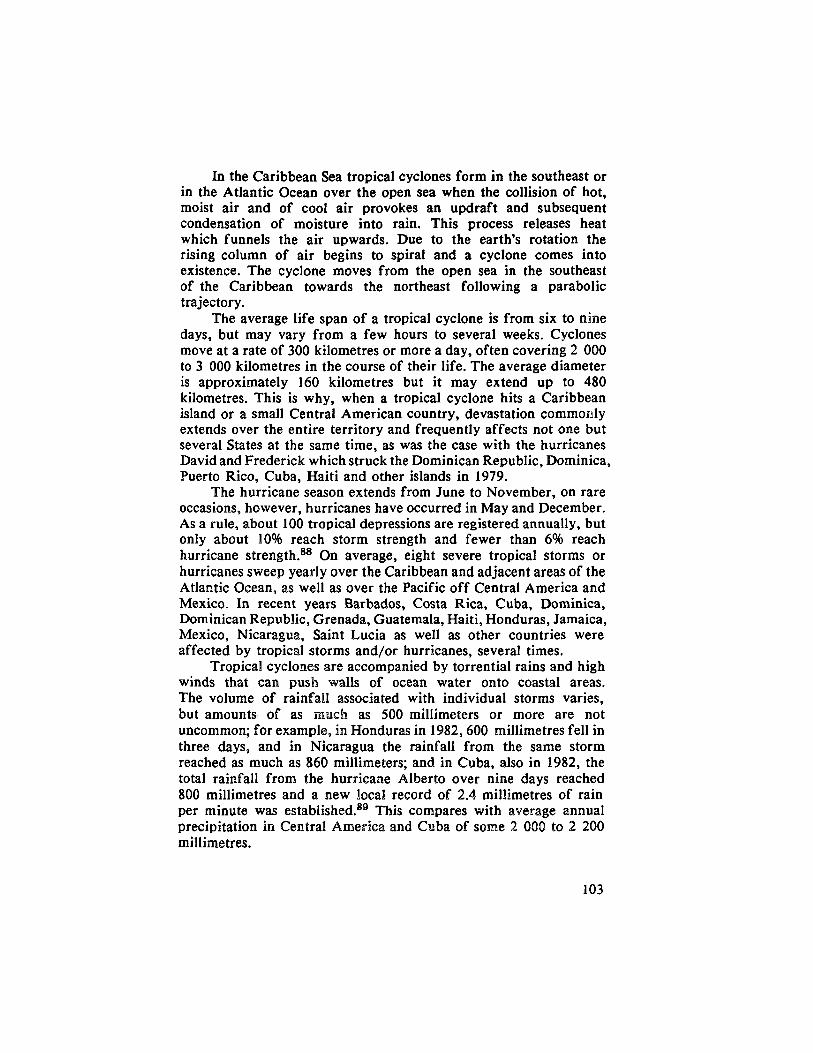
In the Caribbean Sea tropical cyclones form in the southeast or in the Atlantic Ocean over the open sea when the collision of hot, moist air and of cool air provokes an updraft and subsequent condensation of moisture into rain. This process releases heat which funnels the air upwards. Due to the earth's rotation the rising column of air begins to spiral and a cyclone comes into existence. The cyclone moves from the open sea in the southeast of the Caribbean towards the northeast following a parabolic trajectory.
The average life span of a tropical cyclone is from six to nine days, but may vary from a few hours to several weeks. Cyclones move at a rate of 300 kilometres or more a day, often covering 2 000 to 3 000 kilometres in the course of their life. The average diameter is approximately 160 kilometres but it may extend up to 480 kilometres. This is why, when a tropical cyclone hits a Caribbean island or a small Central American country, devastation commonly extends over the entire territory and frequently affects not one but several States at the same time, as was the case with the hurricanes David and Frederick which struck the Dominican Republic, Dominica, Puerto Rico, Cuba, Haiti and other islands in 1979.
The hurricane season extends from June to November, on rare occasions, however, hurricanes have occurred in May and December. As a rule, about 100 tropical depressions are registered annually, but only about 10% reach storm strength and fewer than 6% reach hurricane strength.®® On average, eight severe tropical storms or hurricanes sweep yearly over the Caribbean and adjacent areas of the Atlantic Ocean, as well as over the Pacific off Central America and Mexico. In recent years Barbados, Costa Rica, Cuba, Dominica, Dominican Republic, Grenada, Guatemala, Haiti, Honduras, Jamaica, Mexico, Nicaragua, Saint Lucia as well as other countries were affected by tropical storms and/or hurricanes, several times.
Tropical cyclones are accompanied by torrential rains and high winds that can push walls of ocean water onto coastal areas. The volume of rainfall associated with individual storms varies, but amounts of as much as 500 millimeters or more are not uncommon; for example, in Honduras in 1982, 600 millimetres fell in three days, and in Nicaragua the rainfall from the same storm reached as much as 860 millimeters; and in Cuba, also in 1982, the total rainfall from the hurricane Alberto over nine days reached 800 millimetres and a new local record of 2.4 millimetres of rain per minute was established.®® This compares with average annual precipitation in Central America and Cuba of some 2 000 to 2 200 millimetres.
2842

b) The impact of tropical cyclones on man and the environment
The heat energy released per day by an average cyclone can be compared to that released from about 400 hydrogen bombs of 20 megatons each.®" Hurricane "Hazel" in October, 1954 was dissipating kinetic energy at rate equivalent to one-quarter of that required to maintain the circulation of the atmosphere north of latitude 30° N.® It is hardly surprising, therefore, that when a tropical cyclone hits a heavily populated area damages are likely to be enormous.
The destruction caused by tropical cyclones are due to three factors: the high winds, the storm surge and the ensuing floods caused by the associated torrential rain. The most destructive of the three is the rainstorm-surge combination in coastal areas, which gives rise to catastrophic flooding. The storm surge is a rapid rise in the sea level produced by the hurricane winds and falling barometric pressure.
Some of the biggest tropical cyclones that have struck Latin American and Caribbean countries in recent years include: hurricane "Fifi" (1974) which caused an estimated 6 000 to 8 000 deaths in Honduras;®^ hurricane "David" (1979) devastated most of the island of Dominica and large parts of the Dominican Republic, killing over 1 400 people, injuring 6 000, leaving more than 260 000 homeless and causing damage estimated at US$830 million; in 1980 a hurricane ripped through Saint Lucia, southwestern Haiti and northern Jamaica, leaving 250 dead, 205 000 homeless, 525 000 deprived of their normal source of food and US$530 million damage to housing, infrastructure and agriculture;®® and hurricane "Kate" (1985) caused total damages estimated at US$1 087 million and forced the evacuation of some 715 000 people in Cuba. Between 1960 and 1981 Mexico and Haiti were the countries most affected by hurricanes, the first by 14 and the second by six, resulting 1 560 and 5 800 deaths, respectively.®®
More recently, in September 1988, hurricane "Gilbert" affected several Central American and Caribbean countries, including Cuba, Dominican Republic, Jamaica, Haiti, and Mexico. In Jamaica, "Gilbert" caused 45 deaths, forced evacuation of approximately 1 million persons and left close to US$1 000 million in damages.®® A month later, in October 1988, hurricane "Joan" passed over Nicaragua and caused 148 deaths and about US$840 million in damages. Distribution of these losses among different social and economic sectors is shown in figure 12.®^
Tropical cyclones not only cause human deaths and injuries and destroy property, but also strip cultivated land in the coastal area of its vegetation cover, render the land sterile by salinity and
104

o
Figure 12 NICARAGUA: DAMAGE CAUSED BY HURRICANE JOAN, 1988
10Q r.
so K
60 Z.
4D X
ZD K
0 K Totd Direct Indirect
Social sectors
Agriculture and livestock ( ind . natural resources)
Other productive sectors
Infrastructure
^ Emergency expenditures
Source: D t m m e cojaed b/ hum cone J con in Nicoroguo. Its effectB on economic dowalopmenl ond living conditions, ond requirementa rihobintotion ond reconatructicn, LC/G.154Í Z December laSH, p. 2S.
for

subject it to soil erosion. For example, when in June 1982 Cuba was affected by hurricane "Alberto" and the tropical storm that followed it, an estimated 137 000 hectares of cultivated fields were totally lost or seriously damaged.®®
The storm surge caused by cyclones can erode up to 9-15 metres of beach within an hour. Twelve hours of pounding by such waves is estimated to be equal to a century of normal wave action. This is likely to represent a particular concern for Caribbean countries since many of them suffer from coastal erosion. For example, both hurricanes "David" (1979) and "Klaus" (1984) were reported to have caused coastal erosion in Dominica.®®
Apart from the immediate damage, the long-term consequences of tropical cyclones may also be serious. Large expanses of stagnant water and swamps can be left after a cyclone, and these not only impede reconstruction but also offer breeding grounds for vectors of debilitating diseases such as dengue fever and malaria. For example, in Cuba following the 1982 tropical storm a dengue fever epidemics was feared because ideal breeding grounds for the Aedes Aegypti mosquito had been created in the large expanses of stagnant water left behind as the floods receded. However, this particular epidemics was avoided partly with the help of applications of abate-malathion insecticide.^"" Adverse health consequences may be aggravated by, the destruction of social infrastructure, housing, water supply and sewerage systems and health facilities. In Dominica, the passage óf Hurricane David left 78% of the population homeless and destroyed almost the entire medical infrastructure.^"^ More recently, hurricane "Joan" left similar damage in its wake around Bluefields, Nicaragua. It was estimated that the total damage to the housing sector was equivalent to US$296 000 OOO.i"
Nevertheless, tropical cyclones may also have certain beneficial effects:
i) They bring increased rainfall, because cyclones lift and evaporate sea water and deposit it as salt free rain.
ii) Improved fishing results from the upwelling of nutrient rich water along or near the storm track. Phytoplankton mass at the surface before and after a severe hurricane in the Gulf of Mexico has been found to have doubled. In other areas large increases have been observed in the lobster population after rough seas and high tides due to hurricanes.^"'
106
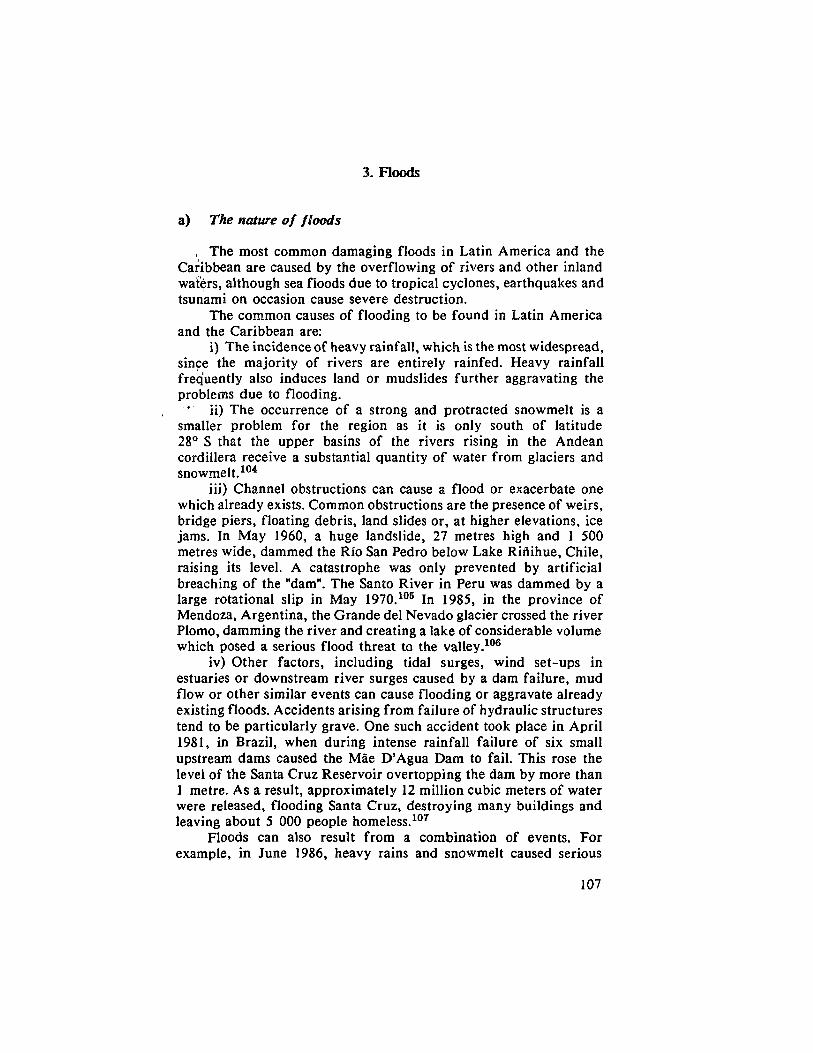
3. Floods
a) The nature of floods
, The most common damaging floods in Latin America and the Caribbean are caused by the overflowing of rivers and other inland waters, although sea floods due to tropical cyclones, earthquakes and tsunami on occasion cause severe destruction.
The common causes of flooding to be found in Latin America and the Caribbean are:
i) The incidence of heavy rainfall, which is the most widespread, since the majority of rivers are entirely rainfed. Heavy rainfall frequently also induces land or mudslides further aggravating the problems due to flooding.
' ii) The occurrence of a strong and protracted snowmelt is a smaller problem for the region as it is only south of latitude 28° S that the upper basins of the rivers rising in the Andean Cordillera receive a substantial quantity of water from glaciers and snowmelt.
iii) Channel obstructions can cause a flood or exacerbate one which already exists. Common obstructions are the presence of weirs, bridge piers, floating debris, land slides or, at higher elevations, ice jams. In May 1960, a huge landslide, 27 metres high and 1 500 metres wide, dammed the Rio San Pedro below Lake Riñihue, Chile, raising its level. A catastrophe was only prevented by artificial breaching of the "dam". The Santo River in Peru was dammed by a large rotational slip in May 1970. °® In 1985, in the province of Mendoza, Argentina, the Grande del Nevado glacier crossed the river Plomo, damming the river and creating a lake of considerable volume which posed a serious flood threat to the valley. "®
iv) Other factors, including tidal surges, wind set-ups in estuaries or downstream river surges caused by a dam failure, mud flow or other similar events can cause flooding or aggravate already existing floods. Accidents arising from failure of hydraulic structures tend to be particularly grave. One such accident took place in April 1981, in Brazil, when during intense rainfall failure of six small upstream dams caused the Mae D'Agua Dam to fail. This rose the level of the Santa Cruz Reservoir overtopping the dam by more than 1 metre. As a result, approximately 12 million cubic meters of water were released, flooding Santa Cruz, destroying many buildings and leaving about 5 000 people homeless.
Floods can also result from a combination of events. For example, in June 1986, heavy rains and snowmelt caused serious
107

flooding in Central Chile, destroying more than 1 000 homes and causing losses estimated at US$22.3 million. "®
The character of flooding is generally, but not exclusively, determined by the size of the catchment tributary. The Paraguay River basin is so vast that periods of flood tend to be very long. In the last 25 years, in no major flood in the river has the period between flood crest and flood peak been less than 15 days at Santa Fe, Argentina, and in most floods it has been closer to 30 days.
In contrast, short rivers, such as those of the Pacific watershed, are more commonly associated with "flash floods". Such floods are particularly dangerous because very little time elapses between the start of the flood and the peak discharge and quite often between the onset of the storm and the arrival of the flood wave. Such flooding is not, however, limited to the Pacific coast, in January 1983, flash floods caused by torrential rains claimed 51 lives and left 2 000 people homeless around the town of Belo Horizonte in the southeast of Brazil. "®
b) The impact of floods on man and the environment
Floods are very frequent in Latin America and the Caribbean. Since 1979 floods have been reported in Argentina, Barbados, Bolivia, Brazil, Chile, Colombia, Cuba, Dominican Republic, Ecuador, El Salvador, Guatemala, Haiti, Honduras, Jamaica, Mexico, Nicaragua, Paraguay, Peru, Venezuela as well as other countries. The number of significant flood events and the number of deaths have increased in recent years (see figures 13 and 14). Of the twenty countries in the world with the highest number of deaths from floods between 1977 and 1984, seven are Latin American.^^°
In areas of high density of human activity, particularly urban areas, and also in regions of intensive agriculture where crops cannot withstand prolonged submergence, damage from floods can be catastrophic. In several Latin American countries a significant part of the population (see table 11), and hence of agriculture and industry, are located in areas exposed to catastrophic floods.
The main impact of floods on economic and social development includes the following:
i) Human deaths and injuries caused either directly by flooding or indirectly, through flood-related land or mudslides, destruction of buildings, etc. The number of deaths and injuries may vary considerably according to density of population, the pattern of economic and social infrastructure in the affected area, as well as the quality of the warning system, the speed and intensity of flooding
108

o VO
Figure 13 NUMBER OF SIGNIFICANT FLOOD EVENTS INVOLVING LOSS
OF LIFE BY CONTINENTS, 1977-1984 1 6
1 4
1Z
1 0
\ \
/"I \ \
'N. y "v
\ >1.
' n ^ ^
Latin America and the Caribbean
Asia
Europe
Africa
North America
Australasia
1 8 7 7 1 S 7 a 1S7S igSQ 1SB1 igB2 1SBJ 1SS4 Source: A.A. Khori, Improved offícíenty in the monogoment of ntrturol hozfrds; flootb, MDPFU/SYMP/7, November 19B6, p. 2.

1QQQQ
1 0 0 0
1QQ .
Figure 14 AVERAGE ANNUAL LOSS OF LIFE IN FLOODS
SOUTH AMERICA CENTRAL AMERICA AND THE CARIBBEAN Olhw ragitma (excluding USSR)
Source: A.A. Khcn, Improved efficiency in the monogement of noturol hozcrda: floocfe, MDPFU/SYMP/7, November 10Sfi, p. 17.

Table 11
LATIN AMEmCA AND THE CARTOBEAN, SELECTED COUNTRIES, APPROXIMATE PERCENTAGE OF
POPUI.ATION LIVING IN AREAS EXKiSED TO CATASTROPHIC FLOODS
Country Percentage of
Population
Argentina 8 - 1 Bolivia 7 Brazil 15 Costa Rica 3 Guatemala 15
Source: K. Szestay, "River Basin Development and Water Management", Water Quality Bulletin. Vol. 7, No. 4, October 1982, p. 157.
and other factors. Floods have caused many deaths in Latin America and the Caribbean in recent years for example: in El Salvador (September 1982) —600 dead—, in Guatemala (September 1982) —600 dead—, in Honduras (September 1982) —200 dead—, in Ecuador (1982-1983) —300 dead—, in Peru (1982-1983) —233 dead—, in Colombia (1984) —152 dead—, and in Brazil (January, March, 1985) —200 dead.^^^ There are, however, no reliable statistics on a region-wide basis. Estimates suggest that there were, at least, 4 700 deaths from flooding between 1960 and 1981 and 2 700 between 1977 and 1984 (table 12).
ii) Flooding leads to epidemics of water-borne and water-related diseases. The floods in Bolivia, Ecuador and Peru in 1982-1983 were the cause of outbreaks of malaria, various gastrointestinal and other diseases in several areas.^^^ In February 1988, an outbreak of the parasitic disease leptospirosis, carried by contaminated water, claimed 18 lives and left 412 ill in the state of Rio de Janeiro, Brazil.
iii) The destruction of industrial and agricultural buildings, social infrastructure, manufactured products, the contamination and disruption of agricultural production and other damages.
I l l

Table 10
ESTIMATES OF DEATHS FROM FLOODS IN SELECTED LATIN AMERICAN
COUNTRIES
Country
World Resources Institute
1960 - 1981
Number of floods
Number of deaths
Khan 01.01.1977 - 31.12.1984
Number Percentage of of deaths global loss
of lives in floods
Argentina 9 200 n.a. n.a. Bolivia 13 160 276 1.1% Brazil 28 2 850 288 1.2% Colombia 10 600 517 2.1% Costa Rica 8 30 n.a. n.a. Ecuador 7 20 330 1.3% El Salvador n.a. n.a. 700 2.9% Mexico 11 370 180 0.8% Panama 6 100 n.a. n.a. Peru 9 350 435 1.8%
Total 101 4 680 2 726 11.2%
Source : League of Red Cross and Red Crescent Societies; U.S. Office of Foreign Disaster Assistance, cited from World Resources 1986, World Resources Institute, International Institute for Environment and Development, p. 306; and A.A. Khan "Flood management: alternative measures for improvement". Water Resources Journal, June 1987, p. 60.
n.a. = information not available.
The total economic cost of floods can be enormous and spread throughout the whole economy. Estimates have been made of the distribution of the more than US$600 million losses caused by the 1982-1983 flood among the different social and economic sectors in Ecuador (figure 1 T h e 1982 floods in Nicaragua caused damages
112

100 X
a o K
a o ^
4-0 %
2 0 ÍS
Figure 15 ECUADOR: DAMAGES CAUSED BY FLOODS, 1982-1983
Social sectors
a Total • t rac t I n d i r a o l
Agriculture and livestock
I Souree: Tha nctural j j B O B t g ^ of 1 S a Z - i g a 3 in Bolivio, Ecuodor and PanJ, E / C E P A L / a 1274 23 Jonuofy 1034, p. 11.

estimated to be equivalent to 20% of the 1981 Gross National Product. ^® The floods which affected the Pampa region, particularly the Province of Buenos Aires, Argentina, during the last quarter of 1985 and intermittently through March 1986, caused losses to crops, farm infrastructure and services estimated at more than US$1.3 thousand million. ^®
Particularly grave environmental consequences tend to be caused by flash river flooding, extreme sea floods or flooding in normally arid zones. In addition, in many countries of the region the destructive impact of floods is aggravated by peculiarities of relief and soil characteristics, and many are accompanied by land or mudslides which not only produce additional damage but also impede rescue operations and reconstruction. It has been estimated that in recent years at least 20% of all floods in Latin America and the Caribbean were accompanied by landslides (see annex 1).
Flooding can be a beneficial process, particularly for some agricultural or pastoral uses. An example is afforded by the Apure flood plains around San Fernando, Venezuela, where major efforts have been made to retain floods so as to permit a longer growing season for natural pastures to support livestock production.
4. Land and mudslides
Land and mudslides are generated either by flood causing events, such as torrential rains or strong and protracted snowmelt, or by seismic and volcanic activity. The presence of populated areas in zones affected by floods, deforestation and other factors increase both the risk of landslides and the damage caused.
Mudflows associated with the eruption of volcanoes with large crater lakes for example, the Saint Vincent Soufriere Volcano on St. Vincent in the West Indies, or with massive accumulation of snow on their slopes are far more destructive than flood associated slides because of their high speed and large volume. "Secondary" mudflows can develop on volcanoes when strong rain falls on slopes covered by unconsolidated volcanic ash and may represent a hazard during periods of heavy rain both during and several years after an e r u p t i o n . ^ ^ ^
The most severe volcanic mudflow of recent years was provoked by the eruption of the Nevado del Ruiz Volcano in the central Cordillera of the Colombian Andes on 13 November 1985. As a result of the eruption of red-hot pumice blocks, the snow and ice at the peak melted, provoking a mudslide or lahar consisting of mixture of water, pumice and soil. This slide descended along the channels of
114

the Azufrado and the Lagunilla rivers which were already swollen by heavy rains, caused the collapse of a natural dam and the ensuing flood swept away the town of Armero, located 45 kilometres from the crater. ^® This mudslide is estimated to have killed 23 000 people, 90% of the population of Armero, injured 5 000 and displaced thousands more. In total, some 200 000 people were affected by the disaster. ^® Fortunately, such events are rare, although in 1845 the eruption of the same volcano caused an avalanche and giant mudflows which killed over 1 000 people.^^"
Although land and mudslides induced by flood causing factors are not usually so devastating as volcanic ones, they are much more widespread and frequent. In recent years, such slides have been reported to have occurred in Argentina, Brazil, Chile, Colombia, Ecuador, Mexico, Peru, and Venezuela. Landslides are particularly destructive in urban areas. A mudflow in the northwestern area of San Salvador killed 350 people in 1982 and similar disasters struck Petropolis, Brazil and Caracas in the last two years.
Landslides can induce large waves where steep slopes abut the sea, lakes, rivers or reservoirs. Landslide caused waves on Lake Rupanco, Chile in 1960 were reported to have caused severe damage to settlements and fields and even some loss of life. ^^
5. Tsunamis
Tsunamis are tidal waves produced by the sudden displacement of a large column of water usually due to either an earthquake or a volcanic eruption below or at sea level. Both earthquakes and volcanic eruptions have been the cause of tsunamis in Latin America and the Caribbean. In the eastern Caribbean, four submarine volcanoes have been reported active in historic times, and there may be others. ^^ The west coast of South and Central America faces the Pacific Ocean which, as a result of high volcanic and seismic activity, is the most frequent scene of tsunamis —on average 2-3 tsunamis have been observed annually in recent decades, however, the majority did not result in damage. ^^
Tsunamis spread in all directions from their point of origin and may reach a speed of 1 000 kilometres per hour in the deep ocean. The giant destructive capacity of tsunami is derived from the fact that the height of the waves increases considerably in shallow coastal areas reaching in extreme cases as much as 20 or 30 metres. The most destructive tsunamis recorded occurred from several decades to more than a century ago. The worst tsunami known to have hit the coast of Peru was triggered by the 1746 earthquake in Lima. It
115

swept over the port of Callao (out of a population of 5 000 only 200 survived) and up to 1.5 kilometres inland. In August 1868, a tsunami affected the area adjacent to the city of Arica, Chile. In 1906 a tsunami caused 400 dead and destroyed 500 houses in the town of Tumaco in Colombia. In May 1960, a tsunami caused several deaths in Chile.127
C. MEASURES FOR THE MITIGATIQN OF NATURAL DISASTERS
In recent decades, the governments of the countries of Latin America and the Caribbean have recognized the need to take measures to reduce the social and economic consequences of natural hazards. These efforts have, at least, ameliorated the extent of the damage caused by natural hazards. Such measures, in themselves are costly, but represent only a small fraction of the economic losses caused through natural disasters.
Measures for the mitigation of natural disasters can be classified as preventive, planning and preparedness measures which can be further divided into two broad groups:
a) Structural or engineering. b) Non-structural measures.
1. Structural measures
A number of structural concepts have been evolved as means of preventing or reducing the damage caused by natural hazards, including: ^®
a) Confinement (flood walls, levees, etc.). b) Detention (landslide retaining walls, flood control dams, etc.). c) Dissipation (wind breaks, sea walls, breakwaters, etc.X d) Diversion (avalanche diversion sheds, flood by-pass channels,
diversion of mudflows, etc.). Structural measures of flood-control have been adopted to a
certain extent in many river basins in Latin America and the Caribbean. The most widely diffused measure is the construction of dykes or containing walls to control the river course and prevent overbank flooding: for example, many of the Pacific coast rivers of Peru have been dyked; in Brazil levees, floodwalls, sluicing canals and other works are commonly used to protect towns; ^ the lower course of the River Guayas in Ecuador was dyked in 1976; and, the containing walls of the River Mapocho in Santiago, Chile, were
116

extended into the upper suburbs after the 1982 flood."" In Venezuela, flood control structures have been constructed for the protection of the towns of Caracas, Maracaibo, Charallave, Morón, and also on the rivers of Apure, Arauca, as well as in other areas. ^^
In 1984, in Latin American and Caribbean countries there were some 257 large dams providing a total reservoir storage capacity of 215 000 million cubic metres destined wholly or in part for flood control. This represents 19% of all dams in the region and 33% of their storage capacity. Most frequently, flood-control storage is provided as part of multi-purpose dams built for irrigation, hydro-electricity production or drinking water supply, as well as flood control. Dams constructed exclusively for flood control are relatively rare. The distribution of flood-control dams by countries and major river basin is shown in figure 16.
Several structural measures may be used for flood-control in different parts of a river basin, for example, reservoirs in the upper basin and containing walls in the lower.
To reduce the impact of droughts, efforts have been concentrated on the expansion of irrigation through construction of storage reservoirs, groundwater wells and the related water distribution systems. The area under irrigation has increased from 8 403 000 hectares in 1961-1965 to 14 707 000 hectares in 1985. The increase is particularly notable in the Caribbean where the area under irrigation has more than doubled. In Latin America and the Caribbean the area under irrigation has been growing at a higher rate than in the world as a w h o l e . R e s e r v o i r storage capacity behind large dams for irrigation increased considerably in the last two decades, at an average annual rate of 6.3% between 1966 and 1985.^'^ The development of irrigation in drought-prone areas is likely to continue in the future, for example, a five year Irrigation Programme for the Northeast was enacted in Brazil in 1986. It is proposed under this programme to increase the area under public and private irrigation in the northeast by 1 000 000 hectares by 1990.
Apart from traditional irrigation systems based on reservoirs and wells, other methods also have been applied to counteract drought. Not surprisingly, this is particular to the Northeast of Brazil. For example, pot-and-capsule irrigation systems; subterranean sand-trap dams; so called "salvation" dams, small reservoir systems designed for a sloping area leading to a cultivation area at the bottom, manually filled porous earthen pots, relatively inexpensive drip and sprinkler irrigation systems have been tried among others. In a number of countries experiments have been made in tapping unconventional water sources. For example, in Argentina, Bolivia, Brazil, Chile, Mexico and Peru investigations are being made into the direct
117

00 Figure 16 LATIN AMERICA AND THE CARIBBEAN: STORAGE CAPACITY
BEHIND LARGE DAMS BUILT FOR FLOOD-CONTROL PURPOSES
By country
Mexico
Argentina
Brazil
Other countries Venezuela
I Source: Intamolioniil CommÍHBÍon on Lorga Doma ( ICOLD).
Other basins
Brazil north-east
By major river basin
Plotn
Pampa
San Freneiaco
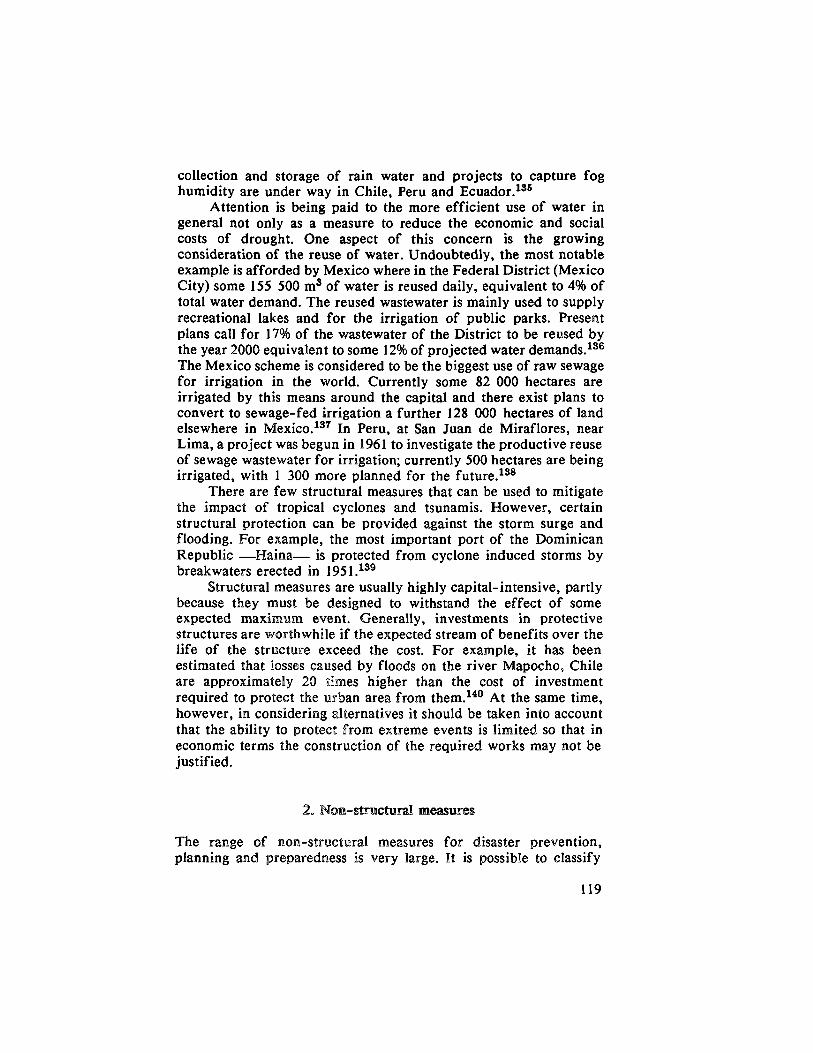
collection and storage of rain water and projects to capture fog humidity are under way in Chile, Peru and Ecuador.^'®
Attention is being paid to the more efficient use of water in general not only as a measure to reduce the economic and social costs of drought. One aspect of this concern is the growing consideration of the reuse of water. Undoubtedly, the most notable example is afforded by Mexico where in the Federal District (Mexico City) some 155 500 m® of water is reused daily, equivalent to 4% of total water demand. The reused wastewater is mainly used to supply recreational lakes and for the irrigation of public parks. Present plans call for 17% of the wastewater of the District to be reused by the year 2000 equivalent to some 12% of projected water demands. ®® The Mexico scheme is considered to be the biggest use of raw sewage for irrigation in the world. Currently some 82 000 hectares are irrigated by this means around the capital and there exist plans to convert to sewage-fed irrigation a further 128 000 hectares of land elsewhere in Mexico.^®' In Peru, at San Juan de Miraflores, near Lima, a project was begun in 1961 to investigate the productive reuse of sewage wastewater for irrigation; currently 500 hectares are being irrigated, with 1 300 more planned for the future.
There are few structural measures that can be used to mitigate the impact of tropical cyclones and tsunamis. However, certain structural protection can be provided against the storm surge and flooding. For example, the most important port of the Dominican Republic —Haina— is protected from cyclone induced storms by breakwaters erected in 1951. ®^
Structural measures are usually highly capital-intensive, partly because they must be designed to withstand the effect of some expected maximum event. Generally, investments in protective structures are worthwhile if the expected stream of benefits over the life of the structure exceed the cost. For example, it has been estimated that losses caused by floods on the river Mapocho, Chile are approximately 20 times higher than the cost of investment required to protect the urban area from them.^^° At the same time, however, in considering alternatives it should be taken into account that the ability to protect from extreme events is limited so that in economic terms the construction of the required works may not be justified.
2. Non-structural measures
The range of non-structural measures for disaster prevention, planning and preparedness is very large. It is possible to classify
119

those most commonly applied in Latin America and the Caribbean into the following manner:
i) Prevention measures including warning systems, land-use controls, building regulations and disaster-related education and training;
ii) Planning to reduce the disaster-related impacts of natural hazards, such as vulnerability analysis of settlements and infrastructure and consideration of the impact of hazard-related disasters on long-term development decisions;
iii) Preparedness in the form of the adoption of measures to organize and facilitate emergency relief and rescue operations including regional co-operation for disaster mitigation.
a) Warning systems
Warning systems are indispensable for effective action to mitigate disasters caused by natural hazards. Warning systems are most effective with hazards that can be detected at an early stage in their existence and whose subsequent history can be monitored with a reasonable degree of accuracy. This is the case with some floods and tropical cyclones, when the expected arrival time and force can be accurately predicted within 24 hours of their appearance. It is common, however, for warning systems and other hydrological and meteorological networks to suffer severe damage during disasters. For example, as a direct result of hurricane Gilbert, the hydro-meteorological network and the radar tracking stations were destroyed in Jamaica. '*^ Warning systems are particularly important for tsunamis, as there are no known means of prevention and little possibility for structural protection.
Forecasting, prediction and warning measures in Latin America and the Caribbean are usually undertaken by national meteorological networks and civil defence organizations. Some countries have installed fairly sophisticated warning and forecasting systems, for example, real time flood forecasting systems.Examples of national forecasting and warning systems are afforded by the System of Flood Alert for the Federal Capital (Argentina) and the Pilot System of Flood and Drought Alert for the river Guaire (Venezuela). '*® In Brazil, a National System of Warning against Floods is in operation, initially, in those river basins with the most serious flood problems, such as the Guaiba, Uruguay, Itajai, Iguafu, Ribeira do Iguape, Paraiba do Sul, Sao Francisco and Capibaribe. There is also a telemetric flood control network located in the Pantanal Region of Mato Grosso, in the Paraguay river basin. '*^
l?0

Regional forecasting and warning measures are particularly important in the Caribbean and Central America. The Hurricane Committee, under the auspices of the World Meteorological Organization, co-ordinates the planning and review of national and regional hurricane warning activities and early hurricane warning and flood forecasting is co-ordinated in close co-operation with the United States' National Hurricane Centre in Miami. In South America co-ordination and co-operation in flood forecasting is maintained mainly in the River Plate basin, where Operational Hydrological Alert Centers have been set up in Buenos Aires, Asunción and Brasilia, to provide the information needed for forecasting floods on the rivers Paraná, Paraguay and Uruguay.
In the case of drought forecasting, apart from forecasts prepared by national meteorological services, the United States Agency for International Development (USAID) provides bi-weekly drought and crop condition assessments throughout Central and South America and the Caribbean Basin in co-operation with the National Oceanic and Atmospheric Administration (NOAA). ^®
A forecasting system for tsunamis is maintained in the Pacific. In 1965, the United States, in co-operation with UNESCO's Intergovernmental Oceanographic Commission (IOC), expanded its existing Tsunami Warning Center in Honolulu to become the headquarters of the International Pacific Tsunami Warning System. At present, the Pacific Tsunami Warning Center (PTWC) at Ewa Beach near Honolulu is operated by the U.S. National Weather Service. Among South and Central American countries, Chile, Colombia, Ecuador, Guatemala, Mexico and Peru are members of the International Co-ordination Group for the Tsunami Warning System in the Pacific. Since 1986, Chile has operated a national system for local tsunami warning. ' ®
b) Emergency measures
The emergency measures include the preparation of emergency plans, construction of Disaster Centres (stocked with food, tents, equipment, medical supplies including vaccines, etc.), the establishment of disaster administrations, the development of emergency legislation, the preparation of priority lists of water users, the evacuation of population, movable goods and livestock, the development of emergency communication systems, etc. (The list of national emergency plans and disaster legislation is given in annex 2.)
121

In Latin America and the Caribbean emergency services are usually undertaken by civil defence organizations charged with responsibility for the response to all disasters regardless of their origin (annex 3). Specialized organizations that respond to a particular natural hazard have, however, a long history in the region. For example in Brazil, the first institution to counter drought, forerunner of the Superintendencia do Desenvolvimento do Nordeste (SUDENE), was established during the drought of 1903 although special drought commissions had existed since 1856, such as those in the River Plate basin in Paraguay and Argentina. At the same time, they acquire particular importance when they are the only measures available for reducing the impact of natural disasters and also in the case of rapidly developing disasters such as flash floods, tsunamis, tropical cyclones and land or mudslides. For example, the casualties from the hurricane Albert that struck Cuba in June 1982 were kept low by the speed and efficiency of the emergency operations. In 1985 when hurricane Kate, the worst to hit Cuba since the beginning of the century, only three lives were lost due to prompt action by the defence committees in organizing the evacuation of some 715 000 people. ' Similarly, effective mobilization reduced the deaths and costs arising from the 1982 floods in Nicaragua. ^® Hurricanes, due to their tremendous destructive powers, may still cause large numbers of deaths even when successful emergency measures are taken.
In the case of drought, measures related to regulating, rationing or reallocating available water supplies acquire particular importance. Therefore, in many countries, the public authorities reserve the right within irrigation districts to control the use of water rationing and establish systems for times of scarcity. In some countries specialized institutions like Brazil's have not been created, however, and responsibility for responding to the hazard in the short-run lies with the Water Departments, for example in Chile and Peru, and in the long-term with the institutions responsible for irrigation. One of the systems in use, for example, in the province of Mendoza in Argentina, relies on pro rata cutbacks when dealing with the same category of water uses. Proportional reductions in water allotments mean that the effects of water scarcity are equitably distributed among all water users. ®°
c) Land-use controls
The restriction of human settlements to areas of lower risk from natural hazards is known to offer enormous advantages, and in distinction from other non-structural measures, it is of high
122

effectiveness in reducing property loss and economic disruption. On the whole, in Latin America and the Caribbean, land use planning measures are applied only in isolated cases within urban areas, although their use seems to be growing. For example, the activities of the Pan-Caribbean Disaster Preparedness and Prevention Project (PCDPPP) are directed towards supporting the efforts of the Caribbean countries to determine areas at high risk from tropical cyclones, floods and other natural disasters. ®^ In December 1987, the PCDPPP, in co-operation with the University of the West Indies and the Office of Disaster Preparedness in Jamaica, sponsored a regional meeting of experts on hazard mapping.
In Jamaica, an analysis of spatial variations in the occurrence of natural hazards has been made, and in other Caribbean islands disaster-controllable areas have been identified to improve protection systems, most notably perhaps in Cuba, which has a national disaster plan prepared by the Office of Civil Defence. The adoption of land use regulation as a flood damage reduction measure has been proposed in Argentina.
Land use planning and control is not only applied in the narrower sense of the restriction of certain uses in known high risk areas, but in the wider sense of attempting to establish new less risk-prone uses. One example of such a policy is afforded by the Atacama desert in northern Chile, where 18 000 hectares of Prospis tamarugo and algarroba (mesquite), which tap moisture from the atmosphere, have been planted to serve as cattle fodder. ®® In the northeast of Brazil industrial development is being stimulated with the aim of reducing the heavy dependence of the region on drought sensitive agriculture.
d) Building regulations
The prevention of building collapse and damage substantially reduces human death and suffering, limits property losses and supports post disaster emergency activities. Building regulations are an important means of controlling losses in the case of floods, tropical cyclones and other natural hazards which imply added loads for the building structure. It should be noted, however, that building regulations that can prevent damage from earthquakes and those designed to protect against tropical cyclones or floods do not necessarily coincide.
The incorporation of standards to withstand hazard induced stress into building regulations is usually considered to augment construction costs, but experience in the region shows that simple
2862
precautions can be effective. For example, such simple preventive measures as anchoring roofs securely to buildings or the provision of strong shutters for glass windows can considerably reduce damage from tropical cyclones.
The use of building regulations for mitigation of natural disasters seems to be growing in the region, most notably perhaps in the Caribbean where the adoption of building techniques and codes that can reduce damage to buildings from tropical cyclones and other natural disasters is promoted by the PCDPPP.^" In 1982 the Caribbean Community Secretariat, with assistance from various other organizations, embarked on the development of a Caribbean Uniform Building Code which, it is believed, could be the one single action contributing most over the next decade to reduce damages from tropical cyclones to buildings in the subregion. ®®
Building or construction standards and regulations are equally important for disaster mitigation structures, themselves, since the failure of these during a natural disaster can substantially increase damage.
3. Regional co-operation
There has been a considerable development in recent years in regional co-operation both in response to natural disasters and in measures for disaster prevention and preparedness. Such co-operation is achieved both through the United Nations and Inter-American systems and through specialized institutions.
Apart from co-operation in the operations of warning systems already mentioned earlier in the text, one example of co-operative activities is provided in the field of education and training. The training of specialized personnel is provided by the Pan American Health Organization (PAHO) and the Centro Latinoamericano de Asistencia Regional (CELAR). The Emergency Preparedness and Disaster Relief Co-ordination Programme of PAHO aims to enhance the preparedness of the health sector through training, public awareness and contingency planning. In addition, it offers a variety of services including international and local courses and workshops, simulation exercises for emergency committees; dissemination of technical manuals, etc.
CELAR, founded in 1985 during the Second Latinamerican Colloquium on Regional Assistance, operates under the responsibility of the Social Solidarity Fund Foundation (FUNDASOCIAL) which depends on the Ministry of Internal Relations of Venezuela. It offers an annual Course for Civil Defence and Protection Officers at a
124

senior level. At present it also offers courses for medium and high level officials of National Civil Protection systems in various countries of the region.
For the last 18 years ECLAC has been assisting governments in assessing the social and economic impact of natural hazard caused disasters. The objective of this work is to provide both the governments of affected countries and the international donor community with information to help define post-disaster priorities for reconstruction. A large number of reports have been prepared on the direct and indirect damages caused by disasters, on the impact of disasters on economic development and on the identification of rehabilitation and reconstruction projects (see annex 4).
The United Nations Disaster Relief Organization (UNDRO) promotes co-operation in the region in many areas related to disaster relief. UNDRO organizes meetings and seminars, as well as acting as a vehicle for technical co-operation in all aspects of disaster management.
Co-operation in the field of disaster mitigation has achieved its highest development in the region in the Caribbean. This can be explained both by the characteristics of the predominant natural hazards, tropical cyclones affecting several countries at the same time, and by the relatively small territories of most Caribbean countries, devastation from a single even may extend over the entire territory making emergency response difficult without external assistance. Both these factors and the tragic accumulation of hazard events in the late seventies when several Caribbean countries experienced a series of severe natural disasters encouraged the development of formal co-operation measures.
The major initiative towards co-operation in the Caribbean was the adoption by ECLAC of a resolution, October 1979, later endorsed by the General Assembly of the United Nations, whereby, "the United Nations, and more particularly the Office of the United Nations Disaster Relief Co-ordinator, should study ways and means of setting up specific machinery to cope with the natural disasters that periodically occur in the Caribbean Basin".
The task of "setting up specific machinery" was realized through the creation, under the auspices of UNDRO, of the Pan-Caribbean Disaster Preparedness and Prevention Project (PCDPPP) which formally initiated its activities in September 1981. The geographical scope of the PCDPPP includes all Caribbean island states and four adjacent mainland countries: Belize, French Guyana, Guyana and Suriname. The objective of PCDPPP is to contribute to socio-economic development and environmental protection by developing the individual and collective capacity of the participating
125

countries to mitigate the disastrous effects of natural hazards and to cope efficiently with disasters when they occur. This objective is achieved through the promotion and facilitation of the adoption of disaster mitigation measures both at the national and regional levels."®
The other area in which there is co-operation within the region is in the provision of emergency aid. Humanitarian aid is freely provided among the countries of the region and, in addition, the multi-lateral development banks, the World Bank (IBRD), Inter-American Development Bank (IDB) and the Caribbean Development Bank (CDB) have made a limited number of loans for rehabilitation following water-related disasters. The largest loan was that made to the Dominican Republic, equivalent to 25.47% of all loans identified for this purpose, following hurricane "David". In general, however, such loans have been very modest, less than 1% of the loans made by the multi-lateral banks between 1973 and 1987, and sizeable loans have only been made in a few cases (figure 17). ®°
1 2 6

N)
Figure 1 7 LOANS FOR WATER-RELATED DISASTER REHABILITATION,
1 9 7 3 - 1 9 8 7
By bank
o t h e r coun t r i es
A r g e n t i n a
Peru
Brazi l
B o l i v i a D o m in icon Republ ic
IBRD and IDA
CDB
Source: onnuol reporta of raapoctivo bonka. Notec the amount of loona hog been colculoted m oonatont ISBO US dolloFa.


Part Three
WATER POLLUTION *
* This document was published by ECLAC under the symbol LC/L.499, 8 May 1989.


introduction
A hallmark of the second part of the twentieth century in the use of the water resources of Latin America and the Caribbean has been the emergence of pollution as a significant and alarming feature of many water bodies. There are very disparate factors which account for this increase in pollution. Among the more important are rapid population growth, particularly the urban population, improvement in the provision of drinking water supply and sewerage services, the expansion of industry and the technification of agriculture —all this unaccompanied by the development of waste treatment facilities and pollution control. Together, these factors have led to the emergence of the control of water pollution as a major challenge for water management in the region.
The growing seriousness of water pollution in the region can be seen in the decline in the quality of the waters of rivers with large volumes of flow, such as the Cauca and Magdalena in Colombia, the Mantaro in Peru and in the rivers of the La Plata system. The situation is far worse, however, in many smaller rivers, lakes and lagoons where the impact of pollution tends to be relatively greater.
There is a complex and specific set of relationships between human activity, the generation of waste flows, absorbing capacity and the resulting contamination of any water body.
It is known that one of the major causes of water pollution in Latin America and the Caribbean is the discharge of untreated or inadequately treated domestic and industrial waste water. Non-point source pollution from the percolation, precipitation and/or unregulated run-off of contaminated water can also be important. Water pollution can be caused by natural factors, but this is usually of lesser significance; however. Lake Managua in Nicaragua is seriously contaminated from volcanic sources.
131

There has been no systematic regional evaluation of the evolution of water pollution in Latin America and the Caribbean or of its impact on the welfare of the population and its economic consequences. At the same time, the overall magnitude of the pollution of the region's water resources is not known. This report provides a description based on existing reports and information of the state of water pollution in the region and of the efforts being made by governments to control it and to improve water quality management.
I. WATER POLLUTION CAUSED BY POINT-SOURCE WASTE DISCHARGES
A. OVERALL PATTERNS
In Latin America and the Caribbean, one of the main causes of water pollution is the direct discharge of domestic sewage and industrial effluent. Of these two contaminants, domestic sewage is usually the more important, particularly in large population centres. For example, it has been estimated that in Rio de Janeiro, Brazil, 70% of the pollutants in the recipient waters around the city are of human origin while only 30% are industrial and organic wastes. Storm-water run-off is a further source of pollution in major urban areas of the region.
There is a general absence in the region of waste water treatment plants for any but the most toxic industrial wastes. Virtually all municipal sewage and industrial effluent is discharged into the nearest rivers and streams without any treatment. In most major cities even the patterns of waste flows are only partially controlled through interceptor sewers and scientifically located outfalls.
The geographical pattern of water pollution from point-source waste discharges in Latin America and the Caribbean is dominated by the flows originating from large metropolitan areas, although water bodies in areas of non-metropolitan concentrations of mining and manufacturing industry also receive significant waste discharges.
A high proportion of industry and population is concentrated in relatively few regions, such as the Lower Parana-River Plate area of Argentina and Uruguay, the triangle of Rio de Janeiro/Sáo Paulo/Belo Horizonte in Brazil, and the Mexico City metropolitan region in Mexico. Elsewhere, the largest cities usually account for a substantial part of both total population and total industrial
132

production. For example in Peru, the Lima metropolitan area, which in 1980 comprised 27% of the total population, but accounted for 43% of GDP and more than 90% of capital goods production (table 13).
In the future, demands on the water resources adjacent to metropolitan regions for the disposal and transport of industrial and domestic wastes are likely to increase due to continued growth in population and industrial development. The limited financial resources and economic difficulties facing the countries of the region are likely to inhibit a parallel expansion of efficient water pollution control and the installation of the waste-treatment facilities required.
B. MAIN POINT-SOURCE WASTE DISCHARGES
1. Domestic sewage
The average sewage production per capita usually ranges between 30 and 100 litres per day, although much higher figures can occur. For example, in Santiago, Chile, in 1984 the waste water discharge per capita per day was estimated to be 400 litres. The main ingredient of domestic sewage —99% or more by volume— is water. Dry organic matter, the most active portion of sewage, can constitute as much as 60%-70% of the total dry matter. The organic matter present in domestic sewage usually consists of carbohydrates, fats, proteins, oils, surfactants and agricultural trace compounds. Since some portion of the population carries various diseases, domestic sewage is infected by pathogenic organisms, the most significant of which are coliform bacteria, faecal streptococci, helminthic eggs, protozoa, salmonella typhosa and various v i r u s e s . T h e bacteriological load of raw domestic sewage in Latin America usually varies between 10 * 10® and 10 * lO' coliform bacteria per 100 ml. ®® Domestic sewage in Latin America tends to have high biological oxygen demand (BOD), suspended and dissolved solids characteristics, while the fat content is generally low (table 14).
Domestic sewage is biodegradable. Its chemical composition permits relatively rapid decomposition by natural processes in water bodies or in engineered systems. However, owing to large population concentrations and a lack of sewage treatment facilities, the input of sewage into the environment in many locations in Latin America and the Caribbean exceeds the natural decomposition and dispersal capacity of the recipient water bodies. The result is a significant degradation of the quality of water. The percentage of domestic
133

Table 13
Mexico River Tula and Lerma/Panuco 1980 13 368 315 20.0
SSo Paulo River Tiete and Lake Billings 1980 12 183 634 10.2
Buenos Aires River Plate and tributaries 1980 9 969 826 35.7
Rio de Janeiro Guanabara Bay and Atlantic Ocean 1980 8 821 845 7.4
Lima Pacific Ocean 1981 4 608 010 27.1 Bogotá River Bogotá 1985 3 974 813 13.8 Santiago River Mapocho 1982 3 902 356 34.4 Caracas River Guaire and Tuy 1981 2 640 013 18.2 Belo Horisonte River Das Velhas
and others 1980 2 461 081 2.1 Guadalajara River Santiago 1980 2 221 053 3.3 Porto Alegre River Guiba 1980 2 178 079 1.8 Recife Atlantic Ocean 1980 2 131 649 1.8 Medellfn River Medellin 1985 1 963 850 6.8 Havana Gulf of Mexico 1981 1 929 432 19.8 Monterrey River Santa
Catarina 1980 1 913 075 2.9 Salvador Atlantic Ocean 1980 1 696 318 1.4 Fortaleza Atlantic Ocean 1980 1 501 469 1.3 Montevideo Atlantic Ocean 1985 1 449 975 49.5 Santo Domingo Atlantic Ocean 1981 1 313 172 23.3 Cali River Cauca 1985 1 367 452 4.8 Curitiba River Belem 1980 1 325 275 1.1 Guayaquil River Guayas and
Salado estuary 1982 1 175 973 14.6 Brasilia River Paranua Sta.
Maria 1980 1 139 480 1.0 Barranquilla River Magdalena 1985 1 122 511 3.9 Guatemala River Maria Linda 1981 1 098 476 18.1 Maracaibo Lake Maracaibo 1981 1 013 939 7.0
Total 88 471 071 21.3
Year Population As a % of the population of the country
Santiago Caracas Belo Horisonte
Guadalajara Porto Alegre Recife Medellfn Havana Monterrey
Salvador Fortaleza Montevideo Santo Domingo Cali Curitiba Guayaquil
Brasilia
Barranquilla Guatemala Maracaibo
Total
1980
gs 1980 1
1980 r and
1980 1981 1985
River Mapocho 1982 River Guaire and Tuy 1981 River Das Velhas and others 1980 River Santiago 1980 River Guiba 1980 Atlantic Ocean 1980 River Medellin 1985 Gulf of Mexico 1981 River Santa Catarina 1980 Atlantic Ocean 1980 Atlantic Ocean 1980 Atlantic Ocean 1985 Atlantic Ocean 1981 River Cauca 1985 River Belem 1980 River Guayas and Salado estuary 1982 River Paranua Sta. Maria 1980 River Magdalena 1985 River Maria Linda 1981 Lake Maracaibo 1981
13 368 315
12 183 634
9 969 826
8 821 845 4 608 010 3 974 813 3 902 356 2 640 013
2 461 081 2 221 053 2 178 079 2 131 649 1 963 850 1 929 432
1 913 075 1 696 318 1 501 469 1 449 975 1 313 172 1 367 452 1 325 275
1 175 973
1 139 480 1 122 511 1 098 476 1 013 939
88 471 071
20.0
10.2
35.7
7.4 27.1 13.8 34.4 18.2
2.1 3.3 1.8 1.8 6.8
19.8
2.9 1.4 1.3
49.5 23.3
4.8 1.1
14.6
1.0 3.9
18.1 7.0
21.3
Source : Latin American Demographic Centre, América Latina en el año de los 5.000 millones, Santiago, Chile, 1987, p. 36.
134

Table 13
CHARACTERISTICS OF DOMESTIC WASTEWATER, SELECTED LATIN AMERICAN COUNTRIES
Characteristic "Typical"
composition Uruguay (mg/1) (mg/1)
Mexico (mg/1)
Colombia® (mg/1)
Chile^ (mg/1)
Biological oxygen demand 200 260*^ 299 241 109^
Chemical oxygen demand 500 n / a 719 n / a n / a
Solids, total 700 n / a n / a n / a 1 059
Suspended solids, total 200 275 309 289 91
Suspended solids, non-sett leable 150 193 n / a n / a n / a
Suspended solids, settleable SO 7 n / a n / a n / a
Dissolved solids, total 500 n / a 830 n / a 968
Nitrate (as N) 40 n / a n / a 33.8 28
Nitrate, ammoniacal 25 n / a 28 n / a n / a
Nitrate, organic 15 n / a 23 n / a n / a
Phosphore (as P ) 10 n / a n / a 2.9 n / a
PPO4, total n / a n / a 25 n / a n / a
Oil and fat 100® n / a 44 10.8 31®
Souice : C E P A L / C P P S / P N U / U I F S M , Valparaiso, Chile, Deacontaminación de la Bahía, anexo 1; Walter A. Castagnino, "Polución de agua, modelos y control", Serie técnica. 20, CEPIS, Environmental Health Division, Pan-Amer ican Health Organization, p. 5; H. Weitzenfeld and J . Barrios, "Water Pollution in Cartagena Bay, Colombia", Wate r Quality Bulletin, vol. 9, No. 4, October 1984, p. 216.
^ Car tagena Bay. " Melipilla. M D B 0 ) 5 .
«^DBOg^ 20-
®Fat . n / a = Not available.
135

wastes currently treated is not known, but estimates suggest that less than 2% of total urban sewerage flows receive treatment.
Some idea of the current demand for the use of water bodies for domestic waste disposal and transport can be gained from the fact that in 1980 total domestic-municipal return water in South America has been estimated at some 127 m^/sec, representing 4.2% of the world total whereas in 1950 these figures were 29 mVsec and 3.9% respectively. Waste flows can be very significant in the largest metropolitan areas and can be expected to increase as the population served by sewerage in the region grows. The served urban population increased by 18% between 1980 and 1985 and is expected to increase by a further 39% by 1990. Estimates of the outflow and parameters of domestic sewage for cities with 100 000 inhabitants or more in 1980 and the recipient water bodies of these discharges are given in annex 5.
A direct and sensitive measure of the overall state of pollution of water bodies by domestic sewage is obtained by counting indicator organisms such as faecal coliforms. Information on such counts is not available for the majority of the region's water bodies, but recent data on 24 major or regionally representative Central and South American rivers (figure 18) suggests that the situation in the region may be, on average, worse than in other parts of the world. For example, whereas 22% of the monitored rivers of other regions were of other regions were characterized by faecal coliform counts of less than 100 per 100 ml and 58% of these by counts of less than 1 000 per 100 ml, in contrast, the corresponding indices in Central and South America are 4% and 46% respectively. Eight percent of the rivers monitored in Central and South America have faecal coliform counts of more than 100 000 per 100 ml; in the other regions only 4% of the rivers are polluted to such a degree. ®®
Demands on water resources for the disposal and transport of domestic waste and the resulting potential for pollution can be expected to expand enormously in the region by the end of the century. For example, they will more than double in Sao Paulo, Brazil, although treatment is planned (table 15). Although the population of many of the major metropolitan areas is expected to more than double, population growth will be only one factor responsible for the rise in the demand on water resources. Equally significant will be the increased flows through sewerage systems as drinking-water-supply and sewerage connections are extended to a larger proportion of the population and individual water use increases. At present, in many metropolitan regions less than half of the population is served by sewerage systems, and water use per capita is substantially lower than in Europe and North America. Treatment
136

<1
SQ X
P 40 K c e n
o 30 X g
o f ZQ X
r Í V o 10 « r
• X
Figure 18 FAECAL COLIFORMS IN RIVERS MONITORED BY THE
GLOBAL ENVIRONMENT MONITORING SYSTEM
mm.
Below 10 1 0 0 0 - 1 0 0 0 0
c o l Í f o r m B
Central and South America
Rest of the world
1 0 0 Q 0 - 1 0 Q 0 Q 0
p « r 1 Q 0 ml. Above 100000
Sourca: Globd Environment Monitoring ^atem (GEMS).
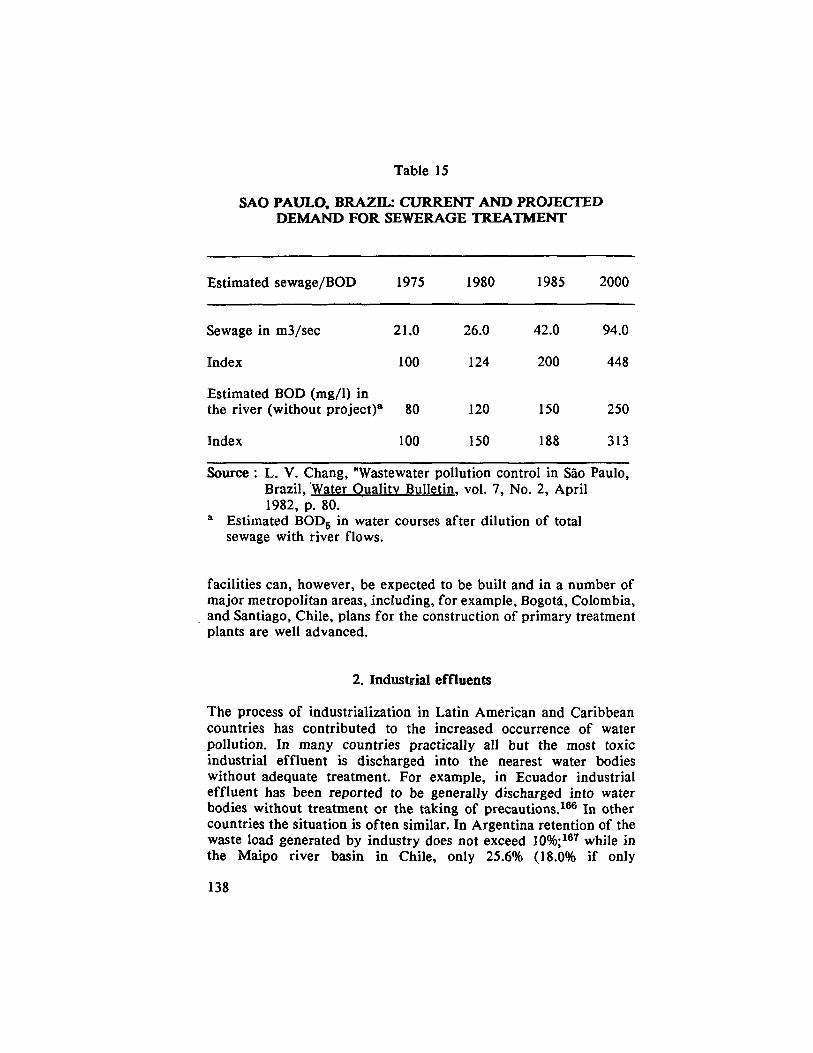
Table 15
SAO PAULO, BRAZIL: CURRENT AND PROJECTED DEMAND FOR SEWERAGE TREATMENT
Estimated sewage/BOD 1975 1980 1985 2000
Sewage in m3/sec 21.0 26.0 42.0 94.0
Index 100 124 200 448
Estimated BOD (mg/1) in the river (without project)" 80 120 150 250
Index 100 150 188 313
Source : L. V. Chang, "Wastewater pollution control in Sao Paulo, Brazil, Water Quality Bulletin, vol. 7, No. 2, April 1982, p. 80.
® Estimated BODg in water courses after dilution of total sewage with river flows.
facilities can, however, be expected to be built and in a number of major metropolitan areas, including, for example, Bogotá, Colombia, and Santiago, Chile, plans for the construction of primary treatment plants are well advanced.
2. Industrial effluents
The process of industrialization in Latin American and Caribbean countries has contributed to the increased occurrence of water pollution. In many countries practically all but the most toxic industrial effluent is discharged into the nearest water bodies without adequate treatment. For example, in Ecuador industrial effluent has been reported to be generally discharged into water bodies without treatment or the taking of precautions. ®® In other countries the situation is often similar. In Argentina retention of the waste load generated by industry does not exceed 10%; ® while in the Maipo river basin in Chile, only 25.6% (18.0% if only
138

manufacturing industry is taken into consideration) of industrial effluent receives treatment (figure 19), although for the region as a whole, this represents a relatively high degree of waste treatment. Even when treatment facilities do exist, they are not always well maintained or the technology employed is not always the most adequate.
There is no information from which to determine the overall impact of industrial waste flow on the region's water bodies, it has, however, been estimated that industrial effluents constitute 90% of overall water pollution in Mexico, the contribution from agriculture not having been taken into consideration; while in Colombia industry is estimated to be responsible for some 50% of water and air pollution. ®® The total return water flows from industry and power production in South America were estimated at some 254 m'/sec in 1980. This is almost four times higher than the flows in 1950 but represents only 1.3% of the estimated world total.
Demands on the water resources for the disposal and transport of industrial wastes and subsequent pollution problems can be expected to continue to increase. For example, both the pulp and paper and the iron and steel industries, which rank among the most important industrial sources of water pollution in the region, have been growing twice as fast as the economy of Latin American countries as a whole.
a) Effluent flows from manufacturing
In manufacturing, water is used in cooling, chemical treatment, transport, washing and other similar operations, many of which cause a deterioration of its quality. The characteristics of water use in selected industrial sectors are shown in figure 20. Of all the pollution caused by industry, chemical and biological pollution undoubtedly ranks foremost in the region owing both to the high toxicity and non-degradability of industrial pollutants and to the characteristics of the industrial structure.
i) Chemical and biological pollution. The nature and quantity of pollutants vary in relation to products, processes and technology. Industrial waste waters may contain heavy metals, soluble organics causing depletion of dissolved oxygen, various toxic substances, acid-producing compounds, oil and fat, phenols, colloidal solids, dissolved trace refractory organics, colour and turbidity, suspended solids, nutrients (nitrogen and phosphorus compounds) and other organic and inorganic substances. Many of their components are resistant to biodegradation.
139

• u o Figure 19
TREATMENT OF INDUSTRIAL EFFLUENT IN THE MAIPO RIVER BASIN, CHILE (cubic meters per day)
SQDDQ
6 DO DO
3 0 0 00
- + ChemicalB, plnBtic and rubber Paper and paper producía TeKttlea Food and beverageH
SaDDO
fiOOQO
3 00 00
Total ef f luent Treated ef f luent
Meial p roducts Cement, grovel and gloBB Leather and leather prcductB
Source: Contommacicn marino en Chile, Mtraaterio de Solui^ Sontiogo, 1S79, p. 1B.
Copper mining

Food
Meta l products
Figure 20 WATER USE BY INDUSTRY
Paper
Cement ^
Chemical
Cooirnq P r o c e e s e B
Petroleum refining
StnitaFV Jt boil era
Source: Woltar A. Cootognino, Polucion do oguo, modeloB y control, CEPIS, Drgonízocíon Ponomencono da lo Salud, p. 12.
Industrial water use in the majority of the countries of Latin America and the Caribbean accounts for a relatively minor part of total water withdrawals. In those countries with a higher degree of industrial development, however, chemical and biological contamination from the effluents of manufacturing rivals domestic wastes as a source of water pollution. Locally it can be extreme. This phenomenon is due both to the nature of the predominant pollutants and to the fact that their toxicity tends to be very high. In metal-ore mining, for instance, the population equivalent of wastes per employee has been put at 40, while in the factories and refineries of the sugar industry which is also widely developed in the region, it is, on average 999.^^° Characteristic of the situation in the region as a whole is the fact that in El Salvador, the manufacturing labour force in 1980 comprised 247 621 persons, but the population equivalent of the industrial effluent was estimated to be equal to that of the population of the whole country —almost 5 million— a ratio of 1:19 (see table 16)."^
It appears that the region has a higher share of industries with potentially noxious effluents than the world as a whole. For example, while the share of Latin America in the world total value added in industry was 5.3% (1983), its share (1982) in petroleum refining was 17.7%; in the production of other chemicals, 14.7%; in the number of beverage industries, 11.4%; in food manufacturing, 8.7%; in iron and steel basic industries, 7.1%; in non-ferrous basic industries, 6.3%, and in paper products, 5.4%. ^^
The major industrial waste loads in the region are generated by the pulp and paper, chemicals and petrochemicals and petroleum refining, metal-working (particularly iron and steel production and non-ferrous metal refining), food processing (particularly sugar in major producing countries), fish-meal, coffee-processing, thermal electricity generation and the textile industries. Some idea of the extent of the contribution from different industries can be gained from figure 21 showing the dynamic of waste water discharges by industrial sectors in Mexico. The location of these industries in relation to water bodies is shown in annex 6.
Insufficient data hampers any quantitative evaluation of the contribution of each industry to overall industrial water pollution; however, some idea of the extent of their potential contribution can be gained from process characteristics:
- Pulp and paper industry. Waste water discharges from the paper and pulp industry are among the greatest pollution hazards for the region's water bodies. Its pollution flows are mainly related to its bleaching, paper-coating, screening, washing and wood preparation and pulping processes. The typical effluent from a pulp
142
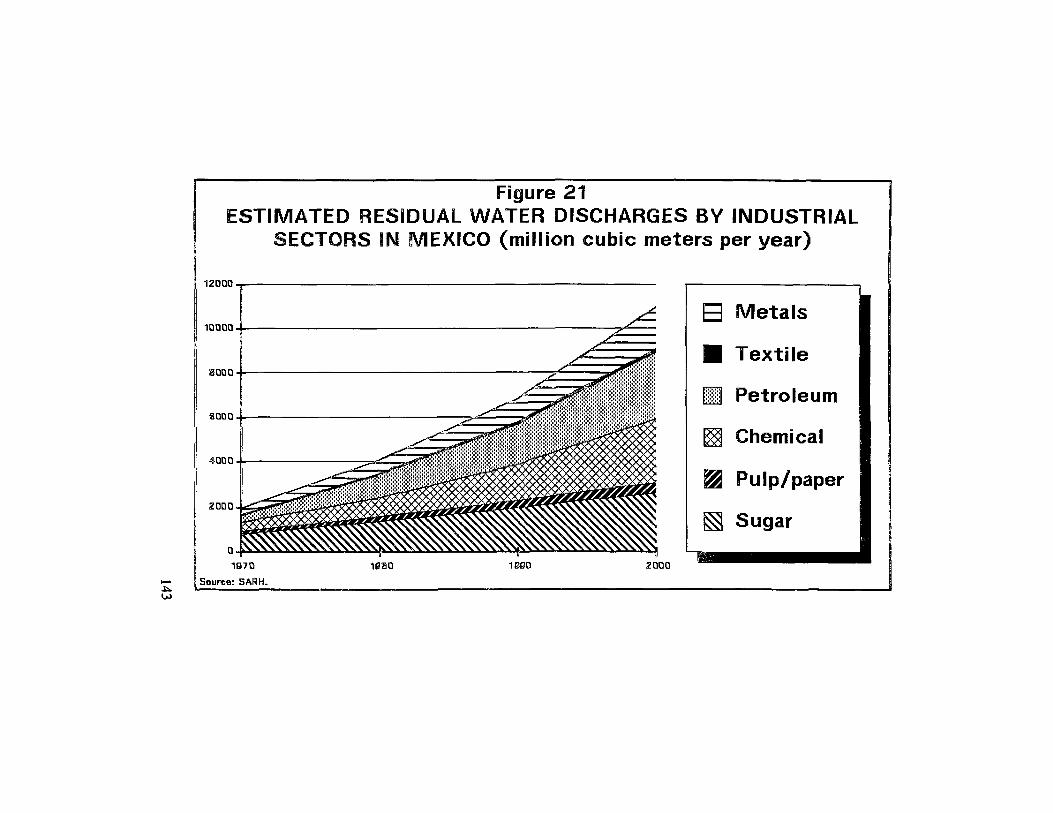
Figure 21 ESTIMATED RESIDUAL WATER DISCHARGES BY INDUSTRIAL
SECTORS IN MEXICO (million cubic meters per year)
12QQ0
1QQQQ
iOQQ
SQDQ
4QDQ
2QDQ
1070 1— t Source: SARH.
l e s Q 1B0O
Metals
Texti le
Petroleum
Chemical
Pulp/paper
Sugar
2DQQ
U>

Table 15
POPULATION EQUIVALENT OF MANUFACTURING INDUSTRY EFFLUENTS IN EL SALVADOR
Number Population equivalent of plants of the industry
effluent
Coffee processing 211 2 123 357
Sugar 11 1 590 718
Processing of American agaves 4 694 535
Distilling 3 193 808
Tanning 14 85 872
Dairy 10 24 165
Textiles 19 23 604
Slaughterhouses 42 18 435
Paper 2 11 414
Total 316 4 765 908
Coffee processing 211
Sugar 11
Processing of American agaves 4
Distilling 3
Tanning 14
Dairy 10
Textiles 19
Slaughterhouses 42
Paper 2
Total 316
2 123 357
1 590 718
694 535
193 808
85 872
24 165
23 604
18 435
11 414
4 765 908
Source : Resumen general sobre recursos y demandas. Plan maestro de desarrollo y aprovechamiento de los recursos hídricos, El Salvador, Documento básico No. 14, PNUD/ELS/78/005, May 1982, Table No. 43.
and paper industry contains chlorinated organic compounds; colloidal solids; dyes; fat; colours; dissolved trade refractory organics; nutrients, such as nitrogen and phosphorus; oil; phenols and various other organic pollutants.
Paper and pulp plants produce, on average, 200 m' of effluent per ton of cellulose pulp and 110 m^ per ton of paper, although figures vary enormously from plant to plant.^^^ The potential volume of effluent generated by the industry in the region is estimated at some 27 m3/sec.^^®
- Petroleum refining. The products and production processes used in petroleum refining are varied, and the contaminants of the
144

waste water discharges are similarly diverse. They range from phenols, other organic pollutants and suspended and dissolved solids to alkaline and caustic sludge, cyanides, heavy metals and sulphides.
Petroleum refining produces, on average, 380 litres of effluent per barrel of crude oil refined, although figures can vary depending upon the technology employed.^^® The potential volume of effluent can be estimated at some 24 mVsec.
Refineries located on the coast can represent a greater hazard for the aquatic environment than seabed petroleum extraction. It has been estimated that in the Caribbean refineries account for almost twice the volume of petroleum hydrocarbon residuals due to exploration and production activities. At the same time refined products may pose a more serious long-term threat than crude oil since they tend to be much more persistent and long-lived in the marine environment.^"
- Iron and steel production. Various processes in the production of iron and steel give rise to waste water discharges. These include the preparation of raw materials, sintering and coke-making processes, the operation of blast furnaces and hot rolling mills, pickling operations, the operation of cold mills and coke plants and the finishing of steel products. Depending upon the process in which water is used, effluent may contain ammonia, cyanides, oils, phenols, fluorides, ferrous chloride, emulsions, sulfuric acid, ferrous sulphate, hydrochloric acid and large amounts of suspended solids.
The iron and steel mills generate, on average, 25 m^ of effluent per ton of production, although the amounts per individual mill vary substantially. The potential volume of effluent generated by the industry in the region is estimated at some 25 mVsec; and the annual potential pollution load from untreated effluent, at 1 762 700 tons of suspended solids, 910 tons of phenols, 400 tons of cyanide, 1 100 tons of nitrogen (ammonia), 38 500 tons of mineral oils and 1 100 tons of iron.
- Non-ferrous metal refining. The effluent from the non-ferrous metal refining industry is an important source of water pollution in several countries of the region. Depending upon the characteristics of the primary mineral being processed and of the other minerals in the ore, effluents may contain high concentrations of arsenic, lead, cadmium, copper, nickel, zinc and other harmful, non-degradable substances.
Non-ferrous metals refineries generate, on average, 20 mVsec of effluent per ton of production, although much higher and lower figures may also be recorded depending upon the technology and equipment employed. The potential volume of effluent generated by
145

these plants in the region is estimated at 4 m®/sec, of which copper smelting and refining probably account for more than half.
- Food processing and related industries. Food processing industries are important dischargers of suspended and colloidal solids and organic pollutants. For example, brewery wastes show a high BOD with an elevated carbonaceous soluble component. They also contain high concentrations of organic matter and suspended solids. Dairy wastes are also characterized by very high BOD. They contain organic compounds which, although initially neutral or alkaline, tend to acidify rapidly, posing treatment problems. Cannery waste may contain large amounts of oil and grease in addition to high BOD, solid materials, dissolved or colloidal compounds, soda and citric acid. Discharges from meat and poultry processing and packing show considerable concentrations of blood and excreta with elevated levels of the bacteria salmonella. The wastes contain high levels of organic compounds and suspended solids and also of nitrogen and grease.
The food manufacturing industry produces, on average, 2 050 m^ of effluent per employee annually, although again figures can vary substantially from plant to plant depending upon the equipment and technology used. ^^ Thus, the potential discharge of effluent by processors in 19 Latin American and Caribbean countries
can be estimated at about 60 mVsec.^®^ It should be noted that because of the seasonal nature of the production of some branches of the food processing industry, much of their effluent is likely to be discharged during a few months, which increases their potential for pollution, particularly if the period of discharge coincides with the period of low flow.
In many countries, it is known that these industries are important contributors to water pollution. For example, it has been estimated that in Argentina food, beverage and tobacco industries account for some 59% of the potential pollution generated by i n d u s t r y . I n the Maipo and Marga-Marga river basins in Chile, the food and beverage industry generates 11%-14% of industrial wastes (excluding those generated by copper mining).
- Sugar production. In recent years, Latin America and the Caribbean produced some 26 000 000 - 28 800 000 tons of centrifugal sugar. The sugar refining industry is developed in virtually all the countries of the region. Brazil and Cuba are the largest producers, accounting for nearly 60% of total production in 1984.18^
The sugar industry produces, on average, 3 m' of effluent per ton of production in the case of cane sugar and 40 m' in the case of beet sugar. The potential volume of effluent discharged can be roughly estimated at about 3 mVsec. However, due to the seasonal
146

character of this industry, discharges tend to be concentrated during a relatively short period of time. In El Salvador, for example, the period of discharge lasts 5 months —from November to March. ®® During^this period effluent is likely to be discharged at a rate of about 8 mVsec. This explains why the sugar industry and related industries put a considerable strain on the water resources of the main producer countries. In Brazil pollution by sugar industry effluent has been reported to be particularly high in the states of Sao Paulo and Pernambuco. ®® Relatively small and irregular run-off heightens the impact of sugar industry effluents in Caribbean countries.
The distilling and rum industries associated with the sugar industry produce a strong organic waste containing yeast. It is characterized by a BOD of 1 200 - 2 000 mg/1 and a pH of 3.0 and has a strong aromatic odour. ®' Brazil produces a large volume of alcohol fuels from sugar cane. The production of such fuels grew by 35% annually between 1975/1976and 1985/1986, reaching 11.1 billion liters in the latter season. ®® Problems associated with the water pollution caused by distilling and rum industry effluent exist in several countries of the region. ®®
- Coffee-processing plants. In Latin America and the Caribbean, more than 17 500 000 tons of coffee berries are processed annually. The bean is known to comprise only 44% of the weight of the average coffee berry, the remainder being made up of pulp and mucilage. It is estimated that processors discard about 10 000 000 tons of waste every year, which is dumped in rivers and elsewhere, creating pollution and even constituting a health hazard. By comparison, Africa, Asia and Oceania together generate only about 6 900 000 tons of coffee waste.^®° As in the case of the food and sugar industry, the bulk of the coffee-processing effluent is discharged during a few months.
One of the most typical coffee-processing-related water pollution problems in the region is caused by the wet depulping process which is widely used in Central America, particularly in El Salvador and Guatemala, but is also used in some South American countries, such as Brazil and Colombia. This process requires high volumes of water. In Colombia 12 litres of water are used to produce one kilogram of washed coffee beans. Expensive treatment methods are not used because coffee farms are often very small, there are 3 000 plants in Guatemala, and the effluent from them is discharged directly into nearby streams. Moreover, one of the by-products of the wet depulping process is an organic residue which is left in mounds on river banks, the leachaie augmenting the organic load and the BOD. ®i
i 47

- The fishing industry. Effluent from the fishing industry is an important source of contamination of coastal waters near large fish-processing and fishmeal factories. Pollution tends to be a particularly acute problem when factories are located on the shores of bays characterized by weak currents.
The fishing industry is widespread in the region but is particularly highly developed in Chile and Peru. It has been reported that some 41 tons of fishing industry wastes are dumped into the coastal waters of the northern zone of Chile daily. ®^ In Peru pollution caused by the fishing industry affects the coastal waters adjacent to several ports.
Apart from pollution caused by fish blood and absorbent water, fishmeal factories produce highly contaminated effluent characterized by an extremely high BOD (70 000 mg/1). In quantitative terms, effluent (other than absorbent water and fish blood) generated by fishmeal plants amounts to, on average, 23% of the tonnage produced. The estimated potential volume of effluent from the fishmeal industry in selected Latin American and Caribbean countries is given in table
- Energy production. Water pollution caused by energy production is primarily physical pollution resulting from thermal discharges into bodies of water. Thermal discharges sometimes contain certain trace chemicals, but this is usually a minor problem. Hydroelectric projects can have a negative impact on the chemical and biological quality of water as a result of the flooding of forests. Experiences with the Curuá-Una Dam in Brazil and the Brokopondo Dam in Suriname show that decomposition of submerged forest can lead to the production of hydrogen sulphide and other harmful substances that pose serious public health risks and threaten a dam's machinery. Other adverse effects associated with reservoirs include massive fish kills and infestation by aquatic weeds.
ii) Physical water pollution. Manufacturing affects water quality not only through effluents containing chemical substances and biological agents but also through physical contamination. In its most common form, such contamination is caused by thermal discharges into water bodies. The most apparent effects of thermal inputs are the rises they produce in water temperature. This can affect aquatic animals and plants, increase evaporation and reduce the availability of dissolved oxygen, which may have adverse consequences for water quality.
Cooling water accounts for between 60% and 70% of all the water use by industry and for as much as 90% of such water if thermal electric power production is taken into consideration.^®® Significant amounts of cooling water are discharged from iron and
148
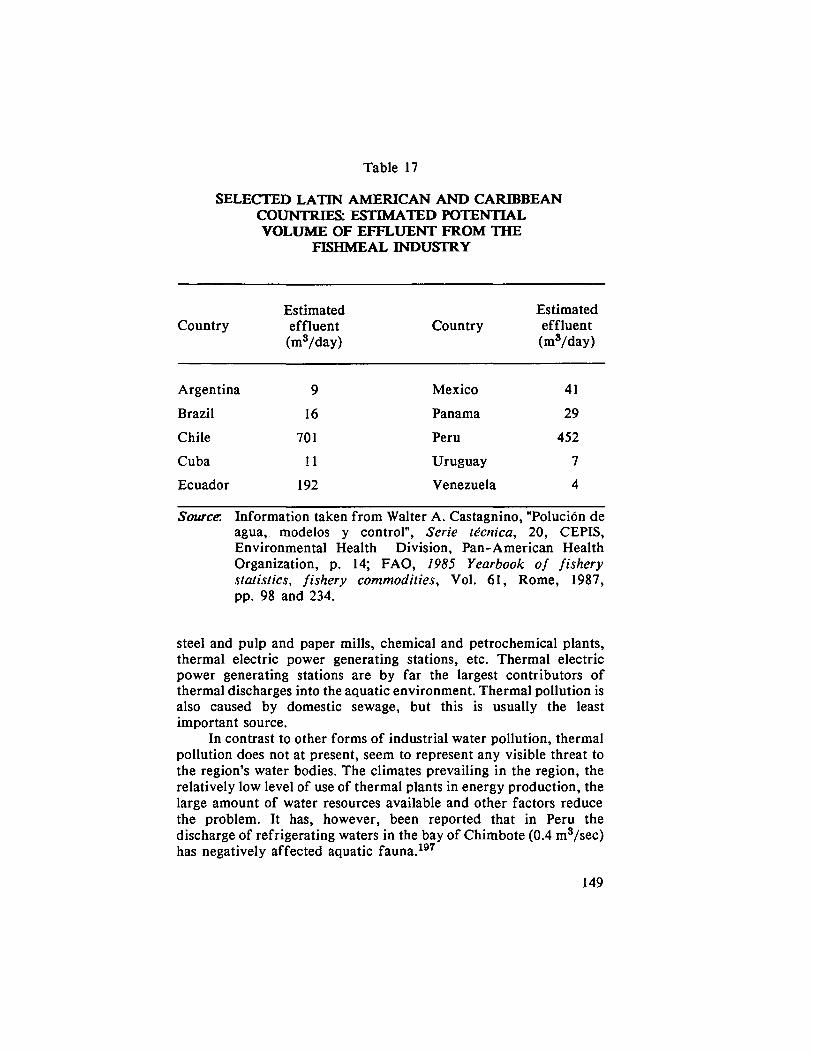
Table 15
SELECTED LATIN AMERICAN AND CARIBBEAN COUNTRIES: ESTIMATED POTENTIAL VOLUME OF EFFLUENT FROM THE
FISHMEAL INDUSTRY
Estimated Estimated Country effluent Country effluent
(m^/day) (m'/day)
Argentina 9 Mexico 41
Brazil 16 Panama 29
Chile 701 Peru 452
Cuba 11 Uruguay 7
Ecuador 192 Venezuela 4
Source. Information taken from Walter A. Castagnino, "Polución de agua, modelos y control". Serie técnica, 20, CEPIS, Environmental Health Division, Pan-American Health Organization, p. 14; PAO, 1985 Yearbook of fishery statistics, fishery commodities. Vol. 61, Rome, 1987, pp. 98 and 234.
steel and pulp and paper mills, chemical and petrochemical plants, thermal electric power generating stations, etc. Thermal electric power generating stations are by far the largest contributors of thermal discharges into the aquatic environment. Thermal pollution is also caused by domestic sewage, but this is usually the least important source.
In contrast to other forms of industrial water pollution, thermal pollution does not at present, seem to represent any visible threat to the region's water bodies. The climates prevailing in the region, the relatively low level of use of thermal plants in energy production, the large amount of water resources available and other factors reduce the problem. It has, however, been reported that in Peru the discharge of refrigerating waters in the bay of Chimbóte (0.4 m^sec) has negatively affected aquatic fauna.
149

b) Mining and the processing of minerals
Water, usually in very large quantities, is an essential element in every stage of the development of mineral resources —mining, concentration and processing. Water pollution is regarded the most hazardous environmental problem associated with the mining industry. The pollutants emitted by the mineral industry are, in order of importance, toxic metals, acid and solids in suspension. ^® The degree of water pollution caused by mining and the processing of minerals is determined both by the characteristics of the primary mineral being processed and/or of other minerals in the ore and by the technology used.
In order to evaluate the impact of the mineral industry on the water resources of Latin America and the Caribbean, the following important factors should be taken into consideration:
- The mineral industry plays a key role in the economy of many Latin American and some Caribbean countries and has been characterized by high growth rates (see annex 7).
- Usually the simplest means of mineral recovery (which are frequently used in the region) result in the greatest water pollution problems.
- Most chemical pollutants (toxic metals and acid) are known to result from oxidation of the minerals being mined and in particular from the oxidation of sulphide minerals. Many of the important metals produced in the region are mined as sulphides (including copper, zinc, lead, nickel, silver, mercury, cadmium and arsenic), and sulphides occur in many of the minerals not mined as sulphides. ®®
- Many mines and mineral processing plants dump their wastes in small, isolated rivers and streams which bring pollution directly to the sea.
- The minerals industry also produces huge quantities of solid wastes and also have certain other potentially detrimental effects on the environment, which may in certain circumstances cause water pollution including physical water pollution, and/or aggravate water pollution problems which already exist. For example, in Peru it has been considered necessary to dredge Lake Junin, the source of the Mantaro river, to remove the mineral residues which have accumulated over several decades.^""
i) Mining. Pollution from mining affects many water bodies and some coastal areas in nearly all South American countries and poses a particularly acute problem in the Andean countries, especially Chile and Peru (table 18). °^ Chile produces coal, copper, gold, iron, lead, manganese, mercury, molybdenum, saltpeter, selenium, silver, sulphur and zinc. Peru produces antimony, arsenic, bismuth, coal,
150

Table 18
EFFLUENT FROM THE MINING INDUSTRY IN PERU
Location Number of Treatment points of yes/no^
discharge
Total volume of effluent
mVmin
As % of total
Inland water bodies
Locumba basin 2 No 73.7 36.8
Rimac basin 6 Yes 30.5 15.2
Moche basin 3 Yes 4.1 2.1
Majes basin 3 3.3 1.7
Pisco basin 2 2.5 1.2
Santa basin 5 Yes 2.5 1.2
Ocoña basin 2 0.5 0.3
Pativilca basin 1 Yes 0.4 0.2
Into the sea
Marcona 1 Yes 81.6 40.7
Ilo 4 No 1.4 0.7
T o t a l 29 200.4 100.0
yes/no^ of effluent m V m i n
As % of total
Majes basin
Pisco basin
Santa basin
Ocoña basin
Pativilca basin
3
3
No
Yes
Yes
Yes
Yes
73.7
30.5
4.1
3.3
2.5
2.5
0.5
0.4
36.8
15.2
2.1
1.7
1.2
1.2
0.3
0.2
Marcona
I l o
T o t a l
Into the sea
81.6
200.^
40.7
0.7
100.0
Source : UNEP, Fuentes, niveles y efectos de la contaminación marina en el Pacifico Sudeste, Informes y Estudios del Programa de Mares Regionales, No. 21, 1983, p. 92.
^ It is not known what degree of treatment is provided or to what extent the information available is comolet®.
151

copper, gold, iron, lead, manganese, mercury, molybdenum, selenium, silver, tin, wolfram and zinc.
The basic reason for the significant contribution of mining to water pollution is the fact that, at best, only a minor part of its effluent receives treatment and this treatment is often only partial. As a result of inadequate treatment, many water bodies are polluted by mining industry wastes. One of the few exceptions to this rule is found in the Maipo river basin in the metropolitan region of Chile, where some 98% of the copper mining effluent was reported to receive some treatment (figure 19).^°^
In the Mantaro River in Peru, the concentration of metals, including heavy metals was reported to substantially exceed the norms established by the Water Law. The concentration of iron was 260 times in excess of the norm, and that of manganese 55 times in excess.^"^ The Rimac River is considered to rank among the most polluted rivers of the continent. The pollution of this river is a matter of particular concern because water for 60% of the population of Lima is supplied from it. Its water contains varying amounts of potentially harmful elements, such as arsenic, cyanide, lead, chrome and selenium. Concentrations were reported to be approaching the norms established by the Regulations Governing the Sanitary Classification of Bodies of Water.^°^
On the other hand, mining does not appear to represent a serious threat to the water resources of the countries of Central America and the Caribbean. For example, it has been estimated that in Mexico the share of the extractive industry in overall water pollution leaving pollution caused by agriculture aside, is only 0.5%. °® There are exceptions however, in Jamaica, the effluent of the bauxite-alumina industry is a major pollutant.^"®
In several bauxite-producing countries, wastes from the bauxite-alumina industry are dumped into coastal waters, endangering the marine environment, including fish life, and negatively affecting the use of the waters for recreational purposes.^"^ The volume of waste produced in the Caribbean may seem insignificant in comparison with that produced by the mining industry of the South American countries, but on small islands, given their limited land and water resources, the negative impact of mining wastes may be much more pronounced.
ii) Petroleum production. Oil production is a further important source of water pollution in the region, both near points of extraction and in the case of transport by pipelines and ships. Historically, pollution related to petroleum production was significant only in a few Latin American and Caribbean countries, most notably
152

Trinidad and Tobago and Venezuela, where Lake Maracaibo and several other water bodies have suffered from oil pollution for many years. It has been estimated that in the basin of Lake Maracaibo, 15 minor oil spills occur each month on average. "® The ecological balance of the lake has recently been reported to be "in mortal danger" due to pollution from oil spills and illegal dumping by oil t a n k e r s . 2 0 9
The discovery of major petroleum deposits and the development of oil production in Argentina; southern Chile; the foothills of the Andes in Bolivia, Ecuador and Peru; the central Amazon basin; the South Atlantic and the Gulf of Mexico has considerably increased the number of water bodies exposed to such pollution (see annex 7). There are some specific cases of severe pollution. For example, according to a recent report, the Coatzacoalcos and Tonala Rivers in Mexico could be considered to have the most extreme levels of hydrocarbon pollution yet discovered in any of the world's coastal regions. In the Coatzacoalcos River, in particular, traces of fossil hydrocarbons were up to 10 times higher than the normal levels —an indication of the huge impact of the petroleum industry in the region.^^"
Petroleum pollution puts at risk not only inland water bodies but also coastal waters, which are polluted as a result of oil exploitation, the drilling of oil-wells and deliberate discharges from ships that ballast their oil tanks with sea water and following accidents. It has been estimated that the total ocean and sea spills of hydrocarbons in the region amount to more than 500 000 tons annually and that sea transport is responsible for some 28% of those spills. ^^
n . NON-POINT SOURCE WATER POLLUTION
The percolation, precipitation and unregulated run-off of already contaminated water into water bodies are the constituents of non-point source water pollution. Run-off from agricultural land and storm-water flows from urban areas are the most important of such sources in Latin America and the Caribbean.
A. RUN-OFF FROM AGRICULTURAL LAND
Run-off carries various pollutants in dissolved or suspended form from contaminated surfaces into water bodies. In the majority of
153

Latin American and Caribbean countries, agriculture is the prime source of contaminated run-off.
While the contamination of agricultural run-off caused by man-made substances is of relatively recent origin, contamination by suspended solids and salts has been common for a long time. The principal source of sediment is soil erosion, which, although it reaches its maximum in mountainous terrain, is also widespread in lowland areas. Increased amounts of sediment can result in substantial economic losses downstream. For example, in Honduras a rapid buildup of sediment has been reported to be reducing the capacity of the reservoir that supplies water to Tegucigalpa.^^^ Increased sediment loads may also affect irrigation, navigation and other beneficial uses of water, but hydro-electricity generation suffers the most.
Irrigation drainage water can be a major source of pollution. While advanced methods of irrigation produce virtually no return flows thanks to their high water-application efficiency rates (up to 98%), they are not widely used in the region. In most countries of the region farmers still practise surface-gravity irrigation involving either the channelling of water through parallel furrows or the flooding of entire fields. The volume of return flow may be as much as one-third or more of the original flow. Irrigation drainage waters tend to be contaminated by varying amounts of suspended solids, dissolved salts or sodium, fertilizers, pesticides, insecticides, herbicides, pathogenic organisms (when organic fertilizers are used), and other substances.
On its way through the soil, irrigation water dissolves naturally- occurring salts and carries them to surface water bodies or groundwater aquifers, thereby increasing their salinity —or alkalinity, if sodium is dissolved. Salinity can render water unsuitable for other uses and adversely affect aquatic life. At the same time, the reuse of drainage water for irrigation is substantially accelerating the process of soil salinization or alkalinization which affects many areas in South America, Central America and Mexico. For example, on the coast of Peru about 34% the of land is estimated to suffer from salinization and drainage problems.
A large and growing part of agricultural water pollution is caused by the use of fertilizers, pesticides, herbicides, insecticides and other chemical substances. Although the utilization of such substances continues to be low in Latin America and the Caribbean, in many cases the situation is aggravated by significant local abuses in application owing to a lack of knowledge of soil management techniques.^^^
154

1. Fertilizers
The consumption of fertilizers in Latin America and the Caribbean increased by approximately 97% between 1973 and 1985. In comparison with developed countries, however, Latin American and Caribbean countries still use a substantially smaller volume of fertilizer. In 1984 the consumption of fertilizers per hectare of farmland in Latin America amounted to only 7.9 kg (N, P2O5, KjO) compared with 142.7 kg in Europe and 45.8 kg in the United States. In some countries of the region, however (e.g., Cuba, Dominica, El Salvador, Saint Lucia, Suriname, and Trinidad and Tobago), the consumption of fertilizers is similar to that of developed countries. ^®
The increasing use of fertilizers poses the following problems for the region's water resources:
a) Both synthetic fertilizers and animal wastes are important sources of nutrients. The accumulation of nutrients in water bodies, especially lakes and reservoirs, can contribute to eutrophication.
b) The use of organic residues as fertilizers not only causes nitrate and phosphorus pollution, but can also be a source of pollution by pathogens, ammonia, etc., and increased BOD. In zones of intensive cattle breeding, animal wastes, even if they are not used as fertilizers, can still harm water resources.
c) The increasing use of nitrogenous and phosphate fertilizers is leading to high nitrate and phosphorus concentrations, which pose potential health hazards.
2. Pesticides, herbicides, insecticides and other chemical substances
These materials can be transported to water bodies either indirectly —through percolation, precipitation, or run-off— or directly when used to control aquatic organisms, pests and weeds.
Two characteristics of these materials make them a major hazard for water resources:
a) They are both toxic to aquatic life and humans; this is particularly true of organophosphates, which tend to penetrate more deeply into the soil than organochlorinated compounds, thus increasing the threat to deeper aquifers. ^®
b) They are frequently non-degradable or only degrade very slowly; for example, the toxicity of organic chlorinated compounds decreases by only 50% over 10 years. As a result, they not only tend to accumulate but also are prone to food chain concentration
155

(i.e., they become concentrated instead of dispersed with each link in the food chain).
In general, the Latin American and Caribbean countries use a substantially lower level of agrotoxic chemicals in their agriculture than do developed countries. Nevertheless, although the total volume of consumption is not known, pesticide imports increased by almost half between 1971-1973 and 1983-1985."^
Furthermore, pesticide consumption substantially exceeds the regional average in some areas. For example, in certain areas of the Pacific coast in Central America, 80 kilograms of pesticides are applied per hectare of cotton, which is one of the highest figures in the world, while El Salvador was reported to have used at least 20% of the world's total parathion output in a recent year.'^® Even where the use of pesticides and other similar products is not so intensive their application can still pose problems locally for water resource management:
a) The Latin American and Caribbean countries place relatively few restrictions on the use of agricultural chemicals. For example, from the list of agricultural chemicals in the United Nations publication Consolidated list of products whose consumption and/or sale have been banned, withdrawn, severely restricted or not approved by governments, some 20%-25% are subject to any restrictions in Latin American and Caribbean countries, and the majority of these restrictions are of recent origin (see annex
As a result, the countries of the region continue to employ chemical substances whose use is either restricted or no longer permitted in countries with more stringent environmental legislation (see table 19).^^° An example is afforded by the pesticide dibromochloropropane (DBCP), which has beeñ banned in many countries and is classified by the World Health Organization (WHO) as extremely hazardous; nevertheless, this pesticide has been reported to be in use in Costa Rica, Ecuador, Honduras and possibly in Colombia and Panama. ^^
Although organic chlorinated compounds such as DDT and aldrin —which have been in use for more than 30 years and are still being used today— play a key role in water pollution in the region, they are giving way to others, such as phosphates and carbamates. In Peru, for example, 55% of all imported insecticides in 1979, were organic chlorinated compounds and, prior to 1977, DDT and mercury containing fungicides were used without restriction.^^^ DDT use is still widespread in several countries of Central America.'^'
b) The improper application and misuse of these potentially dangerous materials or non-observance of existing legal limitations on their use frequently result in a high number of pesticide poisonings;
156

Table 15
LATIN AMERICA AND THE CARIBBEAN: PESTICIDES USED IN OR SOLD TO AGRICULTURE WHOSE
CONSUMFnON AND/OR SALE HAVE BEEN BANNED, WITHDRAWN, SEVERELY RESTRICTED OR NOT APPROVED
BY GOVERNMENTS »
Product Country Year ^ 100 kg
ALDRIN <= Argentina 1984 5 832 Ecuador 1984 689 El Salvador 1979/81 432 Guatemala 1979/81 1 470 Guyana 1979/81 22 Mexico 1985 1 000 Suriname 1979/81 630 Uruguay 1985 126
ARSENICALS Uruguay 1979/81 26
BHC Argentina 1984 60 El Salvador 1979/81 12 Mexico 1985 2 500 Suriname 1979/81 961
DDT Argentina 1979/81 6 Ecuador 1984 4 000 El Salvador 1979/81 1 269 Guatemala 1979/81 12 570 Mexico 1985 3 000 Suriname 1979/81 33
LINDANE Argentina 1984 1 725 Guatemala 1979/81 11 Honduras 1986 1 371 Mexico 1985 150 Uruguay 1985 5
PARATHION Argentina 1984 9 234 Ecuador 1984 584
157

Product Country Year ^ 100 kg
El Salvador 1979/81 12 144 Guatemala 1979/81 905 Honduras 1986 1 360 Mexico 1985 46 000 Uruguay 1985 140
TOXAPHENE El Salvador 1979/81 5 252 Mexico 1985 6 000
2,4-D Argentina 1984 12 024 Ecuador 1984 8 684 Honduras 1985 28 Mexico 1985 14 000 Suriname 1979/81 525 Uruguay 1985 1 424
2,4,5-T Argentina 1979/81 117 El Salvador 1979/81 168 Guatemala 1979/81 124 Mexico 1984 500
. Suriname 1979/81 200 -
TOXAPHENE
2,4-D
2,4,5-T
Country
El Salvador Guatemala Honduras Mexico Uruguay
El Salvador Mexico
Argentina Ecuador Honduras Mexico Suriname Uruguay
Argentina El Salvador Guatemala Mexico Suriname
Year
1979/81 1979/81 1986 1985 1985
1979/81 1985
1984 1984 1985 1985 1979/81 1985
1979/81 1979/81 1979/81 1984 1979/81
100 kg
12 144 905
1 360 46 000
140
5 252 6 000
12 024 8 684
28 14 000
525 1 424
117 168 124 500 200
Source : FAO, 1987 FAO ProductionYearbook, vor."4M^ojne, 1988, pp. 9-10 and 119-127; and United Nations, Consolidated list of products whose consumption and/or sale have been banned, withdrawn, severely restricted or not approved by governments, ST/ESA/192, 1987, Second issue.
^ Data refer generally to quantities of pesticides used in, or sold to agriculture. They are shown in terms of active ingredients, except for Ecuador and Guatemala, where data refer to formulation weight. Formulation weight usually includes active ingredients plus diluents and adjuvants.
^ The latest year for which consumption data have been available. Consumption figures are for aldrin and similar insecticides.
158

it has been reported that about 1 800 pesticides poisonings per 600 000 population occur in Central America annually, in comparison with only 1 per 600 000 a year in the United States. In a recent five-year period approximately 17 000 pesticide poisonings were medically certified in Guatemala and El Salvador alone. "* One of the contributing factors is that in some countries there is no centralized authority for the administration of the trade, use and application of pesticides.
3. The regional situation
Little information exists on the impact of chemicals used in agriculture on the water resources of the region. Brazil, however, with a consumption level of some 150 000 tons annually, ranks among the top five countries in the world in terms of pesticide use. Moreover, several of the products still in use in Brazil, including aldrin, eldrin, ethilic parathion, heptachlor and lindane, have been banned or restricted in a number of European countries and the United S t a t e s . ^ ^ s
Agriculture-related water pollution has been identified in several South American countries, including Argentina, Bolivia, Brazil, Chile, Colombia, Ecuador, Peru and Venezuela, as well as in several water bodies in Central American and Caribbean countries.
Apart from the agriculture-related water pollution caused by fertilizers and agrotoxic chemicals, abstractions from rivers for irrigation and other purposes can alter the annual hydrograph and thereby indirectly affect water quality. Under certain circumstances, this may lead to saline water penetration into deltas or estuaries and the problem may be aggravated if abstractions are made during periods of low flow. Saline intrusion is particularly noticeable in the rivers of tropical countries where there is a large difference between maximum and minimum flows. This phenomenon has been observed in the River Guayas, Ecuador, where saltwater intrusion has precluded the river's use as a source of water supply for the city of Guayaquil during periods of low flow. ^®
Abstractions of water reduce the amount of water available for the dilution of domestic and industrial effluents and thus give rise to a corresponding increase in the intensity of pollution.^^^ This can be particularly significant in the case of industries characterized by a seasonal pattern of production, such as sugar or coffee processing, whose peak periods of activity coincide with major abstractions and low flows.
1 5 9

B. STORM-WATER RUN-OFF
In Latin America and the Caribbean the use of separate storm drainage systems is generally limited. In the majority of the urban areas, most storm-water run-off is channeled into the natural drainage system. A proportion, however, of storm-water enters the sanitary sewerage systems. As much of the region lies in tropical and sub-tropical zones characterized by heavy rainfall, the amount of storm-water run-off from urbanized areas can be significant (see table 20). The pollutant potential of urban storm-water run-off is related to its BOD strength, suspended solids content, organic and inorganic (particularly phosphorus, nitrogen and lead) pollutant load and bacterial contamination.^^® A comparison of the chemical characteristics of storm-water run-off and those of other urban effluents shows that they are, to a certain extent, comparable sources of water pollution. Given the possible volumes of storm-water run-off in major urban areas it can be an important source of pollution.
When collected in combined sewerage systems, storm-water run-off may also result in the hydraulic overloading of these systems and of sewage treatment plants. This may aggravate pre-existing pollution problems and cause the contamination of urban areas. Overloading of sewerage systems and treatment plants by storm-water run-off represents a particularly serious problem in the region because many Latin American cities lack storm sewer networks. For example, storm-water run-off has been reported to have caused damage to water supply and sewerage systems in several cities of Honduras. This was accompanied by contamination p r o b l e m s . I n Santiago, Chile, rainwater periodically finds its way into the sewerage network and causes the collector chambers in some sectors of the city to overflow.^^"
C. PERCOLATION OF POLLUTED WATER INTO GROUNDWATER
Seepage from waste dumps, septic tanks, sewerage systems, oil and chemical spills and the use of water for irrigation, watering, street-flushing, etc., can result in the slow percolation of polluted water into groundwater and its subsequent contamination. Eventually, such contaminated groundwater will find its way into rivers, lakes and reservoirs.
1 6 0

Table 15
ESTIMATED AVERAGE POTENTIAL STORM-WATER
Estimated average storm-water
run-off mVmin/km^
Country City Annual average
Rainiest month
1. Argentina Buenos Aires 1.1 1.5 2. Bolivia La Paz 0.6 1.6 3. Brazil Rio de Janeiro 1.2 1.8 4. Chile Santiago 0.4 1.1 5. Colombia Bogotá 1.1 2.0 6. Costa Rica San José 2.1 4.4 7. Ecuador Guayaquil 1.1 3.4 8. El Salvador San Salvador 2.0 4.4 9. Honduras Tegucigalpa 1.0 2.6
10. Mexico Mexico City 0.9 2.2 11. Nicaragua Managua 1.4 3.9 12. Paraguay Asunción 1.5 2.1 13. Peru Lima 0.03 0.08 14. Suriname Paramaribo 2.5 4.3 15. Uruguay Montevideo 1.2 1.4 16. Venezuela Caracas 0.9 1.5
City Annual Rainiest average month
1. Argentina 2. Bolivia 3. Brazil 4. Chile 5. Colombia 6. Costa Rica 7. Ecuador 8. El Salvador 9. Honduras
10. Mexico 11. Nicaragua 12. Paraguay 13. Peru 14. Suriname 15. Uruguay 16. Venezuela
Buenos Aires 1.1 1.5 La Paz 0.6 1.6 Rio de Janeiro 1.2 1.8 Santiago 0.4 1.1 Bogotá 1.1 2.0 San José 2.1 4.4 Guayaquil 1.1 3.4 San Salvador 2.0 4.4 Tegucigalpa 1.0 2.6 Mexico City 0.9 2.2 Managua 1.4 3.9 Asunción 1.5 2.1 Lima 0.03 0.08 Paramaribo 2.5 4.3 Montevideo 1.2 1.4 Caracas 0.9 1.5
Source: Estimated on the basis of information from FAQ, Datos agroclimatológicos de América Latina y el Caribe, Rome, 1985; and on the assumption that storm-water run-off represents 60% of the original precipitation.
Groundwater pollution is a cause of particular concern in Latin America and the Caribbean because many cities, including several large metropolitan centres, such as Mexico City and Havana, as well as the extensive arid and semi-arid areas in much of the region and thousands of rural communities rely on springs and wells for drinking water and irrigation. Much of the rural dispersed population uses
161

such for drinking water and latrines. The bad siting of latrines commonly leads to contamination of the well.
The percolation of water contaminated by fertilizers and toxic agrochemicals does not represent, however, such an acute problem in the majority of Latin American and Caribbean countries as in more developed regions. This is due both to the substantially lower utilization of these materials in the region's agriculture and to the predominant climatic and soil characteristics. According to recent assessments, in tropical climates certain soils have a lower risk of nitrate leaching than do similar areas under temperate c o n d i t i o n s . ^ ' * ^
One particular aspect of the percolation problem is the intrusion of saltwater as a result of the growing use of groundwater from coastal aquifers for irrigation as well as for other purposes. This phenomenon can be seen in many coastal areas of the region, particularly in islands of the West Indies where intensive irrigated agriculture is based on groundwater utilization. In Caribbean countries groundwater is also frequently used for water supply. Other examples are to be found in Argentina, where saline water intrusion has been reported to threaten coastal areas near the city of Mar del Plata and to have caused the salinization of some aquifers in the area of Buenos Aires. ®^ Saltwater intrusion has also been reported in El Salvador and Mexico.
The percolation of polluted water from septic tanks, sewerage systems and waste dumps is also a significant source of groundwater contamination in the region:
a) The percolation of water contaminated by human wastes from septic tanks, which are widely used in the region, and from sewerage systems, which are usually poorly maintained, is a major source of groundwater contamination, particularly by microorganisms and nitrates. In several cities as much as 50% of the water supply is lost through leakage (for example, distribution losses in Buenos Aires, Argentina, are reported to amount to 4.7 - 9.5 mVsec).'^® Although similar information is not available in regard to sewerage systems, there is no reason to believe that leakage does not occur.
Cases of groundwater pollution have been reported in many large metropolitan areas (e.g., in Buenos A i r e s , S a n t i a g o , a n d Mexico City). In Mexico City, in the neighbourhood of Xochimilco, it has been necessary to close several wells because of an excessive concentration of nitrates in the water, possibly due to pollution from the Chalco Channel, which transports urban sewage. ®® Also in Mexico, the dumping of waste water in the subsoil of the city of Mérida is reported to have resulted in the severe pollution
162

of groundwater aquifers of the city, and some of its outlying a r e a s . ^ ® ^
b) The seepage of toxic chemicals from industrial liquid waste dumps and solid waste dumps containing household garbage is a further threat to the region's groundwater resources. It has been estimated that total urban solid waste production in Latin America and the Caribbean was 160 000 tons a day in 1984 and that the amount of such waste that is generated has been growing at the rate of 4% annually since 1980. ^® The total potential regional leachate from this volume of solid waste may reach 5 - 6 m®/sec, with an expected increase to 9 - 10 m'/sec by the year 2000. ^® Given that leachate from sanitary landfills usually contains high concentrations of both organic and ammoniacal nitrates, copper, zinc, nickel, phosphates, sulfates, chlorates, COj, SO3, etc. and is characterized by high pH and extremely high BOD (in the range of 20 000-30 000 mg/l),240 the risk to the region's groundwater resources is obvious. It should be noted that, in general, in Latin American countries industrial wastes are dumped together with domestic wastes. Of the countries for which information is available, only Brazil and Mexico have begun to use technologies for industrial waste disposal that take environmental protection needs into consideration.^'*^
An equally important and related problem in many countries of the region is the direct tipping of solid wastes into water bodies. For example, it has been estimated that in Colombia about 25% of solid wastes are disposed of by tipping them into bodies of water ^ ^ (some 184 000 tons are dumped every year in the basin of the Medellin River alone). *® In Ecuador, the dumping of some 3 300 tons a year of solid wastes has been reported to have impaired the water quality of the Tomebamba and Machánagara rivers. '*'* Direct tipping of solid wastes into bodies of water has also been reported in Haiti and the Netherlands Antilles. ^® In Guanabara Bay, Brazil, most of the solid wastes are dumped at the edge of the bay, with the city of Rio de Janeiro alone dumping over 3 000 tons daily. ^® Household solid wastes have also been reported to contribute to water pollution problems in the Caracas Metropolitan Region in Venezuela.^^^
D. PRECBPITATIOM OF KiLLUTED WATER
Precipitation tends to absorb certain air polluíamís, gases, particles, pathogens, etc. and to carry them directly or indirectly, through
163
run-off or percolation, into water bodies. For a long time this was presumed to be an insignificant source of water pollution in comparison with other non-point sources. In recent years, however, as a result of research on acid rain and toxic metals, the precipitation of polluted water and pollution loading from dry atmospheric deposition are receiving increasing attention.^*® Polluted precipitation may represent a particular problem in many Caribbean countries where rainwater is an important source of drinking water.
There is virtually no information on the relationship between air and water pollution in Latin America and the Caribbean. The characteristics of predominantly airborne pollutants found in the region are such as to suggest that many of them can be transferred to water bodies from the air by rain. One of the few areas of the region for which information on the chemical characteristics of precipitation is available is Cerro Verde in El Salvador (see table 21). A few cases of pollution through precipitation have been reported in the highly industrialized southeastern section of Brazil, where some soils have become acidic as a result of acid rains. Brazil is particularly vulnerable in this respect because in a number of areas (e.g., the Amazon basin) the soil is naturally acidic. '*® In Chile, acidic precipitations has been detected in the Santiago Metropolitan Region, as well as in the localities of Caletones, Catemu, Nos, Puchuncavi and Ventanas, and precipitation contaminated by heavy metals and industrial elements in regions V and In addition to cases of acidic precipitation, at least one instance of seawater pollution by gases originating from fish processing plants has been reported in Peru. ®^
in. THE IMPACT OF WATER POLLUTION ON HUMAN HEALTH AND WELFARE
Untreated human wastes are generally considered to be the most dangerous environmental threat to human health. In Latin America and the Caribbean despite the advance made in recent years diseases transmitted through water contaminated by human waste are still very common, although deaths from diarrhoeic diseases have decreased dramatically in the last 20 years. Deaths from such diseases remain, however, the first or second principal cause of death in children under 1 year old and from 1 to 6 years old in those countries with the highest rates of infant mortality.^®^
164

Table 15
PRECIPITATION CHEMISTRY MONITORING, 1975-1982. IN EL SALVADOR (CERRO VERDE)
Characteristics 1975/1976 1977/1978 1979/1980
1. Average annual pH - El Salvador, Cerro Verde 4.7 5.5 5.1 - average for locations in
the United States and Canada 5.3» 5.4^ 5.5<=
2. Average annual concentration of sulfate (milligrams per litre) - El Salvador, Cerro Verde n/a 0.54 0.70 - average for locations in
the United States and Canada 1.20= 1.04^ 1.04=
3. Average annual concentration of nitrate (milligrams per litre) - El Salvador, Cerro Verde n/a 0.03 0.36 - average for locations in
the United States and Canada 0.38" 0.45® 0.44=
Source : World Resources Institute and International Institute for Environment and Development, World Resources 1986, p. 324.
® Average for 17 locations. ^ Average for 22 locations. = Average for 23 locations. ^ Average for 16 locations. ® Average for 21 locations, n/a = Not available.
165

A. HUMAN WASTES AND HUMAN HEALTH
Water pollution by domestic wastes, organic matter and certain other substances plays a major role in the transmission of various diseases, including cholera, typhoid fever, dysentery, other, intestinal infectious diseases, etc. The mechanisms of disease transmission vary. Initially, causative organisms find their way into water bodies either as part of domestic sewage and the effluent of certain industries (particularly meat packing and processing) or from other sources since they are present in the environment. Water polluted by organics provides a good breeding ground for microorganisms, which survive and/or reproduce there until they enter the human body. Direct transmission can occur through drinking water: in 1985, 14% of the urban population of the region and 55% of the rural population still lacked a protected source of drinking water. Even when a supply,of drinking water is available, the water is not always of adequate quality. The sale of bottled water in urban areas reflects a general concern with the quality of the public water supply. Moreover, the contamination of water bodies used as a source of drinking water increases the cost of treatment.
In addition to the direct contamination of drinking water there are other routes of transmission. Certain diseases are transmitted by bathing in polluted water. Indirect transmission can occur through contaminated agricultural products and fish, the bite of an insect vector that breeds in polluted water, etc.
Undeniably, the pollution of surface waters by domestic sewage poses serious health problems for the population, particularly in urban areas. It is generally agreed that both the high rate of infant mortality and the incidence of various intestinal infectious diseases, which are markedly higher in the region than in developed countries (figure 22), can be, at least partially attributed to the biological pollution of water bodies by human wastes. For example, according to a study carried out by the School of Public Health of the University of Antioquia to determine the health benefits of controlling the pollution of the Medellin River (Colombia), 0.3% of all deaths in the city, 28.8% of deaths from enteritis and diarrhoea, and 71.4% of deaths from tuberculosis could be avoided. Considering the medical expenses involved, days off work, production losses, etc., the public health benefits were estimated to amount to US$3 600 000 (1982).253 In Chile, although only 30% of the national population lives in Santiago, the city accounts for 60% of all cases of typhoid fever. ®^ Both Medellin and Santiago are characterized by a high level of bacteriological contamination of adjacent water bodies due to
166

Figure 22 DEATHS FROM TYPHOID FEVER iWFECTIOUS D ISEASES.
OTHER INTESTINAL 00 000 POPULATION
On - J
Guotarnclg
Ecuodor
Honduraa
lyÍQKÍCO
Paru
El Sdvodor
Ptrroguoy
SuFinoma
Domínícnn Repubirc
Ven «ZU el a
Pinomo
Ceata Rtca
Umguoy
Argentino
Chile
Cubo
aorbodoB
; Developed countnea
^ 0 20 40 j Source: WHO, informotion for vorioua recent yewa.
160

a lack of sewage treatment. In Mexico, salmonella poisoning and other gastric problems have been reported to be above the national average among the 1 500 000 people living near the heavily-polluted Coatzacoalcos River.^^s The segment of the population which is most affected by such problems is usually composed of low-income groups that lacks safe water supply, sewerage facilities or medical services.
B. THE CONSEQUENCES OF THE USE OF POLLUTED WATER FOR IRRIGATION
A problem particular to point-source water pollution of urban origin is the use of already contaminated water for irrigation. This frequently occurs in areas where large urban centres are located in zones of irrigated agriculture and where untreated waste flows are returned to watercourses which are subsequently used for irrigation. One motivation for the use of waste water for irrigation is the fact that the nutrients in it may be regarded as cheap fertilizers capable of substantially improving crop yields.
The use of untreated waste water for irrigation —a practice which is widespread in the countries of the region— may give rise to serious sanitary problems, particularly if adequate sanitation and treatment standards are not maintained. Both pathogens and heavy metals, apart from having direct harmful effects on crops and soils, are able to enter the food chain along with other pollutants. For example, reports indicate that in Santiago, Chile, the risk involved in consuming raw vegetables originating from nearby areas may be as much as five times higher than that associated with vegetables grown in coastal a r e a s . I n Mexico City, after little or no treatment, waste waters, including those contaminated by heavy metals and toxic organic compounds, have been used for irrigation. As a result, contaminants have been discovered in vegetables and other crops which give cause for concern about long-term health risks. ®^ In Argentina, the pollution of water used for irrigation has also been identified in the Grande and Primero Rivers. ®® In Cuba, water from the Almendares River and Arroyo Grande was reportedly being used for the irrigation of vegetables in spite of the level of microbacteriological contamination. ®®
168

C. RECREATION AND HEALTH
Offensive smells, floating materials (particularly sewage solids) and certain other pollutants including high suspended sediments, dyes, etc., can create aesthetically repellent conditions for recreational uses of water and reduce its visual appeal. Even more importantly elevated levels of bacteriological contamination and, to a lesser extent, other types of pollution can render water bodies unsuitable for recreational use. This is of particular concern in those countries where tourism is an important source of foreign exchange and employment. Several tourist areas in the region are affected to various degrees by water pollution, including such popular resorts as Guanabara Bay in Brazil,'®" Viña del Mar in Chile and Cartagena in Colombia. 261
In general, recreation is a much neglected use of water in the region hardly considered in the process of water management. The available information suggests, however, that pollution in recreational areas is a serious problem. This is particularly the case as the recreational use of water is very popular and it is concentrated in those water bodies closest to the large metropolitan areas. Many of these are increasingly contaminated by domestic sewage and industrial effluents.
IV. WATER POLLUTION CONTROL
The increasing contamination of surface and groundwater has prompted the governments of many Latin American and Caribbean countries to adopt measures for combating water pollution. These include laws designed to control water pollution, water quality monitoring and more widespread treatment of waste water and incipient attempts to control some non-point pollution.
A. LAWS AIMED AT CONTROLLING WATER POLLUTION
Most countries have begun to develop a body of law providing for water pollution control. Many countries now have the necessary basic legislation to empower public agencies to take steps to control water pollution. In addition, several countries have incorporated
2908

provisions relating to environmental protection in their laws and, in a few, a guarantee of a clean environment is even contained in their national constitutions (for example, the Constitutions of Chile (article 19), Cuba, Guyana (articles 25-36), Panama (article 114) and Peru (article 123)).
Colombia, Mexico and Venezuela can be cited as having the most comprehensive legislation and the strongest institutions for environmental management.^®^ In particular, Colombia possesses one of the most comprehensive bodies of environmental law, the National Renewable Natural Resources and Environmental Protection Code (decree 2811, dated December 18, 1974). This legislation, which has been referred to as the first "omni-comprehensive law in the world", deals with all elements of the environment in an integrated form.'®^ Furthermore, water quality and pollution control in Colombia are also subject to the Sanitary Code, which was framed in 1945 and revised in 1979. In 1984 a section on water quality was added to the Code, and this was followed by pollution control regulations.^®^ Other countries in the region have made fewer advances in institutionalizing the consideration of the environment in resource management.
In the majority of countries, regulations relating to water pollution control are incorporated not only in their environmental law, but also in the laws governing different spheres of water resource management and use. For example, in Antigua and Barbuda the public health laws prohibit the pollution of watercourses and drains, while in Jamaica the Mining Act contains some safeguards against pollution. ®® In many countries there are specific laws, sometimes dating back several decades, regulating pollution originating from major sources of contamination. One example is Venezuela, which adopted a law to control pollution from hydrocarbons as long ago as 1936. ®®
In most cases the legislation specifically prohibits the discharge of untreated or inadequately treated effluent into bodies of water. For example, in Ecuador the Environmental Pollution Prevention aiid Control Act (decree 374, dated June 21, 1976) prohibits the discharge of untreated wastes into sewerage networks, lakes, rivers, etc., as well as the infiltration into the ground of waste water containing contaminants harmful to human health, fauna, flora or property. ®^ In Cuba, Law Number 33, which deals with environmental protection and the rational use of natural resources (dated February 12, 1981), requires an adequate treatment of waste before its discharge into the environment.^®®
Licensing the construction and operation of potentially contaminating industrial plants and processes is a relatively frequent means of controlling discharges. Such provisions are, for example,
170

incorporated in the respective laws of Brazil, Colombia and Mexico. ®® In Brazil, the existing legislation delegates the authority to grant licenses to the state governments and in certain cases, to the municipalities. However, the granting of licenses for some activities, such as the operation of nuclear plants, is the exclusive prerogative of the Federal Government.^^® In Cuba, all agencies that invest in the water resources sector must obtain the prior approval of the Water Economy Institute for each project in respect of the nature and disposal of effluents, the source of the water and the volume to be used. ^^ In the Dominican Republic, a concession is required for the use of water in industry and mining. Such concessions remain in effect so long as the activity in question does not infringe the law by polluting the water with substances harmful to health, vegetation or to fish and f i s h e r i e s . T h e legislation of several countries (including Colombia, Cuba, Ecuador and Mexico) provides for the establishment of emissions standards governing the physical, chemical and biological composition of effluents.^^^ In Ecuador, the Environmental Pollution Prevention and Control Act authorizes th e Ministry of Health to establish the degree of treatment that effluents should receive.^^^ Legislation in several countries —including Brazil, Colombia, Cuba and Mexico— provides for restrictive zoning. In some cases such laws refer to the protection of groundwater wells, upper watersheds, etc. '® For example, in Montserrat a specific ban on activities likely to pollute surface water bodies is in effect within areas over which the Government has authority for water resource conservation and protection purposes. In Cuba, the location of activities whose effluents, even when treated, pose potential risks of contamination is prohibited in the catchment areas of water supply sources for population and industry.^"
Pollution control legislation usually specifies the measures to be used to ensure compliance with the established norms. In Latin America and the Caribbean these provisions cover a wide spectrum, ranging from economic measures (such as direct effluent charges, fines and incentives for the development and construction of water treatment facilities) to administrative measures (such as the temporary or definite prohibition of pollution-causing activities or plants). In the case of pollution of, or in close proximity to, the sources of public water supplies, sanctions may even include imprisonment. As for economic measures, Brazil and Colombia, for example, have explicitly adopted the "polluter pays" principle in their legislation.^^®
The legislation of Brazil, Colombia and Mexico provides for educational measures and the promotion of public awareness as a
171

means of combating pollution.^'® Very strong penalties for offenders —including plant closures— have been recently introduced in C o l o m b i a . 2 8 0
Several countries of the region have adopted the requirement that all new projects be evaluated in terms of their impact on the environment, including possible water pollution. Although environmental impact evaluation provisions have not yet become widespread, they do figure in the legislation of Brazil, Colombia, Ecuador and Mexico, among other countries. ®^ For example, in Colombia under the'National Renewable Natural Resources and Environmental Protection Code, every person planning to undertake any activity likely to cause environmental degradation is required to submit a statement concerning the projected environmental risks involved. At the same time, an ecological and environmental study is necessary prior to any activity that may cause a serious degree of deterioration of renewable natural resources or the environment.^®^
Few Latin American and Caribbean countries have comprehensive restrictions on the use of chemicals in agriculture. Of the countries for which information is available, Argentina, Colombia and Ecuador seem to have the most developed legislation (see annex 8). ®® In Mexico a new environmental law regulating the sale and use of toxic substances was to go into effect in 1988. ®^ The legislation of several countries also contains provisions regulating the use of effluents for irrigation. For example, in Mexico, the Federal Environmental Protection Act provides that urban sewage may be used in industry and agriculture only if it is treated in accordance with the standards set by the Department of Urban Development and Ecology in co-ordination with the Department of Agriculture and Water Resources and the Department of Health and W e l f a r e . 2 8 6
The apparent contradiction between the widespread occurrence of water pollution and the existence of sophisticated control legislation in many Latin American and Caribbean countries seems to arise from the fact that the implementation of such legislation is usually weak. In some cases regulations may not have been promulgated, while in others, even when appropriate norms do exist, their application is frequently hampered by the dispersion of legislative authority, the failure to set out the provisions of such regulations in sufficient detail, or both.
Positive steps have been taken, however, particularly in the more industrialized countries of the region, towards the serious control of polluting industries and the enforcement of requirements that effluent be treated. The same trend can be seen in regard to other sources of water pollution as well, particularly the treatment of
172

municipal wastes. Evidence of this is provided by the adoption of policies on pollution abatement and control. Examples include the announcement in 1984 of a nationwide plan for the control of water pollution in Argentina,^®® the preparation of a number of studies on polluted water bodies, and the taking of specific measures to control emissions (e.g., a water pollution control programme for the city of Bogota, Colombia, has resulted in the installation of effluent treatment plants in dozens of factories).^®' Studies on the behaviour of water bodies for the purpose of planning pollution control measures have been undertaken in Havana Bay (Cuba), in Guanabara Bay (Brazil), off Montevideo (Uruguay) and Valparaiso (Chile), in the basin of the Yaracuy River (Venezuela), and elsewhere. As a result of sustained efforts in this connection, the decline in water quality in the State of Sao Paulo, Brazil, has been reported to be levelling off and, in some cases, even to be improving; some areas which had reached critical levels have been reduced to point problems and fish are re-entering certain rivers.
B. WATER QUALITY MONITORING
Even the best water pollution law is almost certain to fall short of its objectives if it is not supported by an adequate water quality monitoring network. Legislation in Colombia, Costa Rica and Cuba specifically provides for the collection, classification and dissemination of information related to the environment and its conservation. On-going monitoring of the environment and of its state of preservation is provided for by the laws of Brazil, Colombia, Cuba and Mexico.'®®
An efficient water quality monitoring network should be able to measure the quality of potable water, of surface and groundwater in situ, and of effluent, as well as being capable of tracing specific pollutants to their sources. Of these three types of water quality monitoring, the control of drinking-water quality is the most highly developed in the region, and all the countries have laboratories for its analysis. In general, potable water control is best organized in the larger cities. ®® It should be noted, however, that some countries continue to experience problems in relation to the quality of their drinking water.
The measurement of surface and groundwater quality, particularly in the most densely populated, urbanized and industrialized river basins, has progressed considerably in the region, and especially in Argentina, Brazil, Chile and Mexico. In these
173
countries systematic studies have been made of the pollution problems of many water bodies.
Most municipal and industrial effluents are discharged into water bodies without any prior treatment and consequently, the monitoring of waste water quality is limited. It is only practised only at the few existing effluent treatment facilities as a means of assessing the treatment process.
Thus, few countries have, as yet, adequate water quality monitoring networks. According to a United Nations survey, in 1983 the majority of Latin American and Caribbean countries considered their water quality observation networks to be insufficient, although reliable, and most of the countries had plans to expand existing networks.^®" Nonetheless, several countries do have relatively well developed national water quality monitoring networks. In Brazil, the National Water and Electrical Power Department (DNAEE) has been surveying water quality parameters since 1973 and, since 1978 the water quality network has been operating with Brazilian-made equipment.2^^ This constitutes a notable achievement since many countries of the region must import monitoring equipment and have subsequently experienced difficulties related to servicing and spare parts. In Chile, the Bureau of Water Resources not only operates two networks used in the monitoring of water quality, but is also developing a modern computerized system for the storage and retrieval of hydro-meteorological information.^®^ In Cuba, the National Network of Control Laboratories, comprising 37 Health and Epidemiology Laboratories and the National Institute of Health, Epidemiology and Microbiology (INHEM), monitors water quality, while INHEM regulates and supervises the Network's laboratories.'®^ In Panama, the Institute of Water Resources and Electrification (IRHE) initiated a national water quality monitoring programme in 1975 and now maintains a network of some 200 water quality stations. Data validity is continuously checked by means of analytical quality control systems.'®^ The use of remote-sensing technologies for water quality monitoring is being investigated in a number of countries.
Assistance has been provided in connection with much of the work being done in the field of water quality monitoring by the programmes of the Pan American Center for Sanitary Engineering and Environmental Science (CEPIS) of the Pan American Health Organization (PAHO) and by the United Nations Environment Programme (UNEP).
174

C. TECHNOLCX5ICAL ADVANCES IN WATER POLLUTION CONTROL
One of the main difficulties that Latin American and Caribbean countries face in improving water pollution control is the high cost of waste water treatment. Moreover, such local factors as the lack of qualified personnel, social and climatic particularities, the specific chemical composition of sewage and industrial effluent, etc., hinder the direct application of water treatment technologies developed in other regions. In several countries of the region, efforts are being made to develop relatively simple and low-cost waste treatment techniques, such as stabilization (facultative, maturation or anaerobic) ponds, and methods based on the use of locally available products. Some countries (e.g., Brazil, Colombia, Costa Rica and Mexico) have even incorporated provisions into their legislation concerning the development of appropriate technologies as a means of environmental protection. ®®
1. Waste treatment
Stabilization ponds are widely recognized as being a low-cost, highly efficient method of sewage treatment, particularly in tropical and subtropical regions. These two features make them very attractive in Latin America and the Caribbean, and stabilization pond research has been carried out in several countries. For example, research at the Federal University of Paraiba in Brazil has demonstrated that stabilization ponds substantially reduce BOD and suspended solids and are especially effective in removing excreted pathogens; in fact, the results of this techniques were found to be several thousands of percentage points better in this respect than conventional treatment systems. ®®
Extensive research in the field of industrial and domestic sewage treatment is being carried out by CETESB in Brazil and has included the study of simple aeration systems, criteria for settling ponds, oxidation systems, etc. Waste water treatment-related research is also being conducted in other states of Brazil as well. For example, the Water and Sewerage Company of the State of Parana (Companhia de Agua e Esgotos do Parana - SANEPAR) has been actively studying anaerobic digestors for the conversion of biodegradable pollutants into methane gas and agricultural fertilizer, the utilization of methane gas obtained from sewage gas as an automotive fuel, the use of coagulants other than alum, and other subjects.^®^
175

In several countries research has been accompanied by efforts to introduce simple and low-cost waste treatment techniques in smaller towns and villages. One example of such an initiative is the Proyecto de Desarrollo Tecnológico de Instituciones de Agua Potable y Alcantarillado in Peru, which has been undertaken with the assistance of CEPIS.
Another positive development is that some countries have begun to promote and encourage waste water reuse. This is particularly the case in areas characterized not only by water pollution problems but also by acute water shortages. Sewage reuse is of particular interest for the region's agriculture since it is known to be rich in nutrients, mainly nitrogen and phosphorus, and —after adequate treatment— represents a valuable and low-cost agricultural input. Undoubtedly, the most notable example in the field of waste water reuse is to be found in the Federal District of Mexico, where recycled waste water accounts for some 4% (155 500 mVday) of current water use (mainly in recreational lakes and in the irrigation of public parks). According to existing plans, by the year 2000 about 17% of the District's waste water will be reused to supply some 12% of the projected water demand. ®® The Mexico scheme is also considered to represent the largest-scale use of raw sewage for irrigation in the world. Currently, approximately 82 000 ha are irrigated by raw sewage around the capital, and there are plans to convert a further 128 000 ha of land elsewhere in the country to sewage-fed irrigation. Before expanding the project, a detailed study on the health risks involved is to be carried out. ®® In Peru a research project has been undertaken at San Juan de Miraflores (near Lima) since 1961 to investigate the productive reuse of sewage waste water for irrigation; currently 500 ha are being irrigated by this means, and there are plans to use this method on another 1 300 ha in the future.®""
One important step forward has been the establishment, under the leadership of CEPIS, of a regional information system on the environmental health aspects of water management through the Paa American Network for Information and Documentation in Sanitary Engineering and Environmental Sciences (REPIDISCA).
A great deal of research is being done on the use of local products for waste treatment. For example, in Bolivia, with assistance from UNESCO, the utilization of Schocnoplectus tatora seeds and of aquatic weeds for water purification has been studied.'"^ Other countries have investigated bacterial leaching. This technology, apart from permitting the extraction of metals from low-grade ores and concentrates, provides the possibility of using mine waste dumps productively while also curbing pollution, since the tailings undergo a chemical change as part of this process which
176

renders them harmless. Industrial applications of this technology are in use at Cerro de Pasco in Peru and at Cananea in Mexico, and other projects are under consideration. In addition, research has been reported to be underway in Chile with a view to improving the bacterial action.^^^ Another achievement has been the utilization of the large quantities of waste products generated by the coffee processing industry in Costa Rica for animal feed. At present, about one-third of the coffee-processing waste generated in Costa Rica is being used in the production of an energy-rich and nutritious animal f o o d . 3 0 3
2. Biological control of agricultural pests
Research into means of reducing contamination by agrotoxic chemicals has led to the exploration of alternative methods of pest control, including biological techniques —although these are not yet in widespread use. An exception is Mexico, where in 1987 an estimated 765 000 ha of farmland (60% more than in 1986) were reported to be protected by biological means of pest control.®"^ Biological control has also been successfully used in Costa Rica on banana plantations. Other applications, which have resulted in a substantial reduction of insecticide and pesticide use, have been undertaken in Brazil and Nicaragua. In Brazil, impressive advances have been made in the application of alternative methods of pest control in the production of soybeans; participating farmers have reportedly achieved a reduction of insecticide use of up to 80-90%.3°5
3. Human resource development
One significant obstacle to better pollution control is the lack of appropriately qualified personnel. This lack tends to be aggravated by the low salaries prevailing in many national civil services and the consequent high staff turnover rates. There is in the region, however, much attention being given to the education and training of the required personnel.
Most countries have some form of training related to pollution control and waste disposal and there are institutions in some countries, as well as international organizations that offer training on a regionwide basis. For example, courses are offered at the Escuela Regional de Ingeniería Sanitaria (ERIS) at the University of San Carlos in Guatemala, at the Pan American Centre for Sanitary
177

Engineering (CEPIS) of the Pan American Health Organization in Lima, Peru and at the Inter-American Centre for Integrated Land and Water Development (CIDIAT) in Merida, Venezuela. Some national courses are open to students from all Latin American and Caribbean countries. Equally important is the fact that several of these organizations are actively engaged in waste water treatment research.
D. THE WORK OF INTERNATIONAL ORGANIZATIONS
Various international and regional organizations are working in the field of water pollution control. Their activities focus on the preparation of studies (both at office level and field reports), training courses, the promotion of horizontal co-operation among competent national organizations and the preparation of manuals and dissemination of methods. PAHO and its sanitary engineering centre, CEPIS, are the most active organizations. Their recent water pollution control-related activities and projects have included: the monitoring and control of pollution in Cartagena Bay and tributary areas, in Colombia; the design of a manual concerning marine outfalls; advisory services concerning water pollution and the application of mathematical models of water quality in relation to the Bogotá River (Colombia), Chimbóte (Peru) and the Asososca lagoon (Nicaragua); the transfer of water from the Mantaro River (Peru); a regional programme for the improvement of the quality of water for human consumption; a regional programme on appropriate technology for the collection, treatment and final disposal of waste water and excreta in medium-sized, small and dispersed rural communities in Peru; and a regional project on simplified methodologies for studies of eutrophication in tropical lakes.
The international and regional banks, particularly the Inter-American Development Bank (IDB), support investments in pollution control. In 1979 the IDB adopted a policy on environmental management with a view to preventing its projects from having adverse environmental impacts. In 1983, it established the Environmental Management Committee, which is responsible for ensuring the environmental review of all projects financed by the Bank and for promoting an understanding of environmental issues. Apart from helping its member countries with a variety of projects, such as those involving preventive measures to avoid the discharge of contaminating effluent into bodies of water, the IDB also stresses institution building, the training of personnel in environmental technology, and the identification and solution of environmental problems. An example of the IDB's special efforts in the field of
178

water pollution control is afforded by two loans totalling US$46 400 000 which were approved in 1986 for a project to expand and improve the water and sewerage system of Tijuana, Mexico. This project involves extensive measures to treat and dispose of sewage effluents so that both the city and adjacent beaches will be protected from pollution.®"® in 1970, the World Bank, for its part, established the office which later became the Office of Environmental and Scientific Affairs. This office has the responsibility of examining all projects for their possible consequences for the environment and of incorporating suitable measures for the preservation or mitigation of seriously detrimental effects.®"'^ Recently the World Bank has created environmental units in its regional divisions, as well as a central environmental department,^"® and is taking other steps with the aim of increasing its ability to assist developing countries to manage their natural resources on a sound environmental basis. In addition to the pollution-control components in its projects, the World Bank, in co-operation with other organizations, has prepared and issued guidelines and manuals, conducted training activities, provided technical assistance, etc. One example of the Bank's activities in the field of water pollution control is the US$60 000 000 loan that it approved in fiscal year 1986 for the development of a water-supply and sewerage system in Santiago, Chile, which includes a pollution-abatement component.®""
V. CONCLUSIONS
During the past decade the countries of Latin America and the Caribbean have made some progress towards remedying the pollution problems resulting from their increasing use of water resources for waste disposal and transport. The region continues to face, however, a steady decline in water quality in many bodies of water, and efforts to arrest the decline are still no more than incipient.
The report provides clear evidence that the contamination of water resources continues to increase. Control measures are weak, the financial resources for investment in waste treatment are insufficient and, in general, the preservation of water quality remains a secondary consideration. There are too many water bodies ÍEI the region in which the decline in ¡guality has reached critical proportions, although there is some evidence of a public reactioE ic this situation and the issue is begiirming to figure more prossinently on the poíiíical agendas of govermmenis.
i. / >

Despite the gains that have been made, far more remains to be done if even the most glaring instances of biological pollution are to be controlled, as indicated by the critical level of intestinal and other water-related diseases among children and adults. Moreover, if controls are not initiated, the problem will surely grow worse as the expansion of water-supply and sewerage coverage leads to a greater use of the water resources of the region for the transport of wastes.
Notes
^ World Bank, Report on World Development 1983. ^ Miguel S. Wionczek, "La aportación de la política hidráulica
entre 1925 y 1970 a la actual crisis agrícola mexicana". Comercio Exterior, vol. 32, No. 4, Mexico, April 1982, pp. 394-409.
® Subsecretaría de Planeación, Secretaría de Recursos Hidráulicos, "Plan Nacional Hidráulico 1975", Mexico City, July 1976.
* Instituto Nacional de Ciencia y Técnica Hídricas (INCYTH), Centro de Economía, Legislación y Administración del Agua, various publications, 1973-1983, Mendoza, Argentina.
® Axel Dourojeanni, La planificación para el desarrollo, aprovechamiento, y manejo de los recursos hidricos, CDA-24, ECLAC, Santiago, Chile, November 1980.
® Fernando González Villarreal, "Central Planning in Water Resources Development", United Nations publication. Water Resources Planning. Experiences in a National and Regional Context, TCD/SEM.80/1, New York, 1980.
^ Sandro Petricione, "Water Management Planning: The Regional and Central Approach", United Nations publication. Water Resources Planning. Experiences in a National and Regional Context, TCD/SEM.80/1, New York, 1980.
® United Nations, "The Demand for Water: Procedures and Methodologies for Projecting Water Demands in the Context of Regional and National Planning", Natural Resources/Water Series No. 3, Doc. ST/ESA/38, New York, 1976; John C. Kammerer, "Estimated Demand of Water for Different Purposes", Water for Human Consumption, Report of the IVth World Congress of LW.R.A., 3 to 12 September 1982, Argentina.
® Institute for Land Reclamation and Improvement (ILRI), Framework for Regional Planning in Developing Countries, No. 26, Wageningen, The Netherlands, J. M. van Staveren and D. V. W. M. van Dusseldorp (eds.), Í983.
180

United Nations, Department of Economic and Social Affairs, "Integrated River Basin Development", Report of a Panel of Experts, New York, 1970.
^ Gunther Schramm, "Integrated River Basin Planning in a Holistic Universe", Natural Resources Journal, vol. 20, October 1980.
^ Comisión del Plan Nacional Hidráulico, Secretaría de Agricultura y Recursos Hidráulicos, Plan Nacional Hidráulico 1981, Mexico, D.F., March 1981. It should be noted, however, that this plan is a second version; the first was published around 1957. This means that Mexico began the planning of its water resources long before the United Nations Water Conference.
Comisión del Plan Nacional de Aprovechamiento de los Recursos Hidráulicos (COPLANARH), Plan Nacional de Aprovechamiento de los Recursos Hidráulicos, vol. 1, El Plan, Caracas, 1972.
^ Comisión Multisectorial del Plan Nacional de Ordenamiento de los Recursos Hidráulicos, Plan Nacional de Ordenamiento de los Recursos Hidráulicos. Bases Técnicas y Económicas para su Formulación, Lima, 1977.
United Nations, El Salvador: Plan maestro de desarrollo y aprovechamiento de los recursos hidricos. Conclusiones y recomendaciones del Proyecto, New York, 1983.
Dirección de Planificación del Instituto Nacional Ecuatoriano de Recursos Hidráulicos (INERHI), "Marco general para la elaboración del Plan Nacional Hidráulico", Documento PNRH 6, Quito, August 1981.
Departamento Nacional de Planeación, Plan nacional de aguas. Términos de referencia, Bogotá, January 1982.
Secretaría Técnica del Consejo Superior de Planificación Económica (CONSUPLANE), Plan Nacional de Recursos Hidricos 1979-1983, Tegucigalpa.
UNDP, "Jamaica: National Water Resources Development Master Plan", project document. New York, January 1984.
Instituto de Cooperación para la Agricultura/Instituto Nacional de Recursos Hidráulicos, "Lineamientos para un Plan Nacional de Recursos Hidráulicos y Recursos Naturales relacionados para la República Dominicana", document prepared by Professor Warren A. Hall, Santo Domingo, March 1981.
^ In general the term "ordenamiento" would seem to be the most appropriate in Spanish since it does not limit the plan to water use, as does the term "aprovechamiento", but permits the inclusion of other aspects associated with conservation, preservation and protection of the environment and prevention and control of adverse natural phenomena such as floods, droughts and the like. The term
181

"aprovechamiento" however, is also considered adequate if it is implicitly assumed that it refers to a rational use that includes the aspects mentioned in "ordenamiento". The term "desarrollo" is not considered necessary or even suitable for inclusion since natural resources such as water are not "desarrollados" per se but rather utilized for the purposes of development. It is apparently a literal translation of the phrase "Water Resource Development" commonly used in English. The omission of a qualifying term is also somewhat undesirable since there are no "resource plans" but plans to do something with resources, although in practice this is quite understood. As regards the terms "agua", "hidráulico" and "hídrico", the dictionary of the Real Academia de la Lengua states that the term "hidráulico" has a connotation of "arte de conducir, contener, elevar y aprovechar las aguas" and would therefore exclude the idea of preservation, conservation and protection of the quality and quantity of water (environmental aspects) and would rather be focused on fluid mechanics. For this reason, as a variant of the term "agua" and to convey the idea of value to society, Latin America commonly uses the term "Recursos Hidricos" although this does not figure in the official dictionary and is also a translation adapted from the English phrase "Water Resources".
COMPLANORH, "Plan nacional de ordenamiento de los recursos hidráulicos", Lima, August 1977, p. XL
COPLANARH, "Plan nacional de aprovechamiento de los recursos hidráulicos", Caracas, 1972.
Departamento Nacional de Planeación, "Plan nacional de aguas. Términos de referencia", Bogotá, January 1982.
25 UNDP, "San Salvador: Plan maestro de desarrollo y aprovechamiento de los recursos hídricos", project document, San Salvador, March 1979.
2® Comisión Nacional del Plan Hidráulico, Plan Nacional hidráulico 1981, Mexico City, March 1981.
27 Ibid. 2® The documents relating to the Cuban plan are not for
publication. 2® UNDP, "Jamaica: National Water Resources Development
Master Plan", project document. New York, January 1984. Instituto Nacional de Planificación del Peru (INP), Plan
Nacional de Ordenamiento de los Recursos Hidráulicos. Bases Técnicas y Económicas para su Formulación, COMPLANORH, Lima, August 1977.
^ Ministry of Agriculture and Food, "Análisis sistemático de la problemática para el desarrollo, uso y conservación de los recursos agua y suelo", Lima, 1979.
182

Ibid., "Plan nacional de rehabilitación de tierras costeras -PLANREHATIC", project financed by the World Bank, Lima, 1979.
This is undoubtedly the weakest aspect of the plans for water resource management in the region and likewise the key factor that needs improvement.
Universidad del Pacífico, Estudio sobre las perspectivas y alcances del proyecto Majes-Siquas, Centro de Investigación, Lima, 15 February 1980.
Frequently this happens because the State directs the action of the public sectors towards "priority development areas" without specifying or establishing interinstitutional co-ordination mechanisms for working simultaneously in the areas selected.
ECLAC, "Proyecto regional de interconexión eléctrica el Istmo Centroamericano", Mexico City, March 1979.
Ministry of Energy and Mines of Peru, Evaluación del potencial hidroeléctrico nacional, 19 volumes, Lima, 1974. T;ie "HEC-4" (originating in the Hydrologic Engineering Center, of the United States Engineering Corps in California) is a monthly autoregressive stochastic model, multivaried, which generates synthetic sequences of a hydrological variable, and fills information gaps by employing correlations with other stations.
Hydrocomp, "Microprocessors isi Simulation", Newsletter Mountain View, California, April 1983.
Argentina: Ministry of Economy, "Flan nacional de equipamiento para los sistemas de generación y transmisión de energía eléctrica, período 1979-2000. Descripción metodológica. Módulos utilizados. Producción hidroenergética", Buenos Aires, September 1979, p. 105.
INERHI, "Experiencias en planificación hidráulica en el Ecuador", written communication, Quito, July 1983.
^ IPEA-IPLAN-CPS, "SME: energía eléctrica na década dos 70", Brasilia, March 1982.
United Nations, "Istmo Centroamericano. Programa de evaluación de recursos hidráulicos". Informe regional, New York, November 1978.
^ Ministry of the Interior, Companhia do Desenvolvimento do Vale do Sao Francisco - CODEVASF, "Inventario do projetos de irrigagao", Brasilia, 1982.
^ Ministry of the ¡nterioir, "Projeto do I Piano Nacioi?.a! áe Irriga9áo - IPNI. 1982-1986", Brasilia, 1982.
Secretarías de Planeamiento y de AgricuííEra del Estado de Piauí, "Programa Estadual de Iririgagáo e Recursos Hídricos - PROIRPr, Decree 4903 of 21 May Í982, Piauí.
1 8 3

Both the Inter-American Institute for Agricultural Co-operation (IICA) of the OAS and FAO actively promote this type of activity in Latin America.
ECLAC, Drinking Water Supply and Sanitation in Latin America, 1981-1990, Estudios e Informes de la CEPAL N» 25, June 1983.
ECLAC, The provision of drinking water and sanitation to the rural population in Latin America, Interregional Seminar on Rural Water Supply, Uppsala, Sweden, October 1980 (E/CEPAL/ L.232).
Argentine Republic, "Evaluación del estado actual de los servicios de abastecimiento de agua y saneamiento y de las previsiones de desarrollo sectorial", International Drinking Water Supply and Sanitation Decade, Buenos Aires, November 1978.
Servicio Nacional de Agua Potable (SNAP), "Plan nacional de agua potable", Buenos Aires, 1972.
Instituto Ecuatoriano de Recursos Hidráulicos (INERHI), "Experiencias en planificación hidráulica en el Ecuador", written communication, Quito, 1983.
Instituto Nacional de Fomento Municipal (INSFOPAL), "Informe", written communication, Bogotá, May 1983.
ECLAC, Progress towards achievement of the goals of the International Drinking Water Supply and Sanitation Decade (IDWSSD), 1980-1983, E/CEPAL/G.1263, Santiago, Chile, December 1983.
ECLAC, Drinking Water Supply and Sanitation in Latin America, 1981-1990, op. cit.
OAS, Actividades de cooperación técnica. Departamento de Desarrollo Regional, Energía y Recursos Naturales, Washington, D.C., August 1981.
®® INERHI, "Experiencias en planificación hidráulica en el Ecuador" written communication, Quito, July 1983.
SUVALE, Reconhecimento dos recursos hidráulicos e de solos da Bacía do río Sao Francisco, Rio de Janeiro, 1970.
OAS, op. cit. Colombia Information Service, "Colombia's Cauca Valley
to benefit from Salvajina Multipurpose Project", Colombia Today, vol. 18, No. 5, New York, 1983.
Gunther Schramm, op. cit. Instituto Nacional de Planificación (INP), "Plan nacional de
regionalización del Perú", Diario Oficial El Peruano, Lima, February 1983.
P. P. Azpúrua and A. J. Gabaldón, Recursos hidráulicos y desarrollo, Ed. Tecnos, Madrid, 1975.
184

®® Comisión del Plan Nacional Hidráulico, "Plan nacional hidráulico", Mexico City, March 1981, p. 130.
^ United Nations Environment Programme, Review of the priority subject area. Natural disasters. Report of the Executive Director, Nairobi, 1977, p. 1.
®® Enrique Florescano Mayet, Jaime Sancho y Cervera and David Pérez Gavilán Arias, "Las sequías en México: historia, características y efectos". Comercio Exterior, vol. 30, No. 7, July 1980, p. 756; and As secas do nordeste (urna abordagem histórica de causas e efeitos), Ministério do Interior, Superintendéncia do Desenvolvimento do Nordeste, Departamento de Recursos Naturais, Recife, Brazil, 1981, p. 24.
®® Judith Dworkin, Global Trends in Natural Disasters, 1947-1973, Natural Hazards Research, Working Paper No. 126,
See the discussion in E. F. Schulz, V. A. Koelzer and Khalid Mahmood (eds.) Floods and Droughts, Proceedings of the Second International Symposium in Hydrology, September 11-13, 1972, Fort Collins, Colorado, U.S.A., Session VI - Moisture Availability as it Relates to Droughts, Water Resources Publications, Fort Collins, Colorado, United States, 1973, pp. 489-588.
®® Ibid, and R. K. Linsley, Jr., M. A. Kohler and J. C. H. Paulhus, Hydrology for engineers, 2nd ed., McGraw-Hill, New York, 1975, cited from John A. Dracup, Kil Seong Lee and Edwin G. Paulson, Jr., "On the definition of droughts". Water Resources Research, vol. 16, No. 2, April 1980, pp. 297 and 302.
United Nations Environment Programme, op. cit., pp. 3-4. As defined in Kenneth Hewitt and Ian Burton, "The
hazardousness of a place". Research Publication, No. 6, University of Toronto, Department of Geography, 1971, pp. 98-99.
ECLAC, Latin America and the Caribbean: The Management of Water Scarcity, LC/R.774, June 1989.
^ Ministério do Interior, Superintendéncia do Desenvolvimento do Nordeste, op. cit., p. 24.
Miguel R. Solanes, "Legislative approaches to drought management". Natural Resources Forum, vol. 10, No. 4, November 1986, p. 374.
^ "Havana rations water after drought". World Water, August 1985, p. 16.
75 "Further disasters threaten Duarte", Latin American Weekly Report, 19 March 1987, p. 10.
ECLAC, Los desastres naturales de 1982-1983 en Bolivia, Ecuador y Perú (E/CEPAL/G.1274), Santiago, Chile, 1983.
185
ECLAC, El Salvador: the Natural Disasters of 1982 and their Effects on Economic and Social Development (E/GEPAL/MEX/ 1982/L.30), Mexico, 1983, p. 5
Country Report: Guatemala, El Salvador, Honduras, The Economist Intelligence Unit, No. 1, 1987, p. 23.
The irregular pattern of rainfall and the fact that the period of rains does not always coincide with the agricultural cycle can result in low yields due to a "green drought" even in normal rainfall conditions; Brazil, Ministry of Mines and Energy, National Department for Water and Electric Power, Division for Water Resource Control, Water Resources, Most Relevant Features of Water Resource Management in Brazil, Brasilia, 1986, p. 8; Latin American Weekly Report, 20 August 1987, p. 11.
ECLAC, Los desastres naturales de 1982-1983 en Bolivia, Ecuador y Perú, op. cit., p. 25.
Enrique Florescano Mayet, et al., op. cit., p. 754. "Salvadorean Power Hit by Drought", World Water, April 1987,
p. 5. "Panama/Energy rationing", Latin American Weekly Report",
9 April 1987. FONADE, Departamento Nacional de Planeación, Estudio
nacional de aguas. Informe final, Bogotá, Colombia, July 1985, Mejía Millán y Perry Ltda., p. 349.
®® "International Drinking Water Supply and Sanitation Decade. Regional Progress Report", Environmental Series, No. 6, Pan-American Health Organization, World Health Organization, Environmental Health Programme, p. 24.
®® ECLAC, Los desastres naturales de 1982-1983 en Bolivia, Ecuador y Perú, op. cit., pp. 33-34.
United Nations Environment Programme, op. cit., p. 5. ®® United Nations Environment Programme/Economic
Commission for Latin America and the Caribbean, Natural disasters overv/ew(E/CEPAL/PROY.3/L.INF.12), Santiago, Chile, 1979, p. 35.
®® "Short reports", C/A^DiiOA ews, September/October 1982, p. 8. United Nations Environment Programme, op. cit., p. 6. Cited in E. T. Stringer, Foundations of Climatology,
Wh. Freeman, San Francisco, 1972, p. 118. ECLAC, Informe sobre los Daños y Repercusiones del Huracán
Fifi en la Economía Hondureña (E/CEPAL/AC.67/2/Rev. 1), Santiago, 1974, p. 11.
"The Pan-Caribbean Disaster Preparedness and Prevention Project" UNDRO News, March/April, 1984, pp. 9-10.
The Economist Intelligence Unit, Quarterly Economic Review of Cuba, Dominican Republic, Haiti, Puerto Rico, No. 1, 1986, p. 11.
186

®® League of Red Cross and Red Crescent Societies; U.S. Office of Foreign Disaster Assistance, cited from World Resources 1986, World Resources Institute, International Institute for Environment and Development, p. 306.
®® Jamaica Office of Disaster Preparedness and World Meteorological Organization, Flood Mapping Project, "Hurricane Gilbert and its Effects on Jamaica", Kingston, October 1988.
ECLAC, Damage Caused by Hurricane Joan in Nicaragua. Its Effects on Economic Development and Living Conditions, and Requirements for Rehabilitation and Reconstruction (LC/G.1544), Santiago, Chile, 1988, pp. 2 and 15.
"Devastating floods", UNDRO News, September/October 1982, p. 3.
Gillian Cambers, Regional Survey of Coastal Conservation, Regional Sewage Disposal and Coastal Conservation Studies, vol. Ill, preliminary draft, p. 67.
100 "Devastating floods", op. cit., p. 3. ECLAC, Report on the Effect of Hurricane "David"
on the Island of Dominica (E/CEPAL/G.1099), Santiago, 1979, pp. 10-11.
ECLAC, Damage Caused by Hurricane Joan in Nicaragua, op. cit., pp. 11-16.
United Nations Environment Programme, op. cit, p. 1. ECLAC, Water Management and the Environment in Latin
America, Water Development, Supply and Management, vol. 12, Pergamon Press, Londres, 1979.
Kenneth Hewitt, "Seismic Risk and Mountain Environments: The Role of Surface Conditions in Earthquake Disaster", Mountain Research and Development, vol. 3, No. 1, February 1983, pp. 34-35.
"Glacier Dams up River in Argentinean Andes", UNDRO News, March/April 1985, p. 5.
Dams in the Northeast of Brazil, Ministry of the Interior, National Department of Works against Droughts (DNOCS), Fortaleza, 1982, p. 135.
Inter-American Development Bank, 1986 Annual Report, Washington, D.C., p. 61 andf/A/ercuno, Santiago, 22 June 1986 (the estimate is for damages to water supply and sewerage systems, roads, agriculture and housing).
"Short reports", UNDRO News, March/April 1983, p. 11. A. A. Khan, Improved Efficiency in the Management of
Natural Hazards: Floods, Interregional Symposium on Improved Efficiency in the Management of Water Resources, United Nations, New York, 5-9 January 1987, MDPFU/SYMP/7, November 1986,
187

p. 4. These countries are El Salvador, Colombia, Peru, Ecuador, Brazil, Bolivia and Mexico.
^ ^ Pan-American Health Organization, Las condiciones de salud en las Américas, 1981-1984, vol. I, Scientific Publication, No. 500, Washington, D.C., 1986, pp. 133-134.
ECLAC, Los desastres naturales de 1982-1983 en Bolivia, Ecuador y Perú, op. cit. pp. 29, 47-48, 66.
l is "Brazil floods", Latin American Weekly Report, 3 March 1988, p. 12; and "A 18 Aumentan Los Muertos por Leptospirosis", El Mercurio, Sunday 28 February 1988, p. A l l .
ECLAC, Los desastres naturales de 1982-1983 en Bolivia, Ecuador y Perú, op. cit. p. 12.
ECLAC, Nicaragua: The Floods of May 1982 and their Effects on the Social and Economic Development (E/CEPAL/ G.1206/Rev.l), September 1982, p. 41
Walter F. Kugler, "Conservación de suelo y de agua e inundaciones en la cuenca de la Plata", Ambiente y recursos naturales, July-September 1984, vol. I, No. 3, p. 38.
UNEP/ECLAC (E/CEPAL/PROY.3/L.INF.12), op. cit., p. 22.
On the basis of information in United Nations, The Nevado del Ruiz Volcano Natural Disaster (SG/SM.1/1), New York, 1985, "Nevado del Ruiz: sleeping giant awakes", UNDRO News, November/December 1985, p. 5; and Geoffrey Matthews and Maria Elena Hurtado "How Colombia stumbled into hell", South, January 1986, p. 112.
United Nations, ibid., "Disaster news in brief, UNDRO News, November/December 1985, p. 25; and "Little relief for Armero survivors", Latin American Weekly Report, 4 December 1986, p. 9.
"Lessons to be learnt", UNDRO News, November/December 1985, p. 7.
Kenneth Hewitt, op. cit., p. 35. UNEP/ECLAC (E/CEPAL/PROY.3/L.INF.12), op. cit.,
p. 23. United Nations, Disaster Prevention and Mitigation. A
Compendium of Current Knowledge Seismological Aspects, op. cit., p. 113. Estimates are based on the number of tsunamis observed in the Pacific Ocean between 1900 and 1970. During this period there were about 180 tsunamis. Of these, 35 caused casualties and damage near the source only and 9 spread destruction throughout the Pacific.
United Nations, ibid. "Tales of tsunamis", UNDRO News, May/June 1988, p. 9.
188

"Un país'desastroso'", £•/r/empo, p. 1-C, Bogotá, Colombia, 12 July 1987.
"Las sirenas del maremoto". El Mercurio, Santiago, Chile, 24 April 1988.
United Nations Environment Programme, op. cit., p. 14. United Nations, Department of Technical Co-operation for
Development, Flood Damage Prevention and Control in China, Report of a study tour and workshop. Natural Resources/Water Series No.l 1, ST/ESA/119, p. 107.
130 "Defensas del Mapocho virtualmente completas". El Mercurio, Santiago, Chile, 8 May 1988.
"Lainfraestructurahidráulicayambiental", ^wé/ewtó. No. 1, Año 10, 1987, p. 19.
Calculated on the basis of information in FAO Production Yearbook, vols. 33 and 40, FAO, Rome, 1980 and 1987.
Calculated on the basis of information in World register of large dams. International Commission on Large Dams (ICOLD), Paris, 1979.
Gwynne Power, "Land reform vital in NE Brazil", World Water, vol. 9, No. 8, October 1985, pp. 37-42.
Christiaan Gischler and C. Fernández Jáuregui, "Técnicas económicas para la conservación y gestión del agua en América Latina", La naturaleza y sus recursos, UNESCO, vol. XX, No. 3, July-September 1984, pp. 12 and 16.
Sandra Postel, "Conserving Water: The Untapped Alternative", Worldwatch Paper 67, September 1985, p. 32.
Denise Searle, "Sewage: Health fears crop irrigation promise". Water Resources Journal, (ST/ESCAP/ SER.C/152), p. 53, March 1987.
R. Sáenz, "Use of wastewater treated in stabilization ponds for irrigation - Evaluation of microbiological aspects". Water Quality Bulletin, vol. 12, No. 2, April 1987, pp. 87-88.
Inter-American Development Bank, 1985 Informe Anual. ^ ^ Juan Parrocchia Beguin, "No le echemos la culpa al río ni al
canal". Hoy, Year VI, No. 259, Week 7-13 July 1982, Santiago, Chile, p. 17.
Hurricane Gilbert and its effects on Jamaica, op. cit, p. 2. World Meteorological Organization, "Review of the
Committee's technical plan and its implementation programme for 1986-1987", Hurricane Committee, RA IV/HC-VIII/Doc.5 (12.in.l986), p. 4.
Argentina, Plan de Acción de Mar de Plata y Decenio del Agua Potable y del Saneamiento Ambiental - Progresos Relativos al
189

Año 1985. Informe Nacional, April 1986, Buenos Aires, p. 24; and "La información básica". Ambiente, Year 10, No. 1, 1987, p. 33.
Brazil, Ministry of Mines and Energy, National Department for Water and Electric Power, Division for Water Resource Control, op. cit., p. 19.
"US Aid for Disasters", UNDRO News, September/October 1984, p. 8.
"Tales of tsunamis", op. cit., p. 10; "Las sirenas del maremoto", op. cit., p.6; and United Nations, Preparedness aspects. Disaster prevention and mitigation. A compendium of current knowledge, vol. 11, New York, 1984, pp. 33-34.
^ ^ Devastating floods, op. cit., p. 3; and The Economic Intelligence Unit, Quarterly Economic Review of Cuba, Dominican Republic, Haiti, Puerto Rico, No. 1, 1986, p. 11.
ECLAC, Nicaragua: The Floods of May 1982 and their Effects on the Social and Economic Development, op. cit.
More than 2 000 deaths were caused by hurricane David in the Dominican Republic although timely emergency measures were taken (E/CEPAL/G.1098/Rev.l), p. 53.
Miguel R. Solanes, op. cit., pp. 375 and 378. A.T. Watson, "Insurance Industry Can Help Reduce Disaster
Losses", UNDRO News, March/April 1985, pp. 17-18. 152 "UNDRO at work", UNDRO News, January/February 1988,
pp. 15 and 23. 163 «-pi g fQig Qf forestry in land management", op. cit., p. 21.
"The Pan-Caribbean Disaster Preparedness and Prevention Project", UNDRO News, March/April 1984, pp. 9-10.
Ibid., p. 10. F. McDonald, "Disaster Preparedness and the insurance
sector", UNDRO News, March/April 1985, p. 17. UNDRO, Directory of National and International Schools,
Institutions and Agencies Providing Training in Disaster Management, 1986, p. 146.
Economic Commission for Latin America, Report of the Committee of the Whole (E/CEPAL/G.1105), Thirteenth Special Session, 19 October, 1979, United Nations, Economic and Social Council, 24 October 1979, p. 14.
On the basis of information in "The Pan-Caribbean Disaster Preparedness and Prevention Project", op. cit., pp. 9-13.
All these figures refer to fiscal years between 1973 and 1987. The loans have been calculated on the basis of information provided in the annual reports of the respective banks. The figures refer to approvals and not actual disbursements. All loans have been classified by their main
190

purpose on the basis of project descriptions and/or name. Loans not directly related to water-related disaster rehabilitation, other operations (financing, grants, etc.) as well as cancellations, amendments, etc. usually have not been taken into consideration. The amounts of loans have been inflated/deflated by the United States Capital Equipment Price Index to constant U.S. dollars 1980. It has been assumed that all loans were granted in the year of their approval.
Denise Bure R., Francisco Pizarro A. and Nora Cabrera F., Diagnóstico de la contaminación marina en Chile. Anexos, CORFO, AF 86/37, Annex No. 2, February 1986.
On the basis of United Nations, Wastewater Reuse and its Applications in Western Asia, E/ESCWA/NR/84/2/Rev. l , December 1985, pp. 9-10.
Walter A. Castagnino, "Polución de agua, modelos y control". Serie técnica. No. 20, CEPIS, Environmental Health Division, Pan American Health Organization, p. 7.
Estimates are based on information taken from ECLAC, El Medio Ambiente en América Latina, Document 76-3-422-70, March 1976.
On the basis of information provided in World Health Organization and United Nations Environment Programme, "Global Pollution and Health", Global Environment Monitoring System (GEMS), 1987, pp. 9-11.
Luis Carrera de la Torre, Las Cuencas Hidrográficas del Ecuador y su Manejo Ambiental, document presented ai the First Ecuadorian Environmental Conference, Quito, Ecuador, February 1987, pp. 127-128.
República Argentina, Plan de Acción de Mar del Plata. Evaluación 1984. Report on the progress of and outlook for the application of the Mar del Plata Plan of Action submitted to the Water Committee, ECLAC, twentieth session, Lima, Peru, March 1984, p. 36.
Enrique Posada R. and Bernardo Pérez, "Consideraciones Económicas sobre la Evaluación de Impactos Ambientales", Contaminación Ambiental, No. 9, 1982, p. 15; and Mexico: SARH, Plan Nacional Hidráulico 1981, Mexico City, Comisión del Plan Nacional Hidráulico, p. 33.
Sandra Posíel, "Water: Rethinkiüg Management in an Age of Scarcity", Worldwatch Paper, 62 December 1984, p. 19.
Methodological approaches for the collection and assessment of data on pollutants flowing from industries located in the coastal area of ECE member countries, WATER/R.60/Add.l , 18 September 1978, annex IV, p. 1.
191

^ ^ UNDP, Resumen general sobre recursos y demandas. El Salvador: Plan maestro de desarrollo y aprovechamiento de los recursos hídricos, UNDP/ELS/78/005, Documento básico No. 14, May 1982, table 43; and ILO, Yearbook of Labour Statistics 1983, 43rd issue, 1983, Geneva, p. 44.
^ ^ ECLAC, Desarrollo industrial: Generación y manejo de los residuos (LC/R.602(Sem.41/6)), 28 August 1987, pp. 9, 17 and 18.
The chemical composition of industrial effluent in different sectors of the manufacturing industry is described on the basis of information provided in United Nations, Strategies, Technologies and Economics of Waste Water Management in ECE Countries, ECE/WATER/36, 1984, pp. 23-29.
^ ^ The coefficients for calculating the quantities of effluents generated in the course of industrial production in different sectors of manufacturing are taken from Walter A. Castagnino, "Polución de agua, modelos y control", op. cit., pp. 10 and 14.
Estimates of potential effluents in different sectors of manufacturing are based on conversion coefficients given in Walter A. Castagnino, op. cit:. United Nations, Methodological approaches ..., op. cit., annex III, p. 7 and annex IV, p. 1. These and other estimates given below are based on the corresponding coefficients and production and/or capacity figures and do not take into consideration possible differences in the technology actually used or the presence and/or absence of treatment facilities.
Walter A. Castagnino, op. cit., p. 11. UNEP, "Development and Environment in the Wider
Caribbean Region: A synthesis", UNEP Regional Seas Reports and Studies, No. 14, 2 August 1982, p. 16.
This description of the chemical composition of industrial effluent is based on information provided in United Nations, Strategies, Technologies and Economics of Waste Water Management in ECE Countries, op. cit., pp. 20-23; and H. I. Awad,"Industrial discharges into municipal wastewater transportation and treatment systems for country towns of New South Wales, Australia", Water Resources Journal (ST/ESCAP/SER.C/150), ESCAP, September 1986, pp. 48-51.
United Nations, Methodological approaches ..., op. cit. Annex I, p. 1.
These estimates are for the following 19 Latin American and Caribbean countries: Argentina, Barbados, Bolivia, Chile, Colombia, Cuba, Dominican Republic, Ecuador, El Salvador, Guatemala, Haiti, Mexico, Nicaragua, Panama, Peru, Suriname, Trinidad and Tobago, Uruguay and Venezuela.
192

Estimates are based 021 employaasoit figtjres for fes corresponding iadastries whiclh wer© iakeni from Umiisdl Naiioes, Industrial Statistics Yearbook 1985, General Industrial Statistics, ST/ESA/STAT/SER.P/24, vol. I, New York, 1987. la cases wfcsre employmesii figures for the imdcisSries ña qiaesiioEi ifflduésé employment ie other iiadiisíries as well, estimaies, wfcer® possible, were used; in several coumtries esíimattes were made for tlhe food, beverage and tobacco imdESiry as a whole.
Argentiaa: Secretaría de Estado de Traiasiporíe y Obras Públicas, Subsecretaría de Recursos Hídricos, Imsttñíniito Maciomal de Ciencia y Técmica Hídricas, tostituto de Economía, Legislaciósi y AdmisiisíracióB del Agaa, La demanda de agua en la República Argentina. Volumen 11: Uso industrial, INELA/E/! /12/76, Meadoza, Argentina, ¡976, p. 29.
^ ^ Chile: Ministerio de Satad, Contaminación Marina en Chile, Santiago, 1979, pp. 14-20.
International Sugar Organization, Sugar Yearbook 1984,1985, pp. 274-275.
UNDjP, Resumen general sobre recursos y demandas, op. cit..
Aloisio Barboza de Araiajc, O meio ambiente no Brasil: Aspectos económicos, Rio de Janeiro, IPEA/INPES, 1979, p. 86.
R. Reid, "The Caribbean RegioEal Water Resources Management Problems", ¥/aíer Quality Bulletin, vol. 3, No. 2, April 1978, p.
Group of Latin Americam and Caribbean Siagar Ejiportir^g Countries (GEPLACEA), Alcohol carburante: posibilidades para el desarrollo, 1987, p. 134.
Libardo Londoio C., "Alternativas posibles es el uso de los desechos líquidos de destiíería". Contaminación Ambiental, No. 9, 1982, p. 51; Mexico: Secretaría de AgriculíEra y Recursos Hidráulicos (SARH), Comisión del Plan Nacional Hidráulico, op. cit. Anexo 2, p. 6-17; and Venezuela: Ministerio del Ambiente y de los Recursos Naturales Renovables, Documento preliminar para la elaboración de un plan nacional de conservación, defensa y mejoramiento del ambiente, vol. II, Serie de planes D;GS?OA/?L/24, Caracas, October 1978, pp. 509-513.
Yojaoa Sharma, "Chock-fuíl of Goodness"', South, No. 64, February I9S6, p. 65.
Based on Annette Bingham, "Coffee adds to Coior-bia's problems", ¥/orld Water, January/February ]:9§5, pp. 34-35.
192 "paj-g superar maios olores". El Mercurio, Santiago, Chile, 29 January 1987.

pgrú: Instituto Nacional de Planificación, Comisión Multisectorial del Plan Nacional de Ordenamiento de los Recursos Hidráulicos, Modelo Prospectivo Informe al Horizonte 1990 (R. M. No. 0060-77-PM/ONAJ), December 1980, pp. 42-45; and UNEP, "Fuentes, niveles y efectos de la contaminación marina en el Pacífico Sudeste", Informes y Estudios del Programa de Mares Regionales del PNUMA, No. 21, Nairobi, 1983, p. 92.
Estimates are based on the production figures for fishmeal fit for human consumption, and for meals, solubles and similar animal foodstuffs of aquatic animal origin. Estimated effluent figures are only for effluent as such, excluding absorbent water and fish blood. Possible differences resulting from the technology employed and the presence or absence of treatment facilities were not taken into consideration. The figures are for potential effluent, not effluent actually produced.
Emilio Castanheira, "Balbina goes on line". International Dams Newsletter, vol. 2, No. 5, September/October 1987, pp. 4 and 12.
United Nations, Strategies, Technologies and Economics of Waste Water Management in ECE Countries, ECE/WATER/36, 1984, p. 20.
Perú: Instituto Nacional de Planificación, Comisión Multisectorial del Plan Nacional de Ordenamiento de los Recursos Hidráulicos, Modelo Prospectivo Informe al Horizonte 1990, op. cit., p. 44.
ESCAP, "Proceedings of the Working Group Meeting on Environmental Management in Mineral Resource Development", Mineral Resources Development Series No. 49, United Nations, 1982, p. 31.
UNESCO, "Impact of metals from mining and industry on the hydrosphere". Proceedings of a workshop. Workshop on metals and metalloids in the hydrosphere; impact through mining and industry, and prevention technology, Bochum, Federal Republic of Germany, 21-25 September 1987, Part I, Summary Report, p. 7.
Marc Dourojeanni, "Renewable Natural Resources of Latin America and the Caribbean: Situation and Trends", World Wildlife Fund, p. 251.
Ibid., p. 250. Chile: Ministerio de Salud, op. cit., p. 18. Perú: Instituto Nacional de Planificación, op. cit., p. 45.
204 ..£1 j jQ Rímac es el Más Sucio del Continente", El Comercio, Lima, 27 April 1986.
Mexico: Comisión del Plan Nacional Hidráulico, SARH, op. cit., p. 33.
194

R. Reid, "The Caribbean Region Water Resources Management Problems", Water Quality Bulletin, vol. 3, No. 2, April 1978, p. 4.
ECLAC/UNEP, El estado de la contaminación marina en la Región del Gran Caribe, E/CEPAL/PROY.3/L.INF.4, 25 October 1979, p. 26.
"La contaminación de las aguas". Ambiente, No. 1, vol. 10, 1987, p. 53.
209 "Venezuela Seeks Funds to Save Lake Maracaibo", World Water, October 1984, p. 11.
Mike Rose, "The Cost of Mexico's Filthy Riches", and "Catalogue of Devastation", South, No. 80, June 1987, pp. 106-107.
Rafael Valenzuela, Legislación ambiental en la América Latina (elementos para su conocimiento, desarrollo y parfeccionamiento), a supplemented and updated version of "Requerimientos para el desarrollo y la implementación de la legislación ambiental en la América Latina" prepared at the request of UNEP and presented at the "Meeting of high-level government experts on environmental law" ("Reunión ad hoc de Altos Funcionarios Gubernamentales Expertos en Derecho Ambiental"), held at Montevideo, Uruguay, 28 October-6 November 1981, p. 37.
H. Jeffrey Leonard, Natural Resources and Economic Development in Central America: A Regional Environmental Profile, International Institute for Environment and Development, Executive Summary, p. 18.
C. A. Alva, J. G. van Alphen, A. de la Torre and L. Manrique, "Problemas de Drenaje y Salinidad en la Costa Peruana", Bulletin 16, International Institute for Land Reclamation and Improvement, 1976, p. 28.
Marc Dourojeanni, op. cit., p. 110. 21® Estimated on the basis of information provided in FAO,
1985 FAO Fertilizer Yearbook, vol. 35, Rome, 1986, pp. 45-53. 21® G.I. Kaplin, "Land-use planning as a tool for soil and
ground-water protection", WATER/SEM.14/R.3, 27 July 1987, p. 4. Sandra Postel, "Defusing the toxics threat: Controlling
pesticides and industrial waste", Worldwatch Paper 79, September 1987, p. 11.
21® H. Jeffrey Leonard, op. cit., p. 20. 21® Estimated on the basis of United Nations, Consolidated
list of products whose consumption and/or sale have been banned, withdrawn, severely restricted or not approved by governments (ST/ESA/192), New York, 1987, second issue, pp. 121-226. A pesticide included in this list may have been restricted for various reasons. It is important to mote tJisii the fact that a
1 9 5

given product is not listed as regulated by a country does not necessarily mean that it is permitted in that country. Therefore, the fact that a particular country is not included in this list as restricting the use of a certain chemical does not imply that it uses it or permits its use. At the same time, it should be taken into consideration that decisions taken by a limited number of governments on a specific product may not be representative of other governments' positions, particularly in view of different risk-benefit considerations. For additional information please see the above-mentioned list.
Some of the countries listed in this table have restrictions on the use of the chemicals in question. Therefore, the pesticide in question might have been used in line with existing restrictions and/or for permitted purposes. A pesticide included in the list may have been restricted for various reasons. For additional details, please see United Nations, Consolidated list of products ..., op. cit.
Andrew Chetley, "Bitter Harvest in Costa Rica", South, No. 80, June 1987, pp. 107-108.
Marc Dourojeanni, Gran Geografía del Perú: Naturaleza y Hombre. Volumen IV, Recursos Naturales, Desarrollo y Conservación en el Perú, p. 137.
223 H. Jeffrey Leonard, op. cit., p. 21. 22<i H. Jeffrey Leonard, op. cit., p. 20. 225 Maria Elena Hurtado, "Agrotoxics: Blight on the next
generation". South, No. 77, March 1987, p. 97. 226 "Hydraulics Research", ODU Bulletin, Wallingford, January
1987, pp. 3 and 10. 227 Health Organization, Water pollution control. Report
of a WHO Expert Committee, World Health Organization Technical Reports Series, No. 318, Geneva, 1966, p. 9.
22® M. Varela, Policy, legal and technical measures to combat pollution of soil and ground water from non-point sources. Economic Commission for Europe, Committee on Water Problems, Seminar on Protection of Soil and Aquifers against Non-point Source Pollution, Madrid, Spain, 5-9 October 1987, WATER/SEM.14/R.2, 28 July 1987, p. 2.
229 Pan-American Health Organization, Las Condiciones de Salud en las Américas, 1981-1984, op. cit., p. 166.
230 ly^fg^ Management and Environment in Latin America, Water development, supply and management. Series Editor: Asit K. Biswas, vol. 12, p. 266.
23 G. N. Golubev, "Economic Activity, Water Resources and the Environment: A Challenge for Hydrology", Hydrological Sciences Journal, vol. 28, No. 1, July 1984, p. 57; quoted from World Resources
196
Institute and International Institute for Environment and Development, World Resources 1986, p. 136.
^ ^ Guillermo J. Cano, Legislación Latinoamericana (excluida la Argentina) sobre Contaminación Ambiental Antrópica, Fundación ARN, Mendoza, 15 April 1987, p. 19; and Instituto de Economía, Legislación y Administración del Agua (INELA), La demanda de agua en la República Argentina. Volumen II: Uso industrial. Secretaría de Estado de Transporte y Obras Públicas, Sub-secretaría de Recursos Hídricos, Instituto Nacional de Ciencia y Técnica Hídricas, INELA/E/I/12/76, Mendoza, Argentina, 1976, p. 192.
"State reform gets first impulse", Latin American Weekly Report, 2 July 1987, WR-87-25, p. 4.
INELA, op. cit., p. 192. ECLAC, Water Management and Environment in Latin
America, op. cit., p. 266. 23® Danilo Anton, Dwindling Water in the Sinking Cities, The
IDRC Reports, April 1986, p. 19. 23' El Medio Ambiente en México y América Latina, Ecología y
Sociedad series, Vicente Sánchez, Mexico, 1978, p. 150. 238 Pan-American Health Organization, op. cit., 1986, p. 150. 23® Estimated on the basis of information provided in EPA,
Office of Research and Development, Organic Compounds Entering Ground Water from a Landfill, Washington, D.C., 1974, EPA-660/2-74-077.
24° Ibid. 241 ECLAC, Resultados del Seminario sobre la Aplicación de los
Estudios de Impacto Ambiental en la Planificación de la Disposición de los Desechos Sólidos Urbanos e Industriales Generados en una Ciudad (LC/R.601(Sem.41/5)), 28 August 1987, p. 6.
242 Pan-American Health Organization, op. cit., p. 83. 243 Robin Wiseman, "Computers Aid Medellin Clean-up", World
Water, October 1984, p. 24. 244 Fabián Yáñez Cossio and Juan Carlos Bermeo C., Estudios
sobre control de la contaminación en ríos de alta montaña, January 1987, paper presented at the First Ecuadorian Environmental Conference (February 1987, Quito) p. 13.
245 Pan-American Health Organization, op. cit., pp. 14 and 159. 246 ECLAC, Water Management and Environment in Latin
America, op. cit., p. 223. 247 UNDP, Sistemas ambientales venezolanos. Project
VEN/79/001, preliminary version, Final Report, Caracas, October 1982, p. 270.
248 M. Varela, op. cit., p. 6.
197

María Elena Hurtado, "A Hard Rain Begins to Fall...", South, No. 61, November 1985, p. 150.
"Las Emisiones: Región por Región", El Mercurio, 29 January 1987.
Guillermo Cano, Legislación Latinoamericana (excluida la Argentina) sobre Contaminación Ambiental Antrópica, op. cit., p. 15.
Pan-American Health Organization, op. cit., 1986, pp. 48-53. Robin Wiseman, op.cit., pp. 24-25. Chile: Comisión Metropolitana de Descontaminación
Ambiental, Sub-Comisión Agua, Riego de Cultivos Hortícolas de Consumo Crudo con Aguas Contaminadas y su Relación con la Salud Pública, Republic of Chile, Intendencia Región Metropolitana, Santiago, Chile, August 1977, p. 4.
255 Mike Rose, op. cit., p. 106. 256 Chile: Comisión Metropolitana de Descontaminación
Ambiental, op. cit., p. 5. 25'' Sandra Postel, "Defusing the toxics threat: ...", op. cit.,
September 1987, p. 14. 258 INELA, op. cit., pp. 179-198. 259 José Guardado Chacón CSc., Aurora Fundora, Omar Vilches
and Vicente Molina, "Tasa de Democión Bacteriana en el Río Almendares", Voluntad Hidráulica, No. 70-71, 1986, pp. 2-7; and "Evaluación Preliminar del Estudio Sanitario de la Zona Arroyo Grande", Voluntad Hidráulica, No. 73, 1987, p. 41.
26" Marlise Simons, "The bay's a thing of beauty". The New York Times, September 16, 1987.
261 H. Weitzenfeld, "Water pollution in Colombia's Bay of Cartagena", Water Quality Bulletin, vol. 3, No. 2, April 1978, p. 15; "Las emisiones: Región por región". El Mercurio, 29 January 1987; Denise Bore R., Francisco Pizarro A. and Nora Cabrera F., op. cit., pp. 111-115; and UNEP, "Fuentes, niveles y efectos de la contaminación marina en el Pacífico Sudeste", Informes y Estudios del Programa de Mares Regionales del PNUMA, No. 21, 1983, p. 47.
262 E. Fano and M. Brewster, "Industrial Water Pollution Control in Developing Countries", Water Quality Bulletin, vol. 7, No.l , January 1982, p. 7
263 Guillermo J. Cano, op. cit., pp. 9-10. 264 Robin Wiseman, "PAHO Prompts Colombia's Progress",
World. Water, September 1984, p. 53. 265 United Nations, "Water resources legislation and
administration in selected Caribbean countries", Natural Resources/Water Series, No. 16, New York, 1986, pp. 7 and 89.
266 Henrique Meier, "Legislando sobre agua", Ambiente, No. 4, vol. 5, 1981, p. 45.
198

267 UNEP/ROLAC, Legislación Ambiental an América Latina y el Caribe, 1984, p. 95.
Ibid., p. 115. Guillermo J. Cano, op. cit., p. 20.
270 Ibid. Elias Suárez Matos, Water Resources Planning in Cuba,
United Nations, Water Resources Planning Experiences in a National and Regional Context, Report of a United Nations Workshop convened in Co-operation with the Government of Italy, Castelgandolfo and Stress, Italy, 18-29 June 1979, TCD/SEM.80/1, New York, 1980, p. 127.
United Nations, "Water resources legislation and administration in selected Caribbean countries", op. cit., p. 45.
Guillermo J. Cano, op. cit., pp. 21-22. 274 UNEP/ROLAC, op. cit., p. 95. 276 Guillermo J. Cano, op. cit., p. 22. 276 United Nations, op. cit., p. 119. 27 UNEP/ROLAC, op. cit., p. 155. 278 Guillermo J. Cano, op. cit., p. 20. 279 Ibid., p. 23. 2®° Robin Wiseman, op. cit., p. 53. 28 Guillermo J. Cano, op. cit., p. 19.
UNEP/ROLAC, op. cit., p. 18. Estimated on the basis of United Nations, Consolidated list
of products ..., op. cit. It is important to note that the fact that a given product is not listed as regulated by a country does not necessarily mean that it is permitted in that country. Therefore, the fact that a particular country is not included in this list as restricting the use of a certain pesticide does not iro.ply that it uses it or permits its use. At the same time it should be taken into consideration that decisions taken by a limited number of governments on a specific product may not be representative of other governments' positions, particularly in view of different risk-benefit considerations. For additional information please see the above-mentioned list.
284 Mexico: sale of dangerous pesticides denounced. Special United Nations Service (SUNS), No. 1859, 21 January 1988, p. 10.
285 UNEP/ROLAC, op. cit., p. 160. 286 "Rio Plata Flan", V/orld V/ater, July 1984, p. 19. 287 "Colombia Fights Water Pollution and Beforesiaticn", UNEP
News, July/August 1986, Supplement 3. 28® Guillermo J. Cano, op. cit., p. 19. 28® C. J. Kirchmer, "Water Quality Monitoring in Latin
America", Water Quality Bulletin, vol. 1, No. 2, Aprii 1976, p. 16.
199

United Nations, Questionnaire: Progress in the implementation of the Mar del Plata Action Plan: present status of and prospects for water resources development at the national level, 1983.
^ ^ Coordinadoria de Gestao de Recursos Hídricos, Recursos Hidricos - Aspectos Mais Relevantes sobre sua Administragao no Brasil, 2.IV. Qualidade das águas, Brazil; and Ministry of Mines and Energy, op. cit., p. 14.
R. Merino F., R. Sandoval L. and A. Grilli D-F, "Monitoring of Water Quality in Chile", Water Quality Bulletin, vol. 10, No. 3, July 1985, pp. 116 and 118.
C. F. Martinez, "The Control of Water Pollution in Cuba", Water Quality Bulletin, vol. 3, No. 2, April 1978, p. 9.
D. Muschett, "Water Quality Monitoring in Panama", Water Quality Bulletin, vol. 10, No. 2, April 1985, pp. 80-81 and 105.
Guillermo J. Cano, op. cit., p. 23. Duncan Mara, Howard Pearson and Saloao A. Silva,
"Brazilian Stabilization-Pond Research Suggests Low-Cost Urban Applications", World Water, July 1983, p. 20.
29 Carlos A. Richter and Elenice C. Roginski, "Water Sanitation Research in the State of Parana, Brazil", Water Quality Bulletin, vol. 9, No. 4, October 1984, pp. 208-212.
29® Sandra Postel, op. cit., p. 32. 299 Denise Searle, op. cit., p. 53.
R. Sáenz, "Use of wastewater treated in stabilization ponds for irrigation - Evaluation of microbiological aspects". Water Quality Bulletin, vol. 12, No. 2, April 1987, pp. 87-88.
Christiaan Gischler and C. Fernández Jáuregui, "Técnicas económicas para la conservación y gestión del agua en América Latina", La Naturaleza y Sus Recursos, UNESCO, vol. XX, No. 3, July-September 1984, p. 13.
"2 Alyson Claire Warhurst, "A Bug Turns Waste to Profit", South, February 1984, p. 43.
Yojana Sharma, op. cit., p. 65. 304 "Agriculture/Mexico", Latin American Weekly Report,
25 June 1987, WR-87-24, p. 3. Sandra Postel, "Defusing the toxics threat: controlling
pesticides and industrial waste", Worldwatch Paper 79, September 1987, pp. 27-28.
IDB, 1985 Annual Report, Inter-American Development Bank, pp. 13-14.
The World Bank Annual Report 1985. D. 74.
200

Steve Schwartzman, "Is the World Bank living up to its promises?". International Dams Newsletter, vol. 2, No. 5, September/October 1987, pp. 1 and 10.
The World Bank Annual Report 1986, p. 135.
701


ANNEXES


Annex 6 (cont.10)
Sub-region Type of disaster Number
Central America and the Caribbean All disasters 91 Drought 20 Flood 26 Land/muds Iide 1 Windstorm 44
South America All disasters 127 Drought 8 Flood 80 Land/mudsl ide 32 Uindstorm 7
Total All disasters Drought Flood fi' Land/mudslide Uindstorm
218 28
106 33 51
Type of disaster
Central America and the Caribbean
Type of disaster
Central America and the Caribbean
South America Events for which data have been available as percentage of events
of similar type included in table 1
Drought 0 20 3.57 Flood 3 133 5 719 69.81 Land/mudslide 10 31 752 90.91 Uindstorm 16 570 425 56.86
Total 19 713 37 916 61.47
All disasters D r o u g h t Flood L and/muds I i de Windstorm
All disasters Drought Flood Land/mudst ide Uindstorm
91 20 26
1
127 8
80 32 7
All disasters Drought Flood fi' Land/mudslide Uindstorm
218 28
106 33 51
According to available information, of the 106 floods at least 21 were accompanied by land/ mudslides.
Table 2
NUMBER OF DEAD, INJURED AND MISSING, BY SUB-REGION AND TYPE OF DISASTER
Type of disaster
Central America and the Caribbean
South America Events for which data have been available as percentage of events
of similar type included in table 1
Drought Flood Land/muds Iide uindstorm
0 3 133
10 16 570
20 5 719
31 752 425
3.57 69.81 90.91 56.86
37 916
Note: The above information has been obtained from the analysis of data on water-related natural disasters in Latin American and Caribbean countries between 1979 and 1987. It has been gathered from a great variety of sources ranging from specialized publications of competent international and national organizations to newspaper and magazine articles. Unfortunately, it has not always been possible to verify whether the information is true to fact or not. This annex does not include all water-related natural disasters that took place in the region between 1979 and 1987, and information available on each of them is not necessarily directly comparable.
205

Annex 1 (conc l . )
Table 3
DAMAGE CAUSED, BY TYPE OF DISASTER (constant 1980 US do l la rs )
Type of disaster
Estimated damage (mi I lions constant
US dol lars at 1980 prices) (%)
Events for which data have been avai lable as percentage of events
of similar type included in table 1
Drought 123.3 1.3 7.14 Flood 5 416.8 58.4 20.75 Land/muds I ide 321.4 3.5 6.06 Utndstorm 3 407.8 36.8 25.49
Total 9 269.4 100.0 17.89
Note: The reported amount of damage has been in f la ted /de f la ted by the United States Capital Equipment Price Index.
206
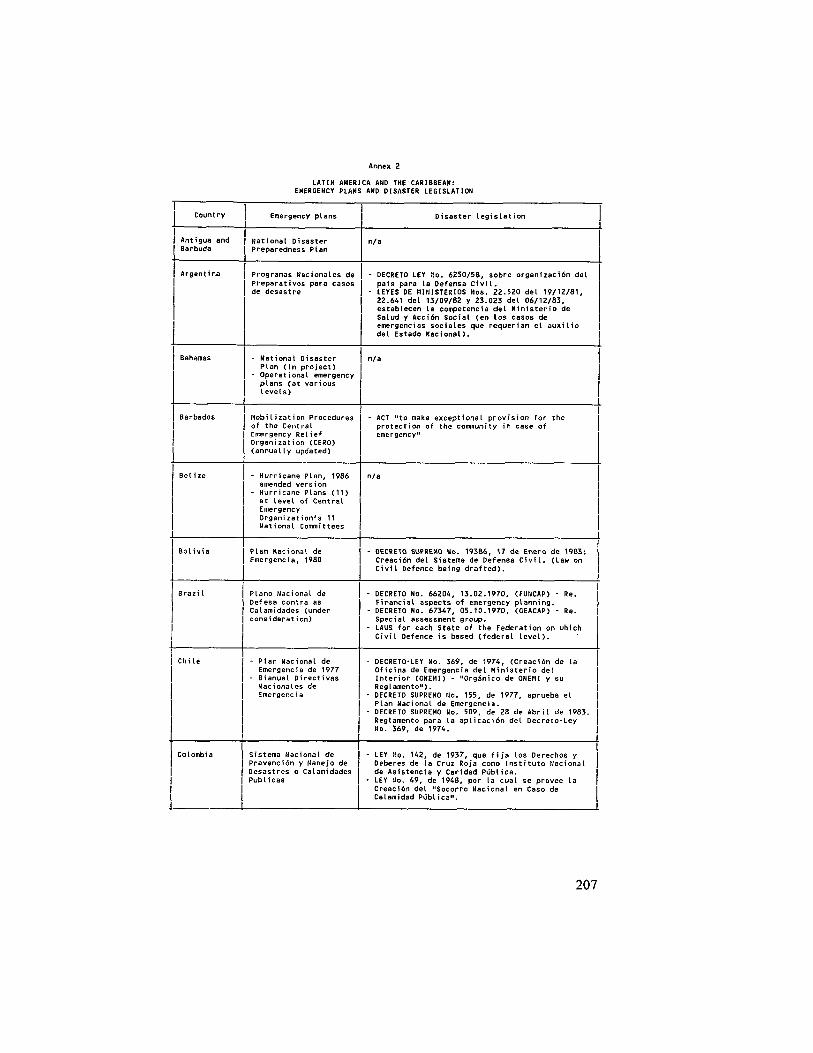
Country Emergency plans Disaster legislation
Antigua and Barbuda
National Disaster Preparedness Plan
n/a
Argentina Programas Nacionales de Preparativos para casos de desastre
- DECRETO LEY No. 6250/58, sobre organización del país para la Defensa Civil.
- LEYES DE MINISTERIOS Nos. 22.520 del 19/12/81, 22.641 del 13/09/82 y 23.023 del 06/12/83, establecen la competencia del Ministerio de Salud y Acción Social (en los casos de emergencias sociales que requerían el auxilio del Estado Nacional).
Bahamas - Mational Disaster Plan (in project)
- Operational emergency plans (at various levels)
n/a
Barbados Mobilization Procedures of the Central Emergency Relief Organization (CERO) (annually updated)
- ACT "to make exceptional provision for the protection of the community in case of emergency"
Belize - Hurricane Plan, 1986 amended version
- Hurricane Plans (11) at level of Central Emergency Organization's 11 National Committees
n/a
Bolivia Plan Nacional de Emergencia, 1980
- OECRETO SUPREMO Mo. 19386, 17 de Enero de 1983: Creación del Sistema de Defensa Civil. (Law on Civil Defence being drafted).
Brazil Plano Nacional de Defesa contra as Calamidades (under consideration)
- DECRETO No. 66204, 13.02.1970, (FUMCAP) - Re. Financial aspects of emergency planning.
• DECRETO No. 67347, 05.10.1970, (GEACAP) - Re. Special assessment group.
• LAWS for each State of the Federation on uhich Civil Defence is based (federal level).
Chile - Plan Nacional de Emergencia de 1977
- Bianual Directivas Nacionales de Emergencia
' DECRETO-LEY No. 369, de 1974, (Creación de la Oficina de Emergencia del Ministerio del Interior (ONEMI) - "Orgánico de ONEMI y su Reglamento").
• DECRETO SUPREMO No. 155, de 1977, aprueba el Plan Nacional de Emergencia.
• DECRETO SUPREMO No. 509, de 28 de Abril de 1983. Reglamento para la aplicación del Decreto-Ley Mo. 369, de 1974.
Colombia Sistema Nacional de Prevención y Manejo de Desastres o Calamidades Publicas
- LEY Mo. 142, de 1937, que fija los Derechos y Deberes de la Cruz Roja como Instituto Nacional de Asistencia y Caridad Pública.
- LEY No. 49, de 1948, por la cual se provee la Creación del "Socorro Nacional en Caso de Calamidad Pública".
Disaster legislation
lity in case of
- Hurricane Plan, 1986 amended version
- Hurricane Plans (11) at level of Central Emergency Organization's 11 National Committees
Bolivia Plan Nacional de Emergencia, 1980
OECRETO SUPREMO Mo. 19386, 17 de Enero de 1983: Creación del Sistetna de Defensa Civil. (Law on Civil Defence being drafted).
Piano Nacional de Defesa contra as Calamidades (under consideration)
DECRETO No. 66204, 13.02.1970, (FUMCAP) - Re. Financial aspects of emergency planning. DECRETO No. 67347, 05.10.1970, (GEACAP) - Re. Special assessment group. LAWS for each State of the Federation on uhich Civil Defence is based (federal level).
Chile Plan Nacional de Emergencia de 1977 Bianual Directivas Nacionales de Emergencia
DECRETO-LEY No. 369, de 1974, (Creación de la Oficina de Emergencia del Ministerio del Interior (ONEMI) - "Orgánico de ONEKI y su Reglamento"). DECRETO SUPREMO No. 155, de 1977, aprueba el Plan Nacional de Emergencia. DECRETO SUPREMO No. 509, de 28 de Abril de 1983. Reglamento para la aplicación del Decreto-Ley Mo. 369. de 1974.
Colombia Sistema Nacional de Prevención y Manejo de Desastres o Calamidades Diihl iVac
- LEY Mo. 142, de 1937, que fija los Derechos y Deberes de la Cruz Roja como Instituto Nacional de Asistencia y Caridad Pública.
- LEY No. 49, de 1948, por la cual se provee la Creación del "Socorro Nacional en Caso de Calamidad Púhltra".
207

Country Emergency plans Disaster legislation
continued Colombia
- DECRETO-LEY No, 2341, de 1971, por el cual se organiza la Defensa Civil.
- LEY No. 9A, de 1979: Código Sanitario Nacional. Título VIII • "Desastres".
- DECRETO No. 3489, de 1982, por el cual se reglamenta el Título VIII de la Ley No. 9A de 1979 y el Decreto-Ley No. 2341 de 1971 en cuanto a Desastres.
• DECRETO-LEY No. 1547, de 1984: Creación del Fondo Nacional de Calamidades; Normas para su Organización y Funcionamiento.
- DECRETO No. 2068, de 1984, por el cual se modifican algunas disposiciones del Decreto-Ley No. 2341 de 1971, Orgánico de la Defensa Civil Colombiana, y se dictan otras Disposiciones.
- PROYECTO DE LEY por el cual se crea y organiza el sistema nacional de Prevención y Manejo de Desastres o Calamidades Públicas.
Costa Rica Documento Básico para elaboración del Plan Nacional de Emergencia 1976
- LEY No. 4374, de 14 de Agosto de 1969. "Ley Nacional de Emergencia". Creación de la Comisión Nacional de Emergencia.
- DECRETO EJECUTIVO No. 4020-T, de 13 de Agosto de 1974. "Reglamento de Emergencias Nacionales".
- DECRETO No. 17031 -P-MOPT, de 16 de Mayo de 1986 (Modificaciones de la legislación sobre ta Comisión Nacional de Emergencia).
- DECRETO No. 17275-P-MOPT, de 31 de Octubre de 1986.
Cuba - Plan for Protection agai nst Hurri canes and Heavy Rains
- Plan for Protection against Catastrophes
- LAW No. 1194, of 11 July 1966, on Civil Defence
Dominica (Commonwealth of)
Disaster Emergency Plan 1981 (1986: draft of revised version)
- EMERGENCY POWERS ORDINANCE of 16 July 1951
Dominican Republic
National Disaster Plan 1986
• LEY No. 257, of June 1966. Establishment of an Office of Civil Defence. Provision for the Preparation of a Plan and General Programme for Civil Defence in the whole territory.
Ecuador Plan Nacional de Defensa Civil
- DECRETO EJECUTIVO No. 1463, de 8 de Enero de 1986. Creación de la Unidad Ejecutora de Obras Emergentes (Executing Unit for Emergencies).
- DECRETO No. 436, de 28 de Julio de 1980, aprueba el Plan Nacional de Defensa Civil.
El Salvador - Plan General de Emergencia "ESPERANZA-84" (Comité de Emergencia Nacional, 1984)
- Sectorial and other emergency plans, manuals, etc., 1984-86.
- DECRETO LEGISLATIVO No. 498, de 8 de Abril de 1976. Creación del Sistema de Defensa Civil como parte integrante de la Defensa Nacional.
• LEY DE EMERGENCIA NACIONAL para Auxilio a la Población Civil.
- REGLAMENTO de la Ley de Emergencia Nacional para Auxilio a la Población Civil.
Disaster legislation
DECRETO-LEY Mo, 2341, de 1971, por el cual se organiza la Defensa Civil. LEY No. 9A, de 1979: Código Sanitario Nacional. Título VIII • "Desastres". DECRETO No. 3489, de 1982, por el cual se reglamenta el Título VIII de la Ley No. 9A de 1979 y el Decreto-Ley No. 2341 de 1971 en cuanto a Desastres. DECRETO-LEY No. 1547, de 1984: Creación del Fondo Nacional de Calamidades; Normas para su Organización y Funcionamiento. DECRETO No. 2068, de 1984, por el cual se modifican algunas disposiciones del Decreto-Ley No. 2341 de 1971, Orgánico de la Defensa Civil Colombiana, y se dictan otras Disposiciones. PROYECTO DE LEY por el cual se crea y organiza el sistema nacional de Prevención y Manejo de Desastres o Calamidades Públicas.
LEY No. 4374, de 14 de Agosto de 1969. "Ley Nacional de Emergencia". Creación de la Comisión Nacional de Emergencia. DECRETO EJECUTIVO No. 4020-T, de 13 de Agosto de 1974. "Reglamento de Emergencias Nacionales". DECRETO No. 17031 -P-MOPT, de 16 de Mayo de 1986 (Modificaciones de la legislación sobre ta Comisión Nacional de Emergencia). DECRETO No. 17275-P-MOPT, de 31 de Octubre de 1986.
- Plan for Protection agai nst Hurri canes and Heavy Rains
- Plan for Protection against Catastrophes
- LAW No. 1194, of 11 July 1966, on Civil Defence
Dominica (Commonwealth of)
Disaster Emergency Plan 1981 (1986: draft of revised version)
- EMERGENCY POWERS ORDINANCE of 16 July 1951
Dominican Republic
National Disaster Plan 1986
LEY No. 257, of June 1966. Establishment of an Office of Civil Defence. Provision for the Preparation of a Plan and General Programme for Civil Defence in the whole territory.
Ecuador Plan Nacional de Defensa Civil
DECRETO EJECUTIVO No. 1463, de 8 de Enero de 1986. Creación de la Unidad Ejecutora de Obras Emergentes (Executing Unit for Emergencies). DECRETO No. 436, de 28 de Julio de 1980, aprueba el Plan Nacional de Defensa Civil.
El Salvador - Plan General de Emergencia "ESPERANZA-84" (Comité de Emergenci£ Nacional, 1984)
- Sectorial and other emergency plans, manuals, etc., 1984-86.
DECRETO LEGISLATIVO No. 498, de 8 de Abril de 1976. Creación del Sistema de Defensa Civil como parte integrante de la Defensa Nacional. LEY DE EMERGENCIA NACIONAL para Auxilio a la Población Civil. REGLAMENTO de la Ley de Emergencia Nacional para Auxilio a la Población Civil.
208

Anne* 2 ( c o n t . 2 )
Country Emergency plans Disaster legislation
Grenada - National Disaster Plan (completed in 1983)
- Disaster Preparedness Programme.
n/a
Guatemala Plan de Trabajo 1986 del Comité Nacional de Emergencia
- ACUERDO GUBERNATIVO, 8 de Septiembre de 1969. Creación del Comité Nacional de Emergencia.
- ACUERDO GUBERNATIVO, 28 de Septiembre de 1971. Ratificación con carácter de Permanente
- REGLAMENTO GENERAL del Comité Nacional de Emergencia, Agosto de 1981.
Guyana National Disaster Preparedness Plan (draft) 1985
n/a
Haiti Projet de Plan ORSEC Cyclone - 1985
- LOI portant création et organisation de l'Organisatlon Pré-Désastre et de Secours (OPDES), 1983.
Honduras Emergency Measures 1981 (according to Instruction No. 1 of Consejo Permanente de Emergencia Nacional (COPEN))
• DECRETO LEY No. 33 de 13 de Marzo de 1973 y sus respectivas Reformas de fecha 30 de Marzo de 1975. Creación del COPEN.
- INSTRUCTIVO PC No. 01 de U de Agosto de 1981, de Procedimientos para tomar medidas en situaciones de emergencia causadas por desastres naturales (COPEN).
Jamaica - Emergency Operations National Disaster Plan 1980
- Preparedness Plans for individual Parishes and Communities and for each hazard
- GOVERNMENT DECISION, dated July 1980, to establish an Office of Disaster preparedness and Emergency Relief Co-ordination (ODP).
Mexico Programa de Protección Civil
• DECRETO por el que se aprueban las Bases para el Establecimiento del Sistema Nacional de Protección Civil, 1986. (Diario Oficial, Estados Unidos Mexicanos, Mexico D.F., Martes 6 de Mayo de 1986).
Nicaragua National Disaster Plan (in preparation, 1985)
- DECRETO No. 113 de 5 de Abril de 1973. Emergencia Nacional.
Panama Plan de Protección Civil 1982
- LEY No. 22 de 15 de Noviembre de 1982. Creación del Sistema de Protección Civil para Casos de Desastre (SIMAPROC).
- RESUELTO No. 682 de 13 de Noviembre de 1984. Creación del Nuevo Comité ad hoc. oresidido oor S.E. el Ministro de Gobierno y Justicia.
Paraguay n/a - LEY No. 832 de 1980. "Ley de la Organización General de las Fuerzas Armadas" (Art. 3 - Defensa Civil).
- ESTATUTOS del Consejo Nacional de Entidades de Beneficencia (CONEB), de 1983.
209

Annex 6 (cont.10)
Country Emergency plans Disaster legislation
Peru Plan de Operaciones de Emergencia (de Defensa Civil) 1983
- DECRETO LEY No. 19338 de 10 de Marzo de 1972. Lay de Creación del Sistema de Defensa Civil.
- DECRETO SUPREMO No. 017-72-IN de 25 de Julio de 1972. Reglamento de Defensa Civil
- DIRECTIVA No. 03 DC/SE (4) - Formulación del Plan de Operaciones de Emergencia de Defensa Civil, 1983.
- RESOLUCION DIRECTORAL Mo. 0003-87-IN-OC/SE, de 6 de Febrero de 1987, nombran Comision encargada de recibir donaciones en dinero y especie para ser destinados a damnificados.
Saint Christopher and Nevis
(New) Disaster Plan 1984 (draft)
n/a
Saint Lucia National Disaster Plan (last revised version) 1985
n/a
Saint Vincent and the Grenadines
National Disaster Plan 1986
n/a
Suri name n/a n/a
Trinidad and Tobago
Basic System for Disaster Preparedness
n/a
Uruguay n/a - LEY No. 15.688, de 11 de Noviembre de 1984 - Ley de Defensa Civil.
- Ley No. 15.808, de 7 de Abril de 1986 - Se modifica la Ley Orgánica de las Fuerzas Armadas.
Venezuela - Programas de la Comisión Nacional de Defensa Civil
- Plan Regional de Defensa Civil (Plan TIPO, 1974)
- DECRETO No. 702 de 7 de Septiembre de 1971. Creación de la Comisión Nacional de Defensa Civil.
- DECRETO No. 533 de 12 de Noviembre de 1974. Comisión Nacional de Defensa Civil.
- DECRETO No. 231 de 10 de Agosto de 1979. Reorganización de la Comisión Nacional de Defensa Civil ("La CNDC organizará una Oficina Coordinadora de D.C.").
Source: Office of the United Nations Disaster Relief Co-ordinator (UNDRO), List of national officials responsible for the management of disasters and other emergencies, emergency plans and disaster legislation. 1987.
n/a = Information has not been available or there are no emergency plans and/or disaster legislation. This list is not necessarily exhaustive.
210

LATIN AMERICA AND THE CARIBBEAN: NATIONAL ORGANIZATIONS IN THE FIELD OF DISASTER HANAOEHENT
Country National organizations in the field of disaster management
AnguiI la - National Disaster Committee under the chairmanship of the Governor - Permanent Secretary/Co-ordinator of Disaster Preparedness, Cabinet
Secretary, Chief Minister's Office
Antigua and Barbuda
- National Disaster Committee under the chairmanship of the Honourable Minister of Health
- National Disaster Co-ordinator, Ministry of Home Affairs
Argentina - Dirección Nacional de Defensa Civil, Ministerio de Defensa - Dirección Nacional de Emergencias Sociales (DINES), Ministerio de Salud y
Acción Social
Bahamas - Civil Defense Department - National Disaster Co-ordinator, Prime Minister's Office
Barbados Central Emergency Relief Organization (CERO), Prime Minister's Office
Belize Central Emergency Organization, Office of the Premier
Bermuda Police Headquarters
Bol i via Dirección Nacional de Defensa Civil, Ministerio de Defensa Nacional
Brazil - Civil Defense, Ministry of the Interior - Grupo Especial para Asuntos de Calamidades (GEACAP), Ministry of the
Interior - Fondo Especial para Calamidades Publicas (FUNCAP), Ministry of the
Interior - Defensa Civil do Estado de Sao Paulo
British Virgin Islands
National Disaster Co-ordinator, Assistant Secretary to Deputy Governor
Cayman Islands
Deputy Commissioner of Police
Chile Oficina Nacional de Emergencia (ONEMl), Ministerio del Interior
Colombia - Dirección Nacional de la Defensa Civil • National Co-ordinator on Disaster Prevention and Management, General
Secretary, President's Office
Costa Rica • Civil Defence - National Health-Sector Emergency Commission (CONESS)
Cuba Oficina de Desastres, Defensa Civil
Dominica (Commonwealth of)
National Emergency Planning Organization, Office of the Prime Minister
211

Annex 6 (cont.10)
Country National organizations in the field of disaster management
Dominican Republic
- Civil Defence Ministry • National Director of Emergencies, Secretariat of Public Health and Social
Welfare
Ecuador • Dirección Nacional de Defensa Civil - Dirección de la Unidad Ejecutora de Obras Emergentes
El Salvador Comité de Emergencia Nacional (COEN), Ministerio del Interior
Grenada - Office of Disaster Preparedness, Ministry of Information and National Security
• Parliamentary Election Officer/National Disaster Co-ordinator, Office of the Prime Minister
Guatemala Comité Nacional de Emergencia (CONE)
Guyana Civil Defence Commission chaired by the Minister of Health and Public Welfare
Haiti Organisation Pré-Désastre et de Secours (OPDES), Ministére de la Santé Publique et de la Population
Honduras Consejo Permanente de Emergencia Nacional (COPEN)
Jamaica Office of Disaster Preparedness and Emergency Relief Co-ordination
Martinique Direction Departementale de la Securite Civile
Hex i CO - Sistema Nacional de Protección Civil - Subsecretaría de Asentamientos Humanos, Dirección General de Prevención y
Atención de Emergencias Urbanas (SAHOP) • Centre Medical de l'Universite Autonoroe (UNAM) - Fondo Nacional para Actividades Sociales (FONAPAS)
Montserrat Government Information Officer, National Disaster Co-ordinator
Nicaragua • Comité Nacional de Emergencia Frente al Desastre • Oficina de Defensa Civil Nacional, Ministerio de Defensa
Panama Sistema Nacional de Protección Civil para Casos de Desastres (SINAPROC), Ministerio de Gobierno y Justicia
Paraguay • Civil Defence Organization, Ministry of the Interior - Consejo Nacional de Entidades de Beneficencia (CONEB)
Peru - Comité Nacional de Defensa Civil - Division of Emergencies and Catastrophes, Department of Epidemiology,
Ministry of Health
Puerto Rico Oficina de Defensa Civil, Oficina del Gobernador
212

Annex 6 (cont.10)
Country National organizations in the field of disaster management
Saint Christopher and Nevis
Permanent Secretary and Federal Disaster Co-ordinator, Ministry of Home Affairs
Saint Lucia National Disaster Co-ordinator, Prime Minister's Office
Saint Vincent and the Grenadines
- Central Emergency Relief Organization - National Disaster Co-ordinator, Ministry of Housing and Labor
Sur iname Bureau of Public Health
Trinidad and Tobago
National Emergency Relief Organization, Ministry of Mational Security
Turks end Caicos
National Disaster Co-ordinator, Under-Secretary, Chief Minister's Office
Uruguay - Servicio General de Defensa Civil, Ministerio de Defensa Nacional - Comité de Asistencia
Venezuela - Dirección Nacional de Defensa Civfl, Ministerio de Relaciones Interiores - FUNDASOCIAL
US Virgin Islands
Civil Defense and Emergency Services, Office of the Governor
Source: United Nations Office of the Disaster Relief Co-ordinator (UNDRO), 1986; and UNDRO, list of national officials responsible for the management of disasters and other emergencies, emergency plans and disaster legislation. 1987.
Note: This list is not necessarily exhaustive.
213

Annex 4
LIST OF ECLAC DOCUMENTS IN THE FIELD OF NATURAL DISASTER DAMAGE ASSESSMENT
L Informe sobre los daños y repercusiones del terremoto de la Ciudad de Managua en la economía nicaragüense (CEPAL/MEX/73/Nic.l; E/CN.12/AC.64/2/Rev.l), 1973.
2. Informe sobre los daños causados en Antigua y Barbuda por el sismo del 8 de octubre de 1974 y sus repercusiones (E/CEPAL/1001-(ESP).
3. Informe sobre los daños y repercusiones del huracán Fifí en la economía hondureña (E/CEPAL/AC.67/2/Rev.l), 1974.
4. Evaluación de los daños causados por el temporal en Granada y repercusiones para los programas de desarrollo económico (E/CEPAL/CDCC/9), 1975.
5. Daños causados por el terremoto de Guatemala y sus repercusiones sobre el desarrollo económico y social del país (CEPAL/MEX/76/Guat.l), 1976.
6. Report on the Effect of Hurricane "David" on the Island of Dominica (E/CEPAL/G.1099), 1979.
7. República Dominicana: Repercusiones de los huracanes David y Frederico sobre la economía y las condiciones sociales (E/CEPAL/G. 1098)/Rev. 1).
8. Guatemala: Repercusiones de los fenómenos meteorológicos ocurridos en 1982 sobre la situación económica del país (E/CEPAL/MEX/L.31), 1982.
9. El Salvador: Los desastres naturales de 1982 y sus repercusiones sobre el desarrollo económico y social (E/CEPAL/MEX/1982/L.30), 1982.
10. Nicaragua: Las inundaciones de mayo de 1982 y sus repercusiones sobre el desarrollo económico y social del país (E/CEPAL/G. 1206), 1982.
214

11. The Natural Disasters of 1982-1983 in Bolivia, Ecuador and Peru (E/CEPAL/G.1274), 1983.
12. Ecuador: Evaluación de los efectos de las inundaciones de 1982/1983 sobre el desarrollo económico y social (E/CEPAL/G.1240), 1983.
13. Repercusiones de los fenómenos meteorológicos de 1982 sobre el Desarrollo Económico y Social de Nicaragua (E/CEPAL/MEX/1983/L.l), 1983.
14. Damage Caused by the Mexican Earthquake and its Repercussions upon the Country's Economy (LC/G. 1367), 1985.
15. The 1986 San Salvador Earthquake: Damage, Repercussions and Assistance Required (LC/G. 1443) plus addendum containing Project Profiles (LC/G.1443/Add.l), 1986.
16. Economic and Social Consequences of Recent, Major Natural Disasters in Latin America and the Caribbean: A Need for Prevention and Planning, 1986.
17. The Natural Disaster of March 1987 in Ecuador and its Impact on Social and Economic Development (LC/G.1465), 1987.
215

Annex 5
LATIN AMERICA AND THE CARIBBEAN: ESTIMATES OF DOMESTIC SEWAGE OUTFLOW AND COMPOSITION FOR
CITIES WITH 100 000 INHABITANTS OR MORE IN 1980, BY MAJOR HYDROGRAPHIC BASINS AND
COUNTRIES a/
a/ The presence or absence of waste water treatment facilities has not been taken into consideration.
These estimates are based on: i) Population in 1980 (Latin American Center, Statistical
Abstract of Latin America, University of California, Los Angeles, various recent years; and other sources),
ii) Sewerage service (house connections) coverage of the urban population for the country as a whole (1980); in the cases where this information has not been available, coverage by sewerage and excreta disposal services was used (WHO, The International Drinking Water Supply and Sanitation Decade-Review of National Baseline Data (as at December 1980), Offset Publication No. 85; PAHO/WHO, Environmental Health Program, International Drinking Water Supply and Sanitation Decade, Regional Progress Report, Environmental series No. 6, p. 18; and Osvaldo Montero Ojeda, Instituto de Hidroeconomía, El Programa cubano para el abastecimiento de agua y saneamiento para poblaciones de bajos ingresos, Seminario Regional sobre Agua Potable y Saneamiento para Grupos de Bajo Ingreso en Comunidades Rurales y Urbano-marginales, Recife, 1988, Documento No. 14, p. 3);
iii) The level of consumption is taken to be 200 litres per capita per day;
iv) The following conversion factors are applied: DBO5 - 19.7 kg/inh./year, phosphorus - 0.4 kg/inh./year, nitrogen - 3.3 kg/inh./year, suspended solids - 20.0 kg/inh./year (United Nations, ECLAC, Desarrollo industrial: generación y manejo de los residuos (LC/R.602(Sem.41/6), 28 August 1987, p. 52).
216

Latín Aflterica and the Caribbean: Estimates of Doniestic Sewage Outflow and Cofrposition for Cities with 100 000 Inhabitants or more in 1980, b/ Major Hydrographic Basins and Countries
Cities by major hydrographic basins, coiJitries, and recipient Mater bodies
OOHESTIC SEWAGE
OUTFLOUS <m3/sec)
DBO (Ton/year)
PHOSPHORUS (Ton/year)
NITROGEN (Ton/year)
SUSPENDED SOLIDS ÍTon/year)
BASIN: Amazon
Bolivia Cochabauija La Paz
Rocha Choqueyapu Pirai
O.U 0.43 0.18
1 130 3 682 1 534
24 75 31
198 617 257
1 197 3 738 1 558
Subtotal 0.75 6 396 130 1 071 6 493
Brazil Belein Campo Grande
Harajo Bay Aripuana
0.56 0.21 0.45
4 779 1 783 3 865
97 36 78
801 299 647
4 852 1 810 3 924
Subtotal 1.23 10 427 212 1 747 10 586
Peru Cuzco Huancayo Iquitos
Vilcanota Negro
0.23 0.21 0.23
2 000 1 787 1 937
41 36 39
335 299 324
2 030 1 814 1 966
Peru Cuzco Huancayo Iquitos
Subtotal 0.6? 5 724 116 959 5 all
TOTAL FOR BASIN 1 2.65 22 546 458 3 777 22 890
BASIN: Brazil, north-east |
Brazil Canpina Grande Caruaru Fortaleza Joao Pessoa Juazeiro do Norte Mace i 0 Natal 01 inda Recife Sao Luis Teresina
Paraiba Ipojuca Atlantic Ocean Atlantic Ocean Salgado Atlantic Ocean Atlantic Ocean Capibaribe Atlantic Ocean San Marcos Bay Parnaiba
0.16 0.10 0.48 0.22 0.09 0.28 0.28 0.20 0.S8 0.14 0.25
1 401 868
4 090 1 831 790
2 373 2 374 1 679 7 465 1 150 2 139
28 18 83 37 16 48 48 34 152 23 43
235 145 685 307 132 398 398 281
1 251 193 358
1 422 881
4 152 1 859 802
2 409 2 410 1 705 7 579 1 168 2 171
Brazil Canpina Grande Caruaru Fortaleza Joao Pessoa Juazeiro do Norte Mace i 0 Natal 01 inda Recife Sao Luis Teresina
Subtotal 3.0? 26 160 531 4 382 26 558
TOTAL fOR BASIN | 1 3.07 26 160 531 4 382 26 55S
BASIN: California 1
Mexico Ciudad Obregon Culiacan Durango Ensenada Hermosillo Mazatlan Mexican Ti Juana
raqui Culiacan Hezquital Pacific Ocean Sonora Pacific Ocean Colorado Tijuana
0.21 0.37 0.26 0.16 0.36 0.21 0.40 0.64
1 754 3 130 2 208 1 345 3 082 1 798 3 364 5 467
36 64 45 27 63 37 68 111
294 524 370 225 516 301 564 916
1 781 3 178 2 241 1 365 3 129 1 826 3 416 5 550
Mexico Ciudad Obregon Culiacan Durango Ensenada Hermosillo Mazatlan Mexican Ti Juana
Subtotal 2.60 22 148 450 3 710 22 486
TOTAL FOR BASIN | 2.60 22 148 450 3 710 22 486
217

Annex 6 (cont.10)
DOMESTIC cities by major hydrograph c basins, comtries, SEUAGE DBO PHOSPHORUS NITROGEN SUSPENDED
and recipient water bodies OUTfLOUS (Ton/year) (Ton/year) (Ton/year) SOLIDS (m3/sec) (Ton/year)
BASIK: Caribbean
Colorbia Armenia Cauca 0.25 2 166 44 363 2 199 Barrancabemieja Magdalena O.l» 1 651 34 277 1 676 Sarranquilla Magdalena 1.27 10 775 219 1 805 10 939 Bogota Bogota 5.61 47 765 970 8 001 48 493 Bucaramanga Lebrija 0.48 4 104 83 687 4 166 Cali Cauca 1.87 15 910 323 2 665 16 152 Cartagena Caribbean Sea 0.69 5 905 120 989 5 995 I bague Corfceina 0.33 3 239 66 542 3 288 Kaniiales Chinchina 0.39 3 305 67 554 3 356 Hedellin Medellin 2.00 17 047 346 2 856 17 306 Honteria Sinu 0.22 1 892 38 317 1 921 Neiva Magdalena 0.25 2 141 43 359 2 173 Palmira Cauca 0.25 2 105 43 353 2 157 Pereira Otun 0.33 2 803 57 470 2 846 Santa Harta Caribbean Sea 0.25 2 138 43 358 2 171 Valledupar 0.20 1 716 35 287 1 742 Valledupar
Subtotal U.65 124 662 2 531 20 882 126 560
Guatemala Guatemala City Las Vacas 0.69 5 900 120 988 5 990
Subtotal 0.69 5 900 120 988 5 990
Honduras San Pedro Sula 1 1 ChaiTclecon 0.26 2 194 45 368 2 227 Tegucigalpa 1 Grande 0.42 3 607 73 604 3 662 Tegucigalpa
Subtotal 0.68 5 801 118 972 5 889
Nicaraqua Managua 1 Lake Managua 0.69 5 881 119 985 5 971
Subtotal 0.69 5 881 119 985 5 971
TOrAL fOR BASm 1 16.71 142 244 2 833 23 823 144 410
BASIN: Caribbean Islands |
Cuba Bayairo Bayano 0.09 726 15 122 737 Camaguey San Pedro 0.21 1 770 36 297 1 797 Cienfuegos Cienfuegos Bay 0.09 741 15 124 752 Guantarumo Caribbean Sea 0.14 1 206 24 202 1 224 Kolguin Holguin 0.16 1 348 27 226 1 363 La Habana Almendares 1.63 13 912 282 2 330 14 123 Matanzas Yunuri/San Juan 0.09 727 15 122 738 Santa Clara Sagua La Grande 0.15 1 250 25 209 1 269 Santiago de Cuba Caribbean Sea 0.30 2 533 51 424 2 571
Subtotal 2.85 24 212 492 4 056 24 581
Dominican Republic Santo Domingo Ozama 0.68 5 765 117 966 5 852 Stgo.de Los Caballeros raque del Norte 0.15 1 248 25 209 1 267
Subtotal 0.82 7 012 142 1 175 7 119
Haiti Port-Au-Prince (1982) 1 Bois de Chene 0.68 5 792 118 970 5 880
Subtotal 0.68 5 792 118 970 5 880
218

Annex 6 (cont.10)
Cities by major hydrographic basins, countries, and recipient water bodies
DOMESTIC SEWAGE
OUTFLOWS (jiG/sec)
DBO (Ion/year)
PHOSPHORUS (Ton/year)
NITROGEN CTon/year)
SUSPENDED SOLIDS (Ton/year)
BASIN: Caribbean Islands (cont.
Jamaica Kingston Caribbean Sea 0.18 1 537 31 257 1 560 Jamaica Kingston
Subtotal 0.18 1 537 31 257 1 560
Puerto Rico Bayamon Caguas Ponce San Juan
Cidra Loiza Caribbean Sea San José Lagoon
n/a n/a n/a n/a
n/a n/a n/a n/a
n/a n/a n/a n/a
n/a n/a n/a n/a
n/a n/a n/a n/a
Subtotal n/a n/a n/a n/a n/a
TOTAL FOR BASIN 1 4.53 38 553 783 6 458 39 140
BASIN: Central Venezuela |
Venezuela Barcelona/Pto.La Cruz Barquisimeto Caracas Cumana Departamento Vargas Maracay Valencia
Caribbean Sea Yaracuy Guaires Gulf of Cariaco Tuy Aragua Cabrialcs
0.45 0.77 3.67 0.26 0.35 0.54 0.87
3 799 6 550
31 205 2 203 3 000 4 582 7 377
77 133 634 45 61 93 150
636 1 097 5 227
369 503 768
1 236
3 857 6 649
31 680 2 236 3 046 4 652 7 489
Subtotal 6.90 58 716 1 192 9 836 59 610
TOTAL FOR BASIN | ¡ 6.90 58 716 1 192 9 836 59 610
BASIN: Central system of Chile 1
Chile Chilian Concepcion Rancagua Santiago Talca Talcahuano Valparaiso-Viña del Mar
Itata Biobio Cachapoal Hapocho Claro Pacific Ocean Pacific Ocean
0.19 0.43 0.22 5.84 0.21 0.32 0.85
1 606 3 641 1 902
49 679 1 747 2 751 7 267
33 74 39
1 009 35 56 148
269 610 319
8 322 293 461
1 217
1 631 3 697 1 931
50 436 1 774 2 793 7 378
Chile Chilian Concepcion Rancagua Santiago Talca Talcahuano Valparaiso-Viña del Mar
Subtotal 8.06 68 594 1 393 11 490 69 638
TOTAL FOR BASIN | 8.06 68 594 1 393 11 490 69 638
BASIN: Gulf of Mexico |
Mexico Jalapa de Enriquez Mexico City Poza Rica de Hidalgo Tampico Veracruz
Actopan Lake Texcoco/Tula Purificación Panuco Jamapa
0.23 16.73 0.22 0.44 0.35
1 945 142 384
1 911 3 764 2 962
39 2 891
39 76 60
326 23 851
320 631 496
1 974 144 552
1 940 3 821 3 007
Subtotal 17.97 152 966 3 106 25 624 155 295
TOTAL FOR BASIN { 17.97 152 966 3 106 25 624 155 295 =========== ====s====== =========== ===========
219
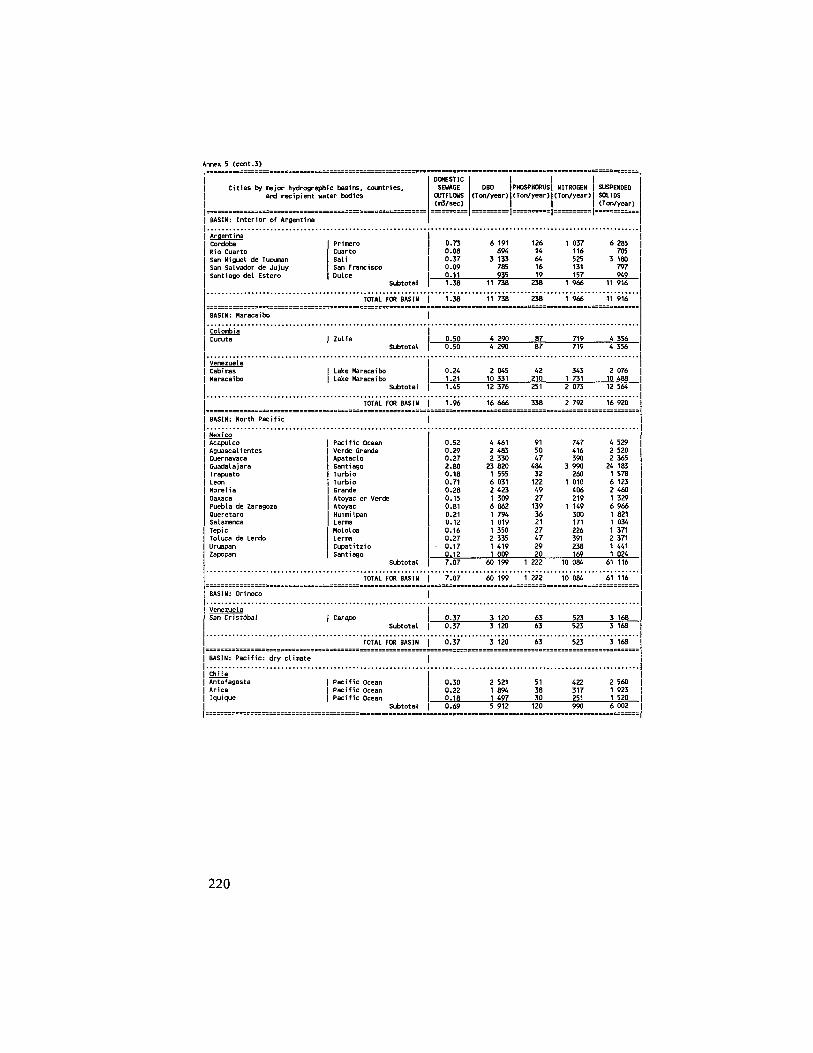
Annex 6 (cont.10)
Cities by major hydrographic basins, countries, and recipient water bodies
BASIN: Interior of Argentina
DOMESTIC SEWAGE
OUTFLOWS (iti3/scc)
DBO (Ton/year)
PHOSPHORUS (Ton/year)
KITROGEN (Ton/year)
SUSPENDED SOLIDS (Ton/year)
Argentina Cordoba Rio Cuarto San Miguel de Tucunan San Salvador de Jujuy Santiago del Estero
Primero Cuarto Sal i San Francisco Dulce
0.73 0.08 0.37 0.09 0.11 1.38
6 191 694
3 133 785 935
11 738
126 14 64 16 19
1 037 116 525 131 157
1 966
6 285 705
3 180 797 949
11 916
TOTAL FOR BASIN | 1 1.38 11 738 238 1 966 11 916
8ASIN: Haracatbo 1 1 Colofifcia Cucuta Zulia I 1 0.50 4 290 87 719 4 356
Subtotal I 1 0.50 4 290 87 719 4 356
Venezuela Cabimas Lake Maracaibo 0.24 2 045 42 343 2 076 Maracaibo Lake Maracaibo 1.21 10 331 210 1 731 10 488
Subtotal 1.45 12 376 251 2 073 12 564
TOTAL FOR BASIN | 1 1.96 16 666 338 2 792 16 920
BASIN: North Pacific |
Mexico Acapulco Pacific Ocean 0.52 4 461 91 747 4 529 Aguascalientes Verde Grande 0.29 2 483 50 416 2 520 Cuernavaca Apataclo 0.27 2 330 47 390 2 365 Guadalajara Santiago 2.80 23 820 484 3 990 24 183 Irapuato Turbio 0.18 1 555 32 260 1 578 Leon Turbio 0.71 6 031 122 1 010 6 123 Horelia Grande 0.28 2 423 49 406 2 460 Oaxaca Atoyac or Verde 0.15 1 309 27 219 1 329 Puebla de Zaragoza Atoyac 0.81 6 862 139 1 149 6 966 Queretaro Huimilpan 0.21 1 794 36 300 1 821 Salamanca Lerma 0.12 1 019 21 171 1 034 Tepic Mololoa 0.16 1 350 27 226 1 371 Toluca de Lerdo Lerma 0.27 2 335 47 391 2 371 Uruapan Cupatitzio 0.17 1 419 29 238 1 441 Zapopan Santiago 0.12 1 009 20 169 1 024 Zapopan
Subtotal 7.07 60 199 1 222 10 084 61 116
TOTAL FOR BASIN | 1 7.07 60 199 1 222 10 084 61 116
BASIH: Orinoco SSSSSSSSSSSSSSSSSEZSSZSSSSSSS
Í Venezuela San Cristóbal | 1 Caropo 0.37 3 120 63 523 3 168
Subtotal 0.37 3 120 63 523 3 168
TOTAL FOR BASIN | 1 0.37 3 120 63 523 3 168
BASIN: Pacific: dry climate 1 1 Chile Antofagasta Pacific Ocean 0.30 2 521 51 422 2 560 Arica Pacific Ocean 0.22 1 894 38 317 1 923 Iquique Pacific Ocean 0.18 1 497 30 251 1 520
Subtotal 0.69 5 912 120 990 6 002
220
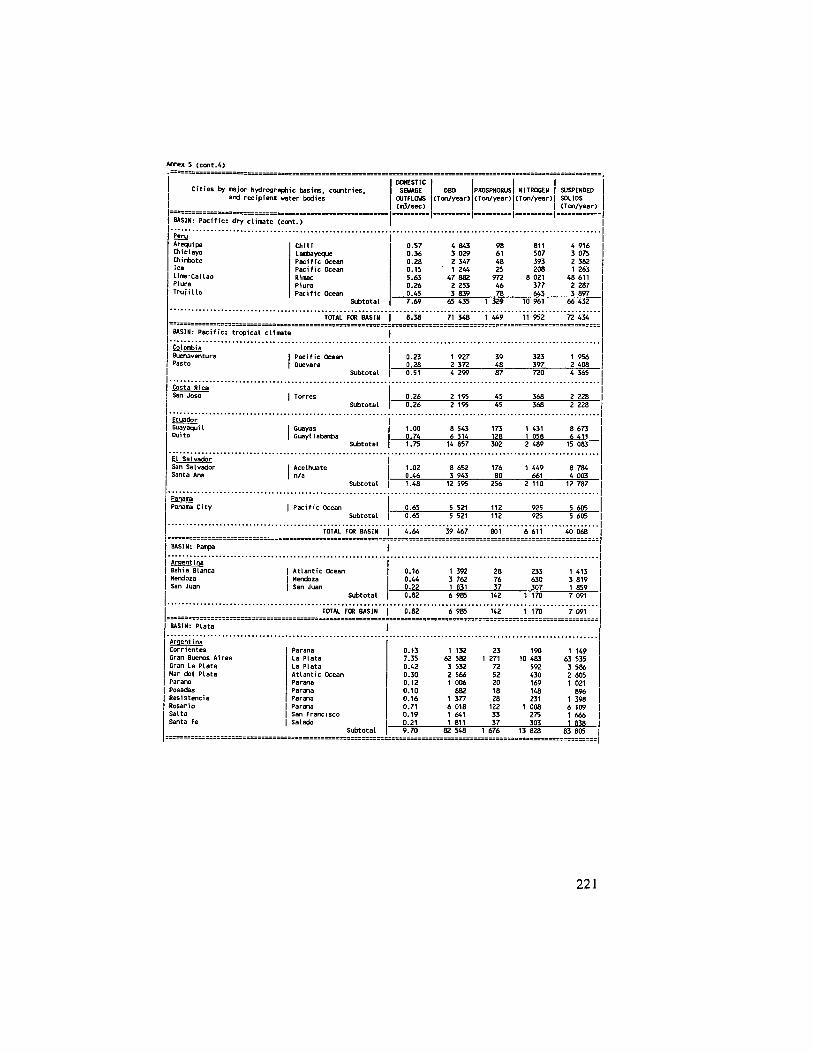
cities by major hydrographic basins, countries, and recipient water bodies
DOMESTIC SEUAGE
OUTFLOUS (na/sec)
OBO (Ton/year)
PHOSPHORUS (Ton/year)
NITROGEN (Ton/year)
SUSPENDED SOLIDS (Ton/year)
BASIN: Pacific: dry climate (cont.)
Peru Arequipa Chiclayo Oiintote Ica Lima-Callao Piura Truj i Ilo
Chili Laniiayeque Pacific Ocean Pacific Ocean Rimac Piura
0.57 0.36 0.28 0.15 5.63 0.26 0.45
4 843 3 029 2 347
• 1 244 47 882 2 253 3 839
98 61 48 25
972 46 78
811 507 393 208
8 021 377 643
4 916 3 075 2 382 1 263
48 611 2 287 3 897
Subtotal 7.69 65 435 1 3 » 10 961 66 432
TOTAL FOR BASIN 1 8.38 71 348 1 M 9 11 952 72 434
BASIN: Pacific: tropical climate |
Colorbia Buenaventura Pasto
I Pacific Ocean 0.23 1 927 39 323 1 956
Subtotal 0.51 4 299 87 720 4 365
Costa Rica San Jose 1 Torres 1 0.26 2 195 45 368 2 228 1 Torres
Subtotal 1 0.26 2 195 45 368 2 228
Ecuador Guayaqui I Quito
1 Guayas I Guayllabainba
1.00 0.74
5 543 6 314
173 128
1 431 1 058
8 673 6 411
Subtotal 1.75 14 857 302 2 489 15 083
El Salvador San Salvador Acelhuate 1.02
0.46 8 652 3 943
176 80
1 449 661
8 784
Subtotal 1.48 12 595 256 2 110 12 787
Panama Panama City 0.65 5 521 112 925 5 605
Subtotal 0.65 5 521 112 925 5 605
TOTAL FOR BASIN 4.64 39 467 801 6 611 40 068
BASIN: Pampa
Argentina Bahi a Blanca Mendoza San Juan
Atlantic Ocean Mendoza
0.16 0.44 0.22
1 392 3 762 1 831
28 76 37
233 630 307
1 413 3 819 1 859
Subtotal 0.82 6 985 142 5 170 7 091
TOTAL FOR BASIN 0.82 6 9S5 142 1 170 7 091
BASIN: Plata |
Argentina Corrientes Gran Buenos Aires Gran La Plata Mar del Plata Parana Posadas Resistencia Rosario Salta Santa Fe
Parana La Plata La Plata Atlantic Ocean Parana Parana Parana Parana San Francisco Salado
0.13 7.35 0.42 0.30 0.12 0.10 0.16 0.71 0.19 0.21
1 132 62 582 3 532 2 566 1 006 832
1 377 6 018 1 641 1 811
23 1 271
72 52 20 18 28 122 33 37
190 10 483
592 430 169 148 231
1 008 275 303
1 149 63 535 3 586 2 605 1 021 896
1 398 6 109 1 666 1 838
Subtotal 9.70 82 548 1 676 13 828 83 805
ooresTic SEUAGE
OUTFLOUS (niS/sec)
OBO (Ton//car)
PHOSPHORUS (Ton/year)
HtTROGEN (Ton/year)
SUSPENDED SOLIDS (Ton/year)
0.57 0.3« 0 . 2 8 0.15 5.63 0.26
7.69
4 843 3 029 2 347
• 1 244 47 882
2 253 3 839
61 48 25
972 46
- Z l ,
811 507 393 208
8 021 377 643
65 435 1 3 » 10 961
4 916 3 075 2 382 1 263
4a 611 2 287 3 897
66 432
I 8 .38 71 348 1 M 9
0.23 o.zs
1 927 Z 372
39 323 397
1 956 2 ' 08
0.26 2 '95 45
368 2 228
Guayaqui I Quito
I Guayas Guayllabainba
1.00 0.74
- T j r 5 543 6 314
173 128
1 431 1 058
8 673 6 411
El Salvador San Salvador Santa Ana
Acelhuate n/a
1.02 0.46
8 652 3 943
176 80
1 449 661
8 784 4 003
Panama Panama City I Pacific Ocean
0.65
"i'.M
5 521
"39'467" 112
"¿¿r
925
"¿ '¿ i i '
5 605 5 605
"ib'oú' TOTAL FOR BASIN I
BASIN: Pampa
Argentina Bahi a Blanca Mendoza San Juan
Atlantic Ocean Mendoza San Juan
Subtotal
0.16 0.44 0.22
1 392 3 762 1 831
28 76 37
0.82
0.82
6 985
6 9S5
142
142
233 630 307
5 170
' I ' Í t o '
1 413 3 819 1 859 7 091
7 091
BASIN: Plata
TOTAL FOR BASIN I
I
Argentina Corrientes Gran Buenos Aires Gran La Plata Mar del Plata Parana Posadas Resistencia Rosario Salta Santa Fe
Parana La Plata La Plata Atlantic Ocean Parana Parana Parana Parana San Francisco Salado
0.13 7.35 0.42 0.30 0.12 0.10 0.16 0.71 0 .19 0.21
1 132 62 582
3 532 2 566 1 006
832 1 377 6 018 1 641 1 811
23 1 271
72 52 20 18 28
122 33 37
9 .70
190 10 483
592 430 169 148 231
1 008 275 303
82 548 1 676 13 S2S
1 149 63 535
3 586 2 605 1 021
896 1 398 6 109 1 666 1 838
83 805
2960

Annex 6 (cont.10)
DOMESTIC 1 Cities by major hydrographic basins, countries. SEWAGE 1 DBO PHOSPHORUS NITROGEN SUSPENDED
and recipient water bodies OUTFLOWS (Ton/year) (Ton/year) (Ton/year) SOLIDS (ra/sec) (Ton/year)
BASIN: Plata (cont.)
Brazil Americana Piracicaba 0.09 768 16 129 779 Anapolis Meia Ponte 0.12 1 012 21 170 1 027 Aracatuba Tiete 0.08 715 15 120 726 Araraquara Jacaré Guacu 0.10 826 17 138 838 Bauru Bauru 0.13 1 128 23 189 1 145 Brasilia Paranua Sta Maria 0.30 2 593 53 434 2 632 Catipinas Capivari 0.42 3 571 73 598 3 626 Carapicuiba Tiete O . U 1 171 24 196 1 189 Guiaba Cut aba 0.12 1 058 21 177 1 075 Curitiba Belem 0.62 5 319 108 891 5 400 Diadema Tiete 0.17 1 441 29 241 1 463 Franca Grande 0.11 905 18 152 919 Goiania Meia Ponte 0.52 4 433 90 743 4 501 Guarulhos rnhoi Cima 0.29 2 491 51 417 2 529 Jundiai Guapeva 0.16 1 324 27 222 1 344 Lajes Caveiras 0.08 686 14 lis 696 Limeira Piracicaba 0.10 869 18 146 882 Londrina Tibaji 0.19 1 627 33 273 1 652 Marilia Do Peixe 0.08 703 14 118 714 Maringa Ivai 0.12 996 20 167 1 012 Haua Tiete 0.15 1 297 26 217 1 317 Mogi das Cruzes Paraitinga 0.09 771 16 129 782 Osasco Tiete 0.35 2 987 61 500 3 033 Piracicaba Piracicaba 0.13 1 131 23 189 1 148 Ponta Grossa Tibaji 0.13 1 079 22 181 1 095 Presidente Prudente Santo Anastacio 0.09 805 16 135 817 Ribeirao Preto Pardo 0.22 1 896 38 318 1 925 Santo Andre Tiete 0.41 3 463 70 580 3 515 Sao Caetano do Sul Tiete 0.12 1 028 21 172 1 043 Sao Carlos Jacaré Guacu 0.08 689 14 115 699 Sao Jose do Rio Preto Preto 0.13 1 084 22 182 1 101 Sao Paulo Tiete 5.21 44 339 900 7 427 45 015 Sorocaba Sorocaba 0.19 1 606 33 269 1 630 Uberaba Grande 0.13 1 137 23 190 1 154 Uberlandia Uberarinha 0.17 1 452 29 243 1 475
Subtotal 11.56 98 399 1 998 16 483 99 897
Paraquav Asuncion 1 Paraguay 0.32 2 692 55 451 2 733
Subtotal 0.32 2 692 55 451 2 733
Uruguay Montevideo | 1 Atlantic Ocean 0.43 3 688 75 618 3 744
Subtotal 0.43 3 688 75 618 3 7 U
TOTAL FOR BASIN 1 22.01 187 326 3 804 31 379 190 179
BASIN: Rio Bravo |
Mexico Chihuahua Chuviscar 0.44 3 726 76 624 3 732 Ciudad Juarez Bravo 0.71 6 034 123 1 Oil 6 125 Matamoros Bravo 0.22 1 866 38 313 1 894 Monterrey Pesqueria 2.29 19 486 396 3 264 19 783 Nuevo Laredo Bravo 0.25 2 158 44 362 2 191 Reynosa Bravo 0.26 2 231 45 374 2 265 Saltillo Pesqueria 0.29 2 495 51 418 2 533
Subtotal 4.46 37 995 771 6 365 38 574
TOTAL FOR BASIN 1 4.46 37 995 771 6 365 38 574
222

Annex 6 (cont.10)
Cities by major hydrographic basins, comtries, and recipient water bodies
BASIN: San Francisco
DOKESTIC I SEHAGE I DBO
OJTFLOUS (Ton/year) (iriS/sec) I
PHOSPHORUS (Ton/year)
NITROGEN (Ton/year)
SUSPENDED SOLIDS (Ton/year)
Brazil Belo Horizonte Divinopolis Montes Claros
Das Velhas Para Verde
Subtotal
TOTAL FOR BASIN
1.07 0.08 0.11
9 093 683 957
185 14 19
1 523 114 160
9 232 693 972
Brazil Belo Horizonte Divinopolis Montes Claros
Das Velhas Para Verde
Subtotal
TOTAL FOR BASIN
1.26
1 1.26
10 734
10 734
218
218
1 798
1 798
10 897
10 897
BASIN: South Atlantic |
Brazil Aracaju Atlantic Ocean 0.21 1 816 37 304 1 844 Barra Mansa Paraiba do Sul 0.09 778 16 130 790 Blumenau Itajai 0.11 913 19 153 927 Canpos Paraiba do Sul 0.13 1 098 22 184 1 115 Canoas Dos Sinos 0.16 1 350 27 226 1 370 Caxias do Sul Piauhi 0.15 1 253 25 210 1 272 Duque de Caxias niteroi 0.23 I 929 39 323 1 959 Feira de Santana Jacuipe 0.17 1 418 29 238 1 440 Florianopolis Atlantic Ocean 0.11 968 20 162 983 Governador Valadares Doce 0.13 1 095 22 183 1 112 Itabuna Colonia 0.10 819 17 137 832 Joinvile Sao Francisco Bay 0.16 1 368 28 229 1 389 Juiz de Fora Parai buna 0.22 1 889 38 317 1 918 Hi lopoUs Atlantic Ocean 0.12 1 060 22 178 1 076 Niteroi Atlantic Ocean 0.29 2 435 49 408 2 472 Nova Iguacu Atlantic Ocean 0.36 3 100 63 519 3 148 Novo Hamburgo Dos Sinos 0.10 833 17 139 845 Pelotas Lagoa dos Patos 0.15 1 242 25 208 1 261 Petropolis Piabanha 0.11 942 19 158 956 Porto Alegre Guaiba 0.82 6 990 142 1 171 7 097 Rio Grande Lagoa dos Patos 0.09 786 16 132 798 Rio de Janeiro Guanabara Bay 3.77 32 108 652 5 378 32 597 Salvador Atlantic Ocean 1.11 9 433 192 1 580 9 576 Santa Karia Bagu 0.11 953 19 160 968 Santos Atlantic Ocean 0.30 2 591 53 434 2 631 Sao Bernardo do Cairpo Cubatao 0.28 2 403 49 403 2 440 Sao Goncalo Atlantic Ocean 0.16 1 395 28 234 1 416 Sao Joao de Heriti Atlantic Ocean 0.16 1 327 27 222 1 348 Sao Jose dos Campos Paraiba do Sul 0.20 1 690 34 283 1 716 Sao Vicente Atlantic Ocean 0.14 1 215 25 204 1 234 Taubate Paraiba do Sul 0.12 979 20 164 994 Vitoria Atlantic Ocean 0.11 909 18 152 923 Vitoria da Conquista Pardo 0.09 793 16 133 805 Volta Redonda Paraiba do Sul 0.13 1 121 23 188 1 138
Subtotal 10.69 91 002 1 848 15 2 U 92 388
TOTAL FOR BASIN 1 10.69 91 002 1 848 15 244 92 388
BASIN: South Pacific
Chile Temuco Inperial
Subtotal
TOTAL FOR BASIN |
0.25
'óizs'
2 U 3
2143
44
44
2 175 359 2 175
359 Z'ÍTS'
223
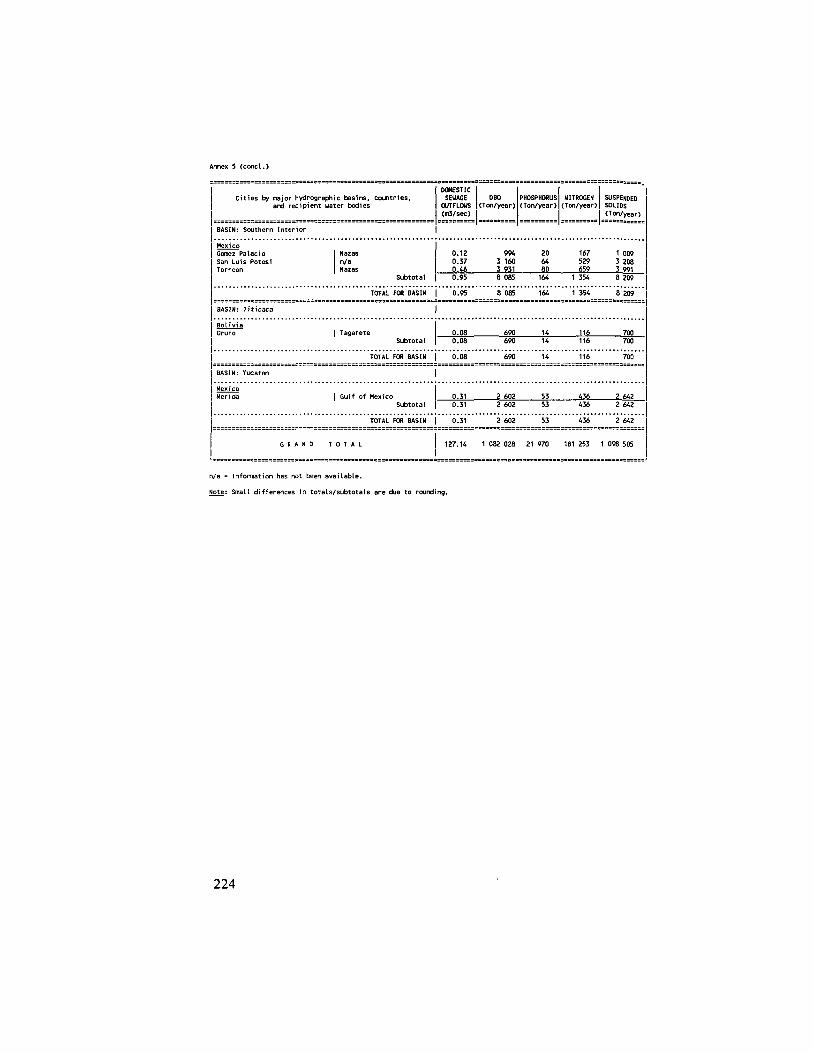
Annex 6 (cont.10)
Cities by major hydrographic basins, countries, and recipient water bodies
BASIN: Southern Interior
OOMESriC SEWAGE
OUTFLOWS (na/sec)
DBQ (Ton/year)
PHOSPHORUS (Ton/year)
NITROGEN (Ton/year)
SUSPENDED SOLIDS (Tor/year)
"exiCO Gomez Palacio San Luis Potosi Torreon
Nazas n/a Nazas
Subtotal
TOTAL FOR BASIN |
0.12 994 20 167 1 009 0.37 3 160 64 529 3 208 0.46 3 931 80 659 3 991 0.95 8 085 164 1 354 8 209
0.95 8 085 164 1 354 8 209
8ASIN: Titicaca
Bolivia Oruro I Tagarete
Subtotal
TOTAL FOB BASIN
0.08 0.08
'oioa'
690
'¿W
14
Ü"
116
"ÍÍ6
_700_ 700
foo'
BASIN: Yucatan
"exiCO Herida I Gulf of Mexico
Subtotal
TOTAL FOR BASIN
«36 0.31
óisi'
: 602
2 602'
53
"53"
436 2 642 2 642
G R A N D T O T A L 127.14 1 082 028 21 970
436 2 642
181 253 1 098 505
n/a = Information has not been available.
Note: Small differences in totals/subtotals are due to rounding.
224

A n n e x 6 (cont.10)
INSTALLED CAPACITY OF SELECTED I N D U S T R I E S , BY WATER BODY
A. PULP AND PAPER INDUSTRY ( i n s t a l l e d c a p a c i t y , t o n s )
= = = = = = = = = = = = = = =: = = = = = = = = = = = = s = = = = = = = = = = s = = = = = = = = = = = = = = = = = == = = = = = === = = == = = = = L o c a t i o n of t h e p l a n t | C e l l u l o s e | P a p e r | W a t e r b o d y
= = = = = = = = = = = = = = = = = s: = = = = = 5 = == = = = = = s = = = = = a = = = = = = = = = = = = = = s = = == = = == = =:== = = = = = = = = B a s i n : Amazon
Bo l i v i a La Paz 7 0 0 1 1 5 0 0 C h o q u e y a p u
T o t a l f o r b a s i n
B a s i n : A r i d P a c i f i c
7 0 0 1 5 0 0
P e r u C h a c o i l a y o C h i c l a y o C a y a l t i C h o s i c a L ima L ima V i e j o Paramonga T r u j i I l o V e n t an i 1 l a V i t a r t e
0 3 0 0 0
0 0 0
60 0 0 0 4 9 5 0 0
0 0
8 3 0 0 4 000
U 0 0 0 5 0 0 0 3 0 0 0
85 0 0 0 6 6 0 0 0
5 0 0 0 5 0 0
Rimac Reque Rimac P a c i f i c Ocean R i mac P o r t a l e z a P a c i f i c Ocean Rimac P a c i f i c Ocean
T o t a l f o r b a s i n 112 5 0 0 190 8 0 0
B a s i n : B r a z i l , N o r t h - E a s t
B r a z i l B e b e r i be Campiña G r a n d e F o r t a l e z a J a b o a t a o M o r e n o
7 5 0 0 5 100 1 8 4 0 4 4 2 0
0 3 1 0 11 6 0 0 20 4 0 0
1 7 0 0 4 100
22 6 4 0 : = = = = !
34 3 3 0
C h o r o Pa r a i b a A t l a n t i c Ocean J a b o a t a o J a b o a t a o
T o t a l f o r b a s i n
B a s i n : C a r i b b e a n
C o l o m b i a B a r r a n q u i I l a B o g o t a Ca l i Mede 11 i n P e r e i r a
O 4 0 0 0
137 2 0 0 O O
1 9 0 o 13 2 0 0
2 0 3 6 0 0 3 0 0 0 5 100
M a g d a l e n a B o g o t a Cauca M e d e l l i n O t u n
T o t a l f o r b a s i n U 1 2 0 0 226 800
B a s i n : C e n t r a l C h i l e
C h i l e B i Ob i 0 6 6 0 0 0 64 6 0 0 B i c b i o L a j a 240 0 0 0 17 000 L a j a L a j a Grown 0 4 9 0 0 0 L a j a N a c i mi e n t o 75 0 0 0 70 000 Bi o b i o P u e n t e A l t o 15 0 0 0 58 000 M a i p o S a n t i a g o 0 10 0 0 0 Mapocho T a l c a 0 3 000 C l a r o V i n a d e l Mar 2 0 0 0 4 500 P a c i f i c Ocean
T o t a l f o r b a s i n 3 9 8 0 0 0 2 7 6 100 s = = = s s s = s s s s = = = =
225

Annex 6 ( c o n t . 1 ) = s s = s s s s s s s s s s s = = s s s = s s s = s = = = = s
L o c a t i o n o f t h e p l a n t C e l l u l o s e 1 P a p e r 1 W a t e r body - = - ^— - .- -. - _ -
B a s i n : C e n t r a l V e n e z u e l a
V e n e z u e l a C a r a c a s Q 2 0 0 0 Gua i r e s G u a c a r a 0 2 3 0 0 0 L a k e V a l e n c i a H a r a c a y 0 6 3 0 0 0 A r a g u a M o r o n 25 OOQ 95 0 0 0 Moron P e t a r e 0 2 7 0 0 0 Gua i r e s V a l e n c i a 0 6 3 0 0 0 Q u e b r a d a Seca
T o t a l f o r b a s i n 25 000 2 7 3 0 0 0 . r :. i- ^ : = = = = = s = = = r a = = = = = = = = = = = = = = =
B a s i n : G u l f of Mex i c o
M e x i c o A p i z a c o 3 6 0 0 0 Z a v a p a n A y o t l a 5 8 5 0 0 I B 0 0 0 L a k e T e x c o c o / T u l a A z c a p o t z a l c o 0 19 5 0 0 L a k e T e x c o c o / T u l a Cam. M e x i c o C i t y -
- L a r e d o 6 0 0 0 0 7 7 0 0 0 San J a v i e r Cam. M e x i c o C i t y -
T e x c o c o 0 2 4 0 0 0 L a k e T e x c o c o / T u l a C o l o n i a G o a j a 0 25 0 0 0 L a k e T e x c o c o / T u l a C o l o n i a Maco 0 15 0 0 0 L a k e T e x c o c o / T u l a C o l o n i a P a n a m e r i c a n a 0 1 5 0 0 L a k e T e x c o c o / T u l a I x t a p a l a p a 0 15 0 0 0 L a k e T e x c o c o / T u l a I x t a p a l u c a 0 2 5 0 0 L a k e T e x c o c o / T u l a La Paz 0 3 0 0 0 L a k e T e x c o c o / T u l a Los Reyes 23 4 0 0 7 9 0 0 0 L a k e T e x c o c o / T u l a M e x i c o C i t y 4 100 1 2 8 0 0 0 L a k e T e x c o c o / T u l a Or i z a b a 4 740 0 B l a n c o San P e d r o X a l o s t o c 5 100 0 San R a f a e l 130 0 0 0 1 1 8 5 0 0 L a k e T e x c o c o / T u l a S a n t a C l a r a 6 0 0 0 6 SCO T l a l n e p a n t l a 0 5 6 5 0 0 T l a l n e p a n t l a T l a l p a n 31 7 0 0 55 0 0 0 L a k e T e x c o c o / T u l a T u x t e p e e 5 8 100 5 0 0 0 0 S a n t o Domingo U a u c a l r a n de J u a r e z 0 20 5 0 0
T o t a l f o r b a s i n 3 8 5 2 4 0 7 1 4 5 0 0 - : . : ;::i 1 - - - - - . : = s = r s s s s s s s s = = = = = = = = = = a = = s s r s = s = = = s = = =
B a s i n : I n t e r i o r o f A r g e n t i n a
A r g e n t i n a B e 11 a V i s t a 1 500 2 0 0 0 S a l i C o r d o b a 0 9 0 0 0 P r i m e r o L e a l e s 6 0 0 0 6 0 0 0 S a l i L i b . G r a I . S a n M a r t i n 3 0 0 0 0 3 6 0 0 0 San F r a n c i s c o Onca t i vo 0 1 5 0 0 R i o J u 0 2 0 0 0 C u a r t o Tucuman 2 000 3 5 0 0 S a l i
T o t a l f o r b a s i n 3 9 5 0 0 6 0 0 0 0 ~ = = = r _ - - - .z = = . s s s s = = = = = = s s : : s s = s = s = s s s = s s = = s = s s s s = s = = = = = s = = = s = = = = =
B a s i n : N o r t h P a c i f i c
Mex i CO A t e n q u i q u e 40 0 0 0 7 0 0 0 0 T u x p a n At i z a p a n 0 8 5 0 0 Lerma C u e r n a v a c a 0 2 0 0 0 0 A p a t a c l o G u a d a l a j a r a 0 15 0 0 0 S a n t i a g o P u e b l a 0 19 0 0 0 A t o y a c S a I v a t i e r r a 1 500 0 P e s q u e r i a San B a r t o l o 2 000 35 0 0 0 Lerma T e x m e I u c a n 0 10 0 0 0 A t o y a c
T o t a l f o r b a s i n 4 3 5 0 0 1 7 7 5 0 0 = === = = = = = = 5 = = = = = = = = == = =: = = = = = = = = = === :
226

L o c a t i o n o f t h e p l a n t C e l l u l o s e P a p e r y a t e r body = = = = = = = = = = = = = = = = = = = = = = = = = = = = = = . SSSSSSSSSSSSSSSSS
B a s i n : N o r t h e r n I n t e r i o r
Mex i CO Anahuac 1 2 0 0 0 S a n t a I s a b e l
T o t a l f o r b a s i n 1 2 0 0 0 = = = = = = = = = = = = = = = = = = = = = = =
B a s i n : Pampa =======
A r g e n t i na C i p o l e t t i 0 1 5 0 0 Neuquen Godoy C r u z 0 30 000 Mendoza T o r n q u i s t 0 6 0 0 0 Sauce C h i c o
T o t a l f o r b a s i n 0 3 7 500 = = = = = = = = = = = = = = = = = = = = = = = ======= ============ s ssss
B a s i n : P l a t a
A r g e n t i n a Alma F u e r t e 4 0 0 0 6 0 0 0 T e r c e r o And i no 0 8 5 0 0 C a r c a r a n a A v e l l a n e d a 0 21 000 R i a c h u e l o A z u l 2 000 3 000 A z u l B a r a d e r o 0 4 000 B a r a d e r o B e c c a r 0 12 000 La P l a t a B e r a z a t e g u i 0 6 000 La P l a t a B e r n a I 20 000 102 0 0 0 La P l a t a Buenos A i r e s 0 40 0 0 0 La P l a t a Campana 4 0 0 0 22 5 0 0 P a r a n a Canada de Gomez 2 0 0 0 3 500 Canada De Gomez C a p i t a n Bermudez 4 0 0 0 0 70 000 P a r a n a Ci u d a d e l l a 0 1 500 La P l a t a C o r d o b a 0 4 000 P r i m e r o C o r o n e l S u a r e z 6 000 6 000 V i l i m a n l a G e n e r a l Lagos 0 3 000 P a r a n a G e n e r a l P a c h e c o 0 1 500 R e c o n q u i s t a H u r I i ngham 6 0 0 0 10 0 0 0 R e c o n q u i s t a I t u z a i ngo 0 2 5 0 0 R e c o n q u i s t a Lanus 0 14 0 0 0 R i a c h u e l o Las Pa lmas 4 0 0 0 4 000 P a r a g u a y Lomas de Zamora 0 2 000 La P l a t a M e r c e d e s 0 1 500 Moyano P a r a n a 0 4 500 P a r a n a P u e r t o P i r a y 30 0 0 0 5 0 0 0 P a r a n a Q u i I m e s 0 26 0 0 0 La P l a t a Rane1agh 4 0 0 0 12 0 0 0 La P l a t a R i n g u e l e t 0 5 000 La P l a t a R o s a r i o 0 1 500 P a r a n a S José de l a E s q u i n a 6 000 6 000 P a r a n a S a l t o 0 1 000 S a l t o San F e r n a n d o 0 3 000 La P l a t a San I s i d r o 1 000 2 000 La P l a t a San J u s t o 65 0 0 0 160 000 La P l a t a San L o r e n z o 3 0 0 0 7 5 0 0 P a r a n a San M a r t i n 2 0 0 0 3 5 0 0 A t l a n t i c O c e a n San P e d r o 2 5 0 0 4 5 0 0 P a r a n a T a n d i l 0 2 000 L a n g u e y o T o r c u a t o 0 3 000 Reconqu i s t a V a l e n t i n A l s i n a 0 11 500 R i a c h u e l o V e l l a n e d a 0 3 000 R i a c h u e l o V i c e n t e Lopez 0 7 000 La P l a t a V i l l a Domi n i CO 0 15 000 La P l a t a V i l l a G. G a l v e z 0 2 000 La P l a t a V i l l a Ocampo 6 0 0 0 14 000 P a r a n a Wi I d e 0 32 000 La P l a t a Z a r a t e 64 0 0 0 76 000 P a r a n a de Las P a l m a s
S u b t o t a l 2 7 1 5 0 0 755 5 0 0
P a p e r | y a t e r body = = = = = = = = = = = = = = = = = =
1 5 0 0 Neuquen 30 000 Mendoza
6 0 0 0 Sauce C h i c o
" s f ' s ó ó ' = = = = = = = = = = = = = = = = = = = = = = = = = = = = = = = = = = = = = = = = = = = = = = = = =
C a p i t a n Bermudez Ci u d a d e l l a C o r d o b a C o r o n e l S u a r e z G e n e r a l Lagos G e n e r a l P a c h e c o H u r I i ngham I t u z a i ngo Lanus Las Pa lmas Lomas de Zamora M e r c e d e s P a r a n a P u e r t o P1 r a y Q u i I m e s R a n e l a g h R i n g u e l e t R o s a r i o S José de l a E s q u i n a S a l t o San F e r n a n d o San I s i d r o San J u s t o San L o r e n z o San M a r t i n San P e d r o T a n d i l T o r c u a t o V a l e n t i n A l s i n a V e l l a n e d a V i c e n t e Lopez V i l l a Domi n i CO V i l l a G. G a l v e z V i l l a Ocampo Wi I d e Z a r a t e
S u b t o t a l
4 0 0 0 0 O O
6 0 0 0 O O
6 0 0 0 O O
4 000 O O O
30 0 0 0 O
4 000 O O
6 000 O O
1 0 0 0 65 0 0 0
3 0 0 0 2 0 0 0 2 5 0 0
O O O O O O O
6 0 0 0 O
hL nno ?7 i í n o
6 0 0 0 8 5 0 0
2 1 0 0 0 000 000
1 2 0 0 0 6 0 0 0
1 0 2 0 0 0 40 0 0 0 22 5 0 0
3 500 70 000
500 000 000 000 500
1 0 0 0 0 2 5 0 0
14 0 0 0 000 0 0 0
1 500 4 500 5 0 0 0
26 000 12 0 0 0
000 500 000 000 000 000
5 1 6 1 3 2 . . .
160 000 5 0 0 5 0 0 5 0 0 000 0 0 0
1 1 500 000 nnn
15 000 2 0 0 0
14 000 32 000 76 nnn
T'is í n n
T e r c e r o C a r c a r a n a R i a c h u e l o A z u l B a r a d e r o La P l a t a La P l a t a La P l a t a La P l a t a P a r a n a Canada De Gomez P a r a n a La P l a t a P r i m e r o V i l i m a n l a P a r a n a R e c o n q u i s t a R e c o n q u i s t a R e c o n q u i s t a R i a c h u e l o P a r a g u a y La P l a t a Moyano P a r a n a P a r a n a La P l a t a La P l a t a La P l a t a P a r a n a P a r a n a S a l t o La P l a t a La P l a t a La P l a t a P a r a n a A t l a n t i c O c e a n P a r a n a L a n g u e y o Reconqu i s t a R i a c h u e l o R i a c h u e l o La P l a t a La P l a t a La P l a t a P a r a n a La P l a t a P a r a n a Hp 1 ac Palma?;
227

Annex 6 ( c o n t . 3 ) . s s s = = = = = s s s s = s = = = =====================
L o c a t i o n o f t h e p l a n t C e l l u l o s e 1 P a p e r 1 W a t e r body ======================= :======================================
B a s i n : P l a t a ( c o n t . )
B r a z i l , A m e r i c a n a 0 6 8 0 0 A t i b a i a A r a p o t i 2 0 4 0 6 120 B a r r a Mansa A r a r a s 0 2 0 4 0 A r a r a s C a c a d o r 6 8 0 0 5 100 Do P e i x e C a i c i r a s 11 9 0 0 2 7 0 0 0 J u q u e r i C a m p i n a s 2 3 8 0 5 4 4 0 C a p a v a r i C a n u i n h a s 0 1 3 6 0 C a n u i n h a s Cap i t a l 3 4 0 0 20 4 0 0 T i e t e C o r d e i r o P o l i s 0 10 5 4 0 T a t ú C u r i t i b a 7 4 8 0 11 5 6 0 B e l e m Embu 3 4 0 10 6 9 0 Embu M u r u n G u a r a 0 3 4 0 0 P o n t a l G u a r u t Unos, 0 2 4 0 0 C a b u s s u de Cana G u a r u l h o s 13 6 0 0 10 2 0 0 T i e t e G u a y n a i a s 0 3 4 0 0 T i e t e I r a p u r u 0 2 040 Da I n h a I t a p i ra 6 8 0 3 4 0 0 Da Renha I t a q u e r a 0 2 3 8 0 T i e t e 11 i u t a b a 0 4 080 T e j u c o J o a c a b a 5 4 0 0 10 9 0 0 Do P e i x e J u n d i a i 2 0 4 0 4 7 6 0 J u n d i a i L i m e i ra 2 7 2 0 21 2 5 0 T a t ú M a r i l i a 0 3 4 0 0 C i n c M a t o G r o s s o 0 5 100 M a t o G r o s s o Mogi Guacu 6 8 0 0 0 17 0 0 0 Mogi Guacu Mogi das C r u z e s 0 4 100 T i e t e M o n t e A l e g r e 125 8 0 0 203 3 2 0 T i ba j i Nova 0 2 0 4 0 I n d e p e n d e n c i a Oj a s c o 0 2 700 T i e t e P a I m a s 0 2 040 Do P e i x e P a r a c i caba 6 8 0 0 14 9 6 0 Pa r a e i c a b a P e n a p o l i s 0 1 700 L a j e P i r a s s u n u n g a 8 5 0 3 740 Mogi Guacu P i r i t u b a S u z a n o 0 11 9 0 0 T i e t e P o n t a G r o s s a 0 3 4 0 0 R e f u g i o de P i e d r a R i be i r a o P i r e s 0 6 8 0 0 G r a n d e R i b e i r a o P r e t o 0 3 060 P a r d o R i o C l a r o 0 2 0 4 0 C l a r o S a l t o 0 12 9 0 0 T i e t e S a n t a B a r b a r a 0 2 0 4 0 Dos T o l e d o s S a n t a n a de P a r n a i b a 4 0 8 0 0 0 T i e t e S a n t o Amaro 0 2 7 0 0 P i n h e i r o s Sao B e r n a r d o 0 2 3 8 0 Do M e n i n o s Sao C a r l o s 0 5 4 4 0 J a c a r é Guacu Sao P a u l o 9 6 9 0 76 500 T i e t e S u z a n o 6 1 2 0 0 4 0 100 T i e t e V a l i nhos 14 2 8 0 8 8 0 0 A t i b a i a
S u b t o t a l 3 8 6 2 0 0 6 1 3 4 2 0
P a r a f l u a y Asunc i on 0 1 2 0 0 P a r a g u a y
S u b t o t a l 0 1 200 P a r a g u a y
U r u g u a y J u a n L L a c a z o 8 0 0 0 18 7 0 0 La P l a t a M e r c e d e s 4 8 0 0 9 8 0 0 N e g r o M o n t e v i d e o 8 0 0 2 7 100 A t l a n t i c O c e a n
S u b t o t a l 13 6 0 0 55 6 0 0
T o t a l f o r b a s i n 6 7 1 3 0 0 1 425 720
228

Annex 6 ( c o n t . 4 ) = = = = = = = =
L o c a t i o n o f t h e p l a n t C e l l u l o s e 1 P a p e r 1 W a t e r body ======================= ======= : = = = = = = = = = = = : ===========================
B a s i n : R i o B r a v o
M e x i c o Ch i h u a h u a 0 16 0 0 0 C h u v i s c a r M o n t e r r e y 20 4 0 0 61 9 0 0 P e s q u e r í a R i o B r a v o 6 0 0 0 0 B r a v o San N i c o l a s 3 5 0 0 35 0 0 0 P a n t a n o San N i c o l a s de G a r z a 2 7 0 0 0 4 0 0 0 0 P a n t a n o
T o t a l f o r b a s i n 56 9 0 0 152 9 0 0 ======================== :ssssssssss=s ===========================
B a s i n : S o u t h A t l a n t i c
B r a z i I A d o l f o P i n h e i r o 0 2 4 0 P a r a i b a do S u l A l c a n t a r a 8 5 0 0 11 6 0 0 Da A l d e i a A I em P a r a i b a 0 10 3 7 0 P a r a i b a do S u l A p a r e c i d a d e l N o r t e 20 4 0 0 0 P a r a i b a do S u l A r a c a j u 170 3 4 0 0 A t l a n t i c Ocean Cambara 2 0 4 0 0 0 Das A n t a s Campos 0 3 2 0 0 P a r a i b a do S u l C a n e l a 11 200 5 4 0 0 C a h i Canoas 20 4 0 0 19 7 0 0 Dos S i n o s C a n t a g a 1 o 0 2 7 0 0 N e g r o C a t a g u a s e s 5 TOO 11 2 2 0 Pomba C u b a t a o 0 19 0 0 0 C u b a t a o E s t e i o 0 4 4 0 0 Dos S i n o s Gua i ba 17 000 20 100 Gua i ba I t a b a Poana 0 2 7 0 0 I t a b a Poana I t a j a i 2 700 7 100 A t l a n t i c O c e a n J a c a r é 4 0 8 0 0 5 9 160 J a g u a r i J a c a r e p a g u a 0 5 100 J a c a r e p a g u a Lagoon J u i z de F o r a 0 11 2 2 0 P a r a i b u n a Mendes 0 9 5 0 0 S a c r a F a m i I i a N a t a l 6 8 0 1 7 0 0 H u c u r i P a r a i buna 0 1 7 0 0 P a r a i b u n a P e l o t a s 3 4 0 0 6 6 0 0 Lagoa Dos P a t o s P e t r o p o l i s 0 1 2 2 0 0 P i a b a n h a Pi ndamonhangaba 10 2 0 0 1 2 2 2 0 P a r a i b a do S u l P o n t e Nova 6 8 0 6 120 P i t u n g a P r a t e s 0 3 4 0 0 Jequ i t i n h o n d a R i o G r a n d i n a Nova 2 700 3 4 0 0 B e n g a l a R i o de J a n e i r o 0 22 2 7 0 G u a n a b a r a Bay S a l v a d o r 8 5 0 3 230 A t l a n t i c O c e a n San A n t o n i o de Padua 0 3 6 0 0 Pomba San L e o p o l d o 0 6 100 Dos S i n o s Sao G e r a l d o 1 8 7 0 4 4 2 0 Sao G e r a l d o
T o t a l f o r bas i n 167 050 293 0 7 0 • -
B a s i n : S o u t h P a c i f i c
Ch i l e V a l d i v i a 5 8 0 0 1 10 200 C a l l e C a l l e
T o t a l f o r b a s i n 5 8 0 0 10 2 0 0 ; = = = = :
229

Annex 6 ( c o n t . 5 ) ,= = = = = = = = = =: = == = = ==== = = = == = = = = = = = = = =: = = == = = = = = = = = = = = = = = = = = = = == = = = = = «:==== =
L o c a t i o n of t h e p l a n t | C e l l u l o s e | Paper | Water body
B a s i n : T r o p i c a l P a c i f i c
Ecuador Q u i t o San C a r l o s
S u b t o t a l
700 I G u a y l l a b a m b a 9 OOP 9 700
Guayas
El S a l v a d o r San S a l v a d o r
S u b t o t a l 12 8 0 0 1-2 800
A c e l h u a t e
E s c u i n t l a G u a t e m a l a
S u b t o t a l
24 000 5 300
29 300
H i c h a t o y a Las Vacas
Panama Panama
S u b t o t a l 28 000 P a c i f i c Ocean 28 000
T o t a l f o r b a s i n 0 79 800
GRAND TOTAL 2 070 530 3 953 720
S o u r c e : V a r i o u s n a t i o n a l s o u r c e s .
230

L o c a t i o n o f t h e p l a n t | B a r r e l s a / | Wa te r body
B a s i n : Amazon
B o l i v i a Cami r Cochabamba S a n t a Cruz
S u b t o t a l
1 000 25 000 24 000
P a r a p e t i Rocha P i r a i
B o l i v i a Cami r Cochabamba S a n t a Cruz
S u b t o t a l 50 000
P a r a p e t i Rocha P i r a i
B r a z i I Manaos
S u b t o t a l 9 700 Amazon
B r a z i I Manaos
S u b t o t a l 9 700 Amazon
Mocoa S u b t o t a l
1 000 Mocoa Mocoa S u b t o t a l 1 000
Mocoa
Ecuador Lago A g r i o
S u b t o t a l 1 000 Napo
Ecuador Lago A g r i o
S u b t o t a l 1 000 Napo
Peru I q u i tos P u c a l I p a
S u b t o t a l
1 200 2 500
Amazon U c a y a l i
Peru I q u i tos P u c a l I p a
S u b t o t a l 3 700
Amazon U c a y a l i
T o t a l f o r b a s i n 65 400
B a s i n : A r i d P a c i f i c
P e r u Conchan La P a m p i l l a H a r s e l L a T a l a r a
850 100 000
1 400 65 000
P a c i f i c Ocean P a c i f i c Ocean P a c i f i c Ocean Magda I e n a
T o t a l f o r b a s i n
B a s i n : Braz i I , N o r t h - E
167 250
3St
B r a z i I F o r t a l e z a 4 200 1 A t l a n t i c Ocean
T o t a l f o r b a s i n 1
4 200 1
B a s i n : C a r i b b e a n
Colombia B a r r a n c a b e r m e j a C a r t a g e n a El Guamo La Dorada
S u b t o t a I
110 000 5 000 2 500 5 000
H a g d a l e n a C a r i b b e a n Sea L u i s a Magdalena
Colombia B a r r a n c a b e r m e j a C a r t a g e n a El Guamo La Dorada
S u b t o t a I 122 500
H a g d a l e n a C a r i b b e a n Sea L u i s a Magdalena
Costa R i c a P u e r t o Limon
S u b t o t a I 12 000 C a r i b b e a n Sea
Costa R i c a P u e r t o Limon
S u b t o t a I 12 000 C a r i b b e a n Sea
Guatemala P u e r t o B a r r i o s
S u b t o t a I 11 000 C a r i b b e a n Sea
Guatemala P u e r t o B a r r i o s
S u b t o t a I 11 000 C a r i b b e a n Sea
Honduras P u e r t o C o r t e s
S u b t o t a 1 14 000 C a r i b b e a n Sea
Honduras P u e r t o C o r t e s
S u b t o t a 1 14 000 C a r i b b e a n Sea
Managua S u b t o t a l
16 000 Lake Managua Managua S u b t o t a l 16 000
Lake Managua
B a r r e l s a / | Wa te r body
1 0 0 0 25 000 24 OOP 50 000
9 700
P a r a p e t i Rocha P i r a i
9 700
1 0 0 0
Amazon
1 0 0 0 Mocoa
1 OOP 1 0 0 0
Napo
1 2 0 0 2 500 3 700
65 400
Amazon U c a y a l i
P e r u Conchan La P a m p U l a H a r s e l L a T a l a r a
850 1 0 0 0 0 0
1 400 65 000
P a c i f i c Ocean P a c i f i c Ocean P a c i f i c Ocean Magda I e n a
T o t a l f o r b a s i n
B a s i n : B r a z i l , N o r t h - E a s t
167 250
B r a z i I F o r t a l e z a 4 200
4 200
I A t l a n t i c Ocean
T o t a l f o r b a s i n - . - - . _ _ -B a s i n : C a r i b b e a n
- •
Colombia B a r r a n c a b e r m e j a C a r t a g e n a El Guamo La Dorada
S u b t o t a 1
1 1 0 0 0 0 5 000 2 500 5 000
122 500
Magda lena C a r i b b e a n Sea L u i s a (Magdalena
Costa R i c a P u e r t o Limon
S u b t o t a I 1 2 0 0 0 12 0 0 0
11 0 0 0
C a r i b b e a n Sea
Guatemala P u e r t o B a r r i o s
S u b t o t a I 11 0 0 0
14 nnn
C a r i b b e a n Sea
Honduras P u e r t o C o r t e s
R i i h t n t a I 14 nnn Carihhpnn
Managua S u h t o t a I
1 6 0 0 0 16 000
Lake Manaaua
231

Annex 6 ( c o n t . 7 ) - _ T - — — — ^ •
L o c a t i o n o f t h e p l a n t |
B a s i n : C a r i b b e a n ( c o n t . )
B a r r e l s a / | W a t e r b o d y
Panama Las M i n a s C o l o n
S u b t o t a l 100 OOP 1 0 0 0 0 0
L a k e G a t u n
T o t a l f o r b a s i n r = = = = = = = r = = = = = = = = = = = = = =
B a s i n : C e n t r a l Chi l e
275 5 0 0
C h i l e Con Con C o n c e p c i o n
69 0 0 0 75 0 0 0
P a c i f i c O c e a n P a c i f i c O c e a n
T o t a l f o r b a s i n ==============5========
B a s i n : C e n t r a l V e n e z u e l a
U 4 0 0 0
V e n e z u e l a Amuay C a r d ó n O p t o . La C r u z E l C h a u r e E l P a l i t o San Roque
6 5 3 000 3 0 5 0 0 0 195 0 0 0 195 0 0 0 105 0 0 0
5 3 0 0
G u l f o f V e n e z u e l a G u l f o f V e n e z u e l a C a r i b b e a n Sea C a r i b b e a n Sea C a r i b b e a n Sea G u e r e
T o t a l f o r b a s i n = = = = = = = = = = :==: = = = = = = = = = =
B a s i n : G u l f o f M e x i c o
1 4 5 8 3 0 0
Mex iCO A z c a p o t z a I CO C i u d a d M a d e r o M i n e t i 11 an Poza R i c a T u l a
105 0 0 0 175 0 0 0 2 7 0 0 0 0
2 7 0 0 0 150 0 0 0
L a k e T e x c o c o / T u l a G u l f o f M e x i c o C o a t z a c o a l c o s C a z o n e s T u l a
T o t a l f o r b a s i n
B a s i n : Ma r aca i bo
7 2 7 0 0 0
Co I o m b i a T i b u
S u b t o t a l 5 0 0 0 5 0 0 0
T i b u
V e n e z u e I a M a r a c a i b o
S u b t o t a I 61 OOP 61 POO
' ¿ ¿ ' ó o ó '
L a k e o f M a r a c a i b o
T o t a l f o r b a s i n
B a s i n : N o r t h P a c i f i c
M e x i c o Sa I amanea S a l i n a C r u z
2 1 0 0 0 0 170 0 0 0
L e r m a P a c i f i c O c e a n
T o t a l f o r b a s i n
B a s i n : O r i n o c o
3 8 0 0 0 0 =s======== ============
V e n e z u e l a O b i s p o s 5 0 0 0
T o ó ó '
S a n t o D o m i n g o
T o t a l f o r b a s i n
232

A n n e x 6 ( c o n t . 8 ) . = = = = = = === = === = = = = =
L o c a t i o n o f t h e p l a n t = = = = = = = = = = = = = = = = = = = = =
B a s i n : Pampa
B a r r e l s a / | W a t e r b o d y
A r g e n t i na B a h i a B l a n c a O p t o . G a l v a n L u j a n de Cuyo P l a z a H u i n c u l
13 8 5 0 1 7 0 0 0
1 0 5 3 8 4 2 3 4 8 5
A t l a n t i c O c e a n A t l a n t i c O c e a n M e n d o z a N e u q u e n
T o t a l f o r b a s i n
B a s i n : P a t a g o n i a
1 5 9 7 1 9
A r g e n t i n a Comodoro R i v a d a v i a San S e b a s t i a n
6 3 0 0 10
A t l a n t i c O c e a n A t l a n t i c O c e a n
T o t a l f o r b a s i n
B a s i n : P l a t a
6 3 1 0 = = = = = = = = = = = = = = = = = = = = = = = = = = = = = = = =
A r g e n t i n a B u e n o s A i r e s Campana Campo D u r a n La P l a t a Lomas de Z a m o r a Q u i L mes San L o r e n z o
S u b t o t a l
1 1 8 0 1 1 9 2 0 0 0 2 7 0 9 9
2 1 6 7 8 9 2 000
6 0 3 3 1 2 1
4 8 9 0 8 0
La P l a t a P a r a n a B e r m e j o La P l a t a La P l a t a ' La P l a t a Pe r a n a
B o l i v i a San A n d i t a S u c r e
S u b t o t a l
50 000
3 0 5 0
P i l c o m a y o C a i n e
B r a z i l A r a u c a i r a P a u l i n i a
S u b t o t a l
1 2 0 6 0 0 3 2 5 0 0 0 4 4 5 6 0 0
P a r a n a P i I c o m a y o
P a r a g u a y V i l l a E l i s a
S u b t o t a l 5 0 0 0 5 0 0 0
P a r a g u a y
U r u g u a y La T e j a
S u b t o t a l 4 3 0 0 0 4 3 0 0 0
9 8 5 7 3 ¿ '
La P l a t a
T o t a l f o r b a s i n
B a s i n : R i o B r a v o = = = = = = = = = = = = = = = = = = = = = = = = = = = = = = = = = = = = =
H e x i co C a d e r e y t a R e y n o s a
1 0 0 0 0 0 2 0 5 0 0
San J u a n B r a v o
T o t a l f o r b a s i n ;== = = = = = = = = = = = == = =
B a s i n : S a n F r a n c i s c o
1 2 0 5 0 0
B r a z i l Be t i m 7 2 4 0 0 I P a r a o p e b a
T o t a l f o r b a s i n 7 2 4 0 0 : = = = = s s s
233

A n n e x 6 ( c o n t . 1 0 )
L o c a t i o n o f t h e p l a n t |
B a s i n : S o u t h A t l a n t i c
==========s====s======================s==s
B a r r e l s ay | U a t e r b o d y = = = = = i: = = = s s s = r = r s s s = : s = s : : = = = = ===========
C a n o a s C a p u a v a C u b a t a o Duque de C a x i a s M a t a r i pe R i o G r a n d e R i o de J a n e i r o S a n t o A n d r e
7 2 4 0 0 3 3 0 0
162 9 0 0 2 5 6 2 0 0 132 7 0 0
9 3 0 0 9 5 0
3 3 8 0 0
Dos S i n o s A t l a n t i c O c e a n C u b a t a o N i t e r o i A t l a n t i c O c e a n L a g o a d o s P a t o s G u a n a b a r a Bay C u b a t a o
T o t a l f o r b a s i n
B a s i n : S o u t h P a c i f i c
6 7 1 550
C h i l e M a g a l l a n e s 1 5 0 0 S t r a i t o f M a g e l l a n
T o t a l f o r b a s i n 1 5 0 0
B a s i n : T r o p i c a I P a c i f i c
E c u a d o r E s m e r a I d a s La L i b e r t a d
S u b t o t a I
3 6 000 8 OOP
P a c i f i c O c e a n P a c i f i c O c e a n
000 E l S a l v a d o r A c a j u t l a
S u b t o t a l 1 7 0 0 0 1 7 0 0 0
P a c i f i c O c e a n
G u a t e m a I a E s c u i n 11 a
S u b t o t a l U 000 I M i c h a t o y a U 0 0 0
T o t a l f o r b a s i n = = = = = = = = = = = = = = = = = = = = = = = = = 75 0 0 0 = = = = = = =
5 3 8 5 3 5 9
= = = = = = = = = = = = = = = = = =
GRAND TOTAL
S o u r c e : OLADE, 1 9 7 9 .
B a r r e l s p e r d a y o f o p e r a t i o n .
= = = = = = = = = = =
234

Annex 6 ( c o n t . 1 0 )
IRON AND STEEL INDUSTRY ( t o n s )
L o c a t i o n of t h e p l a n t | I n s t a l l e d c a p a c i t y |
B a s i n : A r i d P a c i f i c
W a t e r body
Peru Chimbóte 500 000
s o o ' ó ó o '
P a c i f i c Ocean
T o t a l f o r b a s i n = = = = = = = = :: = = = = = = = £ = = = = = = ' B a s i n : B r a z i l , N o r t h - E a s t
B r a z i l R e c i f e 243 000
243 000
A t l a n t i c Ocean
T o t a l f o r b a s i n - - - - - - - - _ ^
B a s i n : C e n t r a l C h i l e
C h i l e T a l c a h u a n o 700 000
" / o o ' o ó o "
B i ob i o
T o t a l f o r b a s i n
B a s i n : C e n t r a l V e n e z u e l a
V e n e z u e l a B a r c e l o n a B a r q u i s i meto C a r a c a s
6 0 0 0 79 200
175 000
C a r i b b e a n S< T u r b i o Guai r e s
T o t a l f o r b a s i n
as i n : G u l f of M e x i c o
260 200
Hex i CO San Cosme X a l o s t o c V e r a c r u z
80 000 400 000
Z a v a p a n J amapa
T o t a l f o r b a s i n 480 000 - — - - — - - _ - - - — - . - - - _ - - - - .. —: - -B a s i n : I n t e r i o r of A r g e n t i n a
A r g e n t i na E s t . G r a l . San M a r t i n 210 000
210 OÓÓ
I San F r a n c i s c o
Tota I for bas i n j
Basin; M a r a c a i b o
V e n e z u e I a C iudad O j e d a M a r a c a i b o
1 0 0 0 0 12 0 0 0
Lake M a r a c a i b o Lake M a r a c a i b o
Total for b a s i n
Basin: North Pacific
22 000
Mex i CO L a z a r o C a r d e n a s San M i g u e l X o x t l a
300 000 450 000
Pacific O c e a n A t o y a c
Tota I for bas i n
Ras in: O r i n o c o
1 7>;n n n n
V e n e z u e l a RnI i va r
T o t a l f o r b a s i n
270 ono
270 000
n r i nofíft
235

Annex 6 ( c o n t . l l ) - - r - ^
Locat ion of the p l a n t — — = - : "
Basin: Pampa
t n s t a l ( e d c a p a c i t y Water body
Araent ina Bragado 135 000
' i i s ' ó o o '
Salado
To ta l f o r basin
Basin: P l a t a
Argent ina Buenos A i res Campana Tablada V i l l a Cons t i tuc ión
Subto ta l
2 750 000 385 000 260 000 22» OOP
3 619 000
La P l a t a Parana La P l a t a Parana
B r a z i l Lencois P a u l i s t a Mogi das Cruzes P i r a c i c a b a Sao Paulo
Subto ta l
40 000 511 000 290 000 430 OOP
1 271 OOP
' ¿ ' ¿ ¿ o ' o ó ó '
Paranapanema T i e t e P i r a c i c a b a T i e t e
To ta l f o r basin
Basin: Rio Bravo
Mexico Monclova Monterrey San Nico las
3 300 000 1 0 0 0 000
555 POO
Nadadores Pesquer i a Pesquer i a
Tota l f o r basin = - ... .
Basin: San Francisco
4 855 000 s s s s s s s s s s s s s
B r a z i l Belo Hor izonte Contagem D i v i n o p o l i s
902 000 80 000
209 000
Das Velhas Das Velhas Paraca
Tota l for basin . : ------ ----- - .. _ L: _ Basin: South A t l a n t i c
1 191 000
Barra Mansa 210 000 Para iba do Sul Corone 1 Fabr i c i ano 660 000 Doce Cubatao 2 448 000 Cubatao I pat i nga 2 763 000 Doce Pindamonhangaba 270 000 Para iba do Sul Porto Alegre 336 POO Guaiba Rio de Janeiro 786 000 Guanabara Bay Salvador 254 OOP A t l a n t i c Ocean San Jeronimo 179 OOP Jacui Santo Amaro 7 OOP Para iba do Sul Sao Goncalo 56 000 Guanabara Bay V i t o r i a 162 000 A t l a n t i c Ocean V o l t a Redonda 2 970 000 Para iba do Sul
Tota l for basin 11 101 000
Basin: u n s p e c i f i e d
Unspec i f i ed
T o t a l f o r bas in
870 000
' s f ó ' ó ó o '
GRAND TOTAL 31 477 200
Source: ILAFA, 1974.
236

Annex 6 ( c o n t . 1 0 )
NON-FERROUS METAL INDUSTRY ( t o n s )
L o c a t i o n of t h e p l a n t | I n s t a l l e d c a p a c i t y | W a t e r body
TYPE OF INDUSTRY : A l u m i n i u m
B a s i n : Guayanas
S u r i n a m e Paranam 66 000
T o t a l f o r b a s i n 66 000
B a s i n : G u l f of M e x i c o
M e x i c o V e r a c r u z 45 000 Jamapa
T o t a l f o r b a s i n 45 000
B a s i n : O r i n o c o
V e n e z u e l a C i u d a d Guayana 400 000 O r i n o c o
T o t a l f o r b a s i n 400 000
B a s i n : P a t a g o n i a
A r q e n t i na P u e r t o Madryn 140 000 A t l a n t i c Ocean
T o t a l f o r b a s i n 140 000
B a s i n : P l a t a
B r a z i I Pocas de C a l d a s S o r o c a b a
90 000 120 200
P a r d o S o r o c a b a
T o t a l f o r b a s i n 210 200
B a s i n : South A t l a n t i c
B r a z i 1 A r a t u Saramenha Duro P r e t o
58 000 60 000
J a c u i pe Doce
T o t a l f o r b a s i n | [ 118 000
T o t a l f o r i n d u s t r y | 9 7 9 200 1
TYPE OF INDUSTRY : Copper ( r e f i n i n g )
B a s i n : Amazon
P e r u La Oroya 55 000 1 Neg ro
T o t a l f o r b a s i n 55 000
B a s i n : A r i d P a c i f i c
C h i l e Chuqui camata Mantos B l a n c o s Pa i po t e Pot r e r i I l o s
370 000 31 000 72 000 85 000
Loa Loa Copi apo S a l a d o
S u b t o t a I 558 000
237

Annex 6 ( c o n t . 1 3 )
Location of the plant | Installed capacity | = = = ~ _ = :r . i - - • • : • = = = = - - :: ^ = = - = :: ::- = - : = = - -Type of industry: Copper (refining) Basin : Arid Pacific (cont.)
Water body
Peru Cerro Verde I lo
SubtotaI
33 000 150 000 183 000
Pacific Ocean
Total for basin
Basin: Central Chi le
741 000 = = = = = = = = = = = = = = = = = = = = = = = = s = == = = = = = = = = = s: = = = s
Chile Caletones Las Ventanas Sant iago
130 000 2 2 2 6 0 0
16 0 0 0
Cachapoal Pacific Ocean Mapocho
Total for basin ========================» Basin: Gulf of Mex ico
368 600 z : - — : _ — i = - r: ^ n - r' - - -- _ i: IT - :: • - ^ r _. -J
Mexico Azcapotzalco 75 300 Lake Texcoco/Tula
Total for basin
Total for industry | - •• _ _ - - — • • - . . r - _ .
TYPE OF
Basin: Amazon
75 300
1 239 900 I = sr= = = = = = :r = = = = = = = = = = s INDUSTRY : Copper (smelting)
Peru La Oroya 182 400
'Í82'4¿¿"
I Negro
Total for basin ======================= Basin: Arid Pacific
Chi le Chuqui camata PotreriI los
Subtotal
940 000 245 000
1 185 000
Loa Salado
Peru I lo
Subtota I 456 000 456 000
1 641 000
Pacific Ocean
Total for basin
B a s i n : C a l i f o r n i a
Mexico Cananea Santa Rosalia
126 300 45 600
Bocomuch i Gulf of Cal i forni a
Total for basin :====================== Basin: Central Chile
171 900 = = = = = = = = = =
Chi le Chegres Las Ventanas
8 6 0 0 0 255 000
Aconcagua P a c i f i c Ocean
T o t a l f o r b a s i n 3 4 t 000
238

Annex 6 (cont.14) -= = = = = = = s = = = = = = = = = = == = = = = = = = = = = = = = = = = = =: = = = = = == = = = = = = = =
Location of the plant | Installed capacity | Water body = = = = = = = s = = = = = = = = = = = = = = = = = = = = = = = = = = = = = = = s = = = = = = = = = = = = = = = s = = = = = = = : Type of industry: Cooper (smelting) (cont.) ===================================================== Basin: Southern Interior
: = = = = = = = ,
M e x i c o , San Luis Potosi 136 800
Total for basin
Total for industry | ============================= TYPE' OF INDUSTRY =========================
Basin: Amazon
: = = = = = = = = = = =
136 800 =========== 2 473 100 =========== Lead (smelting and refining)
Peru La Oroya 90 000 Neg ro
Total for basin ¡
Basin: Interior of Argentina
90 000
Argent i na Abra Pampa 1 500
' i ' s ó o ' Total for basin ================= Basin: Plata
Argentina Puerto Vilelas |
Subtotal 30 000 30 000
Parana
Brazi l Panelas
Subtotal 19 000 19 000
49 000
Urra
Total for basin
Basin: Rio Bravo
Mexico Chihuahua 136 800 Chuvi scar
Total for basin
Basin: South Atlantic
136 800
B r a z i l Santo Amaro 2 2 0 0 0 Para i ba
Total for basin
Basin: Southern Interior
2 2 0 0 0
Mexico Torreon 2 1 0 0 0 0 Nazas
Total for basin ¡
Total for industry I
2 1 0 0 0 0 =========
í n o 3 n n

Annex 6 (cont.15) _ - -- — - - • - - • - — -Location of the plant | Installed capacity | Water body
TYPE OF INDUSTRY : Zinc (eIectroI iticaI>
Basin: Amazon
Peru La Oroya 34 500 Negro
Total for basin -- • — B.is 1 ••; Plata
34 500
Argentina Borgh i 13 000
óoo
Parana
Total for basin
Basin: San Francisco
13
BraziI Tres Marias 32 800
8ÓÓ
San Francisco
Total for basin
Basin: South Atlantic
32
15 5
700 900
Parai buna Itaquai
Total for basin
Basin: Southern Interior
21 .600 = = = = = = = = = = = = =
Hex i C O
Tor reon 47 880 Nazas .
Total for basin 47
Total for industry | 149
TYPE OF INDUSTRY ;
8 8 0
780 I
Zinc (smelting) - _.. -Basin: Patagonia
Comodoro Rivadavia 16
' Í 6 '
000
0 0 0
I Atlantic Ocean
Total for basin
Basin: Rio Bravo
Hex i C O
R o s i t a Salt i I lo
61 30
000 0 0 0
Sabi nas Pesquer i a
Total for basin
Basin: Southern Interior
91 000
Mexico San Luis Potos i 000 113
' Í Í 3
220
Source: Non-Ferrous Metal Data, 1983, American Bureau of Metal Statistics
Total for basin (
Total for industry |
000
000
240

Annex 6 ( c o n t . 1 8 )
E. THERMAL ELECTRIC POWER GENERATING STATIONS
======-=====a======s=== Locat ion of the p lan t ======================= Basin: Amazon
1 Capaci ty (MU) ==================== 1 Water body ===========================
Braz i I Belem Manaos
130 69
Marajo Bay Amazon
Tota l fo r basin 199
Basin: A r i d P a c i f i c
C h i l e Anto fagasta Barqui to Chuqui camata Pedro de V a l d i v i a Tocopi11 a
21 68 23 24
200
P a c i f i c Ocean P a c i f i c Ocean
P a c i f i c Ocean
Tota l fo r basin 336
Basin: Cal i f o r n i a
Mexico Ahome Baja C a l i f o r n i a Cajeme Durango EL Fuer te Guaymas Kermosi I lo Maza t lan T i j u a n a
41 75 32 35 59
272 32 40
307
Fuerte
Yaqui Hezqui t a l Fuer te Gulf of C a l i f o r n i a Sonora Gulf of C a l i f o r n i a Ti Juana
Tota l for basin 893
Bas in: Caribbean
Colombia B a r r a n q u i I la Bogota Cartagena Honda Yumbo Zupaguria
Subtota l
74 66
1 0 2 155
53 71
624
31
Magdalena Bogota Car ibbean Sea Magdalena Cauca Bogota
Costa R i ca Heredi a
Subtota I 31
"¿55 '
Grande de Tarco les
T o t a l fo r basin
Basin: Cen t ra l C h i l e
C h i l e Corone I Laguna Verde Laja Sant iago Ventanas
125 55 33
100 115
P a c i f i c Ocean P a c i f i c Ocean Laja Hapocho P a c i f i c Ocean
T o t a l fo r basin
Basin: Gulf of Mexico
428
Mexico Al tami ra Tampico
316 29
A l t a m i r a Lagoon Gulf of Mexico
T o t a l fo r basin 345
241

Locat ion of the p l a n t Capac i ty (MU) Uater body =s===»=======s==================s========== = = = = = = = = = = = = = = = = = = = = = = = = = = =
Basin: I n t e r i o r of A r g e n t i n a
Argent ina Dean Funes 33 La Banda 18 Dulce P i l a r 141 Segundo Tucuman 80 s a l i
T o t a l fo r bas in 272 = = = = = = = = = = = = = = = = = = = = = = = = = = = = = = = = = = = = = = = = = = = = = = = = = = = = = = = = = = = = = = = = = = = = = =
Basin: North P a c i f i c
Mexico Celaya 43 Lerma Guadalaj ara 87 Sant iago Salamanca 322 Lerma
T o t a l fo r bas in 452 = = = = = = = = = = = = = = = = = = = = = = = = = = = = = = = = = = = = = = = = = = = = = = = = = = = = = = = = = = = = = = = = = = = = = =
Basin: Orinoco
Colombia B e l e n c i t o 25 Ch i camocha Pa i pa 99 Grande
To ta l fo r bas in 124 = = = = = = = = = = = = = = = = = = = = = = = = = = =
Basin: Pampa
Argent i na Bahia Blanca 50 A t l a n t i c Ocean Lujan de Cuyo 120 Mendoza Mar de Ajo 16 A t l a n t i c Ocean Necochea 206 A t l a n t i c Ocean Neuquen 30 Neuquen
To ta l fo r bas in 422
Basin: Patagonia ssssssssssssssssss====s==ss
Argent ina Comodoro R ivadav ia 47 A t l a n t i c Ocean
Tota l fo r bas i n 47 = = = = = = = = = = = = = = = = = = = = = = = = = = = = = = = = = = = = = = = = = = = = = = = = = = = = = = = = = = = = = = = = = = = = = =
Basin: P l a t a
Argent i na Atucha 370 Parana Avel laneda 184 La P l a t a Barranqueras 55 Parana Bragado 12 Salado Buenos A i res 2 845 La P l a t a Caseros 19 Uruguay Chascomus 3 salado Concepcion del Uruguay 15 Uruguay C o r r i e n t e s 175 Parana Guemes 120 San Francisco G u t i e r r e z 17 La P l a t a Juni n 16 Salado La Tablada 54 La P l a t a Halaver 36 La P l a t a Horon 36 La P l a t a 0 1 a v a r r i a 32 TapaIquen Pa I pa la 36 San Francisco Parana 22 Parana Pehuajo 12 Posadas 48 Parana Reconqui sta 3 Parana Resi s tenc i a 108 Parana Rio Cuarto 3 Cuarto
= : ; = = = = = = = = = = = = = = = = = = = = = = = = = = = = = = = = = = = = = = = = = = = = =
Uate r body
33 18
141 80
272
Dulce Segundo S a l i
43 87
322
452 = = = = = = =
Lerna Sant iago Lerma
25 99
124
Ch i camocha Grande
Lujan de Cuyo Mar de Ajo Necochea Neuquen
To ta l fo r bas in
Basin: Patagonia
50 120
16 206
30
422
A t l a n t i c Ocean Mendoza A t l a n t i c Ocean A t l a n t i c Ocean Neuquen
=s=========:
Argent ina Comodoro R ivadav ia
Tota l fo r bas i n
47 ' 4 7 '
A t l a n t i c Ocean
Basin: P l a t a
Argent i na Atucha Avel laneda Barranqueras Bragado Buenos A i res Caseros Chascomus Concepcion del Uruguay C o r r i e n t e s Guemes G u t i e r r e z Juni n La Tablada Halaver Horon 0 1 a v a r r i a Pa I pa l a Parana Pehuajo Posadas Reconqui sta Resi s tenc i a Rio Cuarto
370 184
55 12
2 84S 19 3
15 175 120
17 16 54 36 36 32 36 22 12 48 3
108 3
Parana La P l a t a Parana Salado La P l a t a Uruguay salado Uruguay Parana San Francisco La P l a t a Salado La P l a t a La P l a t a La P l a t a TapaIquen San Francisco Parana
Parana Parana Parana Cuarto
242

Annex 6 ( c o n t . 1 8 )
Location of the plant ======================= Basin: Plata Argentina fcont.l Rio Tercero Roque Saenz P. Rosario Salta San Nicolas San Pedro Santa Fe Tartagal Villa Maria
Subtotal
1 Capacity (HU) ====================
644 17
226 32
720 8
37 13 51
1 Uater body ===========================
Tercero
Parana San Francisco Parana San Francisco Salado Itiyuro Tercero
Location of the plant ======================= Basin: Plata Argentina fcont.l Rio Tercero Roque Saenz P. Rosario Salta San Nicolas San Pedro Santa Fe Tartagal Villa Maria
Subtotal 6 065
1 Uater body ===========================
Tercero
Parana San Francisco Parana San Francisco Salado Itiyuro Tercero
Brazil A l egrete Bage Campiñas Cari ova Sao Roque Tubarao
Subtotal
66 446 30 30
450 255
Ibi rapui ta Negro Pi raci caba Das Antas Tiete PaImei ras
Brazil A l egrete Bage Campiñas Cari ova Sao Roque Tubarao
Subtotal 1 277
Ibi rapui ta Negro Pi raci caba Das Antas Tiete PaImei ras
Uruguay Montevideo
Subtotal 280 1 Atlantic Ocean
Uruguay Montevideo
Subtotal 280 1 Atlantic Ocean
Total for basin 7 622 1 Basin: Rio Bravo
Mexico Ch i huahua Delicias Francisco I Madero Monterrey
Nava Rio Bravo San Nicolas
76 66 30
161 30 38 75
393
Chuviscar San Pedro Manantial Cabecera Pesquer i a Pesqueria
Nazas Pantano
Total for basin 869
Basin: South Atlantic
Brazi l Campos Duque de Caxias Porto Alegre Salvador Santa Cruz Sao Geronimo Sao Goncalo
30 23 24 20
599 92 33
Para i ba Do Sul Niteroi Gua i ba Atlantic Ocean Sepetiba Bay Jacui Guanabara Bay
Total for basin 821
Basin: Southern Interior
Mexi co Gomez Palacio Torreon
189 28
Nazas Nazas
Total for basin 217
243

Annex 6 (concl.)
= = = = = = = = = === = = = = = = = = = = = = = = =:= = = = = = = = = = = S = 3S SS = = S = = = = = = = = = = = = = = = = = = Location of the plant | Capacity (HU) | Water body
= = = = s s = = = = = = = = = = = = = = = = s = = = s = = s s = = = = s s s s s = = = = = = = s = = = s = = = = = = = = = s = = = = = = s = Basin: Tropical Pacific
Costa Rica San Jose
Subtotal 2 0 Torres
Costa Rica San Jose
Subtotal 2 0 Torres
Ecuador Cumbaya X i mena
Subtotal
2 3 1 1 0
San Pedro Guayas
Ecuador Cumbaya X i mena
Subtotal 1 3 3
San Pedro Guayas
El Salvador Acajutla Soyopango
Subtotal
70 5 9
Pacific Ocean Acelhuate
El Salvador Acajutla Soyopango
Subtotal 1 2 9
Pacific Ocean Acelhuate
Guatemala Escuintle La Laguna
Subtotal
58 3 0
Hi chatoya Maria Linda ,
Guatemala Escuintle La Laguna
Subtotal 88
Hi chatoya Maria Linda ,
Total for basin 3 7 0
GRAND TOTAL U 0 7 2
:==a=========-======:
Source; Various national sources.
244

Annex 7
LATIN AMERICA AND THE CARIBBEAN: MINING PRODUCTION, BY MINERALS, COUNTRIES AND YEARS
Count ry s = = = = = = = = s = s = = = :
ANTIMONY ( t o n s A r g e n t i n a B o l i v i a Guatemala Honduras Hex ico Peru
T o t a l
1950
8 7 8 1 . 0
5 8 6 8 . 0 9 7 0 . 6
15 6 1 9 . 6
1970 1
0 . 3 11 5 7 6 . 0
261 .0 3 4 2 . 9
4 4 6 8 . 0 1 1 6 7 . 0
17 8 1 5 . 2
1 1980 s s s s s s s s s s s s s s s s
15 4 6 5 . 0 5 5 6 . 0
2 8 . 0 2 1 7 6 . 0
6 5 5 . 0
18 8 8 0 . 0
1 1985
8 6 3 5 . 0 9 0 . 0
3 2 0 . 0 3 5 7 4 . 0
2 6 3 . 0
12 8 8 2 . 0
B r a z i I ^ ^ Mex i C O Peru
T o t a l
1 0 6 6 . 8 8 9 8 6 . 5
10 0 5 3 . 3
2 9 8 . 0 9 1 4 0 . 0
7 7 2 . 0
10 2 1 0 . 0
6 9 3 2 . 0 2 4 7 5 . 0
9 4 0 7 . 0
5 0 0 0 . 0 8 0 0 . 0
5 8 0 0 . 0
BAUXITE ( 1 000 B r a z i l Domi n i can
Repub l i c Guyana H a i t i Jamaica S u r i name
T o t a l
t o n s )
1 8 . 6
1 6 6 8 . 4
2 0 4 5 . 4 3 7 3 2 . 4
5 0 9 . 8
1 0 8 6 . 0 4 4 1 7 . 2
6 5 6 . 8 12 0 0 9 . 7
6 0 2 2 . 0
24 701 .5
4 1 5 2 . 4
5 1 0 . 5 3 0 5 2 . 0
4 6 1 . 0 12 0 6 4 . 3
4 9 0 3 . 1
25 1 4 3 . 3
6 4 3 3 . 2
2 4 8 4 . 7
6 2 3 9 . 3 3 3 7 4 . 8
18 5 3 2 . 0
BERYLLIUM (tons A r g e n t i n a B r a z i I
T o t a l
5 )
2 8 9 4 . 0
2 8 9 4 . 0
1 5 7 1 . 0 3 3 3 3 . 0
3 9 0 4 . 0
3 1 . 0 5 5 0 . 0
581 . 0
15 .4 1 4 9 6 . 8
1 5 1 2 . 2
BISMUTH ( t o n s ) B o l i v i a Mex ico Peru
T o t a l
2 4 . 4 2 6 3 . 2 2 2 6 . 9
5 1 4 . 5
6 2 3 . 0 571 .0 8 0 6 . 2
2 0 0 0 . 2
1 1 . 0 7 7 0 . 0 4 9 0 . 0
1 2 7 1 . 0
1 2 5 . 6 385 .0 3 6 2 . 6
8 7 3 . 2
CHROMIUM ( 1 00( B r a z i I Cuba
T o t a l
t o n s ) 2 . 0 1 . 5
3 . 5
2 7 . 9 8 . 0
3 5 . 9
3 1 6 . 9 1 0 . 0
3 2 6 . 9
2 5 0 . 0 1 0 . 0
2 6 0 . 0
COAL ( 1 000 tor Argent i na 8 r a z i I Colombi a Chi l e Mexico Peru Venezue la
T o t a l
2 6 . 0 1 9 5 9 . 0 1 0 1 0 . 0 1 9 9 5 . 0 1 0 0 0 . 0
1 9 5 . 7 1 .4
6 1 8 7 . 1
6 1 5 . 5 2 3 6 1 . 3 2 5 0 0 . 0 1 3 8 2 . 4 2 9 5 9 . 2
156 .1 4 0 . 0
10 0 1 4 . 5
3 8 9 . 0 4 9 8 4 . 6 4 1 1 3 . 0
9 9 5 . 6 6 8 2 7 . 5
8 5 . 0 b / 4 8 . 0
17 4 4 2 . 7
3 9 6 . 0 7 1 7 8 . 0 a / 9 7 0 6 . 0 1 3 6 9 . 8 9 7 7 0 . 8
8 5 . 0 b / 3 6 . 0
28 5 4 1 . 6
245

C o u n t r y 1950 1970 1 1 9 8 0 1 1985 = = = = = = = = = = = s = = = = = = = s = = = = = = = = = = = = ^ = = = = = = = = = = = = = = = = = = = = = = = =
COPPER ( 1 0 0 0 o n s ) A r g e n t i n a 0 . 5 0 . 2 0 . 1 B o l i v i a 4 . 7 8 . 9 1 . 7 2 . 4 B r a z i 1 3 . 8 0 . 4 3 2 . 0 Chi l e 3 6 2 . 9 6 9 1 . 6 1 0 6 7 . 9 1 3 5 6 . 4 C o l o m b i a 0 . 1 1 . 4 0 . 2 Cuba 2 0 . 4 0 . 4 3 . 3 3 . 0 D o m i n i c a n
R e p u b l i c 0 . 4 E c u a d o r 0 . 5 0 . 2 0 . 9 G u a t e m a l a 0 . 8 H a i t i 4 . 8 M e x i c o 6 1 . 7 61 . 0 1 7 5 . 4 1 7 3 . 0 N i c a r a g u a 3 . 4 P e r u 3 0 . 1 2 2 0 . 2 3 6 6 . 7 3 8 6 . 8
T o t a l 4 8 0 . 3 9 9 5 . 3 1 6 1 8 . 7 1 9 5 3 . 9
GOLD ( k i l o g r a m
A r g e n t i na 2 4 8 . 8 3 3 0 . 4 6 9 9 . 8 B o l i v i a 2 4 0 . 0 9 5 1 . 9 1 6 1 9 . 7 9 3 3 . 1 B r a z i 1 6 0 8 0 . 7 5 3 2 9 . 0 4 0 4 3 4 . 0 62 2 0 7 . 0 Chi l e 5 9 8 4 . 0 1 6 2 2 . 9 6 8 3 5 . 7 17 2 4 0 . 1 Co lombi a 11 8 0 1 . 0 6 2 6 7 . 9 15 8 7 6 . 4 35 7 6 9 . 0 C o s t a R i c a 3 . 6 1 5 . 6 5 5 9 . 9 1 0 8 8 . 6 Domi n i can
R e p u b l i c 1 4 . 8 11 4 9 5 . 9 10 4 8 6 . 5 E c u a d o r 2 9 9 8 . 5 265 . 0 7 . 0 31 . 1 E l S a l v a d o r 9 0 3 . 6 71 . 6 7 7 . 5 8 . 7 Guyana 3 8 4 . 6 1 3 7 . 9 3 4 2 . 2 3 2 1 . 1 H o n d u r a s 1 1 3 6 . 7 1 0 3 . 7 6 3 . 0 7 7 . 8 Hai t i 9 3 . 3 9 0 . 0 9 0 . 0 Mex i CO 12 6 9 4 . 0 6 1 6 6 . 0 5 4 7 6 . 9 8 8 6 4 . 5 N i c a r a g u a 7 1 2 9 . 1 3 5 8 2 . 3 1 8 6 6 . 0 761 . 8 P e r u 3 9 6 4 . 4 3 3 4 9 . 0 4 4 1 7 . 9 6 9 5 0 . 0 S u r i n a m e 1 4 3 . 4 3 5 . 4 1 0 . 9 1 5 . 6 V e n e z u e l a 1 0 7 1 . 9 6 9 4 . 2 4 2 1 . 9 2 2 6 7 . 4
T o t a l 54 7 9 9 . 1 28 6 8 5 . 7 89 9 2 5 . 3 147 8 1 2 . 1
IRON r l oon f n n c )
A r g e n t i n a 4 0 . 0 2 3 8 . 8 4 1 2 . 0 5 7 8 . 0 B o l i v i a 4 . 1 6 . 0 7 . 0 B r a z i l 1 9 8 7 . 0 40 2 3 3 . 6 100 2 7 5 . 0 114 6 9 5 . 0 Ch i l e 2 9 7 5 . 9 11 2 6 5 . 0 8 9 6 0 . 0 6 5 3 4 . 0 C o l o m b i a 4 5 3 . 0 4 9 1 . 0 440 . 0 G u a t e m a l a 2 . 0 M e x i c o 4 1 9 . 6 4 3 5 3 . 6 8 1 4 9 . 0 8 1 0 3 . 0 Peru 9 7 1 1 . 9 5 6 7 9 . 0 4 8 9 2 . 0 V e n e z u e l a 1 9 8 . 1 22 0 9 9 . 0 13 6 8 1 . 0 14 7 1 0 . 0
T o t a l 5 6 2 0 . 6 88 3 6 1 .0 137 6 5 3 . 0 149 9 5 9 . 0
LEAD Í 1 oon t o n s )
A r g e n t i n a 2 3 . 0 3 5 . 6 3 2 . 6 2 9 . 0 B o l i v i a 3 1 . 2 2 5 . 8 1 5 . 9 7 . 8 B r a z i l 2 0 . 3 2 1 . 8 1 9 . 2 Chi l e 3 . 3 0 . 9 0 . 5 2 . 7 C o l o m b i a 0 . 5 0 . 1 E c u a d o r 0 . 2 0 . 1 0 . 2 0 . 2 G u a t e m a l a 3 . 0 1 . 0 0 . 1 0 . 1 H o n d u r a s 0 . 3 1 5 . 1 1 3 . 3 2 0 . 4 M e x i c o 2 3 8 . 1 1 7 6 . 6 1 4 7 . 2 181 . 6 P e r u 6 2 . 1 1 5 6 . 8 1 8 9 . 1 2 1 6 . 2
T o t a l 3 6 1 . 2 4 3 2 . 7 4 2 0 . 8 4 7 7 . 2
1970
0 . 5 8 . 9 3 . 8
6 9 1 . 6 0 . 1 0 . 4
0 . 4 0.2
4 . 8 61 .0
3 . 4 220.2 9 9 5 . 3
1 9 8 0
0 . 2 1 . 7 0 . 4
1 0 6 7 . 9 1 . 4 3 . 3
0 . 9 0 . 8
1 7 5 . 4
3 6 6 . 7
1 6 1 8 . 7
1985 = = = = = = = = = =
0.1 2 . 4
3 2 . 0 1 3 5 6 . 4
0 . 2 3 . 0
1 7 3 . 0
3 8 6 . 8
1 9 5 3 . 9
Guyana H o n d u r a s Hai t i Mex i CO N i c a r a g u a P e r u Sup íname V e n e z u e l a
T o t a l
1 1 3 6 . 7
12 6 9 4 . 0 7 1 2 9 . 1 3 9 6 4 . 4
1 4 3 . 4 1 0 7 1 . 9
54 7 9 9 . 1
9 5 1 . 9 5 3 2 9 . 0 1 6 2 2 . 9 6 2 6 7 . 9
1 5 . 6
265 . 0 71 . 6
1 3 7 . 9 1 0 3 . 7
9 3 . 3 1 6 6 . 0 5 8 2 . 3 3 4 9 . 0
3 5 . 4 6 9 4 . 2
28 6 8 5 . 7
3 3 0 . 4 1 6 1 9 . 7
4 0 4 3 4 . 0 6 8 3 5 . 7
15 8 7 6 . 4 5 5 9 . 9
4 9 5 . 9 7 . 0
7 7 . 5 3 4 2 . 2
6 3 . 0 9 0 . 0
4 7 6 . 9 8 6 6 . 0 4 1 7 . 9
1 0 . 9 4 2 1 . 9
89 9 2 5 . 3
11
6 9 9 . 8 9 3 3 . 1
62 2 0 7 . 0 17 2 4 0 . 1 35 7 6 9 . 0
1 0 8 8 . 6
10 4 8 6 . 5 31 . 1
8 . 7 3 2 1 . 1
7 7 . 8 9 0 . 0
8 8 6 4 . 5 761 . 8
6 9 5 0 . 0 1 5 . 6
2 2 6 7 . 4
147 8 1 2 . 1
IRON ( 1 0 0 0 t o n s )
A r g e n t i n a B o l i v i a B r a z i l Ch i l e C o l o m b i a G u a t e m a l a M e x i c o Per t ! V e n e z u e l a
T o t a l
4 0 . 0
1 9 8 7 . 0 2 9 7 5 . 9
4 1 9 . 6
1 9 8 . 1
5 6 2 0 . 6
2 3 8 . 8 4 . 1
40 2 3 3 . 6 11 2 6 5 . 0
4 5 3 . 0 2 . 0
4 3 5 3 . 6 9 7 1 1 . 9
22 0 9 9 . 0
88 3 6 1 .0
4 1 2 . 0 6 . 0
100 2 7 5 . 0 8 9 6 0 . 0
4 9 1 . 0
8 1 4 9 . 0 5 6 7 9 . 0
13 6 8 1 . 0
137 6 5 3 . 0
5 7 8 . 0 7 . 0
114 6 9 5 . 0 6 5 3 4 . 0
440 . 0
8 1 0 3 . 0 4 8 9 2 . 0
14 7 1 0 . 0
149 9 5 9 . 0
LEAD ( 1 000 t o n s )
A r g e n t i n a B o l i v i a B r a z i l Chi l e C o l o m b i a E c u a d o r G u a t e m a l a H o n d u r a s M e x i c o P e r u
T o t a l
2 3 . 0 3 1 . 2
3 . 3
0 . 2 3 . 0 0 . 3
2 3 8 . 1 6 2 . 1
361 - ?
3 5 . 6 2 5 . 8 2 0 . 3
0 . 9 0 . 5 0 . 1 1 . 0
1 5 . 1 1 7 6 . 6 1 5 6 . 8
432.7
3 2 . 6 1 5 . 9 2 1 . 8
0 . 5 0 . 1 0 . 2 0 . 1
1 3 . 3 1 4 7 . 2 1 8 9 . 1
420.8
2 9 . 0 7 . 8
1 9 . 2 2 . 7
0 . 2 0 .1
2 0 . 4 181 .6 2 1 6 . 2
477.2
246

Annex 6 (con t .18)
Country _ ^ :—: - - ; MANGANESE f1 OC
1950
0 tons)
1970 1 1 1980 1 1985 :SSSSSSSSSSSSSSSSSSS=5SSSSSSS:
Argent ina B o l i v i a Braz i t C h i l e Colombia Cuba Mexico Peru
8 6 . 0 1 6 . 7
11 .6 U . 5
0 .5
10.2 Q . I
1 201 .9 11 .1
0 . 5 2 0 . 0 9 8 . 6
0 . 6
1 .4 1 .4
1 339 .0 9 . 0
2 1 . 4
161 .0
0 . 3
1 0 5 6 . 7 0 .5
20 .0
192.5
T o t a l 129.3 1 3 4 3 . 0 1 533 .2 1 270 .0
MERCURY ( t o n s )
Chi le Colombia
11 .0 13 .4 7 .4
Dominican Republ i c
Mexico Peru
128.0 1 0 4 3 . 0 110.2
5 . 5 145 .0
0 . 7 3 4 4 . 7
T o t a l 139.0 1 174.0 150.5 3 4 5 . 4
MOLYBDENUM ( t o n s )
Chi le Mexico Peru
992 .0
0 . 9
5 701 .2 141 .1 6 0 6 . 9
13 668 .0 7 3 . 9
2 6 8 8 . 0
18 3 9 0 . 0 3 6 9 6 . 8 3 8 2 7 . 9
T o t a l 9 9 2 . 9 6 4 4 9 . 2 16 4 2 9 . 9 25 9 1 4 . 7
B r a z i I Colombi a Cuba
2 990 .0
36 7 7 5 . 7
4 291 .0
38 230 .0
13 2 0 0 . 0 14 000 .0 38 000 .0
Domini can RepubI i c
Guatemala Mexico 4 4 . 0
15 500 .0 6 900 .0
18 .1
25 4 0 0 . 0
T o t a l 39 8 0 9 . 7 64 9 3 9 . 1 90 6 0 0 . 0
Oil. (1 OOP inS-)
Argent i na 3 728 .8 22 793 .2 28 566 .0 26 716 .2 B o l i v i a 9 8 . 0 1 4 0 2 . 2 1 3 8 3 . 9 1 140 .0 Braz i I 5 3 . 9 9 6 8 5 . 6 10 562 .0 31 716 .3 Chi le 100.2 1 976 .5 1 933 .1 2 074 .4 Colombia 5 414 .4 12 725 .5 7 3 0 3 . 7 10 2 3 9 . 0 Cuba 2 . 1 167.4 288 .0 9 1 3 . 2 Ecuador 418 .4 235 .3 11 890 .4 16 2 7 9 . 9 Mexico 11 746 .0 29 132.0 122 822 .0 159 2 6 3 . 0 Peru 2 3 8 8 . 9 4 176.0 11 345 .4 10 935 .1 T r i n i d a d and
Tobago 3 285 .5 8 114.3 12 340 .9 10 2 4 7 . 0 Venezuela 86 929 .0 215 177.0 125 737 .0 97 5 3 9 . 8
T o t a l 114 165.2 305 585 .0 334 172.4 367 0 6 3 . 9
Colombia 760 .5 8 0 8 . 7 446 .2 3 6 2 . 3
T o t a l 760.5 8 0 8 . 7 4 4 6 . 2 3 6 2 . 3
SALTPETER (1 0( 0 tons)
Chi le 1 6 5 9 . 7 6 7 4 . 1 620 .4 7 0 0 . 0
T o t a l 1 6 5 9 . 7 6 7 4 . 1 620 .4 700 .0
247

Country 1950 1 1970 1980 1 1985 = = = = = = 5: = = === = = = = = = = - - = = = = = = = = = = = = = = = = = = = = = = = = = = = = = = = = =
Chi le 17 .0 2 5 . 0 Mexico 1 2 6 . 0 46 . 0 4 0 . 0 Peru 7 . 0 23 . 0 2 2 . 0
T o t a l 1 3 3 . 0 86 . 0 8 7 . 0
A r g e n t i n a 8 7 . 6 73 . 3 61 .5 B o l i v i a 1 8 5 . 6 189 . 7 125 .0 B r a z i I 0 . 7 1 2 . 0 44 .5 6 6 . 5 Chi le 3 7 . 2 7 6 . 2 298 .5 5 0 5 . 0 Colombi a 3 . 6 2 . 4 4 . 1 6 . 1 Domi n i can
Republ i c 60 .5 4 6 . 5 Ecuador 8 . 0 2 . 2 1 . 0 El Sa lvador 4 . 8 4 . 8 0 . 6 Honduras 1 0 9 . 3 1 1 8 . 7 53 .5 8 0 . 7 H a i t i 0 . 5 0 . 6 0 . 7 Mexico 1 5 2 8 . 5 1 3 3 2 . 4 1 556 . 8 2 1 5 8 . 8 N i c a r a g u a 4 . 1 6 . 7 5 . 1 1 .5 Peru 4 1 7 . 8 1 2 3 9 . 0 1 339 . 8 1 7 6 9 . 8
T o t a l 2 1 0 9 . 2 3 0 6 8 . 1 3 632 . 2 4 8 2 2 . 7
SULPHUR (1 000 t o n s )
Argent i na 7 . 7 4 0 . 0 10 .0 B o l i v i a 7 . 8 1 6 . 0 11 .0 2 . 0 B r a z i l 9 . 0 156 . 0 3 3 7 . 0 Chi le 1 5 . 4 1 0 9 . 0 115 . 0 109 .5 Colombi a 1 . 2 3 4 . 0 27 . 0 3 8 . 0 Cuba 30 . 0 8 . 0 Ecuador 6 . 1 14 . 0 14 .0 Mex ico 1 1 . 2 1 381 .0 2 217 .0 2 1 9 0 . 0 Trinidad and
Tobago 4 . 4 57 . 0 5 . 0
T o t a l 4 3 . 3 1 5 9 9 . 5 2 627 . 0 2 7 1 3 . 5
TIN ( t o n s )
A r g e n t i n a 261 .0 1 1 7 2 . 0 600 .0 2 7 0 . 0 B o l i v i a 31 7 1 2 . 0 30 1 0 0 . 0 27 271 . 0 18 0 0 0 . 0 B r a z i I 1 8 3 . 0 3 6 8 0 . 0 6 930 . 0 22 000 .0 Mexico 4 4 7 . 0 5 3 3 . 0 60 . 0 4 0 0 . 0 Peru 3 8 . 2 1 0 2 . 9 1 077 . 0 3 8 0 7 . 0
T o t a l 32 641 .2 35 5 8 7 . 9 35 938 .0 44 4 7 7 . 0
Argent i na 2 3 . 6 1 4 3 . 8 44 .0 3 6 . 0 B o l i v i a 2 4 8 4 . 8 1 8 4 5 . 2 2 732 . 0 1 551 .0 B r a z i l 1 3 7 1 . 7 1 1 5 6 . 2 1 116 . 0 1 1 7 5 . 0 Guatema I a 4 0 . 8 Mex i CO 6 7 . 9 2 8 8 . 0 265 . 8 291 .0 Peru 5 1 6 . 2 8 0 4 . 2 581 . 0 8 7 0 . 0
T o t a l 4 4 6 4 . 2 4 2 7 8 . 2 4 738 . 8 3 9 2 3 . 0
1970
126.0 7 . 0
1 3 3 . 0
1980 I 1985 ============s=========:
1 7 . 0 4 6 . 0 2 3 . 0
8 6 . 0
2 5 . 0 4 0 . 0 2 2 . 0
8 7 . 0
8 7 . 6 1 8 5 . 6
1 2 . 0 7 6 . 2
2 . 4
2 . 2 4 . 8
1 1 8 . 7 0 . 5
1 3 3 2 . 4 6 . 7
1 2 3 9 . 0
3 0 6 8 . 1
7 3 . 3 1 8 9 . 7
4 4 . 5 2 9 8 . 5
4 . 1
6 0 . 5 1 . 0 4 . 8
5 3 . 5 0 . 6
1 5 5 6 . 8 5 . 1
1 3 3 9 . 8
3 6 3 2 . 2
61 .5 125 .0
6 6 . 5 5 0 5 . 0
6.1
4 6 . 5
0.6 8 0 . 7
0 . 7 2 1 5 8 . 8
1 .5 1 7 6 9 . 8
4 8 2 2 . 7
SULPHUR (1 000 t o n s )
Argent i na B o l i v i a B r a z i l Chi le Colombi a Cuba Ecuador Mex ico Trinidad and
Tobago
T o t a l
7 . 7 7 . 8
1 5 . 4 1 . 2
1 1 . 2
4 3 . 3
4 0 . 0 1 6 . 0
9 . 0 1 0 9 . 0
3 4 . 0
6 .1 1 3 8 1 . 0
4 . 4
1 5 9 9 . 5
1 1 . 0 1 5 6 . 0 1 1 5 . 0
2 7 . 0 3 0 . 0 1 4 . 0
2 2 1 7 . 0
5 7 . 0
2 6 2 7 . 0
10.0 2 . 0
3 3 7 . 0 109 .5
3 8 . 0 8 . 0
14 .0 2 1 9 0 . 0
5 . 0
2 7 1 3 . 5
TIN ( t o n s )
A r g e n t i n a B o l i v i a B r a z i I Mexico Peru
T o t a l
31 261 .0 7 1 2 . 0 1 8 3 . 0 4 4 7 . 0
3 8 . 2
32 6 4 1 . 2
1 1 7 2 . 0 30 1 0 0 . 0
3 6 8 0 . 0 5 3 3 . 0 1 0 2 . 9
35 5 8 7 . 9
6 0 0 . 0 27 2 7 1 . 0
6 9 3 0 . 0 6 0 . 0
1 0 7 7 . 0
35 9 3 8 . 0
2 7 0 . 0 18 000 .0 22 0 0 0 . 0
4 0 0 . 0 3 8 0 7 . 0
44 4 7 7 . 0
Argent i na B o l i v i a B r a z i l Cuaterna I a Mex i CO P e r u
T n t a l
2 3 . 6 2 4 8 4 . 8 1 3 7 1 . 7
6 7 . 9 5 1 6 . 2
4 4 6 4 . 7
1 4 3 . 8 1 8 4 5 . 2 1 1 5 6 . 2
4 0 . 8 2 8 8 . 0 8 0 4 . 2
4 P7S.?
4 4 . 0 7 3 2 . 0 116.0
2 6 5 . 8 581 . 0
4 y'ÍR R
3 6 . 0 1 5 5 1 . 0 1 1 7 5 . 0
291 .0 8 7 0 . 0
•K 9 ? 3 . 0
248

ZINC C1 000 t o n s )
Argent i na 1 2 . 6 3 9 . 0 3 3 . 7 3 6 . 0 B o l i v i a 1 9 . 6 4 6 . 5 4 6 . 2 4 1 . 0 B r a z i 1 1 1 . 0 7 0 . 0 1 1 0 . 0 Chi l e 0 . 1 1 .5 1 . 1 1 8 . 0 Colombi a 0 . 2 0 . 3 1 . 0 Ecuador 0 . 1 0 . 6 0 . 1 Gua temala 0 . 3 1 . 0 0 . 1 Honduras 0 . 1 1 8 . 6 1 6 . 0 4 4 . 0 Mex ico 223 .5 2 6 6 . 4 2 3 5 . 8 2 8 0 . 0 N i caragua Peru 8 8 . 0 2 9 9 . 0 5 3 0 . 8 5 8 8 . 6
T o t a l 3 4 4 . 2 6 8 3 . 3 9 3 4 . 6 1 1 1 8 . 7
Argent i na B o l i v i a B r a z i t Chi l e Colombi a Ecuador Gua temala Honduras Mex ico N i caragua Peru
T o t a l
12.6 1 9 . 6
0 . 1
0 . 3 0.1
223 .5
8 8 . 0
3 4 4 . 2
1970
3 9 . 0 4 6 . 5 1 1 . 0
1 .5 0 . 2 0.1 1 . 0
18.6 2 6 6 . 4
2 9 9 . 0
6 8 3 . 3
1980
3 3 . 7 4 6 . 2 7 0 . 0
1 . 1 0 . 3 0 . 6 0 . 1
16.0 2 3 5 . 8
5 3 0 . 8
9 3 4 . 6
~ - - - -
1985 : = = = = = :
3 6 . 0 4 1 . 0
110.0 1 8 . 0
1 . 0 0.1
4 4 . 0 2 8 0 . 0
5 8 8 . 6
1 1 1 8 . 7
Source: ECLAC. " E s t a d í s t i c a s m i n e r a s : p roducc ión y p r e c i o s en América L a t i n a y e l C a r i b e " ( L C / R . 5 4 5 ) , 18 March 1987.
a / 1984. b/ 1979 .
249

A n n e x 7
L A T I N AMERICA AND THE CARIBBEAN: AGRICULTURAL CHEMICALS WHOSE CONSUMPTION ANO/OR SALE HAVE BEEN BANNED, WITHDRAWN,
SEVERELY RESTRICTED OR NOT APPROVED BY GOVERNMENTS
= = = = = = = = = = = = = = = = 5 = = = = = S = =:== = = = = = = = = = = = = = = = = = = = = = = = = = = = = = = = = = = = = S = , A G R I C U L T U R A L
C H E M I C A L S
= = = = s: = = = = = = =: = = = = = =s = = = = = s = = = = 1 . a l p h a - H C H
L A T I N AMERICA & THE CARIBBEAN A G R I C U L T U R A L C H E M I C A L S
= = = = s: = = = = = = =: = = = = = =s = = = = = s = = = = 1 . a l p h a - H C H
C O U N T R Y
A r g e n t i n a
E F F E C T I V E DATE a / = = = = = = = s = = = = = = = = = s =
2 O c t o b e r 1 9 8 0
2 . b e t a - H C H A r g e n t i na 2 O c t o b e r 1 9 8 0
3 . d e l t a - H C H A r g e n t i na 2 O c t o b e r 1 9 8 0
4 . gamma-HCH A r g e n t i na A r g e n t i na C o l o m b i a E c u a d o r
20 D e c e m b e r 1 9 7 1 1 J u n e 1 9 7 2
May 1 9 7 8 1985
5 . ALDRIN A r g e n t i na A r g e n t i na A r g e n t i na A r g e n t i na Chi l e C o l o m b i a E c u a d o r V e n e z u e l a
19 M a r c h 1 9 6 3 3 0 A p r i I 1 9 6 8
20 December 1 9 7 1 1 J u n e 1 9 7 2
5 J a n u a r y 1983 6 December 1 9 7 4
1985 6 June 1 9 8 3
6 . AMITRAZ A r g e n t i na 24 June 1 9 8 0
7 . AMITROLE E c u a d o r 1985
8 . ARAMITE A r g e n t i na 2 0 December 1 9 7 1
9 . ARSENIC E c u a d o r 1985
1 0 . CAMPHECHLOR C o l o m b i a E c u a d o r V e n e z u e l a
D e c e m b e r 1974 1985 1 9 8 3
1 1 . CHLORDANE A r g e n t i na A r g e n t i na Chi l e C o l o m b i a E c u a d o r V e n e z u e l a
1 June 1 9 7 2 10 June 1 9 6 9
5 J a n u a r y 1983 6 December 1 9 7 4
1985 1983
1 2 . CHLORBECONE V e n e z u e l a 1 9 8 3
1 3 . CHLORDIMEFORM C o l o m b i a E c u a d o r G u a t e m a l a
19 J u l y 1 9 7 8 1985
A p r i l 1 9 7 8
U . CHLOROBENZILATE E c u a d o r
1 5 . DDT A r g e n t i n a A r g e n t i na A r g e n t i n a A r g e n t i n a Chi l e C o l o m b i a C o l o m b i a C o l o m b i a Cuba E c u a d o r E c u a d o r Cuaterna l a V e n e z u e l a
19 M a r c h 1963 3 0 A p r i L 1 9 6 8
20 December 1971 1 June 1 9 7 2
1 J a n u a r y 1985 2 May 1 9 7 7
12 Hay 1 9 7 8 6 December 1 9 7 4
1 9 7 0 1 9 8 5 1 9 8 5
A p r i l 1 9 8 0 1 9 8 3
250

A n n e x 6 ( c o n t . 1 8 )
A G R I C U L T U R A L C H E M I C A L S
= = = = = = = = s = = = = = a = = = = = = = = = = = = = = 1 6 . D I E L D R I N
L A T I N AMERICA & THE CARIBBEAN A G R I C U L T U R A L C H E M I C A L S
= = = = = = = = s = = = = = a = = = = = = = = = = = = = = 1 6 . D I E L D R I N
C O U N T R Y
A r g e n t i n a A r g e n t i n a C h i l e C o l o m b i a E c u a d o r V e n e z u e I a
E F F E C T I V E DATE a /
21 F e b r u a r y 1 9 6 8 2 7 M a r c h 1 9 6 9
5 J a n u a r y 1 9 8 3 6 D e c e m b e r 1 9 7 4
1 9 6 5 1 9 8 3
1 7 . D INOSEB E c u a d o r 1 9 8 5
1 8 . ENDOSULFAN A r g e n t i na A r g e n t i n a
1 May 1 9 6 8 1 J u n e 1 9 7 2
1 9 . E N D R I N A r g e n t i n a A r g e n t i n a A r g e n t i n a A r g e n t i n a A r g e n t i n a C h i l e C o l o m b i a E c u a d o r V e n e z u e l a
1 9 M a r c h 1 9 6 3 1 H a y 1 9 6 8
1 0 J u n e 1 9 6 9 2 0 D e c e m b e r 1 9 7 1
1 J u n e 1 9 7 2 5 J a n u a r y 1 9 8 3
S e p t e m b e r 1 9 8 5
1 9 8 3
2 0 . ETHYLENE D I B R O M I D E ( E D B )
C h i l e C o l o m b i a E c u a d o r
7 F e b r u a r y 1 9 8 5 15 May 1 9 8 5
1 9 8 5
2 1 . H C H - M I X E D ISOMERS A r g e n t i na C o l o m b i a C o l o m b i a E c u a d o r
2 O c t o b e r 1 9 8 0 6 D e c e m b e r 1 9 7 4
1 2 May 1 9 7 8 1 9 8 5
2 2 . HEPTACHLOR A r g e n t i na A r g e n t i na A r g e n t i na A r g e n t i na A r g e n t i n a C h i l e E c u a d o r V e n e z u e l a
1 J u n e 1 9 7 2 21 F e b r u a r y 1 9 6 8
1 May 1 9 6 8 1 0 J u n e 1 9 6 9
2 0 D e c e m b e r 1 9 7 1 5 J a n u a r y 1 9 8 3
1 9 8 3
2 3 . HEXACHLOROBENZENE A r g e n t i n a A r g e n t i na A r g e n t i na
1 9 M a r c h 1 9 6 3 3 0 A p r i I 1 9 6 8
1 J u n e 1 9 7 2
2 4 . ISOBENZAN C o l o m b i a D e c e m b e r 1 9 7 4
2 5 . LEAD E c u a d o r 1 9 8 5
2 6 . LEPTOPHOS C o l o m b í a E c u a d o r G u a t e m a l a
5 J u l y 1 9 7 7
O c t o b e r 1 9 7 7
2 7 . M A L E I C HYDRAZIDE G u a t e m a l a
2 8 . M E L I P A X C o l o m b i a D e c e m b e r 1 9 7 4
2 9 . MERCURY C o l o m b i a N o v e m b e r 1 9 7 4
3 0 . METHOXYCHLOR A r g e n t i na A r g e n t i na A r g e n t i na A r g e n t i na
1 9 M a r c h 1 9 6 3 3 0 A p r i I 1 9 6 8
1 May 1 9 6 8 1 J u n e 1 9 7 2
251
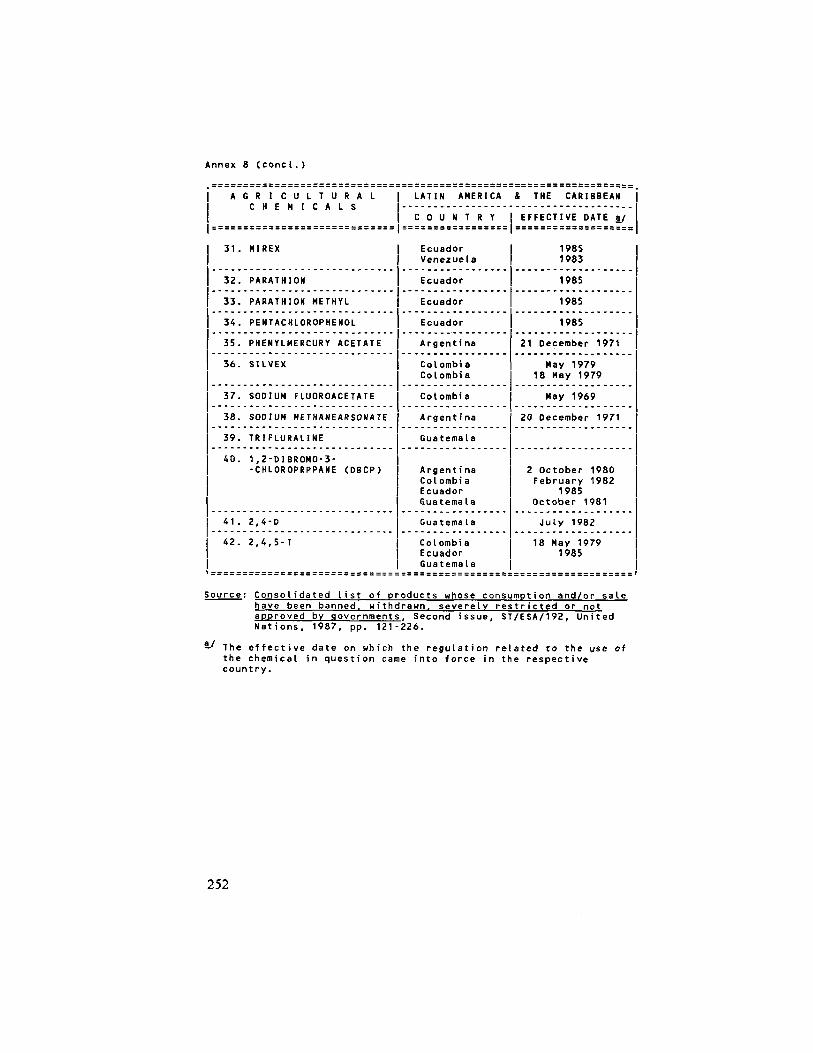
A n n e x 8 ( c o n c l . )
3 1 . MIREX E c u a d o r V e n e z u e l a
1985 1 9 8 3
3 2 . PARATHION E c u a d o r 1985
3 3 . PARATHION METHYL E c u a d o r 1985
3 4 . PENTACHLOROPHENOL E c u a d o r 1985
3 5 . PHENYLMERCURY ACETATE A r g e n t i n a 21 December 1 9 7 1
3 6 . S I L V E X C o l o m b i a C o l o m b i a
May 1 9 7 9 18 May 1 9 7 9
3 7 . SODIUM FLUOROACETATE C o l o m b i a May 1 9 6 9
3 8 . SODIUM METHANEARSONATE A r g e n t i n a 20 December 1 9 7 1
3 9 . T R I F L U R A L I N E G u a t e m a l a
4 0 . 1 , 2 - D l B R O M O - 3 --CHLOROPRPPANE ( D B C P ) A r g e n t i na
C o l o m b i a E c u a d o r G u a t e m a l a
2 O c t o b e r 1 9 8 0 F e b r u a r y 1 9 8 2
1 9 8 5 O c t o b e r 1 9 8 1
4 1 . 2 , 4 - D G u a t e m a l a J u l y 1982
4 2 . 2 , 4 , 5 - T C o l o m b i a E c u a d o r G u a t e m a I a
18 May 1 9 7 9 1 9 8 5
LAT IN AMERICA & THE CARIBBEAN
C O U N T R Y I EFFECTIVE DATE a /
E c u a d o r V e n e z u e l a
1985 1 9 8 3
E c u a d o r
E c u a d o r
E c u a d o r
A r g e n t i n a
1985
1985
1985
21 December 1 9 7 1 3 5 . PHENYLMERCURY ACETATE
3 6 . S I L V E X C o l o m b i a C o l o m b i a
May 1 9 7 9 18 May 1 9 7 9
3 7 . SODIUM FLUOROACETATE
3 8 . SODIUM METHANEARSONATE
3 9 . T R I F L U R A L I N E
C o l o m b i a
A r g e n t i n a
G u a t e m a l a
May 1 9 6 9
20 December 1 9 7 1
4 0 . 1 , 2 - D l B R O M O - 3 --CHLOROPRPPANE ( D B C P ) A r g e n t i na
C o l o m b i a E c u a d o r G u a t e m a l a
2 O c t o b e r 1 9 8 0 F e b r u a r y 1 9 8 2
1 9 8 5 O c t o b e r 1 9 8 1
4 1 . 2 , 4 - D
4 2 . 2 , 4 , 5 - T
G u a t e m a l a J u l y 1982
. --- - = - - - = r • -
C o l o m b i a E c u a d o r G u a t e m a I a
= = = - - - - :..--: = = =;
18 May 1 9 7 9 1 9 8 5
:s = = = = = = s = = = = = =: = = =: = :
S o u r c e : C o n s o l i d a t e d l i s t o f p r o d u c t s whose c o n s u m p t i o n a n d / o r s a l e h a v e b e e n b a n n e d , w i t h d r a w n , s e v e r e l y r e s t r i c t e d or n o t a p p r o v e d by g o v e r n m e n t s . S e c o n d i s s u e , S T / E S A / 1 9 2 , U n i t e d N a t i o n s , 1 9 8 7 , p p . 1 2 1 - 2 2 6 .
T h e e f f e c t i v e d a t e on w h i c h t h e r e g u l a t i o n r e l a t e d t o t h e u s e of t h e c h e m i c a l i n q u e s t i o n came i n t o f o r c e i n t h e r e s p e c t i v e c o u n t r y .

ECLAC publications
ECONOMIC COMMISSION FOR U T I N AMERICA AND THE CARIBBEAN Casilla 179-0 Santiago, Chile
PERIODIC PUBLICATIONS
C E P A L Review
CIPAL Review first appeared in 1976 as part of the Publications Programme of the Economic Commission for Latin America and the Caribbean, its aim being to make a contribution to the study of the economic and social development problems of the region. The views expressed in signed articles, including those by Secretariat staff members, are those of the authors and therefore do not necessarily reflect the point of view of the Organization.
CEPAL Review is published in Spanish and English versions three times a year.
Annual subscription costs for 1989 are US$16 for the Spanish version and US$18 for the English version. The price of single issues is US$10 in both cases.
Estudio Económico de América Latina y el Caribe
Economic Survey of Latin America and the Caribbean
1980. 1981. 1982. 1982. 1983. 1983. 1984. 1984. 1985. 1986. 1987. 1988.
664 pp 863 pp 693 pp 199 pp 694 pp
voi. I vol. // voi i ÜOT HP voi a 179 pp M / VOL a
702 pp 233 pp 672 pp 734 pp 692 pp 741 pp
1980. 1981. 1982. 1982. 1983, 1983, 1984, 1984, 1985, 1986, 1987, 1988,
629 pp 837 pp
vol. / 658 pp vol. II 186 pp vol / 686 pp vol / / 166 pp vol / 685 pp vol.11 216 pp
660 pp 729 pp 685 pp 637 pp
(issues for previous years also available)

Anuaria Estadística de América Latina y el Caribe/ Statistical Yeartook for Latin America and the Caribbean (bilingüe)
1980. 617 pp. 1988. 782 pp. 1981. 727 pp. 1987. 714 pp. 1983. (1982/1983) 749 pp. 1988. 782 pp. 1984. 761 pp. 1989. 770 pp. 1985. 792 pp.
Libros de la C E P A L
(issues for previous years also available)
1 Manual de proyectos de desarrollo económico, 1958, 5" ed. 1980, 264 pp. 1 Manual on economic development projects, 1958, 2nd. ed. 1972, 242 pp. 2 América Latina en el umbral de los años ochenta, 1979, 2" ed. 1980, 203 pp. 3 Agua, desarrollo y medio ambiente en América Latina, 1980, 443 pp. 4 Los bancos transnacionales y el financiamiento externo de América Latina. La experiencia de!
Perú. 1980, 265 pp. 4 Transnational banks and tbe extarnal finance of L atin America: the experience of Peru, 1985,
342 pp. 5 La dimensión ambiental en los estilos de desarrollo de América Latina, por Osvaldo Sunkel,
1981, 2" ed. 1984, 136 pp. 6 La mujer y e! desarrollo: gula para la planificación de programas y proyectos, 1984, 115 pp. 6 Women and development: guidelines for programme and project planning, 1982, 3rd. ed.
1984, 123 pp. 7 Africa y América Latina: perspectivas de la cooperación interregional, 1983, 286 pp. 8 Sobrevivencia campesina en ecosistemas de altura, vols. I y II, 1983, 720 pp. 9 La mujer en el sector popular urbano. América Latina y el Caribe, 1984, 349 pp.
10 Avances en la interpretación ambienta! de! desarrollo agrícola de América Latina, 1985, 236 pp.
11 El decenio de la mujer en el escenario latinoamericano, 1986, 216 pp. 11 The decade for women in Latin America and the Caribbean: baclcground and prospects, 1988,
215 pp. 12 América Latina: sistema monetario internacional y financiamiento externo, 1986, 416 pp. 12 Latin America: international monetary system and external financing, 1986, 405 pp 13 Raúl Prebisch: Un aporte al estudio de su pensamiento, 1987, 146 pp. 14 Cooperativismo latinoamericano: antecedentes y perspectivas, 1989,371 pp. 15 CEPAL, 40 años (1948-1988), 1988, 85 pp. 15 ECLAC 40 Years (1948-1988), 1989, 83 pp. 16 América Latina en la economía mundial, 1988, 321 pp. 17 Gestión para el desarrollo de cuencas de alta montaña en la zona andina, 1988, 187 pp. 18 Políticas macroeconómicas y brecha externa: América Latina en tos años ochenta, 1989,
201 pp. 19 CEPAL, Bibliografía 1948-1988, 1989, 648 pp. 20 Desarrollo agrícola y participación campesina, 1989, 404 pp. 21 Planificación y gestión deí desarrollo en áreas de expansión de ía frontera agropecuaria en
América Latina, 1989, 113 pp. 22 Transformación ocupacionaí y crisis social en América Latina, 1989, 243 pp.

M0I80GRAPH SERIES
Cuadernos de la C E P A L
1 América Latina: el nuevo escenario regional y mundial/Latin America: the new regiana! and world setting, (bilingüe), 1975, 2" ed. 1985, 103 pp.
2 Las evoluciones regionales de ia estrategia internacional del desarrollo, 1975, 2° ed. 1984, 73 pp.
2 Regional appraisals of the international development stratBgv, 1975, 2nd. ed. 1985, 82 pp. 3 Desarrollo humano, cambio social y crecimiento en América Latina, 1975, 2° ed. 1984,
103 pp. 4 Relaciones comerciales, crisis monetaria e integración económica en América Latina, 1975,
85 pp. 5 Síntesis de la segunda evaluación regional de la estrategia internacional del desarrollo, 1975,
72 pp. 6 Dinero de valor constante. Concepto, problemas y experiencias, por Jorge Rose, 1975, 2" ed.
1984, 43 pp. 7 La coyuntura internacional y el sector externo, 1975, 2" ed. 1983, 106 pp. 8 La industrialización latinoamericana en los anos setenta, 1975, 2° ed. 1984, 116 pp. 9 Dos estudios sobre inflación 1972-1974. La inflación en los países centrales. América Latina y
la inflación importada, 1975, 2° ed. 1984, 57 pp. s/n Canada and the foreign firm, D. Pollock, 1976, 43 pp. 10 Reactivación del mercado común centroamericano, 1976, 2" ed. 1984, 149 pp. 11 Integración y cooperación entre países en desarroHu en el ámbito agrícola, por Germánico
Salgado, 1976, 2" ed. 1985, 62 pp. 12 Temas deí nuevo orden económico internacional, 1976, 2° ed. 1984, 85 pp. 13 En torno a las ideas de ía CEPAL: desarrollo, industrialización y comercio exterior, 1977,2° ed.
1985, 57 pp. 14 En torno a las ideas de la CEPAL: problemas de ía industrialización en América Latina, 1977,
2" ed. 1984, 46 pp. 15 Los recursos hidráulicos de América Latina. Informe regional, 1977, 2° ed. 1984, 75 pp. 15 The water resources of Latin America. Regional report 1977, 2nd. ed. 1985, 79 pp. 16 Desarrollo y cambio social en América Latina, 1977, 2" ed. 1984, 59 pp. 17 Estrategia internacional de desarrollo y establecimiento de un nuevo orden económico
internacional, 1977, 3° 58d. 1984, 61 pp. 17 International development stnSagy sná ssísMisSimaní of s mvj isitarnstional econmis order,
1977, 3rd. ed. 1985, 59 pp. 18 Raices históricas de íes estructuras distributivas de América Latina, por A. di Filippo, 1977,
2° ed. 1983, 64 pp. 19 Dos estudios sobre endeudamiento externo, por C. Massad y R. Zahier, 1977, 2" ed. 1986,
66 pp. s/n United States — Latin Mmorisan trade aadíioancisf relations: some policy resommandations,
S. Weintraub, 1977, 44 pp. 20 Tendencias y proyecciones a largo plazo de! desarrollo económico de América Latina, 1978,
3° ed. 1985, 134 pp. 21 25 años en ía agricultura de América Latina: rasgos principales 1950-1975, 1978, 2" ed.
1983, 124 pp. 22 Notas sóbrela familia como unidad socioeconómica, porCarlos A.Borsotti, 1978, 2" ed. 1984,
60 pp. 23 La organización de ía información para ía evaluación del desarrollo, por Juan Sourrouille, 1978.
2" ed. 1984, 61 pp. 24 Contabilidad nacional a precios constantes en América Latina, 1978, 2" ed. 1983,,60 pp. s/n Energy in latín Emories: Tiie NistoríeslÑeesnl, J. Mullen, 1978, 66 pp.

25 Ecuador: desafios y logros de la política económica en la fase de expansión petrolera, 1979, 2° ed. 1984, 153 pp.
26 Las transformaciones rurales en América Latina: ¿desarrollo social o marginación?, 1979, r ed. 1984, 160 pp.
27 La dimensión de la pobreza en América Latina, por Oscar Altimir, 1979, 2" ed. 1983, 89 pp. 28 Organización institucional para el control y manejo de la deuda externa. El caso chileno, por
Rodolfo Hoffman, 1979, 35 pp. 29 La política monetaria y el ajuste de la balanza de pagos: tres estudios, 1979, 2" ed. 1984,
61 pp. 29 Monetary policy and balance of payments adjustment: three studies, 1979, 60 pp. 30 América Latina: las evaluaciones regionales de la estrategia internacional del desarrollo en los
años setenta, 1979, 2° ed. 1982, 237 pp. 31 Educación, imágenes y estilos de desarrollo, por G. fiama, 1979, 2° ed. 1982, 72 pp. 32 Movimientos internacionales de capitales, por R. H. Arriazu, 1979, 2" ed. 1984, 90 pp. 33 Informe sobre las inversiones directas extranjeras en América Latina, por A. E. Calcagno,
1980, 2° ed. 1982, 114 pp. 34 Las fluctuaciones de la industria manufacturera argentina, 1950-1978, porD. Heymann, 1980,
2° ed. 1984, 234 pp. 35 Perspectivas de reajuste industrial: la Comunidad Económica Europea y los países en
desarrollo, por B. Evers, G. de Groot y W. Wagenmans, 1980, 2" ed. 1984, 69 pp. 36 Un análisis sobre la posibilidad de evaluarla solvencia crediticia de los países en desarrollo, por
A. Saieh, 1980, 2° ed. 1984, 82 pp. 37 Hacia los censos latinoamericanos de ios años ochenta, 1981, 146 pp. s/n The economic relations of Latín America with Europa, 1980, 2nd. ed. 1983, 156 pp. 38 Desarrollo regional argentino: ía agricultura, por J. Martin, 1981, 2° ed. 1984, 111 pp. 39 Estratificación y movilidad ocupacionaí en América Latina, porC.FilgueirayC. Geneletti, 1981,
2° ed. 1985, 162 pp. 40 Programa de acción regional para América Latina en los años ochenta, 1981, 2" ed. 1984,
62 pp. 40 Regional programme of action for Latin America in the 1980s, 1981, 2nd. ed. 1984, 57 pp. 41 El desarrollo de América Latina y sus repercusiones en la educación. Alfabetismo y escolaridad
básica, 1982, 246 pp. 42 América Latina y la economía mundial del café, 1982, 95 pp. 43 El ciclo ganadero y la economía argentina, 1983, 160 pp. 44 Las encuestas de hogares en América Latina, 1983, 122 pp. 45 Las cuentas nacionales en América Latina y el Caribe, 1983, 10G pp. 45 National accounts in Latin America and the Caribbean, 1983, 97 pp. 46 Demanda de equipos para generación, transmisión y transformación eléctrica en América
Latina, 1983, 193 pp. 47 La economía de América Latina en 1982: evolución general política cambiaría y renegociaciú.i
de ía deuda externa, 1984, 104 pp. 48 Políticas de ajuste y renegociación de la deuda externa en América Latina, 1984, 102 pp. 49 La economía de América Latina y el Caribe en 1983: evolución general, crisis y procesos de
ajuste, 1985, 95 pp. 49 The economy of Latín America and the Caribbean in 1983: main trends, the impact of the crisis
and the adjustment processes. 1985, 93 pp. 50 La CEPAL, encarnación de una esperanza de América Latina, por Hernán Santa Cruz, 1985,
77 pp. 51 Hacia nuevas modalidades de cooperación económica entre América Latina y eUapón, 1986,
233 pp. SI Towards new forms of economic co-oparation between Latin America and Japan, 1987,
245 pp.
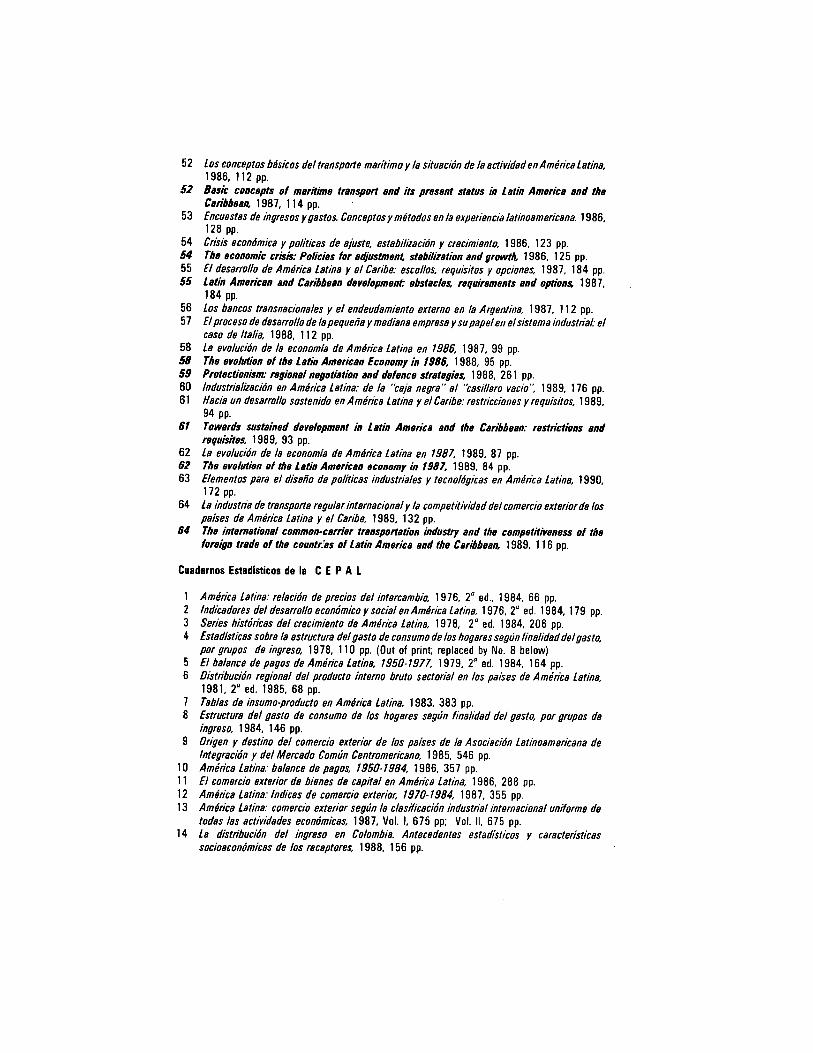
52 Los conceptos básicos de! transporte marítimo y la situación de ¡a actividad en América Latina, 1986, 112 pp.
52 Basic concepts of maritime transport and its present status in Latin America and the
Caribbean, Aw 53 Encuestas de ingresos y gastos. Conceptos y métodos en ta experiencia latinoamericana. 1986,
128 pp. 54 Crisis económica y políticas de ajuste, estabilización y crecimiento, 1986, 123 pp. 54 The economic crisis: Policies for adjustment stabilization and growth, 1986, 125 pp. 55 Ei desarrollo de América Latina y eí Caribe: escollos, requisitos y opciones, 1987, 184 pp. 55 Latín American and Caribbean development obstacles, requirements and options, 1987,
184 pp. 56 Los bancos transnacionales y eí endeudamiento externo en la Argentina, 1987, 112 pp. 57 Ei proceso de desarrollo de la pequeña y mediana empresa y su papel en el sistema industrial: eí
caso de Italia, 1988, 112 pp. 58 La evolución de ía economía de América Latina en 1986, 1987, 99 pp. 58 The evolution of the Latín American Economy in 1986, 1988, 95 pp. 59 Protectionism: regional negotiation and defence strategies, 1988, 261 pp. 60 Industrialización en América Latina: de ía "caja negra" ai "casillero vacio", 1989, 176 pp. 61 Hacia un desarrollo sostenido en América Latina y el Caribe: restricciones y requisitos, 1989,
94 pp. 81 Towards sustained development in Latin America and the Caribbean: restrictions and
requisites, 1989, 93 pp. 62 La evolución de ía economía de América Latina en 1987, 1989, 87 pp. 62 The evolution of the Latín American economy in 1987, 1989, 84 pp. 63 Elementos para eí diseño de políticas industriales y tecnológicas en América Latina, 1990,
172 pp. 64 La industria de transporte regular internacional y ía competitividad del comercio exterior de los
países de América Latina y eí Caribe, 1989, 132 pp. 64 The international common-carrier transportation industry and the competitiveness of the
foreign trade of tbe countr.es of Latin America and the Caribbean, 1989, 1 16 pp.
Cuadernos Estadisticos da la C E P A L
1 América Latina: relación de precios del intercambio, 1976, 2° ed., 1984, 66 pp. 2 Indicadores deí desarrollo económico y social en América Latina, 1976, 2" ed. 1984, 179 pp. 3 Series históricas deí crecimiento de América Latina, 1978, 2" ed. 1984, 206 pp. 4 Estadísticas sobre la estructura deí gasto de consumo de los hogares según finalidad deí gasto,
por grupos de ingreso, 1978, 110 pp. (Out of print; replaced by No. 8 below) 5 Eí balance de pages de América Latina, 1950-1977, 1979, 2° ed. 1984, 164 pp. 6 Distribución regional del producto interno bruto sectorial en ios países de América Latina,
1981, 2" ed. 1985, 68 pp. 7 Tablas de insumo-producto en América Latina, 1983, 383 pp. 8 Estructura del gasto de consumo de los hogares según finalidad deí gasto, por grupos de
ingreso, 1984, 146 pp. 9 Origen y destino del comercio exterior de ios países de la Asociación Latinoamericana de
integración y del Mercado Común Centromerícano, 1985, 546 pp. 10 América Latina: balance de pagos, 1950-1984, 1986, 357 pp. 11 Eí comercio exterior de bienes de capital en América Latina, 1986, 288 pp. 12 América Latina: índices de comercio exterior, 1970-1984, 1987, 355 pp. 13 América Latina: comercio exterior según ía clasificación industrial internacional uniforme de
todas ías actividades económicas, 1987, Vol. I, 675 pp; Vol. II, 675 pp. 14 La distribución deí ingreso en Colombia. Antecedentes estadisticos y características
socioeconómicas de ios receptores, 1988, 156 pp.

Estudios e Informes de la C E P A L
1 Nicaragua: e! impacto de la mutación política, 1981, 2° ed. 1982, 126 pp. 2 Perú 1968-1977: la política económica en un proceso de cambio global, 1981, 2° ed. 1982,
166 pp. 3 La industrialización de América Latina y la cooperación internacional, 1981, 170 pp. (Out of
print; will not be reprinted.) 4 Estilos de desarrollo, modernización y medio ambiente en la agricultura latinoamericana, 1981,
4° ed. 1984, 130 pp. 5 El desarrollo de América Latina en los años ochenta, 1981, 2° ed. 1982, 153 pp. 5 Latín American development ín the 1980s. 1981, 2nd. ed. 1982, 134 pp. 6 Proyecciones de! desarrollo latinoamericano en ios años ochenta. 1981,3" ed. 1985, 96 pp. B Latín American development projections for the 1980s, 1982, 2nd. ed. 1983, 89 pp. 7 Las relaciones económicas externas de América Latina en los años ochenta. 1981, 2° ed.
1982, 180 pp. 8 integración y cooperación regionales en los años ochenta. 1982, T ed. 1982, 174 pp. 9 Estrategias de desarrollo sectorial para ios años ochenta: industria y agricultura. 1981, 2° ed.
1985, 100 pp. 10 Dinámica del subempíeo en América Latina. PREALC, 1981, 2° ed. 1985, 101 pp. 11 Estilos de desarrollo de la industria manufacturera y medio ambiente en América Latina, 1982,
2° ed. 1984, 178 pp. 12 Relaciones económicas de América Latina con ios países miembros del "Consejo de Asistencia
Mutua Económica", 1982, 154 pp. 13 Campesinado y desarrollo agrícola en Bolivia, 1982, 175 pp. 14 Ei sector externo: indicadores y análisis de sus fluctuaciones. El caso argentino, 1982, 2° ed.
1985, 216 pp. 15 Ingeniería y consuhoría en Brasil y el Grupo Andino, 1982, 320 pp. 16 Cinco estudios sobre la situación de la mujer en América Latina, 1982, 2° ed. 1985, 178 pp. 16 Five studies on the situation of women in Latin America, 1983, 2nd. ed. 1984, 188 pp. 17 Cuentas nacionales y producto material en América Latina, 1982, 129 pp. 18 El financiamiento de las exportaciones en América Latina, 1983, 212 pp. 19 Medición del empleo y de los ingresos rurales, 1982, T ed. 1983, 173 pp. 19 Measurement of employment and income in rural areas, 1983, 184 pp. 2 0 Efectos macroeconómicos de cambios en las barreras al comercio y ai movimiento de capitales:
un modelo de simulación, 1982, 68 pp. 21 La empresa pública en la economía: la experiencia argentina, 1982, 2° ed. 1985, 134 pp. 22 Las empresas transnacionales en la economía de Chile, 1974-1980, 1983, 178 pp. 23 La gestión y la informática en las empresas ferroviarias de América Latina y España, 1983,
195 pp. 24 Establecimiento de empresas de reparación y mantenimiento de contenedores en América
Latina y el Caribe, 1983, 314 pp. 24 Establishing container repair and maintenance enterprises in Latin America and the
Caribbean. 1983, 236 pp. 2 5 Ague potable y saneamiento ambiental en América Latina. 1981-1990/Drinking water supply
and sanitation in Latín America, (bilingüe), 1983, 140 pp. 26 Los bancos transnacionales, ei estado y el endeudamiento externo en Bolivia. 1983, 282 pp. 27 Política económica y procesos de desarrollo. La experiencia argentina entre 1976 y 1981.
1983, 157 pp. 28 Estilos de desarrollo, energía y medio ambiente: un estudio de caso exploratorio. 1983,129 pp. 29 Empresas transnacionales en la industria de alimentos. El caso argentino: cereales y carne.
1983, 93 pp. 30 Industrialización en Centroamérica. 1960-1980. y^iZ, y^i W-31 Dos estudios sobre empresas transnacionales en Brasil. 1983, 141 pp.

32 La crisis económica internacional y su repercusión en América Latina. 1983, 81 pp. 33 La agricultura campesina en sus relaciones con la industria. 1984, 120 pp. 34 Cooperación económica entre Brasil y el Grupo Andino: el caso de los minerales y metales no
ferrosos. 1983, 148 pp. 35 La agricultura campesina y el mercado de alimentos: la dependencia externa y sus efectos en
una economía abierta. 1984, 201 pp. 36 El capital extranjero en la economía peruana. 1984, 178 pp. 37 Dos estudios sobre política arancelaria. 1984, 98 pp. 38 Estabilización y liberalización económica en el Cono Sur. 1984, 193 pp. 39 La agricultura campesina y el mercado de alimentos: el caso de Haiti y el de la República
Dominicana. 1984, 255 pp. 40 La industria siderúrgica latinoamericana: tendencias y potencia! 1984, 280 pp. 41 La presencia de las empresas transnacionales en la economía ecuatoriana, 1984, 77 pp. 42 Precios, salarios y empleo en la Argentina: estadísticas económicas de corto plazo. 1984,
378 pp. 43 El desarrollo de la seguridad social en América Latina, 1985, 348 pp. 44 Market structure, firm size and Brazilian exports, 1985, 104 pp. 45 La planificación del transporte en países de América Latina, 1985, 247 pp. 46 La crisis en América Latina: su evaluación y perspectivas. 1985, 119 pp. 47 La juventud en América Latina y el Caribe, 1985, 181 pp. 48 Desarrollo de los recursos mineros de América Latina. 1985, 145 pp. 48 Development of the mining resources of Latin America, 1989, 160 pp. 49 Las relaciones económicas internacionales de América Latina y la cooperación regional 1985,
224 pp. 50 América Latina y la economía mundial del algodón. 1985, 122 pp. 51 Comercio y cooperación entre países de América Latina y países miembros del CAME. 1985,
90 pp. 52 Trade relations between Brazil and the United States. 1985, 148 pp. 53 Los recursos hidricos de América Latina y el Caribe y su aprovechamiento. 1985, 138 pp. 53 The water resources of Latín America and the Caribbean and their utilization, 1985,135 pp. 54 La pobreza en América Latina: dimensiones y políticas. 1985, 155 pp. 55 Políticas de promoción de exportaciones en algunos paises de América Latina. 1985, 207 pp. 56 Las empresas transnacionales en la Argentina, 1986, 222 pp. 57 El desarrollo frutícoía y forestal en Chile y sus derivaciones sociales. 1986, 227 pp. 58 El cultivo deí algodón y la soya en eí Paraguay y sus derivaciones sociales, 1986, 141 pp. 59 Expansión del cultivo de la caña de azúcar y de la ganadería en el nordeste deí Brasil: un examen
deí papel de la política pública y de sus derivaciones económicas y sociales, 1986, 164 pp. 60 Las empresas transnacionales en ei desarrollo colombiano, 1986, 212 pp. 61 Las empresas transnacionales en ía economía deí Paraguay, 1987, 115 pp. 62 Problemas de ía industria latinoamericana en la fase crítica, 1986, 1 13 pp. 63 Relaciones económicas internacionales y cooperación regional de América Latina y el Caribe,
1987, 272 pp. 63 International economic relations and regional co-operation in Latin America and the
Caribbean, 1987, 267 pp. 64 Tres ensayos sobre inflación y políticas de estabilización. 1986, 201 pp. 65 La industria farmacéutica y farmoquimica: desarrollo histórico y posibilidades futuras.
Argentina. Brasil y México. 1987, 177 pp. 66 Dos estudios sobre América Latina y eí Caribe y ía economía internacional 1987, 125 pp. 67 Reestructuración de la industria automotriz mundial y perspectivas para América Latina. 1987,
232 pp. 68 Cooperación latinoamericana en servicios: antecedentes y perspectivas, 1988, 155 pp. 69 Desarrollo y transformación: estrategia para superar ía pobreza, 1988, 114 pp. 69 Development and change: strategies for vanquishing poverty, 1988, 114 pp.

70 La evolución económica de! Japón y su impacto en América Latina, 1988, 88 pp. 71 La gestión de ios recursos hidricos en América Latina y el Caribe, 1989, 256 pp. 72 La evolución del problema de la deuda externa en América Latina y el Caribe, 1988, 77 pp. 72 The evolution of the externa! debt problem in Latin America and the Caribbean. 1988,69 pp. 73 Agricultura, comercio exterior y cooperación internacional, 1988, 83 pp. 73 Agriculture, external trade and international co-operation, 1989, 79 pp. 74 Reestructuración industrial y cambio tecnológico: consecuencias para América Latina, 1989,
105 pp. 75 El medio ambiente como factor de desarrollo, 1989, 123 pp. 76 El comportamiento de los bancos transnacionales y ta crisis internacional de endeudamiento.
1989, 214 pp. 76 Transnational bank behaviour and the international debt crisis, 1989, 198 pp.
Serie INFOPLAN: Temas Especiales del Desarrollo
1 Resúmenes de documentos sobre deuda externa, 1986, 324 pp. 2 Resúmenes de documentos sobre cooperación entre países en desarrollo, 1986, 189 pp. 3 Resúmenes de documentos sobre recursos hidricos, 1987, 290 pp. 4 Resúmenes de documentos sobre planificación y medio ambiente, 1987, 111 pp. 5 Resúmenes de documentos sobre integración económica en América Latina y el Caribe, 1987,
273 pp. 6 Resúmenes de documentos sobre cooperación entre paises en desarrollo, H parte, 1988,
146 pp.

J* J > - - l l v / V»- J-L-I M ^ L > UI- • FWI -WL Y J.J>!L OUCJL > JU JJ—II OÍ-.
to i i invci^Biaiat t i
HOW TO OBTAIN UNITED NATIONS PUBLICATIONS
United Nations publications may be obtained from bookstores and distributors throughout the world. Consult your bookstore or write to: United Nations, Sales Section, New York or Geneva.
COMMENT SE PROCURER LES PUBLICATIONS DES NATIONS UNIES
Les publications des Nations Unies sont en vente dans les librairies et les agentes dépositaires du monde entier. Inl'ormez-vous auprés de votre libraire ou adrcssez-vous á : Nations Unies, Section des ventes. New York ou Geneve.
KAK nO;iy<IHTI> HSAAHH}! O P r A H H 3 A U H H OB1>EZIHHEHHhIX HAUHH
MsflaHHH OpraHH3auHH OS-i>eAHHeHHi>ix HauHA momcho KynHTb b KHHxtHbix Hara-3HHax H areHTCTaax so BCtx paftoHax MHpa. HaeoaHTe cnpasKH 06 HsaaHHRx B BauieM KHHXHOM MarasHHc MnH nHujHTe no a^pecy: OpraHHsauHH 0 6 i > e a H H e H B U x HaUHñ. CeKUHH no npoAawe HaAaHHA. Hbio-nopK unit >KeHeBa.
COMO CONSEGUIR PUBLICACIONES DE LAS NACIONES UNIDAS
Las publicaciones de las Naciones Unidas están en venta en librerías y casas distribuidoras en todas partes del mundo. Consulte a su librero o diríjase a: Naciones Unidas, Sección de Ventas, Nueva York o Ginebra.
Publications of the Economic Commission for Latin America and the Caribbean (ECLAC) and those of the Latin American and the Caribbean Institute for Economic and Social Planning (ILPES) can be ordered from your local distributor or directly through:
United Nations Publications United Nations Publications Sales Section, — DC-2-866 Sales Section New York, NY, 10017 Palais des Nations USA 1211 Geneve 10. Switzerland
Distribution Unit CEPAL — Casilla 179-D Santiago, Chile


