The Waiting List Initiative - Audit
53
Comptroller and Auditor General Report on Value for Money Examination Department of Health and Children The Waiting List Initiative August 2003
Transcript of The Waiting List Initiative - Audit

Comptroller and Auditor General Report on Value for Money Examination
Department of Health and Children
The Waiting List Initiative
August 2003

Government of Ireland 2003 This report was prepared on the basis of information, documentation and explanations
obtained from the public bodies referred to in the report. The draft report was sent to the Department of Health and Children, the Eastern Regional Health Authority, the Midland Health Board, the Mid-Western Health Board, the North Eastern Health Board, the North Western Health Board, the South Eastern Health Board, the Southern Health Board and the Western Health Board and comments were requested. Where appropriate, the comments received were incorporated in the final version of the report.

Report of the Comptroller and Auditor General The Waiting List Initiative I have, in accordance with the provisions of Section 9 of the Comptroller and Auditor General (Amendment) Act, 1993, carried out a value for money examination of the Waiting List Initiative between 1998 and 2002. I hereby submit my report on the above examination for presentation to Dáil Éireann pursuant to Section 11 of the said Act.
John Purcell Comptroller and Auditor General 14 August 2003


Table of Contents
Page Glossary 6 Summary of Findings 8 The Waiting List Initiative 1 Introduction 13 2 How Waiting List Initiative funding was used 17 3 Impact of the Waiting List Initiative 29 4 Monitoring and managing waiting time 39 Appendices A Summary of the recommendations of the Review Group on the Waiting List Initiative, July 1998 50 B Allocations of Waiting List Initiative Funding to Service Providers,
1998 to 2001 52 C Target Group as a percentage of total waiting, by hospital, end
December 2002 53

Glossary
Acute hospital A hospital providing medical and surgical treatment of relatively short duration
Day case admission A person admitted to hospital for elective treatment who is discharged on the same day
Elective treatment admission A planned or non-emergency admission of a patient on a day case or inpatient basis
HIPE (Hospital Inpatient Enquiry) A health information system that collates data about each inpatient and day case hospital discharge, including diagnostic and treatment information
Inpatient A patient admitted to hospital for elective or emergency treatment, who stays for at least one night
Outpatient A patient who attends a hospital clinic for treatment or for a consultation with a specialist and who is not admitted to hospital
Procedure Operation or treatment carried out on a patient by medical staff
Treatment specialty The treatment area under which the patient is categorised (e.g. cardiac surgery, orthopaedics). Each consultant generally specialises in one of these treatment specialties.
Public voluntary hospitals Publicly funded hospitals not under direct control of health boards
Abbreviations
CSO Central Statistics Office
ERHA Eastern Regional Health Authority
GP General Practitioner
WLI The Waiting List Initiative

Summary of Findings
Summary of Findings
The Department of Health and Children introduced the Waiting List Initiative (WLI) in 1993 to deal with a persistent waiting list problem in the acute hospitals. This problem involved significant numbers of public patients waiting long periods for elective (non-emergency) hospital treatment. In setting up the Initiative, the Department set targets for the maximum length of time patients should have to wait for treatment in specialties with the longest waiting lists. The targets were that adults would not have to wait longer than 12 months and children would not have to wait longer than 6 months.
WLI funding which was provided in addition to normal hospital funding was intended to
n incentivise hospitals and health boards to perform extra elective procedures
n be targeted specifically at patients waiting longer than target times in the selected specialties
n be ring-fenced i.e. kept separate from other funding of elective procedures.
Although initially intended to be a short-term initiative, the WLI has been funded each year since 1993 at a total cost of €246 million. Over two-thirds of this funding (€172m) was spent in the five-year period focused on by this examination, 1998 to 2002. The examination considered
n how the WLI funding was used
n what the impact of the WLI has been on the target group of long waiting patients
n how the waiting time and waiting lists are monitored and managed.
Use of the Funds
The funding provided to individual hospitals under the WLI was used in a wide variety of ways. This included increased use of hospitals’ own capacity to treat patients or using other hospitals’ facilities to perform extra procedures.
Many hospitals used part of the available WLI funds to pay for extra waiting list administration and bed management staff. In hospitals visited in the course of this examination, initiatives in these areas appear to have resulted in more active management of waiting lists and waiting times, and better hospital bed utilisation.
WLI funding has been used in many hospitals to fund temporary consultant posts on an ongoing basis. Many of these posts are now being made permanent. This has resulted in a situation where, by 2002, the application of up to half of WLI funds to staffing has reduced the level of flexibility available to the Department to target the WLI funds to long waiting patients in other hospitals.
One factor not directly taken into account in allocating the available WLI funding to hospitals was the number of long waiting patients in each hospital. In fact, those health boards and hospitals that have performed well in reducing their numbers of long waiting patients, have tended to attract increasing shares of funding.

Summary of Findings < 9
Impact on Patient Treatment
Between the start of 1998 and the end of 2002, the reported number of patients waiting longer than the target maximum waiting times for elective treatment decreased by 39% — from just over 14,100 to 8,700.
The reduction in the target group in the period 1998 to 2002 did not affect all target specialties equally.
n The target groups for the ear, nose and throat, vascular, orthopaedic and, in particular, cardiac surgery specialties declined significantly in this period.
n The number waiting in the ophthalmology and urology specialties varied but were about the same at the start and end of this period.
n The plastic surgery and general surgery target groups increased by a quarter during this period.
The extent to which WLI funding succeeded in achieving extra elective activity cannot be reliably established. Although the extra funding under the Initiative was intended to be ring-fenced from core funding, in practice, the activity it generated cannot, in most cases, be distinguished separately from core funded elective activity. Consequently, while the WLI aimed to result in additional elective activity, it is not possible to ascertain if, or to what extent, this was achieved, or if this activity benefited long waiting patients as intended.
Prioritisation of the Target Group
Although it was planned that WLI funding would result in the provision of treatment for long waiting patients, the Department has not specified that they should be given priority in receiving treatment paid for under the Initiative. While the Department does not wish to interfere with clinical independence, in order to ensure that the funding is applied for the purposes intended, there should be, at a minimum, formal shared criteria and standards adopted for the prioritisation of patients for elective treatment, as recommended by a 1998 Review Group of the WLI.
Between 1998 and the middle of 2001, the number of patients in the target group moved broadly in line with the number of other patients waiting for elective treatment, which suggests that there was little prioritisation of target group patients over that period. It was only from mid-2001 that the numbers in the target group began to decline relative to those of other patients. The relative prioritisation of target group patients has continued, in part, as a consequence of the introduction in mid-2002 of the National Treatment Purchase Fund which also targeted long waiting patients.
Current Status of the Target Group
The problem of long waiting is highly concentrated. At the end of 2002, over 70% of long waiting patients were waiting for treatment in hospitals in the Eastern region. While some progress was made in reducing the scale of the problem in the region during the period 1998-2000, progress was significantly slower than in most other regions.
Analysis of data collected by the ERHA from hospitals in the region indicates that, at the end of 2002, the average waiting time of over 15 months for elective inpatient treatment of adults was significantly greater than the target maximum waiting time of 12 months. Similarly, the combined

10 n The Waiting List Initiative
average waiting time for both inpatient and day case treatment for children was 8.9 months compared to the target maximum waiting time of 6 months.
Even within the Eastern region, the scale of the problem in individual hospitals varies greatly.
n St James’s Hospital had almost eliminated waiting longer than the target maximum waiting times for elective treatment at the end of 2002.
n Four Eastern region hospitals (Beaumont, Mater, St Vincent’s and Tallaght) together accounted for half of the national target group at the end of 2002.
n More than 50% of all patients reported as waiting for elective treatment at the end of 2002 in Tallaght Hospital, Temple Street Children’s Hospital and Our Lady’s Hospital for Sick Children in Crumlin were waiting longer than the target maximum times.
Resolving the waiting problem in hospitals such as these will involve a co-ordinated response between the initiatives that now focus on long waiting patients, the WLI and the National Treatment Purchase Fund.
Measuring and Managing Waiting Time
Improvements are required in the performance measurement and management systems in relation to waiting lists and waiting times.
n The Department reports numbers of patients waiting, while measures of average waiting time and maximum waiting time would be more relevant.
n Greater accuracy and consistency between hospitals in reporting waiting lists and waiting times is required.
n The Department should begin to measure and monitor the time a patient waits for an outpatient appointment.
n Existing waiting time targets set by the Department are largely aspirational. In managing waiting time under an initiative like the WLI, milestones and deadlines should be set and periodically reviewed if they are to function as clear and achieveable performance targets.
n Waiting time for public patients in public hospitals should be benchmarked against waiting time for private patients in those hospitals.
n The Department’s public reporting of data about waiting for elective treatment could be significantly improved to assist GPs in making choices about referrals for consultations.

The Waiting List Initiative


1 Introduction
1.1 The Waiting List Initiative (WLI) was introduced in 1993, initially as a short-term measure to tackle the problem of significant numbers of public patients waiting excessively long periods for elective (i.e. non-emergency) hospital procedures.
1.2 The Department of Health and Children (the Department) allocated funding under the WLI to individual health boards and voluntary hospitals to pay for procedures for long-waiting patients on the waiting lists for a number of selected treatment specialties. The money provided under the Initiative was additional to the normal funding for acute hospital services and the procedures funded were to be additional to procedures performed using normal funds.
1.3 The Initiative has been renewed every year since 1993. Total expenditure from 1993 to 2002 was €246 million.
Targets for Waiting Time
1.4 Prior to the WLI, there were no national targets in relation to waiting time for elective treatment. Under the Initiative, specific targets were set. The objective was that adults would not have to wait longer than 12 months for treatment in certain specialties and that children would not have to wait longer than 6 months.
1.5 Surgical procedures were specifically targeted under the WLI (see Figure 1.1). They were selected because they had the largest reported numbers of patients waiting for treatment at the time the Initiative was launched. The target specialties have not changed since January 1994.
Figure 1.1 Targeting of treatment specialties under the Waiting List Initiative
Treatment specialties targeted under the WLI
Cardiac surgery Ear, nose and throat (ENT) General surgery Gynaecology Orthopaedics
Ophthalmology Plastic surgery Urology Vascular surgery
Treatment specialties not targeted under the WLI
Cardiology Dental Dermatology Endocrine procedures Endocrinology Gastro-enterology Genito-urinary Gerontology Infectious diseases Haematology Maxillo-facial General medicine
Metabolic Nephrology Neurology Neurosurgery Oncology Radiotherapy Rehabilitation Respiratory Rheumatology Paediatrics Pain management Psychiatry
Source: Department of Health and Children

14 n The Waiting List Initiative
1.6 When the WLI was launched, the perception was that there was not a significant problem of long waiting for other specialties and they were not included under the Initiative. Consequently, the target maximum waiting times specified for the WLI specialties did not apply to patients waiting for treatment in other specialties.
Trend in Numbers Waiting for Treatment
1.7 As part of the WLI, the Department began to compile national statistics about the number of patients waiting three months or more for treatment, from data supplied by individual hospitals. Figure 1.2 shows the total number of patients reported as waiting and those waiting longer than the target times in the target specialties (the target group) each quarter from March 1993 to December 2002.
Figure 1.2 Reported number of patients waiting for elective treatment, quarterly, March 1993 to December 2002
0
5,000
10,000
15,000
20,000
25,000
30,000
35,000
40,000
Dec-92
Dec-93
Dec-94
Dec-95
Dec-96
Dec-97
Dec-98
Dec-99
Dec-00
Dec-01
Dec-02
Number of patients ('000)
WLI target group
Overall number waiting
1993 1994 1995 1996 1997 1998 1999 2000 2001 2002
40
30
20
10
0
Source: Analysis by the Office of the Comptroller and Auditor General
1.8 A significant proportion of the dramatic fall in the reported number of patients waiting in 1993 was due to the results of extensive validation exercises carried out by individual service providers at the time. From the end of 1994, there was an upward trend in the reported number of patients waiting, despite repeated funding under the WLI. This trend continued into 1999 when the overall total number waiting peaked at around 37,000. The number reported dipped to 26,000 by the end of 2001 and rose again to 29,000 by 31 December 2002.
1.9 For most of the period 1994 to 2002, the numbers of long waiting patients moved broadly in line with the overall numbers waiting.

Introduction < 15
Developments since the Introduction of the Waiting List Initiative
1.10 As a result of the upward trend in the numbers waiting, the Minister for Health and Children established a Review Group in April 1998 to examine the operation of the WLI and to make recommendations on how best to maximise its effectiveness.
1.11 The Review Group reported in July 1998, and presented a set of immediate, medium-term and long-term recommendations which they believed were required if waiting lists and waiting times were to be reduced substantially.1 Some of the recommendations related specifically to the WLI; others related to factors in the wider health system that contributed to the waiting list problem. The Group proposed that all the recommendations should be implemented in the period 1998-2001.
1.12 In guidelines relating to the WLI issued in 1999 and 2000, the Department stated that the objectives of the Initiative were to
¡ achieve a significant reduction in the number of public patients awaiting elective procedures
¡ increase the numbers of persons receiving elective procedures (inpatient and day cases)
¡ reduce the maximum times patients are waiting for elective procedures in target specialties to 12 months for adults and 6 months for children
¡ improve the management of elective procedures, waiting lists and waiting times.
However, in sending the 2000 guidelines to the Chief Executive Officers of health boards and hospitals, the Department pointed out in a covering letter that the overall objective of the Initiative was to ensure that the target maximum waiting times were not exceeded.
1.13 A number of proposals for the acute hospital service, which may potentially impact on the priority for the treatment of long waiting patients, were announced in the health strategy document, Quality and Fairness A Health System for You, published in November 2001.
¡ The capacity of the acute hospital service is to be expanded through the provision of 3,000 extra beds designated for public patients by 2011. The planned extra beds represent a 25% increase on the 2000 acute hospital bed capacity level.
¡ The National Treatment Purchase Fund was established in 2002 to pay for the treatment, either in hospitals in Ireland or abroad, of public patients who had been waiting longer than maximum target waiting times. The Department stated that 1,920 patients were treated using resources provided by the Fund from its inception in July 2002 to the end of that year.
¡ A National Hospitals Office will carry out functions relating to the coordination of actions to reduce waiting lists and waiting times.
1 The recommendations of the Review Group are summarised in Appendix A.

16 n The Waiting List Initiative
Scope and Objectives of the Examination
1.14 In order to eliminate waiting beyond the target times, it was intended that the WLI funding would be managed in a particular way. It was planned to be
¡ ring-fenced i.e. kept separate from other funding of elective procedures
¡ targeted specifically at people waiting longer than target times in the selected treatment specialties which had the longest waiting lists
¡ performance-related i.e. it was designed to incentivise the performance of extra procedures.
1.15 This examination was carried out to establish the extent to which the WLI was successful in achieving its objectives. The specific questions addressed include
¡ How was the WLI funding used?
¡ What has been the impact of the WLI on the target group of long waiting patients?
¡ How is the problem of long waiting time for elective patients being monitored and managed?
1.16 The examination focused mainly on the period 1998 to 2002, when a total of €172 million was spent under the Initiative. This is also the period during which the Review Group’s recommendations were expected to change the operation and impact of the WLI.
1.17 It is too early to assess the effect of the acute hospital service proposals presented in the November 2001 health strategy document.
Examination Methodology
1.18 The examination was carried out by staff of the Office of the Comptroller and Auditor General. Advice on the development of examination issues and analytic approaches was provided to the examination team on a consultancy basis by a member of the School of Management, Trinity College, Dublin.
1.19 Work on the examination included analysis of statistical data compiled by the Department about the number of patients on waiting lists. In addition, other departmental information about the allocation and monitoring of WLI funding was examined. Information was also gathered from the Eastern Regional Health Authority (ERHA) and all health boards. More detailed information about the use of WLI funding and the management of waiting lists was gathered during visits to St Vincent’s Hospital (Elm Park) and St James’s Hospital in Dublin, Cork University Hospital and Tullamore General Hospital.
Structure of the Report
1.20 Chapter 2 examines how WLI funding was allocated and spent. Chapter 3 looks at the extent to which the target group for the WLI – patients waiting longer than the target maximum times – have benefited from the Initiative. Chapter 4 considers how performance in relation to the measurement and monitoring of waiting time could be improved.

2 How Waiting List Initiative Funding Was Used
2.1 The WLI is a hospital-focused initiative. In the main, it aims to provide extra resources to individual hospitals, allowing them to increase the level of elective procedures above that achievable through their normal, core funding. This, in turn, is intended to reduce the number of long-waiting patients.
2.2 This chapter examines how the funding provided under the WLI was spent. In particular, it examines
¡ the basis for allocation of WLI funding to acute hospital service providers
¡ the types of strategies and activities service providers undertook using the WLI funding they received
¡ the extent to which the funding succeeded in generating additional elective treatment.
Allocation of Funding to Service Providers
2.3 Figure 2.1 shows the levels of funding provided under the WLI each year from 1993 to 2002. Spending in the period 1994 to 1998 averaged around €12.6 million a year. The annual funding level increased significantly between 1998 and 2000 and has remained constant at around €44 million a year since then.
2.4 Between 1993 and 1998, the Department allocated WLI funding around July each year. The 1998 Review Group report recommended dividing the available annual funding under the Initiative into two phases, with an early phase allowing service providers to plan activities better to address the problem of long waiting. It was also recommended that the (smaller) second phase of funding would be awarded to the service providers with the best performance record, so as to increase the positive incentive effect of the funding. As a result, almost three-quarters of the WLI funding in recent years was allocated at the start of each year, along with general acute hospital funding allocations. The remaining funding is awarded mid-year.
Figure 2.1 Expenditure under the Waiting List Initiative, 1993 to 2002
0
10
20
30
40
50
1993 1994 1995 1996 1997 1998 1999 2000 2001 2002
Funding provided
€m
Source: Department of Health and Children

18 n The Waiting List Initiative
2.5 Funding provided under the WLI is channelled down through the normal system for funding acute hospitals. As a result, the process of decision-making about how WLI funding is used is effectively shared between various levels of health service administration.
¡ The Department allocates WLI funding to the Eastern Regional Health Authority (ERHA) and to the health boards and is responsible for overseeing the overall impact of this funding.
¡ The ERHA 2 and the health boards allocate the WLI funding available to them to individual hospitals, collate information about the use of the funding and about waiting times and report back to the Department.
¡ Management in hospitals identify strategies and activities to tackle the long waiting problem in the context of overall management of admissions and waiting lists.
¡ Ultimately, consultants select the patients who are to receive treatment using the resources provided with WLI funding.
2.6 As with other areas of the health services, this layered decision-making process creates a management challenge in ensuring that scheme objectives are aligned across all relevant levels of administrative and clinical management, and that there is accountability for performance.
2.7 Figure 2.2 sets out the total allocations of WLI funding to individual service providers over the period 1998 to 2002, and shows the percentage of total funding received by each service provider. Allocations on a year-by-year basis are shown in Appendix B.
2.8 Half of the WLI funding in the period 1998 to 2002 went to service providers in the Eastern region. This was mainly supplied to voluntary hospitals, which provide most of the acute hospital services in the region.
Allocation Criteria
2.9 In allocating WLI funding, service providers are required by the Department or by the ERHA (as appropriate) to set out their proposals for how they would use WLI funding. The proposals typically specify the expected number of additional elective procedures to be carried out. In certain cases, the types of activities proposed to achieve these extra procedures are also outlined. In some cases (especially where procedures are to be outsourced to other hospitals), the expected unit cost of the additional procedures may be specified in the proposals. Many of the proposals submitted are based on the continuation of activities and strategies previously funded under the WLI, with occasional proposals for new initiatives.
2.10 In response to the proposals submitted, the Department/ERHA notifies the service providers of the amount of funding that will be provided, and approves (explicitly or implicitly) the elements of the proposals that are acceptable. The related projected numbers of procedures to be carried out are regarded as performance targets to be achieved.
2 The ERHA has been involved in the allocation of funding to hospitals in the Eastern region since its
establishment in 2000.

How Waiting List Initiative Funding Was Used <19
Figure 2.2 Allocation of WLI funding to service providers, 1998 to 2002
Service provider/region €’000 % of total
Voluntary hospitals in Eastern region St James’s Hospital 19,444 11% Mater Misericordiae Hospital 14,576 9% Beaumont Hospital 12,764 8% Our Lady’s Hospital, Crumlin 10,079 6% St Vincent’s Hospital, Elm Park 9,219 5% Tallaght Hospital 5,673 3% Royal Victoria Eye & Ear Hospital 4,138 2% St Mary’s Hospital, Cappagh 3,954 2% Temple Street Children’s Hospital 717 * Other 831 1%
External service providers Mater Private Hospital 3,486 2% Blackrock Clinic 1,107 1% Other 28 *
Eastern region 86,016 50%
Midland Health Board 9,643 6%
Midland region 9,643 6%
Mid-Western Health Board 10,019 6% St. John's Hospital, Limerick 1,104 *
Mid Western region 11,123 6%
North Eastern Health Board 8,584 5%
North Eastern region 8,584 5%
North Western Health Board 8,808 5% External service providers 1,346 1%
North Western region 10,154 6%
South Eastern Health Board 13,153 8%
South Eastern region 13,153 8%
Southern Health Board 13,103 8% Mercy Hospital, Cork 3,754 1% South Infirmary/Victoria Hospital 2,250 2%
Southern region 19,107 11%
Western Health Board 14,248 8% Portiuncula Hospital, Ballinasloe 98 *
Western region 14,346 8%
Totals 172,126 100%
Source: Analysis by the Office of the Comptroller and Auditor General Note: *indicates percentage is less than 0.5%

20 n The Waiting List Initiative
2.11 The Department has stated that, in general, it took into account the following factors in the allocation of WLI resources in the period 1998 to 2002
¡ the population of the health board area
¡ the reported total number of patients on the waiting list in each hospital
¡ the capacity of each hospital to increase the elective procedures activity level, internally or through purchasing services from external sources
¡ past performance of the hospital in reducing its waiting list
¡ temporary consultant posts in the hospital funded under the WLI.
2.12 The ERHA has stated that it applied criteria similar to those used by the Department in deciding funding allocations to the hospitals in its region.
2.13 In general, the specific reasons for allocating amounts of funding to individual service providers are not formally recorded at Departmental or ERHA level. Consequently, it is difficult to discern the precise factors which were influential in the allocation decisions and the weighting given to each.
Allocations and Numbers Waiting in the Target Group
2.14 Although the primary objective of the WLI was the elimination of the problem of long waiting patients, whether through directly delivered or outsourced treatment, the number of those patients has not been taken directly into account in making funding allocations. Analysis of the amounts allocated to regions and to individual hospitals shows that, in practice, there was no direct relationship between funding and the number of patients in the target group.
¡ The proportionate share of WLI funding allocated to the Eastern region fell by 5% in the period 1998 to 2002. During the same period, this region’s share of the waiting list target group increased from 49% to 72%.
¡ By contrast, while the share of the target group of all other regions combined decreased by 23%, their share of the WLI funding increased by 5%.
2.15 In the Dublin area this divergence between funding and numbers waiting in the target group is also evident when major hospitals are compared.
¡ St James’s Hospital reported a reduction of around 90% in the number of long waiting patients between the end of 1997 and the end of 2001. As a result, the number of long waiting patients reported by the Hospital at the end of 2001 represented only 1% of the national target group. By contrast, the Hospital received 13.5% of the total national WLI funding in 2002 — up from 11.6% of the national total in 1998.
¡ The Mater Hospital reported the biggest target group (over 1,600 long waiting patients) at the end of 2001 — up 4.5% from the end of 1997. Despite this, its share of national WLI funding fell from 15.5% of the total in 1998 to 9.5% of the total in 2002.
¡ St Vincent’s Hospital reported an 82% increase in its target group (to a total of over 1,300 long waiting patients by end 2001). Despite this increase, the share of funding provided to the hospital decreased from 7.6% of the total in 1998 to 5.7% of the total in 2002.

How Waiting List Initiative Funding Was Used < 21
¡ Although it reported over 1,100 patients waiting longer than the target maximum waiting times at the end of 2001, an increase of over 60% on the end-1997 figure, Tallaght Hospital received no WLI funding in 2002. The ERHA have stated that funding was not allocated to Tallaght because the hospital reported that it would not have sufficient capacity to carry out WLI procedures during the year, due to pressures on existing services. The Hospital did not achieve the level of extra activity it had projected with WLI funding in 2001.
2.16 A fixed policy of allocating funding solely or mainly on the basis of the reported number of long waiting patients could result in funding being provided to hospitals that are unable, due to capacity or other constraints, to increase the level of elective activity to provide treatment for long waiting patients. For example, the comparatively high levels of utilisation of available inpatient beds in the larger Eastern hospitals would have affected the ability of these hospitals to use WLI funding in-house.
2.17 Furthermore, there is the risk — recognised in the 1998 Review Group report — that allocating funding in line with the reported numbers of long waiting patients could be a negative incentive, and potentially encourage service providers to maintain waiting lists at a particular level in order to secure continued funding. In making funding allocation decisions, the Department and the ERHA appear to have avoided that type of negative incentive.
2.18 In order to provide a positive incentive to service providers to reduce the number of long waiters, the Review Group recommended that good performers in previous periods should receive priority in the allocation of WLI funding. The current pattern of allocation of funding seems to go beyond that, with a significant amount of WLI funding being directed on a more or less permanent basis to some service providers that have consistently succeeded in reducing their reported number of long waiting patients and maintaining this reduction. As a result, it appears that those service providers are being rewarded for previous success, rather than being incentivised to achieve further success. Correspondingly, this reduces the potential to use WLI funding to provide a positive incentive to those that still have a long waiting problem.
2.19 Reducing the funding allocated to some service providers because they did not meet previous activity targets or because they do not have sufficient capacity to carry out extra procedures puts the long waiting patients concerned at a disadvantage. As a result, approaches other than the WLI will be needed to deal with the waiting time problem in those hospitals. In this respect, the National Treatment Purchase Fund, which funds long waiting patients on an individual basis, potentially complements the WLI in meeting the needs of the patients affected.
WLI Activities
2.20 Individual service providers report that they used the funding they received under the WLI in a wide range of ways. A summary of the main kinds of activities undertaken in using the available WLI funding in selected hospitals in recent years is shown in Figure 2.3.
2.21 The main strategies and activities in using WLI funding include
¡ Waiting list management
WLI funding was used in all the hospitals visited to hire additional staff to administer waiting lists, to centralise (partially or fully) waiting list management, to develop waiting list recording systems, and to carry out waiting list validation procedures to ensure that the waiting lists were accurate, comprehensive and up-to-date.

22 n The Waiting List Initiative
¡ Hospital bed management
The hospitals visited used WLI funding to employ bed managers, combined in some cases with a waiting list co-ordination function. Typically, the bed managers have senior nursing experience, and have responsibility to manage the allocation of hospital beds between competing demands, in particular between emergency and elective admissions. They are also responsible for developing and managing patient admission and discharge initiatives. These initiatives include advance patient discharge planning and management of the discharge of patients who no longer require acute care but for whom rehabilitation, long-term care beds or adequate home support are not readily available. In some cases, they are also involved in ensuring that long waiting patients are actively considered when appointments are being made for elective procedures and in the selection of patients for out-sourced procedures funded under the WLI.
Figure 2.3 Main types of activities funded under the Waiting List Initiative in selected hospitals, 1998 to 2002
St James’s Hospital
St Vincent’s Hospital, Elm Park
Cork University Hospital
Tullamore General Hospital
Amount of WLI funding received €19.4m €9.2m €9.7m €8.5m
Activities funded through WLI
Appointment of a Waiting List Coordinator/Committee P P P P Employment of staff to manage and validate elective waiting lists P P P P Bed management initiatives (e.g. later admission, earlier discharge, patient selection for treatment)
P P P P
Extra weekend/evening theatre sessions P P
Employment of temporary consultant/medical staff P P P P Employment of temporary nursing staff P P P P Dedicated in-house facilities (theatres/wards) to treat elective patients
P P P
Use of treatment facilities (theatres/beds) in other hospitals P P P
Outsourcing of elective procedures in other hospitals P P P P
Outpatient monitoring, screening, extra clinics P P P P
Source: Analysis by the Office of the Comptroller and Auditor General

How Waiting List Initiative Funding Was Used <23
¡ Increased output from existing capacity
Some hospitals tried to achieve higher levels of output from the existing capacity of staff, beds and operating theatres. Strategies adopted included weekend or late-night working on overtime, and the keeping open of wards that might otherwise be closed for periods to achieve expenditure savings. Some hospitals increased their output of elective procedures by using WLI funds to pay for overnight accommodation for patients outside the hospital.
¡ Expansion of in-house hospital capacity
Some of the hospitals applied the available funding to increase their existing capacity. This included, in particular, the recruitment of extra medical, nursing and associated administrative and support staff on temporary contracts, and equipping of theatre or other treatment facilities in a few cases.
¡ Purchasing external capacity and procedures
Some hospitals used WLI funding to outsource treatments for some of their own patients in other hospitals, within the State or abroad. Hospitals also hired treatment facilities, theatres and wards in other hospitals and used their own medical and nursing staff to carry out procedures in the hired facilities.
Activity Costing
2.22 There was no routine comprehensive reporting of the cost of WLI activities in any of the hospitals visited. While there was separate accounting for some of the WLI activities, the cost of activities was generally included in existing cost centres, and could not be distinguished from core-funded activities.
Outsourcing of Treatment
2.23 In the hospitals visited, it was possible to identify the extent to which expenditure on externally commissioned procedures was funded from WLI resources.
¡ In St Vincent’s, Cork University Hospital and Tullamore General Hospital, the procedures invoiced by external service providers were carried out at a cost in the region of €1,000 to €3,000 per patient.
¡ St James’s Hospital outsourced some relatively serious and complex cardiac surgery procedures for elective patients. The hospital stated that the cost of these outsourced procedures was around the estimated average unit cost of carrying out similar procedures in-house.
2.24 The National Treatment Purchase Fund operates by commissioning mainly private sector hospitals to carry out procedures on long waiting patients selected from the lists in individual public sector hospitals. There is therefore a risk that, in outsourcing treatment, individual public sector hospitals may end up competing with the Fund. The Department should bear this risk in mind in coordinating the operation of the two schemes. It could, for example, consider restricting the use of WLI funding to pay for in-house treatment of long waiters, and allow most external purchasing of procedures for the treatment of long waiting patients to be managed by the National Treatment Purchase Fund.3
3 This could involve purchasing by the National Treatment Purchase Fund of procedures for public
hospital patients either in private hospitals or in other public hospitals where spare capacity is available in the relevant specialty area.

24 <The Waiting List Initiative
Hire of Temporary Staff
2.25 The Department’s records indicate that recruitment of additional consultants and associated nursing and support staff on a temporary basis was a feature of the WLI strategies adopted in many hospitals. The cost of employing temporary staff in this way was equivalent to almost half of WLI funding allocated in 2002. Some of the staff were hired to provide treatment in specialty areas targeted under the WLI. Other staff were recruited to provide ‘across-the-board’ increases in treatment capacity, such as in anaesthetics.
2.26 When the Department approved the employment of staff on a temporary basis, funded by the WLI, it did not specify that the staff were required to provide services primarily or only for patients waiting longer than the target maximum waiting times. However, it was noted that in Tullamore General Hospital, temporary consultants were required initially to take on and treat a number of long waiting patients on the existing consultants’ lists before their own patient lists began to build up.
2.27 The Department received representations from Comhairle na nOspidéal, the statutory body which regulates consultant appointments, recommending that temporary posts created and repeatedly funded using WLI money should be made permanent. The Department is currently implementing this recommendation and it intends to continue funding the posts through the WLI. This reduces the level of discretion available in allocating WLI funding and implies that prior-year allocation has effectively become the most significant allocation criterion for the funding. In this way, what was intended as ring-fenced discretionary WLI funding has, in fact, become part of core hospital funding, used to fund ongoing elective treatment capacity.
Selection of Patients for Treatment
2.28 In most cases, public patients waiting longest for treatment are classified medically as being in need of ‘routine’ procedures. These typically deal with medical conditions that, at the time of diagnosis, are not considered to be life threatening, although in many cases they may have serious impacts on the quality of patients’ lives. In drawing up lists of patients for treatment, medical staff in most public hospitals first identify the number of treatment places for public and private patients. Thereafter, patients are selected for treatment on medical grounds, for example, acuteness of the patient’s medical condition, and likely effectiveness of treatment. Duration of waiting time is also considered, but it is not clear what weight it carries in the selection process.
2.29 In order to effectively administer a targeted initiative like the WLI, it would have been necessary, in applying the extra funds, to specify that, as a general rule, all patients waiting longer than target times should be treated before patients waiting less than the target times. No rules were set with the aim of prioritising long waiting patients in this way. The Department has stated that it would have been impossible to absolutely direct that those waiting longer than a particular period should be treated without reference to clinical decision-making or prioritisation.
2.30 The overall objective of the Initiative cannot be achieved unless the moneys are applied for the purposes intended. Consequently, to achieve this , systems must be put in place that are designed to reconcile the aim of reducing long waiting patient lists with the selection by consultants of patients for treatment on the basis of medical considerations and priorities.
2.31 While the 1998 Review Group report recommended that formal shared criteria and standards should be adopted in all public hospitals for prioritisation of patients for elective

How Waiting List Initiative Funding Was Used < 25
treatment, this has not been achieved to date. However, it is intended that the National Hospitals Office will lead the development of guidelines for referral and prioritisation of patients.
Reporting WLI Output
2.32 To assess the extent to which the WLI succeeded in impacting on the target group, WLI -funded procedures would have to be both distinguishable from core-funded procedures, and related to treatment of target group patients. In the hospitals visited, there were no effective systems either
¡ to distinguish the procedures undertaken with WLI funding from core -funded procedures or
¡ to relate the movement in the target group to the funding sources.
Reporting Extra Procedures
2.33 One of the stated objectives of the WLI is to increase the number of people receiving elective treatment. In measuring output for the WLI, the Department and the ERHA requested service providers to supply information on the number of elective procedures carried out in addition to those achievable through core funding.
2.34 The examination found that hospitals used a variety of approaches in estimating the number of extra procedures funded under the WLI. Only in the case of outsourced procedures is the number readily identifiable in most cases.
2.35 The number of procedures attributable to other types of WLI-funded activity is estimated in a range of ways.
¡ In St James’s Hospital, an estimate of the number of additional cardiac procedures carried out in-house as a result of WLI funding is based on the same service design, staffing and cost structure as for baseline activity in this specialty; for other specialties, the number of elective inpatient procedures in the target specialties4 carried out in a five-day ‘WLI’ ward is used.
¡ In Cork University Hospital, WLI -funded activity is estimated as the difference between actual activity and projected baseline activity in each of the target specialties.
¡ In the other hospitals visited, a complex estimation method, devised originally by the Department, is used to estimate the number of procedures attributable to WLI funding. This relies on a mix of actual and estimated figures, including projected baseline elective activity in the target specialties.
2.36 The estimation methods used in the hospitals reviewed do not provide reliable estimates of the level of elective activity supported by WLI funding.
¡ Elements of the estimation model used by some hospitals are not internally consistent — some of the elements relate to individuals waiting 3 months or more; others include those waiting less than 3 months.
4 St James’s regards maxillo-facial surgery as a target specialty for WLI purposes, although it has not
been defined as such by the Department.

26 <The Waiting List Initiative
¡ The practice in deriving baseline or core activity estimates for use as an input in calculations varies from hospital to hospital and is not clear and reliably based.
¡ Attributing all extra activity over and above core activity levels to WLI funding ignores the effect of other initiatives on elective activity.
2.37 Inconsistency in reporting can occur even in cases where dedicated facilities are provided out of WLI funding. In St James’s, all patients other than emergency cases admitted to a five-day ward funded by the WLI are counted as WLI procedures, irrespective of how long they have been waiting. This does not give a true measure of WLI -funded activity in the hospital.
2.38 The reported estimates of activity are not formally audited for accuracy and completeness by the Department or by the ERHA. As a result, it is difficult to verify the reported number of procedures carried out under the WLI and to ascertain the extent to which they are over and above core-funded activity.
Effect of WLI on Overall Elective Activity
2.39 The total number of patients (public and private) treated by the acute hospital system increased rapidly in recent years , reflecting the very substantial increases in overall funding provided for the system. The number of patients discharged after receiving treatment grew from 697,000 in 1998 to 871,000 in 2001 — an increase of 25%.
Figure 2.4 Number of patients treated in acute hospitals, by route of admission and nature of treatment, 1998 to 2001
Patients admitted to acute hospitals for treatment are categorised as
• emergency admissions, where patients are admitted from accident and emergency departments, or transferred from other hospitals, or transferred on an urgent basis at the request of a GP
• elective admissions, where the required treatment is provided on a planned basis. Elective patients may be admitted as
• inpatients, who require overnight bed accommodation while they receive treatment, or as
• day cases, whose treatment is planned so that they are admitted and discharged on the same day.
0
100,000
200,000
300,000
400,000
1998 1999 2000 2001
Elective inpatient admissions
Elective day case admissions
Emergency admissionsNumber of patients discharged from hospital
Source: Analysis by the Office of the Comptroller and Auditor General Note: Based on HIPE data. Last available data relates to 2001

How Waiting List Initiative Funding Was Used < 27
2.40 The bulk of the increase occurred in emergency and day case treatments (see Figure 2.4). There was a 21% increase in the number of emergency patients treated and a 43% increase in the number of elective day case patients treated. In comparison, the number of planned inpatient treatments increased by 6% nationally. In some hospitals, the number of elective inpatient treatments decreased.
2.41 While it is acknowledged that some of the WLI funding could have been used to fund day case treatment5, it was clear that most of the WLI-funded activities in the hospitals visited were aimed, directly or indirectly, towards the provision of public elective inpatient treatment. Despite this, in the hospitals visited, the overall level of inpatient elective activity actually decreased between 1998 and 2001, as shown in Figure 2.5.
2.42 Apart from the increased treatment of patients on a planned day case rather than inpatient basis, as a result of advances in treatment, the decline in the level of elective inpatient treatment in the hospitals may be attributable to
¡ increased competition for resources from emergency admissions, particularly in large urban areas, in a context of overall hospital capacity constraints
¡ increasing incidence of overholding of beds by patients who are medically fit for discharge but for whom there are no suitable rehabilitation, long-term care beds, or adequate support in the community.
2.43 The decrease in the overall volume of elective inpatient procedures performed suggests that, while WLI may have funded inpatient activity in the hospitals examined, it was not additional activity as originally envisaged. Instead, it may in effect have partly compensated for a reduction in core-funded elective inpatient activity, which might have fallen more had WLI funding not been available. In practice, this has the effect of further blurring the distinction between WLI procedures and core-funded elective inpatient procedures.
5 There was considerable confusion about the status of day cases during the period up to mid-2002 (see
paragraph 3.4).
Figure 2.5 Number of elective inpatients dischargeda, selected hospitals, 1998 to 2001b
Hospital 1998 1999 2000 2001
St James’s Hospital 7,400 7,200 7,500 6,200
St Vincent’s Hospital 6,800 4,600 5,000 5,000
Cork University Hospitalc 13,600 12,000 11,300 11,400
Tullamore General Hospital 2,800 2,100 2,600 2,700
Source: Analysis by the Office of the Comptroller and Auditor General, based on HIPE data Notes: a Includes public and private patients. Excludes procedures outsourced to other hospitals.
b Latest available data relates to 2001. c Includes elective inpatient procedures carried out at St Mary’s Orthopaedic Hospital,
Gurranebraher.

28 n The Waiting List Initiative
Conclusions
2.44 The examination found that allocations from WLI funds were, by 2002, out of line with the number of long waiting patients in each region. While a feature of the allocation method was the rewarding of good performance, a high level of provision is continuing even in instances where the list has been virtually eliminated. It is acknowledged that capacity constraints may have reduced the ability of some hospitals in the Eastern region to deliver treatment to patients directly. However, in order to impact on the numbers in the target group in each hospital, whether through directly provided or outsourced treatment, it will be necessary to allocate funding broadly in line with numbers of long waiting patients. There appears to be scope for coordinating the WLI and the National Treatment Purchase Fund more effectively to focus on the needs of long waiting patients and to address them quickly.
2.45 Visits to hospitals indicated that, while WLI funds appear to have been applied to activities designed to achieve the general aims of the Initiative, clear traceability was largely lost because
¡ hospital accounting systems did not track the application of the funds and
¡ the reported number of procedures could not, therefore, be linked to those funds. The number of procedures reported was found in some cases to have been inaccurate due to inconsistencies in the estimation methods used to determine them.
There is a need to ensure that, where tranches of public funds are provided for specific purposes, systems are put in place that can demonstrate that these funds have been applied for the purpose intended and that the output resulting from any such initiative is captured.
2.46 While WLI funding was found to be targeted at inpatient lists in the hospitals visited, the overall level of elective inpatient treatment actually fell between 1998 and 2001. This suggests that the Initiative did not result in an increase in elective inpatient activity over and above existing levels in those hospitals.
2.47 The administration of an initiative such as the WLI through the layered decision-making process that exists in the health service, presents a challenge in reconciling the objective of fund providers to target a category of long waiting patients and the process of consultants selecting patients for treatment on the basis of medical priority. This has remained an unresolved issue throughout the Initiative to date. The Department needs to examine how systems, procedures and practices within the health service can be aligned so as to ensure that these specific allocations of public funds are applied and seen to be applied to treat the intended beneficiaries of the funding, the long waiting patients.
2.48 The application of almost half of the funds to pay for permanent staff posts limits the discretion of the Department to redistribute the funds to meet changing demands in the system. In order to avoid blurring the distinction between the Initiative and the core work of hospitals, core requirements should be funded from the core budget.

3 Impact of the Waiting List Initiative
3.1 From the commencement of the WLI in 1993, the primary objective of the Initiative was to ensure that no public patient waiting for elective treatment in certain specialties would have to wait longer than the specified target maximum waiting times — 12 months for adults and 6 months for children.
3.2 This chapter examines
n the extent to which reported waiting list figures are reliable
n the trend in the figures reported for the target group
n whether the planned targeting of long waiting patients resulted in their prioritisation, relative to other patients waiting.
Trends in the target group by specialty, region and hospital and the extent to which these trends differ from the overall national pattern are also examined.
Reporting the Number of Patients Waiting
3.3 National figures for the number of patients in the target group are compiled by the Department from data reported by individual hospitals.
3.4 In compiling and reporting on numbers waiting for elective treatment, there has been considerable confusion about whether or not elective day case patients (i.e. those where it is planned that the patient will be admitted to the hospital, treated and discharged on the same day) should be included. Between 1993 and 2002, the Department requested reporting of the number of persons waiting for ‘elective inpatient treatment’. In some contexts, the term ‘inpatient’ is used to refer to any formal admission of a patient to a hospital. However, the more general usage of the term is in relation to patients who spend at least one night in hospital. Consequently, some hospitals reported only those waiting on their inpatient lists and excluded patients waiting for treatment on a day case basis.
3.5 In mid-2002, the Department began publishing day case numbers for certain hospitals. This resulted in an adjustment in the number of patients reported in June 2002. Some hospitals have not yet started to report their long waiting day case patients — this may result in some further upward adjustments as all hospitals move to a common reporting basis.
3.6 The net result of these factors is that changes in the reported numbers of long waiting patients have to be interpreted carefully. Furthermore, analysis of national trends needs to be supplemented by analysis of trends at individual hospital level.
3.7 At individual hospital level, patients usually leave the waiting list when they receive the required treatment, whether as a result of normal core funded activity or as a result of WLI-funded or other initiatives. However, they may also cease waiting for other reasons: they may no longer wish to have the treatment or may become unfit for treatment; they may have the procedure carried out elsewhere; or they may become un-contactable. Hospitals periodically review their waiting lists to identify patients in these categories for removal from the list, subject to direction by the consultant concerned and often in consultation with the patients’ GPs. In the hospitals visited, this list validation process was funded mainly through the WLI.

30 n The Waiting List Initiative
3.8 There is also a perception that some individual patients may be on waiting lists for the same treatment in a number of hospitals. While this would lead to double counting of such patients in the reported number of patients waiting, there is no reliable statistical evidence of the scale of this phenomenon.
Trend in the Target Group
3.9 The total number of patients reported in the target group increased from just over 14,100 at the beginning of 1998 to around 17,500 at the end of 1999 (see Figure 3.1). Thereafter, it decreased to reach a level of around 8,700 by the end of December 2002. This represents a net decrease of 39% over the period.
3.10 Fastest progress in reducing the number of patients in the target group was made during 2000. This occurred following an increase in the amount of funding provided under the WLI from €25 million in 1999 to €44 million in 2000. The decline halted temporarily in 2001, despite repeat funding of €44 million, but the downward trend resumed thereafter.
3.11 Identifying the separate impact of the WLI on the reported number of patients in the target group is difficult because other influences may impact on this number. Until the middle of 2002, the influence of the WLI is potentially more obvious. It becomes more complex to separate the influences from June 2002 onwards because
n the Department began reporting day cases for a number of hospitals for the first time
n the National Treatment Purchase Fund began to treat long waiting patients6.
6 The National Treatment Purchase Fund provided resources for the treatment of over 1,900 patients
from its inception in July 2002 to the end of that year.
Figure 3.1 Reported number of patients in WLI target group and in the WLI non-target group nationally, by quarter, 1998 to 2002
0
3,000
6,000
9,000
12,000
15,000
18,000
21,000
Jan-98 Jan-99 Jan-00 Jan-01 Jan-02
Number of patients
1998 1999 2000 2001 2002
WLI target group
Other patients waiting
Source: Analysis by the Office of the Comptroller and Auditor General

Impact of the Waiting List Initiative < 31
3.12 Figure 3.1 shows that, until around September 2001, the number of patients in the target group moved broadly in line with the number of other patients waiting. This suggests that the target group was not prioritised before this date.
3.13 If the WLI were to operate in a way that prioritised long waiting patients, the numbers in the target group should decrease as a proportion of the total number waiting. While the number of patients in the target group fell significantly, it generally mirrored the decline in the reported overall number of patients waiting for treatment. In March 1998, 44% of all patients reported by hospitals as waiting 3 months or more for treatment were in the target group; the corresponding figure at the end of 2001 was 42%.7
Target Group by Treatment Specialty
3.14 There was considerable variation in the trends in numbers waiting longer than the target maximum waiting times for the different treatment specialties in the period 1998 to 2002 (see Figure 3.2).
n The ENT and orthopaedics specialties consistently had the largest reported number of patients in the target group, but the numbers reported began declining significantly from the beginning of 2000.
n Hospitals reported that the number waiting longer than the target maximum waiting time for cardiac surgery treatment decreased from around 1,000 at the start of 1998 to 55 by the end of 2002. However, this reduction is not attributable in full to the WLI since there was also a significant increase in the acute hospital capacity for this specialty during this period.
n The number of patients in the target group for vascular surgery reduced by over 60%; the number of patients in the target group for gynaecology procedures reduced by around a half.
n While there was some fluctuation in the target groups of patients waiting for ophthalmology and urology procedures throughout the period, the number of people waiting longer than the target maximum waiting times at the end of the period was about the same as at the beginning.
n The target group in both the plastic surgery and general surgery specialties increased by a quarter over the period.
7 The figures for June, September and December 2002 are not directly comparable with previous
quarters because, for those dates, more hospitals reported the number of day case patients waiting.

32 n The Waiting List Initiative
Figure 3.2 Number of patients in the target group, by treatment specialty, 1998 to 2002
Cardiac Surgery
0
1,000
2,000
3,000
4,000
5,000
Jan-98 Jan-99 Jan-00 Jan-01 Jan-021998 1999 2000 2001 2002
Ear, Nose and Throat (ENT)
0
1,000
2,000
3,000
4,000
5,000
Jan-98 Jan-99 Jan-00 Jan-01 Jan-021998 1999 2000 2001 2002
Gynaecology
0
1,000
2,000
3,000
4,000
5,000
Jan-98 Jan-99 Jan-00 Jan-01 Jan-021998 1999 2000 2001 2002
Opthalmology
0
1,000
2,000
3,000
4,000
5,000
Jan-98 Jan-99 Jan-00 Jan-01 Jan-021998 1999 2000 2001 2002
Orthopaedics
0
1,000
2,000
3,000
4,000
5,000
Jan-98 Jan-99 Jan-00 Jan-01 Jan-021998 1999 2000 2001 2002
Plastic Surgery
0
1,000
2,000
3,000
4,000
5,000
Jan-98 Jan-99 Jan-00 Jan-01 Jan-021998 1999 2000 2001 2002
Urology
0
1,000
2,000
3,000
4,000
5,000
Jan-98 Jan-99 Jan-00 Jan-01 Jan-021998 1999 2000 2001 2002
Vascular
0
1,000
2,000
3,000
4,000
5,000
Jan-98 Jan-99 Jan-00 Jan-01 Jan-021998 1999 2000 2001 2002
Source: Analysis by the Office of the Comptroller and Auditor General
General Surgery
0
1,000
2,000
3,000
4,000
5,000
Jan-98 Jan-99 Jan-00 Jan-01 Jan-021998 1999 2000 2001 2002
Impact of the Waiting List Initiative < 33
Regional Variations in the Target Group
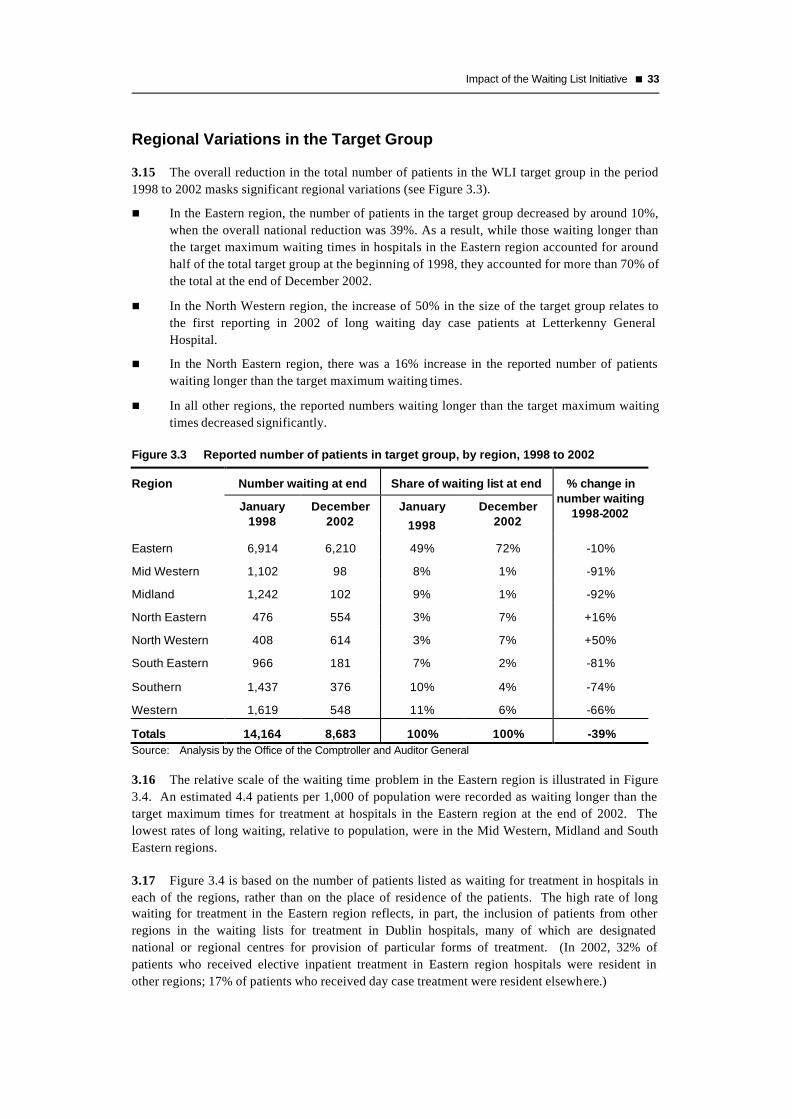
3.15 The overall reduction in the total number of patients in the WLI target group in the period 1998 to 2002 masks significant regional variations (see Figure 3.3).
n In the Eastern region, the number of patients in the target group decreased by around 10%, when the overall national reduction was 39%. As a result, while those waiting longer than the target maximum waiting times in hospitals in the Eastern region accounted for around half of the total target group at the beginning of 1998, they accounted for more than 70% of the total at the end of December 2002.
n In the North Western region, the increase of 50% in the size of the target group relates to the first reporting in 2002 of long waiting day case patients at Letterkenny General Hospital.
n In the North Eastern region, there was a 16% increase in the reported number of patients waiting longer than the target maximum waiting times.
n In all other regions, the reported numbers waiting longer than the target maximum waiting times decreased significantly.
Figure 3.3 Reported number of patients in target group, by region, 1998 to 2002
Region Number waiting at end Share of waiting list at end
January 1998
December 2002
January
1998
December 2002
% change in number waiting
1998-2002
Eastern 6,914 6,210 49% 72% -10%
Mid Western 1,102 98 8% 1% -91%
Midland 1,242 102 9% 1% -92%
North Eastern 476 554 3% 7% +16%
North Western 408 614 3% 7% +50%
South Eastern 966 181 7% 2% -81%
Southern 1,437 376 10% 4% -74%
Western 1,619 548 11% 6% -66%
Totals 14,164 8,683 100% 100% -39% Source: Analysis by the Office of the Comptroller and Auditor General
3.16 The relative scale of the waiting time problem in the Eastern region is illustrated in Figure 3.4. An estimated 4.4 patients per 1,000 of population were recorded as waiting longer than the target maximum times for treatment at hospitals in the Eastern region at the end of 2002. The lowest rates of long waiting, relative to population, were in the Mid Western, Midland and South Eastern regions.
3.17 Figure 3.4 is based on the number of patients listed as waiting for treatment in hospitals in each of the regions, rather than on the place of residence of the patients. The high rate of long waiting for treatment in the Eastern region reflects, in part, the inclusion of patients from other regions in the waiting lists for treatment in Dublin hospitals, many of which are designated national or regional centres for provision of particular forms of treatment. (In 2002, 32% of patients who received elective inpatient treatment in Eastern region hospitals were resident in other regions; 17% of patients who received day case treatment were resident elsewhere.)

34 n The Waiting List Initiative
Figure 3.4 Number of patients waiting longer than target maximum times per thousand of population, by region, end-December 2002
0 0.5 1 1.5 2 2.5 3 3.5 4 4.5 5
Western
Southern
South Eastern
North Western
North Eastern
Midland
Mid Western
Eastern
Region
Target group patients, per thousand of population
Source: Analysis by the Office of the Comptroller and Auditor General
3.18 Patients may seek treatment in hospitals in regions other than where they reside for a variety of reasons. This arises particularly where regional or national specialties are provided in other regions or if the types of procedures they seek are not available in local hospitals. Patients may also seek treatment in hospitals in other regions, on the advice of their GPs or for personal reasons, even though the kind of treatment they require may be available in hospitals in their own region. If their GPs refer them to a number of consultants for the same condition, they may also be listed for the same treatment in hospitals both in their own and in another region.
Target Group by Hospital
3.19 Variations in the trends in numbers of long waiting patients reported are also evident at individual hospital level. Figure 3.5 shows how the numbers reported in the target groups changed over the period 1998 to 2001 in the eight hospitals reporting the biggest target groups during that period.
n St James’s Hospital reported that it had only 4 patients remaining in the target group by the end of December 2002.
n Tullamore and University College Hospital Galway also reported significant reductions in the numbers of long waiting patients.
n The reported numbers in the target group in Beaumont Hospital increased by over a quarter between the beginning of 1998 and the end of December 2001. The further increase in the reported number in the target group in the end-June 2002 quarter reflects the first reporting by the Department of patients waiting longer than the target maximum time for day case treatments.
n There were significant increases in the reported number of long waiting patients in St Vincent’s and Tallaght Hospitals. (In the case of Tallaght, this relates only to elective inpatients — the Hospital does not report on day case patients waiting.)
n Four Eastern region hospitals (Beaumont, Tallaght, St Vincent’s and the Mater) together accounted for half of the reported national target group in December 2002.

Impact of the Waiting List Initiative < 35
Figure 3.5 Number of patients reported in the target group, selected hospitals, 1998 to 2002
St. James's Hospitala
0
500
1,000
1,500
2,000
Jan-98 Jan-99 Jan-00 Jan-01 Jan-021998 1999 2000 2001 2002
University College Hospital, Galwayc
0
500
1,000
1,500
2,000
Jan-98 Jan-99 Jan-00 Jan-01 Jan-021998 1999 2000 2001 2002
Midland Regional Hospital, Tullamoreb
0
500
1,000
1,500
2,000
Jan-98 Jan-99 Jan-00 Jan-01 Jan-021998 1999 2000 2001 2002
Temple Street Children's Hopsital b
0
500
1,000
1,500
2,000
Jan-98 Jan-99 Jan-00 Jan-01 Jan-021998 1999 2000 2001 2002
Beaumont Hospital c
0
500
1,000
1,500
2,000
Jan-98 Jan-99 Jan-00 Jan-01 Jan-021998 1999 2000 2001 2002
Tallaght Hopsital a
0
500
1,000
1,500
2,000
Jan-98 Jan-99 Jan-00 Jan-01 Jan-021998 1999 2000 2001 2002
St. Vincent's, Elm Parkc
0
500
1,000
1,500
2,000
Jan-98 Jan-99 Jan-00 Jan-01 Jan-021998 1999 2000 2001 2002
Mater Misericordiae Hospital b
0
500
1,000
1,500
2,000
Jan-98 Jan-99 Jan-00 Jan-01 Jan-021998 1999 2000 2001 2002
Source: Analysis by the Office of the Comptroller and Auditor General Notes: a inpatients only.
b inpatients and day case patients. c inpatients only up to the quarter ended March 2002; inpatients and day cases figures thereafter.

36 n The Waiting List Initiative
Size of Target Group Relative to Total Patients Waiting
3.20 Figure 3.6 shows the size of the target group as a percentage of the total number of patients waiting in certain hospitals at the end of 2002.
n Of the 14 hospitals listed, 11 hospitals had a higher percentage of people waiting in the target group than the national average of 30%.
n In Temple Street, Tallaght and Crumlin hospitals, more than half of those reported as waiting are long waiting patients.
Figure 3.6 Target group as a percentage of total reported patients waiting, selected hospitals, end December 2002
Size of Target Group Relative to Volume of Elective Activity
3.21 The number of patients reported nationally as waiting longer than the target maximum times — just under 8,700 at the end of December 2002 — is significant in absolute terms. On the other hand, relative to the overall output of elective procedures by the acute hospital system (almost half a million inpatient and day case procedures in 2001), the number of long waiting patients is small – less than 2% of output. The number of long waiting patients may be capable of being addressed by more efficient allocation of WLI funds and the use of the National Treatment Purchase Fund to treat cases backlogged due to capacity constraints.
Hospital Total number of patients waiting
Target group Target Group as a % of Total
Waiting
Temple Street Children's Hospital 756 552 73%
Tallaght Hospital 1,440 885 61%
Our Lady's Hospital, Crumlin 1,034 523 51%
Our Lady's General Hospital, Navan 604 293 49%
South Infirmary/Victoria Hospital 175 73 42%
University College Hospital, Galway 950 371 39%
Merlin Park Regional Hospital, Galway 472 177 38%
Cavan General Hospital 609 208 34%
Beaumont Hospital 4,240 1,423 34%
James Connolly Memorial Hospital 706 225 32%
Mater Misericordiae Hospital 3,878 1,217 31%
St. Vincent's Hospital, Elm Park 3,287 953 29%
Royal Victoria Eye and Ear Hospital 976 271 28%
St. Luke's Hospital, Kilkenny 180 46 26%
Other hospitals 9,852 1,466 15%
National totals 29,159 8,683 30% Source: Analysis by the Office of the Comptroller and Auditor General Note: Hospitals listed are those with a waiting list of 100 people or more and with a percentage of long waiting
patients of 25% or greater. All hospitals with a waiting list in excess of 100 people are shown in Appendix C.

Impact of the Waiting List Initiative < 37
3.22 Since the long waiting problem is highly localised, a first step in addressing it would be to identify the extent of both the inpatient and day case list in terms of hospital capacity.
3.23 Using the most recent output figures as an indication of capacity, Figure 3.7 presents the reported number of long waiting patients for elective treatments at the end of December 2002 as a percentage of the output of elective treatments in selected hospitals in 2001 (the latest year for which the information is available). Separate percentages are shown for day case and inpatient elective treatment. Hospitals are included in the figure where the percentages for inpatient or day case patients (or both) exceeded 5%.
Figure 3.7 Long waiting patients as a percentage of annual output of elective day case and inpatient treatment, selected hospitals, December 2002
3.1%
4.4%
0.6%
9.6%
3.8%
2.6%
1.3%
0.3%
5.9%
5.1%
6.7%
5.4%
9.5%
14.7%
12.7%
13.7%
18.1%
23.4%
0% 5% 10% 15% 20% 25% 30%
James ConnollyMemorial Hospital
Royal Victoria Eye &Ear (Dublin)
Merlin Park RegionalHospital, Galway
St Mary's, Cappagh
Temple Street
Our Lady's Navan
Beaumont Hospital
Mater MisericordiaeHospital
St. Vincent'sHospital, Elm Park
Tallaght Hospital
Inpatient target group as a % of inpatient activityDay case target group as a % of day case activity
Not available
Not available
Source: Analysis by the Office of the Comptroller and Auditor General Note: Tallaght and Merlin Park Regional Hospitals did not report long waiting day case patients.

38 n The Waiting List Initiative
3.24 In six of the hospitals, the number of patients waiting longer than the target maximum times for elective inpatient treatment exceeded 10% of the annual throughput of elective activity.
n In Tallaght Hospital, the reported number of long waiting patients for inpatient treatment was 23% of the number of elective inpatient procedures carried out.
n In St Vincent’s, long waiting patients were equivalent to 18% of annual inpatient activity.
n Given the relative scale of the problem, it would be a considerable challenge for these hospitals to increase the output of elective procedures sufficiently in the short to medium term in order to have an impact on the number of patients waiting long periods for inpatient treatment, without significantly reducing the level of day case or emergency admission treatment.
3.25 The problem of patients waiting longer than the target times for day case procedures is, in most cases, much less acute than for inpatients. However, some major hospitals are not yet reporting the number of patients waiting for day case treatment.
Conclusions
3.26 The numbers reported in the target group of long waiting patients reduced by 39% from just over 14,100 in January 1998 to 8,700 in December 2002. However, it was not until 2001 that the reduction of the target group began to be achieved at a faster rate than the reduction of the waiting list for other patients.
3.27 The problem of long waiting is highly concentrated in the hospitals in the Eastern Region. At the end of December 2002, the hospitals with the worst problems of long waiting for elective inpatient treatment nationally, in both absolute and relative terms, were Beaumont, the Mater, St. Vincent’s and Tallaght Hospitals in Dublin. Between them, they account for over half of the national target group. There is also a significant long waiting problem in Temple Street Children’s Hospital, both for inpatient and day case treatment. The concentration of the problem in these hospitals suggests that in allocating funds, whether from the WLI or the National Treatment Purchase Fund, there will be a need for co-ordination and the targeting of resources in a way which takes account of
n the internal capacity of these hospitals and
n the scope for using outsourced treatment options.
3.28 Despite the move to reporting the target group on the basis of both the inpatient and day case elements, full consistency has not been achieved since some hospitals still only provide figures for those awaiting inpatient treatment. The effective administration of the Initiative, which has now been running for 10 years, is dependent on accurate information. The Department needs to address this matter urgently.

4 Monitoring and Managing Waiting Time
4.1 Waiting lists are a feature of any situation where the demand for a service is greater than the availability of that service. In the hospital system, people who require elective treatment may have to wait because resources such as beds, staff or operating theatres have to be rationed or because the available resources are not used in the most efficient way.
4.2 From an efficiency viewpoint, the existence of a waiting list does not, in itself, indicate that a problem exists within the system. In fact, achieving optimum efficiency in the provision of public services may inevitably result in the creation of waiting lists. The alternative to requiring patients to wait is to provide spare capacity in the system to deal with peaks in demand. This could be expensive and wasteful, particularly in the health service where any excess resources can always be used productively. However, the objective of being efficient in the use of resources in the health system has to be balanced with the requirement to deliver treatment to patients within a reasonable time.
4.3 As the Department acknowledges in its November 2001 Health Strategy document, active and effective management of waiting lists generally and of initiatives (such as the WLI) to address waiting time problems will require the development of sound performance measurement systems.
4.4 This chapter examines
n how waiting time is measured, including the suitability of the measures used by the Department and how the consistency, reliability and comprehensiveness of the data collected could be improved and
n the management of waiting lists and waiting time in terms of the targets set and the reporting and benchmarking of performance.
Measuring Waiting Time
4.5 Targets for waiting times were first set by the Department when establishing the WLI. Since then, the number of patients waiting for elective treatments has been compiled by the Department from quarterly reports supplied by the service providers. The waiting list definition adopted by the Department for measurement and reporting purposes required service providers to report the number of public patients waiting three months or more for elective treatment.
4.6 At the end of each quarter, hospitals are required to report the number of patients listed as waiting in each of the following categories
n Target specialties
Ø adults waiting 3 to 12 months; and adults waiting 12 months or more
Ø children waiting 3 to 6 months; and children waiting 6 months or more
n Other specialties
Ø adults waiting 3 months or more
Ø children waiting 3 months or more.
4.7 To be useful in decision-making, point-in-time reports such as these need to be supplemented with additional information because

40 n The Waiting List Initiative
n in the target specialties, they report only those cases that fall into two time categories (3 months to target time; patients waiting longer than target time)
n they do not give the average length of time patients are waiting or the time spent waiting by the patient waiting longest
n they do not measure the rate of turnover of cases on the waiting list or in the target group.
In addition, they do not give any details of persons waiting until they pass the lower threshold of 3 months. This information would be useful to identify emerging patterns.
Distribution of Numbers Waiting
4.8 From the patient’s point of view, the time spent waiting for treatment is the most relevant consideration.
4.9 The ERHA has begun to compile information about the waiting time distribution of patients on waiting lists for all treatment specialties in hospitals in the Eastern region (see Figure 4.1). This shows that the total number of patients reported by hospitals as waiting for elective inpatient treatment in the Eastern region at the end of December 2002 was almost 17,600. Almost 30% of these patients were waiting less than three months for treatment and, consequently, they are not included in the waiting list figures published by the Department.
Figure 4.1 Public patients in the Eastern region waiting for elective inpatient treatment, all specialties, by duration of wait, end December 2002
30%
17% 18% 17%
6% 4%8%
0
1,000
2,000
3,000
4,000
5,000
6,000
0 to 3 3 to 6 6 to 12 12 to 24 24 to 36 36 to 48 48+
Months waiting
Number waiting
Source: Eastern Regional Health Authority
4.10 At end December 2002, almost 6,100 patients in the Eastern region had already waited twelve months or more for elective inpatient treatments — over a third of all those waiting for elective treatment. Over 1,300 patients (8% of the total) had been waiting longer than four years.
4.11 The data gathered by the ERHA provides a basis for estimating the average length of time public patients had been waiting for inpatient care in the Eastern region at the end of December 2002 (see Figure 4.2). This indicates that adults were, on average, waiting an estimated 15 months for treatment. This average is very high, considering that the target maximum waiting time for adults is 12 months.

Monitoring and Managing Waiting Time < 41
Figure 4.2 Estimated average waiting timesa for elective inpatient treatment in the Eastern region, adults and children, end December 2002
Adults Childrenb
Inpatient admissions 15.1 months n.a.
Day case admissions 7.8 months n.a.
All elective admissions 12.6 months 8.9 months
Source: Analysis by the Office of the Comptroller and Auditor General Notes: a Averages are based on mid-point value for patients in each time band; patients waiting 48
months or more are assumed to be waiting an average of 60 months. b Average waiting times cannot be calculated separately for children waiting for inpatient and
day case treatment because the numbers waiting in Our Lady’s Hospital, Crumlin cannot be categorised in this way.
4.12 Using the ERHA data, it is not possible to separately estimate inpatient and day case waiting time averages for children. However, the overall average for children reported as waiting for elective treatment is estimated at almost 9 months. This is significantly greater than the target maximum waiting time of 6 months.
4.13 The Department (or the National Hospitals Office, when it is established) should consider collecting national waiting time data along the same lines as the ERHA, and including an analysis of the distribution of waiting time and waiting time averages in its periodic reports on waiting time. Furthermore, because the number of patients in the ‘48 months or more’ category is so significant, both the Department and the ERHA should use a more disaggregated time categorisation. They should also consider asking all service providers to report the longest waiting time for an individual patient in each of the targeted specialties.
Data Collection and Validation
4.14 The Department has had considerable difficulties in ensuring the completeness, accuracy and reliability of the data it collects and publishes in relation to numbers of patients waiting. We examined data collection and reporting in four hospitals.
Patient Record Administration Systems
4.15 Three of the four hospitals visited in the course of this examination (St James’s, St Vincent’s and Tullamore General) use the same system to manage patient administration details — the Patient Administration System (PAS), developed on behalf of the Department as a generic system for Irish acute hospitals. While individual hospitals have developed some localised modules, the same kinds of basic information are captured in all hospitals. A different computer system (the Patient Information Management System) is used in Cork, but it has a similar functionality to the PAS, and holds similar information.
4.16 Practice in the use of the patient record systems varies from hospital to hospital. In all the hospitals visited, all elective patients are registered on the systems from the date of first contact with the hospital (e.g. receipt of a GP referral letter, date patient was seen in accident and emergency, etc). All the hospitals visited have waiting lists for the WLI target specialties, but three of the four do not have centralised waiting lists for some of the non-target specialties.

42 n The Waiting List Initiative
4.17 Typically, a waiting list is not kept if all patients in a specialty area are immediately given an appointment date for their elective treatment. Hospital managements regard this as acceptable if the appointment date is in the near future, but separate monitoring systems are required in such cases to ensure waiting times do not begin to extend. The preferable approach — employed in Tullamore General Hospital — is to record all elective patients for all specialties on waiting lists, and use the computerised reporting system to generate comprehensive waiting time information.
4.18 Following on a recommendation of the 1998 Review Group report, the Department introduced a reporting mechanism so that average waiting time by specialty and by consultant would be calculated at hospital level, and collated and published by the Department. This kind of data is routinely collected in other health services and is published so that GPs can take account of the information in referring patients for consultations or treatment. However, the Department judged that the quality and reliability of the information returned by service providers was poor and decided not to publish it.
4.19 The patient administration systems in the hospitals visited are potentially capable of producing waiting time distributions and reliable average waiting times for each hospital, by specialty and by consultant. However, the Department has also pointed out that some other hospitals do not have sufficiently sophisticated patient administration systems to allow them to produce the necessary data. A first step in providing this information will be the clear definition by the Department of the measures it seeks to generate and of a methodology that will ensure the production of comprehensive and consistent data across all hospitals.
4.20 In this regard, there may be scope for applying the lessons learned from a major information technology project commissioned in the Eastern region to address the recording of waiting lists in the major Dublin acute teaching hospitals. It is expected that the project will identify and resolve inconsistencies in the management of waiting list data, as well as improving access to waiting list information.
Reporting Day Case Procedures
4.21 The Department has stated that, from the outset of the WLI, it intended to include in its waiting list count both those waiting for inpatient treatment and those waiting for treatment as day cases. However, its guidelines and data collection instruments refer specifically in some places only to inpatients. Because this term has two different meanings in practice, some hospitals reported numbers waiting including both groups, while others reported only those waiting for inpatient treatment.
4.22 In mid-2002, the Department began to categorise numbers waiting as either day case patients or inpatients for all those hospitals that report day case numbers. In June 2002, hospitals reported that almost 9,500 patients were waiting three months or more for day case procedures. By December 2002, the same hospitals were reporting that over 10,500 day case patients were waiting three months or more. The Department plans in the future to report the numbers waiting in each of the categories separately.
4.23 Some hospitals had not begun reporting the number of patients waiting for day case treatment up to December 2002. These included Tallaght Hospital and St. James’s Hospital. Our Lady’s Hospital for Sick Children reports inpatient and day case numbers together.
4.24 The Department does not have separate waiting time targets for inpatients and day case patients.

Monitoring and Managing Waiting Time < 43
Suspended and Return Patients
4.25 In their counts of patients on their waiting lists, practices differ between hospitals in the manner of treatment of two small but significant categories of patient.
n Patients listed for particular kinds of treatments may require a certain amount of assessment and pre-operative work before the planned procedure can be carried out. This process may reveal that the patient is not medically fit to have the treatment e.g. achievement of a weight loss target may be necessary before joint replacement or anaesthesia. In Tullamore, patients who are long term medically unfit (particularly for major joint replacement) are temporarily suspended from the waiting list count. Thereafter, they are routinely assessed and, when judged to be medically fit, are restored to the active list and shown as waiting from the time they were originally listed for treatment. In the other hospitals visited, unfit patients may remain on waiting lists. While the numbers involved are unlikely to skew the estimation of average waiting times significantly, retaining them in a distribution analysis may give an incorrect measure of longest waiting time.
n For some types of elective treatment, patients may require a procedure to be repeated at planned intervals. Typically, patients are given their next appointment at the time they are discharged. Strictly, they are not waiting for the treatment. In some cases, they are counted as waiting patients; in other cases, they are excluded from the count. These patients should be excluded from the count in all cases, unless the planned treatment is deferred.
Validation of Waiting Lists
4.26 In the earlier years of the WLI, list validation exercises by individual service providers reduced the reported numbers waiting significantly. There has been more systematic validation of lists on an on-going basis in recent years, resulting in correspondingly smaller adjustments to the lists.
4.27 In general, the validation exercises carried out have been of an administrative nature, including writing to patients to ascertain that they still wish to have the treatments for which they are listed. In some cases, validation has involved recall of long waiting patients for a medical re-assessment.
4.28 Considering the length of time some patients have waited for treatment, it seems reasonable that the medical condition and suitability for treatment of patients waiting longer than the target times should be assessed periodically as part of a list validation strategy.
Waiting for an Outpatient Appointment
4.29 From an individual patient’s perspective, waiting time for treatment includes the time between the referral by the patient’s GP and the initial appointment with the consultant as an outpatient.
4.30 The Department has not set waiting time targets for outpatient consultations. It does not collect national statistics about the number of patients waiting for outpatient appointments, nor about the length of time they wait. In other health services, these aspects of patient waiting time are measured routinely, and performance targets are set for these measures, as well as for time spent waiting for elective treatment.

44 n The Waiting List Initiative
4.31 A CSO survey carried out in mid-20018 suggests that for every 10 public patients reporting that they were waiting for elective treatment, a further 14 public patients said they were waiting for an outpatient appointment.
4.32 In view of the numbers of patients waiting for outpatient consultations, the Department (and, in due course, the National Hospitals Office) should gather data and set waiting time targets for outpatient appointments as well as for elective treatments.
4.33 In most cases, patients attend a consultant’s outpatient clinic before being placed on the relevant waiting list for elective treatment.9 Irrespective of the length of time they have waited for an outpatient appointment, patients are not eligible for consideration for treatment under the National Treatment Purchase Fund until they have been waiting on the list for elective treatment longer than the target maximum waiting times.
Managing Waiting Time
4.34 Initiatives such as the WLI need to be managed on the basis of clear objectives and targets, with performance benchmarked against comparable results. The compilation and reporting of waiting time information is a basic requirement for effective management. In this regard, it is planned that the National Hospitals Office will, upon its establishment, introduce and manage a national waiting time database and coordinate actions to reduce waiting lists and waiting times.
Target Setting
4.35 Achievable deadlines are important in motivating and focusing management in the pursuit of objectives. An initiative such as the WLI should be managed as a programme and deadlines set for the achievement of key milestones. Without target dates for achievement, standards set in terms of waiting time remain aspirational and imprecise for performance management purposes.
4.36 When the WLI was launched, a deadline was not set for meeting its overall aim of treating all long waiting patients. Subsequently, the Health Strategy 2001 specified both waiting time targets and deadlines for their achievement, as indicated in Figure 4.3.
4.37 The aim is that by the end of 2004, no patient should have to wait longer than 3 months for elective treatment in any specialty, whether on a day case or inpatient basis. The end-2002 performance target has not been achieved, and the Department has not set revised deadlines for achievement of its waiting time targets. As a result, the targets have again become aspirational and imprecise.
8 CSO, Quarterly National Household Survey, June – August 2001, published May 2002. 9 In Tullamore General Hospital, a patient may be placed on a waiting list on the direction of the relevant
consultant, based on the GP’s referral letter and without an outpatient consultation, where the GP refers the patient in line with medical assessment protocols laid down by the Hospital’s consultants.

Monitoring and Managing Waiting Time < 45
Figure 4.3 National target maximum waiting times for elective treatment
Source: Department of Health and Children
Benchmarking Public Waiting Times
4.38 Public hospitals provide services to both public and private patients. Approximately 20% of beds in public hospitals are formally designated for private use.
4.39 It is frequently suggested that waiting times for private patients treated in public hospitals are lower than those for public patients but little comparative analysis is available. Similar details are recorded about public and private patients in public hospitals, so statistical analysis of relative waiting times is possible. While this, potentially, provides a highly relevant performance benchmark in the context of management of public patient waiting times, the Department does not collect any information about waiting times for private patients.
4.40 In the absence of health service data about comparative waiting times for public and private patients, the results of a Central Statistics Office (CSO) survey carried out in 2001 provides a basis for benchmarking waiting times for public and private patients (see Figure 4.4). In drawing comparisons from the survey results, it should be noted that private patients might have been waiting for treatment in private beds in public hospitals, or in private hospitals.
4.41 The CSO data can be used to compare the distributions of time waited for both elective treatment and outpatient appointments reported by those with private health insurance and by those who rely mainly on the public health system for treatment.
4.42 The survey suggests that
n while 29% of private patients reported they had been waiting more than 3 months for elective treatment, almost twice that percentage of public patients reported they had been waiting more than 3 months
n a quarter of private patients had been waiting more than 3 months for an outpatient appointment, whereas 46% of public outpatients had been waiting more than 3 months.
4.43 The monitoring of performance in public hospitals in terms of relative waiting time for public and private patients could provide valuable information to help managers benchmark performance in the management of waiting time for patients treated using public funds.
End 2002 target
Adults
Children
Adults
Children
Adults
Children
3 months 6 months 9 months 12 months
End 2003 target
End 2004 target

46 n The Waiting List Initiative
Source: Central Statistics Office
Figure 4.4 Benchmarking waiting time for elective treatment and outpatient appointments, June-August 2001
As part of its Quarterly National Household Survey in the three months from June to August 2001, the Central Statistics Office (CSO) asked respondents a number of questions about their use of health services and about waiting for services. The results of the survey in relation to health issues were published in May 2002.
The survey results cannot be fully reconciled with the Department’s reported waiting list numbers, because the CSO used different definitions and the timing of the survey did not coincide exactly with the Department’s reporting period. Furthermore, the CSO’s results are based on patients’ perceptions of the services they are awaiting and on the length of time they have been waiting. Despite these differences, comparison of relevant parts of the CSO results with the Department’s figures indicates that the two sets of data are reasonably consistent.
The survey distinguished between respondents on the basis of the type of medical cover they hold. The survey found that 48% of respondents had private medical insurance. (This includes 2% who also had a medical card.) This suggests that they had access to private medical treatment — in public and/or private hospitals — and would therefore be less likely to rely on the public system for elective treatment. Of the remaining 52% of respondents, half reported they had a medical card and half reported that they had neither private insurance nor medical card cover. Patients in both these categories are more likely to rely on the public system for elective treatment.
0%
10%
20%
30%
40%
50%
<1 1 to 3 3 to 6 6 to 9 9 to 12 12 +
Duration of waiting (months)
Percentage of patients waiting
Public patients
Private patients
Elective treatment
0%
10%
20%
30%
40%
50%
<1 1 to 3 3 to 6 6 to 9 9 to 12 12 +
Duration of waiting (months)
Percentage of patients waiting
Public patients
Private patients
Outpatient appointments

Monitoring and Managing Waiting Time < 47
Coordination with General Practitioners
4.44 Reliable waiting time performance could be very useful to GPs in referring patients for treatment. In other jurisdictions, special websites have been created to make this information readily accessible.
4.45 Since June 2002, the Department has begun to publish on its website quarterly information about numbers of patients waiting. The Department publishes the reported number of patients waiting for inpatient and day case treatment, by hospital and specialty. The number of patients waiting longer than the target time is also shown. However, the form and content of this section of the website could be developed to make it more helpful to GPs in making their referral choices.
4.46 The following performance measures could enhance the currently published information
n the number of elective procedures carried out (each year or each quarter), by hospital and specialty, to allow the number waiting to be put in context
n the average waiting times for treatment in each specialty area
n the longest waiting time for an individual patient in each specialty area
n waiting time for initial outpatient consultation appointments
n presentation of data on a time series basis, so that trends in waiting time can be identified
n presentation of direct comparisons of waiting times for the same specialties at different hospitals.
Conclusions
4.47 CSO statistics indicate that, nationally, the proportion of public patients waiting longer than three months for elective treatment is almost twice the proportion for private elective patients. Benchmarking of public patient waiting against waiting times for private treatment in public hospitals would be useful in reviewing the performance of service providers in delivering the services funded by the State whether out of core funds or under targeted initiatives like the WLI.
4.48 Recent developments in data collection are beginning to generate better information about waiting times for elective treatment. The available data suggests that, at end December 2002 in the Eastern Region (where most of the elective treatment waiting time problem is located), both adults and children were, on average, waiting significantly longer that the target maximum waiting times. This implies significant improvements in waiting times are required in the short term if the Department’s waiting time targets are to be met. The Department should encourage the national production of similar data to that now collected in the Eastern region.
4.49 Significant further improvements are required in the performance measurement and management systems in relation to waiting lists.
n Individual hospitals and the Department report quarterly on the overall number of patients waiting more than three months for treatment and the number waiting longer than the target maximum waiting times for selected specialties. While data collection in relation to numbers on waiting lists has been improving, these measures of numbers waiting provide little information about the length of time the average patient is waiting or how fast the waiting list is moving. These are more relevant considerations from the patients’ point of view.

48 n The Waiting List Initiative
n Greater accuracy and consistency is required in the data collection process.
n Since time spent waiting for outpatient appointments is potentially a significant part of a patient’s overall waiting time for treatment, this should also be measured and monitored.
n Existing waiting time targets set by the Department are largely aspirational. In managing waiting time under an initiative like the WLI, milestones and time deadlines should be established and regularly reviewed if they are to function as clear and achievable performance targets.

Appendices

Appendix A Summary of Recommendations of the Review Group on the Waiting List Initiative, July 1998
Overall Conclusions
The Review Group believes that a series of immediate, medium term and long-term initiatives must be taken if waiting lists and waiting times are to be reduced substantially. There are no simple short-term solutions which, on their own, will have a significant impact. In addition, a satisfactory response must reach beyond the acute hospital services alone. The report makes a number of recommendations regarding organisational initiatives that could be implemented quickly, but these must be accompanied by an integrated set of medium to long term initiatives both within and outside the acute hospital sector.
Immediate Term Recommendations: 1998
Further study of hospital capacity is needed as a matter of urgency. Some hospitals have reached full capacity with existing resources in relation to elective work. Where staffing is an issue, these hospitals should be funded for the provision of appropriate temporary staff in target specialties, subject to certain conditions. Where physical capacity is an issue, favourable consideration should be given to developing, in the medium to long term, additional capacity in hospitals which demonstrate that their existing facilities are already appropriately utilised and fully committed.
Agencies should be asked to review their information systems to ensure that they can maintain accurate and up-to-date WLI data and should be assisted if specific shortfalls are identified. The Department of Health and Children should develop and implement an improved IT system for recording and analysing national WLI data.
Hospitals should carry out a bulk postal review of patients on their waiting lists where they have not done so in the previous twelve months. There should be an agreed protocol for periodic further reviews on a selective basis following this validation process.
A set of short-term steps relating to the operation of hospital services should be taken. These include an improved flow of information between primary and hospital care regarding the status of patients on waiting lists; a continued move towards day case work; the appointment of bed managers and bed utilisation committees; agreement under each agency's service plan regarding the mix of public and private patients treated; and a written policy on planning the discharge of older patients and on liaising with community-based services.
Medium Term Recommendations: 1999
WLI funding should focus on a limited number of specialties and take the greatest possible account of health and social gain, the priority set according to clinical judgement and the length of time already waited by patients.
The present system of allocating WLI funding may act as a disincentive to hospitals to improve their waiting list performance. The Department of Health and Children should consider introducing positive financial incentives to hospitals to reduce their waiting times. A proportion of

Summary of Recommendations of the Review Group on the Waiting List Initiative, July 1998 < 51
total WLI funding could be retained by the Department for distribution to the hospitals which showed the greatest reduction in waiting times in target specialties. The details of any such incentive system should be developed in conjunction with the relevant hospitals.
Protocols should be developed in all major Waiting List Specialties for the validation and prioritisation of cases. This should be done either at national level through protocols devised by the relevant professional bodies, or at local level by individual hospitals.
A number of measures should be pursued to reduce the pressure from A&E services on acute beds. These include developing rapid diagnostic systems for common emergency presentations; developing effective care guidelines for managing conditions which no longer require admission; further developing treatment/observation areas to allow frequent review of certain cases; and improving access by general practitioners to urgent specialist opinion.
Long Term Recommendations 1999 - 2001
The development of Geriatric Day Hospitals on the site of acute hospitals should be prioritised in the medium to long term. The next priority should be the development of rehabilitation facilities on acute hospital sites where they do not already exist. Both of these developments would significantly increase the appropriate utilisation of scarce acute hospital services.
Each health board should evaluate the long-term residential care needs of its region. There should then be a planned programme of investment in appropriate facilities for those in need of long-term care.
For acute patients, the case for providing stand-alone day surgery units on the site of acute hospitals should be examined closely. Since many patients who are on public waiting lists could be treated on a day case basis, a dedicated day surgery unit could greatly protect them from delays that arise from other hospital pressures.
The question of providing additional hostel or other short-term accommodation for patients who do not otherwise need to stay overnight in an acute bed should be pursued as a means of reducing unnecessary hospital stays.

Source: Analysis by the Office of the Comptroller & Auditor General
Appendix B Allocations of Waiting List Initiative Funding to Service Providers, 1998 – 2002
Service Provider / Region 1998 1999 2000 2001 2002
Total
(1998-2001) €’000 €’000 €’000 €’000 €’000 €’000 Voluntary Hospitals in Eastern Region
St James’s Hospital 1,764 2,133 4,919 4,713 5,915 19,444 Mater Misericordiae Hospital 1,200 4,979 3,697 1,053 3,647 14,576 Beaumont Hospital 938 1,765 2,842 3,249 3,970 12,764
Our Ladys Hospital, Crumlin 1,178 983 2,425 4,177 1,316 10,079 St Vincent's Hospital, Elm Park 1,152 1,422 2,203 1,930 2,512 9,219 Tallaght Hospital 394 949 2,165 2,165 0 5,673 Royal Victoria Eye & Ear Hospital 348 510 805 939 1,536 4,138
St Mary’s Hospital, Cappagh 0 0 660 1,270 2,024 3,954 Temple Street Children’s Hospital 127 190 301 99 0 717 Rotunda 114 140 220 0 0 474 Coombe 43 57 90 0 0 190
St Michael’s Hospital, Dunlaoire 0 65 102 0 0 167 External Service Providers Mater Private 584 0 161 2,337 404 3,486 Blackrock 584 0 0 415 108 1,107 East Coast Area Health Board 0 0 0 0 28 28
Eastern Region 8,426 13,193 20,590 22,347 21,460 86,016
Midland Health Board 736 1,765 2,720 2,222 2,200 9,643
Midland Region 736 1,765 2,720 2,222 2,200 9,643
Mid-Western Health Board 780 1,351 2,720 2,603 2,565 10,019 St John's Hospital, Limerick 95 138 218 317 336 1,104
Mid Western Region 875 1,489 2,938 2,920 2,901 11,123
North Eastern Health Board 660 1,060 2,528 2,286 2,050 8,584
North Eastern Region 660 1,060 2,528 2,286 2,050 8,584
North Western Health Board 762 1,448 3,385 1,143 2,070 8,808 External providers 25 283 0 1,038 0 1,346
North Western Region 787 1,731 3,385 2,181 2,070 10,154
South Eastern Health Board 885 1,715 3,785 3,238 3,530 13,153
South Eastern Region 885 1,715 3,785 3,238 3,530 13,153
Southern Health Board 1,244 1,174 3,333 3,492 3,860 13,103 Mercy Hospital, Cork 84 470 574 1,206 1,420 3,754 South Infirmary/Victoria Hospital 191 178 150 676 1,055 2,250
Southern Region 1,519 1,822 4,057 5,374 6,335 19,107
Western Health Board 1,336 2,582 3,832 3,238 3,260 14,248 Portiuncula Hospital, Ballinasloe 0 38 60 0 0 98
Western Region 1,336 2,620 3,892 3,238 3,260 14,346
Totals 15,224 25,395 43,895 43,806 43,806 172,126

Appendix C Target Group as a Percentage of Total Waiting, by Hospital, end December 2002
Hospital Total Waiting Target Group Target Group as a % of Total
Waiting
Temple Street Children's Hospital 756 552 73%
Tallaght Hospital 1,440 885 61%
Our Lady's Hospital, Crumlin 1,034 523 51%
Our Lady's General Hospital, Navan 604 293 49%
South Infirmary/Victoria Hospital 175 73 42%
University College Hospital, Galway 950 371 39%
Merlin Park Regional Hospital, Galway 472 177 38%
Cavan General Hospital 609 208 34%
Beaumont Hospital 4,240 1,423 34%
James Connolly Memorial Hospital 706 225 32%
Mater Misericordiae Hospital 3,878 1,217 31%
St Vincent's Hospital, Elm Park 3,287 953 29%
Royal Victoria Eye and Ear Hospital 976 271 28%
St Luke's Hospital, Kilkenny 180 46 26%
Orthopaedic Hospital, Kilcreene 144 33 23%
Cork University Hospital 1,053 231 22%
St Mary's Hospital, Cappagh 699 148 21%
Sligo Regional Hospital 817 161 20%
Our Lady of Lourdes (NEHB) 281 53 19%
Midland Regional Hospital, Tullamore 548 100 18%
Letterkenny General Hospital 2,563 453 18%
Mercy Hospital, Cork 259 41 16%
Waterford Regional Hospital, Ardkeen 931 82 9%
Regional Hospital, Dooradoyle, Limerick 1,150 83 7%
St Mary's Hospital, Gurranebraher 110 5 5%
St James's Hospital 529 4 1%
St John's Hospital, Limerick 251 0 0%
Other Hospitals 517 72 14%
Totals 29,159 8,683 30% Source: Analysis by the Office of the Comptroller and Auditor General Note: Hospitals included are those with a waiting list of 100 people or more.