The Vote Is Cast: The Effect of Corporate Governance on ...
35
THE JOURNAL OF FINANCE • VOL. LXVII, NO. 5 • OCTOBER 2012 The Vote Is Cast: The Effect of Corporate Governance on Shareholder Value VICENTE CU ˜ NAT, MIREIA GINE, and MARIA GUADALUPE ∗ ABSTRACT This paper investigates whether improvements in the firm’s internal corporate gov- ernance create value for shareholders. We analyze the market reaction to governance proposals that pass or fail by a small margin of votes in annual meetings. This pro- vides a clean causal estimate that deals with the endogeneity of internal governance rules. We find that passing a proposal leads to significant positive abnormal returns. Adopting one governance proposal increases shareholder value by 2.8%. The market reaction is larger in firms with more antitakeover provisions, higher institutional ownership, and stronger investor activism for proposals sponsored by institutions. In addition, we find that acquisitions and capital expenditures decline and long-term performance improves. CORPORATE GOVERNANCE PROVISIONS grant managers independence to man- age the firm. However, they also insulate managers from the monitoring and control of shareholders. 1 Establishing empirically how these provisions affect shareholder value and what type of shareholder rights have greater effects is essential for our understanding of the internal governance of firms. In practice, it is generally difficult to find a setting in which a firm’s governance structure changes exogenously. As a result, the existing literature has generally not been able to provide causal estimates of the effect of these corporate governance provisions. 2 Furthermore, the range of results in the ∗ Vicente Cu ˜ nat, London School of Economics; Mireia Gine, WRDS University of Pennsylvania and Public-Private Sector Research Center, IESE Business School; Maria Guadalupe, INSEAD, NBER, CEPR, and IZA. We are grateful to Ashwini Agrawal; Ann Bartel; Ken Chay; Jeff Coles; Jan Eeckhout; Ray Fisman; Laurie Hodrick; Denis Gromb; Raymond Lim; Marco Manacorda; Zacharias Sautner; David Yermack; and seminar participants at Brown University, Columbia Business School, the University of Edinburgh, Goethe University, LeBow College of Business Conference on Corporate Governance, the London School of Economics, University of Michigan, the New York University Paduano Seminar, and the University of Oregon for their helpful comments and suggestions. The usual disclaimer applies. 1 See, for example, Shleifer and Vishny (1997), Becht, Bolton, and R¨ oell (2005), Comment and Schwert (1995), Gompers, Ishii, and Metrick (2003), Bebchuck, Cohen, and Ferrell (2004), and Core, Guay, and Rusticus (2006). 2 Prior research shows that legislative changes that affect external governance measures, such as state-level antitakeover legislation, increase managerial slack and reduce performance (Garvey and Hanka (1999), Bertrand and Mullainathan (2003), Giroud and Mueller (2010)). Internal gover- nance arrangements, the ones developed by the firm itself, have been the subject of much research, but the evidence provided in these papers is mixed and, most importantly, based on correlations rather than on causal estimates. 1943
Transcript of The Vote Is Cast: The Effect of Corporate Governance on ...

THE JOURNAL OF FINANCE • VOL. LXVII, NO. 5 • OCTOBER 2012
The Vote Is Cast: The Effect of CorporateGovernance on Shareholder Value
VICENTE CUNAT, MIREIA GINE, and MARIA GUADALUPE∗
ABSTRACT
This paper investigates whether improvements in the firm’s internal corporate gov-ernance create value for shareholders. We analyze the market reaction to governanceproposals that pass or fail by a small margin of votes in annual meetings. This pro-vides a clean causal estimate that deals with the endogeneity of internal governancerules. We find that passing a proposal leads to significant positive abnormal returns.Adopting one governance proposal increases shareholder value by 2.8%. The marketreaction is larger in firms with more antitakeover provisions, higher institutionalownership, and stronger investor activism for proposals sponsored by institutions. Inaddition, we find that acquisitions and capital expenditures decline and long-termperformance improves.
CORPORATE GOVERNANCE PROVISIONS grant managers independence to man-age the firm. However, they also insulate managers from the monitoringand control of shareholders.1 Establishing empirically how these provisionsaffect shareholder value and what type of shareholder rights have greatereffects is essential for our understanding of the internal governance offirms. In practice, it is generally difficult to find a setting in which a firm’sgovernance structure changes exogenously. As a result, the existing literaturehas generally not been able to provide causal estimates of the effect of thesecorporate governance provisions.2 Furthermore, the range of results in the
∗Vicente Cunat, London School of Economics; Mireia Gine, WRDS University of Pennsylvaniaand Public-Private Sector Research Center, IESE Business School; Maria Guadalupe, INSEAD,NBER, CEPR, and IZA. We are grateful to Ashwini Agrawal; Ann Bartel; Ken Chay; Jeff Coles;Jan Eeckhout; Ray Fisman; Laurie Hodrick; Denis Gromb; Raymond Lim; Marco Manacorda;Zacharias Sautner; David Yermack; and seminar participants at Brown University, ColumbiaBusiness School, the University of Edinburgh, Goethe University, LeBow College of BusinessConference on Corporate Governance, the London School of Economics, University of Michigan, theNew York University Paduano Seminar, and the University of Oregon for their helpful commentsand suggestions. The usual disclaimer applies.
1 See, for example, Shleifer and Vishny (1997), Becht, Bolton, and Roell (2005), Comment andSchwert (1995), Gompers, Ishii, and Metrick (2003), Bebchuck, Cohen, and Ferrell (2004), andCore, Guay, and Rusticus (2006).
2 Prior research shows that legislative changes that affect external governance measures, suchas state-level antitakeover legislation, increase managerial slack and reduce performance (Garveyand Hanka (1999), Bertrand and Mullainathan (2003), Giroud and Mueller (2010)). Internal gover-nance arrangements, the ones developed by the firm itself, have been the subject of much research,but the evidence provided in these papers is mixed and, most importantly, based on correlationsrather than on causal estimates.
1943

1944 The Journal of Finance R©
existing literature varies widely, from negative effects of increased shareholderrights (e.g., Comment and Schwert (1995), Kadyrzhanova and Rhodes-Kropf(2011)) to very large and positive effects on firm performance (e.g., Gompers,Ishii, and Metrick (2003), Bebchuck, Cohen, and Ferrell (2004)). Given the rele-vance of the question and the number of papers written on the topic, an analysisproviding a causal estimate that is able to establish the sign and magnitude ofthe effect of changing governance structures seems of utmost importance. Thispaper provides an estimate that overcomes the limitations of the existing liter-ature. In particular, we exploit the outcomes of votes on shareholder-sponsoredgovernance proposals at annual meetings to provide a causal estimate of theeffect of changes in the firm’s internal corporate governance structure on share-holder value and managers’ behavior.3
It is difficult to estimate the effect of changes in governance provisions onshareholder returns for primarily two reasons. First, the choice of governancestructure and the type of provisions adopted by firms are arguably endogenousand correlated with other firm characteristics. Thus, comparing the returnsof firms with different governance structures is likely to capture the effect ofthose unobserved characteristics rather than the effect of governance. Second,if investors know about the superior performance of better-governed firms,their knowledge should be incorporated into prices and we should not observeany systematic differences in abnormal returns. These problems are pervasivein the existing literature. To overcome these limitations, we need a setting inwhich governance rules are exogenously or “randomly” adopted and, at thesame time, in which their adoption is not foreseen by the market and incorpo-rated into returns.
We argue that a regression discontinuity design on the outcomes of share-holder proposals in annual meetings allows us to overcome the two limitationsof standard regressions of stock market returns on governance provisions.This empirical strategy essentially compares the stock market’s reaction toshareholder-sponsored governance proposals that pass by a small margin tothose that fail by a small margin. For these close-call proposals, passing isakin to an independent random event (it is “locally” exogenous) and thereforeuncorrelated with firm characteristics. Intuitively, the average characteristicsof a firm in which a proposal passes with 50.1% of the votes are similar tothose of a firm in which the proposal gathers only 49.9% and fails to pass. How-ever, this small difference in the vote share leads to a discrete change in theprobability of implementing a proposal. Empirically, the proposal that passes is20.7% more likely to be implemented (Ertimur, Ferri, and Stubben (2010)). Ourestimate captures the effect of this discrete change in implementation at themajority threshold (the number of votes that determines whether a proposalpasses). More importantly, this estimate does not incorporate any observed or
3 Corporate governance provisions voted on in annual meetings include provisions that lowertakeover barriers, regulate the independence of the board from management, define the votingrules in annual meetings, and decide on executive and board compensation.

The Vote Is Cast 1945
unobserved confounding factors as long as their effect is continuous aroundthe threshold. We show that, indeed, for votes around the majority threshold,passing is uncorrelated with a large number of observed firm and meeting char-acteristics. Hence, by focusing on these proposals, we can plausibly estimate acausal effect.
In addition, it is precisely for these close-call proposals that the vote containssubstantial information—switching from an unpredictable outcome to eitherpass or fail—that is not already fully incorporated in prices. Before the vote,and given the uncertainty inherent in the vote outcome, the market is unableto predict which close-call proposals will pass and which will fail. However,the distribution of prior expectations of proposals that ex post get a 49.9%vote share is, on average, very similar to the distribution of expectations ofproposals that obtain a 50.1% vote share. Therefore, just before the electiontakes place, the expected return to the vote, which is already incorporated intoprices, is very close for these two types of firms. After the vote, uncertainty isresolved since some proposals pass and others do not, and the price for each firmreacts correspondingly to incorporate the information. We adapt the regressiondiscontinuity methodology to the analysis of stock returns in an event study.We present an analytical framework that shows how stock prices should reactfor each observed vote outcome and how one can recover the value of passinga provision from the outcome of votes around the majority threshold. We alsodiscuss how the observed reaction varies with the probability of implementinga proposal and other information that may be contained in the vote outcome.This is, in a nutshell, the regression discontinuity design that allows us toobtain a clean estimate of the effect of shareholder-sponsored proposals.
Our data set includes all shareholder-sponsored governance proposals votedon in firms included in the S&P 1500, plus another sample of 500 widely heldfirms between 1997 and 2007. This yields almost 4,000 proposals. We restrictourselves to shareholder-sponsored proposals because, unlike management-sponsored ones, they cannot be removed strategically by the firm’s manage-ment, and their vote distribution is not affected by selective withdrawal aroundthe discontinuity (see Section III and Listokin (2008)). Given the structure ofour data, we adopt the empirical dynamic regression discontinuity model pro-posed by Cellini, Ferreira, and Rothstein (2010), and we allow the result of thevote in any given annual meeting to affect future outcomes and the votes infuture meetings. We also adapt this methodology to deal with multiple votes inone meeting.
The results show that, on the day of the vote, a shareholder governance pro-posal that passes yields an abnormal return of 1.3% relative to one that fails.The 1-week cumulative return is 2.4%. This price reaction is more pronouncedfor the set of antitakeover provisions included in the G-index developed byGompers, Ishii, and Metrick (2003), suggesting that these provisions are im-portant for governance (since Jensen (1986), it has been argued that takeoverthreats are an important form of managerial discipline). In particular, the effectis largely driven by proposals to eliminate classified boards and poison pills,
1946 The Journal of Finance R©
which represent 68% of the G-Index proposals that fall around the majoritythreshold. We also find that other proposals, such as those increasing boardindependence, have a positive but weaker effect on returns. Finally, we findthat the effect is stronger among firms with concentrated ownership, for thosewith a large number of antitakeover provisions in place, for those with highR&D expenditures, for those with more shareholder proposals in the past, andfor proposals made by institutional shareholders rather than by individuals.
However, the estimated excess return of passing a proposal is not necessar-ily the full expected increase in value from implementing the proposal. This isbecause the estimated excess return (the market response to the event) incor-porates two probabilities: first, the change in the probability of implementingthe proposal as a result of the vote, and second, the probability that passingthe proposal may lead to other governance proposals being submitted and im-plemented in the future (dynamic effects). Using these estimated probabilities,we calculate that, for the firms in our sample, adopting a governance proposalincreases shareholder value by 2.8%. We estimate that two-thirds of the reac-tion corresponds to the contemporaneous implementation of proposals directlyfollowing the vote and one-third to dynamic effects. This is an economicallysizeable effect, especially when we consider that firms often drop several provi-sions in subsequent meetings. Dropping 2.5 provisions (one standard deviationof the G-index in the sample) translates into a predicted increase in marketvalue of 7%, implying that the economic consequences of poor governance ar-rangements are nonnegligible.
Finally, we examine the real effects beyond the stock price reaction on theday of the vote. The regression discontinuity design allows us to study theeffect of the new governance arrangements on variables such as acquisitionsand capital expenditures, which have been used as proxies for empire buildingand potentially inefficient behavior (e.g., Bertrand and Mullainathan (2003),Gompers, Ishii, and Metrick (2003)). We find that acquisitions and capital ex-penditures fall as a result of passing corporate governance proposals. We alsofind evidence that firm value—as reflected by Tobin’s Q and the book-to-marketratio—increases in the years following the vote. We interpret these results asevidence that firms are operated differently as a result of their improved corpo-rate governance structure, reflecting changes in managers’ behavior. Finally,the effect that we identify pertains, by definition, only to firms that have ob-servations around the discontinuity, which affects the degree to which one canextrapolate the results of our analysis to other firms. However, we show thatfirms with observations falling around the threshold are not very differentfrom other firms that are subject to shareholder proposals and that 35% of theG-index proposals fall within 10 percentage points of the majority threshold.This suggests that our results can be directly generalizable to a sizeable set offirms, though not to all.
Our results can be interpreted as the causal effect of corporate governanceon firm value. In contrast, the estimates in most preexisting studies may be bi-ased because of the nonrandom nature of governance structures. For example, ifbetter-run firms (e.g., firms where managers are already committed to generate

The Vote Is Cast 1947
value for shareholders) are likely to have both better governance and higherperformance, this would cause regression coefficients to be biased upwards.Alternatively, if good governance is more likely to be in place when manage-ment is poor (e.g., management and good governance are substitutes), simpleregression estimates would underestimate the causal effect of governance. Ul-timately, the sign and magnitude of the biases is an empirical question. Inaddition, our approach explicitly deals with the fact that market returns incor-porate investors’ expectations. Core, Guay, and Rusticus (2006) emphasize thatif governance provisions are observable and their influence is well understood,the effect of different levels of governance should already be incorporated inshare prices. As such, we should not observe any permanent excess returns fordifferent governance levels. Our paper extends this argument not only to lev-els, but also to predictable changes in governance. In fact, we show that thereare no significant price reactions to votes that pass or fail by large margins,suggesting that the market had already factored them into the share price.
In their influential paper, Gompers, Ishii, and Metrick (2003) report aver-age annual abnormal returns of 8.5% of going long on the so-called democraticportfolio and short on the dictatorship portfolio between 1990 and 1999. AsCore, Guay, and Rusticus (2006) emphasize, however, with efficient marketsthese returns can only be justified if the market learned about the value ofgood governance precisely during this period. This estimate can also be taintedby endogeneity if governance structures are correlated with omitted variables.Our main estimates indicate that this learning process should have led toannual returns of around 2.6%, a substantial yet much smaller effect thanthe Gompers, Ishii, and Metrick (2003) value.4 The rest of the effect could beattributed to the presence of endogeneity (and/or to the fact that we are study-ing a different sample period). Therefore, our results suggest that preexistingestimates are upward biased.
Besides establishing how much shareholder value is generated by increasingshareholder rights and improving corporate governance inside firms, our re-sults imply that shareholder activism can create significant value. Improvingdemocracy inside firms, so that shareholder proposals that fall short of themajority threshold pass, would be value-increasing. We are able to preciselyquantify that value. Finally, our novel use of the regression discontinuity iden-tification can be applied in other settings in which a discontinuity treatment iscombined with an event study.
This paper is organized as follows. Section I describes the data and presentsan analytical framework of how information on the stock price reaction to theoutcome of governance votes that fall around the majority threshold allows usto recover the effect of governance proposals. Section II presents the empiricalmodel used to identify this effect. Section III provides evidence on the regressiondiscontinuity in shareholder votes as a quasi-experiment. Section IV presentsthe results, and Section V concludes.
4 A less conservative estimate based on 1-week cumulative returns can explain up to 5.1% of theabnormal return, which is still well below the Gompers, Ishii, and Metrick (2003) value.

1948 The Journal of Finance R©
I. Shareholder Votes and Abnormal Returns
A. Data Description
We use data collected by Riskmetrics on shareholders’ proposals from 1997to 2007.5 Our sample includes all 3,984 shareholder proposals that Riskmetricsclassifies as governance-related and that are included in the proxy statementfor all S&P 1500 companies, plus an additional 500 widely held firms (theAppendix shows the full list of proposals and how frequently each of themappears in the data). Riskmetrics provides data on the company name, thedate of the annual meeting, the percentage of votes in favor of the proposal,the description of the type of proposal, and the proponent.6 Most shareholderproposals are presented as a recommendation to the board of directors—that is,the outcome of the vote is nonbinding. Ertimur, Ferri, and Stubben (2010) showthat 31.1% of the shareholder proposals that pass are implemented, whereasonly 3.2% of those not approved are implemented.
Riskmetrics classifies the proposals into 72 distinct types. While the effect ofthe different types of proposals is probably heterogeneous, we bundle them intobroader categories due to the limited number of observations in each group.For descriptive purposes, we group governance proposals into six categorieswidely used in the literature: antitakeover proposals (G-index), compensation,voting, auditors, board structure, and other (see the Appendix). Panel A ofTable I displays the frequency of governance proposals, the percent approved,and the average support over time. From 2003 onward, there is a significantincrease in the number of proposals (over 400 per year), and around 30% ofthose are approved. Panel B also shows that G-index proposals obtained thehighest levels of shareholder support and were approved in 53% of the cases.Compensation proposals were approved in only 4.2% of the cases, board struc-ture proposals in 8.8% of the cases, and voting proposals in 3.3% of the cases.For the empirical analysis, the difference in approval rates means that we havevery few observations on compensation, board structure, or voting around thediscontinuity, so we have to further pool all those proposals and analyze themtogether. The Appendix shows the number of proposals of each type falling
5 Rule 14a-8 permits shareholders to submit proposals requesting that certain corporate mattersbe put to a vote at the company’s next annual meeting. Proposals are submitted in advance andincorporated in the proxy material for the meeting. To be eligible to submit a proposal, a shareholdermust be a beneficial owner of at least 1% or $2,000 in market value of securities entitled to vote,have owned these securities for at least 1 year, and continue to own them through the date of themeeting. The vote outcome is not revealed until the actual day of the meeting.
6 We check that all the proposals go in the direction of increasing shareholder rights and control,or improving alignment. We also use a second Riskmetrics data set with information on whetherthe majority is computed out of votes cast or outstanding, and on the majority threshold. Mostproposals have a 50% majority threshold, three had a 66.7% threshold, three had a 70% threshold,and four had an 80% threshold. We also used this data set to check that the vote was correctlyrecorded. In the cases where we find discrepancies between the two data sets, we look at thecompany statements.

The Vote Is Cast 1949
Table IShareholder Governance Proposals
Panel A displays the frequency, approval percentage, and average support over time of governanceproposals. Data are collected by Riskmetrics on all shareholder governance proposals from 1997to 2007 for all S&P 1500 companies plus an additional 500 widely held firms. The threshold forapproval is 50% for all but 10 observations. We take into account the different threshold rulesacross proposals and firms for computing the percentage of approved proposals. Panel B classifiesgovernance proposals by type.
Panel A: Shareholder Proposal Summary Statistics
PercentageShareholder Approved Approved Average Vote Std. Dev. Vote
Year Proposals Proposals Proposals Outcome Outcome
1997 292 29 9.90% 23.13% 17.461998 272 37 13.66% 26.29% 19.111999 310 58 18.70% 28.60% 21.842000 272 70 25.00% 30.95% 232001 277 67 24.00% 30.03% 22.212002 297 100 33.60% 36.61% 23.382003 479 166 34.60% 37.50% 23.272004 451 126 27.00% 33.12% 25.052005 417 124 29.70% 37.17% 23.992006 450 143 31.70% 40.87% 22.662007 467 120 25.70% 37.31% 21.97Total 3,984 1,040 27.35% 36.16%
Panel B: Type of Governance Proposals (Broad Classification)— Summary Statistics
Proposal Type No. of Proposals Mean Vote in Favor Percentage Approved
Auditors 68 22.70% 4.40%Board 1,061 22% 8.80%Compensation 520 23.00% 4.20%G-Index 1,558 51% 53%Voting 421 14% 3.30%Other 356 33.90% 21.00%
around the majority threshold. Among the 523 G-index proposals within fivepercentage points of the discontinuity, 219 (42%) are proposals to repeal clas-sified boards and 132 (25%) are proposals to eliminate poison pills. Among the387 Other (non-G-index) kinds of proposals around the discontinuity, 115 (or30%) are proposals to elect directors through a majority vote and 68 (18%) areproposals to expense stock options. Throughout the paper, we analyze two setsof proposals—G-index versus Other—both pooled and separately.
For the 948 firms that constitute our final sample, we obtain additionalinformation from a number of sources: security prices from CRSP, financialinformation from Compustat, data on acquisitions from the SDC database,

1950 The Journal of Finance R©
Table IIDescriptive Statistics
Our sample of 3,984 proposals corresponds to 2,377 firm-year observations. Abnormal Returns arecomputed from CRSP. G-index is the number of antitakeover provisions in place at the firm (SourceRiskmetrics). All accounting variables are obtained from Compustat: Total Assets (AT), MarketValue (mkvalt f), Capital Expenses (CAPX). Tobin’s Q is defined as the market value of assets(AT+mkvalt f-CEQ) divided by the book value of assets (AT), and balance sheet Deferred Taxesand Investment Tax Credit (TXDITC). Book-to-market is the ratio of book value of common equity(previous fiscal year) to market value of common equity (end of previous calendar year). Ownershipby top five shareholders is the sum of institutional ownership for the top five shareholders in thelast fiscal quarter before the meeting, and institutional shareholders that own at least 5% is thenumber of shareholders that own at least 5% of the firm’s stock (Source: Thomson 13F Database).Acquisitions Count is the number of acquisitions made in a year, Acquisitions Ratio is computedas the sum of all acquisition prices paid divided by the average market capitalization on the firstand last day of the year (Source: SDC). All monetary values are in 1996 U.S. dollars. Note that thenumber of observations may change due to missing values for some of the variables.
N Mean Std. Dev. 10th Per. 90th Per.
Abnormal Return on meeting day 2,377 0.001 0.023 −0.020 0.023G-index 2,050 9.5 2.5 6 13Total assets ($millions) 2,369 43,794.83 124,155 718.83 85,775.73Market value ($millions) 2,011 22,431 44,477 485 62,404EBITDA ($millions) 2,300 3,177.70 6,320 52,29 8,223Capital expenses ($millions) 2,239 1,043 2,570 9.3 2,182R&D/Assets 2,369 0.018 0.045 0 0.065Ownership by top five shareholders
(%)2,301 0.245 0.095 0.136 0.367
Institutional shareholders that ownat least 5%
1,787 2.170 1.230 1 4
Tobin Q 1,805 1.588 0.69 1.01 2.67Book to market 1,805 0.528 0.300 0.180 0.960Return on equity 1,778 0.107 0.100 −0.009 0.241Growth of capital expenses 1,908 0.059 0.300 −0.31 0.45Acquisitions ratio 1,960 0.016 0.030 0 0.064Acquisitions count 1,991 0.53 0.80 0 2.00
and institutional ownership characteristics from Thomson Financial.7 Table IIdisplays the characteristics of the firms in our sample.
B. Identifying Shareholder Returns from Votes on Governance Proposals
In this section, we present an analytical framework that shows how to recoverthe value of a governance provision by focusing on close votes in shareholder-sponsored governance proposals. We show that a discontinuity analysis is a
7 Most of these data sets are recorded at the end of the fiscal year. To determine what is the firstobservation after a vote, we require that the end of the fiscal year be at least 6 months after themeeting in which the vote is recorded. If it is less than 6 months after, then we use the followingyear available as the first year after the meeting.

The Vote Is Cast 1951
Figure 1. Market reaction to vote outcomes.
simple way to deal with the presence of prior expectations in an event study.Figure 1 provides an illustration. Denote v as the vote share in favor of pass-ing a proposal and W(v) as the value to the firm of a particular vote outcome.For simplicity, we assume throughout this illustration that the outcome of thevote is always binding, that the majority threshold for a vote to be approved isv � 1
2 , and that the value of the proposal to the firm is fixed (i.e., independentof v), such that W(v) = W if v � 1
2 and zero otherwise. Figure 1 represents W(v)and shows the change in the underlying value of the firm after the vote. Theobjective of the empirical analysis is to estimate W , the value of implementinga governance proposal, which is not directly observable. As the day of the voteapproaches, investors use all the available information to form an expectationof the probability that the proposal will succeed, and this expectation is in-corporated in stock prices. Therefore, the price reaction, that is, the abnormalreturn that we observe when the outcome of the vote is known is the differencebetween the actual value of the proposal to the firm W(v) (which is either Wor zero, depending on whether it passes) and its expected value before the voteE(W |v) (the average price that the market had formed for a given observedvote outcome). We represent E(W |v) by a dashed line in Figure 1. The intuitionbehind E(W |v) is that, for votes that have a vote share v close to zero, the mar-ket had already assigned a low probability that they would pass. Therefore,E(W |v) is close to zero. Similarly, for votes around 100%, the market assigneda high probability of passing, and E(W |v) is close to W . In contrast, around thethreshold, on average the market had assigned a 50% probability that the votewould pass, and E(W |v) is close to 1
2 W .8
8 The Internet Appendix describes analytically how to derive E(W |v) and the price reaction forany vote outcome, taking into account the full distribution of prior expectations.

1952 The Journal of Finance R©
Since E(W |v) is a continuous function of v but W(v) is discontinuous atthe majority threshold, the abnormal return that one observes when the out-come of the vote is known is also discontinuous at the majority threshold.In fact, the difference in abnormal returns at the majority threshold—Z inFigure 1–between a vote that barely fails and one that barely passes is ex-actly the value of the proposal. Under the set of assumptions outlined earlier,Z = (W − E(W |v)) − (0 − E(W |v)) = W . Therefore, one can recover the value ofthe proposal from the difference in abnormal returns of close-call votes or, inother words, at the discontinuity. The only two crucial identification assump-tions are that the distribution of firm characteristics and vote expectations issimilar on both sides of the discontinuity and that the probability of imple-menting the proposal changes discretely when a proposal passes. Note thatthis analysis can be generalized to other discontinuity treatments that are notbased on votes.
The earlier example made a number of additional assumptions that may notnecessarily hold in reality but are not crucial for the identification. In practice,shareholder proposals are typically not binding. A proposal may pass but not beimplemented; thus, W(v) will be below the effective value of the proposal to theright of the threshold, and the market reaction to proposals that pass by a closemargin will be less positive than if the vote were binding. Similarly, if manage-ment feels that a proposal that fails to pass by a few votes should still be imple-mented, W(v) will be slightly positive to the left of the threshold and the marketreaction will be less negative. Furthermore, W(v) may incorporate the probabil-ity that the current vote will trigger another proposal in the future that in turnmay or may not pass. As a result, E(W |v) and abnormal returns are not neces-sarily symmetric around the threshold, as in our simple example in Figure 1(the Internet Appendix illustrates this case).9 Still, provided that E(W |v) iscontinuous and the probability of implementation discontinuous around thethreshold, Z can be used to measure the value of the proposal to the firm. Inthis case, the value estimated at the discontinuity, Z, is not equal to W , as inthe previous example. To recover the value of W from our estimate Z, we needto consider the fact that, around the discontinuity, the market is updating boththe probability of implementation and the chances of proposing and passingfuture proposals.
Therefore, our identification strategy does not require that proposals be bind-ing. As Lee and Lemieux (2010) discuss, the identification strategy is still validas long as there is a discrete jump in the probability of implementation at themajority threshold (this is the “fuzzy” regression discontinuity setting).10 It
9 The Internet Appendix for this article is available online in the “Supplements and Datasets”section at http://www.afajof.org/supplements.asp.
10 In Ertimur, Ferri, and Stubben (2010), the change in the probability of implementation at themajority threshold can be inferred to be around 20.7%; in Section IV.A.3, we estimate a discretechange in the implementation probability of 30.1% within 2 years for the subset of proposalsthat affect the G-index. Ertimur, Ferri, and Stubben (2010) also show that the probability ofimplementation increases in the vote share: proposals with 50% to 60% of the votes in favor have a23.9% probability of implementation, while proposals with 90% to 100% of the votes in favor havea 78.6% probability of implementation.

The Vote Is Cast 1953
is also important to emphasize that the estimate recovered using the discon-tinuity analysis is the average effect of the governance proposals with votesaround the threshold. Below, we discuss which proposals fall around the ma-jority threshold in the data.
We can define pI as the difference in the probability of implementation ofa proposal that passes by a small margin relative to one that fails by a smallmargin. Similarly, we can define pp
t+i as the endogenous change in the probabil-ity of passing and subsequently implementing another proposal i periods fromnow (as a result of the current proposal passing at the discontinuity). Assum-ing a discount rate of δi, the market reaction at the threshold Z can thereforebe written as the sum of two elements: the value associated with the currentproposal being implemented (pIW f ) plus the discounted value of future propos-als being passed and implemented as a result of the current proposal passing(∑∞
i=1 δi ppt+iW f ). So, once we obtain estimates pI and pp
t+i from the data, thevalue of the proposal can be recovered as
W f = Z
pI +∞∑
i=1
δi ppt+i
. (1)
One important question that arises when trying to infer the value of a pro-posal from the abnormal returns at the discontinuity is whether we shouldexpect any effect of votes that barely pass or fail. Shareholder votes should re-flect a value-maximizing decision. If all shareholders were trying to maximizeshareholder value, and in the absence of transaction costs, then they shouldall vote in the same way, in favor of or against a proposal. If shareholdersare identical but have different information on the value of a proposal, thensome votes would fall around the discontinuity, and those would correspond toproposals whose value to the firm is neutral or uncertain. However, when theobjective of some shareholders is not to maximize shareholder value (say, in thepresence of other private benefits), then the outcome of the vote will depend onthe distribution of their preferences. In this sense, it is well-documented thatdifferent types of shareholders vote differently because they are heterogeneousin their objectives and may have other stakes in the firm. For example, it hasbeen shown that banks and insurance companies tend to side with manage-ment by voting against the proposals, while mutual funds, unions, advisors,and pension funds tend to support the proposals (Brickley, Lease, and Smith(1988), Agrawal (2008)). The fact that we find positive abnormal returns atthe discontinuity suggests that there are decisions that maximize shareholdervalue but are hard to implement.
C. Abnormal Returns as a Function of Votes: Graphical Evidence
Figure 2 shows the impact of passing a proposal on shareholder abnormalreturns on the day of the meeting. We calculate the daily abnormal returnsfrom CRSP, using the three Fama–French factors and the momentum factor

1954 The Journal of Finance R©
0
0.005
0.01
Excess returns
-10 -5 0 5 10 Vote share relative to threshold (2pp bins)
Figure 2. Excess returns by vote share on the day of the vote. The figure shows averageexcess returns by the vote share in favor of the proposal. Proposals are grouped into two percentage-point bins: proposals that passed by between 0.001% and 2% are assigned to the 1 bin, and thosethat failed by similar margins are assigned to the −1 bin. Excess returns are computed using theFama–French and momentum factors from Carhart (1997).
from Carhart (1997).11 Figure 2 is the empirical counterpart of Figure 1. Inpractice, since vote outcomes are not binding and may trigger future proposals,this can make the effects nonsymmetric around zero (as shown in the InternetAppendix). The graph plots the average daily abnormal return for the day of themeeting (t = 0) when the information of the vote is revealed. The x-axis reflectsthe margin of victory (the vote share minus the threshold for that vote). On theday of the vote, proposals that pass by a small margin have positive abnormalreturns, and comparing those to proposals that fail by a small margin givesus the effect of passing a proposal on abnormal returns. Notice that proposalsthat pass by more than a 5% margin display zero abnormal returns, which isconsistent with the fact that the market can forecast with some accuracy theprobability of passing a proposal and this is incorporated in prices. Most firmsdisclose vote outcomes on the same day of the annual meeting through a varietyof channels (newswires and real-time broadcast). Independently, institutionalinvestors such as CALPERS provide news posts on voting results. The mediacovering these corporate events releases additional information.
Figure 2 is an intuitive representation of the main result of the paper: close-call governance proposals that pass lead to positive abnormal returns on theday of the vote, while those that do not pass lead to negative or negligible ones.Before showing regression results (in Section IV), over the next two sectionswe describe the methodology that uses all the data efficiently and we test thevalidity and generality of our approach.
11 The estimation period starts 2 months prior to the event date; the length of the estimationperiod is 200 trading days, and we require at least 15 days with returns to make it into the sample.

The Vote Is Cast 1955
II. Methodology and Identification Strategy
This section describes how to adapt the regression discontinuity methodologyto an event study in order to estimate the effect of shareholder governanceproposals on shareholder returns.
A. Regression Discontinuity in Shareholder Votes
Suppose that shareholders of firm f vote on a shareholder proposal at timet, the meeting date, and that this proposal gets a total vote share (percentageof votes in favor) v f t. If v f t is larger than the majority threshold v∗, then thisproposal passes and we code the indicator for pass as Df t = 1( v f t � v∗).
We are interested in the effect that passing a certain proposal has on anoutcome variable yf t. We can write
yf t = κ + Df tθ + uf t, (2)
where the coefficient θ that we are interested in is the effect of passing aproposal in a shareholder meeting on the outcome variable yf t —for example,abnormal returns—and uf t represents all other determinants of the outcome(E(uf t) = 0). The problem with estimating a regression such as (2) directly isthat the passage of a proposal is a highly endogenous outcome, and Df t isunlikely to be independent of the error term (E(Df t, uf t) �= 0), in which case theestimate of θ will be biased.
To get a consistent estimate, we would ideally want “passing” a proposalto be a randomly assigned variable. The regression discontinuity frameworkthat exploits the vote shares helps us to approximate this ideal setup because,in an arbitrarily small interval around the discontinuity (the threshold v∗),whether the proposal passed or failed is random (e.g., whether a proposalpasses by 50.1% or fails by 49.9% is random). Lee (2008) formally shows that,as long as there is a random component to the vote, the assignment into “treat-ment” (pass and Df t = 1) and “control” (fails and Df t = 0) groups is randomaround the threshold.12 This implies that our estimate of θ using the regres-sion discontinuity design is not affected by omitted variables—such as firmannouncements—even if they are correlated with the vote, as long as their ef-fect is continuous around the threshold. Therefore, by comparing the outcomeyf t of votes that barely passed to the outcome of votes that barely failed, we geta consistent estimate of the value of a new governance rule.
To use all our data and improve efficiency, we follow the standard approach(see Lee and Lemieux (2010)) and assume that we can approximate the contin-uous underlying relationship between yf t and v f t, with a polynomial in the voteshare. This polynomial flexibly captures the underlying relationship betweenany variable that is continuously affected by the vote share and the outcome
12 This random component contains all kinds of events that make the voting outcome not fullypredictable (such as shareholder turnout, undecided voters, and last minute information). It doesnot need to be large for our purposes, given that we perform a local analysis.

1956 The Journal of Finance R©
variable. Only the discontinuous effects at the threshold are captured by θ .Allowing for a different polynomial for observations on the right-hand side ofthe threshold Pr(v f t, γ
r) and on the left-hand side of the threshold Pl(v f t, γl)
gives
yf t = Df tθ + Pr(v f t, γ
r)+ Pl(v f t, γ
l)+ uf t. (3)
The estimate, θ , is precisely the estimate of Z from Section I.A (Figures 1and 2). Therefore, when yf t are abnormal returns, the regression discontinuitymodel yields a consistent estimate of Z.
B. Panel Data, Multiple Votes, and Multiple Shareholder Meetings
Two issues emerge when trying to implement the standard regression dis-continuity model of expression (3) to analyze the effect of governance rulesin our data, and in any event study. The first is that the event (the elec-tion) at time t will have an impact on outcomes at times t + 1, t + 2, etc.The second is that, for each firm and meeting date, shareholders may haveto vote on more than one governance issue. Therefore, we need to find a wayto aggregate all votes by firm and meeting date. This is particularly relevantfor event studies given that, on any particular date, there may be multipletreatments.
B.1. Dynamics in the Impact of the Votes
We follow the empirical model in Cellini, Ferreira, and Rothstein (2010) tocharacterize the dynamic version of the regression discontinuity for a firm fthat has a vote at time t, and we define the outcome τ periods later yf ,t+τ as
yf ,t+τ = Df tθτ + Pr
(v f t, γ
rτ
)+ Pl(v f t, γ
lτ
)+ uf t,t+τ . (4)
The term θτ estimates the causal effect of passing a vote at time t on outcomesat t + τ. As Cellini, Ferreira, and Rothstein (2010) note, estimating expression(4) separately for each period t + τ is inefficient because there is an importantcomponent that is fixed within firms over time but that varies across firms. Wefollow their strategy, pooling data for multiple τ (including τ < 0) and includingcontrols to absorb firm-level heterogeneity. For each election in our data ( f , t),we use observations for firm f in periods t − 2 to t + T (T is up to 7 daysafter the election for abnormal returns and 4 years after the election for otheroutcomes). We then estimate
yf ,t+τ = Df tθτ + Pr
(v f t, γ
rτ
)+ Pl(v f t, γ
lτ
)+ ατ + ηc + λ f t + e f tτ. (5)

The Vote Is Cast 1957
This follows expression (7) in Cellini, Ferreira, and Rothstein (2010) (seemore details for the sample construction in that paper).13 The parametersατ , ηc, and λ f t are fixed effects for time periods relative to the meeting date,calendar years, and focal elections, respectively. The parameters, θτ , γ r
τ , and γ lτ
are allowed to vary for τ � 0, and constrained to zero for τ < 0, and standarderrors are clustered by firm f . Here, θτ is the effect of passing a proposal attime t on outcomes τ periods later, and we obtain separate estimates for thecontemporaneous effect (τ = 0), one period later (τ = 1), etc. Notice that thisdynamic model allows us to introduce focal meeting fixed effects λ f t, which willabsorb any characteristic of the meeting that affects outcomes in periods t + τ
(e.g., characteristics of the firm that are constant during the event window).Information is released mainly on the day of the vote, but in any case thisdynamic structure would capture any effect in subsequent days.
B.2. Aggregating Votes
Next, since there is only one outcome (e.g., one abnormal return) per meeting,we need to find a way to aggregate all votes for a given firm and meeting date.To illustrate how we do this, we first ignore dynamics and use the simple(nondynamic) expression (3). Imagine that the firm could vote on two issues,A and B, on any given date. Then we would extend expression (3) to allow fortwo different kinds of votes to affect yf t
yf t = DAf tθ
A + DBf tθ
B + P Ar
(vA
f t, γA,r)+ PB
r
(vB
f t, γB,r)+ P A
l
(vA
f t, γA,l)
+ PBl
(vB
f t, γB,l)+ uf t,
where θ A and θ B would be the effect of proposals of type A and B on the outcomeof interest. The problem is that there are not just two types of governanceproposals, but 72 (see the Appendix). Given that we identify effects only aroundthe discontinuity, the number of observations limits the degree to which we canseparate out the effects. However, under the assumption that for all K, θ K = θ,
PKr = Pr, and PK
l = Pl, we can rewrite expression (3) as
yf = θ
N∑K=1
DKf t +
[Pr
(N∑
K=1
vKf t, γ
K,r
)+ Pl
(N∑
K=1
vKf t, γ
K,l
)]+ uf t. (6)
The coefficient θ is the average causal effect of a proposal. To allow for moreflexibility than this arguably restrictive but practical assumption allows, we letθ vary by two relevant groups of proposals (antitakeover provisions vs. otherproposals). We also let the effect of θ be nonlinear in the number of proposals
13 This yields the Intent To Treat (ITT) estimator in Cellini, Ferreira, and Rothstein (2010), whodemonstrate how to derive Treatment On the Treated (TOT) estimates in the dynamic regressiondiscontinuity setting. For our daily shareholder return regressions, ITT and TOT are identicalsince there is only one election per year and hence no intervening elections between t and t + 7where t is measured in days.

1958 The Journal of Finance R©
Figure 3. Distribution of vote shares for other shareholder governance proposals. Theleft panel includes G-index proposals (N = 1,558) and the right panel includes all “Other” share-holder proposals (N = 2,426) from 1997 to 2007.
passed. As we will see, the effect is approximately linear. When we restrictour analysis to meetings in which only one governance proposal is voted on (inwhich case we do not need to aggregate across proposals), we obtain resultssimilar to those using multiple votes in a day. Thus, expression (6) appears tobe a good way to summarize the data.
When we put together expressions (5) and (6 ), which recognize the dynamicstructure of the data and the need to aggregate over N proposals, we obtainour estimating expression
yf ,t+τ = θτ
N∑K=1
Df t +[
Pr
(N∑
K=1
vKf t, γ
K,rτ
)+ Pl
(N∑
K=1
vKf t, γ
K,lτ
)]+ ατ + ηc
+λ f t + e f tτ .(7)
Throughout the paper, we use a polynomial of order four on either sideof the threshold. The Internet Appendix shows that our results are similarwhen using higher order polynomials, indicating that we are capturing a trulydiscontinuous effect.
III. Election Votes as a Quasi-Experiment: Vote Distribution andPreexisting Differences
The basic assumption of the regression discontinuity design is that, aroundthe threshold, passing a proposal is as good as random assignment. Here,we provide a standard test of this assumption that evaluates whetherthe distribution of votes is continuous around the majority threshold. Figure 3shows the distribution of the vote share (the percentage of votes in favor) forproposals to remove antitakeover provisions (those included in the G-index),and Other proposals to increase shareholder control (including compensation,board-related, and auditor-related proposals). If there were sharp changes inthat distribution around the threshold, this would indicate that the probabilityof falling on either side of the threshold is discontinuous and that the main

The Vote Is Cast 1959
identification assumption is not likely to hold (McCrary (2008)). We see thatthe distribution is smooth around the threshold.14
Figure 3 also shows that antitakeover proposals are more likely to fall aroundthe discontinuity. Since our estimates are identified only from observationsaround the discontinuity, this implies that most of the effect we estimate comesfrom the passage of antitakeover provisions. It also limits the extent to whichwe can try to identify the effects of different subgroups since we do not haveenough observations around the threshold.
A second standard test of the regression discontinuity design evaluateswhether, prior to the day of the vote, there were systematic differences inthe characteristics of firms that fall on either side of the threshold. The mainassumption of the design is that there are no systematic differences in charac-teristics from firms that marginally pass, relative to those that marginallyreject, a proposal. The first column in each panel of Table III evaluateswhether, before the meeting, firms that pass a proposal have different char-acteristics from firms that reject a proposal. The regressions in column 1 donot control for a polynomial in the vote share, and hence they estimate theaverage predifference in characteristics across all firms. The regressions incolumn 2 include the polynomials of order four on either side of the threshold,and thus they estimate the effect at the discontinuity. We see that there is nosignificant difference in abnormal returns on the day before the meeting, in1-week cumulative returns, in 1-month cumulative returns (panel A), or in To-bin’s Q, capital expenditures, return on equity, or R&D over assets in the yearbefore the meeting (panel B). There is no difference in the growth rates of thosevariables, on average (column 3), and, most importantly for our identification,around the discontinuity (column 4), which indicates the absence of preexistingdifferences. Panel C examines two acquisitions variables (number and value ofacquisitions), and neither has significant differences around the threshold.
Next, we examine differences in ownership concentration for institutionalowners (panel D). As mentioned, the presence of institutional owners is likelyto be a determinant of the outcome of the vote. In column 1, panel D, we findthat a proposal is indeed more likely to pass in firms with a high reportedconcentration of institutional owners (measured as the sum of institutionalownership for the top five shareholders in the last fiscal quarter before themeeting) or with more institutional owners that report owning at least 5% ofshares outstanding.15 This confirms the fact that one cannot directly comparefirms with or without governance provisions in place since these are different
14 We perform the formal density test for smoothness of the vote share suggested in McCrary(2008) and cannot reject smoothness around the majority threshold. See the Internet Appendix.Listokin (2008) also reports a smooth distribution of shareholder-sponsored proposals around themajority threshold as evidence of lack of strategic behavior. However, he shows that managementproposals (which are excluded from our analysis) display a very sharp discontinuity in the densityof votes at the majority threshold. Essentially, these rarely fail, as management strategicallywithdraws those proposals that are likely to fail.
15 These two variables are computed using SEC Form 13F quarterly filings, provided by ThomsonFinancial.

1960 The Journal of Finance R©
Table IIIPre-existing Differences in Firm Characteristics as a Function of the
Vote OutcomeThe table tests whether passing a vote on the meeting date is systematically related to firmcharacteristics prior to the meeting. Note that in panel A t refers to days, in panels B to E, trefers to years. Each row corresponds to a different dependent variable and each entry comesfrom a separate regression. Each entry in the table reports the coefficient on whether a proposalpassed. Columns 1 and 2 (3 and 4) report the estimated effect of passing a vote on outcome variablelevels (changes) the year before the annual meeting, t–1 (between t–2 and t–1). Columns 1 and 3present estimates without controlling for a polynomial in the vote share and, therefore, estimatethe average effect of passing relative to not passing. Columns 2 and 4 include the polynomial in thevote share of order four on each side of the threshold such that it effectively estimates the effectat the discontinuity. All columns control for year fixed effects and standard errors (in parentheses)are clustered at the firm level. Significance at the 10%, 5%, and 1% levels is indicated by ∗, ∗∗, and∗∗∗, respectively.
Before meeting (t–1)Change from (t–2) to
(t–1)
(1) (2) (3) (4)
Panel A
Abnormal return 1 day before meeting, −0.00002 −0.004 n.a. n.a.Car (–1, –1) (0.001) (0.003)
Cumul. returns 1 week before meeting −0.0002 0.0068 n.a. n.a.(0.002) (0.0079)
Cumul. returns 1 month before meeting −0.0024 0.0006 n.a. n.a.(0.0034) (0.0156)
Panel B
Tobin Q −0.010 0.254 0.014 0.041(0.068) (0.191) (0.029) (0.101)
Capital expenses/Assets −0.001 −3.88 × 10⁻⁶ −0.002 0.003(0.003) (0.006) (0.001) (0.003)
Return on equity 1.65 −0.83 1.63 −0.69(1.63) (1.2) (1.68) (1.21)
R&D/Assets 0.003 −0.002 −0.00002 0.002(0.002) (0.006) (0.001) (0.001)
Panel C
Acquisitions ratio 0.007 −0.04 −0.023 −0.021(0.010) (0.041) (0.010) (0.073)
Acquisitions count −0.124∗ 0.193 −0.067 0.305(0.070) (0.21) (0.064) (0.267)
Panel D
Percentage ownership by top five shareholders 3.121∗∗∗ −0.856 0.092 0.849(0.616) (1.255) (0.217) (0.83)
Institutional shareholders that own at least 5% 0.319∗∗∗ −0.24 0.018 0.29(0.072) (0.199) (0.049) (0.204)
Panel E
G-index 1.242∗∗∗ −0.514 −0.078 −0.101(0.180) (0.391) (0.051) (0.173)
Polynomial in the vote share no yes no yes

The Vote Is Cast 1961
kinds of firms. However, once we include the polynomial in the vote share incolumn 2 of panel D, we see that there is no significant difference around thethreshold, which lends support to our identifying assumption.
Similarly, one expects that firms with different levels of shareholder rights,as measured by the G-index, have different propensities to pass shareholders’governance proposals. Column 1 of panel E shows that firms with a higherG-index (more antitakeover provisions in place) are more likely to pass theshareholder proposals. However, firms around the vicinity of the discontinuitydo not differ along this dimension, which further supports the paper’s basicidentifying assumption. Finally, we also examine a number of additional meet-ing characteristics, such as the number of proposals, the number of withdrawnproposals prior to the annual meeting, and the identity of the proponent, andwe find no evidence of preexisting differences at the discontinuity (see theInternet Appendix). Overall, we find no evidence of selection into either sideof the discontinuity based on observable variables. This lends support to ouridentification strategy, which is specifically designed to be unaffected by anyvariable (observable or unobservable) that is continuous in the vote share.However, there is still scope for effects that change discontinuously at the ma-jority threshold as a result of the vote. For example, if management changes itsannouncements at the meeting upon seeing that a proposal passed by a smallmargin, this interim reaction will be incorporated in prices. Our estimate canbe interpreted as capturing a governance effect only to the extent that suchchanges can be interpreted as indicative of governance improvements or indi-rect effects of passing a proposal.
IV. Results
A. Market Reaction to Exogenous Changes in Governance
A.1. The Effect of Governance Proposals on Abnormal Returns
Table IV reports estimates of the difference in abnormal returns betweenproposals that pass and proposals that do not pass for increasingly small in-tervals around the election threshold on the day of the vote (standard errorsare clustered by firm). Column 1 estimates this difference on the whole sample,and shows that there is no difference, on average, between those proposals thatpass and those that fail (a highly insignificant estimate of 0.0009). The lack ofsignificant results is driven by votes that pass or are rejected by a large margin(e.g., by more than a 10% margin as reported in column 2). This possibly re-flects the fact that these nonclose votes are highly predictable and the marketincorporates the expectation in the prices prior to the vote. Column 3 restrictsthe sample to proposals that fall within 10 percentage points of the threshold,and here we begin to see a higher estimate (0.002—that is, 0.2% daily abnor-mal return) and a smaller standard error. For votes within five percentagepoints of the threshold, the abnormal return is 0.76% higher for those thatpassed (significant at the 1% level), and as we narrow the window even fur-ther to two percentage points (column 5) and one percentage point (column 6)

1962 The Journal of Finance R©
Table IVAbnormal Returns around the Majority Threshold
This table presents regressions of the abnormal returns on the day of the meeting t = 0 on whetherthe proposal passed. Abnormal returns are computed using the Fama–French and momentumfactors from Carhart (1997). Column 1 estimates are based on the whole sample. Column 2 restrictsthe sample to nonclose votes, that is, votes beyond 10 points of the threshold. Column 3 restrictsthe sample to observations with a vote share within 10 points of the threshold, column 4 to fivepoints, and so forth. Column 7 introduces a polynomial in the vote share of order four, one on eachside of the threshold, and uses the full sample. All columns control for year fixed effects; standarderrors are clustered by firm. Significance at the 10%, 5%, and 1% levels is indicated by ∗, ∗∗, and∗∗∗, respectively.
All Shareholders Proposals
(1) (2) (3) (4) (5) (6) (7)All Votes Nonclose −10; +10 −5; +5 −2; +2 −1; +1 Full Model
Pass 0.000922 −0.000071 0.00230 0.00761∗∗∗ 0.0105∗∗ 0.0139∗ 0.0131∗∗∗
(0.000924) (0.0012) (0.00163) (0.00256) (0.00502) (0.00756) (0.00494)Observations 3904 2990 909 450 183 91 3904R2 0.000 0.000 0.002 0.024 0.032 0.039 0.014
the abnormal return of passing increases to 1.05% and 1.39%, respectively.These figures are still significant, even though the number of observationsfalls as we narrow the window.16
Finally, column 7 makes use of all the data in the sample (as described inSection II.A) and introduces two polynomials of order four in the vote share,one on each side of the threshold (as in expression (3)). Using this model, weestimate that the effect of passing a proposal is 1.3%, which is very close to theresults of the unrestricted models of the earlier columns.17
Figure 4 shows the day-by-day difference in abnormal returns between firmsin which a proposal passes or fails within five percentage points on either sideof the majority threshold. We observe a clear peak in the difference in returnsbetween firms that pass and firms that do not pass a proposal on the day ofthe vote, t = 0 (this is the same as the coefficient in column 4 of Table IV). Forother days around the annual meeting, there are no clear spikes or discerniblepattern. This shows that the market incorporates the outcome of the vote onthe day of the vote itself—when the outcome is known—and not before.
Table IV is a simple and transparent representation of our data, but it doesnot take into account the possibilities that several proposals can be voted on in1 day, that the effect of the vote can potentially persist over more than 1 day, orthat the returns are likely to be correlated over time, given that they respondto the same events. In order to incorporate these characteristics of the data,we use the full model described in expression ( 7). The results are reported in
16 In the Internet Appendix, we find a similar pattern on both types of proposals, that is anti-takeover provisions and all other proposals. Within one percentage point of the interval, passingan antitakeover provision yields a 2.2% abnormal return on the day of the vote.
17 We also test the robustness of our estimates to narrowing the vote-share window and simul-taneously including a polynomial in the vote share and obtain similar results.

The Vote Is Cast 1963
-0.006
-0.004
-0.002
0
0.002
0.004
0.006
0.008
0.01
-11 -9 -7 -5 -3 -1 1 3 5 7 9 11 13 15 17 19 21 23 25 27 29
Diff. in excess returns between Pass and Fail
in [-5;+5] interval
Day rela�ve to mee�ng date
Figure 4. Day-by-day difference in excess returns, vote share in [−5;+5] interval. The y-axis measures the difference in daily excess returns between proposals that pass by a close margin[up to +5%] and proposals that are rejected by a close margin [up to −5%]. The x-axis shows thedifferent days before and after the vote (date 0 is the day when the vote is passed).
Table V. Column 1 displays the effect of passing a proposal on the meeting date(t), the day after (t + 1), and over the t + 2 to t + 7 period. We find that most ofthe effect (1.3% abnormal return) is on the day of the vote, when the surprisearound the threshold occurs. The following 6 days yield an additional returnof 1.2%, suggesting that there is no reversal of the effect. While this 1.2% isnot statistically significant, the total cumulative effect after 1 week (2.4%) issignificant at the 10% level. Given the difference in precision between the twoestimates, throughout the paper we favor the 1.3% 1-day return as our moreconservative but more precisely estimated coefficient of the market responseto passing a proposal. Column 2 shows similar results using a different modelto compute the daily abnormal returns (a standard one-factor market modelinstead of the three-factor Fama–French with momentum that we use in therest of the analysis).
Overall, we find that, most of the effect on prices occurs on the day of thevote. In column 3, we further explore what happens on that day by allowingfor a more flexible specification of the effect of the number of votes on daily re-turns (recall that the model in expression (7) sums over the votes of the day toaggregate over all the different outcomes). Here, we allow for different dummyvariables for the number of proposals that passed, with a maximum of six pro-posals passing in a given meeting day. We find that the effect is monotonicallyincreasing and approximately linear in the number of proposals. Therefore,the linearity assumption in the model in Section II.B.2 seems appropriate (theeffect of passing one proposal is 1.3%, similar to our baseline estimate; passingtwo proposals yields a 2.2% abnormal return; three and four proposals yield
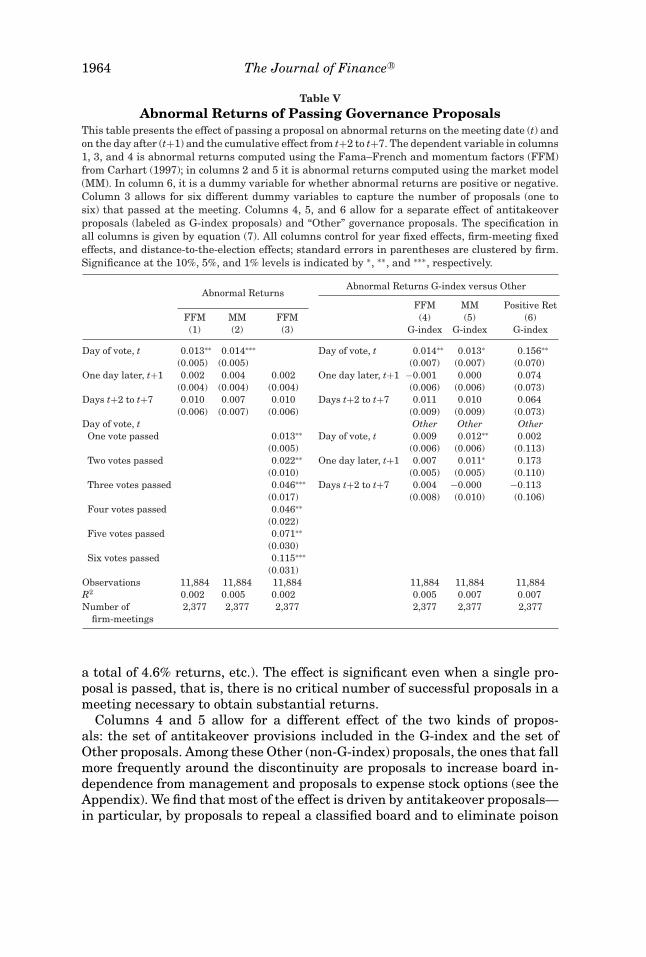
1964 The Journal of Finance R©
Table VAbnormal Returns of Passing Governance Proposals
This table presents the effect of passing a proposal on abnormal returns on the meeting date (t) andon the day after (t+1) and the cumulative effect from t+2 to t+7. The dependent variable in columns1, 3, and 4 is abnormal returns computed using the Fama–French and momentum factors (FFM)from Carhart (1997); in columns 2 and 5 it is abnormal returns computed using the market model(MM). In column 6, it is a dummy variable for whether abnormal returns are positive or negative.Column 3 allows for six different dummy variables to capture the number of proposals (one tosix) that passed at the meeting. Columns 4, 5, and 6 allow for a separate effect of antitakeoverproposals (labeled as G-index proposals) and “Other” governance proposals. The specification inall columns is given by equation (7). All columns control for year fixed effects, firm-meeting fixedeffects, and distance-to-the-election effects; standard errors in parentheses are clustered by firm.Significance at the 10%, 5%, and 1% levels is indicated by ∗, ∗∗, and ∗∗∗, respectively.
Abnormal Returns G-index versus OtherAbnormal Returns
FFM MM Positive RetFFM MM FFM (4) (5) (6)(1) (2) (3) G-index G-index G-index
Day of vote, t 0.013∗∗ 0.014∗∗∗ Day of vote, t 0.014∗∗ 0.013∗ 0.156∗∗
(0.005) (0.005) (0.007) (0.007) (0.070)One day later, t+1 0.002 0.004 0.002 One day later, t+1 −0.001 0.000 0.074
(0.004) (0.004) (0.004) (0.006) (0.006) (0.073)Days t+2 to t+7 0.010 0.007 0.010 Days t+2 to t+7 0.011 0.010 0.064
(0.006) (0.007) (0.006) (0.009) (0.009) (0.073)Day of vote, t Other Other OtherOne vote passed 0.013∗∗ Day of vote, t 0.009 0.012∗∗ 0.002
(0.005) (0.006) (0.006) (0.113)Two votes passed 0.022∗∗ One day later, t+1 0.007 0.011∗ 0.173
(0.010) (0.005) (0.005) (0.110)Three votes passed 0.046∗∗∗ Days t+2 to t+7 0.004 −0.000 −0.113
(0.017) (0.008) (0.010) (0.106)Four votes passed 0.046∗∗
(0.022)Five votes passed 0.071∗∗
(0.030)Six votes passed 0.115∗∗∗
(0.031)Observations 11,884 11,884 11,884 11,884 11,884 11,884R2 0.002 0.005 0.002 0.005 0.007 0.007Number of 2,377 2,377 2,377 2,377 2,377 2,377
firm-meetings
a total of 4.6% returns, etc.). The effect is significant even when a single pro-posal is passed, that is, there is no critical number of successful proposals in ameeting necessary to obtain substantial returns.
Columns 4 and 5 allow for a different effect of the two kinds of propos-als: the set of antitakeover provisions included in the G-index and the set ofOther proposals. Among these Other (non-G-index) proposals, the ones that fallmore frequently around the discontinuity are proposals to increase board in-dependence from management and proposals to expense stock options (see theAppendix). We find that most of the effect is driven by antitakeover proposals—in particular, by proposals to repeal a classified board and to eliminate poison

The Vote Is Cast 1965
pills. This is partly because there are more G-index proposals that fall aroundthe discontinuity, so we can estimate them more precisely. This also reflects thefact that G-index proposals are thought to have a potentially greater impactin insulating managers to pursue their private goals. However, we also findpositive, albeit somewhat smaller and less precisely estimated, effects of otherkinds of proposals, which have received less attention in the literature.
Finally, we replace abnormal returns with a dummy variable that indicateswhether the returns were positive or negative. This estimate ignores the mag-nitude of abnormal returns but is less sensitive to the presence of outliers.Column 6 shows that, on the day of the vote, G-index proposals that passedby a small margin were 16% more likely to lead to a positive abnormal returnthan those that failed by a small margin.
In sum, we find that there is a significant 1.3% average price reaction toproposals that pass by a small margin relative to those that fail by a smallmargin.18 We argue that the regression discontinuity design allows us to obtaina causal estimate that is not driven by omitted variables or unobserved firmcharacteristics. In Section IV.C below, we study the long-term effects of thesevotes to assess the evidence on different possible explanations for the positiveprice reaction.
A.2. Heterogeneous Effects of Governance Proposals
The previous section provides an estimate of the average effect of passinga governance proposal. However, it is likely that firms with different charac-teristics may have different quantitative responses to passing a governanceproposal. In this section, we study whether the effect of passing a governanceproposal is different in different types of firms and when governance provisionsmatter more.
One would expect that firms with large institutional shareholders (who areamong the most active ones) might respond differently from firms with lowinstitutional ownership. Column 1 of Table VI reproduces the analysis of TableV, restricting the sample to firms with above-median concentration of the topfive institutional owners. We find that they respond more to passing a provisionthan firms with more dispersed ownership. In particular, column 1 of Table VIshows that passing a G-index shareholder proposal in concentrated-ownershipfirms elicits a 2.1% abnormal return on the day of the meeting, with a furthercumulative return of 2.1% in the 7 days after the meeting. The cumulative ef-fect after 1 week in firms with concentrated ownership is 1.76 times the effectfor the whole sample. This may reflect that these firms are more closely moni-tored and therefore the proposal is more likely to be implemented. It may alsoreflect that the value of these provisions is higher for these firms, suggestingthat governance proposals and monitoring are complements. In column 2, we
18 This is a large and significant effect, in contrast with the generally small or insignificantresults found when using the mailing date as an event study (see Gillan and Starks (2000),Thomas and Cotter (2007)).

1966 The Journal of Finance R©
Table VIAbnormal Returns and Firm Heterogeneity
This table presents the effect of passing a proposal on abnormal returns on the meeting date (t) andon the day after (t+1) and the cumulative effect from t+2 to t+7 for different subsamples of firms.The dependent variables in all columns are abnormal returns computed using the Fama–Frenchand momentum factors from Carhart (1997). Column 1 includes firms with above-median owner-ship concentration (percentage controlled by the top five institutional owners); column 2 includesfirms with 10 or more antitakeover provisions (above-median G-index) before the meeting; col-umn 3 includes firms with above-median R&D/assets. Columns 1 to 4 allow for a separate effectof antitakeover proposals (labeled as G-index proposals) and Other governance proposals. Column5 uses the whole sample and allows for a separate effect of proposals by individual and institu-tional/activist shareholders. The specification in all columns is given by equation (7). All columnscontrol for year fixed effects, firm-meeting fixed effects, and distance-to-the-election effects; stan-dard errors in parentheses are clustered by firm. Significance at the 10%, 5%, and 1% levels isindicated by ∗, ∗∗, and ∗∗∗, respectively.
G-index versus Other Proponents
HighOwnership Active High High Activist
Concentration Sharehold. G-Index R&D Proponent(1) (2) (3) (4) (5)
Day of vote, t G-index 0.021∗∗ 0.025∗∗ 0.019∗∗ 0.018∗ Institutional 0.021∗∗
(0.010) (0.010) (0.009) (0.010) (0.008)One day later, t+1 G-index 0.002 0.004 0.001 0.005 Institutional 0.007
(0.008) (0.007) (0.007) (0.010) (0.006)Days t+2 to t+7 G-index 0.019∗ 0.010 0.023∗∗ 0.005 Institutional 0.015∗∗
(0.010) (0.011) (0.011) (0.013) (0.008)
Day of vote, t Other 0.009 0.012 0.010 0.008 Individuals 0.008(0.008) (0.009) (0.010) (0.009) (0.007)
One day later, t+1 Other 0.012∗ 0.015∗ 0.008 0.012 Individuals −0.001(0.007) (0.008) (0.011) (0.008) (0.006)
Days t+2 to t+7 Other 0.004 −0.008 0.008 −0.006 Individuals 0.005(0.011) (0.012) (0.015) (0.012) (0.010)
Observations 5,919 2,579 5,704 4,320 11,819R2 0.016 0.046 0.012 0.017 0.005Number of 1,184 516 1,141 864 2,364
firm-meetings
restrict the sample to firms that have been exposed to some degree of activistshareholder pressure. We proxy for shareholder pressure using the number ofprior shareholder proposals (i.e., had two or more shareholder-sponsored pro-posals in the previous two meetings) and find that, in those firms, the effect ofpassing a G-index proposal is quite high at 2.5% on the day of the meeting.
We also analyze whether the identity of the proponent is related to theprice response to passing a proposal. Some proposals are introduced by well-established activist funds or institutional shareholders, while others are putforth by individuals. We might expect larger effects for institutional activists’proposals if they more accurately reflect the needs of the firm and are also morelikely to be implemented. Column 5 separately evaluates the effect of passingfor proposals by two different groups of proponents: proposals by individuals

The Vote Is Cast 1967
(which constitute around 50% of the sample) and proposals by institutionalactivists (these include pension funds, investment funds, companies, and otherinstitutional shareholders). We find that institutional activists’ proposals havehigher effects, with an abnormal return of 2.1% on the day of the vote and afurther 2.2% over the following 6 days. For individual proponents, the cumu-lative effect after 1 week is just 1.1%, and it is not statistically different fromzero.
It is also important to determine if there is a critical number of provisionsthat shield the firm against external discipline. The value of removing an an-titakeover provision may be different in firms with many provisions in placerelative to those with few, which are already relatively unprotected. Column3 shows the effect of passing a proposal for firms with more than 10 (median)G-index provisions in place on the day of the meeting. We find that those firmsbenefit more from the removal of takeover barriers. In particular, passing aG-index shareholder proposal yields a 1.9% abnormal return on the day ofthe vote and a further 2.4% abnormal return over the following 7 days. Thecumulative effect after 1 week is 6.6%, that is, 2.64 times the effect for thewhole sample. Antitakeover provisions seem to be more effective when bun-dled together with many others. In contrast, when firms are already relativelyunprotected from takeovers, dropping a further provision has a more modestimpact on governance.
The previous analysis shows that, on average, passing a proposal that im-proves shareholder rights increases shareholder value. However, it is possiblethat excessive shareholder rights could lead managers to focus excessively onthe short run at the expense of the long run (Stein (1988)). If this were the case,firms in which long-run investments are important might respond negativelyto these governance proposals. We proxy for the long-term nature of firms’investment by their R&D expenditures. Column 4 estimates our basic modelfor firms with an above-median R&D-to-assets ratio prior to the meeting. Wefind that the effect for these firms (1.8%) is, if anything, larger than the re-sult for the whole sample (1.3%), indicating that there is no different responseregarding this dimension of long-run investments. The change in abnormalreturns due to changes in the governance structure is also positive for thesefirms.
The regression discontinuity estimate is the weighted average effect acrossall firms and proposals, where more weight is given to those votes in which aclose election was expected (Lee and Lemieux (2010)). In our case, as we men-tion earlier, the elimination of staggered boards and poison pills represents68% of G-index proposals falling around the discontinuity, implying that thoseproposals have a bigger weight in the identification. In terms of how muchone can extrapolate the results of our analysis to other firms, one must takeinto account the fact that, within listed firms, those that are larger, less prof-itable, and have a higher level of institutional ownership tend to be targetedby shareholder proposals more often (Karpoff, Malatesta, and Walkling (1996),

1968 The Journal of Finance R©
Romano (2001)).19 However, within the set of firms that are the target of aproposal, we know from Section III that there are no systematic differences be-tween firms on either side of the threshold, which means there is no evidenceof selection into treatment.
A.3. Implementation and the Probability of Passing Future Proposals
Ertimur, Ferri, and Stubben (2010) show that the average probability that aproposal that passes will be implemented is 31.1%. For proposals that are closerto the threshold, the probability of implementation after passing increases by20.7%.20 While data on whether each proposal in our sample was implementedare not publicly available, we know how the value of the G-index changes overtime for most firms in our sample. The G-index is the number of antitakeoverprovisions in place at a point in time. We can evaluate how it responds tothe passage of a provision at the discontinuity. This serves as a proxy for thenet effect on implementation of passing a proposal that incorporates not onlythe direct effect of passing the particular issue voted on, but also effects onother proposals being passed and implemented—both contemporaneously andin the future. Column 1 of Table VII shows the effect of passing a governanceproposal on the G-index. The index is available only every 2 years. Hence, thefirst coefficient is the effect on the first year available after the focal meeting(this can be between 1 and 2 years after the meeting, depending on whenthe vote occurred relative to the G-index years), and the second coefficientis 2 years later, etc. We find that the probability of implementation increasesdiscretely around the discontinuity. Thus, proposals that pass by a small marginare substantially more likely to be implemented relative to those that fail.Passing a proposal reduces the G-index by 0.313, which we interpret as a31.3% probability of removing an antitakeover provision within 2 years. Thatnumber grows in subsequent years, and within 4 years the probability is 50%.This indicates, among other things, that when a proposal is passed but notimplemented, shareholders are likely to propose it again.21
19 In the Internet Appendix, we display firm characteristics across different samples. We seethat the sample of firms with close-call votes is relatively similar to the S&P 1500: book-to-market, return on equity, and cash flow over assets are not statistically different. While differencesin return on assets and capital expenditures are statistically significant, they are economicallysmall, at 0.8% and 0.3%, respectively. In addition, in the Internet Appendix we show that firmswith observations around the discontinuity are not “extreme” observations, but rather firms withaverage characteristics in terms of institutional ownership and Tobin’s Q.
20 They estimate that the probability of implementation from proposals that obtain 50% to 60%of the vote in favor is 23.9%. The probability that a proposal that failed will be implemented is3.2%. We obtain 20.7% as the difference between the two. See Table I, panel D and footnote 9 inErtimur, Ferri, and Stubben (2010).
21 Passing a governance proposal in a given meeting is also likely to affect the probability ofsubmitting and passing other proposals in the future. In an earlier version, we estimate thesedynamic effects in our data and find that passing G-index proposals makes it more likely thatother proposals will be passed in the future (unreported).

The Vote Is Cast 1969
Table VIIEffect of Passing a Governance Proposal on the G-index
Column 1 shows the effect of passing a governance proposal on the number of antitakeover pro-visions in place at the firm (the G-index). The index is provided by Riskmetrics every 2 years.The first coefficient (Year of vote, t) is the effect of passing a proposal on the G-index for the firstyear available in Riskmetrics that is at least 6 months after the meeting; the second coefficientis the effect 2 years after that, etc. Column 2 allows for six different dummy variables to capturethe number of proposals (one to six) that passed at the meeting. The specification in all columnsis given by equation (7). All columns control for year fixed effects, firm-meeting fixed effects, anddistance-to-the-election effects; standard errors are clustered by firm. Significance at the 10%, 5%,and 1% levels is indicated by ∗, ∗∗, and ∗∗∗, respectively.
G-index
(1) (2)
Year of vote, t −0.313∗∗∗(0.102)
Two years later, t+2 −0.329∗∗ −0.329∗∗(0.150) (0.149)
Four years later, t+4 −0.503∗∗ −0.505∗∗(0.229) (0.228)
Six years later, t+6 −0.507 −0.511(0.389) (0.389)
Year of vote, tOne vote passed −0.336∗∗∗
(0.108)Two votes passed −0.581∗∗∗
(0.217)Three votes passed −0.744∗∗
(0.318)Four votes passed −1.828∗∗∗
(0.589)Five votes passed −2.393∗∗∗
(0.562)
Observations 9,386 9,386R2 0.044 0.045Number of firm-meetings 2,198 2,198
B. The Value of a Governance Proposal
In the previous section, we find that passing a provision increased share-holders’ returns on the day of the vote by 1.3%. This is our estimate of Z, asdefined in Section I.B. However, the observed abnormal return does not fullyreflect the value from implementation; rather, it corresponds to the change inthe expectation of the proposal being implemented and the additional effect onthe submission and implementation of future governance proposals. In orderto recover the actual value of a proposal (W ) using expression (2), we need toknow (i) the probability that the provision will be implemented if passed, and(ii) the probability that other proposals will be passed and implemented in thefuture.

1970 The Journal of Finance R©
We use the G-index results from Table VII as a proxy for implemen-tation to estimate the value of the proposal to the firm. We show thatpassing a proposal reduces the number of G-index provisions by 0.31. Wealso find that 2 years later, the probability of passing and implementing is1.6% higher (pp
t+2 =0.329−0.313), and 2 years after that, it is 17.4% higher(pp
t+4 =0.503−0.329), etc. With these probabilities in hand and assuming a dis-count rate of 5%, we can use expression (1) to recover the value of a provision tothe firm. We estimate that one provision generates an increase of 2.8% in mar-ket value. This is a lower bound for the effect of implementing a governanceproposal that only takes into account the 1-day market reaction. Using theless conservative 1-week cumulative returns as our estimate for the market re-sponse (2.4%) would imply a value of implementing one proposal of up to 5.1%.Solving for Z in expression (1), one can also show that two-thirds of the effectis due to contemporaneous factors and one-third to dynamic considerations.22
A 2.8% increase in shareholder value per provision translates into approx-imately U.S.$600 million for the average firm in the sample (average marketvalue is U.S.$22,400 million in 1996 U.S. dollars). This is an economically size-able effect, especially when we consider the fact that firms often drop severalprovisions in subsequent meetings. Dropping 2.5 provisions (one standard de-viation of the G-index in the sample) translates into a nonnegligible predictedincrease in market value of 7%.
These estimates can be benchmarked against the 8.5% annualized returnthat Gompers, Ishii, and Metrick (2003) report when going long on the demo-cratic portfolio and short on the dictatorship portfolio over the 1990 to 1998period. Their result requires the strong assumption that the value of good gov-ernance was not fully understood in 1990 (otherwise the initial prices of bothportfolios should have already reflected the value of governance) and that it wasat least partially discovered during this period, either explicitly or implicitly,by observing the performance of different firms. Even under the assumptionthat the importance of antitakeover provisions was fully discovered between1990 and 1998, using our results we would have only predicted an annualizedreturn between 2.6% and 4.3%.23
C. Long-Run Effects of Governance
In this final section, we evaluate the effect of passing a governance proposalon long-term firm outcomes. Evaluating these real effects is important for de-termining why the firm’s market value increases following an improvementin shareholder rights and, in particular, following the removal of antitakeover
22 The abnormal return of 1.3% on the day of the vote can be decomposed, using equation (1),into 0.86% due to changes in governance within 1 year of the vote and 0.44% due to subsequentchanges.
23 The difference in average provisions between both portfolios is 9.4. The 2.6% return is obtainedusing our preferred (most conservative) estimate of 2.8% per provision. This implies a 26.3% returnover 9 years. The 4.3% is obtained using the full weekly returns with an implied value of a provisionof 5.15%.
The Vote Is Cast 1971
provisions. The increase in market value could simply reflect that the increasedprobability of a takeover may lead to a takeover premium. It could also resultfrom an improvement in internal governance and managerial discipline.24 Thiswould be the case if weak shareholder rights provided substantial protectivepower to standing managers (e.g., by insulating them from the takeover mar-ket), causing additional agency costs in the form of inefficient investments,reduced operational efficiency, and/or private benefits.
All regressions in Table VIII use the empirical model in expression (7) toestimate the effect of passing a governance proposal on a number of long-termoutcomes and to distinguish between the effects of antitakeover and Other pro-posals.25 Columns 1, 2, and 3 examine, respectively, whether the number ofacquisitions made by a firm, the growth of capital expenditures, and the book-to-market ratio change significantly in the years following the improvement inshareholder rights.26 One way in which improved governance can affect per-formance is through the reduction in unnecessary acquisitions, investments,and capital-expenditures growth. We compute the number and value of firmacquisitions from the SDC database, which records all transactions of at least5% of market value. We find that removing an antitakeover provision reducesthe number of acquisitions made in the years following the vote (column 1).This effect is long-lived and exhibits interesting dynamics. The number fallsby 0.03 the year after the vote, 0.17 two years later, and 0.18 three years later(only this last coefficient is significant though).27 Column 2 shows that thegrowth of capital expenditures also seems to decline after a vote to eliminateG-index provisions. These results suggest a less aggressive growth policy forbetter-governed firms and give support to empire building, excessive size, andfree cash flow problems as manifestations of poor governance. For other typesof provisions the effect is reversed, and capital expenditures actually increasea few years after the vote, but this is subject to the limitations of the datafor those proposals at long durations mentioned earlier. Finally, we find somelong-term performance improvements following these exogenous changes ingovernance. Column 3 of Table VIII shows that the book-to-market ratio of the
24 We tested directly (unreported) whether the proposals had an effect on the probability ofbeing taken over using firm delisting information from CRSP. Firms that pass more proposalsare more likely to be acquired but we find no significant difference around the discontinuity intakeover probabilities. However, conclusively establishing this result would require a separateanalysis given the relatively low frequency of such events and given that the endogenous changein manager behavior will reduce observed takeover probabilities.
25 To avoid the effect of outliers, for each column of Table VIII we restrict the sample to firm-votes that do not have any observation in the top or bottom 5% of the distribution of the dependentvariable. The results are not sensitive to this particular outlier cutoff but are sensitive to theinclusion of outliers.
26 Since we are looking at effects up to 4 years after the vote, we cannot estimate the long-runeffects for proposals at the end of the sample. This is particularly problematic for Other proposalsbecause they are more frequent toward the end of the sample. Our very demanding identificationin terms of data requirements (fixed effects, clustering, discontinuity) is bound to yield largerstandard errors.
27 We find a similar pattern for the value of these acquisitions (see the Internet Appendix).

1972 The Journal of Finance R©
Table VIIILong-Run Effects of Governance Proposals
This table presents the effect of passing a governance proposal on firm long-term outcomes. Thespecification in all columns is given by equation (7). All columns allow for a separate effect of anti-takeover proposals (labeled as G-index proposals) and Other governance proposals. The dependentvariables are: the number of acquisitions in column 1, the growth rate of capital expendituresin column 2, and book-to-market value of the firm in column 3. See notes to Table II for furthersources and definitions. Standard errors in parentheses are clustered by firm. Significance at the10%, 5%, and 1% levels is indicated by ∗, ∗∗, and ∗∗∗, respectively.
Acquisitions Count Capex Growth Book-to-Market(1) (2) (3)
Year of meeting, t G-index −0.00102 −0.0797 −0.0172(0.120) (0.0541) (0.0270)
One year later, t+1 G-index −0.0305 −0.117∗∗ −0.0255(0.102) (0.0577) (0.0337)
Two years later, t+2 G-index −0.166 −0.0411 −0.0648∗(0.109) (0.0664) (0.0342)
Three years later, t+3 G-index −0.180∗ −0.00382 −0.0970∗∗∗(0.108) (0.0671) (0.0362)
Four years later, t+4 G-index 0.166 −0.0922 −0.0941∗∗(0.134) (0.0648) (0.0419)
Year of meeting, t Other 0.0384 0.114 −0.0607∗∗(0.122) (0.0832) (0.0254)
One year later, t+1 Other 0.135 0.0161 −0.107∗∗(0.132) (0.106) (0.0436)
Two years later, t+2 Other 0.316 0.157 0.00972(0.223) (0.103) (0.0724)
Three years later, t+3 Other 0.248 0.464∗∗∗ −0.0266(0.214) (0.144) (0.0447)
Four years later, t+4 Other 0.500∗∗ 0.664∗∗ 0.0444(0.253) (0.257) (0.101)
Observations 11,384 6,501 9,120R2 0.022 0.027 0.024Number of firm-meetings 1,797 1,524 1,817
firm falls significantly as a result of passing the governance proposals (bothG-index and Other). Given that the abnormal returns seem to be linear in thenumber of provisions passed (Table V, column 3), we also check whether thereal effects reported in this section also follow a linear pattern. The results(reported in the Internet Appendix) show a linear pattern of real effects. Thisis further evidence that links both effects. The Internet Appendix providesadditional long-term results.
Overall, we find that, as a result of the removal of antitakeover provisions,acquisitions and capital expenditures fall and firm valuation increases in thelong-run, which provides evidence of dynamic effects of governance well be-yond the year the proposal passed. In contrast, there is little effect on earnings(see also the Internet Appendix). Although some of these effects are impre-cisely estimated, this suggests that the abnormal returns that we identify in
The Vote Is Cast 1973
earlier sections as a result of governance improvements lead to actual changesin managers’ actions. Furthermore, if one is willing to interpret the marginalacquisitions and capital expenditures as value-destroying and a way in whichmanagers extract private benefits (e.g., through empire building), then our ev-idence suggests that corporate governance proposals that remove antitakeoverprovisions increase shareholder value through disciplining management and areduction in agency costs.
V. Conclusion
In this paper, we present novel evidence on the causal effect of corporategovernance provisions on firms’ market value and long-term performance. Weadapt the regression discontinuity design to the analysis of event studies andapply it to the outcomes of votes on governance proposals in shareholder meet-ings. Firms that pass a proposal by a close margin are ex ante similar to thosethat reject it by a close margin. Hence, passing a provision is “locally” exoge-nous, leading to a discrete increase in the probability of implementation. Thisapproach provides a causal estimate and overcomes the endogeneity problemsthat have affected the literature thus far. Our empirical strategy allows us torecover an estimate of the effect of governance even if, prior to the vote, themarket had already incorporated the probability of passing the shareholderproposal into stock prices. This is because proposals that fell around the major-ity threshold were, ex ante, the most uncertain, in which case investors couldnot perfectly predict whether they would pass. It is for these proposals that weare able to observe a price reaction. This strategy allows us to interpret ourresults as causal, overcoming the limitations of the existing literature.
We show that, on average, the market reacts to the passage of a governance-related shareholder proposal with positive abnormal returns of around 1.3%on the day of the vote. This reflects an increase in market value of 2.8% perimplemented proposal. We identify some heterogeneity of this reaction, withthe effect being more pronounced among firms with concentrated ownership,high preexisting antitakeover provisions, high R&D expenditures, and strongershareholder pressure, and for proposals made by institutional shareholdersrather than by individuals. However, while positive, the magnitude of our es-timated effects is between one-third and one-half of the estimates in Gompers,Ishii, and Metrick (2003).
Firm behavior also changes with new governance structures. Dropping anti-takeover provisions leads to lower investments and fewer acquisitions. Finally,the long-term performance of the firm, measured using Tobin’s Q or book-to-market ratios, improves after 2 or 3 years when antitakeover provisionsare dropped; nevertheless, we find modest results with respect to return onequity.
Our analysis also uncovers interesting dynamic effects. Passing a governanceproposal affects the chance of dropping a provision both now and in the future.In terms of shareholder returns, two-thirds of the effect is associated withcontemporaneous provision changes and one-third with future ones. The real

1974 The Journal of Finance R©
effects associated with governance changes are also dynamic, with some effectsmaterializing up to 4 years after a proposal passes.
As a whole, our results suggest that changing the internal corporate gov-ernance in targeted firms is rewarded by the market—with more pronouncedeffects for proposals to remove antitakeover provisions. These changes alsoyield performance improvements in the long run. The evidence indicates thatthe channels behind these improvements include more conservative investmentand acquisition policies.
A better understanding of the effect of governance provisions and the mag-nitude of the agency problem is crucial to guiding the public debate on theadequacy of implementing and regulating corporate governance. Our resultsprovide causal evidence that the value of improving governance inside firmsis sizeable. Our results also shed light on the potential role of shareholderactivism in improving the governance of firms and creating value. In particu-lar, our evidence suggests that shareholder activism and improved democracyinside firms can have large positive effects on shareholder value.
Appendix
Description of All Shareholder Proposals (Rismetrics 1997 to 2007)
Discontinuity
Type Description Proposal Observations Mean Vote For # –5, +5 # –10, 10 Frequ.
Audit Limit consulting by auditors 59 20.1 2 5Shareholder approval of auditors 7 48.0 2 3Rotate auditor 2 5.3 0 0 68
Board Separate chairman/CEO 224 28.2 15 33Majority independent directors 89 26.1 5 9Commit to/report on board
diversity60 16.7 0 1
Limit director tenure 54 6.3 0 1Independent nominating
committee24 25.7 2 2
Increase key committeeindependence
15 19.0 0 0
Allow union/employee reps. on theboard
11 7.7 0 0
Increase compensation committeeindependence
10 35.1 3 4
Minimum director stockownership
9 7.6 0 0
Independent compensationcommittee
7 18.8 0 0
Lead director 6 24.4 0 1Shareholder advisory committee 4 10.2 0 0Increase audit committee
independence4 19.5 0 0
Create nominating committee 3 24.7 0 0 520
(Continued)

The Vote Is Cast 1975
Appendix—Continued
Discontinuity
Type Description Proposal Observations Mean Vote For # –5, +5 # –10, 10 Frequ.
Compensation Link pay to performance/recoup bonuses
371 16.0 12 21
Award performance-basedstock options
114 23.6 6 17
Expense stock options 112 50.1 39 68Link executive pay to social
criteria109 8.2 0 0
Disclose executivecompensation
59 11.5 1 3
Advisory vote oncompensation
53 41.5 14 33
Misc compensation 42 25.6 3 10Cap executive pay 35 8.0 0 0Add performance criteria to
equity-based awards31 34.4 6 12
Restrict directorcompensation
29 9.6 0 0
Approve/disclose/limitSERPs
24 35.6 5 7
Pay directors in stock 23 11.8 0 0Restrict nonemployee
director pensions14 31.1 0 1
Pension fund surplusreporting
14 33.6 0 4
Require equity awards tobe held
12 27.5 0 0
No repricing underwaterstock option
11 31.6 3 4
Approve executivecompensation
4 31.3 0 1
Hire independentcompensation consultant
4 39.9 1 2 1,061
G-IndexG Delay Repeal classified board 549 57.5 116 219G Other Redeem or vote poison pill 355 57.7 77 132G Voting Cumulative voting 273 31.5 22 49G Protection Vote on future golden
parachutes152 44.4 19 56
G Voting Eliminate supermajorityprovision
109 62.7 16 32
G Other Remove antitakeoverprovisions & other
42 41.4 2 8
G Voting Confidential voting 39 52.7 7 16G Delay Shareholders may call
special meeting25 56.5 3 8
G Protection Compensation plans 6 18.7 0 0G Other Adopt antigreenmail 3 30.7 0 1G Protection Maximum director liability 3 15.5 0 0G Voting Require only majority vote 2 50.1 0 2 1,558
(Continued)

1976 The Journal of Finance R©
Appendix—Continued
Discontinuity
Type Description Proposal Observations Mean Vote For # –5, +5 # –10, 10 Frequ.
Other Study sell company 162 15.8 2 7Miscellanea 138 14.5 3 6Double board nominees 43 8.1 0 0Change annual meeting
location20 6.0 0 0
Reincorporate to U.S. state 15 25.5 0 2Change annual meeting
date12 4.4 0 0
Affirm politicalnonpartisanship
8 7.2 0 0
Vote on targeted shareplacement
4 42.4 0 3
Issue postmeeting report 3 5.5 0 0Opt out of state takeover
statute3 46.6 0 1
Disclose prior governmentservice
2 3.2 0 0
Improve postmeetingreport
2 6.6 0 0
Restore preemptive rights 1 27.5 0 0Nominee statement in
proxy1 9.1 0 0 416
Voting Majority vote to electdirectors
206 45.9 56 115
Majority vote shareholdercommittee
128 15.9 8 9
No discretionary voting 11 14.8 0 0Counting shareholder votes 6 15.4 0 0Equal access to proxy 5 22.0 1 2 356
REFERENCESAgrawal, Ashwini K., 2008, Corporate governance objectives of labor union shareholders: Evidence
from proxy voting, Working Paper FIN-08-006, Stern School of Business, New York University.Bebchuck, Lucian A., Alma Cohen, and Allen Ferrell, 2004, What matters in corporate governance?
Review of Financial Studies 22, 783–827.Becht, Marco, Patrick Bolton, and Ailsa Roell, 2005, Corporate governance and control, European
Corporate Governance Institute Working Paper.Bertrand, Marianne, and Sendhil Mullainathan, 2003, Enjoying the quiet life? Corporate gover-
nance and managerial preferences, Journal of Political Economy 111, 1043–1075.Brickley, James, Ronald C. Lease, and Clifford W. Smith, Jr., 1988, Ownership structure and
voting on antitakeover amendments, Journal of Financial Economics 20, 267–291.Carhart, Mark M., 1997, On persistence in mutual fund performance, Journal of Finance 52,
57–82.Cellini, Stephanie R., Fernando Ferreira, and Jesse Rothstein, 2010, The value of school facility
investments: Evidence from a dynamic regression discontinuity design, Quarterly Journal ofEconomics 125, 215–261.
Comment, Robert G., and William Schwert, 1995, Poison or placebo? Evidence on the deterrenceand wealth effects of modern antitakeover measures, Journal of Financial Economics 39, 3–43.

The Vote Is Cast 1977
Core, John E., Wayne R. Guay, and Tjomme O. Rusticus, 2006, Does weak governance cause weakstock returns? An examination of firm operating performance and investors’ expectations,Journal of Finance 61, 655–687.
Ertimur, Yonca, Fabrizio Ferri, and Stephen Stubben, 2010, Board of directors’ responsiveness toshareholders: Evidence from shareholder proposals, Journal of Corporate Finance 16, 53–72.
Garvey, Gerald T., and Gordon Hanka, 1999, Capital structure and corporate control: The effect ofantitakeover statutes on firm leverage, Journal of Finance 54, 519–546.
Gillan, Stuart L., and Laura T. Starks, 2000, Corporate governance proposals and shareholderactivism: The role of institutional investors, Journal of Financial Economics 57, 275–305.
Giroud, Xavier, and Holger M. Mueller, 2010, Does corporate governance matter in competitiveindustries? Journal of Financial Economics 95, 312–331.
Gompers, Paul A., Joy L. Ishii, and Andrew Metrick, 2003, Corporate governance and equity prices,Quarterly Journal of Economics 118, 107–155.
Jensen, Michael C., 1986, Agency costs of free cash flow, corporate finance, and takeovers, TheAmerican Economic Review 76, 323–329.
Kadyrzhanova, Dalida, and Matthew Rhodes-Kropf, 2011, Concentrating on governance, Journalof Finance 66, 1649–1685.
Karpoff, Jonathan, Paul Malatesta, and Ralph Walkling, 1996, Corporate governance and share-holder initiatives: Empirical evidence, Journal of Financial Economics 42, 365–395.
Lee, David, 2008, Randomized experiments from nonrandom selection in U.S. house elections,Journal of Econometrics 142, 675–697.
Lee, David, and Thomas Lemieux, 2010, Regression discontinuity designs in economics, Journalof Economic Literature 48, 281–355.
Listokin, Yair, 2008, Management always wins the close ones, American Law and EconomicsReview 10, 159–184.
McCrary, Justin, 2008, Manipulation of the running variable in the regression discontinuity design:A density test, Journal of Econometrics 142, 698–714.
Romano, Roberta, 2001, Less is more: Making shareholder activism a valuable mechanism ofcorporate governance, Yale Journal on Regulation 18, 174–251.
Shleifer, Andrei, and Robert W. Vishny, 1997, A survey of corporate governance, Journal of Finance52, 737–783.
Stein, Jeremy C., 1988, Efficient capital markets, inefficient firms: A model of myopic corporatebehavior, Quarterly Journal of Economics 104, 655–669.
Thomas, Randall, and James F. Cotter, 2007, Shareholder proposals in the new millennium:Shareholder support, board response and market reaction, Journal of Corporate Finance 13,368–391.