Dan Cayan Scripps Institution of Oceanography, Climate Research Division, UCSD

Seismological Research Letters September/October 2003 Volume 74, Number 5 641
The Visualization Center at Scripps Institution of Oceanography: Education and Outreach
D. Kilb, C. S. Keen, R. L. Newman, G. M. Kent, D. T. Sandwell, F. L. Vernon, C. L. Johnson, and J. A. Orcutt
Cecil H. and Ida M. Green Institute of Geophysics and Planetary Physics, University of California at San Diego
THE VISUALIZATION CENTER AT SCRIPPS
Since opening in March 2002, the Visualization Center atScripps has had more than 2,500 visitors, of which ~500 wereeducation- and outreach-related. Based upon follow-uprequests and referrals, we expect these numbers to grow. Thecenter’s state-of-the-art visualization technology projectshigh-resolution, multidimensional images onto a 120˚curved Panoram
®
floor-to-ceiling screen (8
′
6
″
by 28
′
4
″
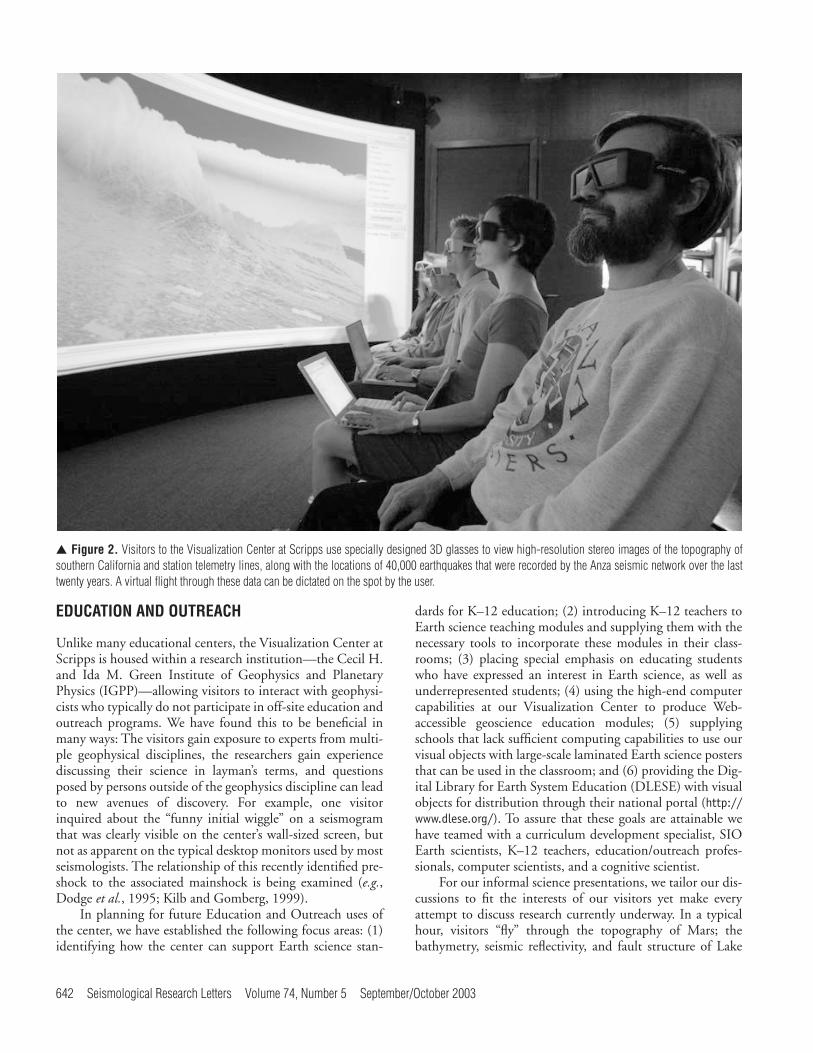
) thatimmerses viewers in a virtual environment (Figure 1). Thecenter is ideal for presenting and manipulating very large datasets to groups of up to 50 people, and the system is equippedwith transmitters and LCD shutter glasses that allow stereo-graphic 3D viewing of high-resolution data sets through a setof specialized eyeglasses (Figure 2). The lenses in the glassesflicker synchronously with the computer images at 48 framesper second, per eye, thus producing a stereo or 3D effect.
Multiple video streams can be simultaneously displayed,including the SGI
®
megadesktop, S-VHS video, DVD video,and video from a laptop computer; the user can quickly tog-gle between these various platforms (Kent
et al.
, 2002). Sim-ilarly, the five-channel surround-sound audio system can beintegrated through several inputs, allowing for numerousvideo and audio combinations. For instance, one third of thescreen can display S-VHS video of damaging earthquakes,while the remaining portion of the screen can show an inter-active underground 3D flight through seismicity in theregions presented in the video. Alternatively, the audio sur-round-sound system can be set to produce sounds of varioussynthetically generated earthquakes (
http://quake.wr.usgs.gov/info/listen/allsounds.html
), while the corresponding seis-micity, topography, and seismic station locations and teleme-try paths are juxtaposed on the screen with the associatedseismic waves.
�
Figure 1.
A group of visitors in the Visualization Center at Scripps view the topography of Mars.
642 Seismological Research Letters Volume 74, Number 5 September/October 2003
EDUCATION AND OUTREACH
Unlike many educational centers, the Visualization Center atScripps is housed within a research institution—the Cecil H.and Ida M. Green Institute of Geophysics and PlanetaryPhysics (IGPP)—allowing visitors to interact with geophysi-cists who typically do not participate in off-site education andoutreach programs. We have found this to be beneficial inmany ways: The visitors gain exposure to experts from multi-ple geophysical disciplines, the researchers gain experiencediscussing their science in layman’s terms, and questionsposed by persons outside of the geophysics discipline can leadto new avenues of discovery. For example, one visitorinquired about the “funny initial wiggle” on a seismogramthat was clearly visible on the center’s wall-sized screen, butnot as apparent on the typical desktop monitors used by mostseismologists. The relationship of this recently identified pre-shock to the associated mainshock is being examined (
e.g.
,Dodge
et al.
, 1995; Kilb and Gomberg, 1999).In planning for future Education and Outreach uses of
the center, we have established the following focus areas: (1)identifying how the center can support Earth science stan-
dards for K–12 education; (2) introducing K–12 teachers toEarth science teaching modules and supplying them with thenecessary tools to incorporate these modules in their class-rooms; (3) placing special emphasis on educating studentswho have expressed an interest in Earth science, as well asunderrepresented students; (4) using the high-end computercapabilities at our Visualization Center to produce Web-accessible geoscience education modules; (5) supplyingschools that lack sufficient computing capabilities to use ourvisual objects with large-scale laminated Earth science postersthat can be used in the classroom; and (6) providing the Dig-ital Library for Earth System Education (DLESE) with visualobjects for distribution through their national portal (
http://www.dlese.org/
). To assure that these goals are attainable wehave teamed with a curriculum development specialist, SIOEarth scientists, K–12 teachers, education/outreach profes-sionals, computer scientists, and a cognitive scientist.
For our informal science presentations, we tailor our dis-cussions to fit the interests of our visitors yet make everyattempt to discuss research currently underway. In a typicalhour, visitors “fly” through the topography of Mars; thebathymetry, seismic reflectivity, and fault structure of Lake
�
Figure 2.
Visitors to the Visualization Center at Scripps
use specially designed 3D glasses to view high-resolution stereo images of the topography ofsouthern California and station telemetry lines, along with the locations of 40,000 earthquakes that were recorded by the Anza seismic network over the lasttwenty years. A virtual flight through these data can be dictated on the spot by the user.
Seismological Research Letters September/October 2003 Volume 74, Number 5 643
Tahoe; southern California’s topography and seismicity(~40,000 earthquakes) accompanied by real-time seismicwaveforms recorded by the Anza seismic network (see Kilb
etal.
, 2003); and seismicity from around the world (~384,000earthquakes from the PDE catalog).
Depending upon the interest of our audience, we canexplore more specific topics. For example, we depict eachearthquake recorded by the Anza seismic network (
http://www.eqinfo.ucsd.edu
) in southern California as a point that iscolor-coded according to its time of occurrence; from theseimages clusters of similarly colored points can be identified aseither mainshock/aftershock sequences, induced seismicity(
e.g.
, from quarries), or earthquake swarms. Visitors learnthat, unlike mainshock/aftershock sequences, induced earth-quakes have very shallow depths (< 5 km). Other concepts/topics that we highlight include the accurate locations ofmicroearthquakes in California (as determined from wave-form cross correlation; Kilb and Rubin, 2002), detailedbathymetry of the global ocean basins and its tectonic impli-cations (based on ship soundings and inversion of satellitealtimetry data; Smith and Sandwell, 2002), and interferomet-ric synthetic aperture radar (InSAR) maps of the surfacedeformation following the M 7.1 1999 Hector Mine, Cali-fornia, earthquake (Sandwell
et al.
, 2000; Fialko
et al.
, 2002).We discuss the basic scientific questions being addressed (
e.g.
,is earthquake size predictable; using estimated fault dimen-sions to determine what the associated seismic hazards are fora region; is there evidence for an ocean on Mars, and if sohow extensive might it have been) and outline techniquesthat researchers at SIO are implementing to gain a betterunderstanding of a variety of problems (
e.g.
, Hartse
et al.
,1994; Haase
et al.
, 1995; Johnson
et al.
, 1997; Sandwell
et al.
,1997; Babcock
et al.
, 1998; Price and Sandwell, 1998; Kent
et al.
, 2000; Kilb
et al.
, 2000; Lyons
et al.
, 2000; Fialko
et al.
,2001; Miller
et al.
, 2001; Sandwell and Smith, 2001; Harde-beck and Shearer, 2002; Kilb and Rubin, 2002; Shearer,2002; Kent
et al.
, 2003; Kilb, 2003).
K–12 Education
To date, our youngest group of visitors was Ms. Beaudet’s 6thgrade class from the Nazareth School in San Diego. We intro-duced these students to the concept of supercomputers, seis-mology, the topography of Mars, the formation of the lakebottom of Lake Tahoe, and Space-to-your-Face (an interac-tive application that seamlessly allows exploration of multi-resolution images from space) (
http://siovizcenter.ucsd.edu/news_events.shtml
).As part of the NSF IT OptIPuter (Optical IP computer)
project (
http://www.calit2.net/news/2002/9-25-optiputer.html
), we are involved in a field-based education and outreachprogram through the Preuss School, which is a San DiegoCity Charter School for low-income, first-generation college-bound students, grades 6–12, located on the UCSD campus(
http://preuss.ucsd.edu/
). In collaboration with curriculumwriters, Preuss School teachers, and various geoscienceresearchers, we are assisting in the development of an Earth
science curriculum at the 8th grade level. Our role in thiseffort involves developing geophysical data visualizations tobe used as tools in observational inquiry-based learning. Forexample, the students can “fly” through computer-generatedimages of seismic data from around the globe and use pat-terns in seismicity to identify tectonic plate boundaries. Theycan also use the depth of the seismicity to identify the differ-ent plate boundary types (
e.g.
, subduction zone boundarieshave deeper seismicity than strike-slip boundaries). Studentscan learn to question the robustness of the data by overlayingseismicity and station locations to determine if regions ofminimal seismic activity are truly areas of seismic quiescenceor merely an artifact of sampling. Interactions such as thesewill, over the next five years, result in the development of por-table learning units (visual objects) for general Web-baseddistribution through our Web site and/or through theDLESE portal. As part of this project, these visual objects willalso be integrated into classrooms in targeted school districtsin San Diego, Houston, and Chicago. In this way, the fullnature of the visual objects can be viewed and explored in 3Dstereo on inexpensive systems such as the GeoWall (
http://geowall.geo.lsa.umich.edu
).
Southern California Earthquake Center: Summer Interns and Teacher Programs
A scientific collaboration evolved from a tour of our facility bySouthern California Earthquake Center (SCEC) summerundergraduate interns. Interns Sara Whipple and LeonardJimenez helped facilitate an exchange of data sets between SanDiego State University (SDSU), SCEC, and IGPP thatincluded detailed 3D fault models developed by SCEC’scrustal fault model group (
http://structure.harvard.edu/cfma/
),roads in California, the continental USA outline, fault traces,and city names. Additionally, Sara Whipple and Jeff Sale fromSDSU visited the Visualization Center at Scripps on multipleoccasions to develop QuickTime
®
movies and produce datasets beneficial to our interests as well as their projects for theSeismic Safety Commission (
http://www.seismic.ca.gov/
).Some of the resulting geophysical visualization projects,which primarily focus on southern California, are availableonline (
http://www.siovizcenter.ucsd.edu/streaming/
).We are collaborating with Incorporated Research Institu-
tions for Seismology (IRIS), SCEC, USGS, SDSU, and theBirch Aquarium at Scripps to develop one-day teacher train-ing workshops that incorporate visualizations created at theVisualization Center at Scripps. The goal of these workshopsis to “provide a direct connection between scientists anddevelopers of earthquake education resources and those whouse these resources in the classroom” (SCEC Communica-tion, Education and Outreach [CEO] program annual meet-ing report, 2002). The workshops, taught in tandem by SIOresearchers, SCEC, and USGS education personnel, will beheld at the Visualization Center at Scripps in Spring 2003 tooffer K–12 teachers hands-on opportunities to work withearthquake activities developed primarily by IRIS. We haveaugmented existing materials with visualizations produced in
644 Seismological Research Letters Volume 74, Number 5 September/October 2003
the Visualization Center at Scripps and are working with sci-ence teachers and local public school science administratorsto generate interest in the workshops. If there are significantinterest and resources, we hope to offer the workshop annu-ally, as well as to extend our efforts to include K–12 classroomfield trips to the Visualization Center at Scripps.
Teach for America
In the summer of 2002, SIO Assistant Professor CatherineJohnson teamed with Teach for America (
http://www.teachforamerica.org/
) corps member MacGregor Campbellfor two months at SIO. MacGregor is a 7th grade mathteacher at Davis Middle School in Compton, California. Hegenerously used his summer break to develop math modulesbased on Earth and planetary science. These modules areavailable online (
http://mahi.ucsd.edu/johnson/mathjourney/introduction.html
) and were purposely designed for teachers inschools with minimal or no computer equipment. Educatorsnationwide can download the modules from their homecomputers and then bring the information to the studentsusing nothing but chalk, a chalkboard, and at times an over-head projector. Part of MacGregor’s time was spent in theVisualization Center at Scripps developing QuickTime mov-ies of the topography of Mars (
http://siovizcenter.ucsd.edu/streaming/
) and familiarizing himself with other availabledata sets such as the Earth’s topography, global seismicity, andthe bathymetry of Lake Tahoe. Based on his experience in thecenter, MacGregor comments, “I am excited to share with mystudents the information I have learned and the experiences Ihave had in the center working with SIO researchers. I hopesome day each of my students will have similar opportunitiesthat make scientific research easy to understand and, mostimportantly, fun.”
Graduate Student Research using the Visualization Center at Scripps
To educate IGPP graduate students about data visualization,we held a graduate student competition at the VisualizationCenter at Scripps
on 6 September 2002 (
http://www.siovizcenter.ucsd.edu/news_events/2002/09/06.shtml
). Priorto the competition we offered several informal classes intro-ducing the center’s hardware and software, as well as datatypes suitable for visualization. These classes were followed byindividual tutorials with students who expressed an interestin using visualizations to understand and present theirresearch projects. The competitors’ presentations covered arange of topics, including the topography of Mars, active tec-tonics in Lake Tahoe, electromagnetic methods, seismicityfrom around the globe, and the topography of Baja Califor-nia. Some entries were simple projects, such as showing theextraordinary expanse of the Valles Marineris canyon systemon Mars by draping a political map of the United States on it,while other, more complex projects were based on softwaredevelopment for research and image generation that requiredmany weeks of preparation (
e.g.
,
http://schwehr.org/viz02/
).
The four judges for the event included scientists with arange of backgrounds as well as one nonscientist. All thejudges were impressed with the quality of the presentations.The event was successful in introducing IGPP graduate stu-dents to high-end visualization technology. Further annualcompetitions are planned, incorporating students across sci-ence curriculum groups at the Scripps Institution of Ocean-ography campus; it is hoped this will allow students toimprove their understanding of multidimensional scientificproblems and play an integral part in extending their knowl-edge of visualization technology.
The Visualization Center at Scripps has also been used toteach graduate classes in tectonics, time series analysis, seis-mology, mathematical methods, geophysical data analysis,geophysical inverse theory, and geodynamics. In a recentclass, for example, Dr. Peter Shearer used the wall-sized screendisplay to demonstrate how to use the Seismic Analysis Code(SAC) computer software program. Seeing first-hand how theprogram worked greatly familiarized the students with thecomputer program—much more so than the typically usedpaper handouts.
Some graduate students have opted to use the Visualiza-tion Center at Scripps for their Ph.D. defenses. Most stu-dents divide the wall-sized screen into three sections,simultaneously displaying movies, equations, interpretations,and descriptions of their work. In one case, in preparation fora defense, the memory and speed of the SGI
®
3400 Onyxcomputer reduced the rendering time of a movie of patterndevelopment in Arctic soils by an order of magnitude (this isrelated to a recent cover of the journal
Science
:
http://www.igpp.ucsd.edu/ne/2003/01/29.html
).
Partnership with the Birch Aquarium at Scripps
Multiple education and outreach programs have been devel-oped through a partnership with the Birch Aquarium atScripps (
http://aquarium.ucsd.edu/
). These efforts includedhosting a component of the Southern California regionalcompetition of the National Ocean Sciences Bowl (NOSB)and two components of the Expanding your Horizons work-shops, which are geared to enhance 6th through 10th gradegirls’ exposure to science, mathematics, engineering, andtechnology (
http://www.sdsa.org/EYH/
). Another weekend,gifted students from the Junior Science and Humanities Pro-gram, an undertaking that recognizes high school students foroutstanding achievement in experimentation and originalresearch in the sciences, visited the aquarium to learn aboutthe Earth and discuss geophysical and oceanographic science.At the Visualization Center at Scripps, where the studentsspent a portion of their visit, they were introduced to basicgeophysical techniques, including what a seismogram lookslike, determination of the approximate location of an earth-quake (
i.e.
, near the station that has the earliest first seismicarrival), and more challenging concepts. To introduce theconcept of dynamic triggering of earthquakes (Harris, 1998;Kilb
et al.
, 2000; Wyss and Wiemer, 2000; Freed
et al.
, 2001;Power
et al.
, 2001) we took a virtual flight across the topogra-
Seismological Research Letters September/October 2003 Volume 74, Number 5 645
phy of the western USA from the epicenter of the southernCalifornia 1992 Landers earthquake to locations of docu-mented remote aftershock triggering, such as Cedar City,Utah; Boise, Idaho; and Yellowstone, Montana (Hill
et al.
,1993).
Trips to the Visualization Center at Scripps were alsoincluded in Aquarium programs designed for Aquatic Adven-tures’ high school mentors and middle school youth.
AquaticAdventures (
http://www.aquaticadventures.org
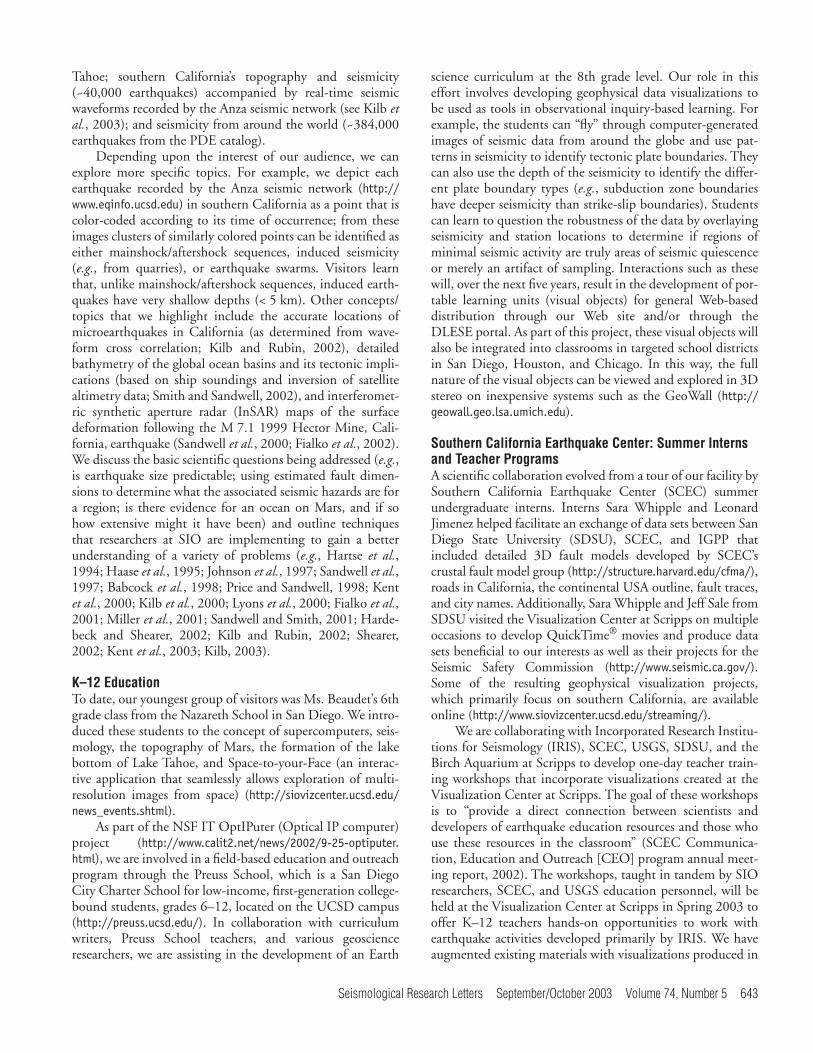
) is a private,nonprofit science education organization dedicated to pro-viding free programs in Earth and ocean sciences to studentsat underserved San Diego schools. This visit included identi-fying the kelp beds that are visible from the balcony of theVisualization Center at Scripps (Figure 3). To measure thestudent’s retention, a pre-/postvisit evaluation was conductedby Shara Fisler, Executive Director of Aquatic Adventures.The results showed a marked improvement in the students’knowledge about Earth science (on the previsit evaluation theaverage score was 11/21; on the postvisit evaluation the aver-age score was 20/21).
Television-based Modules
The Visualization Center at Scripps has been spotlighted inlocal and national television news programs. Some programshave had specific focuses; for example, the National Geo-graphic Channel interviewed researchers about natural disas-ters pertaining to earthquakes and earthquake-generatingseiche waves near Lake Tahoe (Kent
et al.
, 2003). Other pro-grams are more general, such as a local San Diego television
crew production of three ~10-minute interviews with Dr.Graham Kent, in which the purpose of the VisualizationCenter at Scripps and its capabilities were discussed.
A production company called INTELECOM based inPasadena is producing a 26-part community college curricu-lum and PBS series on oceanography called “The EndlessVoyage.” They have interviewed scientists at all of the majoroceanographic institutions and research universities on a widevariety of topics, ranging from the dynamics of the Earth’sinterior to ocean basin structure, and from physical oceanog-raphy to biological oceanography. To provide graphics toaccompany the scientific narration, Dr. David Sandwell pro-duced seven animations using the technology at the Visual-ization Center at Scripps. These modules will be used forboth PBS broadcasts and computer-based Earth-scienceinstruction. The animations display the Earth with the oceandrained and provide a tour of all of the major seafloor spread-ing ridges, subduction zones, and hotspot seamount chains.These tours provide graphical evidence for the structures onthe ocean floor that were created and modified by global platetectonic activity over the past 200 million years of Earth his-tory.
We are currently working in conjunction with SDSUProfessor Dr. Pat Abbott, who is in the process of creating abroadcast-quality video for the award-winning “Written inStone” series (
http://www-rohan.sdsu.edu/~wis
). The nextvideo,
Shake, Rattle, and Grow: A View of the Growth of theTopography in Los Angeles
, will emphasize the development ofan earthquake through fault histories and plate tectonics todemonstrate how the Los Angeles landscape was formed bythe same processes that sometimes interrupt our daily lives—earthquakes. Our contribution to this project will be a virtualtour through the topography of southern California. Our vir-tual tour will mimic the route of a helicopter flight, employ-ing a gyro-stabilized Wescan camera system. Unlike trueflight, our virtual tour can make the surface of the Earthtransparent so that we can see the locations of earthquakes inSouthern California and their correlation with the topogra-phy in the region, as well as the mapped faults. By integratingtrue flight with virtual flight, we can speculate as to what thesurface topography might be able to tell us about seismicity atdepth (
e.g.
, mountainous regions typically correlate with seis-micity).
Research/Education from Spatially Different Locations
One long-range goal of the Visualization Center at Scripps isto continue collaborating with Cal-(IT)
2
, SDSU, and diversehigh-tech companies (
e.g.
, SGI, TeraBurst, Cox Communica-tions) toward building an infrastructure that enables synchro-nous sharing of immersive environments, including the nextgeneration of visualization hardware, as well as ensuring thatthese technologies work seamlessly with the end users’ sys-tems. Our center and the partner center at SDSU are linkedvia Cox Communications’ 44-mile, 10-gigabit-per-secondoptical-fiber network, making these centers a prototype forhow educators in different physical locations can interact.
�
Figure 3.
Dr. Cheryl Peach from the Birch Aquarium at Scripps dis-cusses aspects of the ocean environment, has the students identify kelpbeds (visible from the balcony of the Visualization Center at Scripps), andshows the students specimens of meso- and bathypelagic fish.

646 Seismological Research Letters Volume 74, Number 5 September/October 2003
Groups at both institutions are able to send and receive dataand images simultaneously, allowing collaboration on theanalysis of large 3D geophysical data sets in real-time. Thisnetwork is facilitated by TeraBurst Networks’ WAVS
®
(WideArea Visualization Solution), which is based on a high-perfor-mance, optical networking platform (OC-192). This tech-nology enables the transmission of massive amounts of databetween multiple locations and is the only technology avail-able that enables video, audio, and data to be transmittedsimultaneously and synchronously over a wide-area opticalnetwork to spatially remote centers. Given that networkspeeds are doubling every nine months, this level of interac-tivity will be available throughout the U.S. in three to fiveyears, enabling educators from multiple institutions to viewextremely large data sets simultaneously.
UTILIZATION OF VISUALIZATION OBJECTS DEVELOPED IN THE VISUALIZATION CENTER AT SCRIPPS
Alternative Visualization Systems
The visualization systems used by educators can, at times,limit presentation resources. Computer memory and com-puter speed are two of the primary constraints. To cope withthis problem, educators resort either to limiting the spatial ortemporal range of their data, or forfeiting simultaneous dis-play of multiple data sets (
e.g.
, combining bathymetry, seis-micity, and seismic cross-sections). One alternative is to usecomputers with large amounts of memory and speed to ren-der snapshots, images, and movies that are too big for othersystems, and then export smaller end products to more com-monly used computer systems. For educators, one of the bestcurrent options is to display these end products on the porta-ble PC-based GeoWall (
http://www.geowall.org
), which con-sists of two data projectors that overlap their projections on a5
′
by 4
′
screen, forming a “side by side” stereo image. We haveteamed with the developers of GeoWall to make some of thedata products we develop on our system viewable on theGeoWall system. For interactive data manipulation, the free-ware iView3D (
http://www.ivs.unb.ca/products/iview3d/
)viewer can be used to view visual objects created using IVS’Fledermaus software (
http://www.ivs.unb.ca/
). These solu-tions allow educators access to high-quality products at no orminimal cost.
Seismological Freeware Programs and Web-accessible Information
To encourage further development of our visitors’ geophysi-cal knowledge, we introduce a number of freeware programsduring demonstrations in the Visualization Center at Scrippsand illustrate how easy they are to download to a laptop. Wedo this by displaying the desktop of our laptop on our largescreen, so that all visitors can view the installation and oper-ating procedures. One of the most popular programs is the
Seismic Eruption
computer program developed by Alan L.Jones. A link to this program, as well as to other relevant
resources, can be found on our Web site (
http://www.sioviz-center.ucsd.edu/library/links/index.shtml
).
QuickTime Movies
QuickTime movies of our data products can be viewed by thegeneral public from our real-time streaming server (
http://www.siovizcenter.ucsd.edu/streaming/
). We primarily createthese movies using IVS’ Fledermaus software (
http://www.ivs.unb.ca/
), which has a simple feature that allows theuser to delimit a flight path through a data scene (which canbe a conglomeration of multiple data sets), smooth any kinksin the flight path, and render a movie based on separate imagesnapshots. The resulting QuickTime movies are ideal for usein classrooms from grade school through college, as well as forviewing by the general public. Another avenue of distributionis through online journals, such as
Science
,
Journal of Geophys-ical Research
, and
Nature
, that publish QuickTime movies aspart of journal articles (
e.g.
, Kent
et al.
, 2000).The movies we generate provide easy-to-use material for
introductory Earth science classes in institutions that do nothave high-end visualization systems. Some of the movies weproduce in the Visualization Center at Scripps incorporatelarge amounts of data that are impossible to render on smallersystems, yet the resulting final file sizes of the movies are man-ageable for even a laptop. This reduces the hardware costs fora “visualization system” to the cost of a low-end laptop(~$1,500).
The movies can also be used in the interim while educa-tors determine the interests and needs of their institutions interms of visualization systems. End users such as Gary Patter-son, Information Services Director with the Center for Earth-quake Research and Information at the University ofMemphis, have used our QuickTime movies in presentationsin university and government environments. Patterson hasemployed the movies in workshops to demonstrate to educa-tors the direction in which visual-based learning products areheaded. This has generated interest from his coworkers, whoplan to use the QuickTime movies in their classes. We expectthe distribution of the movies to be rapid and widespread tomany geophysical researchers, as well as for use in educationand public outreach programs.
EARTHQUAKE RESPONSE, SEISMIC SAFETY, AND HOMELAND SECURITY
Visits to our center from California Emergency Responsepersonnel have led to an open exchange of ideas with respectto emergency planning procedures. For example, during avisit to the Visualization Center at Scripps by top emergencyresponse management teams, we demonstrated how SIO seis-mologists record and locate earthquakes and discussed thepossibility of making these tools available to emergencyresponders. We plan to continue to work with these groups todevelop real-time earthquake information that can assist withemergency efforts.

Seismological Research Letters September/October 2003 Volume 74, Number 5 647
The Visualization Center at Scripps has housed a num-ber of media responses to relatively large earthquakes in theSan Diego area. Response to the 31 October 2001 Anza
M
L
5.1 earthquake included an interactive 3D flight over thetopography of southern California on our wall-sized screen,real-time display of aftershocks recorded by the Anza seismicnetwork (
http://eqinfo.ucsd.edu
), and media interviews withDrs. Frank Vernon and Graham Kent. A similar responseafter the 22 February 2002 Calexico
M
L
5.3 earthquakeincluded a virtual flight through the seismicity of southernCalifornia, with a focus on the seismicity near the mainshockepicenter.
The Education Center on Computational Science andEngineering (ECCSE;
http://www.edcenter.sdsu.edu/
) hasbegun a three-way collaboration with SPAWAR and IGPP toestablish a “Civil Visualization Network” in an effort to equipour experts with high-speed collaborative decision supportsystems to educate our students and the general public on cri-sis mitigation, disaster preparedness, and emergencyresponse. This network will leverage the optical fiber connec-tion already existing between the SDSU Immersive Visualiza-tion Center and the Visualization Center at Scripps. We aimto develop examples of collaborative research and educationto demonstrate the value of such technologies.
SCHEDULING AN EDUCATIONAL OR RESEARCH VISIT
Researchers and staff at the Visualization Center at Scrippsmake every effort to accommodate all requests from the com-munity to visit and use our center. Currently two days peryear are reserved for visits from the general public on a first-come, first-served basis (e-mail
[email protected] for moreinformation). We are in the process of developing a cost-recovery rate structure for visits to and use of the center byeducators, researchers, and emergency response personnel.
SUMMARY
The immersive environment of the Visualization Center atScripps, coupled with the presentation of current seismologi-cal research, has great education and outreach potential.Since its March 2002 opening, the Visualization Center atScripps has had more than 2,500 visitors, and numerous vir-tual visitors have explored our Web pages, which includestreaming QuickTime movies of geophysical data, tutorialson how to use SGI/Mac/Windows® visualization software,and examples of visualizations developed by SIO researchersand faculty members (http://siovizcenter.ucsd.edu/library.shtml). We will continue to expand the use of the Visualiza-tion Center at Scripps for K–12 and informal education, andto use the center to supply geophysical data sets, movies, andresearch results to as large a group of educators as possible.Our goal is to develop more sustained K–12 educational pro-grams and to generate assessments of the center’s programsand the educational products created at the Center.
ACKNOWLEDGMENTS
The success of the Visualization Center at Scripps is due to agroup effort put forth by many volunteers. We would like tothank Jeff Babcock, MacGregor Campbell, Yuri Fialko, NoahKnowles, Steve Miller, David Pierce, Jeff Sale, and SaraWhipple for volunteering their time. We also thank ChrisGarrod and Kitty Haak for their attention to details that areessential to the smooth operation of our system and to ourvisitors’ enjoyment. The Center was funded independently offederal support and included funding from the Cecil H. andIda M. Green Foundation for Earth Sciences, the CaliforniaInstitute for Telecommunications and Information Technol-ogy, the Scripps Institution of Oceanography, and the SanDiego Supercomputer Center. This research was supportedby NSF under award ANI-0225642 and by ONR underaward N00014-97-1-0154.
REFERENCES
Babcock, J., A. Harding, G. Kent, and J. Orcutt (1998). An examina-tion of along-axis variation of magma chamber width and crustalstructure on the East Pacific Rise between 13 degrees 30′ N and 12degrees 20′ N, Journal of Geophysical Research 103, 30,451–30,467.
Dodge, D. A., G. C. Beroza, and W. L. Ellsworth (1995). Foreshocksequence of the 1992 Landers, California, earthquake and itsimplications for earthquake nucleation, Journal of GeophysicalResearch 100, 9,865–9,880.
Fialko, Y., D. Sandwell, D. Agnew, M. Simons, P. Shearer, and B. Min-ster (2002). Deformation on nearby faults induced by the 1999Hector Mine earthquake, Science 297, 1,858–1,862.
Fialko, Y., M. Simons, and D. Agnew (2001). The complete (3-D) sur-face displacement field in the epicentral area of the 1999 Mw7.1Hector Mine earthquake, California, from space geodetic observa-tions, Geophysical Research Letters 28, 3,063–3,066.
Freed, A. M. and J. Lin (2001). Delayed triggering of the 1999 HectorMine earthquake by viscoelastic stress transfer, Nature 411,180–183.
Haase, J., P. Shearer, and R. Aster (1995). Constraints on temporal vari-ations in velocity near Anza, California, from analysis of similarevent pairs, Bulletin of the Seismological Society of America 85,194–206.
Hardebeck, J. L. and P. M. Shearer (2002). A new method for determin-ing first-motion focal mechanisms, Bulletin of the SeismologicalSociety of America 92, 2,264–2,276.
Harris, R. A. (1998). Introduction to special section: Stress triggers,stress shadows, and implications for seismic hazard, Journal of Geo-physical Research 103, 24,347–24,358.
Hartse, H., M. Fehler, R. Aster, J. Scott, and F. Vernon (1994). Small-scale stress heterogeneity in the Anza seismic gap, southern Cali-fornia, Journal of Geophysical Research 99, 6,801–6,818.
Hill, D. P., P. A. Reasenberg, A. Michael, W. J. Arabasz, G. C. Beroza,D. S. Brumbaugh, J. N. Brune, R. Castro, S. D. Davis, D. M.dePolo, W. L. Ellsworth, J. Gomberg, S. Harmsen, L. House, S.M. Jackson, M. J. S. Johnston, L. Jones, R. Keller, S. Malone, L.Munguia, S. Nava, J. C. Pechmann, A. Sanford, R. W. Simpson,R. B. Smith, M. Stark, M. Stickney, A. Vidal, A. Walter, V. Wong,and J. Zollweg (1993). Seismicity remotely triggered by the mag-nitude 7.3 Landers, California, earthquake, Science 260,1,617–1,623.
Johnson, C. L., S. C. Solomon, and M. Simons (1997). Global andregional resolution studies of Magellan gravity data: Implications

648 Seismological Research Letters Volume 74, Number 5 September/October 2003
for inferring lithospheric thickness, Lunar and Planetary SciencesXXVIII, 667–668.
Kent, G. M., J. M. Babcock, N. W. Driscoll, A. J. Harding, G. G. Seitz,J. A. Dingler, J. V. Gardner, C. R. Goldman, A. C. Heyvaert, R.Karlin, L. A. Mayer, C. W. Morgan, and R. C. Richards (2003).Modern deformation across Lake Tahoe as measured from sub-merged paleo-shorelines and faults, Nature (to be submitted).
Kent, G. M., D. L. Kilb, J. A. Orcutt, and E. G. Frost (2002). Collab-orative visualization in Earth and ocean sciences, Margins Newslet-ter 8, 1–2.
Kent, G. M., S. C. Singh, A. J. Harding, M. C. Sinha, V. Tong, P. J. Bar-ton, R. Hobbs, R. White, S. Bazin, and J. Pye (2000). Evidencefrom three-dimensional seismic reflectivity images for enhancedmelt supply beneath mid-ocean-ridge discontinuities, Nature 406,614–618.
Kilb, D. (2003). A strong correlation between induced peak dynamicCoulomb stress change from the 1992 M7.3 Landers, California,earthquake and the hypocenter of the 1999 M7.1 Hector Mine,California, earthquake, Journal of Geophysical Research 108, 2012,doi:10.1029/2001JB000678.
Kilb, D. and J. Gomberg (1999). The initial subevent of the 1994Northridge, California, earthquake: Is earthquake size predict-able?, Journal of Seismology 3, 409–420.
Kilb, D., J. Gomberg, and P. Bodin (2000). Earthquake triggering bydynamic stresses, Nature 408, 570–574.
Kilb, D., R. L. Newman, F. L. Vernon , J. A. Eakins, L. Ziegler, J.Bowen, and J. Otero (2003). Education and outreach based ondata from the Anza seismic network in southern California, Seis-mological Research Letters 74, 522–528.
Kilb, D. and A. M. Rubin (2002). Relocated microearthquakes of theMt. Lewis ML5.7, California, earthquake sequence: Implicationsof diverse fault orientations, Journal of Geophysical Research 107,2294, doi:10.1029/2001JB000149.
Lyons, S. N., Y. Bock, and D. T. Sandwell (2000). Near-field crustaldeformation and creep characteristics in the Imperial Valley, Eos,Transactions of the American Geophysical Union 81, F1562.
Miller, S. P., J. Helly, A. Koppers, and P. Brueggeman (2001). SIOEx-plorer: Digital Library Project, in An Ocean Odyssey, MTS/IEEEOceans 2001 Proceedings 4, 2,288–2,296.
Power, J. A., S. C. Moran, S. R. McNutt, S. D. Stihler, and J. J. Sanchez(2001). Seismic response of the Katmai volcanoes to the 6 Decem-ber 1999 magnitude 7.0 Karluk Lake earthquake, Alaska, Bulletinof the Seismological Society of America 91, 57–63.
Price, E. and D. T. Sandwell (1998). Small-scale deformations associ-ated with the 1992 Landers, California, earthquake mapped bysynthetic aperture radar interferometry phase gradients, Journal ofGeophysical Research 103, 27,001–27,016.
Sandwell, D. T., C. L. Johnson, F. Bilotti, and J. Suppe (1997). Drivingforces for limited tectonics on Venus, Icarus 129, 232–244.
Sandwell, D., T. Sichoix, D. Agnew, Y. Bock, and J.-B. Minster (2000).Near real-time radar interferometry of the Mw 7.1 Hector MineEarthquake, Geophysical Research Letters 27, 3,101–3,104.
Sandwell, D. T. and W. H. F. Smith (2001). Bathymetric estimation, inL. L. Fu and A. Cazenale (editors), Satellite Altimetry and EarthSciences, Academic Press, 441–457.
Shearer, P. M. (2002). Parallel fault strands at 9-km depth resolved onthe Imperial Fault, southern California, Geophysical Research Let-ters 29(14), doi: 10.1029/2002GL015302.
Smith, B. and D. Sandwell (2002). Coulomb stress accumulation alongthe San Andreas fault system, Journal of Geophysical Research 108,doi: 10.1029/2002JB001831.
Wyss, M. and S. Wiemer (2000). Change in the probability for earth-quakes in Southern California due to the Landers magnitude 7.3earthquake, Science 290, 1,334–1,338.
Cecil H. and Ida M. Green Institute ofGeophysics and Planetary Physics
UCSD MS 0225La Jolla, CA 92093-0225
Telephone: +1-858-882-4607Fax: +1-858-534-6354
E-mail: [email protected]