The Vibrational Modes of Model Bulk Metallic Glasses · The Vibrational Modes of Model Bulk...
7
The Vibrational Modes of Model Bulk Metallic Glasses P. M. Derlet 1* , R. Maaß 2 and J. F. Löffler 2 1 Condensed Matter Theory Group, Paul Scherrer Institut, 5232 PSI-Villigen, Switzerland 2 Laboratory of Metal Physics and Technology, Department of Materials, ETH Zurich, 8093 Zurich, Switzerland ABSTRACT Bulk metallic glasses exhibit confined low- and high-frequency vibrational properties resulting from the significant bond and topological disorder occurring at the atomic scale. The precise nature of the low-frequency modes and how they are influenced by local atomic structure remains unclear. Using standard harmonic analysis, this study investigates various aspects of the problem by diagonalizing the Hessian of atomistic samples derived from molecular dynamics simulations via a model binary Lennard Jones pair potential. INTRODUCTION & METHODOLOGY Bulk metallic glasses (BMGs) exhibit unique vibrational properties. At low frequencies there exists an excess of modes relative to the Debye solid – the Bose peak [1] – which in a three dimensional system may be simply revealed by plotting the low-frequency part of the vibrational density of states (VDOS) divided by the square of the vibrational frequency. The Bose peak regime is considered a fundamentally important material property because its frequency range correlates strongly with the breakdown of transverse linear dispersion. At much higher phonon frequencies there also exists a critical frequency at which there is a transition from extended modes to strongly localized modes – the so-called mobility edge for phonons [2]. Here we investigate some of these aspects within the framework of the Harmonic approximation using atomistic samples that contain both spring-constant and topological disorder. The BMG samples were generated by quenching from the melt, a 1:1 model A-B binary Lennard-Jones (LJ) [3,4] mixture via constant atom number/pressure/temperature molecular dynamics. We note that the well equilibrated initial liquid state was prepared at a hydrostatic pressure of 14.5 GPa and therefore the quenching procedure involved the simultaneous reduction of both temperature and hydrostatic pressure. Two samples are presented here: sample0 containing 1728 atoms and sample1 containing 13824 atoms. To obtain the final 0K configurations a combination of molecular statics and conjugant gradient relaxation algorithms were used. Fig. 1 displays the volume (per atom), total instantaneous pressure and energy (per atom) as a function of instantaneous temperature during the quench. Inspection of this figure shows that with decreasing quenching rate and/or increasing sample size, the transition from liquid to glass becomes more abrupt with respect to temperature, indicating the underlying first- order phase transition. This trend is confirmed when using quenching rates several orders of magnitude slower, and larger samples sizes – indicating that in smaller samples inherent finite size effects play a role in smoothening out the phase transition. When considering the high quench rates displayed in Fig. 1 it is worth noting that for the present LJ parameterization the employed MD time-step is 0.01 fs. * Corresponding Author: [email protected] Mater. Res. Soc. Symp. Proc. Vol. 1224 © 2010 Materials Research Society 1224-GG05-01
Transcript of The Vibrational Modes of Model Bulk Metallic Glasses · The Vibrational Modes of Model Bulk...
The Vibrational Modes of Model Bulk Metallic Glasses
P. M. Derlet1*
, R. Maaß2 and J. F. Löffler
2
1Condensed Matter Theory Group, Paul Scherrer Institut,
5232 PSI-Villigen, Switzerland 2Laboratory of Metal Physics and Technology,
Department of Materials, ETH Zurich, 8093 Zurich, Switzerland
ABSTRACT
Bulk metallic glasses exhibit confined low- and high-frequency vibrational properties
resulting from the significant bond and topological disorder occurring at the atomic scale. The
precise nature of the low-frequency modes and how they are influenced by local atomic structure
remains unclear. Using standard harmonic analysis, this study investigates various aspects of the
problem by diagonalizing the Hessian of atomistic samples derived from molecular dynamics
simulations via a model binary Lennard Jones pair potential.
INTRODUCTION & METHODOLOGY
Bulk metallic glasses (BMGs) exhibit unique vibrational properties. At low frequencies
there exists an excess of modes relative to the Debye solid – the Bose peak [1] – which in a three
dimensional system may be simply revealed by plotting the low-frequency part of the vibrational
density of states (VDOS) divided by the square of the vibrational frequency. The Bose peak
regime is considered a fundamentally important material property because its frequency range
correlates strongly with the breakdown of transverse linear dispersion. At much higher phonon
frequencies there also exists a critical frequency at which there is a transition from extended
modes to strongly localized modes – the so-called mobility edge for phonons [2]. Here we
investigate some of these aspects within the framework of the Harmonic approximation using
atomistic samples that contain both spring-constant and topological disorder.
The BMG samples were generated by quenching from the melt, a 1:1 model A-B binary
Lennard-Jones (LJ) [3,4] mixture via constant atom number/pressure/temperature molecular
dynamics. We note that the well equilibrated initial liquid state was prepared at a hydrostatic
pressure of 14.5 GPa and therefore the quenching procedure involved the simultaneous reduction
of both temperature and hydrostatic pressure. Two samples are presented here: sample0
containing 1728 atoms and sample1 containing 13824 atoms. To obtain the final 0K
configurations a combination of molecular statics and conjugant gradient relaxation algorithms
were used. Fig. 1 displays the volume (per atom), total instantaneous pressure and energy (per
atom) as a function of instantaneous temperature during the quench. Inspection of this figure
shows that with decreasing quenching rate and/or increasing sample size, the transition from
liquid to glass becomes more abrupt with respect to temperature, indicating the underlying first-
order phase transition. This trend is confirmed when using quenching rates several orders of
magnitude slower, and larger samples sizes – indicating that in smaller samples inherent finite
size effects play a role in smoothening out the phase transition. When considering the high
quench rates displayed in Fig. 1 it is worth noting that for the present LJ parameterization the
employed MD time-step is 0.01 fs.
* Corresponding Author: [email protected]
Mater. Res. Soc. Symp. Proc. Vol. 1224 © 2010 Materials Research Society 1224-GG05-01
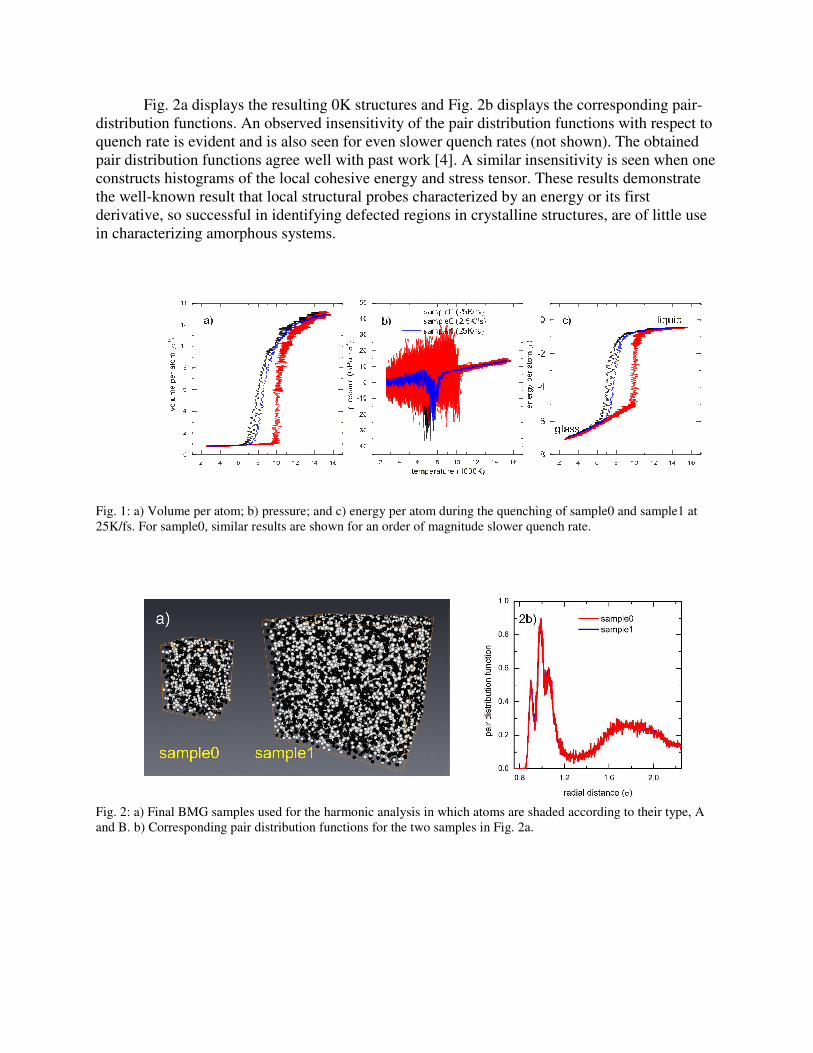
Fig. 2a displays the resulting 0K structures and Fig. 2b displays the corresponding pair-
distribution functions. An observed insensitivity of the pair distribution functions with respect to
quench rate is evident and is also seen for even slower quench rates (not shown). The obtained
pair distribution functions agree well with past work [4]. A similar insensitivity is seen when one
constructs histograms of the local cohesive energy and stress tensor. These results demonstrate
the well-known result that local structural probes characterized by an energy or its first
derivative, so successful in identifying defected regions in crystalline structures, are of little use
in characterizing amorphous systems.
Fig. 1: a) Volume per atom; b) pressure; and c) energy per atom during the quenching of sample0 and sample1 at
25K/fs. For sample0, similar results are shown for an order of magnitude slower quench rate.
Fig. 2: a) Final BMG samples used for the harmonic analysis in which atoms are shaded according to their type, A
and B. b) Corresponding pair distribution functions for the two samples in Fig. 2a.
THEORY AND RESULTS
The 0=k harmonic analysis begins by calculating the Hessian for the system:
( )
∂∂∂
=∂∂
∂=Λ ∑
ab
abtt
jiji
ij RVRRRR
Hba2
122
νµνµµν
,
where ( )RVbatt is the LJ potential between atoms of type at and bt separated by a radial distance
R . In the above equation, Latin indices represent atomic labels and Greek indices polarization
directions. By solving the eigenvalue equation,
( ) 0 ,
2 =−Λ∑ ν
ν
µνµν ωδ jn
j
nijij u ,
the harmonic modes of vibration can be obtained via the eigenfrequencies nω and
eigenvectorsµ
inu , .
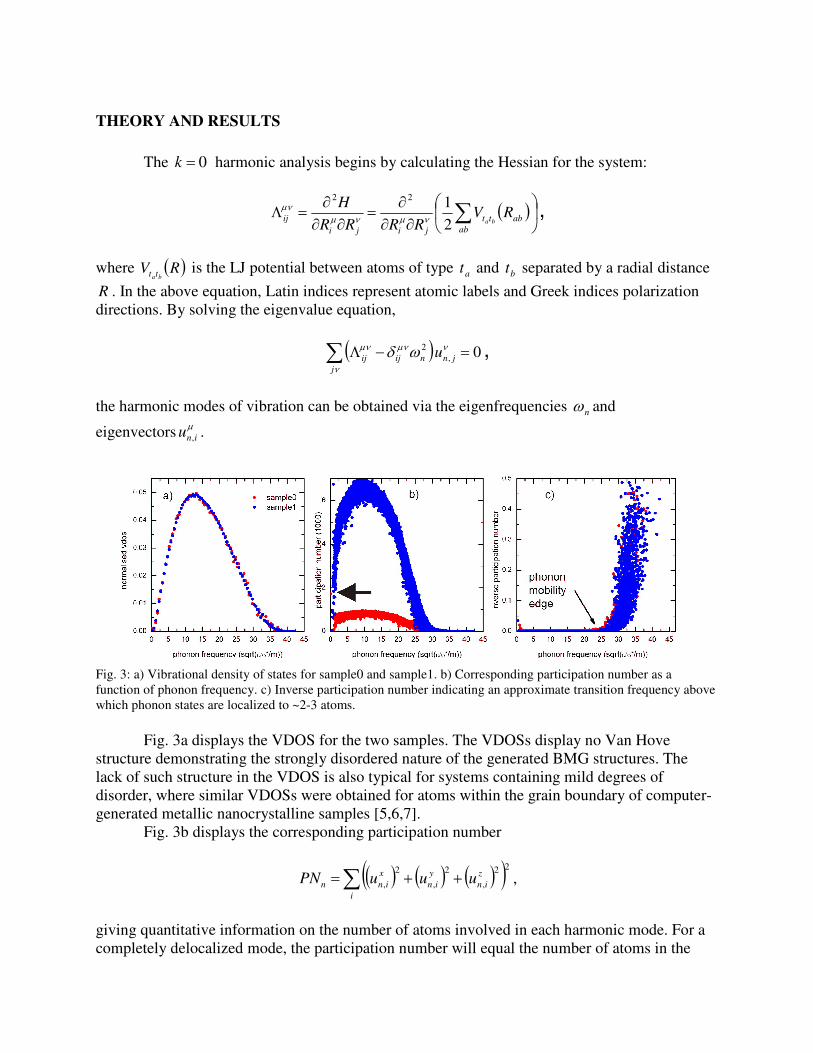
Fig. 3: a) Vibrational density of states for sample0 and sample1. b) Corresponding participation number as a
function of phonon frequency. c) Inverse participation number indicating an approximate transition frequency above
which phonon states are localized to ~2-3 atoms.
Fig. 3a displays the VDOS for the two samples. The VDOSs display no Van Hove
structure demonstrating the strongly disordered nature of the generated BMG structures. The
lack of such structure in the VDOS is also typical for systems containing mild degrees of
disorder, where similar VDOSs were obtained for atoms within the grain boundary of computer-
generated metallic nanocrystalline samples [5,6,7].
Fig. 3b displays the corresponding participation number
( ) ( ) ( )( )∑ ++=i
z
in
y
in
x
inn uuuPN22
,
2
,
2
, ,
giving quantitative information on the number of atoms involved in each harmonic mode. For a
completely delocalized mode, the participation number will equal the number of atoms in the
system, whereas for a mode localized to one atom the participation number will equal unity. In.
Fig. 3a the large participation numbers corresponding to the three zero-frequency translational
modes for sample0 are indicated by an arrow and for sample1 lie outside the range of the graph.
At both low and high frequencies there exist modes that involve a reduced number of atoms. Fig.
3c displays the inverse of the participation number. An inspection of Figs. 3b and 3c indicates
that the number of atoms associated with the low frequency modes depends on the size of the
system, whereas for the high-frequency modes the number of atoms (~2-3) is independent of
system size. Establishing a well defined mobility edge in terms of a critical phonon frequency
and a corresponding power law, as was done in Ref. [2], was not achieved for these rather small
samples.
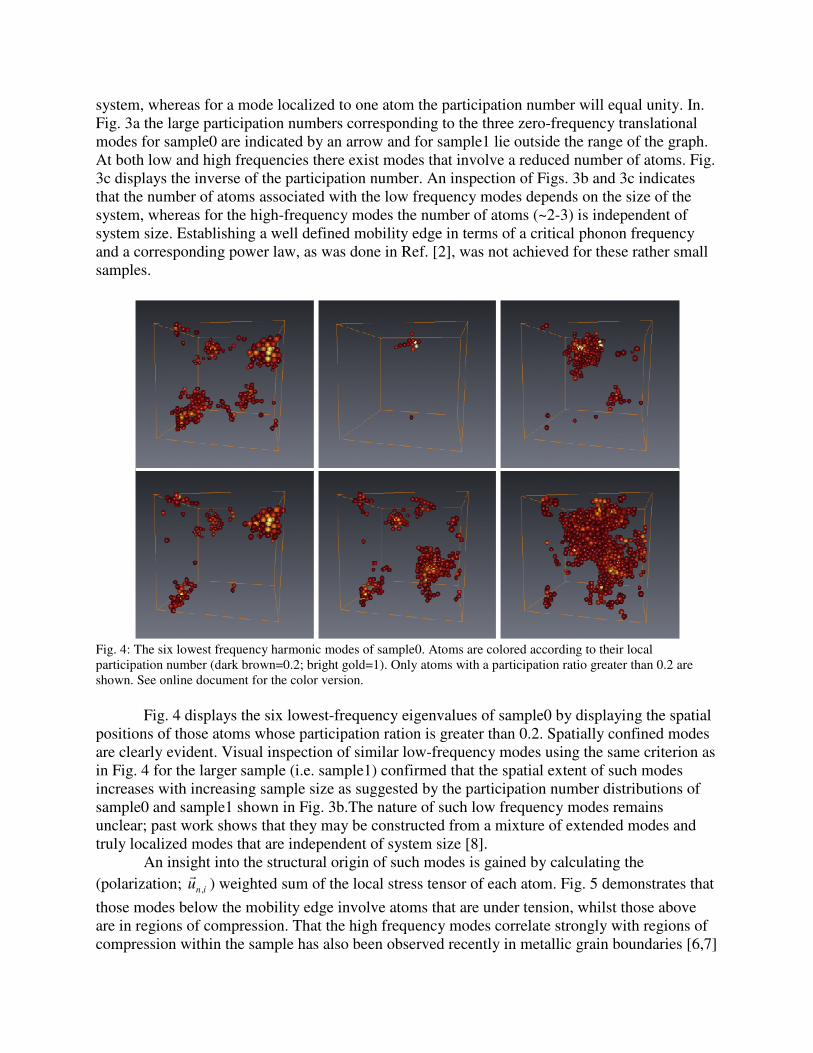
Fig. 4: The six lowest frequency harmonic modes of sample0. Atoms are colored according to their local
participation number (dark brown=0.2; bright gold=1). Only atoms with a participation ratio greater than 0.2 are
shown. See online document for the color version.
Fig. 4 displays the six lowest-frequency eigenvalues of sample0 by displaying the spatial
positions of those atoms whose participation ration is greater than 0.2. Spatially confined modes
are clearly evident. Visual inspection of similar low-frequency modes using the same criterion as
in Fig. 4 for the larger sample (i.e. sample1) confirmed that the spatial extent of such modes
increases with increasing sample size as suggested by the participation number distributions of
sample0 and sample1 shown in Fig. 3b.The nature of such low frequency modes remains
unclear; past work shows that they may be constructed from a mixture of extended modes and
truly localized modes that are independent of system size [8].
An insight into the structural origin of such modes is gained by calculating the
(polarization; inu ,
r) weighted sum of the local stress tensor of each atom. Fig. 5 demonstrates that
those modes below the mobility edge involve atoms that are under tension, whilst those above
are in regions of compression. That the high frequency modes correlate strongly with regions of
compression within the sample has also been observed recently in metallic grain boundaries [6,7]
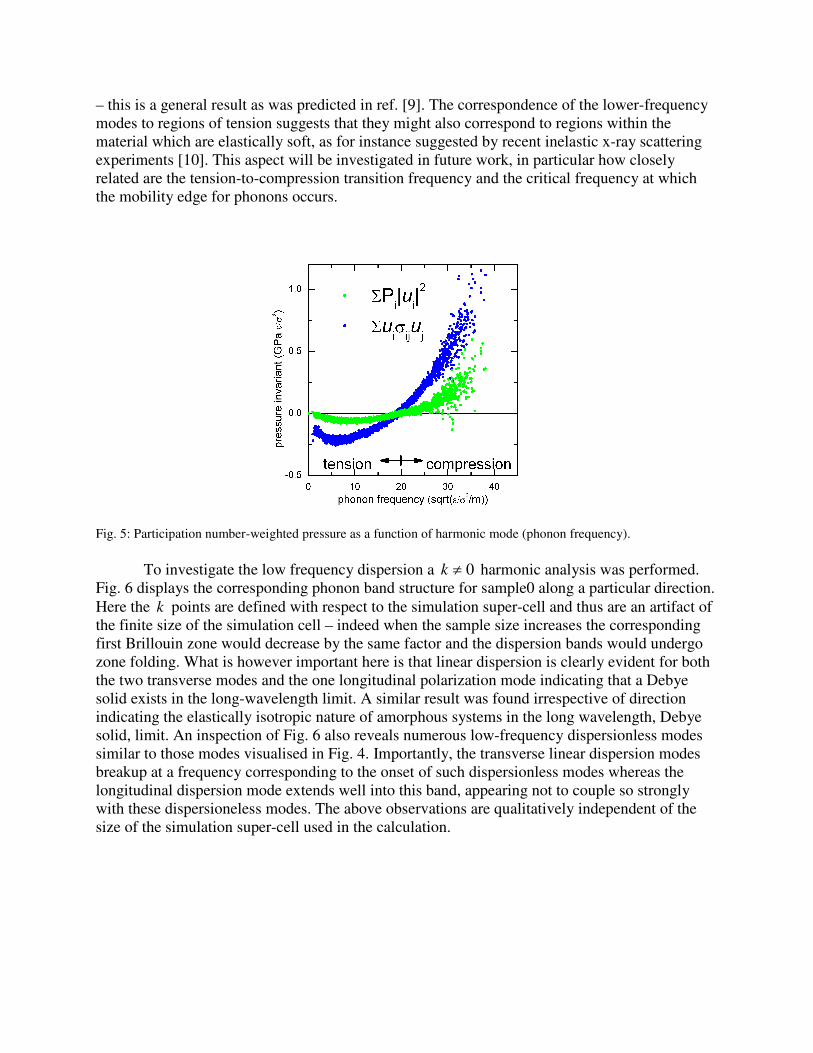
– this is a general result as was predicted in ref. [9]. The correspondence of the lower-frequency
modes to regions of tension suggests that they might also correspond to regions within the
material which are elastically soft, as for instance suggested by recent inelastic x-ray scattering
experiments [10]. This aspect will be investigated in future work, in particular how closely
related are the tension-to-compression transition frequency and the critical frequency at which
the mobility edge for phonons occurs.
Fig. 5: Participation number-weighted pressure as a function of harmonic mode (phonon frequency).
To investigate the low frequency dispersion a 0≠k harmonic analysis was performed.
Fig. 6 displays the corresponding phonon band structure for sample0 along a particular direction.
Here the k points are defined with respect to the simulation super-cell and thus are an artifact of
the finite size of the simulation cell – indeed when the sample size increases the corresponding
first Brillouin zone would decrease by the same factor and the dispersion bands would undergo
zone folding. What is however important here is that linear dispersion is clearly evident for both
the two transverse modes and the one longitudinal polarization mode indicating that a Debye
solid exists in the long-wavelength limit. A similar result was found irrespective of direction
indicating the elastically isotropic nature of amorphous systems in the long wavelength, Debye
solid, limit. An inspection of Fig. 6 also reveals numerous low-frequency dispersionless modes
similar to those modes visualised in Fig. 4. Importantly, the transverse linear dispersion modes
breakup at a frequency corresponding to the onset of such dispersionless modes whereas the
longitudinal dispersion mode extends well into this band, appearing not to couple so strongly
with these dispersioneless modes. The above observations are qualitatively independent of the
size of the simulation super-cell used in the calculation.
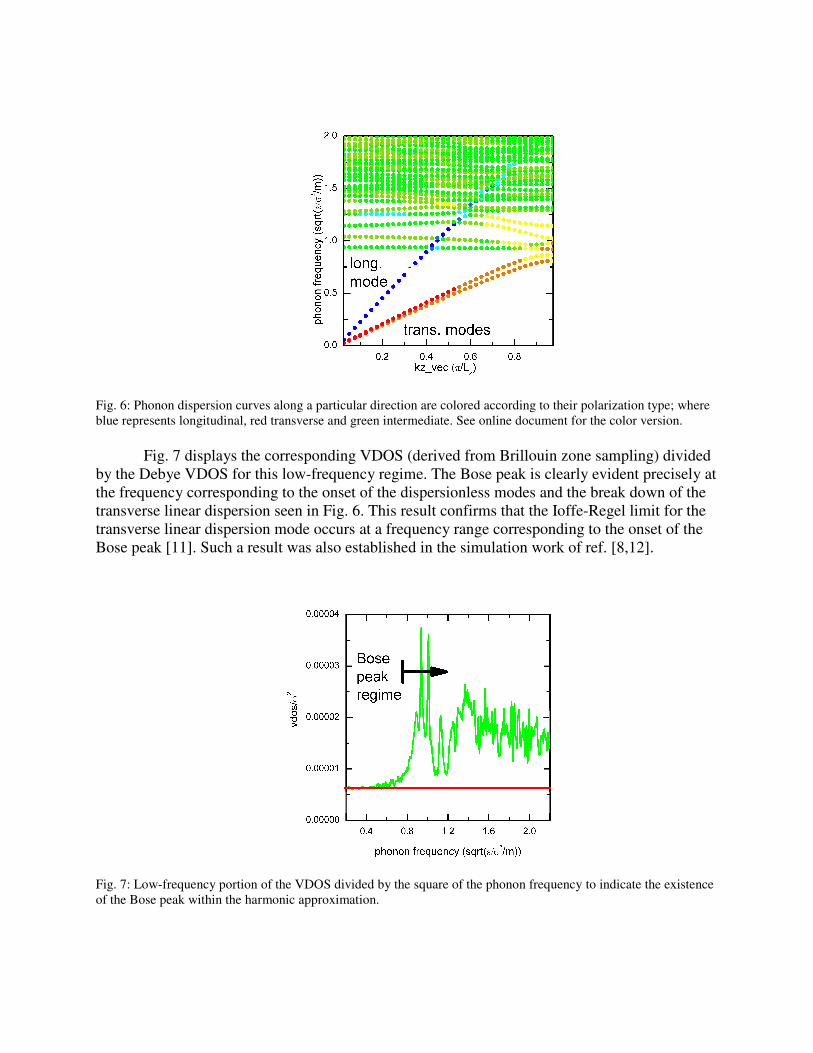
Fig. 6: Phonon dispersion curves along a particular direction are colored according to their polarization type; where
blue represents longitudinal, red transverse and green intermediate. See online document for the color version.
Fig. 7 displays the corresponding VDOS (derived from Brillouin zone sampling) divided
by the Debye VDOS for this low-frequency regime. The Bose peak is clearly evident precisely at
the frequency corresponding to the onset of the dispersionless modes and the break down of the
transverse linear dispersion seen in Fig. 6. This result confirms that the Ioffe-Regel limit for the
transverse linear dispersion mode occurs at a frequency range corresponding to the onset of the
Bose peak [11]. Such a result was also established in the simulation work of ref. [8,12].
Fig. 7: Low-frequency portion of the VDOS divided by the square of the phonon frequency to indicate the existence
of the Bose peak within the harmonic approximation.
CONCLUSIONS
Since the transverse linear dispersion mode couples strongly with the low-frequency
dispersionless modes, this study suggests that the latter are predominantly transverse in nature.
Work is proceeding to gather knowledge of the nature of these low-frequency modes and how
they might relate to the structural properties of the bulk metallic glasses.
Investigating these aspects as a function of increasing sample size demonstrates that the
dispersionless modes (and the onset of the Bose peak) shift to lower frequencies. Whether or not
they converge to a finite frequency has yet to be established.
The longer-term goal is to investigate the connection of such vibrational modes to
possible transition pathways for structural relaxation and localized shear deformation zones
[13,14].
REFERENCES
1. Phillips,W. A. (ed.) Amorphous Solids: Low-Temperature Properties (Springer, 1981).
2. W. Garber, F. M. Tangerman, P. B. Allen, and J. L. Feldman, Philos. Mag. Lett. 81, 433
(2001).
3. G. Wahnstrom, Phys. Rev. A 44, 3752 (1991).
4. Y. Shi and M.L. Falk, Phys. Rev. B 73, 214201 (2006).
5. P. M. Derlet, R. Meyer, L. J. Lewis, U. Stuhr, and H. Van Swygenhoven, Phys. Rev. Lett. 87,
205501 (2001).
6. P. M. Derlet and H. Van Swygenhoven, Phys. Rev. Lett. 92, 035505 (2004).
7. P. M. Derlet, S Van Petegem, H. Van Swygenhoven, Phil. Mag. 89, 3511 (2009).
8. H. R. Schober and C. Oligschleger, Phys. Rev. B 53, 11469 (1996).
9. A. P. Sutton, Phil. Mag. A 60, 147 (1989).
10. T. Ichitsubo, S. Hosokawa, K. Matsuda, E. Matsubara, N. Nishiyama, S. Tsutsui, and A. Q.
R. Baron, Phys. Rev. B 76, 140201(R) (2007).
11. H. Shintani and H. Tanaka, Nature Materials 7, 870 (2008).
12. H. R. Schober, J. Phys.: Condens. Matter 16 S2659 (2004).
13. S. G. Mayr, Phys. Rev. Lett. 97, 195501 (2006).
14. D. Rodney and C. Schuh, Phys. Rev. Lett. 102, 235503 (2009).