The Vehicle(s) in Your Future Jason Mark Director, Clean Vehicles Program
15
The Vehicle(s) in Your Future Jason Mark Director, Clean Vehicles Program
-
Upload
jillian-adriano -
Category
Documents
-
view
21 -
download
0
description
The Vehicle(s) in Your Future Jason Mark Director, Clean Vehicles Program. The Transportation Challenge. Oil Dependence > $500,000/minute to import oil Oil imports = ¼ of last year’s trade deficit Passenger vehicle fuel economy at 20 year low Air Pollution - PowerPoint PPT Presentation
Transcript of The Vehicle(s) in Your Future Jason Mark Director, Clean Vehicles Program

The Vehicle(s) in Your Future
Jason MarkDirector, Clean Vehicles Program

The Transportation Challenge
• Oil Dependence– > $500,000/minute to import oil
– Oil imports = ¼ of last year’s trade deficit
– Passenger vehicle fuel economy at 20 year low
• Air Pollution– 160 million Americans breathe unhealthy air
– Local “hot spots”
• Climate Change– Scientific consensus
– US transportation sector emits more heat-trapping gases than most countries release from all sources together

Climate Change:Avoiding Dangerous Levels

Global Carbon Budget:Dangerous Emissions Levels Approaching
550 ppmv stabilization
450 ppmv stabilization
Sources: IPCC SRES Emission Scenarios Version 1.1. A1G scenario from MiniCAM. 21st century carbon budgets for WRE stabilization curves from IPCC 2001 Synthesis Report, Table 6-1.
"business as usual"
0
500
1000
1500
2000
2500
2000 2010 2020 2030 2040 2050 2060 2070 2080 2090 2100
Glo
bal
Cu
mu
lati
ve C
O2
Em
issi
on
s(G
igat
on
nes
Car
bo
n)

Technology Solutions

Source: www.suvsolutions.org
Conventional Vehicles:Readily available, cost-effective solutions

Hybrid Vehicles:Not all hybrids are created equal
Source: www.hybridcenter.org
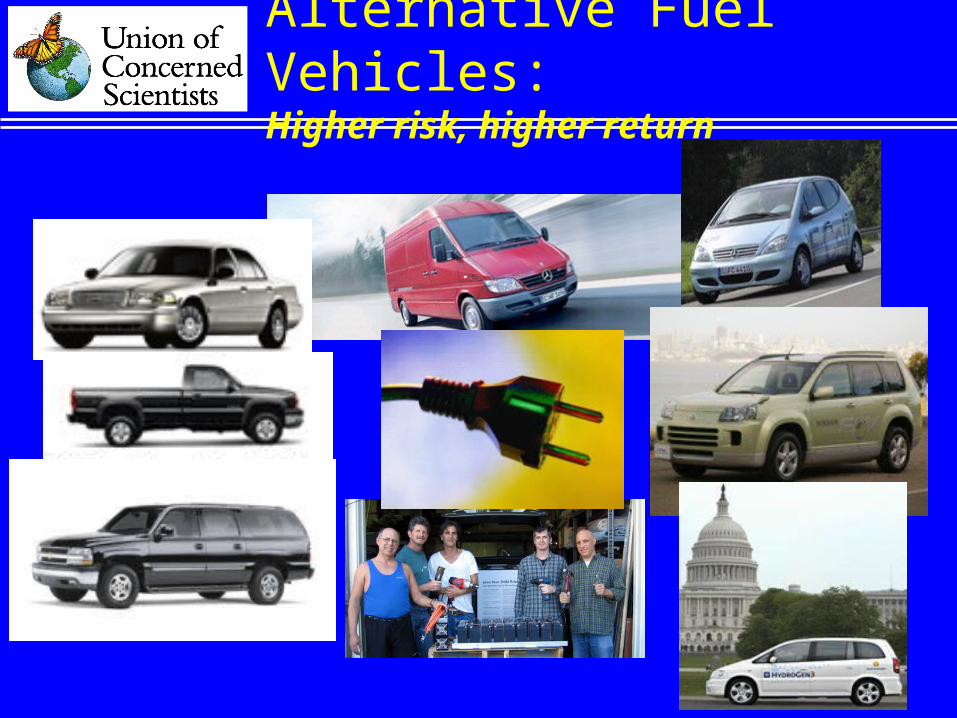
Alternative Fuel Vehicles:Higher risk, higher return

Technology Solutions:Passenger Vehicle Oil Demand
Base Case
0
2
4
6
8
10
12
14
16
2000 2005 2010 2015 2020 2025 2030
Pas
sen
ger
Veh
icle
Fu
el U
se(m
illi
on
bar
rels
per
day
)
Source: UCS Calculations

Technology Solutions:Passenger Vehicle Oil Demand
Remaining Oil Demand
0
2
4
6
8
10
12
14
16
2000 2005 2010 2015 2020 2025 2030
Pas
sen
ger
Veh
icle
Fu
el U
se(m
illi
on
bar
rels
per
day
)
Conventional Vehicles(38 mpg by 2015)
Source: UCS Calculations

Technology Solutions:Passenger Vehicle Oil Demand
Remaining Oil Demand
0
2
4
6
8
10
12
14
16
2000 2005 2010 2015 2020 2025 2030
Pas
sen
ger
Veh
icle
Fu
el U
se(m
illi
on
bar
rels
per
day
)
Conventional Vehicles
Hybrids(55 mpg by 2030)
Source: UCS Calculations

Technology Solutions:Passenger Vehicle Oil Demand
Remaining Oil Demand
0
2
4
6
8
10
12
14
16
2000 2005 2010 2015 2020 2025 2030
Pas
sen
ger
Veh
icle
Fu
el U
se(m
illi
on
bar
rels
per
day
)
Conventional Vehicles
Hybrids
Alt. Fuels
Source: UCS Calculations
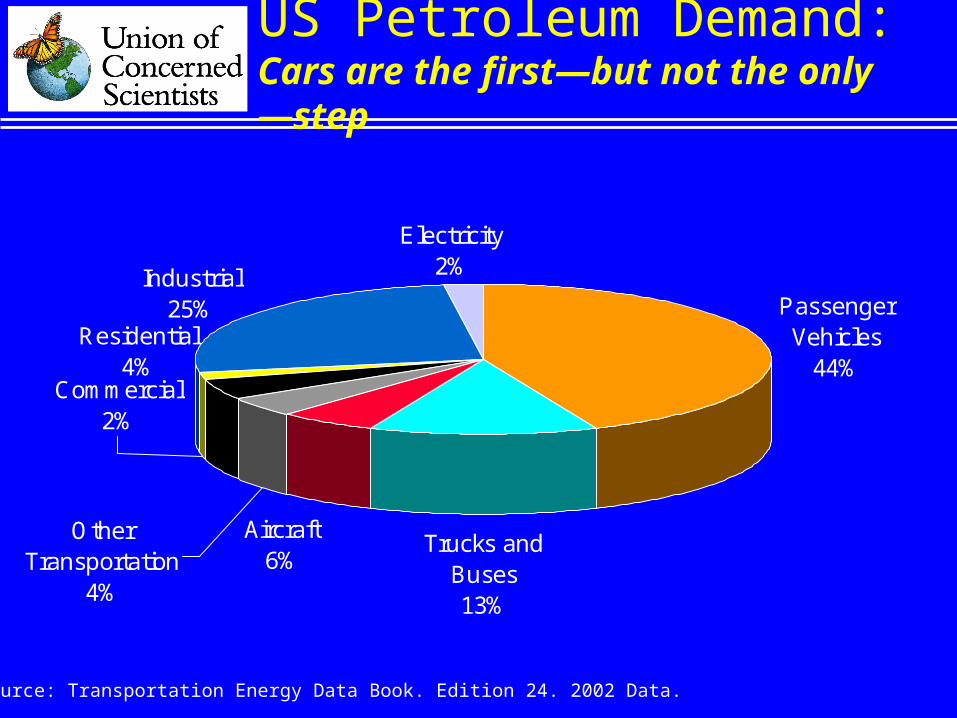
Trucks and Buses13%
Aircraft6%
Industrial25%
Electricity2%
Passenger Vehicles
44%Commercial
2%
Other Transportation
4%
Residential4%
Source: Transportation Energy Data Book. Edition 24. 2002 Data.
US Petroleum Demand:Cars are the first—but not the only—step

Policy Solutions

Signs of Hope