The Value of Forest Ecosystems - UCL · The Value of Forest Ecosystems A Report to The Secretariat...
59
BACKGROUND DOCUMENT The Value of Forest Ecosystems A Report to The Secretariat Convention on Biological Diversity David W Pearce Corin G T Pearce February 2001 DRAFT ONLY: NOT FOR QUOTATION OR REPRODUCTION Contacts: David Pearce, [email protected]; Corin Pearce, [email protected]
Transcript of The Value of Forest Ecosystems - UCL · The Value of Forest Ecosystems A Report to The Secretariat...

BACKGROUND DOCUMENT
The Value of Forest Ecosystems
A Report to The Secretariat
Convention on Biological Diversity
David W Pearce Corin G T Pearce
February 2001
DRAFT ONLY: NOT FOR QUOTATION OR REPRODUCTION Contacts: David Pearce, [email protected]; Corin Pearce, [email protected]

2
Contents 1 Introduction: forests, biodiversity and forest services 2 Forest values 3 Instrumental values and forest classifications 4 The nature of economic value 5 Estimates of forest economic values
5.1 Timber 5.1.1 Sustainable timber management versus conventional logging
5.2 Fuelwood and charcoal 5.3 Non-timber forest products (NTFPs) 5.4 Biodiversity, genetic information and insurance 5.5 Forest land conversion 5.6 Watershed protection 5.7 Carbon storage and sequestration 5.8 Tourism and recreation values
5.8.1 Tropical forests 5.8.2 Temperate forests
5.9 Amenity values 5.10 Option values and existence values 5.11 Changes in values over time 5.12 Forest ownership and economic values 5.13 Summary on economic values 5.14 Costs and benefits of forest land use change
6 The causes of forest loss 6.1 Missing markets 6.2 Discount rates 6.3 Property rights 6.4 Paying for environmental services 6.5 Perverse incentives 6.6 Population change 6.7 Indebtedness 6.8 Internal factors 6.9 'Excessive consumption'
7 Are there new methodologies for economic valuation of forest goods and services? References

3
1 Introduction: forests, biodiversity and forest services Forests worldwide are known to be critically important habitats in terms of the biological diversity they contain and in terms of the ecological functions they serve. Taking species counts as an illustration of biological diversity, the number of described organisms totals some 1.75 million, and it is conjectured that this may be just 13% of the true total, i.e. actual species number perhaps 13.6 million (Hawksworth and Kalin-Arroyo, 1995; Stork, 1999). What fraction of this uncertain total resides in the world's forests is unknown. Wilson (1992) has suggested that perhaps half of all known species reside in tropical forests alone, and WCMC (1992) conjectures that the majority of yet-to-be-discovered species are in tropical areas. Whatever the precise number, forests, and tropical forests in particular, are major locations for biological diversity. The values of forests therefore embody the values of the biological diversity they contain since it seems unlikely that the vast majority of the biological resources in question could occupy non-forest habitats. The ecological services of forests are similarly many. Forests regulate local and global climate, ameliorate weather events, regulate the hydrological cycle, protect watersheds and their vegetation, water flows and soils, and provide a vast store of genetic information much of which has yet to be uncovered. Scientists debate the linkages between biological diversity and ecological services. Those who believe in a strong link argue that any ecosystem, forests included, cannot cope with stresses and shocks if the diversity of the system has been reduced. Others argue that a majority of species are 'redundant' in the sense that their removal would not impair ecosystem functioning. On balance, it seems very likely that uniform systems are more vulnerable: diversity matters for ecosystem performance (Mooney et al. 1995; Holling et al, 1995). The need to understand the values that reside in forests arises from the estimated rates of loss of forest area and, hence, in biological diversity. While still debated, species-area relationships, which predict the number of species lost based on the area lost, suggest that loss rates run into the thousands per year1. Tropical forest extinction rates have been most studied. Assuming that tropical forests account for about one-half of all species diversity, loss rates of tropical forest of just under 1 per cent area per annum would result in 1-10% of the world's species being lost over the next 25 years (Barbault and Sastapradja, 1995). The species-area relationship also entails that current rates of conversion of 'natural' areas will not result in very rapid rates of species loss compared to the loss rates that will ensue when yet further land conversion occurs. In other words, loss rates build up rapidly as the area in question is reduced: 'fewer extinctions now, many more later' (Pimm and Raven, 2000). This situation is exacerbated by the concentration of much diversity into 'hotspots' where rates of land conversion tend to be highest. Even if all remaining hotspot land was immediately protected, it has been suggested that 18% of their species will disappear. If only currently protected hotspot areas remain in a decade's time, 40% of hotspot species will disappear (Pimm and Raven, 2000).
1 The species area relationship takes the form S = cAx where S is the number of species, c is a constant reflecting the density of species per unit area, A is area and x is the slope of the relationship between S and A when S and A are expressed as logarithms. Low values of x indicate that considerable amounts of area can be lost without dramatic effects on species loss - e.g. for x = 0.15, 60% of area lost would result in just 13% loss of species. But the curve then rises dramatically so that the next lost of area results in disproportionately more species being lost. Otherwise, the higher the value of x, the greater the species loss for any given loss of area.

4
2 Forest values The notion of 'value' has been debated in philosophical circles for hundreds of years. The focus here is on instrumental values. Instrumental value derives from some objective function, i.e. the goal or purpose that is being sought. As an example, economic value relates to the goal of maximising human wellbeing (or welfare, or utility), where wellbeing has a particular connotation, namely that someone's wellbeing is said to be higher in situation A than situation B if they prefer A to B. Economic value is anthropocentric - i.e. it is a value for humans - and it is preference based. Instrumental value might be contrasted with moral value. Philosophers debate the source of moral value: to say 'X is good' may mean that the person making the statement simply likes X, that X can be rationally derived as a good thing, that goodness resides in X like an objective quality, or that X is good because a body of religious doctrine says it is good. But moral value can co-exist with instrumental value if what is moral or right is that which achieves some objective, such as human wellbeing. Many people feel that the loss of forests and biodiversity is a moral 'bad', something that simply is 'not right'. Again, philosophers debate whether this moral value resides in the object of value or whether it is conferred on the object by the valuer. If it is objective, residing 'in' the object, then it will exist regardless of whether humans exist as the valuers. The terminology for such objective values usually involves notions of intrinsic or inherent value. If moral value is subjective, on the other hand, then moral value is whatever the valuer thinks it is. The subjective-objective value debate is a long one in the history of philosophy (Beckerman and Pasek, 2001). Other categories of value are named in the Preamble to the Convention on Biological Diversity and include cultural and spiritual values. Such values clearly need to be taken into account in decision-making, but do not lend themselves to quantification. One feature of economic values is that, being based on human preferences, all kinds of motivations can act as determining factors in such preferences, and these motivations may include notions of intrinsic, cultural, social and spiritual value (Beckerman and Pasek, 2001)2. Focusing on instrumental values is not intended to suggest that other values are less important. But instrumental values have a specific feature which makes them relevant to contexts where it is necessary to 'trade' one value against another. Because instrumental value is derived from human attitudes, wants and appreciation of the object, it is possible to weigh up one gain against another gain, and a gain against a loss. This is obviously far more difficult with intrinsic values since it is then necessary to compare the intrinsic worth of objects. As is well known, moral values conflict with each other and there are many debates about what constitutes the 'higher good' in ecological resource conservation (Pearce and Moran, 2001). There are other reasons for focusing on instrumental values, and on economic values in particular. These can be appreciated by looking at the uses of such values - see Table 1.
2 The Ad Hoc Technical Group on Forest Biological Diversity (2000) also lists educational, scientific, recreational and genetic values. These values all have an economic counterpart and hence may be regarded as classes of economic value. It does not follow from this that they are easily measured in economic terms, however.

5
Table 1 A typology of the uses of forest values Context Type of values 1 Demonstrating the importance of forest conservation and sustainable use: awareness raising
All notions of value: moral, spiritual, cultural, aesthetic, economic, ecological
2 Determining damages for loss of forests in liability regimes.
Economic approaches most relevant since they produce money estimates of damage that could constitute liability.
3 Revising the national economic accounts to reflect the values of forest goods and services.
(a) Economic approaches are required for full national
accounting. (b) Physical indicators - e.g. hectarage lost or gained,
are adequate for 'satellite accounting'
4 Land use decisions: e.g.
- encouraging conservation, sustainable forestry or agro-forestry relative to other land uses (e.g. agriculture)
- setting priorities for protected forest areas
Multi-criteria techniques, cost-effectiveness and cost-benefit all relevant. Involves a notion of cost of policy measure and some measure of effectiveness (e.g. biodiversity, value of outputs). Multi-attribute techniques can include spiritual, cultural values etc. but this raises problems of measurability and trade-off against other values.
5 Limiting biological invasions in forests
Cost-effectiveness procedures: cost of measure needs to be compared to expected conservation of diversity.
6 Encouraging eco-certification of forest products
Economic approaches would compare costs of certification with willingness to pay for certified products.
Table 1 shows that economic valuation can have many different uses, but that non-economic 'physical' indicators are also useful. 3 Instrumental values and forest classifications Table 2 provides a classification of forests. The table classifies forests by forest type. A classification by biome is not yet available at this level of detail3
3 It is important to note that the data for plantations in Table 2 are not accurate and reflect the difficulties of differentiating plantations in the WCMC databases. Plantation estimates are probably included in non-plantation forest in the WCMC estimates. An idea of the difference can be obtained by consulting FAO (2001) data for forest plantations. Those data suggest 1.86 million km2 of plantation forest in the world. Unfortunately, FAO data do not distinguish forest cover by forest type in the way that WCMC does so we have used the WCMC data.

6
Tabl
e 2
Fore
st a
rea
by fo
rest
type
Trop
ical
(tho
usan
ds k
m2 )
Wor
ld R
egio
n M
angr
ove
and
swam
p fo
rest
(1)
Mon
tane
(2)
Moi
st ha
rdw
ood
fore
sts (3
)
Dec
iduo
us /
sem
i-de
cidu
ous
broa
dlea
f fo
rest
(4)
Oth
er
tropi
cal (
5)
Dist
urbe
d (6
) Pl
anta
tions
(7)
Tota
l Tro
pica
l
Afri
ca
248.
8 19
3.9
1,71
3.8
2,16
6.1
894.
4 41
5.6
- 5,
632.
7
SE
Asia
(ins
ular
) 11
7.9
302.
1 98
0.2
19.4
3.
5 34
.1
11.4
1,
468.
4
SE
& S
Asia
(con
tinen
tal)
19
.4
112.
2 29
8.2
639.
2 47
.4
244.
5 2.
5 1,
363.
2
Far
Eas
t 0.
0 -
1.1
1.1
- -
0.0
2.3
Mid
dle
East
-
- -
- -
- -
-
Rus
sia
- -
- -
- -
- -
Eur
ope
-
- -
- -
- -
-
Nor
th A
mer
ica
-
- 4.
4 -
- -
2.6
7.0
Cen
tral A
mer
ica
19
.8
263.
9 25
8.0
62.0
63
.4
10.2
-
677.
2
Sou
th A
mer
ica
13
3.1
459.
2 5,
155.
0 11
6.8
1,91
1.7
130.
9 1.
7 7,
908.
4
Carib
bean
12
.3
3.9
9.4
7.7
12.5
6.
9 1.
1 53
.8
Oce
ania
50
.1
1.5
26.1
22
.4
691.
2 -
- 79
1.3
TOTA
L (th
ousa
nds k
m2 )
601.
4 1,
336.
5 8,
446.
1 3,
034.
7 3,
623.
9 84
2.2
19.3
17
,904
.3
TOTA
L (m
illio
ns h
ecta
res)
60
.1
133.
7 84
4.6
303.
5 36
2.4
84.2
1.
9 1,
790.
4
Perc
enta
ge o
f wor
ld
1.5%
3.
4%
21.3
%
7.6%
9.
1%
2.1%
0.
0%
45.1
%

7
N
on-T
ropi
cal (
thou
sand
s km
2 )
Wor
ld R
egio
n Fr
eshw
ater
Sw
amp
Fore
st
Broa
dlea
f (8
)
Scle
ro-
phyll
ous
dry
fore
st
Nee
dlel
eaf
(9)
Mix
ed
need
lele
af /
broa
dlea
f fo
rest
Spar
se
trees
and
pa
rkla
nd
Dis
turb
ed
(6)
Plan
tatio
ns
(7)
Tota
l Non
-Tr
opic
al
Tota
l Tro
pica
l an
d N
on-
Trop
ical
Afric
a -
3.8
18.1
-
28.5
0.
0 -
- 50
.3
5,68
3.1
SE A
sia
(insu
lar)
- -
- -
- -
- -
- 1,
468.
4
SE &
S A
sia
(con
tinen
tal)
1.7
70.0
16
.3
- 33
.0
- 41
.8
- 16
2.8
1,52
6.0
Far E
ast
- 29
6.5
49.1
36
1.9
261.
7 41
9.2
- 65
.5
1,45
3.8
1,45
6.0
Mid
dle
East
-
15.2
10
8.2
34.0
10
.3
- -
- 16
7.7
167.
7
Rus
sia
- 1,
466.
3 -
6,68
7.4
- 10
3.5
- -
8,25
7.2
8,25
7.2
Euro
pe
- 55
0.2
22.8
1,
167.
2 75
.2
- -
- 1,
815.
4 1,
815.
4
Nor
th A
mer
ica
121.
7 1,
275.
5 22
5.0
4,10
2.8
1,23
3.6
1,48
8.3
- -
8,44
7.0
8,45
4.0
Cen
tral A
mer
ica
- -
48.5
-
164.
4 -
- -
212.
9 89
0.1
Sout
h Am
eric
a 3.
6 36
0.6
8.2
- 0.
7 12
9.2
18.7
-
521.
1 8,
429.
5
Car
ibbe
an
- -
- -
- -
- -
- 53
.8
Oce
ania
-
56.4
20
3.3
11.2
-
431.
0 -
- 70
1.9
1,49
3.2
TOTA
L (th
ousa
nds
km2 )
127.
0 4,
094.
5 69
9.5
12,3
64.3
1,
807.
5 2,
571.
2 60
.5
65.5
21
,790
.0
39,6
94.3
TOTA
L (m
illio
ns h
ecta
res)
12
.7
409.
4 70
.0
1,23
6.4
180.
7 25
7.1
6.1
6.5
2,17
9.0
3,96
9.4
Perc
enta
ge o
f wor
ld
0.3%
10
.3%
1.
8%
31.1
%
4.6%
6.
5%
0.2%
0.
2%
54.9
%
100.
0%

8
Sour
ce: A
dapt
ed fr
om Ir
emon
ger e
t al.
1997
. FA
O (2
001)
repo
rt so
me
chan
ges i
n fo
rest
cove
r sta
tistic
s but
thes
e w
ere
not a
vaila
ble
to u
s at t
he ti
me
of w
ritin
g an
d do
not
follo
w th
e sa
me
clas
sific
atio
n as
the
UN
EP-W
CMC
statis
tics.
Note
s: (1
) man
grov
e an
d fre
shw
ater
swam
p fo
rest;
(2) u
pper
(abo
ve 1
800
m) a
nd lo
wer
(120
0-18
00 m
) mon
tane
fore
st; (3
) eve
rgre
en a
nd se
mi-e
verg
reen
bro
adle
af ra
in o
r moi
st br
oadl
eaf f
ores
t bel
ow 1
200
m; (
4) se
mi-d
ecid
uous
and
dec
iduo
us b
road
leaf
fore
st be
low
120
0m; (
5) n
eedl
elea
f, th
orn,
schl
erop
hyllu
s dry
fore
sts a
nd sp
arse
tree
s and
par
klan
d; (6
) al
l for
est w
ith si
gnifi
cant
dist
urba
nce
due
to ro
ads,
logg
ing
etc;
(7) e
xotic
and
nat
ive
spec
ies,
but s
ee fo
otno
te re
gard
ing
the
inac
cura
cy o
f the
WCM
C da
ta; (
8) d
ecid
uous
and
ev
ergr
een
broa
dlea
f; (9
) eve
rgre
en a
nd d
ecid
uous
nee
dlel
eaf.

9
The main instrumental values associated with each category are shown in Table 3 which borrows the classification of forest types in Table 2. Table 3a Economic values by forest type: Tropical (� benefit, × cost, • no effect)
Mangrove / sw
amp
Montane
Moist
Broadleaf
Semi-
deciduous
Other
Disturbed
Plantation
Timber • • �� �� � × �
Fuelwood / charcoal � • • � � × woodlots
NTFPs � • � � � × • • � � � • × •
Genetic information: - Agricultural - Pharmaceutical • � � � • × •
Recreation / tourism � � � � • × •
Research / education � � � � • × • DIR
ECT
USE
VA
LUES
Cultural / religious • � � �? • × •
� �� �� � • × � � � � � • × • � � � � • × • � • • • • × •
Watershed functions: - Soil conservation - Water supply - Water quality - Flood / storm protection - Fisheries protection
� � � � • × •
� � � � � × • Global climate: - Carbon storage - Carbon fixing � • • • • × �
Biodiversity � �� �� � � × •
IND
IREC
T U
SE V
ALU
ES
Amenity (local) ? • • • ? × ×
OPTION VALUES ? � � � • × •
EXISTENCE VALUES � �� �� � ? × •
Crops • • � � � � •
Grassland • • � � • � •
Agri-business • • • � • � •
Aquaculture � • • • • • •
LAN
D
CON
VER
SIO
N
VA
LUES
Agroforestry • • � � • • •

10
Table 3b Economic values by forest type: Temperate / Boreal
Freshwater
swam
p
Broadleaf
Sclerophyllous dry forest
Needleleaf
Mixed needleleaf / broadleaf
Sparse trees and parkland
Disturbed
Timber • � � • � • ×
Fuelwood / charcoal • � • • • • •
NTFPs � • • • • • • • • • • • • •
Genetic information: - Agricultural - Pharmaceutical • • • • • • •
Recreation / tourism � �� � � � �� ×
Research / education • � • • • • • DIR
ECT
USE
VA
LUES
Cultural / religious • • • • • • •
� � � � � • × � � � � � • × � � � � � • × � �� � � � • ×
Watershed functions: - Soil conservation - Water supply - Water quality - Flood / storm protection - Fisheries protection
� • • • • • • • � � � � • ×
Global climate: - Carbon storage - Carbon fixing • � � � � • ×
Biodiversity � �� � � � • ×
IND
IREC
T U
SE V
ALU
ES
Amenity (local) � �� � � � �� ×
OPTION VALUES � ? ? ? ? � ×
EXISTENCE VALUES � � • • • � ×
Crops • • • • • • •
Grassland • • • • • • •
Agri-business • • • • • • •
Aquaculture � • • • • • •
LAN
D
CON
VER
SIO
N
VA
LUES
Agroforestry • • • • • • •

11
4 The nature of economic value Forests are multi-functional: they provide an often complex array of goods and services. It is important to understand that describing, and where possible quantifying, these functions does not always entail that the functions can co-exist under particular management regimes. Forests managed for eco-tourism may not be usable for timber extraction; forests conserved for the supply of genetic information from the canopy can similarly not be converted to other uses, and so on. Economic valuations of forest goods and services are based on the notion of willingness to pay which, in turn, is based on the measurement of individuals' preferences, the basis for 'welfare economics'. Willingness to pay is determined by motivations which may vary from pure self-interest to altruism, concern for future generations, environmental stewardship and a concern for other sentient beings. Survey techniques in environmental economics reveal that motivations vary significantly between individuals, but that self-interest is only one of many motives for environmental valuations. Willingness to pay has a direct counterpart in markets where it is formally equivalent (when expressed in 'marginal' terms) to the demand curve familiar in basic economics textbooks. Market prices thus reflect willingness to pay for the last unit purchased. Total willingness to pay will exceed the price paid because some consumers will be willing to pay more than the market price, thus gaining 'something for nothing', which is known as the consumers' surplus. As long as the forest good or service is being valued in marginal terms - i.e. what is being valued is a small change in the level of provision - then willingness to pay as revealed by market price is a sound indicator of economic value. If the interest is in discrete changes - e.g. a 10 or 20% change in provision - then price will understate true willingness to pay by the amount of consumer surplus. While there has been a lot of interest in valuing the totality of ecosystem services (e.g. Costanza et al, 1997), such exercises have no economic meaning. The removal of all forests, for example, would involve the loss of a major life support system. Economic values have no meaning in this context because the question as to what is the 'value of everything' has no meaning (Pearce, 1998)4. The appropriate context for economic valuation is therefore the value of a small or a discrete change in the provision of goods and services through, say, the loss or gain of a given increment or decrement in forest cover. Many forest goods and services do not have markets and it is accordingly necessary to resort to non-market valuation techniques. In all cases these techniques seek to elicit individuals' willingness to pay for a change in the level of provision of a forest good or a set of such goods. Approaches to 'valuing the forest' may therefore comprise attempts to value individual goods and services with subsequent aggregation of the values, or the approach may involve valuing a change in the level of the provision of the forest generally. The former approach, the bottom up approach, risks a 'part-whole' bias whereby the sum of the individual components is greater than or less than the value of the total set of goods and services. The latter approach, the top down approach, may similarly have errors if individuals are not aware of the full range of services provided by the forest. Both approaches have been used in the forest values literature. Valuing the 'whole' forest does not breach the requirement that what is valued is an increment or decrement, since 'whole forest' studies tend to relate to specific forests which can then be seen as a small change with respect to the totality of forests in a region or, indeed, in the world as a whole.
4 Accordingly, the values quoted by Costanza et al. (1997) are not repeated here.

12
Non-market valuation techniques are twofold. The first involves looking for markets where the forest service affects that market, even though the service is not bought and sold directly. An example would be the value of property located near to woodland or forest. Studies show that property prices are, other things equal, higher in such locations than in locations without proximity to forests. The differential in the house price is a first approximation of the economic value of the forest. This is an example of a revealed preference procedure, in this case the 'hedonic property price' approach. Other revealed preference procedures relevant to forests include: (1) the travel cost method, whereby willingness to pay is inferred from expenditures on travel to
and from the forest for recreational purposes (2) the discrete choice method whereby values are inferred by looking at the choices people
make between two alternatives. An example would be certificated timber: if individuals are willing to pay more for certified timber than for identical non-sustainable timber, the increment reflects individuals' valuation of the environmental benefits from sustainable timber regimes.
The alternative to revealed preference is stated preference. This is essentially a questionnaire based approach in which individuals are asked attitudinal questions about the forest good, and are then asked their willingness to pay to conserve the good or improve its quality etc. The approach is essentially a variant of market research and has the same attractions and difficulties. The main problem is hypothetical bias, i.e. determining the extent to which individuals reply truthfully about their willingness to pay. Stated preference procedures have become very sophisticated and early studies are now generally not regarded as being reliable. Questionnaires that ask 'what is your maximum willingness to pay' or 'are you willing to pay $X' are known as contingent valuation procedures. Questionnaires that present respondents with 'bundles' of attributes and ask them to choose between these bundles, or to rank or rate them, are known as choice modelling procedures. In choice modelling, respondents are not asked their willingness to pay, but one of the attributes of the choice sets they are confronted with is a price, so that willingness to pay can be inferred. Contingent valuation has been used extensively in the forest context, choice modelling tending to be more recent. The types of economic value to be found in forests are use values and non-use values. Use values refer to willingness to pay to make use of forest goods and services. Such uses may be direct, e.g. extractive uses, or indirect, e.g. watershed protection or carbon storage. Use values may also contain option values, willingness to pay to conserve the option of future use even though no use is made of the forest now. Such options may be retained for one's own use or for another generation (sometimes called a 'bequest' value). Non-use values relate to willingness to pay which is independent of any use made of the forest now or any use in the future. Non-use values reveal the multi-faceted nature of the motivations for conservation, e.g. being driven by concerns about future generations, the 'rights' of other sentient beings etc. Table 2 roughly follows the distinctions introduced here. The sum of use and non-use values is total economic value. It is this value that is lost if a forest area is converted to other uses or seriously degraded. Total economic value can then be estimated by summing individual use and non-use values, or by seeking some all-encompassing willingness to pay for 'the forest' generally.

13
5 Estimates of forest economic values This section reviews the available evidence on the economic values associated with forest goods and services. 5.1 Timber Two types of timber use need to be distinguished: commercial and non-commercial. Local uses may be commercial or can relate to subsistence, e.g. building poles. World industrial roundwood production expanded substantially between 1960 and 1990 from some 1 billion m3 to 1.6 billion m3 but has since fallen back to some 1.5 billion m3 in the late 1990s (Barbier et al, 1994; FAO, 2000). Wood-based panel and paper/paperboard production show steadily rising demand which is partially offset by reductions in the demand for sawnwood. Tropical woods production accounts for around 40% of total roundwood production, and tropical woods exports account for 25% of world production (Barbier et al, 1994). Europe and North/Central America account for 65% of world industrial roundwood production, with Asia accounting for about 20% and South America accounting for 9%. Since timber is marketed, its economic value should, in principle, be easy to derive. In practice there are formidable problems in determining this value. First, the 'ex forest' price of a log refers to the price received on sale to a processor or an exporter. The costs of extraction and transportation need to be deducted. It is not easy to find reliable estimates of such costs. In turn, the 'value of the timber stand' is given by the maximum that a concessionaire should be willing to pay for the concession. This is known as the 'stumpage value'. Estimates of stumpage value are also difficult to find. No estimates of the total financial value of world timber output appear to be available. The value of world trade in all timber products is around $120 billion, with trade accounting for significant proportions of production in sawnwood (28%) and paper and paperboard (40%). Since this figure is gross of costs it does not constitute a figure that can be compared to world Gross 'National' Product5. 5.1.1 Sustainable timber management versus conventional logging In a comprehensive survey of sustainable forestry practice, Pearce et al. (2001) find that sustainable forest management is less profitable than non-sustainable forestry, although definitional problems abound. Profit here refers only to the returns to a logging regime. They do not include the other values of the forest. Annex 1 reproduces the results for those cases where absolute profit figures are reported. The general result is that sustainable timber management can be profitable, but that conventional (unsustainable) logging is more profitable. This result is hardly surprising given the role that discount rates play in determining the profitability of forestry. The higher the discount rate the less market value is attached now to yields in the future. If logging can take place in natural forests with maximum harvest now, this will generate more near-term revenues than sustainable timber practice. Similarly, sustainable timber management involves higher costs, e.g. in avoiding damage to standing but non-commercial trees. The significance of the general result is that the non-timber benefits, including ecological and other services, from sustainable forests must exceed the general loss of profit relative to conventional logging for the market to favour sustainable forestry.
5 GNP is measured by 'value added' not the total value of output.

14
5.2 Fuelwood and charcoal. FAO (2000) statistics suggest that that some 1.86 billion m3 of wood is extracted from forests for fuelwood and conversion to charcoal. Of this total, roughly one-half comes from Asia, 28% from Africa, 10% from South America, 8% from North and Central America and 4% from Europe. Smil (1987) puts all biomass energy (i.e. including dung and crop residues) at 15% of world energy consumption. Goldemberg et al. (1987) suggests that some 43% of developing countries' energy consumption comes from non-commercial sources, while Miller and Tangley suggest 26% for fuelwood alone. The International Energy Agency (1998) estimates that 11% of world energy consumption comes from biomass, mainly fuelwood. IEA (1998) estimates that 19% of China's primary energy consumption comes from biomass, the figure for India being 42%, and the figure for developing countries generally being about 35% (see also UNDP et al., 2000). All sources agree that fuelwood is of major importance for poorer countries and for the poor within those countries. While fuelwood may be taken from major forests, much of it comes from woodlots and other less concentrated sources. Extraction rates may or may not be sustainable, depending on geographic region. Hardly any fuelwood and charcoal is traded internationally. Local values of fuelwood and charcoal can be highly significant in terms of the local economy. Shyamsundar and Kramer (1997) show that the value of fuelwood per household per annum for villages surrounding Mantadia National Park in Madagascar is $39. This can be compared with an estimated mean annual income of $279, i.e. collected fuelwood from the forest accounts for 14% of household income. NTFPs generally account for 20-35% of household income in West Bengal (Kant et al, 1996). Houghton and Mendelsohn (1996) find that the value of fuelwood constitutes from 39-67% of local household income from fodder, fuel and timber in the Middle Hills of Nepal. 5.3 Non-timber forest products (NTFP) Table 2's coverage of non-timber forest products refers to extractive products other than fuelwood. Also omitted here is agro-forestry. Following Chomitz and Kumari (1996), agro-forestry is best seen as a form of forest conversion, although this should not detract from its attractions as an environmentally sound land use. NTFP extraction may be sustainable or non-sustainable and few studies make observations as to which is the case. Extractive uses include: taking wild animals for food (hunting), taking animals, fish, crustaceans and birds for local or international trade or for subsistence use, taking tree products such as latex, wild cocoa, honey, gums, nuts, fruits and flowers/seeds, spices, plant material for local medicines, rattan, fodder for animals, fungi, and berries. The importance of NTFPs is not necessarily captured by the economic value per hectare. This is because the benefits of NTFPs accrue mainly to local communities. The size of the population base making use of the forests is therefore comparatively small and the implied value per hectare may therefore also be small due to the unit values being multiplied by a comparatively small number of households. For this reason it is important to discern, as far as possible, what the value of the NTFPs is as a percentage of household incomes. As is shown below, this perspective demonstrates the critical importance of NTFPs as a means of income support. Indeed, it underlines the need to ensure that measurements of household income include the non-marketed products taken 'from the wild'.

15
Early arguments that NTFP (plus sustainable timber extraction) values could exceed those to be to be obtained by land clearance and conversion to a non-forest use (e.g. Peters et al. 1989) have largely been discredited (a) because of poor design of these studies and (b) because of subsequent research. The value of NTFPs, expressed per hectare of forest land, varies significantly with geographical location (e.g. access to markets). Nonetheless, NTFPs have been shown to be extremely important for local communities in some studies. Kant et al. (1996) note that the value of NTFPs is inversely correlated with GNP, suggesting that NTFPs are, as one might expect, an 'inferior' product6. The task of summarising the state of the art in estimating non-timber values in the tropical forest context has been facilitated by a number of recent surveys: Godoy et al. (1993), Pearce and Moran (1994), Southgate (1996), Lampietti and Dixon (1995), Bann (1998a) and Batagoda et al. (2000)7. Unfortunately, these surveys are dated, omit some of the literature, and additionally significant new material has emerged. There are substantial difficulties in reaching general conclusions, primarily because appropriate guidelines for carrying out such studies, such as those set out in Godoy et al. (1993) and Godoy and Lubowski (1992) have not been followed. The result has been a mixture of legitimate and illegitimate valuation procedures. The types of mistake made have included generalisation from studies of a small area of forest to wider areas, with little regard for (a) the fact that the area in question will not be typical of the whole forest area simply because of variations in distance to market, (b) ignoring the fact that, in a hypothetical world where the whole forest was exploited for non-timber products, the prices, and hence the profitability, of non-timber production would fall; (c) failing to define whether the values in question relate to the stock of goods and services, their potential flow if exploited efficiently, and their actual flow; (d) failing to account for post-harvest losses. Studies also vary as to whether they report revenues or revenues net of labour and other costs. Little account has been taken in many of the studies of the extent to which the relevant non-timber activity is itself sustainable, so that what is being compared may well be two non-sustainable land use options. Southgate (1996) notes that quite a few extractive NTFP ventures have collapsed due to over-exploitation. Finally, there is likely to be 'selection bias': only studies that report, or seek out, positive values are being reported. Table 4 summarises the findings of the literature with respect to NTFPs.
6 An inferior product is one where the demand for the product goes down as income rises. 7 A useful elementary introduction is Bishop (1998) but this report contains no empirical material.

16
Table 4 Studies of the economic values of NTFPs
$ per ha pa, gross of costs (G) or net of costs
(N) Entity being
valued/authors Products Site
G N Stock of goods Peters et al, 1989 Flora Iquitos, Peru 700 420 Batagoda, 1997 Trees, climbers,
herbaceous Sinharaja, Sri Lanka 622 377
Ammour et al. 2000 Includes environmental services
Petén, Guatemala 787
Potential flow Pinedo-Vasques et al. 1992
Flora (latex, fruits) Iquitos, Brazil 20
Batagoda 1997 Flora Sinharaja, Sri Lanka 186 Actual flow Schwartzman 1989 Flora Amazon, Brazil 5 Nations 1992 Flora Maya, Guatemala 10 Nations 1992 Flora Amazon, Brazil 5-16 Padoch and de Jong 1989 Flora Iquitos, Peru 18-24 Anderson and Ioris 1992 Flora (some) Combu Isl, Brazil 79 Alcorn 1989 Flora Veracruz, Mexico 116 Chopra 1993 Flora India 117-144 Gunatilleke et al., 1993 Flora Sinharaja, Sri Lanka 13 Batagoda 1997 Flora Sinharaja, Sri Lanka 14 Grimes et al, 1994 Flora Amazon, Ecuador
(various plots) 77-180
Balick and Mendelsohn, 1992
Flora (medicinal plants) Belize 41-188
Mori 1992 Flora (Brazil nuts only) Brazil 97 Bojö, 1993 Flora + wood
crafts/implements Woodland, Zimbabwe 21
Houghton and Mendelsohn, 1996
Fodder (leaves and grass) Nepal 33-115
Ruitenbeek, 1988 Fauna (hunting) Korup, Cameroun 1 Thorbjarnason, 1991 Fauna (caiman) Venezuela 1 Wilkie, 1989 Fauna (hunting) Zaire 1-3 Caldecott, 1988 Fauna (wildlife) Sarawak, Malaysia 8 Batagoda 1997 Fauna (hunting) Sinharaja, Sri Lanka 2 Kramer et al, 1995 Flora and fauna Mantadia, Madagascar 4 Meinyk and Bell, 1996 Flora and fauna (food
only) Southern Venezuela 15
Campbell et al. 1995 Flora and fauna (wood, birds, fruit, mushrooms)
Zimbabwe 57-92
Ammour et al. 2000 Includes environmental services
Petén, Guatemala 30
Yaron, 2001 Flora and fauna Mt Cameroun, Cameroun 6 Bann, 1997 Nuts, wildmeat, rattan etc. Ratanakiri, Cambodia 19 Bann, 1998b Flora and fauna Turkey 5 Mangrove systems Ammour et al. 2000 actual flows sustainable flows
Various, including recreation
Nicaragua 70 130

17
While caution needs to be exercised, the values shown in Table 4 do suggest a clustering of NTPF net values of a few dollars per hectare per annum up to around $100. Lampietti and Dixon (1993) suggest a 'default' value of around $70 per hectare, and Pearce (1998) has suggested $508. However, it would be a serious error to extrapolate these benchmark values to all forest. Typically, the higher values relate to readily accessible forest and values for non-accessible forest would be close to zero in net terms due to the costs of access and extraction. While such values on their own will not 'compete' with many land conversion values, the importance of NTFPs lies more in the role they play in supporting local community incomes. Table 5 illustrates some typical relationships between the value of NTFPs and local incomes. The essential point is that NTFPs can constitute a substantial fraction of household incomes, so that, even if such values fail to compete with alternative land uses, serious local poverty issues can arise if the benefits of the competing land use do not accrue to those who lose the forest products in question. Table 5 NTFPs as percentages of total household income
Study Site NTFPs as % household income Lynam et al. 1994 Zimbabwe:
Chivi Mangwende
40 - 160 12 - 47
Houghton and Mendelsohn, 1996 Middle Hills, Nepal Fodder, fuel and timber can yield as much net revenue as agriculture
Kramer et al. 1995 Mantandia, Madagascar 47 (lost forest products as % of household output)
Bahuguna, 2000 Madhya Pradesh, Orissa and Gujarat, India
49 (fuelwood and fodder = 31%, 10% employment, 6% other NTFPs, 2% timber and bamboo)
Cavendish, 1999 Zimbabwe 35% (across many different environmental goods)
5.4 Biodiversity Defining where the world's biological diversity is located is a complex question, not least because of serious uncertainties about just how many species actually exist. Moreover species diversity is one, albeit convenient, indicator of overall biological diversity. Typically, however, species richness increases from the poles to the equator. The species density of tropically forested areas is well documented (e.g. Reid and Miller, 1989). Tropical forests probably contain more than half the world's species. Patterns vary according to whether the indicator relates to mammals, insects, plants etc. Islands have a critical role to play, often containing high species endemism. The economic value of this diversity is the subject of a rapidly growing literature but one that remains very unsatisfactory in terms of the reporting of values for forest types. Part of the problem lies in the confusion between the value of biological resources and the value of
8 The values shown also reflect local market conditions and there is no reason why prices will be similar in the different locations, e.g. because incomes vary significantly.

18
biodiversity. Many studies relate to the former and few to the latter. The essence of the value of diversity is that it embodies the value of information and insurance. Existing diversity is the result is evolutionary processes over several billion years. This suggests two things: that existing diversity embodies a stock of information, and, because the evolutionary process has occurred in the context of many different environmental conditions, the diversity of living things also embodies characteristics that make them resilient to further 'natural' change (but not to human intervention). In essence, the existing stock of diversity exists to protect the entire range of goods and services, including information, provided by the diverse system. The diversity contains information that can be used to develop those goods and services for the benefit of humankind. In turn, this information derives from the fact that all species co-evolve and hence interact with each other. Swanson (1997) likens the information to a huge library on chemically active ingredients, a library that has barely been accessed. The value of the known information is therefore only a part, and potentially only a trivial part, of the total value of the information stock. Retaining the stock in the event that it will be useful later on represents an 'option value' for the known element, and a 'quasi option value' for the currently unknown element. Information values Advances have been made in respect of the valuation of the information functions of diversity, although a serious debate exists about the findings so far. Potentially, the information can be fed into plant breeding, into pharmaceutical 'blueprints' for drugs, perhaps into industrial processes and so on. The more unique the information is, the more valuable it is, so that the existence of substitutes is a critical factor affecting the economic value of the information. This has affected efforts to value the information content in several ways. First, while forest degradation continues at an alarming rate, it can be argued that the remaining stock is so large that willingness to pay to conserve part of the stock is currently small. That willingness to pay will rise as the stock depletes. Second, the willingness to pay will be small as long as there are substitutes and this is true of both agricultural germplasm and 'medicinal' germplasm. Also relevant is the fact that research and development effort is more easily diverted to genetic manipulation than to the identification of 'wild' genetic information: it may soon be cheaper to prevent a human disease than to cure it. Swanson (1997) reports the results of a survey of plant-breeding companies a shown in Table 6 below. This shows that, overall, the sampled companies rely on germplasm from relatively unknown species for 6.5% of their research (i.e. on in situ and ex situ wild species and landraces). This percentage appears small compared to the more than 80% of research relying on commercial cultivars, but the figure has an important meaning. If the 6.5% is expressed as a percentage of the 82.9% well understood and standardised material, this suggests that the stock of germplasm within the agricultural system tends to depreciate at a rate of 8% of the material currently in the system. Put another way, this 8% ‘injection’ of the relatively unknown species is required just to maintain the system as it is. But the 8% comes from a stock of natural assets – biodiversity – that is itself eroding. So the loss of biodiversity world-wide imposes an increasing risk on the agricultural sector. Essentially, the stock of germplasm within the agricultural system is being renewed at a time interval that is probably around 12 years (100/8). Biodiversity has economic value simply because it serves this maintenance function. Without it, there are risks that the system will not be able to renew itself. It is not known what proportion of the germplasm in Table 6 comes from forests.

19
Table 6 The role of biodiversity in agriculture: sources of germplasm in a sample of plant breeding companies
Source of germplasm Percentage from each source
Commercial cultivator Related minor crop Wild species: ex situ genebanks Wild species: in situ Landrace: ex situ genebank Landrace: in situ Induced mutation Biotechnology
81.5 1.4 2.5 1.0 1.6 1.4 2.2 4.5
Relatively wild species 6.5
Source: Swanson (1997). There are several ways of estimating the economic value of this germplasm. First, it could be argued that the economic value of wild crop genetic material is given by what the crop breeding companies are willing to pay for it. At a minimum, this must be equal to that portion of their R&D budgets spent on germplasm from the more remote sources. Second, an effort could be made to estimate the crop output that would be lost if the genetic material was not available. This is an approach based on damages. Third, an attempt could be made to estimate the contribution of the genetic material to crop productivity – a benefits approach. This approach might proceed by asking what the cost would be of replacing or substituting for wild genetic material should it disappear – a ‘replacement cost’ approach. By and large, we would expect the damage and benefits approach to produce the same answer: benefits will equal damages avoided. But all approaches have their problems. The R&D expenditure approach is complicated by the fact that expenditures are a minimum valuation and it is the rate of return to those expenditures that is a better estimate of value. However, rates of return calculations are complicated by the fact that there are other ‘inputs’ besides genetic material which contribute to value. Separating out the different contributions may be difficult. The replacement cost approach assumes that lost wild genetic material must be replaced, i.e. that there is some constraint on the ‘stock’ of wild biodiversity. Strictly, the issue is whether replacement is worthwhile, so that what should be compared is the cost of replacement (the cost) with the avoided damages (the benefits). As domesticated crops become vulnerable to pests and genetic erosion, so new genetic information is required. The stock of that information provides the insurance against the failure of existing crop genetic stock. There are two sources of vulnerability in the current crop genetic stock: (a) it is based on very few plant families and (b) there is a high rate of loss of wild genetic stock, mainly because of forest conversion. Hence there is a 'red queen race' whereby wild relatives occupy less and less land and the demand for the genetic information they contain grows rapidly. That demand is increasingly being met from other sources, but wild sources

20
remain important. The role of forests in providing that information should not be exaggerated, however. As far as plant based foods are concerned, existing widely-used crops tend not to emanate from tropical forests but from warm temperate regions and tropical montane areas. The existing 'Vavilov' centres of crop genetic diversity are mainly in areas with low forest diversity. While this suggests that forests generally have only a limited role to play as the source of information and diversity for food crops, it should be borne in mind that existing food crops emanate from areas where humans happened to live. It does not follow that forests are irrelevant to future crop production. It seems probably that their value lies more at the regional than the global level (Reid and Miller, 1987). Overall, systematic estimates of the informational value of wild species to crop output are not available. The informational value of forest diversity for pharmaceutical use is better studied. There are two distinct views about the economic value of genetic material with potential pharmaceutical use. The first argues that the implicit economic value is huge, and the second suggests that it is very modest, at least when converted to economic values per unit of land area. Much of this debate surrounds the ‘global’ value of medicinal plant material. There is far less of a dispute about the localised values of traditional medicines, and these are arguably substantial within the context of a local economy (see under NTPFs). The most sophisticated studies (Simpson et al., 1994; 1996; Simpson and Craft, 1996; Rausser and Small, 1998a, 1998b) suggest different results. The original Simpson et al. studies suggest very low values per hectare of forest. Barbier and Aylward (1996) which analysed the MERCK-INBIO deal between Merck and Costa Rica reached similar conclusions. The Rausser and Small studies and the later Simpson et al. studies suggest somewhat higher values. It is important to understand that the values in questions are for marginal species. The total value of biodiversity is clearly unbounded: without biodiversity there would be no human life and hence no economic value. In the pharmaceutical context, then, the relevant economic value is the contribution that one more species makes to the development of new pharmaceutical products, and, by inference, the value of one extra hectare of forested land is the value attached to the species in that area. The studies of Farnsworth, Principe, Pearce and Puroshothaman, and Artuso all estimate average values, i.e. the probability that a species will yield some commercial product multiplied by the commercial or social value of that product. Hence these studies also have limited policy relevance since they do not relate to the marginal species or the marginal area containing biodiversity. Table 7 summarises the values obtained in the recent studies for a given hectare of forest in different forest 'hot spot' regions.

21
Table 7 Estimates of the pharmaceutical value of ‘hot spot’ land areas ($ per hectare)
Area Simpson et al. (1994) WTP of pharmaceuti-cal companies.
Simpson & Craft (1996) ‘Social value’ of genetic material per ha.
Rausser & Small (1998a) WTP of phar-maceutical companies
Western Ecuador Southwestern Sri Lanka New Caledonia Madagascar Western Ghats of India Philippines Atlantic Coast Brazil Uplands of western Amazonia Tanzania Cape Floristic Province, S. Africa Peninsular Malaysia Southwestern Australia Ivory Coast Northern Borneo Eastern Himalayas Colombian Choco Central Chile California Floristic Province
20.6 16.8 12.4 6.9 4.8 4.7 4.4 2.6 2.1 1.7 1.5 1.2 1.1 1.0 1.0 0.8 0.7 0.2
2,888 2,357 1,739 961 668 652 619 363 290 233 206 171 160 138 137 106 104 29
9,177 7,463 5,473 2,961 2,026 1,973 1,867 1,043 811 632 539 435 394 332 332 231 231 0
Source: Simpson et al., 1996; Simpson and Craft, 1996; Rausser and Small, 1998a. Table 7 suggests that pharmaceutical genetic material could be worth several hundreds of dollars per hectare in most hotspot areas, and perhaps up to several thousands of dollars for selected areas. For the major part of the world's forests, however, values will be extremely small or close to zero.
Diversity as an insurance value Apart from the 'products' approach to the value of diversity, i.e. looking at the economic value of the products derived from the value of information, which in turn derives from the diversity within the forest, it is diversity that defines the nature of the forest as an ecosystem. Hence diversity is essential as a precondition for all the other values defined for the forest, from tourism to timber and non-timber products, and including the information flows On this basis, the economic value of diversity as insurance is the insurance premium that the world should be willing to pay to avoid the value of the forest goods and services being lost. The actuarially fair premium for this insurance, if a market for it existed, is the probability of the loss occurring multiplied by the value of all the losses that would occur (Pearce, 2001). No attempt has been made anywhere to estimate, even approximately, what this premium is, but it is clearly very large since the probability of loss is known to be high9 and the values are also potentially high (as demonstrated in other sections). The complication, again, is that the premium will be small for the initial continuing losses of forest cover, rising only as the forest cover is lost.
9 And could be estimated from the current rates of loss of forest cover.

22
Some limited information exists on these insurance values. Most farmers in developed countries can insure against crop losses by paying premia. In many ways, this financial insurance can be thought of as a substitute for ‘natural’ insurance brought about by diversity. If so, expenditures on crop insurance might be thought of as a ‘first cut’ estimate of the insurance value of crop diversity. The complication is that, if the insurance system works efficiently, farmers will only be choosing financial insurance because they regard it as cheaper than the natural form of insurance. Essentially, financial contributions through premia will cost less than the forgone profits from a diverse but lower productivity system. In this case, the financial insurance overstates the value of diversity. However, as WCMC (1992) note, crop insurance systems, at least in the USA, are not efficient. They are subsidised by government, which means that the insurance industry is unwilling to bear all the risks from agricultural failure. This unwillingness probably derives from the very fact of uniformity in the agricultural system, since if one farmer fails so will other farmers: they each engage in the same risky activity of reducing diversity. Insurance only works efficiently where risks are pooled, i.e. where each farmer faces different risks. In this context, then, crop insurance values may be a reasonable first indicator of the insurance value of diversity. WCMC data suggest that total premia in 1990 in the USA amounted to $820 million, of which 75% consisted of farmers’ premia and 25% government grant. Total government pay outs in 1988 were some $890 million, reflecting additional items like compensation for crop losses over and above the premia allowances. Perversely, these subsidies are then encouraging the reduction in natural diversity by encouraging the use of financial insurance. Another perspective on insurance can be obtained by looking at ‘extreme events’, i.e. situations in which entire crop failures have occurred and which can be ascribed to lost genetic diversity. Some scholars have argued that entire civilisations have been lost because of uniformity in a basic food crop, e.g. the Mayan civilisation and its reliance on maize, which was subject to a virus. The Irish potato blight of the 1840s is another example. More recent crises have affected maize, citrus fruit, wheat and rice in various parts of the world (WCMC, 1992). The unsatisfactory nature of current research lies in the fact that 'true' value of the forests lies in the role they play as the repository of biological diversity and that the economic value of this diversity has yet to be rigorously measured. The diversity embodies billions of years of information and billions of years of 'resilience' to environmental change. The latter protect the former but also protects all the other functions of forests - use and non-use values alike. Hence the economic value of any tract of forest must be equal to its informational value plus its insurance value. Informational values for agriculture and pharmaceuticals are under investigation, with widely differing results from the studies so far. The insurance value needs to be thought of as premium to cover the loss of all values. A final approach to valuing diversity consists of using the stated preference approach. If individuals can be presented with different options regarding land use, each with a different composition of biodiversity, then it should be possible to derive values. The assumption, of course, is that individuals are informed about the benefits of diversity or at least have some notion of what those benefits are. One study of British forests (ERM, 1996) attempts this approach. The forest in question was remote conifer forest. Different management options were presented to individuals who were asked to state their willingness to pay for each of them. The first option was 'do nothing' and the remaining options related to increasing the proportion of

23
broadleaf trees, introducing other conifer species, and allowing the forest to evolve to a semi-natural woodland. Mean willingness to pay was found to be £10, £5 and £13 per household for the three states ($15, $7.5, and $20). The lower willingness to pay for the second option is not as expected since it reflects a higher biodiversity level compared to option 1. It appears to be a result of the survey design methodology. While the study aggregates these values across all UK households, it seems unlikely that such willingness to pay would be distributed across the whole population. The aggregation process produced values of £155-300 million, or some £516-1000/ha. Further work is required before assigning significance to the large values derived in the study. 5.5 Forest land conversion Forest land conversion is self evidently not a forest value but the converted use constitutes a value of forest land. It is essential to understand the economic values of converted forest land since, if these exceed the economic values of conserved forest or sustainable forest use, there is a prima facie case for supposing that economic forces will lead to the forest being converted. Notable uses of converted land include palm oil plantations and cocoa, cattle ranching, slash and burn agriculture, and permanent agriculture. Section 6.1 discusses comparative rates of return to alternative land uses. 5.6 Watershed protection There are numerous studies of the role played by forests in watershed regulation. Functions include: soil conservation - and hence control of siltation and sedimentation, water flow regulation - including flood and storm protection, water supply, water quality regulation - including nutrient outflow. The effects of forest cover removal can be dramatic if non-sustainable timber extraction occurs, but care needs to be taken not to exaggerate the effects of logging and shifting agriculture (Hamilton and King, 1983). Economic studies of watershed protection functions are few, but the focus of attention is shifting towards methodologies for assessing the value of these functions. Table 8 assembles the available evidence.

24
Table 8 Economic values of forest watershed protection/water supply functions
Study: tropical Type of watershed protection function
Results
Ammour et al, 2000. Guatemala forest
Prevention of soil erosion. Universal soil loss equation Valued at cost of soil replacement and at costs of preventing soil loss1 Prevention of nutrient loss. Nutrients in aerial biomass. Valued at fertiliser prices1.
Negligible $12 ha/a out of $30 ha/a for all NTFPs and environmental services
Kumari, 1996. Malaysian forest Protection of irrigation water, valued at productivity of water in crops2. Protection of domestic water supplies. Valued at treatment cost for improved quality2.
$15/ha $ 0/ha
Ruitenbeek 1989 Korup, Cameroun
Flood protection only $ 3/ha
Yaron, 2001. Mt Cameroun, Cameroun
Flood protection, valued at value of avoidable crop and tree losses
$ 0-24/ha
Pattanayak and Kramer, 2001 Eastern Indonesia
Drought mitigation from forest protection and regrowth, valued at gain in profits to rice and coffee production
$3 - 35 per household3
(compares to $5-13 per household costs of 're-greening') = $0.36 per mm baseflow. = 1-10% of annual agricultural profit.
Bann, 1998b. Turkey Soil erosion valued by replacement cost of nutrients, flood damage
$46/ha
Adger et al, 1995 Mexico
Sedimentation effects on infrastructure
$negligible
Shahwahid et al. 1997 Malaysia
Impacts of RIL compared to total protection of forests on hydroelectricity
$4/ha
Hodgson and Dixon, 1988 Philippines
Fisheries protection from avoided logging,
$268/ha
Bann, 1999 Johor, Malaysia
Shoreline protection by mangrove forest Fisheries protection by mangrove forest
$845/ha $526/ha
Anderson, 1987. Northern Nigeria Shelterbelts for crop protection Farm forestry
Rate of return increases from 5% (wood benefits only) to 13-17% Rate of return increases from 7% to 14-22%
Study: temperate Clinch, 1999 Irish temperate forests, water supply Minus $20/ha Notes: 1 - in both cases the values are replacement costs. This is not strictly a correct valuation procedure, see text. 2 - valued as the difference between currently unsustainable logging and sustainably managed logging, central case. 3- unfortunately the forest area is not stated. Watershed protection values appear to be small when expressed per hectare but it is important to bear in mind that watershed areas may be large, so that a small unit value is being aggregated across a large area. Secondly, such protective functions have a 'public good' characteristic since

25
the benefits accruing to any one householder or farmer also accrue to all others in the protected area. Third, the few studies available tend to focus on single attributes of the protective function - nutrient loss, flood prevention etc. Fourth, the Hodgson-Dixon study for the Philippines suggests that fisheries protection values could be substantial in locations where there is a significant in-shore fisheries industry. Comprehensive estimates have still to be researched. 5.7 Carbon storage and sequestration A number of studies suggest potentially very large values for the carbon storage functions of forests. It is important to distinguish: (a) carbon stored in a standing forest that is close to 'carbon balance' (b) carbon sequestered in a growing forest. In the former case there is an economic value to the carbon stored and much of which value is lost if the forest is burned or logged, depending in part on the subsequent use of the converted land. Whether such a forest can realise such storage values depends on the baseline, i.e. on what is likely to happen to the forest in the absence of some protective or sustainable use measure. Forest not under threat of conversion has a storage value but this value is unlikely to be realised, although forecasts of continuing rates of forest cover loss of some 0.8% per annum does place a considerable amount of forest under threat. Forest that is threatened in the near-to-medium future has a storage value which can be realised through protective measures. Another way of thinking about the issue of storage value is to consider the lost value of the forest in the event of conversion. In this case, the carbon storage value is lost. Sequestration, on the other hand, relates solely to the net fixation of carbon by a growing forest. The value of the carbon sequestered is the same, per tonne of carbon, as in the carbon storage case, but the value will be aggregated only over the rotation life of the forest if that applies. There are an enormous number of studies on the carbon stored and sequestered in different forest types. Brown and Pearce (1994) suggest benchmark figures for carbon content and loss rates for tropical forests, as shown in Table 9. A close primary forest has some 280 tC/ha of carbon and if converted to shifting agriculture would release about 200 tonnes of this, and a little more if converted to pasture or permanent agriculture. Open forest would begin with around 115 tC and would lose between a quarter and third of this on conversion. Table 9 Changes in carbon with land use conversion: tropical forests tC/ha
Shifting agriculture Permanent agriculture Pasture
Original carbon 79 (53 soil, 25 biomass)
63 (mainly soil)
63 (mainly soil)
Closed primary forest
283 (116 soil, 167
biomass) -204 -220 -220
Closed secondary forest
194 (84 soil, 110
biomass) -106 -152 -122

26
Open forest 115 -36 -52 -52
Using such estimates as benchmarks10, the issue is what the economic value of such carbon stocks is. A significant literature exists on the economic value of global warming damage and the translation of these estimates into the economic value of a marginal tonne of carbon. A recent review of the literature by Clarkson (2000) suggests a consensus value of $34 tC11. Tol et al. (2000) also review the studies and suggest that it is difficult to produce estimates of marginal damage above $50 tC. Taking $34-50 tC as the range produces very high estimates for the value of forests as carbon stores. In practical terms, however, a better guide to the value of carbon is what it is likely to be traded at in a 'carbon market'. Carbon markets have existed since 1989 and refer to the sums of money that corporations and governments have been willing to invest in order to sequester carbon or prevent its emission. Several hundred 'carbon offset' investments of this kind exist, all of them voluntary and unrelated to global warming legislation. More sophisticated markets will emerge as emissions trading schemes develop, and a major boost to these will be given by any eventual agreement on the 'flexibility mechanisms' under the Kyoto Protocol of 1997. Zhang (2000) suggests that, if there are no limitations placed on worldwide carbon trading, carbon credits will exchange at just under $10 per tC. If 'hot air' trading is excluded, the price will be $13 tC. Taking the $10 tC as a conservative estimate, Table 10a repeats Table 9 but with money values rather than tonnes of carbon. Table 10a reveals the large values obtained for tropical forests when applying carbon-trading prices. Values of $2000/ha can be reached for closed primary and secondary forest. Note again that these values relate to forests that are (a) under threat of conversion and (b) capable of being the subject of deforestation avoidance agreements12. Table 10a Changes in carbon with land use conversion: tropical countries tC/ha Shifting agriculture Permanent
agriculture Pasture
Original carbon value $/ha 790 630 630
Closed primary forest 2830 -2040 -2200 -2200
Closed secondary forest 1940 -1060 -1520 -1220
Open forest 1150 -360 -520 -520
The same figure for traded carbon credits can be used to illuminate the value of plantations for carbon purposes. Under the 'Kyoto rules', plantations would not count as contributing to carbon sequestration if they would have been undertaken anyway. Only 'additional' planting would
10 Estimates will vary by region and on whether or not soil carbon is released. 11 Clarkson actually selects $80 tC since it includes 'equity weighting', i.e. it values warming damages more highly for poorer countries than for rich countries. Apart from the arbitrariness of the value judgement involved, the equity weighted approach is not consistent with the other forest values derived in this report which are based on willingness to pay in the area where the forest service occurs. 12 The importance of including carbon storage in the Kyoto flexibility mechanisms is emphasised by these numbers. This issue is the subject of on-going debate by the negotiators to the Kyoto Protocol.

27
count. Hence one approach to plantation carbon is to charge the full costs of plantations to the carbon sequestered to derive a cost per tonne of carbon. In their review of cost estimates, Sedjo et al. (1995) show that estimates range from $3-16 tC for agro-forestry and $3-60 tC for plantations in tropical areas; $1-50 tC for plantations in temperate areas; and $1-4 tC for plantations in boreal areas. Cost-efficient practices would be at the lower end of these ranges. Sedjo et al (1995) point out that these estimates ignore the probable rising cost of plantations for carbon as areas grown increase. Nonetheless, it can be seen that plantations would probably be worth undertaking for carbon sequestration purposes. An illustration of the importance of sequestration in growing forests is given by Solberg (1997). Using Norway's carbon tax of about $49 tCO2 as an expression of the social cost of fossil fuels, Solberg shows that, applied to carbon sequestered in Norwegian forests, the implied value of the forest as a carbon sink exceeds the value of the forest stand as timber. Depending on the interest rate, the carbon value exceeds the timber value by 3-30 times. The implications are (a) that more afforestation is justified than would be the case allowing for timber values alone, and (b) management practices should change in favour of maximising dry weight biomass growth. The latter may not be entirely consistent with biodiversity concerns. The importance of carbon values is further illustrated by the study of Smith et al 91997) for the Peruvian Amazon. The returns to slash and burn agriculture are found to be negative if measured in net present value terms over ten years, but positive if measured over the first two years of yields only. The rationale for considering two years only is that farmers' discount rates may be so high that this is their effective time horizon. Moreover, these returns exceed those to agroforestry. Using stated preference techniques farmers were asked their willingness to accept compensation to forego the existing slash-and-burn land use in favour of (a) agroforestry and (b) forest conservation. Assuming no environmental services were achieved from these land uses, farmers were on average willing to accept $246/ha per annum to leave the forest in a conserved state and $153/ha for agroforestry. The lower value of compensation for agroforestry reflects the fact that farmers would secure some crop yields with an agroforestry system. Asked to revise their compensation requirements to allow for the environmental benefits they would secure, the compensation sums were reduced to $173 and $109 respectively. The estimates suggest that farmer value the environmental services they receive from the forest in a conserved or agro-forestry state at $44-73/ha. Two important conclusions follow: (a) slash and burn farmers are not at all indifferent to the non-cash benefits they secure from forests, and (b) if a scheme of compensation could be devised, payments of $100-200 ha would compensate them for the foregone benefits of agriculture, the lower value reflecting the sum required to get them to switch to agro-forestry, the latter being the sum required if the preferred conservation option is outright conservation. Smith et al (1997) focus on carbon trading as a means by which these compensation measures could take place. Carbon regimes in temperate countries have also been extensively studied. Table 10b summarises some of the studies relating to afforestation programmes. Table 10b Carbon value for afforested land: temperate forests
Study Carbon value per hectare of afforested land Pearce, 1994. UK $280-413 Clinch. Ireland $ 88

28
5.8 Tourism and recreation values 5.8.1 Tropical forests Ecotourism is a growing activity and constitutes a potentially valuable non-extractive use of tropical forests. Caveats to this statement are (a) that it is the net gains to the forest dwellers and/or forest users that matter; (b) tourism expenditures often result in profits for tour organisers who do not reside in or near the forest area, and may even be non-nationals; (c) the tourism itself must be 'sustainable', honouring the ecological carrying capacity of the area for tourists. In principle, tourism values are relevant for any area that is accessible by road or river. Table 11 lists some estimates of tourism value for tropically forested areas. Some ecotourist sites attract enormous numbers of visitors and consequently have very high per hectare values. Again, it is difficult to suggest representative valuations since values clearly vary with location (e.g. the Shultz study for Costa Rica relates to high accessible sites) and the nature of the attractions. Table 11 Tourism values for tropically forested areas
Study Values Comment Hodgson and Dixon, 1988 Philippines
$650/ha Benefit of no logging vs. continued logging near Bacuit Bay. Gross not net revenues and unclear who secures the net revenues.
Adger et al. 1995 Mexico
$1/ha Consumer's surplus estimates
Tobias and Mendelsohn 1991 Costa Rica, Monteverde rainforest
$160/ha Consumer's surplus estimated by travel cost method. For Costa Rican visitors only
Chase et al. 1998. 3 national parks in Costa Rica
$21-25 per foreign visitor Consumer surplus from a contingent valuation study. Areas not stated. Revenue-maximising policy would increase revenues to the three parks by $1 million.
Shultz, W, Pinazzo, J and Cifuentes, M. 1998 Two forested parks in Costa Rica, Poas Volcano (A) and Manuel Antonio (B)1
A: $950/ha B: $2305/ha
Areas (A=5600ha and B=737 ha) stated but total visitors not stated. Latter taken from Southgate (1996). Very high values due to very high popularity of sites (volcano, views, beach).
Maille and Mendelsohn, 1991 Madagascar
$360-468/ha Consumer's surplus estimated by travel cost method. For foreign visitors only
Garrod and Willis, 1997. Forest recreation areas, Malaysia
$740/ha Consumer's surplus by contingent valuation and sample tested with travel cost. Large values due to small areas and proximity to sources of demand.
Bann, 1999. Mangrove protection in Benut, Johor State, Malaysia
$3 ha Valuation of locals only
Notes: 1-A$11 per local visitor; B$13 per local visitor; A$23 per foreign visitor; B$14 per foreign visitor

29
5.8.2 Temperate and boreal forests Table 12 summarises some of the many studies for non-tropical forests. Indicative values for European forests suggest per person willingness to pay of around $1-3 per visit. The resulting aggregate values for forests could therefore be substantial. Elsesser (1999) suggests that forest recreation in Germany is worth some $2.2 billion per annum for day-users alone and a further $0.2 billion for holiday makers. Table 12 Tourism values for non-tropical forested areas
Study Values Comment Bann, 1998b Turkey
$0.4 ha gross Nation-wide average
Bellu and Cistulli, 1997 Liguria forests, Italy
$77-85/ha Consumer surplus by contingent valuation and travel cost methods
Whiteman and Sinclair, 1994. UK forest
$1.3-1.8 per person per visit See Bateman et al, 1999.
Hanley and Ruffell, 1992 All UK forests
$1.5-1.7 per person per visit See Bateman et al, 1999
Hanley and Ruffell, 1991 Scottish forests
$1.8-3.0 per person per visit See Bateman et al, 1999
Bishop 1992 English forests
$0.8-2.6 per person per visit See Bateman et al, 1999
Willis and Benson, 1989 UK forests
$0.8-2.4 per person per visit See Bateman et al, 1999
Hanley, 1989 Scottish forests
$2.5 per person per visit See Bateman et al, 1999
Willis et al. 1998 English forests
$0.5-2.0 per person per visit See Bateman et al, 1999
Bateman and Langford, 1997 English forest
$1.0 per person per visit
See Bateman et al, 1999
Elsasser, 1999 German forests
$42 pp/pa to visit all forests: day users $13 pp to visit one forest during stay in region
Clinch, 1999. Irish forests $16 per household, = $250/ha (both present values)
Landscape, recreational and wildlife values
Scarpa, et al. 2000. Irish forests $1.4 to 3.6 per visit. Rise by $0.2 to $0.6 per visit if national park status conferred
5.9 Amenity values There is some evidence that those living near to forests secure a benefit in terms of amenity. The only available studies relate to temperate forests. Table 13 assembles some estimates based on the hedonic property price model.

30
Table 13 Residential amenity from forests
Nature of good Value Source Proximity to urban forest, Salo, Finland
Houses with view of the forest cost 4.9% more than otherwise similar houses Property price decreases 5.9% for one kilometre away from the forest
Tyrväinen and Miettinen, 2000
Planting woodland in the New Forest, England
Planting 1 ha woodland within 100 metres, raises average house price by £UK540
Powe et al., 1997
Changes in forest cover in UK
Sitka spruce decreased house prices Broadleaves increased house prices
Garrod and Willis, 1992.
Effects of tree cover, Amherst, Mass.
Trees added 6% to house prices Morales, 1980
Effects of landscaping with trees, Athens, Georgia
3.5-4.5% increase in house prices due to landscaping
Anderson and Cordell, 1988
5.10 Option and existence values The notion of economic value includes willingness to pay for the conservation of a forest or ecosystem even though the individual expressing the willingness to pay secures no use value from the forest. There are three contexts in which such values might arise: (a) someone may express a willingness to pay to conserve the forest in order that they may make some use of it in the future, e.g. for recreation. This is known as an option value. (b) someone may express a willingness to pay to conserve a forest even though they make no use of it, nor intend to. Their motive may be that they wish their children or future generations to be able to use it. This is a form of option value for others' benefit, sometimes called a bequest value. (c) someone may express a willingness to pay to conserve a forest even though they make no use of it, nor intend to, nor intend it for others' use. They simply wish the forest to exist. Motivations may vary, from some feeling about the intrinsic value of the forest through to notions of stewardship, religious or spiritual value, the rights of other living things etc. This is known as existence value. In practice it is hard to distinguish motives, although efforts have been made using stated preference procedures such as contingent valuation. The relevance of these values is that they may be 'capturable' through mechanisms such as debt-for-nature swaps, official aid, donations to conservation agencies, and pricing mechanisms. An example of using a price is the suggestion that visitors to China would have the option of paying $1 extra for a 'panda stamp' in their passports, along with their visa, to indicate that they have donated towards panda conservation in China (Swanson and Kontoleon, 2000).

31
Table 14 shows the results of those studies that have attempted to elicit option and existence values. Table 14 Option and existence values for forests
Nature of the good Study Result Protection of 5% more of the world's tropical rain forests. Assumes 5% already protected, so scenario is 10% protection. Values reflect existence and bequest.
Kramer and Mercer, 1997. Contingent valuation.
US residents willing to pay 'one-off' payment of $21-31 per household. Across 91 million households, suggests $2.6-2.9 billion. At 5% interest rate, suggests a fund producing $130-140 million p.a. Divided by 5% of the area of tropical rainforest (720 million ha), this implies about $4 per hectare p.a.
Sinharaja forest reserve, Sri Lanka. WTP of Sri Lankans only.
Gunawardena et al, 1999. Contingent valuation.
3 groups: peripheral villagers, rural, urban. Use values = 0.5% of income for village, 0.2% for rural and 0.3% for urban. Bequest values = 0.4, 0.1, 0.2% respectively. Existence values = 0.2, 0.3, 0.2%. Aggregation is not attempted. Across all rural residents implies $30m existence + bequest values, and across all urban would imply $17m, i.e. $47m in all.1
Wilderness in Colorado. Existence value.
Walsh et al. 1984. $12-45/ha, lowest being for the last increments, highest for the first.
Forest quality in Colorado (avoided infestation)
Walsh et al. 1984 Option value: $16 per household Existence + bequest value: $38 per household
Forest quality in S Appalachians (avoid infestation and air pollution)
Haefele et al. 1992. Existence + bequest values $82 per household
Habitat of the Mexican spotted owl
Loomis and Ekstrand, 1998 $102 per US household p.a implies $4400/ha.
California and Oregon forests, avoided fire risk
Loomis and Gonzáles-Cabán
$56 per household in California and New England. Implies $1.9-9.9 million/ha for all US residents, or $0.9-4.6 million for respondents only.
Implied 'world' willingness to pay for limited forest areas covered by debt-for-nature swaps
Pearce, 1996. Implied willingness to pay.
$ 5/ha.
Implies 'world' willingness to pay via Global Environment Facility
Pearce, 1996. Implied willingness to pay.
$ 2/ha
Debt for nature swaps and grant aid to Mexico forest conservation
Adger et al. 1995 $12/ha
Preservation of forest, southeast Australia
Lockwood et al., 1993. $240 per household per annum.
Notes: 1 - it is extremely unlikely that existence values would be common to everyone regardless of distance from the site. The totals here are therefore upper bounds. As with other environmental goods and services, the general conclusions are (a) that existence values can be substantial in contexts where the forests in question are themselves unique in some sense, or contain some form of highly prized biodiversity - the very high values for spotted owl

32
habitats illustrate this; (b) that, aggregated across OECD households, and across forests generally, existence values are modest when expressed per hectare of forest. 5.11 Changes in forest values over time The willingness to pay estimates previously derived are presented in 'per hectare' terms, either as an annual net value or as a net present value13. None of the studies investigated appears to allow for the potential for annual values to rise through time relative to other values. There are two reasons for supposing that there will be a 'relative price effect' for forests: (a) if the forest stock continues to decline, the value attached to a marginal unit of forest should rise (the supply effect) and (b) incomes will rise thus raising willingness to pay per unit of forest. Unfortunately, comparatively little is known about how willingness to pay varies over time. The relevant concept is the 'income elasticity of willingness to pay' which is defined as the percentage change in willingness to pay for a given percentage change in income. Kriström and Riera (1996) suggest that the elasticity is less than one and note values of 0.2 and 0.3 in the literature. But they acknowledge that the evidence is scanty. A value of 0.5 might be taken as a default benchmark. The benefit-cost equation needs to be modified to allow for the grow of relative willingness to pay. Instead of:
�� +−
+=
tt
t
tt
t
rC
rB
NPV)1()1(
the equation for net present value becomes:
�� +−
++
=t
tt
tt
t
rC
rgBNPV
)1()1()1(0
where B0 is the initial year's benefits, g is a growth rate of benefits, and r is the discount rate. For fairly long time periods the revised formula can be approximated by
�� +−
−+=
tt
t
tt r
Cgr
BNPV
)1()1(0
In other words, the effect is to lower the 'net' discount rate on benefits, thus increasing their scale. If the underlying growth in income per capita is, say 2-3% per annum, and the income elasticity of willingness to pay is 0.5, then the value of g is given by the multiple of these two factors, i.e. g = 1-1.5%. Discount rates of 10% per annum would therefore become 8.5-9% when 'g' is netted out, and so on. The effect can be illustrated in terms of the multiple of B0 in the last equation. These are shown below. 13 The 'per hectare' approach fixes attention on the value of the land, but can be misleading when the hectarage is small and the willingness to pay is large due to some unique features of the site. Despite these limitations it appears to be the most illustrative approach. Net present value (NPV) is equal to the sum of discounted annual net values.

33
10% 9% 5% 4% PV over 30 years = X.B0 X = 9.4 X =10.3 X = 15.4 X =17.3 In other words, if the 'basic' discount rate of 10% is used and it is adjusted for g = 1%, the present value of benefits will be 10.3/9.4 = 1.1 times the unadjusted figure. If the basic discount rate if 5%, the adjustment for g=1% would be 1.12 times. Overall, a rough adjustment factor is to add 10% to the present value of benefits for g=1%, and 20% for g = 2%. These adjustments will not make substantial differences to the values recorded earlier. However, they are critically dependent on the assumed value of the elasticity of willingness to pay. Table 15 below shows how the adjustments would change for higher values of the income elasticity. Table 15 assumes three different values for the income elasticity, a growth rate for incomes of 3%, and two discount rates of 5 and 10%. It will be clear that the higher the value of the income elasticity, the bigger the approximate adjustment to the discount rate. At a value of income elasticity = 1.5, the net discount rate is effectively about one half the basic discount rate (at 10%) and only 15% of the basic rate (at 5%). In such circumstances, the present value of forest benefits could be raised significantly. For example, at 5.5% net rate compared to a 10% basic discount rate, some 50% would be added to the present value of benefits. Table 15 Effects of income elasticity of willingness to pay on 'net' discount rates Income elasticity of WTP → Basic discount rate ↓
0.5
1.0
1.5
5% 3.5 2.0 0.5 10% 8.5 7.0 5.5 5.12 Forest ownership and economic valuation It is important to understand who gains and loses from forest land uses. First, economic values relate to flows of wellbeing and these may or may not be associated with actual cash flows. Cash flows will only emerge if markets are created in the relevant forest good or service. Second, those who gain or lose may or may not be owners of the forest land. Agricultural colonists may not own the land or may have customary rights or they may have purchased the land. Beneficiaries of the forest's carbon storage value will rarely be owners. Third, beneficiaries and losers will be widely distributed geographically - carbon storage benefits all, but watershed protection tends to be local or regional in its impact. Fourth, even where cash flows are generated through market creation, not all the economic value can be appropriated14. Fifth, even where substantial parts of the economic value can be appropriated, it may well not be: e.g. forest concessions fees rarely appropriate the full timber 'rent' of forests (Day, 1998).
14 Benefits are measured by aggregated willingness to pay. But it is difficult to discriminate between users in terms of price (although some effort can be made, e.g. discriminatory pricing of tourists). Hence one price tends to be charged and this leaves the consumer's surplus unappropriated.

34
Table 16 outlines the kinds of cash flow a hypothetical forest owner could receive from the various users and non-users of the forest. Table 16 Potential cash flows to an hypothetical forest owner Good or service Initial beneficiary Form of cash flow Timber Concessionaire Tax Fuelwood Local communities/ urban
centres Usually none
NTFPs Local community Usually none or local sales Genetic information Plant breeders. Drug
companies IPR fee/royalties
Recreation Visitors. Tourism companies Payment, but leakage issue Watershed benefits Regional inhabitants Usually none but potential for
fees (e.g. Costa Rica) Climate benefits World In kind benefits (e.g. CDM) Biodiversity (other than genetics)
Local and global communities Debt for Nature, donations etc
Amenity Local residents None: capitalised in land and property prices
Non-use values Local, national and global communities
Environmental funds, debt for nature, GEF, donations
It is clear from table 16 that a forest owner could be the recipient of a significant number of different cash flows. They are not additive because some of the uses are incompatible. The table underlines the importance of property rights. If the forest is treated as an open access resource, few of the cash flows will materialise. The table also shows the importance of global market creation, e.g. through the flexibility mechanisms of the Kyoto Protocol. Only in this way can the potentially large willingness to pay of the industrialised world be mobilised as cash flows for forest conservation (or as compensation for forgoing non-sustainable forest land uses). 5.13 Summary of economic values Table 17 attempts a summary of the findings of the previous sections on economic values. It is very important not to construe the table as being representative of all forest areas. At best the numbers indicate the kinds of value that could materialise of markets were created. In turn, market creation assumes that certain features of the forest are present: thus tourism values are not relevant for remote and inaccessible forests, although carbon values would be. Nor can values be added simplistically since some uses are competitive. Nonetheless, the table is suggestive of some general conclusions.

35
Table 17 Summary economic values ($ ha/pa unless otherwise stated) Forest good or service Tropical forests Temperate forests Timber conventional logging sustainable conventional logging sustainable
200-4400 (NPV)1
300-2660 (NPV)1
20- 4402 30- 2662
-4000 to + 700 (NPV) 3
Fuelwood 40 - NTFPs 0- 100 small Genetic information 0-3000 - Recreation 2- 470 (general)
750 (forests near towns) 1000 (unique forests)
80
Watershed benefits 15- 850 - 10 to +50 Climate benefits 360- 2200 (GPV)4 90 - 400
(afforestation) Biodiversity (other than genetics)
? ?
Amenity - small Non-use values Option values Existence values
n.a.
2- 12 4400 (unique areas)
70? 12 - 45
Notes: 1 - See Annex 1. 2 - annuitised NPV at 10% for illustration. 3 - Pearce (1994). 4 - assumes compensation for carbon is a one off payment in the initial period and hence is treated as a present value. It is a gross value since no costs are deducted. First, the dominant values are carbon storage and timber. Second, these values are not additive since carbon is lost through logging. Third, conventional (unsustainable) logging is more profitable than sustainable timber management (see Annex 1). Fourth, other values do not compete with carbon and timber unless the forests have some unique features or are subject to potentially heavy demand due to proximity to towns. Unique forests (either unique in themselves or as habitat for unique species) have high economic values, very much as one would expect. Near-town forests have high values because of recreational demand, familiarity of the forest to people and use of NTFPs and fuelwood. Uniqueness tends to be associated with high non-use value, again as one would expect. Fifth, non-use values for 'general' forests are very modest. 5.14 Costs and benefits of forest land use change Using the summary values in Table 17, it is possible to give a very broad indication of the economic values that are gained and lost when changing from one forest land use to another. Again, major caveats are in order. The research that exists is simply insufficient to do more than offer the most general of outlines. Table 18 summarises the costs and benefits.

36
Table 18 Costs and benefits of changing land use $/ha/pa (- shows losses, + shows gains) Original land use ↓↓↓↓ Alternative uses →→→→
Nutrient mining cycle: logs/crops/ ranching
Conventional logging
Agroforestry Agri-business
Primary forest - 223 (to -36301) +172 to 2092
-150 (to -3000)5
+ 20 to 4406 - 2 (to -470)10
+ 1359 to 317 n.a.
Secondary forest
- 121 (to -1050)3
+172 to 2092 - 83 (to -600) + 10 to 2208
0 + 1359 to 317
n.a.
Open forest - 504 n.a. No losses? + 1359 to 317
n.a.
Notes: 1- assumes losses of carbon, all watershed effects, all NTFPs, all recreation, all genetic information, all non-use value. High losses relate only to scarce hotspots with high bio-prospecting value. No other account taken of biodiversity. 2 - based on Wunder (2000). Based on losses of carbon, NTFPs and Watershed values only. High value reflects high watershed values. 4 - carbon losses plus notional value for NTFPs. 5 - assumes half carbon loss and half watershed values lost. High value reflects high watershed and high genetic information values. 6 - see Table 17. 7 - assumes half original carbon lost, all NTFPs lost and half watershed values are lost. 8 - assumes half timber values of primary forest. 9 - based on Cuesta et al. 1994 updated to 2000 values, but note this estimate is taken from a NPV at a 25% discount rate. Hence we have projected the value also at 10% in order to make it comparable to other values. 10 - assumes tourism values only lost. For the justification of keeping other forest values see Chomitz and Kumari (1996). While table 18 is illustrative only - cost-benefit outcomes will be very much dependent on the actual location of the forests - it does suggest several likely conclusions. First, converting primary forest to any use other than agroforestry or very high value timber extraction, is likely to fail a cost-benefit test. Second, the conversion of secondary forest to the 'cycle' of logging, crops and ranching could make prima facie economic sense. As with the primary forest conversion, however, it needs to be borne in mind that the 'sequence' of land uses does not always occur and many conversions to slash and burn agriculture would make no economic sense. Third, the conversion of secondary forest and open forest to agro-forestry appears to make economic sense, assuming that most of the forest's services (including biodiversity) are retained (see Chomitz and Kumari, 1996). Fourth, and worth repeating, the comparisons all assume that non-market values are actually captured through some market creation mechanism. Fifth, the non-market values almost certainly fail to capture the economic value of biodiversity which, apart from the value of genetic information, is omitted from the analysis. Sixth, carbon storage is of the utmost importance to the economic case for forest conservation.
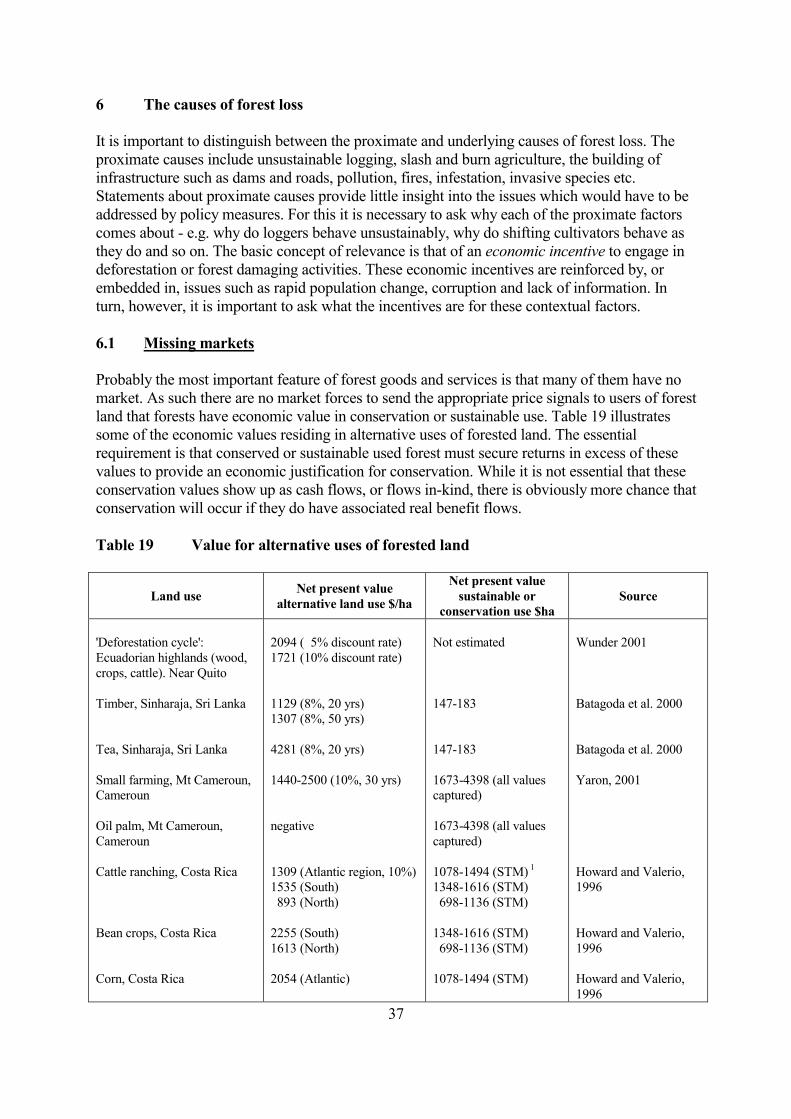
37
6 The causes of forest loss It is important to distinguish between the proximate and underlying causes of forest loss. The proximate causes include unsustainable logging, slash and burn agriculture, the building of infrastructure such as dams and roads, pollution, fires, infestation, invasive species etc. Statements about proximate causes provide little insight into the issues which would have to be addressed by policy measures. For this it is necessary to ask why each of the proximate factors comes about - e.g. why do loggers behave unsustainably, why do shifting cultivators behave as they do and so on. The basic concept of relevance is that of an economic incentive to engage in deforestation or forest damaging activities. These economic incentives are reinforced by, or embedded in, issues such as rapid population change, corruption and lack of information. In turn, however, it is important to ask what the incentives are for these contextual factors. 6.1 Missing markets Probably the most important feature of forest goods and services is that many of them have no market. As such there are no market forces to send the appropriate price signals to users of forest land that forests have economic value in conservation or sustainable use. Table 19 illustrates some of the economic values residing in alternative uses of forested land. The essential requirement is that conserved or sustainable used forest must secure returns in excess of these values to provide an economic justification for conservation. While it is not essential that these conservation values show up as cash flows, or flows in-kind, there is obviously more chance that conservation will occur if they do have associated real benefit flows. Table 19 Value for alternative uses of forested land
Land use Net present value alternative land use $/ha
Net present value sustainable or
conservation use $ha Source
'Deforestation cycle': Ecuadorian highlands (wood, crops, cattle). Near Quito Timber, Sinharaja, Sri Lanka Tea, Sinharaja, Sri Lanka Small farming, Mt Cameroun, Cameroun Oil palm, Mt Cameroun, Cameroun Cattle ranching, Costa Rica Bean crops, Costa Rica Corn, Costa Rica
2094 ( 5% discount rate) 1721 (10% discount rate) 1129 (8%, 20 yrs) 1307 (8%, 50 yrs) 4281 (8%, 20 yrs) 1440-2500 (10%, 30 yrs) negative 1309 (Atlantic region, 10%) 1535 (South) 893 (North) 2255 (South) 1613 (North) 2054 (Atlantic)
Not estimated 147-183 147-183 1673-4398 (all values captured) 1673-4398 (all values captured) 1078-1494 (STM) 1 1348-1616 (STM) 698-1136 (STM)
1348-1616 (STM) 698-1136 (STM) 1078-1494 (STM)
Wunder 2001 Batagoda et al. 2000 Batagoda et al. 2000 Yaron, 2001 Howard and Valerio, 1996 Howard and Valerio, 1996 Howard and Valerio, 1996

38
Ranching, Amazonian Ecuador Timber, Amazonian Ecuador Ranching, Costa Rica Clear felling, Costa Rica Plantations, Cost Rica Cattle ranching, Veracruz, Mexico Slash and burn, Peruvian Amazon
68-351 224 1622 (8%, domestic prices) 576( 8%, domestic prices) 3944 (8% domestic prices) 2000-10000 (pasture price) 4555 with subsidies, minus 2176 without subsidies. But positive if first two years only are considered.
1496-3500 (NTFPs) 1496-3500 (NTFPs) 1050 (STM) 1050 (STM) 1050 (STM) > 2000-10,000 if high planting of 'mamey' Sustainable use more profitable if farmers paid for carbon conservation
Grimes et al.1994 Grimes et al.1994 Kishor and Constantino, 1993 Kishor and Constantino, 1993 Kishor and Constantino, 1993 Ricker et al., 1999 Smith et al. 1997
Notes: STM = sustainable timber management, assuming 2% p.a. increase in stumpage values The relevance of the non-market values of forests can be illustrated with respect to table 15. Batagoda et al, show that marketing non-timber products from Sinharaja would compete with timber extraction provided the time horizon is 50 years and the NTFPs are exploited to the full. Otherwise they do not compete with timber. Similarly, even the full-potential NTFPs scenario does not compete with conversion of the land to tea. This underlines the importance of extending such analyses to the wider ecosystem functions of forests and to include any non-use values. Yaron's analysis for Cameroun shows that conserved forests secure rates of return well in excess of small farm use of the land, again provided all non-market values are included, especially carbon storage. Howard and Valerio show that, unless stumpage prices rise, sustainable timber management does not compete with the land uses shown for Costa Rica, but that with stumpage prices rising above 2% p.a. it does. Kishor and Constantino paint a gloomier picture than this in their comparison of sustainable timber management with alternative land uses. In contrast, Grimes etc. al. suggest very clear advantages of sustainable land uses over ranching and timber in their Amazonian study. Ricker et al. suggest that forest enrichment could produce values greater than ranching in Veracruz, Mexico. The study by Smith et al. directly addresses the important issue: sustainable land uses may well not pay in commercial terms, which suggests finding ways to convert non-commercial value to cash flows to compensate land users for forgoing their preferred land use. Carbon trading offers such a prospect. The overall conclusion is that, despite the early literature suggesting non-timber benefits could greatly outweigh those from slash and burn and/or clear felling, sustainable commercial uses of forest land have considerable difficulty competing with alternative commercial uses such as conventional logging, agri-business and agriculture. There will be exceptions to this rule. Given the difficulties of competing, the importance of 'encashing' the other benefits of forests is to be emphasises, especially carbon storage and sequestration and, where relevant, tourism and the sale of genetic material.

39
6.2 Discount rates One the features underlying the land use comparisons in Section 6.1 is the role of the discount rate. The higher is the rate the less likely it is that sustainable land uses will be favoured. This is because high rates favour the early exploitation of land. Conventional logging will tend to be favoured over sustainable timber management in such circumstances, as will slash-and-burn agriculture compared to agro-forestry and so on. The issue is therefore one of knowing how large discount rates are in such contexts. While there is little research on the subject, what exists suggests that local communities often have high discount rates, reflecting their urgent need to address subsistence and security needs now rather than in the future. This conclusion should not be exaggerated: there are many examples of poor communities investing in conservation practices. But the available evidence supports the traditional view that many have high discount rates and that these contribute to 'resource mining'. Table 20 assembles some of the evidence on discount rates. The most sophisticated study is by Poulos and Whittington (1999) based on contingent valuation studies in various countries. Table 20 Discount rates in various countries T=2 T=5 T=10
Poulos and Whittington 1999
Ethiopia 49 39 28 Mozambique 46 na 15 Uganda 158 na na Bulgaria 45 38 na Ukraine 206 na na Indonesia 57 45 na Cuesta et al. 1994. Costa Rica 49 19 9
Cropper 1994, USA na 17 11 Pearce and Ulph, 1999, UK 2.7-4.0
Cairns and van der Pol, 2000. UK 3.8-6.1
Here T is the time horizon, i.e. the horizon over which the contingent choices were offered. It can be seen that the rates are very high for short horizons and, while still high for long horizons, are lower than for short horizons. The rates shown might be compared to benchmark numbers for social rates used by international agencies such as the World Bank of 6-12%. Such high rates would imply little incentive to engage in sustainable land use practices. Even market rates of interest in developing economies can be very high. Schneider (1995) cites annual real rates of interest on low risk bonds in Brazil of 27-43%, suggesting that risky rates, which would be relevant to land use, would be higher still. Schneider notes that such rates heavily favour the unsustainable use of forested land. In other ways, however, citing high discount rates as a 'cause' of forest loss begs the question since the issue is why discount rates are so high. Much of the explanation here appears to lie with the issue of property rights.

40
6.3 Property rights It is well established that the existence of complete, exclusive, enforced and transferable property rights is a prerequisite for the efficient management of natural resources. Rights must be complete and exclusive to avoid disputes over boundaries and access. They must be enforceable to prevent others from usurping them and they must be transferable (there must be a customary or full market in them) to ensure that land is allocated to its best use. The effects of incomplete or no property rights show up most clearly in the lack of incentive to invest in conservation and sustainable land uses. Regardless of the 'paper' designation of forest land rights, many forests are de facto open access resources, i.e. resources for which there is no owner at all. Others are common property and are managed by a defined group of households with rules and regulations about access, use and transferability. Provided common property resources are not subject to external forces that lead to the breakdown of the communal rules of self-management, common property is a reliable and reasonably efficient use of forest land. Factors causing common property breakdown include rapid population growth and interference in traditional communal management by central authorities. Establishing property rights in the form of communal or private ownership regimes is a prerequisite of efficient land use, but may still not guarantee the desirable level of forest protection. This will be the case where the forest values take the form of 'public goods', i.e. services and goods the benefits of which accrue to a wide community of stakeholders and for which no mechanisms exists to charge them for the benefits. Forest dwellers may then have no incentive to conserve forests for their benefits to downstream fisheries or water users, since they receive no benefit for these services. Institutional change designed to compensate forest users for these services can often be devised (see Section 6.3), effectively establishing property rights in the unappropriated benefits of forest services.

41
6.4 Paying for environmental services Section 6.2 noted that the absence of property rights, or their poor definition, will encourage non-sustainable uses of forest areas, but that defined rights may still lead to over-exploitation if property rights are not further defined to include the benefits to wider communities and, indeed, the whole nation and the world at large. There is a small but growing trend towards the redefinition of property rights in forests to take account of these factors. Carbon trading provides one clear example, whereby corporations or agents in one country invest in sequestration or conservation in another country in return for the paper credit certifying the amount of carbon so stored or sequestered. Such trades began in 1989 and, to date, have been the result of private and some government initiatives. In the event of the ratification of the Kyoto Protocol, it is to be hoped that such trades will escalate, providing a valuable way of 'valorising' the carbon content of forests. Probably the greatest progress in establishing property rights in forest services has been made in Costa Rica (Chomitz et al., 1998). Costa Rica's forestry law of 1996 recognises the value of forests as carbon stores, providers of hydrological services, protectors of biodiversity and providers of scenic beauty. Sources of finance, e.g. a fuel tax, were designed and the rules for paying forest owners for services were established. The Costa Rican government currently disburses money for reforestation, sustainable forest management and forest preservation. Landholders cede their rights to the relevant services to the national Forestry Fund (FONAFIFO) for five years in return for the payments. The payment schedules are: Reforestation $480/ha over 5 years = $96/ha p.a. Natural forest management $320/ha over 5 years = $64/ha p.a Forest regeneration/ $200/ha over 5 years = $40/ha p.a Forest protection These prices are likely to be revised as experience determines the 'demand' for the payments and hence the supply of services. Costa Rica also has an established market in Certified Tradable Offsets (CTOs) for carbon. Carbon stored or sequestered is certified as being additional to a baseline and the resulting certificates are then offered for sale to domestic and international buyers wishing to secure carbon offsets for their own activities, or simply wishing to buy an asset which may appreciate with time. Other initiatives include bilateral deals between private hydro-electric schemes and surrounding forest owners. Payments of $10/ha are made to induce forest owners to conserve the forests to prevent sedimentation of the hydro-reservoirs. Costa Rica's initiatives in 'marketising' forest environmental benefits is a major advance in showing how hitherto missing markets can be established through the conferral of property rights. 6.5 Perverse incentives Governments world-wide provide incentive systems that affect natural resource use. While often conceived with good intentions, they often have deleterious effects on natural resources. Notable examples include the $800 billion spent each year on subsidising certain economic activities,

42
most notably agriculture ($400 billion). Most subsidies are in fact in the developed economies and agricultural subsidies have had some effect in reducing woodland area which is removed to capture the subsidies which are often on a per-hectare basis. In some parts of the developing world subsidies do exist for the clearance of forest land, and in some cases title to the land cannot be secured without a given percentage of the land being cleared. Other subsidies are more subtle and may take the form of preferential logging concessions and low royalty rates relative to what could be charged without deterring logging companies. Low charges increase the 'rent' to be secured from the land. While the issue appears to be one of the distribution of a given rent between government and logger, in fact the result is a competition for who can capture the rent, a competition that uses up resources to no productive purpose. Ensuring a good share of rent capture can involve corrupt practices such as bribes to officials and politicians. In turn, this can result in more extensive logging outside of 'official' concessions and more intensive logging inside concessions as those responsible for enforcement secure greater rewards from the bribes than they do from normal employment. Unsustainable logging is more profitable and hence there is a financial incentive to override or ignore regulations designed to secure sustainable forest management. As long as the rents are high, this incentive translates into payments to those nominally responsible for the protection or regulation of forests. The extent of 'illegal' logging is not known with any accuracy but is clearly very large and may in some countries greatly exceed the officially declared rates of logging. Tackling illegal logging is immensely complex since it effectively involves tackling the corruption involved. Countervailing power in the form of NGOs and citizens' groups can help, as can a free media and international disapproval. It remains the case that there are powerful incentives for illegal logging and deforestation generally. Statistical studies suggest that political freedoms may be linked to reduced deforestation, but the evidence is not firm (Kaimowitz and Angelsen, 1998). 6.6 Population change Rapid population growth appears to be linked to deforestation. Brown and Pearce (1994) review the econometric studies that link deforestation rates to explanatory factors. They find that population growth is generally linked to deforestation, although the patterns of interaction are complex. Simple statements that 'population growth causes deforestation' are unquestionably false, but many models show that population change is important (Kaimowitz and Angelsen, 1998). However, as current population levels rise from 6 billion people to some 9 billion in 2050, much of it in tropical countries, pressures on forest areas must be expected to grow. Lowland-upland migrations as well as officially induced transmigrations will add to the pressure. 6.7 Indebtedness It is widely surmised that the more externally indebted a forested country is, the more likely it is to engage in policies that result in deforestation. The mechanism involves pressure to export logs and processed wood (and to a far lesser extent, other forest products) to secure foreign exchange to meet the interest payments on the debt. A number of econometric studies test this relationship and the balance of evidence suggests that there is some link between indebtedness and deforestation (Kaimowitz and Angelsen, 1998, pp84-5). Very few studies find any link between timber prices and deforestation, i.e. the expected relationship that logging will increase as world prices increase is not found.

43
6.8 Internal factors A number of factors internal to the forested country may contribute to deforestation. Road building has the obvious effect of opening up forested areas. Initially logging roads may have this effect but subsequent hardcover roads may exacerbate the situation by encouraging agricultural colonists to enter the area. Satellite pictures identify 'leaf vein' patterns of land use following initial opening up for logging or for highways. The studies testing for the effects of roads in a statistical model suggest that this effect is present (Kaimowitz and Angelsen, 1998). Anything that reduces transportation costs will also tend to encourage deforestation which would previously have been limited by the costs of getting produce to the market. More generally, the closer forests are to towns the greater the risk they will be subject to clearance. It has been suggested that raising agricultural productivity will lower deforestation by reducing the incentive to 'extensify' agricultural land use. Again, only limited econometric evidence supports this hypothesis. Income levels should also be linked to deforestation, with higher income perhaps increasing deforestation initially and later reducing it. Poverty should be linked to deforestation on the grounds that open access resources add significantly to household income. Econometric studies tend to find that higher incomes increase deforestation, suggesting that the initial phase of the expected relationship is in place. Globally, forest cover is clearly linked to income since European and North American forest area is increasing. 6.9 'Excessive consumption' As income rise, so the demand for natural resources increases. The relationship is a complex one, however. For some forest services, the income-demand relationship can be such that as incomes grow the demand for those services decrease. An example might be the switch from wood fuels to liquid fuels as incomes grow. At the global level, however higher income countries do consume larger absolute amounts of raw materials. This has led to the view that deforestation is linked to 'excessive consumption' in rich countries. The issue is complex because the efficiency of raw materials use, i.e. the ratio of raw materials to income, tends to be lower in richer countries than in poor countries. Rich countries utilise natural resources more efficiently. But the scale of their incomes means that the absolute level of consumption is higher than in poor countries. Since the aim of development is to raise per capita incomes, reducing those incomes is not a realistic policy option, nor is it clear what policies would bring this about without damaging the factors giving rise to income growth - education, technology etc. But it is legitimate to ask that rich countries greatly increase their resource use efficiency even further. This will then translate into reduced demand for raw materials, including forest products imported from developing countries. Care has to be taken that this does not damage the export potential of forested countries, but clearly there is scope for making this transition. Additionally, richer countries can afford to pay premia on forest products to discriminate between sustainably and unsustainable managed products. 7 Are there new methodologies for economic valuation? The estimates of economic value of forest services tend to be based on a few economic valuation methodologies. The first of these is the 'production function' approach whereby some output or service is measured. The output or service is then valued at market prices (e.g. the price of timber, or fuelwood, or medicinal plants etc.). Some of these values can also be derived by

44
stated preference techniques, and notably contingent valuation. The advantages of these techniques is that they measure directly the total value that users of forest products are willing to pay for them. For tourism and recreation the most widely used technique is the travel cost method. The valuation of genetic information has been based on what, implicitly, is the willingness to pay of purchasers of that information (e.g. a drug company). In turn this willingness to pay reflects the value of the genetic information as a potential input to the manufacture of the good in question e.g. a drug. Hence the value of the genetic material is a 'derived' demand and reflects the production function approach again. The same is true of watershed values in that the forest as an 'input' to watershed protection defines the object of value. Avoided expenditures tend to be the source of the unit value, e.g. the willingness to pay of a hydroelectric company for upstream forest conservation reflects the losses that would otherwise accrue due to reservoir sedimentation if the forest is degraded. Climate benefits also tend to be based on the production function approach: climate regulation is an input to many services such as avoided sea level rise, crop damage etc. The individual forms of damage may be valued in many different ways but market prices and avoided costs tend to dominate. Finally, non-use values can only be valued by stated preference techniques, i.e. through questionnaires about willingness to pay, because non-use values leave no 'behavioural trail' for the analysts to assess. Table 21 summarises the techniques that are applicable. One technique listed there appears to have general application. This is 'choice modelling'. Choice modelling refers to a range of techniques in which respondents to a questionnaire are presented with options between which they have to choose. The options combine various features or attributes. The levels of these attributes is varied across the options so that respondents are choosing between different 'bundles' of attributes. A price or cost is generally included as an attribute. Rather than stating their willingness to pay for the different attributes, respondents imply valuations through their rankings. The analyst elicits the valuations through econometric procedures. The relevance of choice modelling to the forest context will be evident. Potentially, each forest good or service can be treated as an attribute. The attributes will vary in level across different forest management systems (and across different forest conversions). In principle, then, choice modelling could lead to valuations of each of the attributes of the forest. In practice choice modelling is still being tested out in environmental contexts (it is familiar in market research and transport analysis) so that it is difficult to say how successful it is likely to be. In the meantime, the available techniques are potentially powerful means of measuring individuals' willingness to pay for forest goods and services.

45
Table 21 Valuation techniques and forest goods and services Forest good or service Valuation techniques PF MP AC CV CM TC HP Timber √ √ Fuelwood √ √ √ NTFPs √ √ √ Genetic information √ √ √ Recreation/Tourism √ √ Watershed √ √ √ √ Climate √ √ √ √ √ Biodiversity √? √ Amenity √ √ √ Non-use values √ √ PF = production function, MP = market price, CV = contingent valuation, CM = choice modelling, TC = travel cost, HP = hedonic prices (property prices), AC = avoided costs

46
Annex 1 Timber values for sustainable and conventional logging
Study Country Type of forestry
Rate of return or net present value (% =
discount rate)
Ratio profits CL
to SFM Comment
Bann, 1997 Cambodia STM, CL CL = $1,697 ha STM = $408 ha (6%)
4.1 90 yr x 3 cutting cycle for STM; 30 yr liquidation for CL
Barreto et al, 1998
Brazil STM $430 ha (20%)
n.a STM profitable
Barros and Uhl, 1995
Brazil CL 14-26% n.a Authors argue STM is possible
Boscolo and Mendelsohn, 1998
Malaysia RIL vs. CL $4400 ha CL $2660 ha STM
1.66 STM Assumes RIL and >60 cm dbh
Browder et al. 1996
Brazil New planting on degraded fallow; agro-forestry; mahogany
NPV = $226 ha degraded fallow; $-50 ha agroforestry; $721 ha pure stand plantation
Not strictly comparable to other studies as new planting
Dixon et al. 1994
Chile CL vs. SFM $500-3000 per ha more than SFM
Howard and Valerio, 1996
Costa Rica STM vs. conversion
STM in South $1340-1612 per ha; in North $671-1142 per ha (10%)
STM > ranching but possibly not with crops
Strong sensitivity to parameters for crops
Howard et al, 1996
Bolivia STM vs. CL CL $334-449 ha STM $204-263 ha (10%)
1.3 – 1.7
Johns et al, 1996
Brazil RIL vs. CL 0.75 needs to be checked
Kishor and Constantino, 1993
Costa Rica STM vs. CL vs. ranching
Liquidation=$1292 ha Ranching= $1319 ha STM = $854 ha. (8%)
1.50 Liquidation involves 60% cover removal
Haltia and Keipi, 1997
Costa Rica STM vs. ranching
Managed natural forest $294 ha better than ranching
Reworks Kishor and Constantino
Kumari, 1996 Malaysia STM vs. CL CL = $860-1380 ha STM = $322-$944 ha
1.5 – 1.7 (taking ‘best’ STM and same damage levels)
Laarman et al, 1995
Philippines Community forest, STM
STM = $638 ha (12%) STM profitable
Mendoza and Ayemou, 1992
Ivory Coast
STM vs. CL STM + processing = $160 ha (10%), but CL >STM
check
Peters et al, 1989
Peru SFM $933 ha (5%) 3.0 Disputed study
Pinedo-Vasquez, et al. 1992
Peru Community forest, CL
254% return on annual investment
check

47
Richards et al, 1991
Mexico Community forest, STM
14-15% annual return on capital, including processing
Shawahid et al,1997
Malaysia Protection vs. RIL
Protection = 10.4 mRupees, RIL = 26.6 mRupees
n.a Protection less desirable than RIL
Southgate and Elgegren, 1995
Peru STM Negative NPV Adverse public policy and guerrilla warfare. NPV could have exceeded opp.cost of STM
Stone, 1996 Brazil Unregulated CL 8% profit margin for small mills, 18% for large mills
Revisits Verissimo et al, 1992
Verissimo et al, 1995
Brazil Unregulated single selective cut, but with regeneration
28% annual profit including processing
Mahogany ‘mining’: few trees left
Verissimo et al, 1992
Brazil STM vs. CL STM has 25% annual return on investment including processing
26 (10%) 19 (5%)
World Bank (summarised in Grut, 1990)
Ghana Guinea
RIL SFM
25% IRR at border prices 34% IRR at border prices
Use of border prices indicates an economic analysis rather than a financial analysis
Sources and notes: Two literature overviews form the core of the table (Gullison et al., 1998, and FAO, 1999), but some entries have been modified and a number of additional studies have been added. RIL = reduced impact logging; CL = conventional logging; STM = sustainable timber management; SFM = sustainable forest management; NPV = net present value; IRR = internal rate of return.

48
Annex 2 Estimates of the pharmaceutical values of forests ($2001) Table A2.1 surveys the estimates of pharmaceutical value found in the literature. Since the relevant values are marginal values, only the later studies are relevant to any serious appraisal of the economic value of forests. The methodology can be illustrated by looking at the Simpson et al. methodology. The fundamental equation elicited by Simpson et al (1994, 1996) is given below. Max WTP = λ/r.[(R-c)/(n+1)].e-R/R-K where the symbols used are explained below along with the numerical estimates used by Simpson et al. λ = expected number of potential products to be identified = 10.52 n = number of species that could be sampled = 250,000 c = cost of determining whether a species will yield a successful product = $3,600 r = discount rate = 10% = 0.1 e = natural logarithm = 2.718 K = expected R and D cost per new product successfully produced = $300 million R= revenues from new product net of costs of new product sales but gross of R and D costs = $450 million. Substituting these estimates into the equation gives a maximum willingness to pay of $9410 for the marginal species. WTP for the marginal species is not a concept that it is easy to identify with. Accordingly, the values may be translated into WTP for land that is subject to the risk of conversion. Most biodiversity loss appears to be caused by conversion from high diversity forest use to agriculture, so that Simpson et al. and Rausser-Small rightly express the WTP in terms of forest land designated as being subject to major threat, the so-called ‘biodiversity hotspots’. This is done as follows: • First, the ‘species-area’ relationship is given by n = αAZ where n is the number of species, A
is area, α is a constant reflecting the species richness potential of the area, and Z is a constant equal to 0.25.
• Second, the economic value V of land area A is given by V[n(A)]. • Third, the value of a change in land area A is given by ∂V/∂A = ∂V/∂n.∂n/∂A. The expression
∂V/∂n is the marginal value of the species, i.e. $9410. • Fourth, ∂n/∂A = ZαAZ-1 = Z.n/A = ZD, where D is the density of species. Hence, the value of marginal land is given by : Value of marginal species x 0.25 x density of species. The resulting values are given in the first column of estimates in Table 6 of the main text15. The overwhelming impression is of the very small values that emerge. While ‘hot spot’ land often 15 In Simpson (1998a) the values per unit land-area are in fact even smaller than those shown here, by about an order of magnitude. The difference arises from the fact that the original estimates, shown here, are ‘static’ whereas the

49
exchanges for small land values, they are almost universally well in excess of the highest value found by Simpson et al., i.e. around $20 per hectare. The essential reasons for the low values are (a) that biodiversity is abundant and hence one extra species has low economic value; (b) that there is extensive ‘redundancy’ in that, once a discovery is made, finding the compound again has no value. Each additional ‘lead’ is likely to be non-useful or, if useful, redundant. Either way, low values result. Simpson and Sedjo (1996b) offer some further ‘scenarios’ to show the sensitivity of the value of the marginal species to the assumed abundance of species (n). With n= 250,000 the value of the marginal species might be $2500 under the model used in Simpson and Sedjo (1996b), but with n=1 million the value is effectively zero. Polasky and Solow (1995) have shown that this result does not change even when discoveries vary in quality or where the success rate varies directly with the ‘genetic distance’ 16. Simpson (1998a) argues that the estimates ‘raise serious doubts concerning the efficacy of two popular strategies to encourage the conservation of biodiversity’, namely, expanding biodiversity ‘prospecting’, and establishing property rights in biodiversity. These conclusions hold true if (a) the estimates of pharmaceutical value are correct and (b) the relevant land area has no other economic value in conservation. The first assumption has been challenged by Rausser and Small. The second assumes that existence and other use values are small or that they are significant but not capturable. Simpson and Sedjo (1996a) raise a further issue which is that if biodiversity is commercially so valuable, why do private investors not make considerably greater investments in conserving forest areas for genetic material? While there are undoubtedly ‘cycles’ in bio-prospecting, there is little evidence to suggest that pharmaceutical companies are failing to exploit major commercial opportunities. Table 6 in the main text also shows later estimates by Simpson and Craft (1996). The basic difference between the Simpson et al (1994, 1996) estimates and the Simpson and Craft (1996) estimates is that the former assume either perfect substitutability or no relationship between species, whereas the latter estimates assume that species are ‘differentiated’ such that one is not a perfect substitute for the other. The result is that the new estimates relate to ‘social surplus’, i.e. the sum of profits and consumer surplus17. Note that this concept of social value differs from that used by Principe and Pearce and Puroshothaman which is related to the value of life-saving because of the resulting drugs. The relevant equation in Simpson and Craft (1996) is: SS = E(π).[(5-12τ)/12n] smaller estimates come from a ‘dynamic’ form of the Simpson et al. model. In the dynamic form of the model, testing of genetic material takes place until the marginal contribution (benefit) of the last species is equal to the marginal cost of waiting until the next period in which tests are conducted. Essentially, then, the dynamic model makes the marginal value of species for pharmaceutical use even smaller. We are indebted to David Simpson at RFF for discussion on this issue. See also Simpson (1998b). 16 Genetic distance refers to the degree of genetic dissimilarity between species. It could be argued that what matters most for the conservation of diversity per se is conserving dissimilar species, i.e. those with the largest genetic distance. See Weitzman, 1992,1993; Polasky, Solow et al, 1993; Solow and Polasky, 1994; Polasky and Solow, 1995. 17 Consumer’s surplus is the excess of WTP over what is actually paid. It is a measure of the net benefit that a consumer obtains when purchasing a product.

50
Where SS is the ‘social surplus’, E(.) is the expected present value, π is industry profits, τ is the ratio of R&D expenditures to total profits, and n is the number of species on which experimentation might take place. Using the data in Simpson and Craft (1996) gives: E(π) = $4 trillion τ = PV(R+D)/PV(E(π)) = 0.375 n = 10 million and SS = $16,700, i.e. the social value of the marginal species is some $17,00018. (The estimates in Table 6 actually use a higher value of $33,000 for the marginal species). Simpson and Craft (1996) illustrate the outcome of their estimation procedure by assuming a 25% loss in the number of species19. The result is a social loss of some $111 billion in net present value terms, or around 0.01% of the world’s gross national product when the former is expressed as an annuity. The policy implications of the earlier work by Simpson et al. are modified to some extent by the Simpson and Craft work. Whereas economic values of (effectively) zero to $20 per hectare are extremely unlikely to affect land conversion decisions, the larger ‘social’ values would be relevant to changing land use in some areas: ‘modest incentives might be sufficient to motivate conservation in some areas’ (Simpson and Craft, 1996, p4). The third numerical column of Table 6 shows estimates produced by Rausser and Small (1998a) who rework the Simpson et al estimates. Rausser and Small argue that the Simpson studies characterise the pharmaceutical companies’ search programme as one of randomly selecting from large numbers of samples. Each sample is then as good as any other since each is assumed to contribute equally to the chances of success. This random sequential testing does not in fact describe a cost-minimising approach to selection. Rather, samples are selected on a structured basis according to various ‘clues’ about their likely productivity. ‘Leads’ showing high promise are therefore of significant value because they help to reduce the costs of search overall20. In effect, samples cease to be of equal ‘quality’ with some samples having much higher demand because of their information value. Clues to that value may come from experience, knowledge of particular attributes, and even indigenous use of existing materials. Rausser and Small (1998a, 1998b) argue that the information value attached to a lead arises from the costs of search and the probability of a success, with the value of the successful drug being relatively unimportant. The Rausser-Small estimates confer greater value on biodiversity than do the Simpson-Craft estimates and substantially more than the Simpson et al values. Rausser and Small (1998a) conclude that: ‘The values associated with the highest quality sites – on the order of $9000/hectare in our simulation – can be large enough to motivate conservation activities’ (p17). Simpson (1998b) argues that the Rausser-Small results are not robust. First, there is some question as to whether the Simpson et al. numbers can be used to apply to a model derived with 18 In fact Simpson and Craft obtain a value of ‘about’ $33,000. This comes from taking the value of τ to be ‘about one third’, whereas the data they use show it to be 0.375. The value of SS is in fact very sensitive to the value of τ. 19 The result is obtained by integrating the equation given previously for n=7.5 million to n=10 million species. 20 Such leads are said to command ’information rents’, i.e. an economic value that derives from their role in imparting information.

51
very different assumptions. The Simpson et al. estimates were deliberately set up to be upper bound estimates. Second, the Rausser-Small model assumes that testing costs for a given area are independent of the number of tests taken, and this is questionable. Third, the Rausser-Small model implies that redundancy is not a serious issue, i.e. additional research generates roughly equal increments in terms of potential drug benefits. But Simpson argues that this holds only when the probability of a ‘discovery’ and the number of research ‘leads’ are small. Otherwise, redundancy is a significant issue and explains the low value of untested species. Fourth, Simpson questions whether the assumption of ‘random sampling’ is as misleading as Rausser and Small claim. Table A2.1 Literature estimates of the value of forest and other ecosystem based pharmaceutical genetic material
Study Value Comment Farnsworth and Soejarto, 1985
$325 million per plant- based drug, USA.
Value of prescriptions for plant based drugs divided by 40 drugs based on plants. Average value.
Farnsworth and Soejarto, 1985
$2.6 million per year per single untested plant species, USA.
40 successful plants out of 5000 tested entails 1 success per 125 tested plants. Total value of plant based drugs ($298 million) divided by 125 gives value of untested species. NB an average value.
Principe, 1991 $0.5 million per year per
untested plant species, OECD.
Based on Farnsworth and Soejarto, but with modified probability of success in deriving a drug from a plant test. OECD total value of $600 million (1980$) x 1 in 2000 probability of success = $300,000 per untested drug = $510,000 per untested drug 1998 prices. Average value.
McAllister, 1991 $10355 per untested tree
species, Canada, per annum.
3 in 100 Canadian trees estimated to have marketable medicinal properties. Value of untested species = annual global value of a drug = $250,000 x 0.03 = $7500 in 1990 prices. Average value (low value due to low assumed value of successful drug).
Principe, 1991 $31 million per untested
species, OECD, per annum.
$37.5 billion annual value per successful species, divided by 1 in 2000 probability of success = $18.8 billion per untested species, or $28.4 billion in 1998 prices. Value based on value of statistical life saved of $8 million (1984 prices).
Ruitenbeek, 1989 $207 per untested species
per annum. Assumed 10 research discoveries in Camerounian rainforest each with patent value of $7500 per annum. Divided by 500 species = $150 or $190 in 1998 prices. Note use of patent values as measure of value.
Pearce and Puroshothaman, 1995
$810 to $1.45 million per untested species, OECD, per annum.
Uses Principe and Farnsworth data. Lower value is private value and upper is social value based on VOSL of $7 million.
Reid et al., 1993 $4-$5014 per untested
species per annum, hypothetical deal (annuitised at 5% over 20 years).
Royalty of 3% assumed, 1 in 10,000 success rate.
Artuso, 1994
Present value of $944 per sample extract in terms of private WTP; $10790 per
Detailed analysis of cash flows associated with sampling 25,000 extracts. Average value.

52
extract in social terms.
Mendelsohn and Balick, 1995
Net revenue to drug companies = $3.0 to 4.5 billion from rights of access to all tropical forests. Around $1 per hectare.
Average value based on likely discoveries and their market value.
Simpson et al. (1994, 1996)
‘Private’ WTP of $0.02 to $2.5 per hectare of ‘hotspot’ land.
See text
Simpson and Craft (1996)
‘Social’ WTP of $31.6 to $3148 per hectare of hotspot’ land .
See text
Rausser and Small (1998a)
‘Private’ WTP of $0 to $10,000 per hectare of ‘hotspot’ land.
See text

53
References Ad Hoc Technical Group on Forest Biological Diversity (2000), Report of the First Meeting, Montreal 27 November - 1 December, Montreal: Convention on Biological Diversity
Adger, N., Brown, K., Cervigni, R and D. Moran, 1995. Total economic value of forests in Mexico, Ambio, 24(5), 286-296.
Ammour, T., Windevoxhel, N and Sencion, G. 2000. Economic valuation of mangrove ecosystems and subtropical forests in Central America, in M. Dore and R. Guevara (eds), Sustainable Forest Management and Global Climate Change, Cheltenham: Edward Elgar, 166-197
Anderson, D. 1987. The Economics of Afforestation: a Case Study in Africa, Baltimore: Johns Hopkins University Press.
Anderson, L and Cordell, H. 1988. Influence of trees on residential property values in Athens, Georgia, Landscape and Urban Planning, 15, 153-164
Artuso, A. (1994) Economic Analysis of Biodiversity as a Source of Pharmaceuticals, Pan American Health Organisation/ Inter American Institute for Cooperation in Agriculture, Conference on Biodiversity, Biotechnology and Sustainable Development, San Jose, Costa Rica, mimeo.
Aylward, B. (1993) The Economic Value of Pharmaceutical Prospecting and Its Role in Biodiversity Conservation. London Environmental Economics Centre, International Institute for Environment and Development, LEEC Paper DP 93-05, London
Aylward, B., Echeverria, J., Fendt, L. and Barbier, E. (1993) The Economic Value of Species Information and its Role in Biodiversity Conservation. Report to the Swedish International Development Authority (SIDA), London Environmental Economics Centre, International Institute for Environment and Development, London
Bahuguna, V. 2000. Forests in the economy of the rural poor: an estimation of the dependency level, Ambio, 29, 3, May, 126-129
Balick, M and R. Mendelsohn, 1992. The economic value of traditional medicine from tropical rain forests, Conservation Biology, 6, 128-139.
Bann, C. 1997. An Economic Analysis of Tropical Forest Land Use Options: Ratanakiri Province, Cambodia. Singapore: Economy and Environment Program for Southeast Asia
Bann, C. 1998a. The Economic Value of Tropical Forest land Use Options: a Manual for Researchers, Singapore: Economy and Environment Program for Southeast Asia.
Bann, C. 1998b. Turkey: Forest Sector Review - Global Environmental Overlays Program. Final Report. Washington DC: World Bank
Bann, C. 1999. A Contingent valuation of the mangroves of Benut, Johor State, Malaysia. Report to DANCED, Copenhagen.
Barbault, R and Sastrapradja, S. 1995. Generation, maintenance and loss of biodiversity, in V.Heywood (ed), Global Biodiversity Assessment, Cambridge: Cambridge University Press, 193-274
Barbier, E. and Aylward, B. (1996) Capturing the pharmaceutical value of biodiversity in a developing country. Environmental and Resource Economics, 8 (2), pp. 157-191
Barbier, E., Burgess, J, Bishop, J and Aylward, B. 1994. Economics of The Tropical Timber Trade, London: Earthscan.
Barros, A and Uhl, C. 1995. Logging along the Amazon river and estuary: patters, problems and potential, Forest Ecology and Management, 77, 87-105
Batagoda, B. 1997. Valuing Rainforests, Ph D Thesis, Norwich: University of East Anglia
Batagoda, B., Turner, R., Tinch, R and Brown, K. 2000. Towards Policy Relevant Ecosystem Services and Natural Capital Values, CSERGE Working Paper GEC 2000-06, University of East Anglia and University College London.
Bateman, I and Langford, I. 1997. Budget constraint, temporal and ordering effects in contingent valuation studies, Environment and Planning, 29, 7, 215-28

54
Bateman, I., Lovett, A and Brainard, J. 1999. Developing a methodology for benefit transfers using geographical information systems: modelling demand for woodland recreation, Regional Studies, 33, 3, 191-205
Beckerman, W and Pasek, J. 2001. What Price Posterity? Environmental Ethics for a New Millennium, Oxford: Oxford university Press.
Bellu, L and Cistulli, V. 1997. Economic Valuation of Forest Recreation Facilities in the Liguria Region (Italy), Working paper GEC 97-08, Centre for Social and Economic Research on the Global Environment, University of East Anglia and University College London.
Bishop, J. 1998. The Economics of Non-timber Forest Benefits: an Overview, London: International Institute of Environment and Development.
Bishop, K. 1992. Assessing the benefits of community forests: an evaluation of the recreational use benefits of two urban fringe woodlands, Journal of Environmental Planning and Management, 35, 1, 63-76
Bojö, J. 1993. Economic valuation of indigenous woodlands, in P Bradley and K.McNamara (eds), Living with Trees: Policies for Forestry Management in Zimbabwe, Washington DC: World Bank.
Browder, J., Matricardi, E and Abdala, W, 1996. Is sustainable tropical timber production financially viable? A comparative analysis of mahogany silviculture among small farmers in the Brazilian Amazon, Ecological Economics, 16, 147-159.
Brown, J and Pearce, D.W. 1994. The economic value of carbon storage in tropical forests, in J.Weiss (ed), The Economics of Project Appraisal and the Environment, Cheltenham: Edward Elgar, 102-23.
Brown, K and Pearce, D.W. 1994. The Causes of Tropical Deforestation, London: University College London Press.
Cairns, J and van der Pol, M. 2000. The estimation of marginal time preference in a UK-wide sample, Health Technology Assessment, 4, 1, 1-83.
Campbell, B., Clarke, J., Luckert, M., Matose, F., Musvoto, C and Scoones, I. 1995. Local-level Economic Valuation of Savanna Woodland Resources: Village Cases from Zimbabwe, London: International Institute for Environment and Development.
Cavendish, W. 1999. Empirical Regularities in the Poverty-Environment Relationship of African Rural Households, Working paper 99-21, Centre for the Study of African Economies, Oxford University.
Chase, L., Lee, D., Schulze, W and Anderson, D. 1998. Ecotourism Demand and Differential Pricing of National Park Access in Costa Rica, Department of Natural Resources, Cornell University, mimeo.
Chomitz, K and Kumari, K. 1996. The Domestic Benefits of Tropical Forests: a Critical Review, Working paper 96-19, CSERGE, University of East Anglia and University College London.
Chomitz, K., Brenes, E and Constantino, L. 1998. Financing Environmental Services: The Costa Rica Experience and Its Implications, Washington DC: World Bank, mimeo.
Clarkson, R. 2000. Estimating the Social Cost of Carbon Emissions, London: Department of the Environment, Transport and the Regions.
Clinch, P. 1999. Economics of Irish Forestry, Dublin: COFORD
Costanza, R, R.D'Arge, R de Groot, S.Farber, M.Grasso, B.Hannon, K.Limburg, S.Naeem, R.O'Neill, J.Paruelo, R.Raskin, P.Sutton and M van den Belt, The value of the world's ecosystem services and natural capital, Nature, 387, May 15 1997, 253-260. An extended version is available on Nature's website: www.nature.com.
Cropper, M., Aydede, S and Portney, P. 1994. Preferences for life saving programs: how the public discounts time and age, Journal of Risk and Uncertainty, 8, 243-265
Cuesta, M., Carlson, G and Lutz, E. 1994. An Empirical Analysis of Farmers' Discount Rates in Costa Rica and its Implication for Soil Conservation. Washington DC: World Bank, mimeo.
Dixon, J., Paredes, G., and Donoso, C, 1994. Native Forest Management Options in Southern Chile: Assessing Trade-Offs Between Income and Biodiversity, World Bank, Washington DC, mimeo.
Elsasser, P. 1999. Recreational benefits of forests in Germany, in C.Roper and A.Park (eds), The Living Forest: the Non-market Benefits of Forestry, London: The Stationery Office, 175-188

55
ERM (Environmental Resources Management) 1996. Valuing Management for Biodiversity in British Forests, Report to The Forestry Commission, Edinburgh.
Garrod, G and Willis, K. 1992. Valuing goods' characteristics: an application of the hedonic price method to environmental attributes, Journal of Environmental Management, 34,59-76
Garrod, G and Willis, K. 1997. The recreational value of tropical forests in Malaysia, Journal of World Forest Resource Management, 8, 183-201
Godoy, R. and Lubowski, R. 1992. Guidelines for the economic valuation of non-timber tropical-forest products, Current Anthropology, 33(4), August-October, 423-433.
Godoy, R., Lubowski, R and A.Markandya, 1993. A method for the economic valuation of non-timber tropical forest products, Economic Botany, 47(3), 220-233.
Goldemberg, J., Johansson, T., Reddy, A and Williams, R. 1987. Energy for a Sustainable World, Washington DC: World Resources Institute.
Grimes, A., Loomis, S., Jahnige, P., Burnham, M., Onthank, K., Alarcón, R., Cuenca, W.P., Martinez, C.C., Neill, D., Balick, M., Bennett, B., Mendelsohn, R. 1994, Valuing the Rain Forest: The Economic Value of Nontimber Forest Products in Ecuador, Ambio, 23 (7).
Grut, M. 1990. Economics of Managing the African Rainforest, World Bank, Washington DC
Gunawardena, U., Edwards-Jones, G and McGregor, M. 1999. A contingent valuation approach for a tropical rainforest: a case study of Sinharaja rainforest reserve in Sri Lanka, in In Roper S and Park, A (eds), The Living Forest: the Non-Market Benefits of Forestry, London: The Stationery Office, 275-284
Haefele, M., Kramer, R and Holmes, T. 1992. Estimating the total economic value of forest quality in high elevation spruce-fir forests, in C.Payne, J.Bowker and P.Reed (eds), Economic Value of Wilderness, Athens, Georgia: USDA Forest Service.
Haltia, O and Keipi, K, 1997. Financing Forest Investments in Latin America: the Issue of Incentives, Environment Division, Inter-American Development Bank, Washington DC.
Hamilton, L and King, P. 1983. Tropical Forested Watersheds: Hydrologic and Soils responses to Major uses or Conversions, Boulder: Westview Press.
Hanley, N and Ruffell, R. 1991. Recretaional Use Values of Woodland Features, Report to the Forestry Commission, Edinburgh
Hanley, N and Ruffell, R. 1992. The Valuation of Forest Characteristics, Working Paper 849, Department of Economics, University of Stirling
Hanley, N. 1989. Valuing rural recreation benefits: an empirical comparison of two approaches, Journal of Agricultural Economics, 40, 361-76
Hawksworth, D and Kalin-Arroyo, M. 1995. Magnitude and distribution of biodiversity, in V.Heywood (ed), Global Biodiversity Assessment, Cambridge: Cambridge University Press, 107-192
Hodgson, G and Dixon, J. 1988. Measuring economic losses due to sediment pollution: logging versus tourism and fisheries, Tropical Coastal Area Management, April, 5-8
Holling, C., Schindler, D., Walker, D and Roughgarden, J. (1994). Biodiversity in the functioning of ecosystems, in C.Perrings, C.Folke, C.Holling, B.Janssen and K-G Mäler, Biological Diversity: Economic and Ecological issues, Cambridge: Cambridge University Press, 44-83
Houghton, K. and Mendelsohn, R. 1996. An economic analysis of multiple use forestry in Nepal. Ambio, 25, No.3, May, 156-159.
Howard, A., Rice, R and Gullison, R. 1996. Simulated financial returns and selected environmental impacts from four alternative silvicultural prescriptions applied to the neotropics: a case study of the Chimanes Forest, Bolivia, Forest Ecology Management, 89, 43-57
Howard, A and Valerio, J. 1996. Financial returns from sustainable forest management and selected agricultural land-use options in Costa Rica, Forest Ecology and Management, 81, 35-49
International Energy Agency, 1998. Energy Statistics and Balances of Non-OECD Countries 1995-1996, Paris: IEA

56
Iremonger, S., Ravilious, C and Quinton, T. 1997. A statistical analysis of global forest conservation, in Iremonger, S., Ravilious, C and Quinton, T (eds), A Global Overview of Forest Conservation, Including GIS Files of Forests and Protected Areas - Version 2. CD-ROM. Cambridge: CIFOR and WCMC
Johns, J., Barreto, P and Uhl, C. 1996. Logging damage during planned and unplanned logging operations in eastern Amazonia, Forest Ecology and Management, 89, 59-77.
Kaimowitz, D and Angelsen, A. 1998. Economic Models of Tropical Deforestation: a Review, Bogor, Indonesia: CIFOR
Kant,S., Nautiyal, J and R.Berry, 1996. Forests and economic welfare. Journal of Economic Studies, 23(2), 31-43.
Kishor, N and Constantino, L. 1993. Forest management and Competing Land Uses: an Economic Analysis for Costa Rica, LATEN Dissemination Note &, Washington DC: World bank.
Kramer, R and Mercer, E. 1997. Valuing a global environmental good: US residents' willingness to pay to protect tropical rain forests, Land Economics, XXXX
Kramer, R., Sharma, N and M.Munasinghe, 1995. Valuing Tropical Forests: Methodology and Case Study of Madagascar, Environment Paper No.13, Washington DC: World Bank.
Kriström, B and Riera, P. 1996. Is the income elasticity of environmental improvements less than one? Environmental and Resource Economics, 7, 45-55
Kumari, K. 1996. Sustainable forest management: myth or reality? Exploring the prospects for Malaysia, Ambio, 25, 7, 459-467
Lampietti, N and Dixon, J. 1995. To See the Forest for the Trees: a Guide to Non-timber Forest Benefits, Washington DC: Environment Department, World Bank, mimeo.
Lockwood, M., Loomis, J and De lacy T. 1993. A contingent valuation survey and benefit-cost analysis of forest conservation in East Gippsland, Australia. Journal of Environmental Management, 38, 233-243
Loomis, J and Ekstrand, E. 1998. Alternative approaches for incorporating respondent uncertainty when estimating willingness to pay: the case of the Mexican spotted owl, Ecological Economics, 27, 29-41
Loomis, J and Gonzáles-Cabán, A. 1998. A willingness to pay function for protecting acres of spotted owl habitat from fire, Ecological Economics, 25, 315-322.
Lynam, T., Campbell, B and Vermeulen, S. 1994. Contingent Valuation of Multipurpose Tree Resources in the Smallholder Farming Sector, Zimbabwe, Paper 1994:8, Gothenburg University: Department of Economics
Maille, P and Mendelsohn, R. 1991. Valuing Ecotourism in Madagascar, New Haven: Yale School of Forestry, mimeo.
Meinyck, M and Bell, N, 1996. The direct use values of tropical forest foods: the Huottuja (Piaroa) Amerindians of Venezuela, Ambio, 25, 7, 468-472
Mendelsohn, R and Balick, M. 1995. The value of undiscovered pharmaceuticals in tropical forests. Economic Botany, 49(2), 223-228.
Mendelsohn, R. and Balick, M. (1995) The value of undiscovered pharmaceuticals in tropical forests. Economic Botany 49 (2), pp. 223-228
Mendoza, G and Ayemou, A. 1992. Analysis of some forest management strategies in Cote d’Ivoire: a regional case study, Forest Ecology and Management, 47, 149-174
Miller, K and Tangley, L. 1991. Trees of Life: Saving Tropical Forests and their Biological Wealth, Boston: Beacon Press.
Mooney, H., Lubchenco., Dirzo, R and Sala, O. 1995. Biodiversity and ecosystem functioning: basic principles, in V.Heywood (ed), Global Biodiversity Assessment, Cambridge: Cambridge University Press, 275-325
Morales, D. 1980. The contribution of trees to residential property value, Journal of Arboricukture, 6, 305-308
Myers, N. (1979) The Sinking Ark. Pergamon Press, Oxford
Myers, N. (1983) A Wealth of Wild Species. Westview Press, Boulder, Co.
Myers, N. 1984. The Primary Source: Tropical Forests and Our Future, Norton, New York.

57
Oldfield, M. (1984) The Value of Conserving Genetic Resources. National Park Service, US Department of the Interior, Washington DC
Pattanayak, S and Kramer, R. 2001. Worth of watersheds: a producer surplus approach for valuing drought mitigation in Eastern Indonesia, Environment and Development Economics, 6, 1, 123-146
Pearce, D.W and Moran, D. 1994. The Economic Value of Biological Diversity, London: Earthscan.
Pearce, D.W and Moran, M. 2001. The Value of Biological Diversity: a Handbook, Paris: OECD (forthcoming).
Pearce, D.W and Puroshothaman, S. 1995. The Economic Value of Plant-based Pharmaceuticals, in T.Swanson (ed), Intellectual Property Rights and Biodiversity Conservation, Cambridge University Press, Cambridge, 127-138.
Pearce, D.W and Ulph, D. 1999. A social discount rate for the United Kingdom, in D.W.Pearce, Economics and the Environment: Essays in Ecological Economics and Sustainable Development, Cheltenham: Edward Elgar,268-285
Pearce, D.W. 1996. Global environmental value and the tropical forests: demonstration and capture, in W.Adamowicz, P. Boxall, M.Luckert, W.Phillips and W.White (eds), Forestry, Economics and the Environment, Wallingford: CAB International, 11-48.
Pearce, D.W. 1998. Auditing the Earth, Environment, 40, 2, March, 23-28
Pearce, D.W. 1998. Can non-market values save the tropical forests? In Goldsmith, B (ed), Tropical Rain Forest: a Wider Perspective, London: Chapman and Hall,255-268
Pearce, D.W. 1999. Can non-market values save the world's forests? In Roper S and Park, A (eds), The Living Forest: the Non-Market Benefits of Forestry, London: The Stationery Office, 5-16
Pearce, D.W. 2001. The Insurance Industry and the Conservation of Biological Diversity, Report to Environment Directorate, OECD, Paris.
Pearce, D.W., Putz, F and Vanclay, J. 2001. A sustainable forest future? In Pearce, D.W and Pearce, C (eds), Valuing Environmental Benefits: Case Studies from the Developing World, Cheltenham: Edward Elgar
Pearce,D.W. 1994. Assessing the social rate of return from investment in temperate zone forestry, in R.Layard and S.Glaister (eds), Cost-Benefit Analysis, Second edition, Cambridge: Cambridge University Press,, 464-490
Peters, C.M, Gentry, A, Mendelsohn, G. 1989. Valuation of an Amazonian rainforest, Nature, 339, 655-656
Pimm, S and Raven, P. 2000. Extinction by numbers, Nature, 403, 24 February, 843-845
Pinedo-Vasquez, M., Zarin, D and Jipp, P. 1992. Economic returns from forest conservation in the Peruvian Amazon, Ecological Economics, 6, 163-173.
Polasky, S. and Solow, A. (1995) On the valuation of a collection of species. Journal of Environmental Economics and Management 29, pp. 298-303
Poulos, C and Whittington, D. Individuals' Time Preference for Life Saving Programs: Results from Six Less Developed Countries, mimeo, University of North Carolina, 1999.
Powe. N., Garrod, G., Brunsdon, C and Willis, K.1997. Using a geographical information system to estimate an hedonic price model of the benefits of woodland access, Forestry, 70, 139-149
Principe, P. (1991) Monetizing the Pharmacological Benefits of Plants. US Environmental Protection Agency, Washington DC
Rausser, G. and Small, A. (1998a) Valuing Research Leads: Bioprospecting and the Conservation of Genetic Resources. Working paper No. 819, Department of Agriculture and Natural Resources, University of California at Berkeley, May, mimeo.
Rausser, G. and Small, A. (1998b) Bioprospecting with Patent Races. Department of Agriculture and Natural Resources, University of California at Berkeley, October, mimeo.
Reid, W and Miller, K. 1987. Keeping Options Alive: The Scientific Basis for Conserving Biodiversity, Washington DC: World Resources Institute.
Reid, W., Laird, S., Gamez, R., Sittenfield, A., Janzen, D., Gollin, M. and Juma, C. (1993) A new lease of life. In: Reid, W. et al. (eds.), Biodiversity Prospecting: Using Genetic Resources for Sustainable Development. World Resources Institute, Washington DC, pp. 1-52

58
Ricker, m., Mendelsohn, R., Daly, D and Angeles, G. 1999. Enriching the rainforest with native fruit trees: an ecological and economic analysis in Los Tuxtlas (Veracruz, Mexico), Ecological Economics, 31, 3, 439-448
Scarpa, R., Chilton, S., Hutchinson, W and Buongiorno, J. 2000. Valuing the Recreational Benefits from the Creation of Nature Reserves in Irish Forests, CREAM, University of Newcastle upon Tune, mimeo.
Schneider, R. 1995. Government and the Economy on the Amazon Frontier, Environment Paper 11, Washington DC: World Bank..
Sedjo, R., Wisniewski, J., Sample, A and J.Kinsman. 1995. The economics of managing carbon via forestry: assessment of existing studies, Environmental and Resource Economics, 6, 139-165.
Shahwahid, M., Awang Noor, A., Abdul Rahmin, N., Zulkifli, Y and U.Ragame. 1997. Economic Benefits of Watershed Protection and Trade-Off with Timber Production: a Case Study of Malaysia, Singapore: Economy and Environment Program for Southeast Asia
Shyamsaundar, P and Kramer 1997. Biodiversity conservation - at what cost? A study of households in the vicinity of Madagascar's Mantadia national park, Ambio, 26, 3, 180-184.
Shultz, W, Pinazzo, J and Cifuentes, M. 1998. Opportunities and limitations of contingent valuation surveys to determine national park entrance fees: evidence from Costa Rica, Environment and Development Economics, 3, 131-149.
Simpson, D. (1998a) Biodiversity Prospecting: Shopping the Wilds is Not the Key to Conservation. Resources for the Future Web Page: www.rff/org/resources_articles /files/biod prospect.http
Simpson, D. (1998b) Some comments on ‘bioprospecting with patent races’ and ‘valuing research leads: bioprospecting and the conservation of genetic resources’ by Gordon Rausser and Arthur Small. Resources for the Future, Washington DC, mimeo.
Simpson, D. and Craft, A. (1996) The Social Value of Biodiversity in New Pharmaceutical Product Research, Resources for the Future, Discussion Paper 96-33, Washington DC
Simpson, D. and Sedjo, R. (1996a) Investments in Biodiversity Prospecting and Incentives for Conservation, Resources for the Future, Discussion Paper 96-14, Washington DC
Simpson, D. and Sedjo, R. (1996b) Valuation of Biodiversity for Use in New Product Research in a Model of Sequential Search, Resources for the Future, Discussion Paper 96-27, Washington DC
Simpson, D., Sedjo, R. and Reid, J. (1994) Valuing Biodiversity: an Application to Genetic Prospecting, Resources for the Future, Discussion Paper 94-20, Washington DC (Early version of Simpson et al. 1996)
Simpson, D., Sedjo, R. and Reid, J. (1996) Valuing biodiversity for use in pharmaceutical research. Journal of Political Economy 104 (1), pp. 163-185
Smil, V. 1987. Energy, Food, Environment: Realities, Myths, Options, Oxford: Oxford University Press
Smith, J., Mourato, S., Veneklaas, E., Labarta., R, Reatugui and Sanchez, G. 1997. Willingness to Pay for Environmental Services Among Slash and Burn Farmers in the Peruvian Amazon: Implications for Deforestation and Global Environmental Markets, Working Paper, CSERGE, University of East Anglia and University College London.
Solberg, B. 1997. Forest biomass as carbon sink - economic value and forest management policy implications, Critical Reviews in Environmental Science and Technology, 27 (special), 323-333.
Solow, A ., Polasky, S. and Broadus, J. (1993) On the measurement of biological diversity. Journal of Environmental Economics and Management 24, pp. 60-68
Solow, A. and Polasky, S. (1994) Measuring biological diversity, Environmental and Ecological Statistics 1, pp. 95-107
Southgate, D and Elgegren, J. 1995. Development of tropical timber resources by local communities: a case study from the Peruvian Amazon, Commonwealth Forestry Review, 74, 2, 142-146
Southgate, D. 1996. What Roles Can Ecotourism, Non-timber extraction, Genetic Prospecting, and Sustainable Timber Production Play in an Integrated Strategy for Habitat Conservation and Local Development? Report to inter-American Development Bank.

59
Stone, S. 1996. Economic Trends in the Timber Industry of the Brazilian Amazon: Evidence from Paragominas, CREED Working Paper No.6, International Institute for Environment and Development, London.
Stork, N. 1999. The magnitude of global biodiversity and its decline, in Cracraft, J and Grifo, F (eds), The Living Planet in Crisis: Biodiversity Science and Policy, New York: Columbia University Press, 3-32
Swanson, T and Kontoleon, A. 2000, Why Did the Protected Areas Fail the Giant Panda?, The Economics of Conserved Endangered Species in Developing Countries, World Economics, 1, 4, 135-148.
Swanson, T. (1997) Global Action for Biodiversity. Earthscan, London
Tobias, D and Mendelsohn, R. 1991. Valuing ecotourism in a tropical rain-forest reserve, Ambio, 20(2), April, 91-2.
Tol, R., Fankhauser, S., Richels, R and Smith, J. 2000. How much damage will climate change do? Recent estimates, World Economics, 1, 4, 179-206
Tyrväinen, L and Miettinen, A. 2000. Property prices and urban forest amenities, Journal of Environmental Economics and Management, 39, 205-223
UN Development Programme, UN Department of Economic and Social and Affairs and World Energy Council (2000), World Energy Assessment: Energy and the Challenge of Sustainability, New York: UNDP.
Verissimo, A ., Barreto, P.,Mattos, M.,Tarifa, R and Uhl, C. 1992. Logging impacts and prospects for sustainable forest management in an old Amazonian frontier: the case of Paragominas, Forest Ecology and Management, 55, 169-199
Verissimo, A., Barreto, P., Tarifa, R and Uhl, C. 1995. Extraction of a high value natural resource from Amazonia: the case of mahogany, Forest Ecology and Management, 72, 39-60
Walsh, R., Loomis, J and Gillman, R. 1984. Valuing option, existence and bequest demand for wilderness, Land Economics, 60, 1, 14-29.
Weitzman, M. (1992) On diversity. Quarterly Journal of Economics, CVII, pp. 363-406
Weitzman, M. (1993) What to preserve? An application of diversity theory to crane conservation. Quarterly Journal of Economics, CVIII, pp. 157-184
Whiteman, A and Sinclair, J. 1994. The Costs And Benefits of Planting Three Community Forests, Policy Studies Division, Forestry Commission, Edinburgh.
Willis, K., Benson, J and Whitby, M. 1998. Values of User Benefits of Forest Recreation And Wildlife. Report to the Forestry Commission, Edinburgh
Wunder, S. 2000. The Economics of Deforetsation: the Examples of Ecuador, London: Macmillan
Yaron, G. 2001. Forest, plantation crops or small-scale agriculture? An economic analysis of alternative land use options in the Mount Cameroun area, Journal of Environmental Planning and Management, 44 (1), 85-108
Zhang, Z.X. 2000. Estimating the Size of the Potential Market for the Kyoto Flexibility Mechanisms, Faculty of Law and faculty of Economics, University of Groningen, mimeo.