Assessing and communicating the value of sustainability programs
September 2013
The Value of Communicating Sustainability At The Intersection of Reality and Perception
By James Cerruti, Senior Partner, Brandlogic
There’s little doubt that sustainability is at top-of-mind in the world of business. As awareness increases, stakeholders of all kinds are factoring corporate environmental, social and governance (ESG) performance into their decisions, prompting more and more companies to release annual sustainability reports. At the same time, corporations are seeing the value of sustainability reporting for its direct operational impact. Measuring and reporting on ESG performance and commitments is therefore more than a promotional exercise: an organized and structured effort in accordance with GRI guidelines generates the very information needed to improve efficiency, reduce risk and establish credibility.
Yet, we at Brandlogic know that there’s more to the picture than operational results. As a brand consultancy, we are acutely aware of the value of perception to a company’s reputation and overall competitiveness. It is not enough to perform well in real terms; communicating that performance and the commitments behind it can be equally, if not more, important in the battle to influence the marketplace. Reputation can have a powerful effect, both positive and negative. Apple, for example, has such
a good reputation that it has been able to weather the widely reported governance issues regarding factory working conditions in China with virtually no impact. On the other end of the spectrum, oil companies like BP and ExxonMobil have been and will be tarnished by the legacy of environmental disasters for decades despite Herculean mitigation efforts. Even today, Exxon Valdez is a familiar term burned into the public consciousness – and that incident occurred nearly 25 years ago.
As important as public perception is, consider the practical implications of a company’s sustainability reputation – or lack thereof. A company that is considered to be a good corporate citizen will be more attractive to prospective employees and will be able to recruit better talent. It will be seen as a low-risk operation worthy of greater consideration by potential business partners as

well as investors. These are important factors that go far beyond a “green” reputation among consumers and the general public.
Building a new picture of sustainability performance Brandlogic contends that sustainability should be considered from two directions: real performance as measured by accepted standards such as the GRI, and perceived performance determined through rigorous stakeholder opinion surveys. By doing so, it is possible to determine which companies truly “walk the walk and talk the talk,” which have acquired an unwarranted reputation for sustainability, which are underappreciated and which are lagging behind on both fronts. This information is important for various stakeholder groups for obvious reasons, but it is also valuable to the companies themselves because it can uncover risks to the brand and help guide investment decisions related to sustainable practices, reporting and brand communications.
When we conceived the idea, an in-depth comparison of real vs. perceived sustainability performance had never been done. Sustainability reporting was still not widely practiced and the prevailing focus was on the reality side of the equation. Accordingly, Brandlogic teamed with CRD Analytics on a pair of studies conducted in 2011 and 2012. Their purpose: To examine and compare 100 leading companies across nine industries, using established benchmarks for real ESG performance and our own survey of highly attentive stakeholder audiences around the world for perceived performance.
Real performance is a matter of record and readily available – in fact, the data provided by CRD Analytics form the basis of the NASDAQ Sustainability Index. Perception data, however, are harder to come by. We wanted to find out how perceptions vary by stakeholder group (investors; purchasing professionals who represent supply chain partners; and graduation students who will soon be entering the workforce) as well as by geography and maturity of the economy.
The studies accounted for a tremendous variety of data for each company – over 100 discrete performance measures on the reality side and an extensive set of parallel, targeted questions asked of three stakeholder groups across six countries around the world.
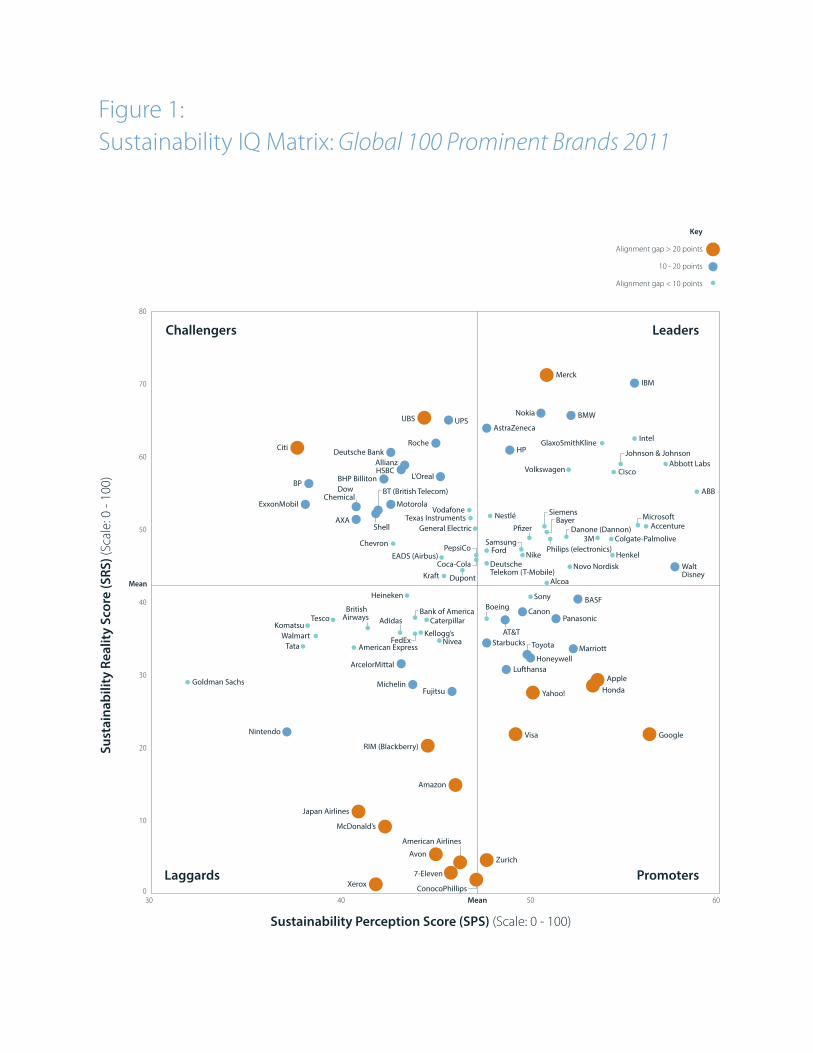
Score (SRS) and the Sustainability Perception Score (SPS). Plotting these produced a useful representation – the Brandlogic Sustainability IQ Matrix™ – that allows direct comparisons of corporate sustainability performance.
The Sustainability IQ Matrix is divided into quadrants to simplify characterization of the companies:
• Leaders – Those who excel in both real and perceived performance • Promoters – Those with relatively high perceived performance, but relatively low real
performance • Challengers – Those with above average real performance but relatively low perception
ratings • Laggards – Companies that trail on both dimensions
Sustainability Score Sources at a glance Sustainability Reality Score (SRS)
• 175 metrics for rating companies • 5 key performance indicators per
ESG dimension • 1,200 rated corporations
Sustainability Perception Score (SPS)
• 16,000+ company ratings • 2,400 respondents from three “most
attentive” stakeholder segments • 100 prominent global corporations
covering 9 of the 10 global industry categories
• 6 major countries covered
Colgate-Palmolive
Walt Disney
Henkel
Honda
Marriott
BMW
Volkswagen
Panasonic
Sony
Toyota
NikeFord
Starbucks
Nestlé
Avon
Michelin
Adidas
McDonald’s
Danone (Dannon)
Coca-Cola
PepsiCo
7-Eleven
Kraft
NiveaKellogg’s
Heineken
Tesco
Walmart
ConocoPhillips
Chevron
Shell
BP
ExxonMobil
Visa
Zurich
UBS
Bank of America
AllianzHSBC
Deutsche Bank
AXA
American Express
Citi
Goldman Sachs
ABB
3M
Siemens
HoneywellLufthansa
Boeing
General Electric
American Airlines
UPS
EADS (Airbus)
Caterpillar
FedEx
British Airways
Japan Airlines
Komatsu
Tata
AccentureMicrosoft
IBM
Intel
Cisco
Apple
Philips (electronics)
Canon
Samsung
HP
Texas Instruments
Fujitsu
RIM (Blackberry)
Xerox
Nintendo
BASF
AlcoaDupont
ArcelorMittal
BHP BillitonDow
Chemical
Abbott LabsJohnson & Johnson
GlaxoSmithKline
Novo Nordisk
Merck
BayerP!zer
AstraZeneca
Roche
Nokia
Yahoo!
AT&T
Deutsche Telekom (T-Mobile)
Vodafone
Amazon
MotorolaBT (British Telecom)
L’Oreal
Key
Alignment gap > 20 points
10 - 20 points
Alignment gap < 10 points
Figure 1: Sustainability IQ Matrix: Global 100 Prominent Brands 2011
Sustainability Perception Score (SPS) (Scale: 0 - 100)
Sust
aina
bilit
y Re
ality
Sco
re (S
RS) (
Scal
e: 0
- 10
0)
Challengers
Laggards
Leaders
Promoters
80
70
60
50
40
30
20
10
030 40 50 60
Mean
Mean

Colgate-Palmolive Walt Disney
HondaMarriott
BMW
Volkswagen
Panasonic Sony
Toyota
Nike Ford
Starbucks
Nestlé
Avon
Michelin
Adidas
McDonald’s
Danone(Dannon)
Coca-ColaPepsiCo
Kellogg’s
Heineken
Tesco
Walmart
ConocoPhillips
Chevron
ShellBP
Dow Chemical
Visa
Zurich
UBS
Bank of America
Allianz
Vodafone
Deutsche Bank
AXA
AmericanExpress
Citi
GoldmanSachs
ABBA
3MSiemensS
HoneywellLufthansa
Boeing
General Electric
American Airlines
UPS
EADS (Airbus)
Caterpillar
FedExBritish Airways
Japan Airlines
Komatsu
Tata
Accenture Microsoft
IBM
Intel
Cisco
Apple
Philips (electronics)
Canon
Samsung
HP
TI
Fujitsu
Xerox
Nintendo
BASF
AlcoaDuPont
ArcelorMittal
BHP BillitonExxonMobil
Abbott Labs
Johnson & JohnsonJ
GlaxoSmithKline
Novo Nordisk
Merck
Bayer
P!zer
AstraZeneca
Roche
Nokia
Yahoo!
AT&T
Deutsche Telekom (T-Mobile)
HSBC
Amazon
BT (British Telecom)h
L’Oréal
Dell
SAP
John Deere
Barclays
H&M
SPS greater than SRS
Alignment gap > 20 points
Alignment gap 10 - 20 points
Alignment gap < 10 points
SRS greater than SPS
Alignment gap > 20 points
Alignment gap 10 - 20 points
Alignment gap < 10 points
Key
Sustainability Perception Score (SPS) (Scale: 0 - 100)
Sust
aina
bilit
y Re
ality
Sco
re (S
RS)(
Scal
e: 0
- 10
0)
Challengers
Laggards
Leaders
Promoters
© C
opyr
ight
201
2 Br
andl
ogic
Cor
p.
80
70
60
50
40
30
20
10
030 40 50 60
Mean 51.7
Mean 44.4
2011 Mean42.4
2011 Mean 47.2
PERCEPTION DOWN2.8 POINTS
REALITYUP 9.3POINTS
Figure 2:Year-over-year change in real and perceived corporate sustainability performance from 2011-2012
Source: Brandlogic, 2012.

One of the interesting things that the Sustainability IQ Matrix does is highlight opportunities and threats for those in the Promoter and Challenger quadrants. Leaders are already employing best practices regarding sustainability reporting and communications, while Laggards need to up their game in every respect to compete. Those in the other two quadrants, however, can use the study findings to make intelligent choices.
For example, a company that has achieved excellent sustainability performance but still has a poor image in the eyes of stakeholders is missing opportunities to attract talent, become a preferred business partner and show that it can meet investor expectations. By the same token, a company that is thought of as highly sustainable but does not have a record of performance to back up its image places considerable economic value at risk. The advantages associated with a good reputation for sustainability could easily be negated if stakeholder misperceptions are corrected.
A dynamic picture of the state of sustainability
By running the study in consecutive years, we were able to add dimension to our findings. The first study established our methodology and provided a snapshot of corporate sustainability in 2011. However, that in and of itself raises an intriguing question: How are commitments to sustainability, real performance and stakeholder attitudes changing over time? Replicating the study in 2012 demonstrated the validity of our approach and provided a second set of data to show how sustainability is evolving. We were also able to look at the data in new ways, for example by focusing in individual industry groups to provide more detailed comparisons of performance.
We found that indeed, things are changing over time as companies take sustainability more seriously. The 2012 study showed that real performance rose for an overwhelming majority of the companies surveyed. As a result, mean performance rose, making it harder to enter the Leader and Challenger quadrants. But at the same time, perceptions fell – either through insufficient communication efforts or because of increasing stakeholder skepticism.
Learning from the Leaders
The two studies also allowed us to identify common characteristics of the companies in the Leaders quadrant – lessons that any business can take to heart to improve performance. As a group, the Leaders:
• Treat sustainability as an integral part of business strategy, not just a compliance issue. The Leaders have evolved (and communicated) a clear business case for sustainability built on the premise that it is possible to “do well by doing good.”
• Take responsibility for the impact of internal operations and those of associated entities, such as supply chain partners. Leading companies have formal codes of conduct for suppliers that define minimum performance standards on ESG and also hold those suppliers responsible for the conduct of subcontractors.
• Implement GRI standards for reporting and ensure that the materiality of sustainability issues is understood by all stakeholder groups. The Leaders excel at full and transparent compliance with GRI standards. Also, they demonstrate why these standards matter to the business in a way that is meaningful for each stakeholder group. That sets the tone for operational and strategic decisions across the enterprise.
• Integrate sustainability into their brand and client value propositions. Making sustainability a central part of customer and investor conversations can fundamentally change how a company is viewed in the marketplace.
• Focus their operational initiatives and related communications on carefully selected themes tied to the core of the business. Leaders make their communications themes around sustainability relevant and complementary, demonstrating that sustainability is not an afterthought or “bolt-on” initiative.
Take a closer look
There’s much more to say about our findings than we can cover here, from specific practices employed by the “best of the best” to the ESG performance issues of greatest importance to key stakeholder groups – and why they matter to every business.
We invite you to download the latest Brandlogic Sustainability Leadership Report for further insights and detailed breakdowns of company, stakeholder and industry sector information. Visit www.sustainabilityleadershipreport.com to learn more.
We also invite you to attend an ISSP-sponsored webinar well worth attending on September 19, 2013 at 2PM EDT, entitled Corporate Sustainability and Communications: the Difficulties of Achieving Differentiation. To join this webinar visit the registration page at https://www.sustainabilityprofessionals.org/civicrm/event/info?reset=1&id=5515
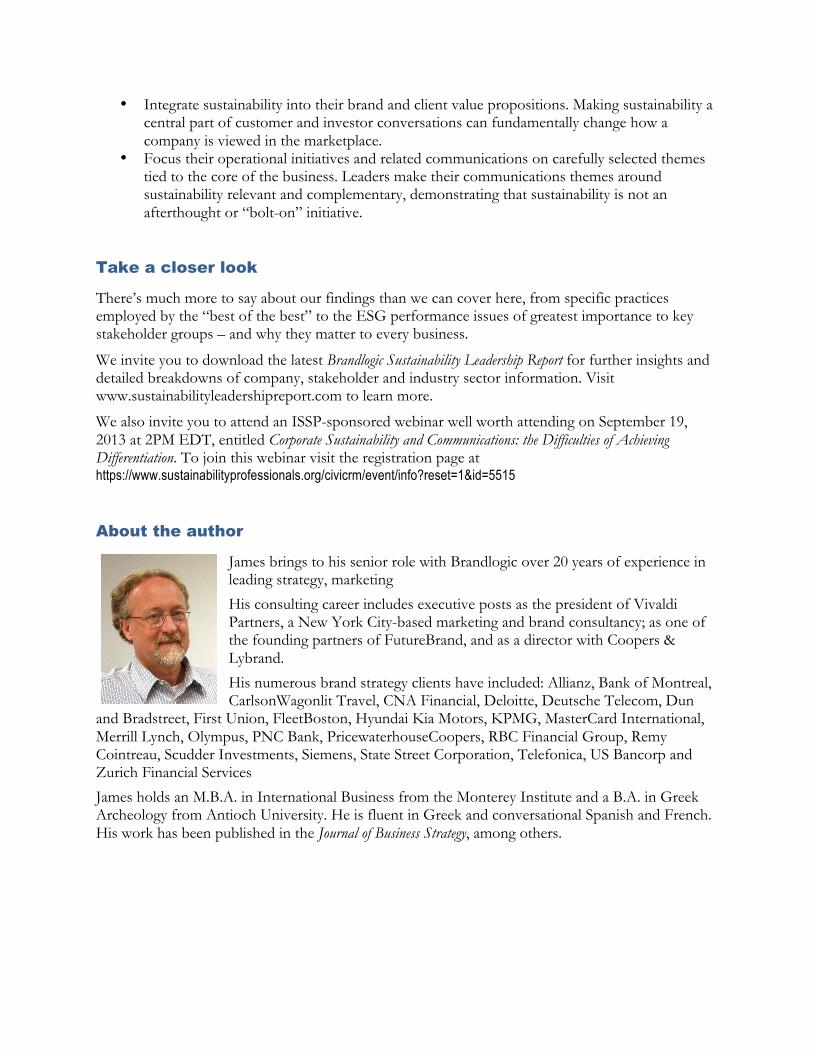
About the author
James brings to his senior role with Brandlogic over 20 years of experience in leading strategy, marketing
His consulting career includes executive posts as the president of Vivaldi Partners, a New York City-based marketing and brand consultancy; as one of the founding partners of FutureBrand, and as a director with Coopers & Lybrand.
His numerous brand strategy clients have included: Allianz, Bank of Montreal, CarlsonWagonlit Travel, CNA Financial, Deloitte, Deutsche Telecom, Dun
and Bradstreet, First Union, FleetBoston, Hyundai Kia Motors, KPMG, MasterCard International, Merrill Lynch, Olympus, PNC Bank, PricewaterhouseCoopers, RBC Financial Group, Remy Cointreau, Scudder Investments, Siemens, State Street Corporation, Telefonica, US Bancorp and Zurich Financial Services
James holds an M.B.A. in International Business from the Monterey Institute and a B.A. in Greek Archeology from Antioch University. He is fluent in Greek and conversational Spanish and French. His work has been published in the Journal of Business Strategy, among others.