The Valuation of Logistics Improvements in CBA of ... · The Valuation of Logistics Improvements in...
49
Nils Bruzelius 2001-12-17 Version 2.0 The Valuation of Logistics Improvements in CBA of Transport Investments; A Survey. EXECUTIVE SUMMARY This Survey has been commissioned by the SAMGODS-group represented by the Swedish Institute for Transport and Communications Analysis (SIKA). The other organisations in the SAMGODS-group are the National Road Administration, the National Rail Administration, the Civil Aviation Authority, the Maritime Authority and the Swedish Agency for Innovation Systems. The purpose of the Survey is to review research on the valuation of freight time and other quality factors affecting goods, as well as how logistics improvements are being accounted for in the cost-benefit method used in Sweden, as well as by other countries and organisations. A further purpose is identify relevant issues as well as possible actions to be taken by SAMGODS to improve the valuation of logistics improvement in cost-benefit analyses (CBA) of transport interventions. The Survey is based on the assumption that the framework typically made use of when undertaking a CBA is reasonable, and can be taken as given. It is therefore argued that for the purposes of a CBA of a transport intervention, the valuation of logistics improvements may be decomposed into a transport element and a goods element, as is normally also done, and therefore to examine separately the costs associated with the goods, including the time required for their shipment and other quality factors. The Survey, hence, focuses on the goods element of the logistics cost. Unit prices related to goods are made use of in the CBA methodology applied by the National Road Administration (VV) and the National Rail Administration (BV). In addition, such unit prices feature in the SAMGODS model system, which is a model for forecasting goods transport by different modes in Sweden, including import, export and transit traffic. The methodology used by VV only reflects the cost of freight time, whilst BV and SAMGODS also use values with respect to (improved) reliability. The impact on goods of a transport intervention is normally not taken into account in the CBA methodology applied by the road (and, where relevant, rail) authorities in other countries in the world. Research into the cost of goods in transport has been carried out in a number of countries and recommendations have been made but so far, no action has been taken by the authorities concerned. Several authorities are at present reviewing the matter further. International financing institutions such as the World Bank, EBRD and EIB, which apply CBA when appraising road
Transcript of The Valuation of Logistics Improvements in CBA of ... · The Valuation of Logistics Improvements in...

Nils Bruzelius2001-12-17Version 2.0
The Valuation of Logistics Improvements in CBA of Transport Investments;A Survey.
EXECUTIVE SUMMARY
This Survey has been commissioned by the SAMGODS-group represented by the SwedishInstitute for Transport and Communications Analysis (SIKA). The other organisations in theSAMGODS-group are the National Road Administration, the National Rail Administration, theCivil Aviation Authority, the Maritime Authority and the Swedish Agency for InnovationSystems.
The purpose of the Survey is to review research on the valuation of freight time and other qualityfactors affecting goods, as well as how logistics improvements are being accounted for in thecost-benefit method used in Sweden, as well as by other countries and organisations. A furtherpurpose is identify relevant issues as well as possible actions to be taken by SAMGODS toimprove the valuation of logistics improvement in cost-benefit analyses (CBA) of transportinterventions.
The Survey is based on the assumption that the framework typically made use of whenundertaking a CBA is reasonable, and can be taken as given. It is therefore argued that for thepurposes of a CBA of a transport intervention, the valuation of logistics improvements may bedecomposed into a transport element and a goods element, as is normally also done, and thereforeto examine separately the costs associated with the goods, including the time required for theirshipment and other quality factors. The Survey, hence, focuses on the goods element of thelogistics cost.
Unit prices related to goods are made use of in the CBA methodology applied by the NationalRoad Administration (VV) and the National Rail Administration (BV). In addition, such unitprices feature in the SAMGODS model system, which is a model for forecasting goods transportby different modes in Sweden, including import, export and transit traffic. The methodology usedby VV only reflects the cost of freight time, whilst BV and SAMGODS also use values withrespect to (improved) reliability.
The impact on goods of a transport intervention is normally not taken into account in the CBAmethodology applied by the road (and, where relevant, rail) authorities in other countries in theworld. Research into the cost of goods in transport has been carried out in a number of countriesand recommendations have been made but so far, no action has been taken by the authoritiesconcerned. Several authorities are at present reviewing the matter further. International financinginstitutions such as the World Bank, EBRD and EIB, which apply CBA when appraising road

schemes, do normally not account for logistics improvements except costs related to vehicles andtheir drivers.
Empirical studies concerning the goods dimension of logistics costs focus on three aspects, viz.the time duration of transport, reliability, and damage and loss. Given that the costs related to themode used to transport the goods are handled separately, the remainder of the benefits associatedwith improvements in logistics should adequately be reflected through these three variables andthe prices or (unit) values associated with them.
Two approaches may be used to estimate the values associated with these three variables, viz.market prices and using values derived from models of choice between transport alternatives inwhich these variables are explanatory factors. The CBA methodology used in Sweden today is, ineffect, based on a mixture of the two methods.
The two approaches give very different results. The approach based on market prices (alsoreferred to as the capital value approach) can be expected to result in low prices, indeed muchlower values than the ones currently in use in Sweden. Even taking into account reliability, whichis currently not recognised in the CBA-methodology used in the road sector in Sweden, wouldnot likely change that assessment. It appears that the value of reliability using the market priceapproach would yield values per time unit saved which are of the same order as the 'pure' value offreight time based on the market price approach. No estimates have been prepared for damageand loss using this approach on account of lack of data on the probability of damage and loss perkm or time unit. This is a void that should not be all that difficult to fill.
The SP-approach to the estimation of values of relevance to freight, in particular, has attracted alot of interest during the last decade, and there is an abundance of results. They indicatesubstantial variability and appear to be very sensitive to the specification of the model used andthe method of estimation. The value of these estimates must be viewed as doubtful, at least forthe time being, for the following reasons:
• CBA is normally based on market prices. There must therefore be a reason - related to theissue of validity - for not using the capital value approach. The literature does not appear tooffer any such reasons.
• SP- and RP-models make use of variables which are not relevant from the point of view ofperforming cost-benefit analyses of transport schemes. For example, reliability is in thesemodels often measured in terms of the portion of shipments that arrive late. When appraisingtransport interventions by way of CBA it would normally not be feasible to measure theirimpact on the portion of shipments arriving late.
• The SP- and RP-approaches are based on methods which raise a number of issues as concernswhat is being measured, and therefore if estimated values are valid from an economic point ofview. There is a need to address these issues through research before the estimates of thesemodels are accepted for use in officially sanctioned CBA methodology.

The gist of the findings of this report is that values used currently in Sweden are too high and thatvalues related to freight are of limited importance for the outcome of CBA of infrastructureinterventions.
1. INTRODUCTION
Investments in transport infrastructure impact on the transport of goods, and in most cases boththe time required for undertaking the transport operation is reduced and the quality is improved.Reduced time and improved quality in turn impact on the total cost of moving goods from wherethey are produced to where they are being consumed or stored to bridge the lead-time betweenproduction and consumption. The total cost of moving goods from a point A where they areproduced to a point B where they are being used (or consumed) is in this Survey referred to as thelogistic cost. Reduction in transport time and quality improvements resulting in reduced logisticcosts for moving goods from A to B may also lead to an increase in demand for the shipment ofgoods between these two places.
Seen in an economic perspective, the logistics cost includes storage services, transport services(which include loading and unloading), the cost of the working capital tied down in goods beingstored and transported, and the damage to and loss of goods whilst in transit between productionand consumption. The services required to put together the logistics chain, including forwardingand insurance, also form part of the logistics cost.
Cost-benefit analysis (CBA) has been used to appraise infrastructure investments in the roadsector in Sweden since the late 1960s and in the railway sector since the late 1980s. Importantcomponents of logistics cost have been taken into account, but never in a comprehensive way.Originally only the cost of transport was recognised, later on the cost of capital tied down ingoods being transported have been taken into account, and more recently attempts have beenmade to also account for improved quality, including expected delays or risk of delays.
This Survey has been commissioned by the SAMGODS-group represented by the SwedishInstitute for Transport and Communications Analysis (SIKA). The other organisations in theSAMGODS-group are the National Road Administration, the National Rail Administration, theCivil Aviation Authority, the Maritime Authority and the Swedish Agency for InnovationSystems. The purpose of the Survey is to review research on the valuation of freight time andother quality factors affecting goods, as well as how logistics improvements are being accountedfor in the cost-benefit methods used in Sweden, well as by other countries and organisations. Afurther purpose is identify relevant issues as well as possible actions to be taken by SAMGODSto improve the valuation of logistics improvement in cost-benefit analyses (CBA) of transportinterventions carried out in Sweden.
Whilst this report has been reviewed by SIKA as well as a committee representing the NationalRoad Administration, the National Rail Administration, the Civil Aviation Authority, theMaritime Authority and the Swedish Agency for Innovation Systems, the author is aloneresponsible for its findings, conclusions and recommendations.
2. THEORETICAL FRAMEWORK AND MEASUREMENT METHODS
2.1 Estimating the benefits of logistics improvements
The motive for considering logistics improvements in CBA is straightforward. Ultimately, CBAaims at showing whether an investment will result in an improvement in welfare. The traditionalcriterion applied to asses this is the so-called Hicks-Kaldor criterion, in terms of which aninvestment is justified if those persons who gain from it can compensate those who lose from it.The approach used to determine whether or not the criterion is met is to assess what is referred toas the willingness to pay or more formally the compensating variation (CV).
The resources tied down in transport and storage are not ends in themselves. They are inputs intofinal consumption. Therefore, if an investment results in logistics improvements, resources arefreed up which can be used elsewhere in the economy and to produce more goods and servicesdesired by consumers. The ambition of CBA is to measure the willingness to pay for being ableto obtain these additional goods and services made possible by way of the improvement ininfrastructure. The question is: How is willingness to pay to be measured?
The textbook approach is based on the assumption that the demand for the good subject totransport and storage can be explained by way of a demand function. This function indicates howdemand is determined by a set of factors (variables), including the time required to transport thegood from A to B and the quality of this transport. It is furthermore assumed that the qualitydimension may be represented by measurable variables reflecting the uncertainty in transporttime, the risk of accidents, and loss and damage en route and whilst loading and unloading. Giventhat (i) such a function exists, (ii) the actual levels of the explanatory variables before theinvestment is incurred may be determined, and (iii) their levels after the investment has takenplace may be determined as well, then this function can directly be used to determine thewillingness to pay (the CV) for the investment. Such a demand function would, in other words,enable the analyst to directly determine the economic value of the logistics improvement. Anumber of assumptions have to be fulfilled for the approach to be valid, including perfectcompetition.
Textbook demand functions only exist in textbooks. In real life much simpler demand functionshave to be made use of. The basic idea of the approach used in practice is that the total logisticscost of a particular shipment can be decomposed into in principle three basic components
• the cost of transport (e.g. the cost of using a goods vehicle )• the cost of 'freight' (reflecting that goods in transit cannot be consumed)• other costs such as damage and uncertainty on account of transport times not being fixed (the
quality factors)
It is further assumed that the last two of these components in turn can be expressed in a formatwhich is referred to as a generalised cost. A generalised cost is based on the idea that the cost canbe formulated as the sum of the product between a variable (assumed to influence demand) and aunit value, a price. Generally the cost of transport is assumed to be a part of the generalised cost

of the shipment, although it is not a necessary to make such an assumption. When the transportcost is part of the generalised cost it is assumed that a transport improvement resulting in reducedlogistics costs and increased demand for shipments, will not affect the size of the shipment.
The approach used in practice, in Sweden is based on the following further assumptions:
• unit values are constant with respect to the level of each variable entering into the generalisedcost function (and explaining demand)
• unit values reflect willingness to pay (measured in the form of a CV).
In this Survey this approach will be assumed to be reasonable, and taken as given. It is thereforeargued here that for the purposes of a CBA of a transport intervention, the valuation of logisticsimprovements may be decomposed into a transport element and a goods element, and to examineseparately the costs associated with the goods, including the time required for their shipment andother quality factors.
The goods component of the logistics cost comprises the following cost elements (as also borneout by the available studies into the goods component as will be reviewed below):
• the cost of goods being in transit whilst being transported from the location of production tothe location of its use (consumption)
• the cost of the uncertainty (or unreliability) of the duration of the time for transport, i.e. that itnormally cannot be assumed that the transport time is fixed
• the degradation, loss and damage of the goods in transit from production to consumption.
The unit values to be applied to calculate these costs may be referred to as:
• the (unit) value of freight time (typically applied on the expected time or the expected timesaving
• the (unit) value of (improved) reliability (rarely applied in practice and estimated in differentways; see below)
• the (unit) value of (reduced) damage (rarely if ever applied in practice; see below)
In the sequel, this Survey will focus on only the goods component - being part of the totallogistics cost - and its associated unit values.
2.2 Market-based prices and unit prices based on revealed and stated preferencemethods
As will be discussed further below, there are two basic approaches for determining unit values.One, which is based on market prices, is the same as used when determining e.g. vehicleoperating cost (VOC) savings in a CBA.
The other approach is based on inferring values from choices made between available alternativesfor undertaking a shipment, e.g. choice between different routes or modes. Such alternatives may
each be associated with different transport times and quality levels, i.e. levels of the explanatoryvariables. The econometric models used are typically logit models, which express the probabilityof the choice of an alternative in terms of the generalised cost of that alternative as well as of theother available alternative(s). To estimate the parameters of the econometric model, there is aneed for a set of observations on (i) the actual choice made; and (ii) the level of the explanatoryvariables which enter into the generalised cost functions.
There are two methods for obtaining data sets of this nature allowing for the deduction of unitvalues by way of econometric models, viz. data on observed choices (revealed preference (RP)data), and data on hypothetical choices obtained through interviews (stated preference (SP) data).In a few studies a mixture of revealed and stated preference data have been used to estimate unitvalues.
Stated preference data are typically obtained through interviews involving games. The respondentis presented sets of data on explanatory variables, and is asked to identify the alternative whichhe/she prefers. The levels of the explanatory variables are related to a real situation, but thechoices made in the interview are based on hypothetical levels. These hypothetical data may beobtained through identification of alternatives that the respondent could face in real life. Often,however, they cannot be related to a real life situation and they are then said to involve abstractchoices.
Most of the research in the field of the cost of the goods component of transport has focused ondetermining unit values based on SP- and RP-data (see Tables 1 and 2 and Appendix 2), but unitvalues used in practice in Sweden today have partly been derived by using the market priceapproach, partly the approach based on SP-data.
3. THE UNIT PRICE APPROACH IN PRACTICE
3.1 Sweden
Unit prices related to goods are made use of in the CBA methodology applied by the NationalRoads Authority (VV) and the National Rail Authority (BV). In addition, such unit prices featurein the SAMGODS model system, which is a model for forecasting goods transport by differentmodes in Sweden, including import, export and transit traffic.
3.1.1 Road planning
CBA was introduced into Swedish road planning towards the end of the 1960s, and it then alsobecame established as the basic instrument for preparing long term investment plans. In the early1980s, VV started to make use of a computerised model for calculating VOCs (FOKO), whichalso allowed for the calculation of the cost of freight time. The concept applied was based on theassumption that time savings for goods on account of road investments should be determined asthe saving in the capital tied down in the goods. To this end, different types of trucks wereassigned a value of the goods they carry, and the hourly value of the capital then determined bymultiplying with an hourly interest rate, obtained by dividing the annual interest rate with 8760,

the number of hours in a year. This approach has subsequently been referred to in Sweden as thecapital value approach for determining values of freight time.
A review of this methodology was undertaken by VV in the mid-1980s (Bruzelius (1986)),against the background of criticism that had been directed against it for not taking into accountcertain other aspects of relevance to the transport of goods, in particular the value of improvedreliability. The review concluded that it would be possible to account for improved reliability byscaling up the value of freight time by a factor of 2 to 2.5. It was furthermore concluded that thiswould at most have a marginal effect on the feasibility and ranking of projects. It is unclear if VVever did incorporate the proposed modification to account for improved reliability into its CBA-methodology.
In the early 1990s, VV commissioned an SP study of the values of freight time, reliability anddamage (Transek (1992)); see Appendix 2 for a summary. The study concluded that the value offreight time for a shipment by road in Sweden was equal to SEK 30 per hour, on average. Thisvalue subsequently served as a basis for revising the values of freight time used by VV. Valuesdetermined in the SP study related to reliability and damage were not taken on board.
In a review of the CBA methodology undertaken in the late 1990s (SIKA (1999)), it wasrecommended that it would be preferable to base the value of freight time on the capital valueapproach. A further modification was made in order to introduce six different generic types ofgoods (bulk goods with low and high density, and general cargo with low and high density, aswell as low and high value per weight unit; see Appendix 1)1. The value per ton of each one ofthese six groups of goods was determined, and a freight value of per hour and ton derived byassuming (i) an annual rate of interest of 20%; (ii) that the hourly rate of interest would beobtained by dividing by 3600 hours; and (iii) that the value obtained in this way should bemultiplied by the factor 2.
No justification was offered for the choice of the rate of interest, whilst the choice of 3600 hours,in lieu of 8760 hours was motivated by that all hours of the year are not available for transportand handling of goods. The motive for multiplying with the factor 2 was to include 'not valuedtime costs as indicated in empirical studies', i.e. to somehow bridge the large gap betweenestimates of values of time obtained through the capital value method and the SP/RP methods, aswill be discussed further below. As a consequence of this change in approach, the values offreight time used by VV in its CBA-methodology were revised again. The values used at presentare at Appendix 1. VV does not make use of values with respect to reliability and damage atpresent.
It should be mentioned that VV, as well as BV, make use of separate prices to calculate accidentcosts, and that these costs also include cost components to reflect damage to property. However,at the present time the property component only reflects damage to vehicles and rolling stock andnot damage to what these vehicles carry. The CBA-methodology used by VV, hence, does notaccount for that interventions in the road sector may impact on the damage, loss and degradationof goods in transport.
1. Goods in terms of standard classification systems were also identified as belonging to one of these types of goods.

3.1.2 Railway infrastructure
BV was established in 1988, and subsequently developed a CBA-methodology similar to the oneused by VV. To provide a basis for valuing freight a SP-study was commissioned (Transek(1990)). Values of freight time were derived for different types of railway wagons and thesefindings were incorporated into the CBA-methodology. The average value of freight time derivedfor a goods wagon was estimated at SEK 6/hour.
In 1999, it was decided to change the methodology for determining values of freight in railtransport in the same way as done for road transport. Two changes were thus implemented, viz.the capital value approach was introduced, and freight values of time for six different types ofgoods (differentiated as for the road sector) were estimated. From these new values of freighttime per ton and hour, average values per goods wagon were also determined; for details on thevalues of freight time currently used in the BV CBA-methodology, see Appendix 1. Unlike forroad transport, the new approach used to determine values of freight time in rail transport impliedan increase in real terms in comparison with the previous approach which was based on the SP-study from 1990.
In addition to time, the CBA-methodology used by BV accounts for improvements in reliability.Reliability is estimated in terms of expected delay time. The approach used is the following. Inthe ex ante situation, the proportion of trains during a given time period (say a year) which aredelayed are determined and divided into three classes, viz. trains delayed less than 1.5 hours,trains delayed between 1.5 and 3.5 hours and trains which are delayed by more than 3.5 hours.This division into classes of delay is only done for trains carrying goods which cannot arrive theday after the agreed date, which made up about 45% of the shipments in the survey used inTransek's 1990 study. In other words, and in practice, only 45% of delayed trains are divided intothe three classes. For each one of these classes the expected reduction in delay time on account ofthe planned intervention is then determined and a value of reduced expected delay time applied.Separate values of improved reliability are applied on the estimated reduction in the expecteddelay in each one of the three classes. The unit values are expressed per wagon and differentiatebetween different types of wagons.
It is understood that the original (unit) values on expected delay time were derived fromTransek's study. It is to be noted, however, that Transek's study used a different variable tomeasure reliability, viz. the risk of a delay or the frequency of shipments delayed, and thenestimated unit values of relevance to this variable. It is not known to this author how the valuesobtained in Transek's 1990 study have been converted into unit values with respect to the variable'expected delay time'. The original values made use of by BV have later been updated to accountfor inflation, but the original differentiation between different types of wagons as well as classesof expected delay times in the ex ante situation has been retained. The methodology of thereliability values were, in other words, not revised in 1999. The values currently used in the BVCBA-methodology are at Appendix 1.
When compared to other (unit) values of time, these unit values applied by BV on reducedexpected delay time must be judged as being exceptionally high. The ordinary freight value oftime is at present SEK 19 per hour and wagon (1999 prices and including indirect taxes). A

reduction of an expected delay by one hour for an average wagon is valued at between SEK 1058and 2166 (1999 prices including indirect taxation ) depending on the size of the ex ante expecteddelay. This is implausible.
3.1.3 SAMGODS
One of the components of the SAMGODS model is the network model referred to as STAN.STAN assigns generalised costs to different modes for shipments from one region to another, alsotaking into account costs when transfers take place at a node from one mode to another.SAMGODS is, hence, able to handle entire transport chains involving a number of differentmodes, including combined transport.
In STAN, differentiation is made between different types of goods. For 1999, a distinction ismade between 11 types, 6 of which are also the ones used to determine the values of freight timeapplied in the CBA-methodology used by VV and BV. It is understood, that the types of goodswill be redefined for future years in the forecasting model.
The values of freight time made use of in STAN have been determined in the same way as thevalues used by VV and BV; the only difference is hence that STAN differentiates between 11different types of goods instead of the 6 ones taken into account by BV and VV. The freightvalues to be used on the types of goods identified for future forecasting years in the SAMGODSmodel are determined in the same way, i.e. by way of the capital value approach.
Reliability is also accounted for in the STAN generalised cost functions. The principle used is tomeasure reliability in terms of a risk of delay and assign values to a decrease in the risk of adelay, e.g. per mille unit change. To this end STAN differentiates between the 11 types of goodsreferred to above, and identifies values per mille reduction in risk level for each one of thesecommodities. The risk of delay for a shipment is determined as the risk per ton-km for differenttypes of transport means (all in all 12 different modes of transport) multiplied by the distance andweight of the shipment. Additional risk elements are identified in connection with transfers atnodes.
The values assigned to a per mille reduction in the risk of delay have (apparently) been derivedfrom a study commissioned by the SAMGODS group in 1999 (INREGIA (1999); see Appendix2. How this has been accomplished is, however, unclear to this author. The INREGIA study doesnot differentiate between the types of goods used by STAN, and produced values from functionswhich in general can not be seen as being linear generalised cost-functions. The study alsoexamined given shipments with fixed origin and destination, which vary with each respondent.The INREGIA study is thus (implicitly) based on the assumption that the valuation with regard toa per mille risk change would be independent of the actual distance involved in or the timerequired for undertaking a transport.

3.2 Other countries and models
Two previous surveys (Aaltonen (1993) and Waters et al. (1995)) have concluded that the impacton goods is not being taken into account in the CBA methodology applied by the road (and whererelevant, rail) authorities in different countries. As a whole that still applies, although as noted,Sweden has been an exception already since at least the early 1980s.
Research into the cost of goods in transport has been carried out in a number of countries andrecommendations have been made but so far, no action has been taken by the authoritiesconcerned. This applies in particular to Holland and the UK, countries in which large studieswere carried out in the mid-1990s on behalf of the Ministry of Transport and the Department ofTransport (DOT), respectively2.
However, the Department of Environment, Transport and Region (the successor to DOT) iscurrently reviewing the matter, and expert advice is being sought. Mention should be made ofthat TransFund, which funds, inter alia, road infrastructure in New Zealand is currently carryingour surveys with a view to account for the impact on goods of transport interventions.Recommendations coming out of that work will be implemented as from about mid-2002.Austroads, the association of the road authorities in the states of Australia as well as NewZealand, publishes estimates of freight travel time values for a range of freight vehicle stereotypes (Austroads (2000)). Austroads has commissioned further research and additionalrecommendations are expected to be forthcoming in the near future.
In the context of the European Union, it is noted that values of freight time have been proposedby EUNET (1998), a project funded by the European Commission under the Transport RTDProgramme of the Fourth Framework Programme. The purpose of EUNET is to develop amethodology to evaluate socio-economic effects of transport infrastructure investments.Deliverable D9 provides 'freight user values of time' (i.e. unit values of freight time). The reportnotes that Sweden is the only country to make use of such values, and hence recommends that thevalues used by Sweden be used also by other EU countries, suitably modified to the cost level inthese other countries. The values recommended for use in EU are thus the old Swedish valuesused by VV in the mid-1990s, which have subsequently been abandoned. In a report from theWestern European Road Directorates (2000) recommendations are made for use of the EUNETfreight values of time.
International financing institutions such as the World Bank, EBRD and EIB, which apply CBAwhen appraising road schemes, do normally not account for logistics improvements except costsrelated to vehicles and their drivers. The Highway Development and Management Model (HDM-4), a comprehensive tool for analysing road schemes which is frequently used by theseinstitutions and their clients, provides for the calculation of 'cargo holding costs' by multiplyingwith an hourly value of freight time. The analyst has to provide the freight value of time per roadtransport vehicle. This function is rarely, if ever, employed by HDM users.
2. The results have been used on an ad hoc basis in some CBA.

4. EVALUATION OF ESTIMATES OF UNIT PRICES
4.1 Using market based prices
4.1.1 Value of Freight Time
As will be elaborated upon below, SP-studies yield values of time and reliability which are higheror much higher than values obtained through using the approach based on market prices. Asnoted, BV and VV at present make use of values of freight time which are based on the latterapproach. It is, however, argued here that the current Swedish values (hereinafter the ASEKapproach) must be seen as being overestimates of the values of freight time.
There are three assumptions going into the ASEK approach that need to be reviewed:
• The rate of interest is now set at 20%, in real terms, an assumption which must be viewed ashigh. The return on capital invested in Sweden in the private sector is normally lower(probably half as high in real terms). Also there is a need to ensure that the assumptions madewith respect to this rate of interest harmonise with the assumptions made about otherparameter values in a CBA which reflect the fact that public investments may push outinvestments in the private sector, and that returns are different and measured differently in thetwo sectors.
• The current values are multiplied by the factor 2. The reason for this is unclear. One possiblemotive could be to take into account reliability, but this factor is at present taken account ofseparately in the BV methodology. Another explanation could be that this factor shouldreflect uncertainty in demand and damage; see further below.
• To obtain an hourly value, the yearly value is divided by 3600 hours and not (365x24=) 8760hours. This is based on an error of thinking, because the time savings in the CBAmethodology used by VV and BV are determined in terms of hours saved so a price per houris required. The rate of interest (20%) is a yearly price so to convert to an hourly price theyearly price must be divided by 8760.
It may thus be argued that the values of freight recommended by ASEK, which are based on thecapital value approach, are far too high and by the following factor
(0.20/0.10)*(2/1)*(8760/3600) = 9.73
i.e. by almost 10 times.
It is to be emphasised that a value of freight time based on the capital value approach onlyreflects the savings made from goods being able to reach their destination quicker, therebyreducing the working capital invested in the goods. Another way of looking at this saving, andfrom the point of view of the entire time period of a CBA, is to recognise that goods being

transported in effect are goods that are being stored. The discounted time savings in the CBAhence reflects the goods that will be released from this stock and made available to consumption.
It is to be emphasised that this interpretation of what is actually reflected in the value of a freighttime saving, estimated in terms of the capital value approach, does not in any way depend onwhether demand and/or supply is uneven in time or production or transport only take place duringa given number of hours of the year (e.g. during 3600 hours as assumed by ASEK). The value offreight in terms of the capital value method always reflects the condition that the time requiredfor transport implies that goods are being stored on a vehicle. A time saving during a transport(repeated continuously during the period of the analysis) therefore gives rise to a saving in thestock required to bridge the location of where the good is produced and the location where it willbe used.
It is sometimes argued that unit values determined on the basis of the capital value approach donot reflect the full willingness to pay for goods to arrive more quickly at their destination. Theargument is related to the condition that demand for the goods in question is stochastic; thisshould not be confused with the condition that the transport time may be uncertain, a matter to beconsidered in the next section.
One can think of several explanations of why stochastic demand may give rise to a highwillingness to pay for quick delivery. One example is when an accident occurs, requiring urgenttransport of e.g. spare parts to enable a production process to continue, which otherwise wouldhave to stop in the absence of stocks. Another example is the nature of modern production andlogistics methods, which often makes it cheaper not to meet a demand immediately through anavailable stock, but by receiving an order and then producing the good that is demanded. Ofcourse, once an order has been placed the customer often wants to have it and the seller wants todeliver it immediately, and there may therefore be an additional willingness to pay for this.
It is recognised that in both these cases, there is a possibility that the customers' willingness topay would be higher than the value reflected through a straightforward application of the capitalvalue approach. As concerns the first example, it may be argued that it could not be a verycommon feature in relation to total transport flows, but also that the additional value is limited.The reason for saying this is that the person responsible for the production process after all madethe decision not to stock the required spare parts, instead relying on delivery in case of a break-down. Apparently this latter alternative was viewed as being less expensive.
As concerns the second example, it may be argued that if there is a high demand for immediatedelivery, then the market will meet this demand. Indeed many products may today be boughteither through an order against later delivery or directly off the shelf, reflecting that someconsumers are prepared to pay a premium for immediate delivery. But this, of course, also meansthat those who are prepared to wait are those who for various reasons can wait. It is difficult tofind an explanation of why those who are prepared to wait would be willing to pay more forreduced time in transit on account of an intervention in the transport system than what is reflectedthrough the capital value approach.

4.1.2 The Value of Improved Reliability
The capital value approach can be taken further by also accounting for reliability and damage. Atheoretical analysis of the issue of reliability has been presented by Minken (1997), and asimplified version is to be found in Bruzelius (1986). However, as far as is known to this author,no extensive empirical analysis has so far been made based on this approach. It would requirestudies of the variation in the transport time, which is seen as the source of unreliability. Theapproaches used by Minken and Bruzelius both presume that the variability in transport time canbe described in terms of a probability density function and that logistics planners build up stocksto ensure that stockout will not occur, or will occur rarely on account of the variability intransport time. The value of improved reliability is determined from the reduction in the bufferstock made possible by a reduction in the variability in transport time. The method may be usedto obtain values of reliability through simulation. The attractiveness of the approach is that itallows for expressing improvements in reliability in terms of variables that may be measured inthe context of a CBA of a transport intervention, e.g. by way of changes in the standard deviationin the transport time. A further property of the approach is that it may be used to provideestimates which may be seen as an upper limit on the value of improved reliability, in view of thefact that logistics planners have a choice between using a buffer stock and not using such a stockat all. When the latter alternative is chosen it is cheaper to allow for a stockout.
In the Bruzelius study a simple model is used in order to obtain an estimate of the value ofreliability. It is based on the assumption that arrival times are normally distributed and that therelationship between speed and the variation in transport time is linear. It is shown that whenapplying the rule that stocks should be adequate 99% of the time, the value of improvedreliability may be assumed to be somewhat higher that the value of freight time, i.e. the size ofthe reduced stock on account of improved reliability is somewhat higher than the stock reductionon account of reduced transport time. Bruzelius argued that his model would provide a reasonableestimate of the value of reliability in CBA of many normal road investments for the followingreasons. The model would likely yield an overestimate because:
• the specific assumptions made with respect the relationship between speed and the variationin transport time
• stocks are not only maintained on account of the variability in transport time but also becausevariability in demand
• only part of the transported goods is subjected to stringent arrival times requiring the build-upof stocks
The model might on the other hand result in an underestimate on account of
• the actual cost of maintaining stocks (i.e. the cost of the warehouse and warehousing)• the variation in arrival times might be better described by a skewed distribution (e.g. the log-
normal, see below), which could result in the need to hold a larger stock at a given targetlevel for a stockout, say stocks available at 99% of the time.
The conclusion of Bruzelius (1986) was that it would be reasonable in CBA of normal roadinvestments to account for reliability resulting in reduced variability in transport time by doubling

the value of freight time (based on the capital value approach). Bruzelius also argued that thedetailed measurement of the value of reliability should not be seen as important in view of thefact that the cost of freight time normally plays an insignificant role in comparison with othercomponents in a CBA.
As concerns rail transport it should only be noted here that the approach used by BV entails amixture between different approaches. The value of freight is based on the capital valueapproach, whilst the origin of the values applied on reductions in expected delay times isapparently to be found in SP-studies.
4.1.3 The value of reduced damage
No attempts appear to have been made to determine the value of reduced damage using thecapital value approach. This approach would require information about
• the value of goods (data are available)• the risk of damage (and loss) per km or per hour for different modes• the nature of the damage, i.e. the proportion of the goods that would not be accepted and
would have to be disposed of on account of damage.
The value of damage determined in this way cannot be expected to be substantial, although this isa matter that should be investigated further. The INREGIA (1999) study suggests that 11 permille of goods transported by road and 22 per mille of goods transported by rail are subjected todamage. These values refer to the entire transport operation from start to end, and presumablyreflect the loading and unloading operations as well. They can therefore not (given theinformation available through the report) be converted into values per hour or km. In addition, itis unclear what is meant by damage in the INREGIA study in that it cannot be determined whatproportion of a shipment, which has been described as having being damaged, that has actuallybeen fully lost.
4.2 Stated and revealed preference analyses
The second approach to determining values for freight time, reliability and damage is by way ofrevealed and stated preference analysis. As evidenced by Tables 1 and 2, as well as Appendix 2,there is a large number of analyses of this nature. However, it is unclear to this author why it ispreferable to use the SP/RP approach to the capital value approach to determine values forfreight. Vehicle operating costs (VOCs) e.g. are determined on the basis of market prices, and asfar as is known no attempts have been made to replace the traditional estimates of VOCs withvalues obtained by way of the SP-method. The basic principle underlying the estimation of costsand benefits in CBA is to as far as possible use market prices, i.e. prices that may be observed.The underlying assumption is that the economy of the country in which the analysis is carried outis characterised by a reasonable level of competition so that market prices can be seen asreflecting willingness to pay. Unit values deduced from various types of trade-off analyses are

therefore normally only used when market prices are believed to be invalid or such prices do notexist.
Indeed it may be argued that if SP and RP studies would yield estimates clearly indicating thatthe willingness to pay to reduce freight time is larger than the estimates obtained by way ofmarket prices, then these results should not be applied. The values to be used in a CBA are, inprinciple, the values of the additional goods that may be consumed through e.g. the time savings,and not the values of shippers and receivers.
It may also be argued that the SP/RP approach raises a number of issues with respect to thevalidity of estimates obtained with it, several of which cannot be addressed through the researchnow available. For both SP- and RP-data, these issues concern the models and estimationtechniques used. For SP-models there are, in addition, questions as concerns the interviewmethod made use of.
The following issues may be identified:
• SP- and RP-models involve choice between alternatives for how to transport shipments.These shipments are of course very diverse in nature (value, size, weight, distance), whilst themodels normally used to explain choice presume a value which is independent of thesecharacteristics. Attempts are often made to lessen the effect of this restriction by estimatingseparate values for different types of goods, etc. Even under these circumstances a fixed valueof time must be viewed as a very strong assumption. There are examples of studies in whichdistributions have been introduced for the values of time (e.g. Wynter (1995) and Kawasaki(2000)), but these are exceptions (and the mentioned studies also suffer from othershortcomings).
• The CBA methodology is based, as mentioned, on the concept of linear generalised costs.However, a number of studies have estimated values from non-linear functions, including thetwo Swedish studies from the early 1990s (Transek (1990) and (1992)). The validity ofestimates obtained from non-linear functions is unclear. The type of function used matters.The data from the Transek (1992) study have subsequently been used by Bergkvist andWestin (2000), who estimated values of freight time by applying a linear function as well asusing a different estimator. The value of freight time obtained by Bergkvist and Westin (SEK14 per shipment and hour) was less than half that obtained through the original approach(SEK 30).
• The most popular model used to estimate values from SP-data is the logit model. The logitmodel is based on the assumption that the error term of the generalised cost function isindependently distributed (with an extreme value distribution). However, SP-data areobtained through repeated interviews, which means that the independence assumption is notfulfilled. This results in biased estimates (overestimates) of the t-values and in thesignificance of parameter estimates being overstated (see Cirillo et al. (1996)).
• The position held by the person interviewed to obtain SP-data vary from study to study. Ingeneral, a person in managerial position, having the authority to make decisions is

interviewed This person normally represents the shipper (consignor), less often the operatorand even less often the receiver (the consignee). The importance of who is actuallyinterviewed is analysed from a theoretical point of view by Winston (1981). An aspect toconsider is, of course, the terms of the contract for the purchase of the goods, in particularhow these are being paid for. If paid CIF, the shipper is probably the key person to interview,but if the goods are sold FOB, the receiver is likely to be more important. This issue will, ofcourse, not matter when the shipper and receiver come from the same firm (i.e. transports areinternal). It would not seem appropriate to use data on choice made by transport operators(i.e. firms which undertake transport for hire and reward) as they will likely be moreconcerned with the cost of their own operations than the cost of the goods they carry(although contractual arrangements may impact on this). It is noted that with the exception ofthe study by Winston, the issue as to whether the shipper or the receiver should beinterviewed is not addressed. It is also noted that estimates of values of time obtained frommanagers of hauliers tend to be higher than those obtained from respondents representingshippers. See e.g. the study by Fowkes et al. (2001), and the study reported on by de Jong(2000) which contains data from the UK value of time study in the mid-1990s. The values offreight time for operators in these studies are much higher than the values obtained fromshippers.
• This last point brings up a related issue, viz. to what extent the choices made by SP-respondents are clouded by other concerns which do not enter into the alternatives - in theform of variables - that they can choose between in the SP games, or by the condition thatvariables are incorrectly specified. Similarly, it may be queried to what extent the respondentsin the interviews can consider the longer term consequences of the alternatives. It should beemphasised that from the point of view of a CBA, it is not short-term effects that are ofinterest but the longer term impacts, reflecting a situation where the economy has found anew equilibrium after a change.
• More fundamental as concerns the quality of the data is the question to what extent arespondent is in fact able to rank alternatives in terms of a utility function (fulfilling theassumptions typically made such as completeness, transitivity and reflexivity). Duringinterviews the respondents normally have limited time before they have to make a choice, andhe/she never incurs any rewards or penalties for making a decision. The INREGIA studysuggests that respondents often make a decision on the basis of the level of one variable onlyinstead of weighing together all the variables of each alternative before making the choice. Isit possible that the data obtained through SP-interviews are better explained in terms of alexicographic ordering than the ordering assumed by the economist? The question has notbeen analysed. It should also be emphasised that the cost of transport is small in relation tothe value of the goods (some 2 to 3 % in most instances), which may have an additional effecton choice not only in SP-interviews but in real life. To this should be added that the abstractalternatives in SP interviews often are structured in such a way that the respondents can chosebetween alternatives which imply better quality at a higher cost. Everybody wants betterquality, and the decision maker who serves as the SP-respondent is probably often rewardedfor improving quality. If the cost to be paid for improved quality in the game is no real cost,then will the data not tend to overstate the willingness to pay for better quality? The availableevidence suggests that the way in which the alternatives are structured have an impact on theanswers obtained. In the 1994/95 value of freight study in the UK (reported on in de Jong

(2000)) transport operators (for hire and own account operators) were subjected to two sets ofgames, one involving abstract alternatives and one involving a toll road and a toll freealternative. The latter experiment yielded values in the range GBP 21-34, whilst the formerresulted in values in the range GBP 36-48. It is understood that the same persons wereinterviewed in the two games.
• Many of the above issues relate to SP studies alone. But also the few available RP studies arecharacterised by data problems. RP data have thus often been obtained ex post throughreconstruction by the researcher and may therefore not represent the actual prices, times andquality factors faced by the decision maker when he made his decision.
4.2.1 Values of Freight Time
Table 1 presents the values of freight time obtained through SP- and RP-studies. Note that theincluded values reflect different currencies, years and units. The last column also indicates if theestimates have been obtained from data on decisions made by road transport companies(operators) or models which have not been formulated in terms of linear generalised costs (non-linear). To provide a reference point: the current values of freight in Sweden, derived from thecapital value approach, are on average SEK 35 for a road transport vehicle and SEK 23 for a railwagon. Whilst clearly being overestimated (in terms of the capital value approach), they appearto be low in comparison with the values obtained through the SP- and RP-approaches.

Table 1: Results of SP and RP studies: Values of Freight Time
Study Year ofdata
Mode/Country
Value Unit Valueper
Comment
Transek (1990) 89/90 Rail/S SEK 6 hour & wagon Non-linearTransek (1990) 89/90 Road/S SEK 20 hour & shipment Non-linearTransek (1992) 1991 Road/S SEK 30 hour & shipment Non-linearKurri et al. (2000) 1997 Road/SF $ 1.53 hour & tonKurri et al. (2000) 1998 Rail/SF $ 0.1 hour & tonFridstrøm et al. (1995) 1992 Road/N NOK 0-70 hour & shipment Non-linearHodkins et al. (1978) 1970s(?) Road/Sea/AUS AUS$ 10 day & ton RPKawamura (2000) 98/99 Road/US $ 23.4-26.8 hour & shipment OperatorsWigan et al. (2000) 1998 Road/AUS AUS$0.66-0.40 hour & palletWynter (1995) 90-94? Road/F FF 7 min.& shipment Operatorsde Jong et al. (2001) 2000 Road/F FF 29-60 hour & shipment SP+RP " 2000 Rail/F FF 17-73 " " " 2000 Combined/F FF 34-53 " "Fosgerau (1996) 88/89 Road/DK DKK 2.7-6.0 min. & shipment OperatorsWinston (1981) 75-77 Road/US $125-1187 day & shipment RPWinston (1981 75-77 Rail/US $490 day & shipment RPde Jong et al. (1992) 91/92 Road/NL/
(99 prices)$ 32-42 hour & shipment Non-linear
" " Rail/NL/ " $ 32 hour & wagon " " " IWT/NL/ " $ 222 hour & shipment "Fowkes et al. (2001) 00/01 Road/UK £ 37.2-169.3 hour & shipment Partly operatorsde Jong et al. (2000) 94/95 Road/UK/
(99 prices)$ 21-48 hour & shipment Partly operators
Fowkes et al. (1991) 88/89 Road/UK / 99prices
$ 0.09-1.29 hour & ton
Viera (1992) 1990? Rail/US/99prices
$ 0.59 hour & ton SP+RP
Roberts (1981) 1980? IWT/US/99prices)
>$ 0.05 hour & ton RP
Blauwens et al. (1988) 1985? IWT/B/99prices)
$ 0.1 hour & ton RP
Fehmarn Belt (1999) 1997? Road/DK+D/99 prices
$ 21 hour & shipment Operators?
de Jong et al. (1995) 1995 Road/D/99prices
$ 33 hour & shipment Non-linear
" 1995 Road/NL/99 prices
$ 40-43 hour & shipment Non-linear
" 1995 Road/F/99 prices
$ 34 hour & shipment Non-linear
Bergkvist et al. (2000) 1991 Road/S SEK 14 hour & shipmentBergkvist (2001) 1991 Road/S SEK 34-509 hour & shipmentINREGIA (2001) 1999 Road/S SEK 0-227 hour & shipment " 1999 Rail/S SEK 0 hour & shipment " 1999 Air/S SEK 117 hour & shipmentSmall et al. (1999) 1995? Road/US $ 144-193 hour & shipment Operators
IWT = Inland waterways transport

4.2.2 Values of Improved Reliability
The most common approach to estimating the value of reliability in SP-studies is by way of thevariable percentage (or per mille) delay. During an SP-interview, the first stage involvesidentifying the number of delayed consignments for a typical transport operation of the firm ofthe respondent. In the second stage the respondent is then asked to chose between alternativeswhich involve other values on the delay variable (as well as other influencing variables). In somestudies a distinction is made between goods which are considered delayed if they arrive lateduring the agreed arrival date, and goods which are considered delayed only if they arrive the dayafter the agreed arrival date. The theoretical basis for using this specification is unclear.
The recent study by Fowkes et al. (2001) suggests an alternative way of measuring reliability, andby way of what is called the spread. The spread is the time between the earliest arrival time of agiven shipment and the time when 98% of all shipments have arrived. The spread variable is thusbased on the notion of a probability distribution of arrival times, but tries to describe it in a verysimple way. However, its usefulness is limited. It will normally not be possible to determine howthe spread time is changed through a proposed investment to be appraised with CBA .
In some US studies attempts have been made to take into account variability through the standarderror of the estimated travel time or the coefficient of variation, i.e. the ratio between the standarddeviation and the mean travel time. The study carried out by Small et al. (1999) assumes that thetravel time follows the log-normal distribution, and then attempts to estimate values of reliabilityreflecting this distribution, and through three different approaches, i.e. (i) the standard deviation;(ii) coefficient of variation, and (iii) a function reflecting that arriving early is associated with acost per time unit, whilst arriving late gives rise to both a fixed penalty and a penalty per timeunit delayed. The number of observations used in this SP-study was, however, limited, and therespondents apparently also expressed difficulties in understanding the questions posed includingthe variables reflecting early and late arrivals, which were formulated so as to reflect theassumption of a log-normal distribution. The usefulness of the results of this study is also limitedby the condition that the interviews were carried out with transport operators.
The appropriateness of all the above approaches to measuring reliability may also be questionedas they are based on the assumption that delay or reliability is not related to the length of the tripor its duration in time. It would seem more reasonable to assume that reliability is a function ofthe time duration. If, in addition, this relationship could be assumed to be linear (as assumed inSTAN), a value on reliability could readily be incorporated into the standard CBA-framework.Indeed, if reliability is a function of transport time, one possible explanation for the high valuesof freight time obtained through SP- and RP-studies could be that they also reflect the value ofreliability
Some of the results obtained from SP and RP-studies are presented in Table 2

Table 2: Results of SP studies: Values of Reliability
Study Year ofdata
Mode/Country
Value Unit Valueper
Comment
Transek (1990) 89/90 Rail/S SEK 60 same day 1 % unit & shipm Non-linearTransel (1990) 89/90 Rail/S SEK 40 next day 1 % unit & shipm Non-linearTransek (1990) 89/90 Road/S SEK 150 same d. 1% unit & shipm Non-linearTransek (1990) 89/90 Road/S SEK 30 next day 1% unit & shipm Non-linearTransek (1992) 1991 Road/S SEK 280 same d. 1% unit & shipm Non-linearTransek (1992) 1991 Road /S SEK 110 next day 1% unit & shipm Non-linearKurri et al. (2000) 1997 Road/SF $ 47.47 hour & ton Expected delayKurri et al. (2000) 1998 Rail/SF $ 0.50 hour & ton Expected delayWigan et al. (2000) 1998? Road/AUS AUS$1.25-2.56 1% unit & palletde Jong et al. (2001) 2000 Road/F Not reported 1% unit & shipm SP+RP " 2000 Rail/F " " " " 2000 Combined/F " " "Winston (1981) 75-77 Road/US $ 404 day, standard dev. RPWinston (1981 75-77 Rail/US $299-4110 day, standard dev. RPde Jong et al. (1992) 91/92 Road/NL/ Not reported 1% unit & shipm Non-linear " " Rail/NL Not reported 1% unit & shipm " " " IWT/NL Not reported 1% unit & shipm "Fowkes et al. (2001) 00/01 Road/UK £ 61.5-167.6 hour & spread Partly operatorsde Jong et al. (2000) 94/95 Road/UK Not reported 1% unit & shipm Partly operatorsde Jong et al. (1995) 1995 Road/D Not reported 1% unit & shipm Non-linear " 1995 Road/NL Not reported 1% unit & shipm Non-linear " 1995 Road/F Not reported 1% unit & shipm Non-linearBergkvist et al. (2000) 1991 Road/S SEK 165 same d. 1% unit & shipm " 1991 Road/S SEK 84 next day 1% unit & shipmBergkvist (2001) 1991 Road/S Not reported 1% unit & shipmINREGIA (2001) 1999 Road/S SEK 63 1 per mille &
shipmentFrom linearmodel
" 1999 Rail/S SEK 1142 1 per mille &shipment
From linearmodel
" 1999 Air/SWE SEK 264 1 per mille &shipment
From linearmodel
Small et al. (1999) 1995? Road/US $ 371.33 hour & shipment Expected delay,operators
4.2.3 Values of reduced damage
A limited number of the studies include variables related to damage and loss, e.g. Transek (1992),de Jong et al. (1992) (the Dutch VOT study), de Jong et al. (1995) (studies of road transport inHolland, France and Germany), Fridstrøm and Madslien (1995), Wigan (2000) and Bergkvist andWestin (2000). With the exception of the study by Wigan (2000), in which damage is defined interms of pallets not being accepted by the receiver, it is not fully clear what is meant by damage,i.e. whether the whole shipment is lost or only part of it.
Estimates vary significantly. The Transek (1992) study resulted in an estimate of SEK 270 forone per mille unit reduction in the frequency of damage. Bergkvist and Westin (2000) using the

same data but a linear specification and anther estimator obtained a value of damage of SEK 20for a per mille unit reduction in frequency of damage to a shipment.
As in the case of reliability, the SP- and RP-values for damage are of limited usefulness from thepoint of view of CBA, as they are not expressed in relation to the distance or the time duration ofshipments.
5. CONCLUSION
5.1 Findings
Empirical studies concerning the goods dimension of logistics costs focus on three aspects, viz.the time duration of transport, reliability, and damage and loss. Given that the costs related to themode used to transport the goods are handled separately, as is the case in the CBA methodologyused in Sweden, the remainder of the benefits associated with improvements in logistics shouldadequately be reflected through these three variables and the prices or (unit) values associatedwith them.
Two approaches may be used to estimate the values associated with these three variables, viz.market prices and using values derived from models of choice between transport alternatives inwhich the three variables are explanatory factors. The CBA methodology used in Sweden todayis, in effect, based on a mixture of these two methods.
The two approaches give very different results. The approach based on market prices (alsoreferred to as the capital value approach) results in low prices, indeed much lower values than theones currently in use in Sweden. Even taking into account reliability, which is currently notrecognised in the CBA-methodology used in the road sector, is not likely to change thatassessment. It appears that the value of reliability using the market price approach would yieldvalues per time unit saved which are of the same order as the 'pure' value of freight time based onthe market price approach. No estimates have been prepared for damage and loss using thisapproach on account of lack of data on the probability of damage and loss per km or time unit.This is a void that should not be all that difficult to fill.
The SP-approach to the estimation of values of relevance to freight, in particular, has attracted alot of interest during the last decade, and there is an abundance of results. They indicatesubstantial variability and appear to be very sensitive to the specification of the model used andthe method of estimation. The value of these estimates must be viewed as doubtful, at least forthe time being, for the following reasons:
• CBA is normally based on market prices. There must therefore be a reason - related to theissue of validity - for not using the capital value approach. The literature does not appear tooffer any such reasons.
• SP- and RP-models make use of variables which are not relevant from the point of view ofperforming cost-benefit analyses of transport schemes. For example, reliability is in thesemodels often measured in terms of the portion of shipments that arrive late. When appraising
transport interventions by way of CBA it would normally not be feasible to measure theirimpact on the portion of shipments arriving late.
• The SP- and RP-approaches are based on methods which raise a number of issues as concernswhat is being measured, and therefore if estimated values are valid from an economic point ofview. There is a need to address these issues through research before the estimates of thesemodels are accepted for use in officially sanctioned CBA methodology.
5.2 Recommendations
Whilst awaiting the results of further research into relevance of the SP-approach and results of SPstudies, it is suggested that ASEK continue to make use of the capital value approach, as alreadydone with effect from 1999. The following further suggestions are made :
1. The value of freight time should be recalculated in terms of the principles set out in section4.1.1.
2. There is a need to review through further analysis, by making use of simple illustrativeexamples, whether stochastic demand (see section 4.1.1) may warrant an adjustment of thevalue of freight time calculated as recommended under 1.
3. In Section 4.1.2, it has been suggested that the value of improved reliability may beaccounted for by doubling the value of freight time determined as recommended under 1.There is a need to undertake further desk analyses of this nature to verify, modify or alter thisapproach.
4. To determine values reflecting damage, loss and degradation it should be possible to makeuse of data to be obtained from e.g. insurance companies on frequency of damage, and howdamage, loss and degradation may be explained by loading, unloading, transfers, andtransport distance and/or transport time. There is also a need to consider if such values shouldbe integrated into the accident values already used in the VV and BV CBA-methodology.
5.3 Concluding words
The gist of the findings of this report, viz. that the values used currently in Sweden are too highand that values related to freight are of limited importance for the outcome of CBA ofinfrastructure interventions, will likely raise a few eyebrows. Indeed these findings may not bewell received. There appears thus to be a concern that current values are low, and also that thelogistics effects are not adequately reflected in the current CBA methodology; see e.g. Östlund etal. (2000).
Two considerations may shed some light on this situation. The first is that the benefits related tologistics improvements and goods are reflected in the accounts of firms. In addition, time savingsfor goods materialise in the form of reduced stocks from the point of view of a company and itsaccounts. The logistics effects, taking into account the whole period of the investment, aretherefore immediately reflected in the accounts, making these benefits much more transparentthan other benefits of a transport scheme. In addition, firms tend to be better at articulating theirneeds than ordinary persons.

Secondly, it appears to this author somewhat strange that so much interest is being vested in thereliability of the transport of goods, whilst the current Swedish CBA methodology does not takeinto account the impact of uncertainty in travel time on VOCs and the cost of travel duringworking as well as non-working time. Irrespective of which values that are assigned to freight,the impact of improved reliability on travel costs and VOCs on the outcome of a CBA of atransport scheme should be substantially much higher than that of freight. Is it possible that thosewho express concerns about inadequate attention being paid to logistics costs are targeting thewrong half of the ground, and should turn their attention to the means of transport instead of onwhat they carry?
References:
Main empirical sources:
Bergkvist, E. (2000): Estimating values of time and forecasting transport choices in road freightwith a non-linear profit specification. The logit versus neural networks. Umeå Economic Studies,No. 540, Umeå.
Bergkvist, Erik (2001): Freight Transportation; Valuation of Time and Forecasting of Flows,Umeå Economic Studies, No. 549, Umeå
Bergkvist, E and L. Westin (2000): Regional Valuation of Infrastructure and TransportAttributes in Swedish Road Freight, Umeå Economic Studies No. 546, Umeå.
de Jong, Gerard (2000): Value of Freight Travel-Time Savings, in Hensher, D.A. and K.J. Button(eds.): Handbook of Transport Modelling, Elsevier.
de Jong, G.C., M.A. Gommers, and J.P.G.N. Klooster (1992): Time valuation in freighttransport: Methods and results, Paper presented at the XXth Summer Annual Meeting, PTRC,Manchester.
de Jong, G.C., Y. van de Vyvere and H. Inwood (1995): The value of freight transport: A cross-country comparison of outcomes. World Conference on Transport Research, Sydney.
de Jong, Gerard, Carine Vellay, and Michel Houée (2001): A Joint SP/RP Model of FreightShipments from the Region Nord-Pas de Calais, Paper presented at the European TransportConference.
Fosgerau, M. (1996): Freight traffic on Storebælt fixed link, Paper presented at the 24th EuropeanTransport Forum.
Fowkes, A.S., C.A. Nash and G. Tweedle (1991): Investigating the market for inter-modal freighttechnologies, Transportation Research, A, 25(4):161-172.
Fowkes, A.S., P.E. Firmin, A.E. Whiteling and G. Tweedle (2001): Freight Road UserValuations of Three Different Aspects of Delay, paper presented and the European TransportForum.
Fridstrøm, Lasse and Anne Madslien (1995): Engrosbedrifters valg av transportøsning, TØIrapport 299/1995, Oslo.
INREGIA (2001): Tidsvärden och transportkvalitet - INREGIA:s studie av tidsvärden ochtransportkvalitet för godstransporter 1999, Underlagsrapport till SAMPLAN 2001:1, februari.
Kawamura, Kazuya (2000): Perceived Value of Time for Truck Operators, TransportationResearch Record, 1725:31-36.

Kurri, Jari, Ari Sirkiä, and Juha Mikola (2000). Value of Time in Freight Transport,Transportation Research Record 1725:26-30
Small, Kenneth, Robert Noland, Xuehao Chu and David Lewis (1999): Valuation of Travel-TimeSavings and Predictability in Congested Conditions for Highway User-Cost Estimation, Report431, National Cooperative Highway Research Program, Washington, D.C.
Transek (1990): Godskunders värderingar, Banverket Rapport 9 1990:2
Transek (1992): Godskunders transportmedelsval, VV 1992:25, oktober.
Wigan, Marcus, Nigel Rockliffe, Thorolf Thoresen and Dimitris Tsolakis (2000): Valuing Long-Haul and Metropolitan Travel Time and Reliability, Journal of Transportation and Statistics,December:83-89.
Winston, C. (1981): A disaggregate model of the demand for intercity freight, Econometrica, 49:981-1006, 1981
Wynter, L.M. (1995): The Value of Time of Freight Transport in France; Estimation ofContinuously Distributed Values from a Stated Preference Survey, International Journal ofTransport Economics, 22:151-65.
Wynter, Laura (1995): Stated Preference Survey for Calculating Values of Time of Road FreightTransport in France, Transportation Research Record, 1477:1-6.
Supplementary sources:
Blauwens, G. and E. van de Voorde (1988): The valuation of time savings in commoditytransport, International Journal of Transport Economics, 15:77-87
Fehmarn Belt Traffic Consortium (1999): Fehmarn Belt traffic demand study, Danish andGerman Ministries of Transport, FTC, Copenhagen, Final Report, 1999.
Hodkins, K.E. and D.N.M. Starkie (1978): Values of Time in Long-distance Freight Transport,The Logistics and Transportation Review, 14,(2):117-26
Roberts, P.P. (1981): The translog shipper cost model. Cambridge, MA: Center forTransportation Studies, MIT.
Viera, L.F.M. (1992): The value of service in freight transportation, Ph.D dissertation, MIT,Cambridge, MA.
Waters, W.G., C. Wong and K. Megale (1995): The Value of Commercial Vehicle Time Savingsfor the Evaluation of Highway Investments; a Resource Saving Approach, Journal ofTransportation Research Forum, Vol. 35, No. 1.
Other sources:
Aaltonen, Pekka, Simo-Pasi Antti Permala, and Hanna-Kaisa Salminen (1993): Logistics effectsdo not guide transport network investments, Nordic Rail & Transport Research, No. 2:16-17.
Abdelwahab, Walid and Michel Sargious: (1992): Modelling the Demand for Freight Transport,Journal of Transport Economics and Policy, January:49-70.
Austroads (2000): Economic Evaluation of Road Investment, Report 142/00.
Bergkvist. E. and P. Johansson (1997): Weighted derivative estimation of quantal responsemodels: Simulations and applications to choice of truck freight carrier, Umeå Economic StudiesNo. 455, Umeå.
Bruzelius, Nils (1986): Företagens MA-kostnader och företagens kapitalkostnader för fordon,Två uppsatser om samhällekonomiska effekter av vägåtgärder, PPp Meddelande, nr. 1, StatensVägverk, Borlänge, 1986.
Cirillo, C., A. Daly, and K. Lindveld (1996): Eliminating the bias due to the repeatedmeasurements problem in SP data, Paper presented to PTRC Transport Conference, London,1996.
EUNET (1998): Socio-Economic and Spatial Impacts of Transport, Deliverable D9:Measurement and Valuation of the Impacts of Transport Initiatives, Institute for TransportStudies, University of Leeds, December
McFadden, D.L., C. Winston and A. Boersch-Supan (1985): Joint estimation of freighttransportation decisions under non-random sampling, in E.F. Daughety (ed.): Analytical studiesin transport economics, Cambridge: Cambridge University Press.
Minken, Harald (1997): Produksjonsmodeller og kostnadsfunksjoner i godstransport, TØI notat1057/1997, Oslo.
Minken, Harald (1997): Næringslivets nytte av raskere og mer pålitlig godstransport:Metodgrunnlag, TØI rapport 347/1997, Oslo.
Ogwude, I.C. (1990): Estimating the Modal Choice of Industrial Freight Transportation inNigeria, International Journal of Transport Economics, Vol. 17:187-205.
Ogwude, I.C. (1993): The Value of Transit Time in Industrial Freight Transportation in Nigeria,International Journal of Transport Economics, Vol. 20:325-337.
SIKA (1999): Översyn av samhällsekonomiska kalkylprinciper och kalkylvärden påtransportområdet, ASEK, SIKA Rapport 1999:6, juni.

Watson, Peter L., James C. Hartwig. and William E. Linton (1974): Factors that Determine ModeChoice in the Transportation of General Freight, Transportation Research Record, 1061: 138-144.
WERD (2000): Valuing the Cost and Benefits of Road Transport; Toward European Value Sets,Prepared for WERD by the Norwegian Public Road Administration, Report No. 1-2000, October.
Wilson, F.R., B.G. Bisson and K.B. Kobia (1986): Factors that Determine Mode Choice on theTransportation of general Freight, Transportation Research Record, 1061:26-31
Östlund. Bo, Christina Bolinder, Gunnar Jansson och Mats Andersson (2001):Samhällsekonomisk värdering av järnvägsinvesteringar för godstrafik, TFK Rapport 2001:1.

APPENDIX 1:
VALUES USED BY VÄGVERKET (VV, THE SWEDISH NATIONAL ROADADMINISTRATION) AND BANVERKET (BV, THE SWEDISH NATIONAL RAILADMINISTRATION) TO VALUE IMPACT ON GOODS IN CBA
Table 1: Values of freight time; 1999 prices
Type Bulk General AverageValue (SEK/kg) n/a n/a >25 <25 >25 <25Density (kg/m3) >1.0 <1.0 >0.6 >0.6 <0.6 <0.6______________________________________________________________________________________Value of goods (SEK/ton) 2 100 1 800 128 500 6 400 167 300 4 500
Value of freight time(SEK/ton & hour)# 0.23 0.20 14.3 0.7 18.9 0.5
Value of freight time (SEKper loaded rail wagon & hour) 5.4 4.6 328 16 430 12 19
Value of time (SEK peraverage truck & hour) 3.3 2.8 203 10 264 7.1 28*
Value of time for light goodsvehicle (SEK/hour) 7.9*
Value of time for heavyfoods vehicle (SEK/hour) 41.2*______________________________________________________________________________________
* These values are used in practice by VV after multiplication by the factor 1.23 (to bring up to consumer pricelevel) yielding: Average: 35 SEK/hour
Light goods vehicles 10 SEK/hourHeavy goods vehicles 50 SEK/hour
# BV uses these values of time per ton and hour for each one of the six groups of goods (after multiplication by thefactor 1.23)
Table 2: Expected delay values of time applied by BV on 45% of traffic for delayed trafficin three categories of delays in the ex ante situation. SEK per hour and loaded wagon
Category < 1.5 hours 1.5-3.5 hours >3.5 hours
Single wagon load 1 406 2 108 2 812Wagon in unit train 529 793 1 058Combined 1 058 1 588 2 166Foreign wagons 1 406 2 108 2 812Domestic wagons 881 1 321 1 763Private wagons 881 1 321 1 763SJ wagons 1 058 1 588 2 116Average 1 058 1 588 2 166

APPENDIX 2.
SUMMARY INFORMATION ON STUDIES OF VALUES OF FREIGHT TIMEAND FREIGHT TIME RELIABILITY
Title: Transek (1990): Godskunders värderingar, Banverket Rapport 9 1990:2
Approach: Discrete choice experiment; conjoint analysis, choice between abstract roadtransport alternatives and choice between abstract railway alternatives
Type of data and year collected: SP data collected through face to face interviews,1989-90, Sweden.
Who makes the decisions: Shipper (manager)
Type of model: Logit models for choice between alternatives
Type of goods: The goods are expected to be representative for all railway transports inSweden. However, the values for truck alternatives apply only to shippers who makeuse of rail transport
Variables used: (i) door-to-door transport time (expected time)(ii) cost of transport(iii) frequency of shipments arriving late either the same dayor the following day(iv) headway (this variable was insignificant for railtransport and not used for road transport)
Variables measured not in absolute values, i.e. as differences in time and price, but interms of percentage changes.
Estimation method: Max. likelihood
Main estimation results:
A number of values of freight time applicable to a goods wagon by rail were estimated.Differentiation with respect to type of train and type of carriage, but not type of good.The average value per wagon was 6 SEK.
Two values with respect to delay times were estimated, one pertaining to those whoincur some form of penalty for a late arrival during day of planned arrival, and thosewho incur a penalty if the arrival is one day after the day of planned arrival. 45%belonged to the first group and 55% to the second. The value of 1 percentage unitimprovement in frequency of delays in the fist group was 60 SEK/wagon, on average.The corresponding value for the second group was 40 SEK/wagon, on average.
The value of freight time for a truck was estimated at 20 SEK/hour and shipment. As forrail, two values of delay times were also estimated for truck transport, defined in the
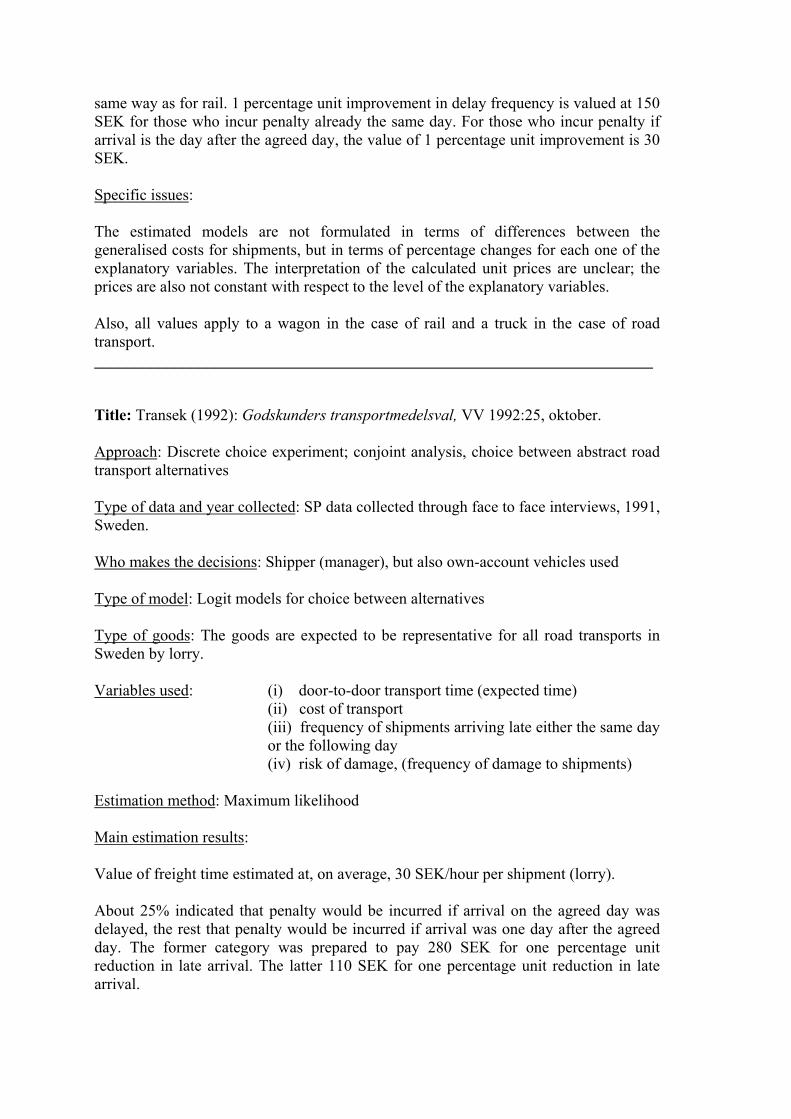
same way as for rail. 1 percentage unit improvement in delay frequency is valued at 150SEK for those who incur penalty already the same day. For those who incur penalty ifarrival is the day after the agreed day, the value of 1 percentage unit improvement is 30SEK.
Specific issues:
The estimated models are not formulated in terms of differences between thegeneralised costs for shipments, but in terms of percentage changes for each one of theexplanatory variables. The interpretation of the calculated unit prices are unclear; theprices are also not constant with respect to the level of the explanatory variables.
Also, all values apply to a wagon in the case of rail and a truck in the case of roadtransport.______________________________________________________________________
Title: Transek (1992): Godskunders transportmedelsval, VV 1992:25, oktober.
Approach: Discrete choice experiment; conjoint analysis, choice between abstract roadtransport alternatives
Type of data and year collected: SP data collected through face to face interviews, 1991,Sweden.
Who makes the decisions: Shipper (manager), but also own-account vehicles used
Type of model: Logit models for choice between alternatives
Type of goods: The goods are expected to be representative for all road transports inSweden by lorry.
Variables used: (i) door-to-door transport time (expected time)(ii) cost of transport(iii) frequency of shipments arriving late either the same dayor the following day (iv) risk of damage, (frequency of damage to shipments)
Estimation method: Maximum likelihood
Main estimation results:
Value of freight time estimated at, on average, 30 SEK/hour per shipment (lorry).
About 25% indicated that penalty would be incurred if arrival on the agreed day wasdelayed, the rest that penalty would be incurred if arrival was one day after the agreedday. The former category was prepared to pay 280 SEK for one percentage unitreduction in late arrival. The latter 110 SEK for one percentage unit reduction in latearrival.

The value of one per mille unit reduction in risk of damage during transport was valuedat 270 SEK per shipment
Specific issues:
The estimated models are not formulated in terms of differences between thegeneralised costs for shipments, but in terms of percentage changes for each one of theexplanatory variables. The interpretation of the calculated unit prices are unclear; theprices are also not constant with respect to the level of the explanatory variables.
Also, all values apply to a shipment (a lorry load). Note that values are higher than inthe previous study, which includes data for shippers using rail and road. The presentstudy refers to representative road transport shippers who may therefore not use rail atall.______________________________________________________________________
Title: Kurri, Jari, Ari Sirkiä, and Juha Mikola (2000). Value of Time in FreightTransport, Transportation Research Record 1725:26-30
Approach: Discrete choice experiment; conjoint analysis, choice between abstract roadtransport alternatives and choice between abstract railway alternatives
Type of data and year collected: SP data collected through face to face interviews, 1997for choice between road transport alternatives and 1998 for choice between railalternatives, Finland.
Who makes the decisions: shipper (manager)
Type of model: Logit models for choice between alternatives
Type of goods: Selected commodities, not necessarily representative with respect totraffic on Finnish roads and railways
Variables used: Absolute values:total transport time door-to-doortotal cost
average unexpected delay, i.e. the average delay, when a delay would occur
Estimation method: Maximum likelihood
Main estimation results:
The average value of freight time for road transport: $ 1.53 per ton and hourThe average value of freight time for rail transport: $ 0.1 per ton and hourThe average value of delay for road transport: $47.47 per ton and hourThe average value of delay for rail transport: $0.50 per ton and hour
Note that delay has been determined by multiplying unexpected delay with theprobability of a delay.

Specific issues:
The interpretation of the delay variable is not clear.______________________________________________________________________
Title: Fridstrøm, Lasse och Anne Madslien (1995): Engrosbedrifters valg avtransportøsning, TØI rapport 299/1995, Oslo.
Approach: Discrete choice experiment; conjoint analysis, choice between truckalternatives. Three sets of choices. Choice between abstract own-account alternatives,choice between abstract for hire alternatives and a choice between abstract own-accountand for hire alternatives.
Type of data and year collected: SP data collected through face to face interviews, 1992,Norway.
Who makes the decisions: Shippers in wholesale companies (outbound shipments)
Type of model: Logit models, two alternatives
Type of goods: Models for different types of goods handled by wholesale firms
Variables used: costtransport timefrequency of shipments arriving latefrequency of shipments being damaged
Estimation method: Maximum likelihood
Main estimation results:
Cannot be translated into 'unit values' since non-linear function used. Values of freighttime derived vary between about 0 to 75 NOK per shipment and hour.
Specific issues:
Non-linear models. Cannot be used to derive 'unit values'.______________________________________________________________________
Title: Hodkins, K.E. and D.N.M. Starkie (1978): Values of Time in Long-distanceFreight Transport, The Logistics and Transportation Review, 14(2):117-26
Approach: Estimation of mode choice model based on observed data. Discrete choicebetween road transport and transport by sea.
Type of data and year collected: RP data from 1970s (?), Australia.
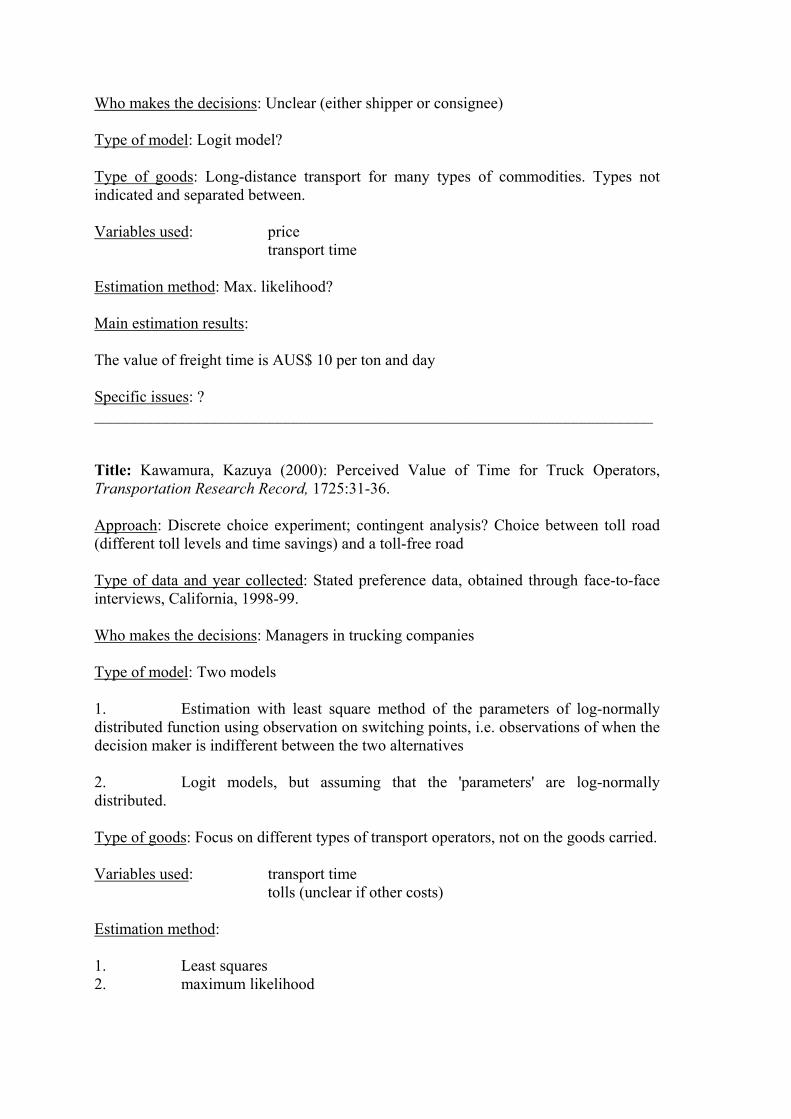
Who makes the decisions: Unclear (either shipper or consignee)
Type of model: Logit model?
Type of goods: Long-distance transport for many types of commodities. Types notindicated and separated between.
Variables used: pricetransport time
Estimation method: Max. likelihood?
Main estimation results:
The value of freight time is AUS$ 10 per ton and day
Specific issues: ?______________________________________________________________________
Title: Kawamura, Kazuya (2000): Perceived Value of Time for Truck Operators,Transportation Research Record, 1725:31-36.
Approach: Discrete choice experiment; contingent analysis? Choice between toll road(different toll levels and time savings) and a toll-free road
Type of data and year collected: Stated preference data, obtained through face-to-faceinterviews, California, 1998-99.
Who makes the decisions: Managers in trucking companies
Type of model: Two models
1. Estimation with least square method of the parameters of log-normallydistributed function using observation on switching points, i.e. observations of when thedecision maker is indifferent between the two alternatives
2. Logit models, but assuming that the 'parameters' are log-normallydistributed.
Type of goods: Focus on different types of transport operators, not on the goods carried.
Variables used: transport timetolls (unclear if other costs)
Estimation method:
1. Least squares2. maximum likelihood

Main estimation results:
1. US$ 26.8 per hour, average2. US $ 23.4 per hour, average
Specific issues:
These values of time probably reflect not the value of goods but the operating costs ofthe transport operators (wages, VOCs)______________________________________________________________________
Title: Wigan, Marcus, Nigel Rockliffe, Thorolf Thoresen and Dimitris Tsolakis (2000):Valuing Long-Haul and Metropolitan Travel Time and Reliability, Journal ofTransportation and Statistics, December:83-89.
Approach: Discrete choice experiment; conjoint analysis, choice between abstract roadtransport alternatives.
Type of data and year collected: Stated preference data obtained through face-to-faceinterview, 1998. Three types of truck operations are analysed
Who makes the decisions: The shipper (manager)
Type of model: Logit model
Type of goods: Not in focus. The aim is to analyse three different segments of the roadtransport market
Variables used: door-to-door transport timecostreliability (per cent shipments arriving late)damage (per cent shipments being damaged and notaccepted)
Estimation method: Maximum likelihood of linear cost functions
Main estimation results: (1998 AUS$)
Segment Freight time Reliability Damagepallet/hour per 1% reduction per 1% reduction
Intercapital (FTL) 0.66 2.56 49.70Urban (FTL) 1.30 1.25 18.29Metropolitanmultidrop 1.40 1.97 27.06
FTL: Full truck load
Specific issues:

It is unclear how to interpret reliability and damage, and if these refer to the unit ofshipment studied, viz. a 'pallet'. Also '1% reduction' in table above should probably beread to say 'one percentage unit reduction'.______________________________________________________________________
Title: Wynter, Laura (1995): Stated Preference Survey for Calculating Values of Timeof Road Freight Transport in France, Transportation Research Record, 1477:1-6.
Approach: Discrete choice experiment; contingent analysis? Choice between toll road(different toll levels and time savings) and a toll-free road
Type of data and year collected: Stated preference data, obtained through telephoneinterviews, France, date not given but likely during first half of the 1990s.
Who makes the decisions: Managers in trucking companies
Type of model: Estimation of the parameters of log-normally distributed function usingobservation on switching points, i.e. observations of when the decision maker isindifferent between the two alternatives
Type of goods: Goods transported over longer distances in France
Variables used: vehicle operating costs (excluding wage costs?)transport timestolls on motorways
Estimation method: Unclear, presumably max. likelihood estimation of the parametersof the long-normal function.
Main estimation results:
Average freight VOT was estimated at about FF 7 per minute.
Specific issues:
The above VOT estimate probably reflects the cost of the driver per time unit, and notthe value of the goods.______________________________________________________________________
Title: de Jong, Gerard, Carine Vellay, and Michel Houée (2001): A Joint SP/RP Modelof Freight Shipments from the Region Nord-Pas de Calais, Paper presented at theEuropean Transport Conference.
Approach: Two sets of data: one based on discrete choice experiment; conjoint analysis,choice between abstract road transport alternatives and choice between various otherabstract mode alternatives. The other combines the first set of data with revealedpreference data.

Type of data and year collected: Stated preference data collected through face-to-faceinterviews in 2000. Revealed preference data through a shippers' survey in 1999,combined with synthesised data for the non-chosen alternative and for missing data forthe chosen alternative.
Who makes the decisions: Shippers (managers)
Type of model: Logit models
Type of goods: Not in focus; the mode of transport and certain attributes of differentmodes are considered.
Variables used: transport costtransport timeprobability of delay (for shipments with agreed arrival time)frequency of shipments to the same clientdummy variables to reflect specific goods or access to rail,etc.
Estimation method: Maximum likelihood
Main estimation results:
A number of values of freight time are estimated which are summarised as:
Mode Per shipment Per tonFF/hour FF/hour
Road; hire and reward 29.0-60.0 5.0-10.9Rail 17.0-73.0 1.7-7.3Combined transport 34.0-53.0 1.8-2.8
Other values not reported.
Specific issues:
The only freight values of time presented above are from linear models. Some valuesare from SP data some are from combined SP and RP data. Values for other attributesare not presented in the source document.______________________________________________________________________
Title: Fosgerau, M.(1996): Freight traffic on Storebælt fixed link, Paper presented at the24th European Transport Forum.
Approach: Discrete choice experiment; conjoint analysis, choice between road transportalternatives involving two alternative ferry crossings across Storebælt as well as thechoice between ferry and a fixed connection across Storebælt.

Type of data and year collected: Stated preference data with regard to shipmentsactually transported across Storebælt, collected in 1988/89. Probably face-to-faceinterviews, but this is not stated.
Who makes the decisions: Managers in transport companies.
Type of model: Logit model
Type of goods: No distinction made. Distinction made between type of truck used.
Variables used: transport timetransport distance (km)headway (ferries)official fare of ferry or fixed connectiondummy variables for discounts and fixed connection
Estimation method: Maximum likelihood
Main estimation results: Values of freight time per truck: DDK/min
Solo truck 6.0Road train 3.2Articulated vehicles 2.7
Specific issues:
It is possible that the estimated values of time reflect the cost of the driver; they mayalso reflect VOCs. Note there is no separate variable for the cost of transport, but thedistance variable may be seen as a proxy of in the first instance the VOC.______________________________________________________________________
Title: Winston, C. (1981): A disaggregate model of the demand for intercity freight,Econometrica, 49: 981-1006, 1981
Approach: Mode-choice model based on disaggregate revealed preference data
Type of data and year collected: Data are from various sources for the period 1975-77.Data on costs and transport times, etc. have been obtained from external sources andnot from the respondent.
Who makes the decisions: 13 different commodities are considered. For some theshipper makes the decision, for some the receiver. This is explicitly accounted for in themodels.
Type of model: Multinomial probit
Type of goods: 13 groups of commodities.
Variables used: Shipment size (lbs.)

commodity value ($/lbs)freight chargesmean transport timestandard deviation transit timereliability (coefficient of variation)miles from rail siding
Estimation method: Weighted exogenous sample maximum likelihood
Main estimation results:
Yields values of freight time; values vary between $ 125-1187 per day and shipment byroad. One significant value for rail: $490 per shipment and day.
Also yields values w.r.t. reliability measured in two ways, viz. by way of the standarddeviation of transit time and its coefficient of variation (standard deviation divided bythe mean).
Values for the standard deviation vary between $ 299 and $ 4110 per day and shipmentfor rail. The only significant value obtained for road transport is $ 404 per day andshipment
Specific issues:
It is unclear how the estimated values should be interpreted against the background ofthat the model also includes parameter estimates w.r.t. shipment size and commodityvalue______________________________________________________________________
Title: de Jong, G. C., M.A. Gommers, and J.P.G.N. Klooster (1992): Time valuation infreight transport: Methods and results, Paper presented at the XXth Summer AnnualMeeting, PTRC, Manchester.
Approach: Discrete choice experiment; conjoint analysis, choice between abstract roadtransport, rail and inland waterways transport alternatives.
Type of data and year collected: SP data collected through face to face interviews,1991-92, Holland.
Who makes the decisions: Shippers (managers) and transport operators
Type of model: Logit models
Type of goods: For road transport, four different categories, for rail and inlandwaterways no differentiation. The goods should be representative with respect totransports in Holland.
Variables used: transport costs (rates)transport time door-to-door

transport time reliability (measured as percent not on time)probability of damagefrequency of shipment
Estimation method: Maximum likelihood
Main estimation results: Value of freight time in US$ per shipment and per hour in1997 prices
Road: varies between 32 and 42Rail: 32 (for a wagonload) (GBP 0.5/tonne and hour; 1995 prices)Inland waterways: 222 (GBP 0.12/tonne and hour; 1995 prices)
Values related to other variables are not reported in the source document.
Specific issues:
The estimated models are not formulated in terms of differences between thegeneralised costs for shipments, but in terms of percentage changes for each variable.The interpretation of the calculated unit prices are unclear; the prices are also notconstant with respect to the level of the explanatory variables.
Separate models were estimated for transport operators resulting in higher freight valuesof time, suggesting that VOC and wages are mixed into the freight values of time.______________________________________________________________________
Title: Fowkes, A.S., P.E. Firmin, A.E. Whiteling and G. Tweedle (2001): Freight RoadUser Valuations of Three Different Aspects of Delay, paper presented and the EuropeanTransport Forum.
Approach: Choice experiment; conjoint analysis, choice between abstract road transportalternatives
Type of data and year collected: Stated preference data collected with the LASP (LeedsAdaptive Stated Preference) survey methodology. Data collected in November 2000 andMarch 2001, through face-to-face interviews.
Who makes the decisions: Transport managers in firms with own-account vehiclesTransport managers in transport firmsTransport managers representing shippers
Type of model: Logit model
Type of goods: Many different types of goods carried by truck over longer distances inthe UK
Variables used: costtransport time (minimum amount of time for door to door)

spread (additional time over minimum time required for 98%of deliveriesschedule delay (delayed departure in relation to planned oroptimal departure time)
Estimation method: Maximum likelihood (?). Separate model for each interviewee.
Main estimation results: (pence per minute and shipment; end 2000 prices)
time spread schedule delay
Own account 169.3 89.5 126.0Transport operator 155.1 167.6 86.8Shipper 37.2 61.5 31.3
Specific issues:
Note the much lower values for shippers, suggesting that the other respondents mix inoperating costs in their time valuation
It appears that a non-linear generalised cost functions have been utilised. This isunclear.______________________________________________________________________
Title: Fowkes, A.S., C.A. Nash and G. Tweedle (1991): Investigating the market forinter-modal freight technologies, Transportation Research, A, 25(4):161-172.
Approach: Choice experiment; conjoint analysis, choice between abstract road transportalternatives and also combined transport
Type of data and year collected: Stated preference data collected with the LASP (LeedsAdaptive Stated Preference) survey methodology. Data collected in 1988/89, throughfact-to-face interviews.
Who makes the decisions: Shipper
Type of model: Logit model
Type of goods: Goods transported over longer distances in the UK
Variables used: Cost per tonnetransport time% on timeinter-modal dummy
Estimation method: Least-squares
Main estimation results:

Value of freight time US$ 0.09-1.29 per ton and hour (1999 prices) quoted from de Jong(2000)
Specific issues:
It is unclear how de Jong has obtained his estimates from the original study, which doespresent any freight VOT results.______________________________________________________________________
Title:
1. de Jong, Gerard (2000): Value of Freight Travel-Time Savings, inHensher, D.A. and K.J. Button (eds.): Handbook of Transport Modelling, Elsevier.
2. de Jong, G.C., Y. van de Vyvere and H. Inwood (1995): The value offreight transport: A cross-country comparison of outcomes. World Conference onTransport Research, Sydney.
Approach: Discrete choice experiment; conjoint analysis, choice between abstract roadtransport alternatives and choice between tolled and untolled road
Type of data and year collected: Stated preference data obtained through face-to-faceinterviews in 1994/95 in the UK
Who makes the decisions: Own-account operatorsTransport operators
Type of model: Logit model
Type of goods: All kinds of goods carried by road. Distinction made between heavy andlight goods vehicles as well as hire and reward and own-account operators
Variables used: transport timetotal transport costinformation about delayschance of unexpected delay of 30 minutes or more
Estimation method: Maximum likelihood
Main estimation results: Freight values of time in 1999 US$ per hour and shipment
Segment Abstract alternatives Route choice
LGV; hire and reward 45 21LGV; own account 36 21HGV; hire and reward 48 21HGV; own account 36 34
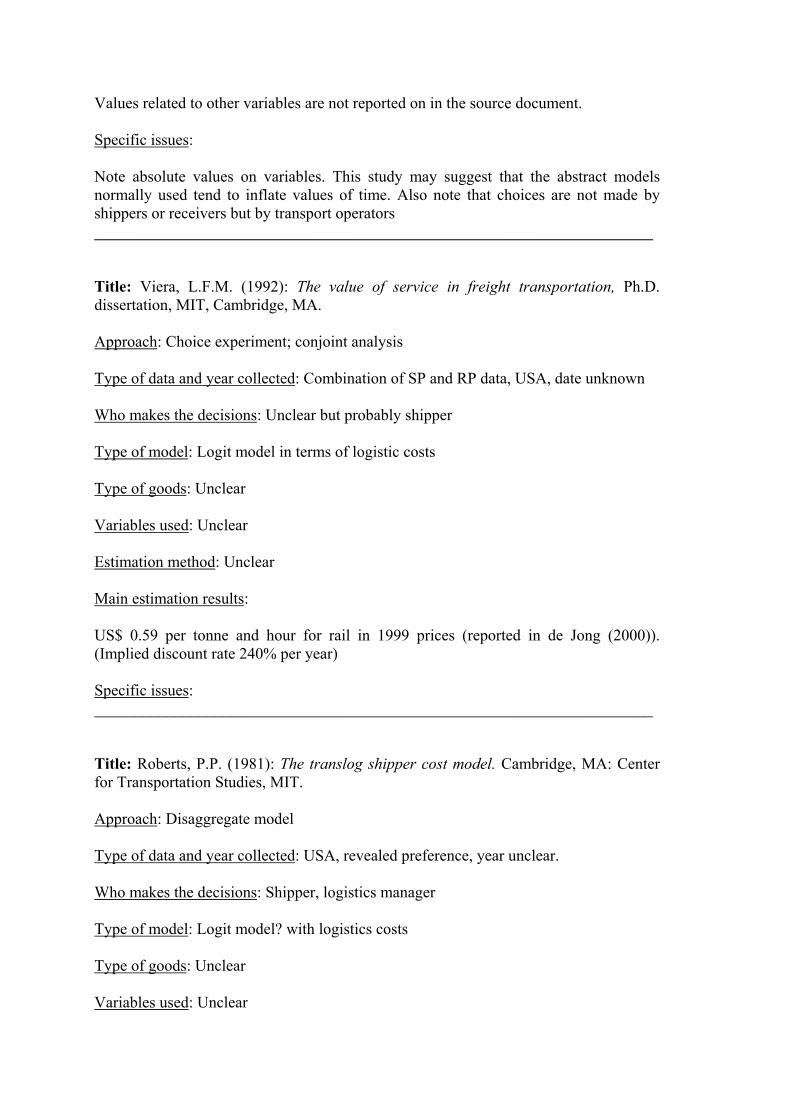
Values related to other variables are not reported on in the source document.
Specific issues:
Note absolute values on variables. This study may suggest that the abstract modelsnormally used tend to inflate values of time. Also note that choices are not made byshippers or receivers but by transport operators______________________________________________________________________
Title: Viera, L.F.M. (1992): The value of service in freight transportation, Ph.D.dissertation, MIT, Cambridge, MA.
Approach: Choice experiment; conjoint analysis
Type of data and year collected: Combination of SP and RP data, USA, date unknown
Who makes the decisions: Unclear but probably shipper
Type of model: Logit model in terms of logistic costs
Type of goods: Unclear
Variables used: Unclear
Estimation method: Unclear
Main estimation results:
US$ 0.59 per tonne and hour for rail in 1999 prices (reported in de Jong (2000)).(Implied discount rate 240% per year)
Specific issues:______________________________________________________________________
Title: Roberts, P.P. (1981): The translog shipper cost model. Cambridge, MA: Centerfor Transportation Studies, MIT.
Approach: Disaggregate model
Type of data and year collected: USA, revealed preference, year unclear.
Who makes the decisions: Shipper, logistics manager
Type of model: Logit model? with logistics costs
Type of goods: Unclear
Variables used: Unclear
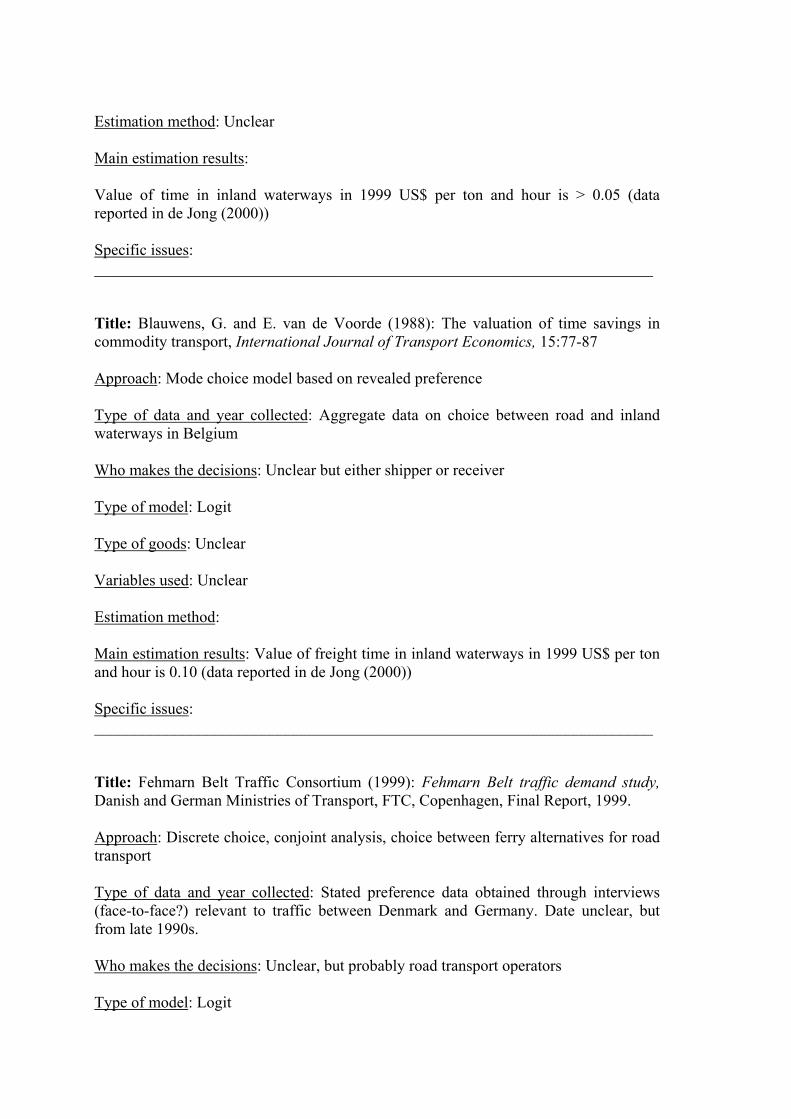
Estimation method: Unclear
Main estimation results:
Value of time in inland waterways in 1999 US$ per ton and hour is > 0.05 (datareported in de Jong (2000))
Specific issues:______________________________________________________________________
Title: Blauwens, G. and E. van de Voorde (1988): The valuation of time savings incommodity transport, International Journal of Transport Economics, 15:77-87
Approach: Mode choice model based on revealed preference
Type of data and year collected: Aggregate data on choice between road and inlandwaterways in Belgium
Who makes the decisions: Unclear but either shipper or receiver
Type of model: Logit
Type of goods: Unclear
Variables used: Unclear
Estimation method:
Main estimation results: Value of freight time in inland waterways in 1999 US$ per tonand hour is 0.10 (data reported in de Jong (2000))
Specific issues:______________________________________________________________________
Title: Fehmarn Belt Traffic Consortium (1999): Fehmarn Belt traffic demand study,Danish and German Ministries of Transport, FTC, Copenhagen, Final Report, 1999.
Approach: Discrete choice, conjoint analysis, choice between ferry alternatives for roadtransport
Type of data and year collected: Stated preference data obtained through interviews(face-to-face?) relevant to traffic between Denmark and Germany. Date unclear, butfrom late 1990s.
Who makes the decisions: Unclear, but probably road transport operators
Type of model: Logit

Type of goods: All goods by truck.
Variables used: Unclear
Estimation method: Unclear
Main estimation results:
Value of freight time per hour and shipment in 1999 US$ 21.
Specific issues:______________________________________________________________________
Title: de Jong, G.C., Y. van de Vyvere and H. Inwood (1995): The value of freighttransport: A cross-country comparison of outcomes. World Conference on TransportResearch, Sydney.
Approach: Discrete choice experiment; conjoint analysis, choice between abstract roadtransport alternatives
Type of data and year collected: Stated preference data obtained through face-to-faceinterviews in 1995 in the Netherlands, Germany and UK
Who makes the decisions: Shippers
Type of model: Logit model
Type of goods: All kinds of goods carried by road.
Variables used: transport timetotal transport costreliability (% not delivered on time)probability of damageflexibility
Estimation method: Maximum likelihood
Main estimation results: Freight values of time in 1999 US$ per hour and shipment
Germany: 33 The Netherlands: 40-43 France: 34
Specific issues:
Variables measured in percentage terms and not in absolute terms._____________________________________________________________________

Title: Bergkvist, E and L. Westin (2000): Regional Valuation of Infrastructure andTransport Attributes in Swedish Road Freight, Umeå Economic Studies No. 546, Umeå.
and
Bergkvist, E. (2000): Estimating values of time and forecasting transport choices inroad freight with a non-linear profit specification. The logit versus neural networks.Umeå Economic Studies, No. 540, Umeå.
Approach: Discrete choice experiment; conjoint analysis, choice between abstract roadtransport alternatives
Type of data and year collected: SP data collected through face to face interviews, 1991,Sweden. The same data as used in Transek (1992)
Who makes the decisions: Shipper (manager), but also own-account vehicles are used.
Type of model: Logit (and other) models for choice between alternatives
Type of goods: The goods are expected to be representative for all road transports inSweden by lorry.
Variables used: (i) door-to-door transport time (expected time)(ii) cost of transport(iii) frequency of shipments arriving late either the same dayor the following day (iv) risk of damage, (frequency of damage to shipments)
Estimation method: Weighted exogenous maximum likelihood
Main estimation results:
Value of freight time estimated at, on average, 14 SEK/hour per shipment (lorry) (to becompared with 30 SEK/hour in original model). The main reason for this may be thatabsolute variables were used (and not percentage), but possibly also that a WESMLestimator was used. Additional values of time estimated for short and long distancetransports in the Northern part and the Southern parts of Sweden
About 25% of interviewees indicated that penalty would be incurred if delayed arrivalon agreed day, the rest that penalty if arrival one day after agreed day. The formercategory was prepared to pay 178 SEK for one percentage unit reduction in late arrival.The latter 90 SEK for one percentage unit reduction in late arrival.
The value of one per mille unit reduction in risk of damage during transport valued at20 SEK per shipment
Specific issues: It is unclear if the data set used in this study is different from theoriginal one.

Additional results obtained with non-linear specifications as well as by using neuralnetworks are not considered here.______________________________________________________________________
Title: Bergkvist, Erik (2001): Freight Transportation; Valuation of Time andForecasting of Flows, Umeå Economic Studies, No. 549, Umeå
Approach: Discrete choice experiment; conjoint analysis, choice between abstract roadtransport alternatives
Type of data and year collected: SP data collected through face to face interviews, 1991,Sweden. The same data as used in Transek (1992). However, a number of observationshave been eliminated to yield the data set used in this particular study, which makes adistinction between on the one hand for hire and own-account operations, and on theother between short and long distance operations
Who makes the decisions: Shipper (manager), but also own-account vehicles are used.
Type of model: Logit models for choice between alternatives
Type of goods: The goods are expected to be representative for all road transports inSweden by lorry.
Variables used: (i) door-to-door transport time (expected time)(ii) cost of transport(iii) frequency of shipments arriving late either the same dayor the following day (iv) risk of damage, (frequency of damage to shipments)
Estimation method: Weighted exogenous maximum likelihood
Main estimation results: Value of freight time estimated at, on average, 37 SEK/hourper shipment in 1996 prices. When divided into own-account and for hire operations,the estimates obtained for the value of freight time become respectively 241 SEK/hourand 34 SEK/hour.
Specific issues: Whilst there may be other explanations (e.g. the value of the goods), theresults of this study may suggest that costs of transport cloud the estimates. An own-account operator may thus associate time increases with increases also in the cost ofoperations of the own-account fleet.______________________________________________________________________
Title: INREGIA (2001): Tidsvärden och transportkvalitet - INREGIA:s studie avtidsvärden och transportkvalitet för godstransporter 1999, Underlagsrapport tillSAMPLAN 2001:1, februari.

Approach: Discrete choice experiment; conjoint analysis, choice between abstract (i)road transport alternatives; (ii) railway alternatives; (iii) shipping alternatives; (iv) airtransport alternatives; and (v) road and rail transport alternatives.
Type of data and year collected: SP data collected by phone interviews, 1999, Sweden.
Who makes the decisions: Transport manager in manufacturing companies with andwithout their own road haulage vehicles
Type of model: Logit
Type of goods: Six different goods defines in terms of bulk/general, density and valueper kg.
Variables used: transport timetransport costper mille delayedper mille damageddummy variable to differentiate values of time in terms oftype of good and delivery time requirements
Estimation method: Maximum likelihood
Main estimation results: Two different models estimated; only results from model 1 arereported on here as model two is not in terms of linear generalised cost functions.
All freight values of time in SEK per hour and shipment, 1999 price level
Road Transport: 0-337Rail Transport: 0Ship: -Air Transport: 117
Risk of delay in SEK per mille unit change, 1999 price level
Road transport: 63Rail transport: 1142Air transport: 264
Risk of damage in SEK per mille change; 1999 price level
Road transport: -Rail transport: 2294Ship: -Air transport: 1175-4225
Specific issues:______________________________________________________________________

Title: Small, Kenneth, Robert Noland, Xuehao Chu and David Lewis (1999): Valuationof Travel-Time Savings and Predictability in Congested Conditions for Highway User-Cost Estimation, Report 431, National Cooperative Highway Research Program,Washington, D.C.
Approach: Discrete choice experiment; conjoint analysis, choice between abstract roadtransport alternatives
Type of data and year collected: Stated preference data collected through telephoneinterviews, California, around 1995
Who makes the decisions: Transport operators
Type of model: Logit model
Type of goods: Four different types of goods, reflecting four different classes withrespect to time sensitivity
Variables used: transport timecostand four different measurements of reliability, based ontransport time having a log-normal distribution, viz.(i) coefficient of variation(ii) standard deviation(iii) probability of being late(iv) probability of being late, schedule delay early andschedule delay late
Estimation method: Maximum likelihood
Main estimation results:
Values of freight time vary between US$ 144 - 193 per hour and shipment. Reducingone hour of schedule delay is valued at US$ 373
Specific issues: Most ambitious study yet to try to model reliability. However, mostparameter estimates related to reliability were either insignificant or had the wrong sign.Two explanations: a small sample and respondents had problems in understanding thealternatives and questions related to reliability.