THE V FOUNDATION AND NET ASSETS THE V FOUNDATION STATEMENTS OF FINANCIAL POSITION ASSETS September...
26
THE V FOUNDATION Cary, North Carolina AUDITED FINANCIAL STATEMENTS FOR THE YEAR ENDED SEPTEMBER 30, 2013 (With Comparative Totals for the Year Ended September 30, 2012)
Transcript of THE V FOUNDATION AND NET ASSETS THE V FOUNDATION STATEMENTS OF FINANCIAL POSITION ASSETS September...
THE V FOUNDATION
Cary, North Carolina
AUDITED FINANCIAL STATEMENTS FOR THE YEAR ENDED
SEPTEMBER 30, 2013 (With Comparative Totals for the Year Ended September 30, 2012)
CONTENTS
PAGES
Independent Auditor's Report 2-3
Exhibits:
"A" Statements of Financial Position 4
"B" Statement of Activities and Changes in Net Assets 5
"C" Statements of Cash Flows 6
"D" Statement of Functional Expenses 7
Notes to Financial Statements 8-25
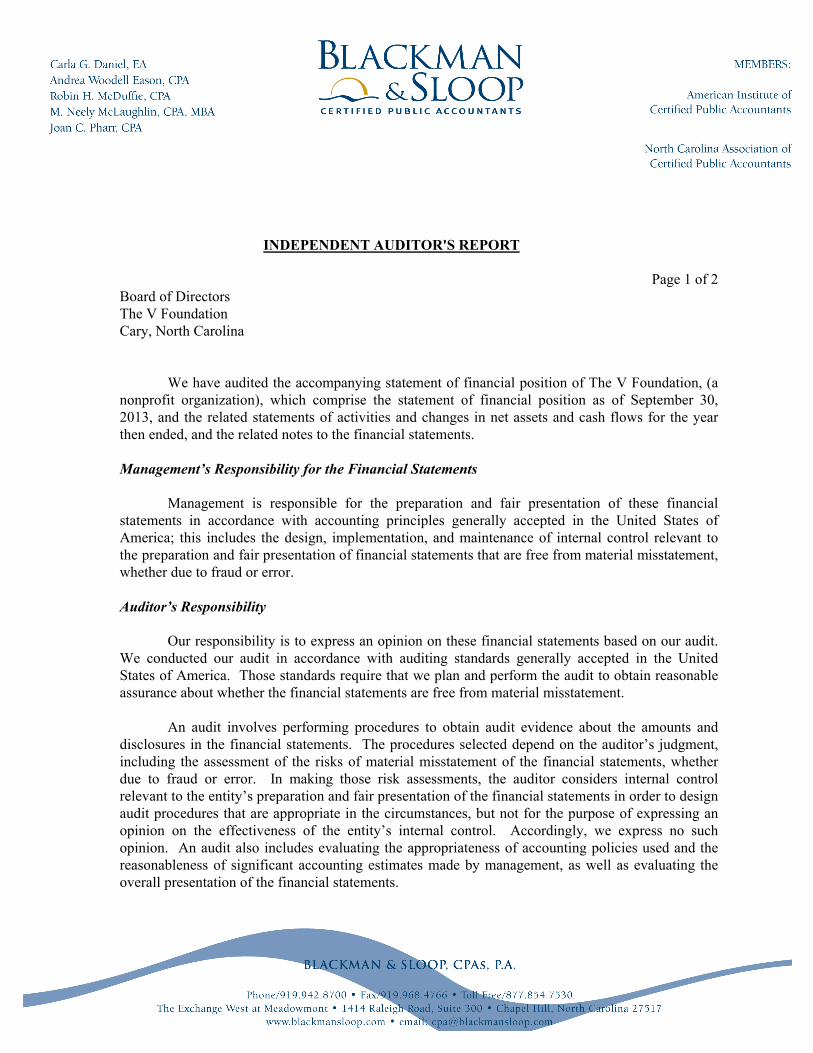
INDEPENDENT AUDITOR'S REPORT
Page 1 of 2Board of DirectorsThe V FoundationCary, North Carolina
We have audited the accompanying statement of financial position of The V Foundation, (a nonprofit organization), which comprise the statement of financial position as of September 30, 2013, and the related statements of activities and changes in net assets and cash flows for the year then ended, and the related notes to the financial statements.
Management’s Responsibility for the Financial Statements
Management is responsible for the preparation and fair presentation of these financial statements in accordance with accounting principles generally accepted in the United States of America; this includes the design, implementation, and maintenance of internal control relevant to the preparation and fair presentation of financial statements that are free from material misstatement, whether due to fraud or error.
Auditor’s Responsibility
Our responsibility is to express an opinion on these financial statements based on our audit. We conducted our audit in accordance with auditing standards generally accepted in the United States of America. Those standards require that we plan and perform the audit to obtain reasonable assurance about whether the financial statements are free from material misstatement.
An audit involves performing procedures to obtain audit evidence about the amounts and disclosures in the financial statements. The procedures selected depend on the auditor’s judgment, including the assessment of the risks of material misstatement of the financial statements, whether due to fraud or error. In making those risk assessments, the auditor considers internal control relevant to the entity’s preparation and fair presentation of the financial statements in order to design audit procedures that are appropriate in the circumstances, but not for the purpose of expressing an opinion on the effectiveness of the entity’s internal control. Accordingly, we express no such opinion. An audit also includes evaluating the appropriateness of accounting policies used and the reasonableness of significant accounting estimates made by management, as well as evaluating the overall presentation of the financial statements.

3
Page 2 of 2
We believe that the audit evidence we have obtained is sufficient and appropriate to provide a basis for our audit opinion.
Opinion
In our opinion, the financial statements referred to above present fairly, in all material respects, the financial position of The V Foundation, as of September 30, 2013, and the changes in its net assets and its cash flows for the year then ended in accordance with accounting principles generally accepted in the United States of America.
Report on Summarized Comparative Information
We have previously audited The V Foundation’s 2012 financial statements, and our report dated February 8, 2013, expressed an unmodified opinion on those audited financial statements. In our opinion, the summarized comparative information presented herein as of and for the year ended September 30, 2012, is consistent, in all material respects, with the audited financial statements from which it has been derived.
Chapel Hill, North CarolinaFebruary 14, 2014
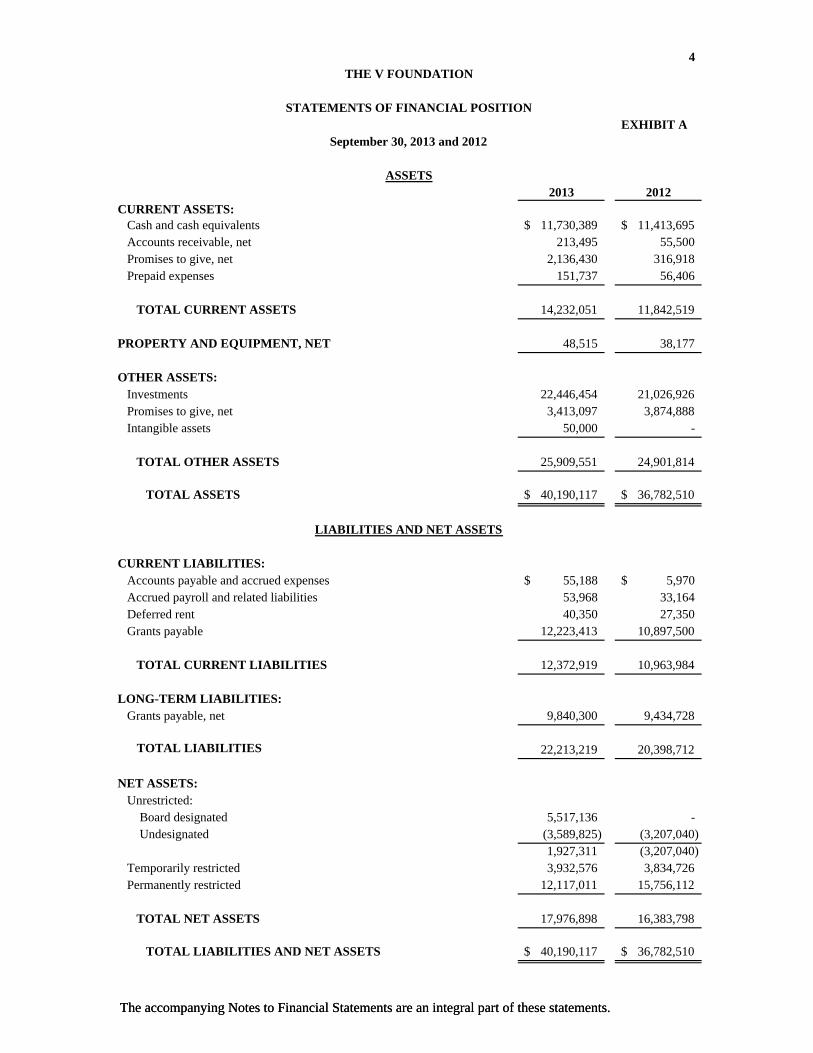
4
EXHIBIT A
2013 2012CURRENT ASSETS: Cash and cash equivalents 11,730,389$ 11,413,695$ Accounts receivable, net 213,495 55,500 Promises to give, net 2,136,430 316,918 Prepaid expenses 151,737 56,406
TOTAL CURRENT ASSETS 14,232,051 11,842,519
PROPERTY AND EQUIPMENT, NET 48,515 38,177
OTHER ASSETS: Investments 22,446,454 21,026,926 Promises to give, net 3,413,097 3,874,888 Intangible assets 50,000 -
TOTAL OTHER ASSETS 25,909,551 24,901,814
TOTAL ASSETS 40,190,117$ 36,782,510$
LIABILITIES AND NET ASSETS
THE V FOUNDATION
STATEMENTS OF FINANCIAL POSITION
ASSETS
September 30, 2013 and 2012
The accompanying Notes to Financial Statements are an integral part of these statements.
CURRENT LIABILITIES: Accounts payable and accrued expenses 55,188$ 5,970$ Accrued payroll and related liabilities 53,968 33,164 Deferred rent 40,350 27,350 Grants payable 12,223,413 10,897,500
TOTAL CURRENT LIABILITIES 12,372,919 10,963,984
LONG-TERM LIABILITIES: Grants payable, net 9,840,300 9,434,728
TOTAL LIABILITIES 22,213,219 20,398,712
NET ASSETS: Unrestricted: Board designated 5,517,136 - Undesignated (3,589,825) (3,207,040)
1,927,311 (3,207,040) Temporarily restricted 3,932,576 3,834,726 Permanently restricted 12,117,011 15,756,112
TOTAL NET ASSETS 17,976,898 16,383,798
TOTAL LIABILITIES AND NET ASSETS 40,190,117$ 36,782,510$
The accompanying Notes to Financial Statements are an integral part of these statements.

5
EXHIBIT B
Temporarily Permanently 2013 2012
Unrestricted Restricted Restricted Totals Totals
SUPPORT AND REVENUE:
Contributions and gifts 10,608,057$ 5,085,610$ 145,899$ 15,839,566$ 14,665,663$
Special events:
Contributions 1,592,397 - - 1,592,397 2,269,778
Event income 204,611 - - 204,611 245,620
Less: costs of direct benefits to donors (674,660) - - (674,660) (599,265)
Net revenues from special events 1,122,348 - - 1,122,348 1,916,133
License income 3,332 - - 3,332 -
Investment income, net of fees 117,605 266,906 - 384,511 283,495
Unrealized gain on investments 213,597 513,399 - 726,996 1,134,072
Realized gain on investments 130,773 314,326 - 445,099 399,368
12,195,712 6,180,241 145,899 18,521,852 18,398,731
Net assets released from restrictions 6,082,391 (6,082,391) - - -
TOTAL SUPPORT AND REVENUE 18,278,103 97,850 145,899 18,521,852 18,398,731
EXPENSES:
Program Services 15,138,098 - - 15,138,098 15,532,787
Supporting Services:
THE V FOUNDATION
STATEMENT OF ACTIVITIES AND CHANGES IN NET ASSETS
For the Year Ended September 30, 2013
(With Comparative Totals for the Year Ended September 30, 2012)
The accompanying Notes to Financial Statements are an integral part of these statements.
Supporting Services:
Management and general 719,490 - - 719,490 546,783
Fundraising expenses 1,071,164 - - 1,071,164 771,224
Total Supporting Services 1,790,654 - - 1,790,654 1,318,007
SUBTOTAL EXPENSES 16,928,752 - - 16,928,752 16,850,794
Loss from bad debts - - - - 230,000
TOTAL EXPENSES 16,928,752 - - 16,928,752 17,080,794
CHANGES IN NET ASSETS 1,349,351 97,850 145,899 1,593,100 1,317,937
TRANSFER OF NET ASSETS 3,785,000 - (3,785,000) - -
NET ASSETS - BEGINNING OF YEAR (3,207,040) 3,834,726 15,756,112 16,383,798 15,065,861
NET ASSETS - END OF YEAR 1,927,311$ 3,932,576$ 12,117,011$ 17,976,898$ 16,383,798$
The accompanying Notes to Financial Statements are an integral part of these statements.

6
EXHIBIT C
CASH FLOWS FROM OPERATING ACTIVITIES: 2013 2012 Changes in net assets 1,593,100$ 1,317,937$ Adjustments to reconcile changes in net assets to net cash used in operating activities: Depreciation and amortization 12,379 4,874 Unrealized gain on investments (726,996) (1,134,072) Realized gain on investments (445,099) (399,368) Permanently restricted contributions (656,059) (1,248,468) Donated securities (719,339) (201,630) Donated property and equipment (19,760) - Increase (decrease) in cash arising from changes in assets and liabilities: Accounts receivable, net (157,995) 30,500 Promises to give, net (1,357,721) (1,376,942) Prepaid expenses (95,331) (20,514) Intangible assets (50,000) - Accounts payable and accrued expenses 49,218 (12,614) Accrued payroll and related liabilities 20,804 17,084 Lease payable 13,000 27,350 Grants payable, net 1,731,485 781,608
NET CASH USED IN OPERATING ACTIVITIES (808 314) (2 214 255)
THE V FOUNDATION
STATEMENTS OF CASH FLOWS
For the Years Ended September 30, 2013 and 2012
The accompanying Notes to Financial Statements are an integral part of these statements.
NET CASH USED IN OPERATING ACTIVITIES (808,314) (2,214,255)
CASH FLOWS FROM INVESTING ACTIVITIES: Acquisition of property and equipment (2,957) (35,549) Purchases of investments (14,488,588) (11,561,592) Sales of investments 14,960,494 11,289,163
NET CASH PROVIDED BY (USED IN) INVESTING ACTIVITIES 468,949 (307,978)
CASH FLOWS FROM FINANCING ACTIVITIES: Permanently restricted contributions 656,059 1,248,468
NET INCREASE (DECREASE) IN CASH AND CASH EQUIVALENTS 316,694 (1,273,765)
CASH AND CASH EQUIVALENTS - BEGINNING OF YEAR 11,413,695 12,687,460
CASH AND CASH EQUIVALENTS - END OF YEAR 11,730,389$ 11,413,695$
SUPPLEMENTAL DISCLOSURE: Noncash contribution: Donated securities 719,337$ 201,630$
Donated property and equipment 19,760$ -$
The accompanying Notes to Financial Statements are an integral part of these statements.

7
EXHIBIT D
Program Management 2013 2012Services and General Fundraising Totals Totals
Grant expense 13,768,985$ -$ -$ 13,768,985$ 14,613,141$ Salaries 662,044 365,806 573,750 1,601,600 974,328 Employee benefits 148,378 81,985 128,589 358,952 223,567 Supporting organization expenses 153,871 - - 153,871 160,690 Professional fees 24,918 71,739 45,841 142,498 207,245 Travel related expenses 56,292 31,104 48,785 136,181 108,121 Occupancy expenses 47,239 26,101 40,939 114,279 118,034 Payroll taxes 46,725 25,818 40,494 113,037 61,684 Bank service charges 46,624 25,762 40,406 112,792 95,656 Computer maintenance 41,341 22,842 35,827 100,010 105,311 Printing and copying 39,215 21,668 33,985 94,868 5,683 Advertising 37,907 20,945 32,851 91,703 63,423 Postage and shipping 16,578 9,160 14,367 40,105 46,968 Office supplies 10,380 5,735 8,995 25,110 25,826 Scientific advisory board expenses 18,010 - - 18,010 8,990 Miscellaneous 6,367 3,519 5,519 15,405 - Insurance 5,415 2,992 4,693 13,100 6,197 Depreciation and amortization 5,117 2,827 4,435 12,379 11,805 Direct fundraising expenses - - 9,355 9,355 4,874 Board expenses 2,692 1,487 2,333 6,512 6,576 Repairs and maintenance - - - - 2,675
THE V FOUNDATION
STATEMENT OF FUNCTIONAL EXPENSES
For the Year Ended September 30, 2013(With Comparative Totals for the Year Ended September 30, 2012)
The accompanying Notes to Financial Statements are an integral part of these statements.
15,138,098$ 719,490$ 1,071,164$ 16,928,752$ 16,850,794$
The accompanying Notes to Financial Statements are an integral part of these statements.
THE V FOUNDATION
NOTES TO FINANCIAL STATEMENTS
8
Page 1 of 18
NATURE OF ACTIVITIES
The V Foundation (the “Foundation”) was incorporated on February 12, 1993, as a nonprofit charitable organization dedicated to saving lives by helping to find a cure for cancer. The Foundation’s mission is to generate broad based support for cancer research and create an urgent awareness among all Americans of the importance of the war against cancer. The Foundation accomplishes its mission through advocacy, education, fundraising, and philanthropy.
SUMMARY OF SIGNIFICANT ACCOUNTING POLICIES AND PRACTICES
A. Basis of Accounting.
The Foundation’s financial statements are presented on the accrual basis of accounting inconformity with accounting principles generally accepted in the United States of America (“U.S. GAAP”). Accordingly, revenues and support are recognized when earned, and expenses are recognized when the obligation is incurred.
The Foundation reports gifts of cash and other assets as temporarily restricted support if they are received with donor stipulations that limit the use of the donated assets. When a donor restriction expires, that is, when a stipulated time restriction ends or purpose restriction is accomplished, temporarily restricted net assets are reclassified to unrestricted net assets and reported in the statement of activities as net assets released from restrictions. Permanently restricted contributions represent only those contributions restricted by the donor to be invested in perpetuity for the purpose of providing a permanent source of income. The accumulated earnings are reflected in temporarily restricted net assets until appropriated.
B. Cash and Cash Equivalents.
Cash and cash equivalents consist of monies on deposit at financial institutions and other highly liquid investments with maturities of three months or less. At times, the Foundation places deposits with high-quality financial institutions that may be in excess of federally insured amounts. The Foundation has not experienced any financial loss related to such deposits.
C. Accounts Receivable.
Accounts receivable consist of receivables from special events held with the specific purpose of promoting and publicizing the Foundation and are carried at their net realizable value. The Foundation provides an allowance for doubtful accounts equal to the estimated losses that are expected be incurred in their collection. The allowance is based on historical collection experience and a review by management of the current status of the existing receivables. As of September 30, 2013 and 2012, all accounts receivable were deemed collectible by management.
THE V FOUNDATION
NOTES TO FINANCIAL STATEMENTS
9
Page 2 of 18
SUMMARY OF SIGNIFICANT ACCOUNTING POLICIES AND PRACTICES (CONTINUED)
D. Promises to Give.
Unconditional promises to give are recognized as support and assets in the period received. Unconditional promises to give that are expected to be collected within one year are recorded at net realizable value. Unconditional promises to give that are expected to be collected in future years are recorded at the present value of their estimated future cash flows. The Foundation provides an allowance for doubtful promises to give equal to the estimated losses that are expected to be incurred in their collection. The allowance is based on historical collection experience and a review by management of the current status of the existing promises to give.
Conditional promises to give are recognized when the conditions on which they depend are substantially met.
E. Property and Equipment.
Property and equipment are stated at cost for purchased assets and at market value on the date of the gift for donated assets. Property and equipment are capitalized if the life is expected to be greater than one year and the cost exceeds $500. Depreciation is calculated using the straight-line method over estimated useful lives of the assets, which range from three to seven years.
The Foundation reports gifts of land, buildings, and equipment as unrestricted support unless explicit donor stipulations specify how the donated assets must be used. Gifts of long-lived assets with explicit restrictions that specify how the assets are to be used, and gifts of cash or other assets that must be used to acquire long-lived assets, are reported as restricted support. Absent explicit donor stipulations about how long those long-lived assets must be maintained, the Foundation reports expirations of donor restrictions when the donated or acquired long-lived assets are placed in service.
F. Investments.
Investments in marketable securities are stated at fair market value based on readily available published values. Donated securities are recorded at their fair market value at the date of gift.
Investments in non-publicly traded companies are stated at cost in accordance with Financial Accounting Standards Board (“FASB”) Accounting Standards Codification (“ASC”) 325-20, Cost Method Investments and ASC 958-25, Not-for-Profit Entities Investments.
THE V FOUNDATION
NOTES TO FINANCIAL STATEMENTS
10
Page 3 of 18
SUMMARY OF SIGNIFICANT ACCOUNTING POLICIES AND PRACTICES(CONTINUED)
G. Intangible Assets.
Intangible assets are capitalized and stated at cost in accordance with FASB ASC 350-30, Intangibles and Other Goodwill. The assets have indefinite lives and are reviewed annually for impairment.
H. Program Grants.
Program grants and the corresponding grants payable are recognized at the time the grant award letter is sent to the recipient. Grants to be awarded in future years are recorded at the present value of their estimated future cash flows.
I. Fair Value of Financial Instruments.
U.S. GAAP requires the Foundation to disclose estimated fair values for its financial instruments. The carrying amount of financial instruments approximates fair value because of the short maturities of the instruments held.
I. Advertising.
The Foundation expenses advertising costs as incurred. Advertising expense totaled $91,703 and $63,423, for the years ended September 30, 2013 and 2012, respectively.
J. Net Assets.
Unrestricted - Resources of the Foundation that are not restricted by donors or grantors as to use or purpose. These resources include amounts generated from operations, undesignated gifts, and investments in property and equipment.
Temporarily Restricted - Resources that carry a donor-imposed restriction that permits the Foundation to use or expend the donated assets for a specific purpose. The restrictions can besatisfied by the passage of time or by actions of the Foundation.
Permanently Restricted - Resources that carry a donor-imposed restriction that stipulates that donated assets be maintained in perpetuity, but may permit the Foundation to use or expend part or all of the income derived from the donated assets.
K. Income Taxes.
The Foundation is an exempt organization under Section 501(c)(3) of the Internal Revenue Code, and is classified as other than a private foundation. It is also exempt from North Carolina income and franchise taxes under the North Carolina Non-Profit Corporation Act.

THE V FOUNDATION
NOTES TO FINANCIAL STATEMENTS
11
Page 4 of 18 SUMMARY OF SIGNIFICANT ACCOUNTING POLICIES AND PRACTICES (CONTINUED)
L. Estimates.
The preparation of financial statements in conformity with U.S. GAAP requires management to make estimates and assumptions that affect the reported amounts of assets and liabilities and disclosure of contingent assets and liabilities at the date of the financial statements and the reported amounts of revenue and expenses during the reporting period. Accordingly, actual results could differ from those estimates.
PROMISES TO GIVE Promises to give consist of the following at September 30:
2013 2012Receivable in less than one year 2,893,376$ 1,450,893$ Receivable in one to five years 3,163,516 3,168,140 Receivable in greater than five years - 20,000 Total gross promises to give 6,056,892 4,639,033 Discount at a rate of 3.28% and 2.00% (203,206) (105,768)
Allowance for uncollectible promises to give (304,159) (341,459)
Net present value of promises to give 5,549,527$ 4,191,806$
Promises to give are presented on the statements of financial position under the following captions:
2013 2012Current assets: Promises to give, net 2,136,430$ 316,918$ Other assets: Promises to give, net 3,413,097 3,874,888
Total promises to give 5,549,527$ 4,191,806$
The Foundation has been named in a number of wills as a beneficiary and has also been informed of other intentions to give. Such intentions to give are not recorded as promises to give until they become unconditional.
THE V FOUNDATION
NOTES TO FINANCIAL STATEMENTS
12
Page 5 of 18
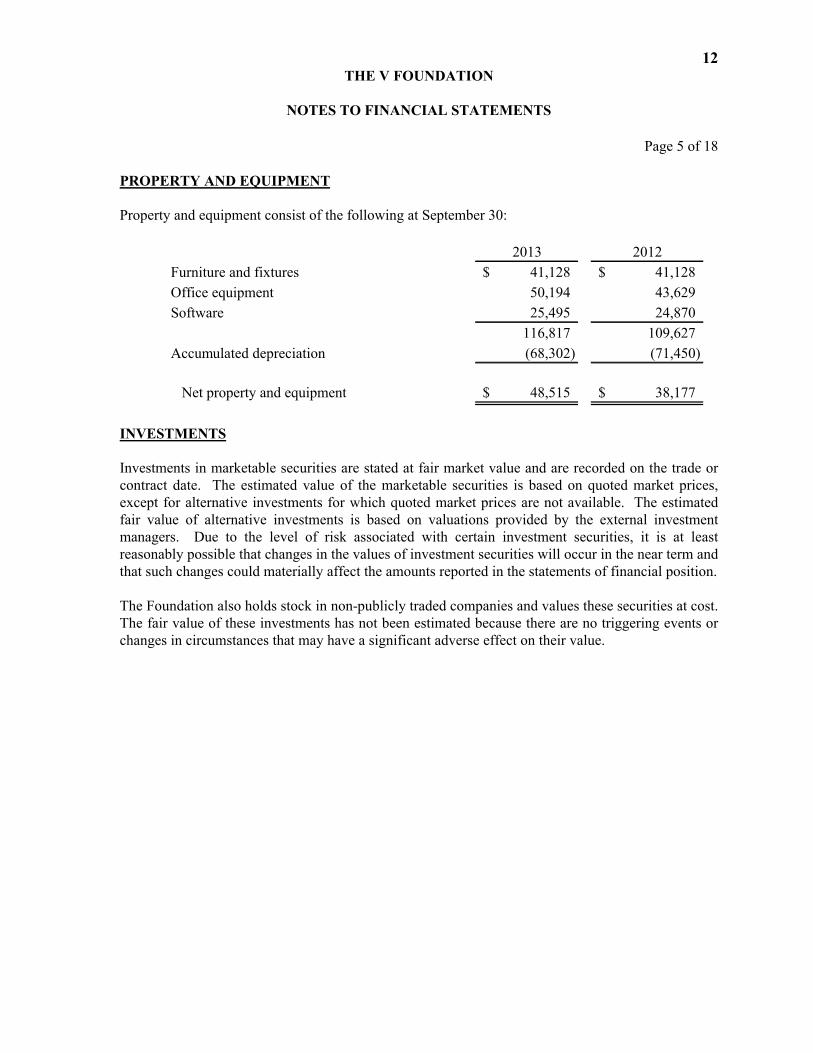
PROPERTY AND EQUIPMENT
Property and equipment consist of the following at September 30:
2013 2012
Furniture and fixtures 41,128$ 41,128$
Office equipment 50,194 43,629
Software 25,495 24,870
116,817 109,627
Accumulated depreciation (68,302) (71,450)
Net property and equipment 48,515$ 38,177$
INVESTMENTS
Investments in marketable securities are stated at fair market value and are recorded on the trade or contract date. The estimated value of the marketable securities is based on quoted market prices, except for alternative investments for which quoted market prices are not available. The estimated fair value of alternative investments is based on valuations provided by the external investment managers. Due to the level of risk associated with certain investment securities, it is at least reasonably possible that changes in the values of investment securities will occur in the near term and that such changes could materially affect the amounts reported in the statements of financial position.
The Foundation also holds stock in non-publicly traded companies and values these securities at cost. The fair value of these investments has not been estimated because there are no triggering events or changes in circumstances that may have a significant adverse effect on their value.

THE V FOUNDATION
NOTES TO FINANCIAL STATEMENTS
13
Page 6 of 18
INVESTMENTS (CONTINUED)
Investments of the Foundation consist of the following at September 30:
Cost Market Cost Market
Marketable securities:
Carried at fair value:
Money market funds 715,596$ 715,596$ 973,089$ 973,089$
U.S. Treasury securities 3,920,388 3,978,429 4,126,174 4,289,927
Corporate debt securities 3,089,932 3,147,555 2,643,349 2,882,745
Equity securities:
Consumer discretionary 1,425,076 1,654,979 838,769 917,350
Consumer staples 1,265,726 1,361,183 806,012 864,248
Energy 1,272,940 1,328,965 1,943,051 1,786,879
Equities blend 40 35 107,012 107,778
Financials 2,165,130 2,305,965 1,433,699 1,507,019
Healthcare 1,331,603 1,646,642 992,975 1,274,584
Industrials 1,178,167 1,336,858 1,439,523 1,415,363
Information technology 1,856,870 2,109,260 1,513,038 1,579,442
Materials 748,007 764,418 1,392,883 1,331,135
Telecommunications 257,016 240,592 374,673 337,496
Utilities 229,939 226,459 226,064 167,844
Perferred stock 41,961 35,600 - -
Alternative investments 1,636,349 1,518,918 1,631,897 1,517,027
Equity securities carried at cost 75,000 75,000 75,000 75,000
Total marketable securities 21,209,740$ 22,446,454$ 20,517,208$ 21,026,926$
20122013
The following schedule summarizes the investment returns and their classifications in the statement of activities and changes in net assets for the year ended September 30, 2013. Investment income on the statement of activities and changes in net assets for the year ended September 30, 2013, is recorded net of investment fees of $191,287, and includes earnings from deposits at financial institutions totaling $6,560.
Temporarily Permanently
Unrestricted Restricted Restricted Total
Investment income 167,246$ 401,992$ -$ 569,238$
Unrealized gains 213,597 513,399 - 726,996
Realized gains 130,773 314,326 - 445,099
Total investment return 511,616$ 1,229,717$ -$ 1,741,333$
September 30, 2013
THE V FOUNDATION
NOTES TO FINANCIAL STATEMENTS
14
Page 7 of 18
INVESTMENTS (CONTINUED)
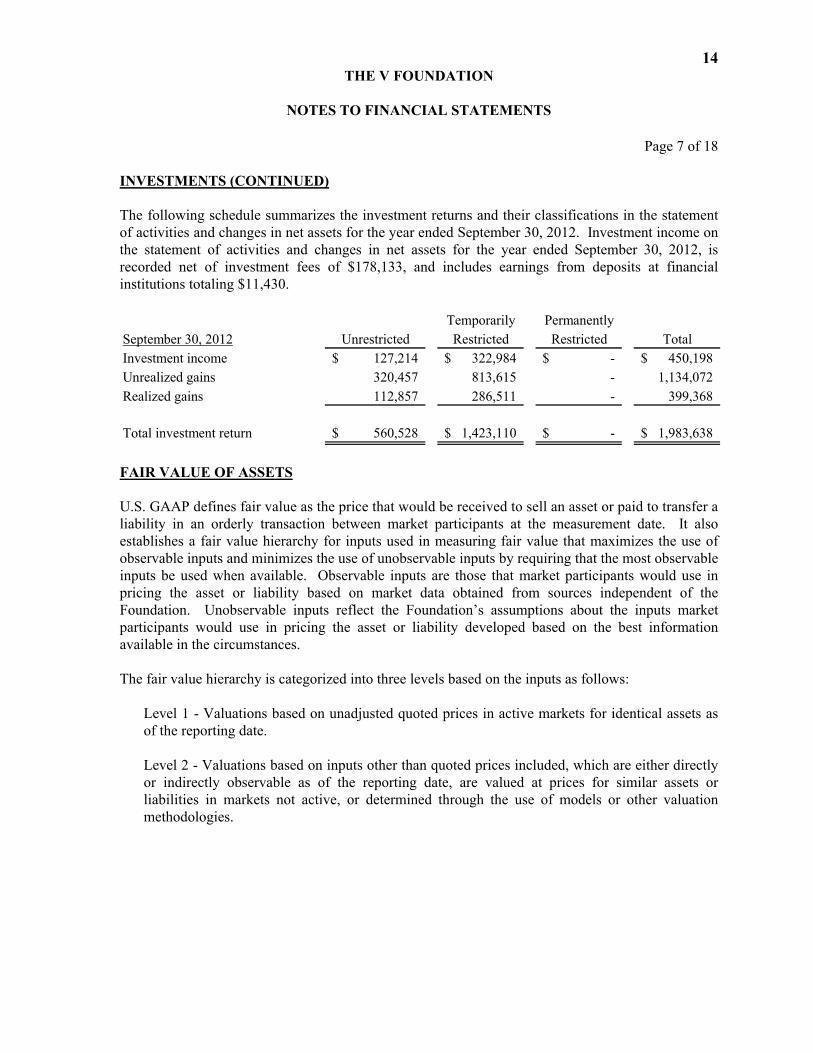
The following schedule summarizes the investment returns and their classifications in the statement of activities and changes in net assets for the year ended September 30, 2012. Investment income on the statement of activities and changes in net assets for the year ended September 30, 2012, is recorded net of investment fees of $178,133, and includes earnings from deposits at financial institutions totaling $11,430.
Temporarily Permanently
Unrestricted Restricted Restricted Total
Investment income 127,214$ 322,984$ -$ 450,198$
Unrealized gains 320,457 813,615 - 1,134,072
Realized gains 112,857 286,511 - 399,368
Total investment return 560,528$ 1,423,110$ -$ 1,983,638$
September 30, 2012
FAIR VALUE OF ASSETS
U.S. GAAP defines fair value as the price that would be received to sell an asset or paid to transfer a liability in an orderly transaction between market participants at the measurement date. It also establishes a fair value hierarchy for inputs used in measuring fair value that maximizes the use of observable inputs and minimizes the use of unobservable inputs by requiring that the most observable inputs be used when available. Observable inputs are those that market participants would use in pricing the asset or liability based on market data obtained from sources independent of the Foundation. Unobservable inputs reflect the Foundation’s assumptions about the inputs market participants would use in pricing the asset or liability developed based on the best information available in the circumstances.
The fair value hierarchy is categorized into three levels based on the inputs as follows:
Level 1 - Valuations based on unadjusted quoted prices in active markets for identical assets as of the reporting date.
Level 2 - Valuations based on inputs other than quoted prices included, which are either directly or indirectly observable as of the reporting date, are valued at prices for similar assets or liabilities in markets not active, or determined through the use of models or other valuation methodologies.

THE V FOUNDATION
NOTES TO FINANCIAL STATEMENTS
15
Page 8 of 18
FAIR VALUE OF ASSETS (CONTINUED)
Level 3 – Pricing inputs are unobservable and include situations where there is little, if any, market activity for the asset. Fair value for these assets is determined using valuation methodologies that consider a range of factors, including but not limited to the price at which the asset was acquired, the nature of the assets, local market conditions, trading values on public exchanges for comparable securities, current and projected operating performance and financing transactions subsequent to the acquisition of the asset. The inputs into the determination of fair value require significant management judgment. Due to the inherent uncertainty of these estimates, these values may differ materially from the values that would have been used had a ready market for these assets existed.
The Foundation’s investments are classified as Level 1, Level 2, and Level 3.
There were no changes during the year ending September 30, 2013, to the Foundation’s valuation techniques used to measure asset values on a recurring basis.
The following tables summarize the assets of the Foundation for which fair values are determined on a recurring basis as of September 30, 2013 and 2012. As required by U.S. GAAP assets are classified in their entirety based on the lowest level of input that is significant to the fair value measurement.
Level 1 Level 2 Level 3 Total
Money market funds -$ 715,596$ -$ 715,596$
U. S. Treasury securities - 3,978,429 - 3,978,429
Corporate debt securities - 3,147,555 - 3,147,555
Equity securities:
Consumer discretionary 1,654,979 - - 1,654,979
Consumer staples 1,361,183 - - 1,361,183
Energy 1,328,965 - - 1,328,965
Equities blend - 35 - 35
Financials 2,305,965 - - 2,305,965
Healthcare 1,646,642 - - 1,646,642
Industrials 1,336,858 - - 1,336,858
Information technology 2,109,260 - - 2,109,260
Materials 764,418 - - 764,418
Telecommunications 240,592 - - 240,592
Utilities 226,459 - - 226,459
Perferred stock - 35,600 - 35,600
Alternative investments - - 1,518,918 1,518,918
12,975,321$ 7,877,215$ 1,518,918$ 22,371,454$
September 30, 2013
THE V FOUNDATION
NOTES TO FINANCIAL STATEMENTS
16
Page 9 of 18
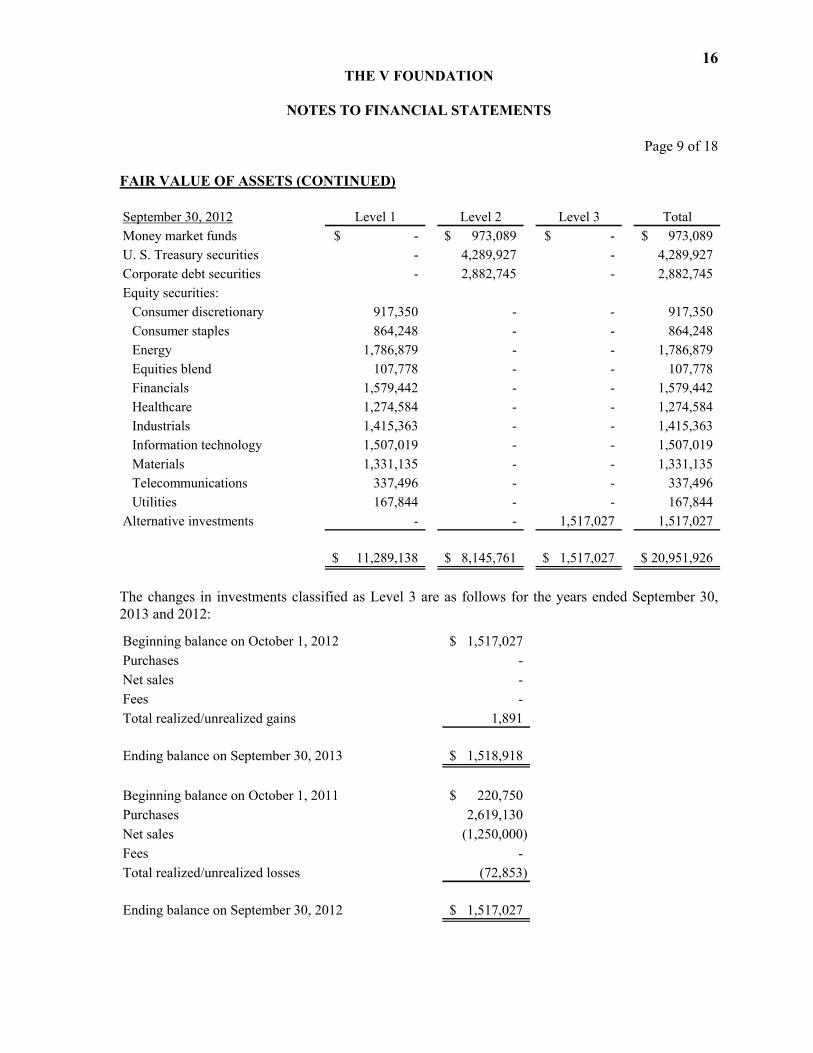
FAIR VALUE OF ASSETS (CONTINUED)
Level 1 Level 2 Level 3 Total
Money market funds -$ 973,089$ -$ 973,089$
U. S. Treasury securities - 4,289,927 - 4,289,927
Corporate debt securities - 2,882,745 - 2,882,745
Equity securities:
Consumer discretionary 917,350 - - 917,350
Consumer staples 864,248 - - 864,248
Energy 1,786,879 - - 1,786,879
Equities blend 107,778 - - 107,778
Financials 1,579,442 - - 1,579,442
Healthcare 1,274,584 - - 1,274,584
Industrials 1,415,363 - - 1,415,363
Information technology 1,507,019 - - 1,507,019
Materials 1,331,135 - - 1,331,135
Telecommunications 337,496 - - 337,496
Utilities 167,844 - - 167,844
Alternative investments - - 1,517,027 1,517,027
11,289,138$ 8,145,761$ 1,517,027$ 20,951,926$
September 30, 2012
The changes in investments classified as Level 3 are as follows for the years ended September 30, 2013 and 2012:
Beginning balance on October 1, 2012 1,517,027$
Purchases -
Net sales -
Fees -
Total realized/unrealized gains 1,891
Ending balance on September 30, 2013 1,518,918$
Beginning balance on October 1, 2011 220,750$
Purchases 2,619,130
Net sales (1,250,000)
Fees -
Total realized/unrealized losses (72,853)
Ending balance on September 30, 2012 1,517,027$

THE V FOUNDATION
NOTES TO FINANCIAL STATEMENTS
17
Page 10 of 18
FAIR VALUE OF ASSETS (CONTINUED)
Gains and losses (realized and unrealized) for Level 3 investments included in revenue for the yearsended September 30 are reported as follows:
2013 2012
1,891$ (72,853)$
1,891$ (72,853)$
Total gains and losses included in realized gains on
investments and unrealized gains (losses) on investments
Unrealized gains or losses relating to assets held at year-
end included in unrealized gains (losses) on investments
There were no realized gains (losses) on Level 3 investments for the years ended September 30, 2013and 2012.
Level 3 investments include $216,500 and $222,250, at September 30, 2013 and 2012, respectively, of investment in currency-linked step up notes. The notes are linked to a basket of Asian currencies and represent a long position in these currencies in relation to the U.S. dollar. There is 100% participation in any increase in the value of the exchange rate measure if it increases above the step-up value, and 90% principal protection at maturity against decreases in the value of the exchange rate measure. The notes have a maturity of approximately three years.
Level 3 investments include $84,315 and $109,410, at September 30, 2013 and 2012, respectively, of investments in a fund that invests substantially all of its assets in privately negotiated mezzanine investment funds. The fair value of the investments in this class has been estimated using the net asset value per share of the investments. The fund is a private equity, long term, ill-liquid investment.
Level 3 investments include investments in certain entities that calculate net asset value per share as follows at September 30, 2013 and 2012:
2013 2012 Redemption Redemption
Fair Value Fair Value Frequency Notice Period
Event driven hedge funds 901,310$ 769,060$ quarterly 30 days
Gold investment hedge fund 67,785 170,155 quarterly 30 days
Global macro hedge funds 249,008 246,152 quarterly 30 days
1,218,103$ 1,185,367$
Event driven hedge funds include funds whose objective is to achieve appreciation of their assets through trading in debt and equity securities and other investments expected to appreciate in price due to financial recovery and/or restructuring. They seek to deliver consistent positive risk-adjusted returns throughout market cycles, with a strong focus on risk management and capital preservation.

THE V FOUNDATION
NOTES TO FINANCIAL STATEMENTS
18
Page 11 of 18
FAIR VALUE OF ASSETS (CONTINUED)
Portfolio composition is determined by market opportunities rather than any predetermined commitment to investment discipline or geography. The fair values of the investments in this class have been estimated using the net asset value per share of the investments.
Gold investment hedge funds’ principal trading objective is to outperform the price of gold in a rising gold price environment. The fair value of the investments in this class has been estimated using the net asset value per share of the investments.
Global macro hedge funds have an investment objective of generating strong risk adjusted returns in all market conditions by giving investors broad based exposure to trading strategies across multiple asset classes. The fair value of the investments in this class has been estimated using the net asset value per share of the investments.
ENDOWMENT
Interpretation of Relevant Law
The Board of Directors of the Foundation has interpreted the Uniform Prudent Management of Institutional Funds Act (UPMIFA) as requiring the preservation of the fair value of the original gift as of the gift date of the donor-restricted endowment funds absent explicit donor stipulations to the contrary. As a result of this interpretation, the Foundation classifies as permanently restricted net assets (a) the original value of gifts donated to the permanent endowment, (b) the original value of subsequent gifts to the permanent endowment, and (c) accumulations to the permanent endowment made in accordance with the direction of the applicable donor gift instrument at the time the accumulation is added to the fund. The remaining portion of the donor-restricted endowment fund that is not classified in permanently restricted net assets is classified as temporarily restricted net assets until those amounts are appropriated for expenditure by the Foundation in a manner consistent with the standard of prudence prescribed by UPMIFA.
In accordance with UPMIFA, the Foundation considers the following factors in making a determination to appropriate or accumulate donor-restricted endowment funds:
1. The duration and preservation of the fund,2. The purposes of the Foundation and the donor-restricted endowment fund,3. General economic conditions,4. The possible effect of inflation and deflation,5. The expected total return from income and the appreciation of investments,6. Other resources of the Foundation, and 7. The investment policies of the Foundation.
THE V FOUNDATION
NOTES TO FINANCIAL STATEMENTS
19
Page 12 of 18
ENDOWMENT (CONTINUED)
Return Objectives and Risk Parameters
The Foundation has adopted investment and spending policies for endowment assets that attempt to provide a predictable stream of funding to programs supported by its endowment while seeking to maintain the purchasing power of the endowment assets. Endowment assets include those assets of donor-restricted funds that the Foundation must hold in perpetuity or for a donor-specified period(s). The Foundation expects its endowment fund, over time, to provide an average rate of return of approximately 6% in perpetuity. Actual returns in any given year may vary from this amount.
Strategies Employed for Achieving Objectives
To satisfy its long-term rate-of-return objectives, the Foundation relies on a total return strategy in which investment returns are achieved through both capital appreciation (realized and unrealized) and current yield (interest and dividends). The Foundation targets a diversified asset allocation that places a greater emphasis on equity-based investments to achieve its long-term return objectives within prudent risk constraints as managed by the Foundation’s Endowment Committee.
Spending Policy and How the Investment Objectives Relate to Spending Policy
The Foundation has a policy of appropriating investment earnings for distribution each year based upon the prior year’s investment earnings of the related endowment. In establishing this policy, the Foundation considered the long-term expected return on its endowment. Accordingly, over the long term, the Foundation expects the current spending policy to allow its endowment to grow at a moderate rate. This is consistent with the Foundation’s objective to maintain the purchasing power of the endowment assets held in perpetuity or for a specified term, as well as to provide additional real growth through new gifts and investment return.
Funds with Deficiencies
From time to time, the fair value of assets associated with individual donor-restricted endowment fund may fall below the level that UPMIFA requires to retain as a fund of perpetual duration. As of September 30, 2013 and 2012, the endowment fund was above the required amounts.

THE V FOUNDATION
NOTES TO FINANCIAL STATEMENTS
20
Page 13 of 18 ENDOWMENT (CONTINUED) Changes in the endowment fund consist of the following during the year ended September 30, 2013:
Temporarily PermanentlyUnrestricted Restricted Restricted Total
Net assets, beginning of year 6,253,331$ 2,443,633$ 12,873,643$ 21,570,607$ Transfer of net assets 2,660,963 - (2,660,963) - Investment income 167,246 401,992 - 569,238 Net appreciation (realized and unrealized) 344,370 827,725 - 1,172,095 Contributions 1,984,035 - 656,059 2,640,094 Appropriation of assets
for expenditure (56) (3,072,227) - (3,072,283) Investment fees (56,202) (135,086) - (191,288)
Net assets, end of year 11,353,687$ 466,037$ 10,868,739$ 22,688,463$
The endowment net asset composition by type of fund as of September 30, 2013, was as follows:
Temporarily PermanentlyUnrestricted Restricted Restricted Total
Donor-restricted 7,205,717$ 466,037$ 10,868,739$ 18,540,493$ Board-designated 4,147,970 - - 4,147,970
Total funds 11,353,687$ 466,037$ 10,868,739$ 22,688,463$
Permanently restricted endowment funds noted above exclude endowment promises to give. Changes in the endowment fund consist of the following during the year ended September 30, 2012:
Temporarily Permanently
Unrestricted Restricted Restricted TotalNet assets, beginning of year 5,743,061$ 1,889,436$ 11,625,175$ 19,257,672$ Investment income 127,214 322,984 - 450,198
Net depreciation (realized and unrealized) 433,314 1,100,126 - 1,533,440 Contributions - - 1,248,468 1,248,468
Appropriation of assets for expenditure - (741,333) - (741,333)
Investment fees (50,258) (127,580) - (177,838)
Net assets, end of year 6,253,331$ 2,443,633$ 12,873,643$ 21,570,607$
Permanently restricted endowment funds noted above exclude endowment promises to give.

THE V FOUNDATION
NOTES TO FINANCIAL STATEMENTS
21
Page 14 of 18
ENDOWMENT (CONTINUED)
The endowment net asset composition by type of fund as of September 30, 2012, was as follows:
Temporarily Permanently
Unrestricted Restricted Restricted Total
Donor-restricted 6,253,331$ 2,443,633$ 12,873,643$ 21,570,607$
Board-designated - - - -
Total funds 6,253,331$ 2,443,633$ 12,873,643$ 21,570,607$
GRANTS PAYABLE
Grants payable consist of the following at September 30:
2013 2012
Payable in less than one year 12,223,413$ 10,897,500$
Payable in one to five years 10,280,000 9,771,000
Payable in greater than five years - 81,500
Total gross grants payable 22,503,413 20,750,000
Discount at a rate of 3.25% (439,700) (417,772)
Net present value of grants payable 22,063,713$ 20,332,228$
Grants payable are presented on the statements of financial position under the following captions:
Current liabilities:
Grants payable 12,223,413$ 10,897,500$
Long-term liabilities:
Grants payable, net 9,840,300 9,434,728
Total grants payable 22,063,713$ 20,332,228$
RETIREMENT PLAN
The Foundation has established a simple IRA plan for its eligible employees. Employees of the Foundation are eligible for coverage under this plan after 90 days of service. The Foundation matches up to 3% of each participating employee’s compensation. The expense was $38,672 and$24,025, for the years ended September 30, 2013 and 2012, respectively.
THE V FOUNDATION
NOTES TO FINANCIAL STATEMENTS
22
Page 15 of 18
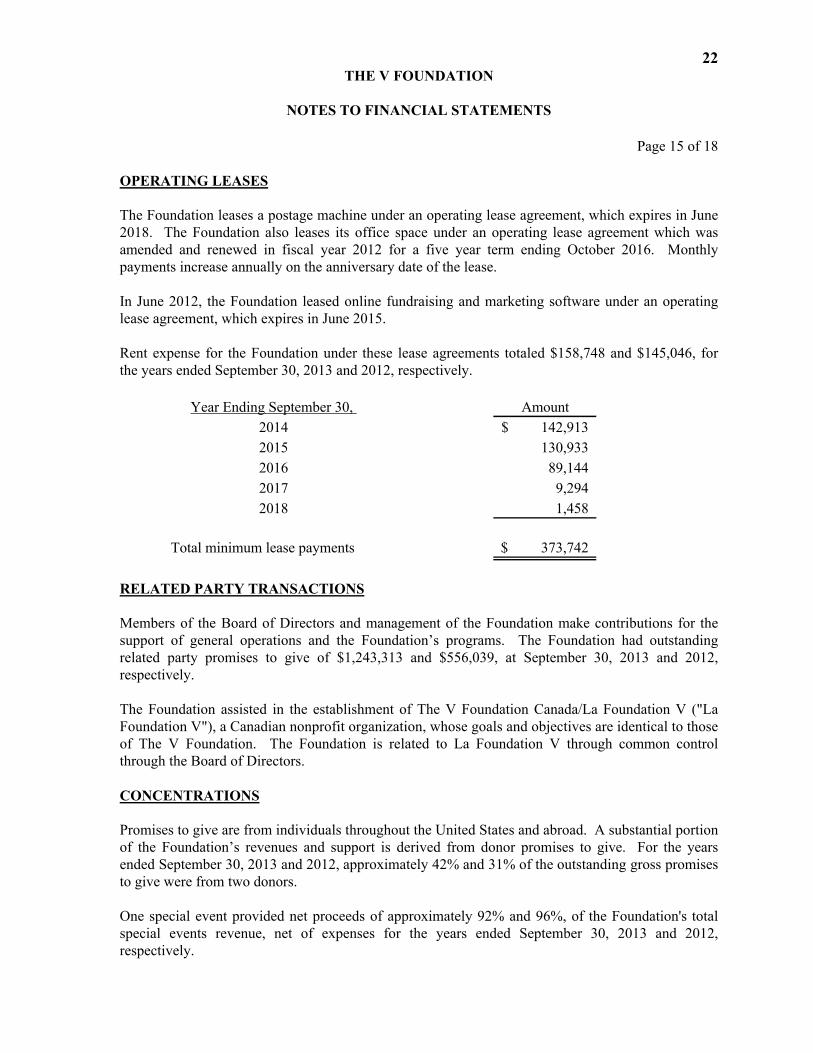
OPERATING LEASES
The Foundation leases a postage machine under an operating lease agreement, which expires in June2018. The Foundation also leases its office space under an operating lease agreement which was amended and renewed in fiscal year 2012 for a five year term ending October 2016. Monthly payments increase annually on the anniversary date of the lease.
In June 2012, the Foundation leased online fundraising and marketing software under an operating lease agreement, which expires in June 2015.
Rent expense for the Foundation under these lease agreements totaled $158,748 and $145,046, for the years ended September 30, 2013 and 2012, respectively.
Year Ending September 30, Amount
2014 142,913$
2015 130,933
2016 89,144
2017 9,294
2018 1,458
Total minimum lease payments 373,742$
RELATED PARTY TRANSACTIONS
Members of the Board of Directors and management of the Foundation make contributions for the support of general operations and the Foundation’s programs. The Foundation had outstanding related party promises to give of $1,243,313 and $556,039, at September 30, 2013 and 2012, respectively.
The Foundation assisted in the establishment of The V Foundation Canada/La Foundation V ("La Foundation V"), a Canadian nonprofit organization, whose goals and objectives are identical to those of The V Foundation. The Foundation is related to La Foundation V through common controlthrough the Board of Directors.
CONCENTRATIONS
Promises to give are from individuals throughout the United States and abroad. A substantial portion of the Foundation’s revenues and support is derived from donor promises to give. For the yearsended September 30, 2013 and 2012, approximately 42% and 31% of the outstanding gross promises to give were from two donors.
One special event provided net proceeds of approximately 92% and 96%, of the Foundation's total special events revenue, net of expenses for the years ended September 30, 2013 and 2012, respectively.

THE V FOUNDATION
NOTES TO FINANCIAL STATEMENTS
23
Page 16 of 18 TEMPORARILY RESTRICTED NET ASSETS Temporarily restricted net assets consist of the following at September 30:
2013 2012Purpose restriction:
General operations 466,038$ 2,443,633$ Gastric Cancer Fund 461,818 364,163 Geno's Cancer Team 191,322 191,322 Ewing's Sarcoma Foundation 85,250 79,694 Richard F. Jones Memorial Fund 65,400 -
Todd Bucher Memorial Fund 26,688 26,688 Garry Betty Foundation 15,769 14,769 Kay Yow Foundation - 63,762
1,312,285 3,184,031 Time restriction:
General 2,620,291 650,695
Total temporarily restricted net assets 3,932,576$ 3,834,726$
PERMANENTLY RESTRICTED NET ASSETS Permanently restricted net assets represent contributions made by donors who have restricted the use of their contributions to provide funding for the V Foundation Endowment Fund (“Fund”). The Fund has been established to provide funding for the operations of the Foundation from the earnings on restricted assets. Permanently restricted net assets totaled $12,117,011 and $15,756,112, at September 30, 2013 and 2012, respectively. TRANSFER OF NET ASSETS During the current year, the Foundation established a board-designated endowment fund. Board designated funds will allow management to use funds to invest in the Foundation's growth and support urgent cancer research needs. The Foundation received permission from donors to transfer $3,785,000 of contributions originally donated to the V Foundation Endowment Fund to the board designated endowment fund. Board designated net assets totaled $5,517,136 at September 30, 2013.

THE V FOUNDATION
NOTES TO FINANCIAL STATEMENTS
24
Page 17 of 18
NET ASSETS RELEASED FROM RESTRICTION
Temporarily restricted net assets were released from donor restrictions by incurring expenses satisfying the restricted purposes or by occurrence of other events specified by donors. The amounts released during the years ended September 30, 2013 and 2012, were as follows:
2013 2012
Purpose restriction:
General operations 3,072,227$ 741,333$
Various cancer programs 645,030 -
Gastric Cancer Foundation 355,604 375,186
Kay Yow Foundation 102,098 1,099,911
Tamar Goodfellow Fund 14,928 156,915
Ewing's Sarcoma Foundation 442 37
4,190,329 2,373,382
Time restriction:
General 1,892,062 407,496
Total temporarily restricted net assets released 6,082,391$ 2,780,878$
DONATED SERVICES
The Foundation recognizes donated services that create or enhance non-financial assets or that require specialized skills, and would typically need to be purchased if not provided by donation. No services meeting these requirements for recognition in the financial statements were received during the years ended September 30, 2013 and 2012. However, a number of persons have donated a significant amount of time and services to the Foundation’s operations.
FUNCTIONAL ALLOCATION OF EXPENSES
The costs of providing various programs and other activities have been summarized on a functional basis in the statement of activities. Accordingly, certain indirect costs have been allocated between the programs and supporting services benefited based on management’s estimates.
INCOME TAXES
Under the statute of limitations, the federal informational returns of the Foundation for the years ended September 30, 2010 through 2013 are subject to examination by the U.S. Internal Revenue Service. Management evaluated tax positions for the years ended September 30, 2010 through 2013, and concluded that there are no uncertain tax positions, and believes there is no income tax effect on the financial statements.
THE V FOUNDATION
NOTES TO FINANCIAL STATEMENTS
25
Page 18 of 18
RECLASSIFICATIONS
Certain reclassifications have been made to the 2012 financial statements in order to conform to the 2013 presentation. Such reclassifications had no effect on net assets.
PRIOR YEAR INFORMATION
The statements of activities and changes in net assets and functional expenses include certain prior-year summarized comparative information in total but not by net asset class and functional category, respectively. Such information does not include sufficient detail to constitute a presentation in conformity with U.S. GAAP. Accordingly, such information should be read in conjunction with the Foundation's financial statements for the year ended September 30, 2012, from which the summarized information was derived.
SUBSEQUENT EVENTS
Management has evaluated subsequent events for recognition or disclosure through February 14, 2014, the date the financial statements were available to be issued. Management did not identify any events that occurred subsequent to year-end that require disclosure in the financial statements.