
The Utilization of Satellite Images to Identify Tree … · PSERC Project Tele-Seminar ... •...
35
PSERC The Utilization of Satellite Images to Identify Tree Endangering Transmission Lines Y. Kobayashi M. S. Moeller G. G. Karady G. T. Heydt R. G. Olsen 3/10/2008 1 PSERC Project Tele-Seminar March 18, 2008
Transcript of The Utilization of Satellite Images to Identify Tree … · PSERC Project Tele-Seminar ... •...

PSERC
The Utilization of Satellite Images toIdentify Tree Endangering
Transmission Lines
Y. Kobayashi M. S. Moeller
G. G. Karady G. T. Heydt
R. G. Olsen
3/10/2008 1
PSERC Project Tele-SeminarMarch 18, 2008
PSERCIntroduction
• Overgrown trees under a transmission lines frequently produce short circuit
• Typical example is 2006 blackout at the Western United State and Canada, which was initiated by an overgrown tree
• Utilities identify a voltage dependent danger zone around the conductors
• The tree trimming is needed when a tree penetrates in the danger zone
3/10/2008 2

PSERCIntroduction
• Danger zone
Taken directly from the Western Area Power Administration web site www.wapa.gov)3/10/2008 3

PSERCIntroduction
• Danger zone
3/10/2008 4

PSERCIntroduction
• Danger zone
3/10/2008 5
• The danger zone dimensions depend on the sag, • This implies that the danger zone is
• wider and • lower
at middle of the span than at the tower

PSERCIntroduction
• The minimum flashover distance is 1 ft for a distribution line and 24 foot for a 500 kV line.
• By drawing circles with the minimum flashover distance around the energized conductors, a danger zone can be determined.
• The height and width of the danger zone depends on the line arrangement and the wind force.
3/10/2008 6
PSERCIntroduction• The conductor swing reduces the distance; consequently the danger zone is calculated using the maximum sag and maximum wind force.
• A tree must be cut or trimmed when it penetrates to this danger zone
• The vegetation management is estimated at 7‐10 billion dollars business annually in the United States alone
3/10/2008 7
PSERCIntroduction
• The present practice is to identify dangerous trees by visual observation from helicopters / airplanes or driving along the right of way
• Such visual inspection is labor intensive and costly
• A common method for the estimation of vegetation height is the analysis of analog and later digitized aerial photos by means of image stereoscopy
• A new technology, based on LiDAR (Light Detection and Ranging) has been developed
3/10/2008 8

PSERCObjective
The objective of this project is:The development of a computerized method that use high resolution multispectral stereo pair of satellite images to identify the location of trees penetrating in the danger zone and endangering transmission line operation.
3/10/2008 9

PSERCObjective
• The concept of the utilization of satellite images for the cited task offers potential improvements over direct visual inspection and airplane based (e.g., LiDAR) technologies:– wide area of coverage– frequent overhead passes– areas with restricted access may be viewed– potentially lower cost because of processing a
large geographical area at one time in an automated workflow.
3/10/2008 10
PSERCConcept of tree identification
3/10/2008 11
• Large trees grow on areas covered by healthy vegetation
• The healthy vegetation can be identified by analyzing the color of the pixels
• Multispectral stereo images contain four bands: red (R), green (G), blue (B), and near infrared (NIR) bands in TIFF format (tagged image file format)
• The reflected signal from healthy vegetation shows a very strong increase of near infrared (NIR) and the red (R) band
PSERCConcept of tree identification
3/10/2008 12
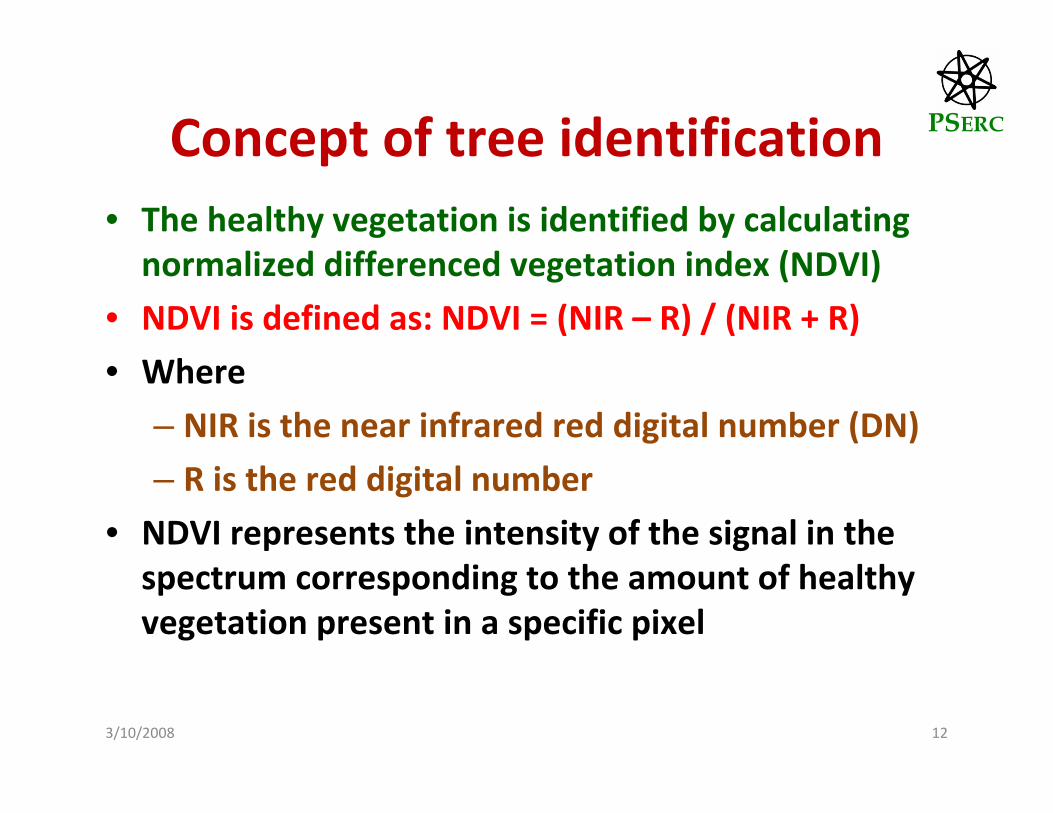
• The healthy vegetation is identified by calculating normalized differenced vegetation index (NDVI)
• NDVI is defined as: NDVI = (NIR – R) / (NIR + R)
• Where
– NIR is the near infrared red digital number (DN)
– R is the red digital number
• NDVI represents the intensity of the signal in the spectrum corresponding to the amount of healthy vegetation present in a specific pixel

PSERCConcept of tree identification
3/10/2008 13
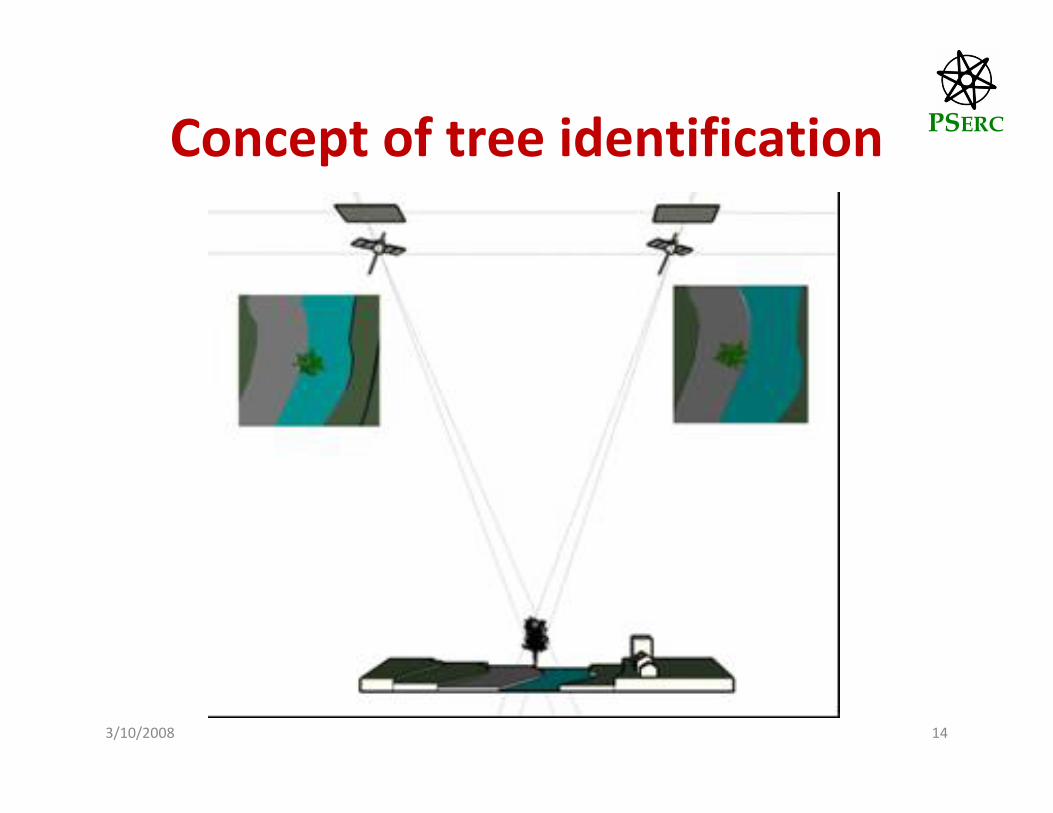
• The tree height determination requires stereo images
• The stereo image obtained by taking two pictures using different camera angle
• Each pixel in the image is described by two images, a stereo pair.
• The matching of the two images results a three dimensional picture of the area, called Digital Surface Model (DSM).
PSERCConcept of tree identification
3/10/2008 14
PSERCSatellite Images
3/10/2008 15
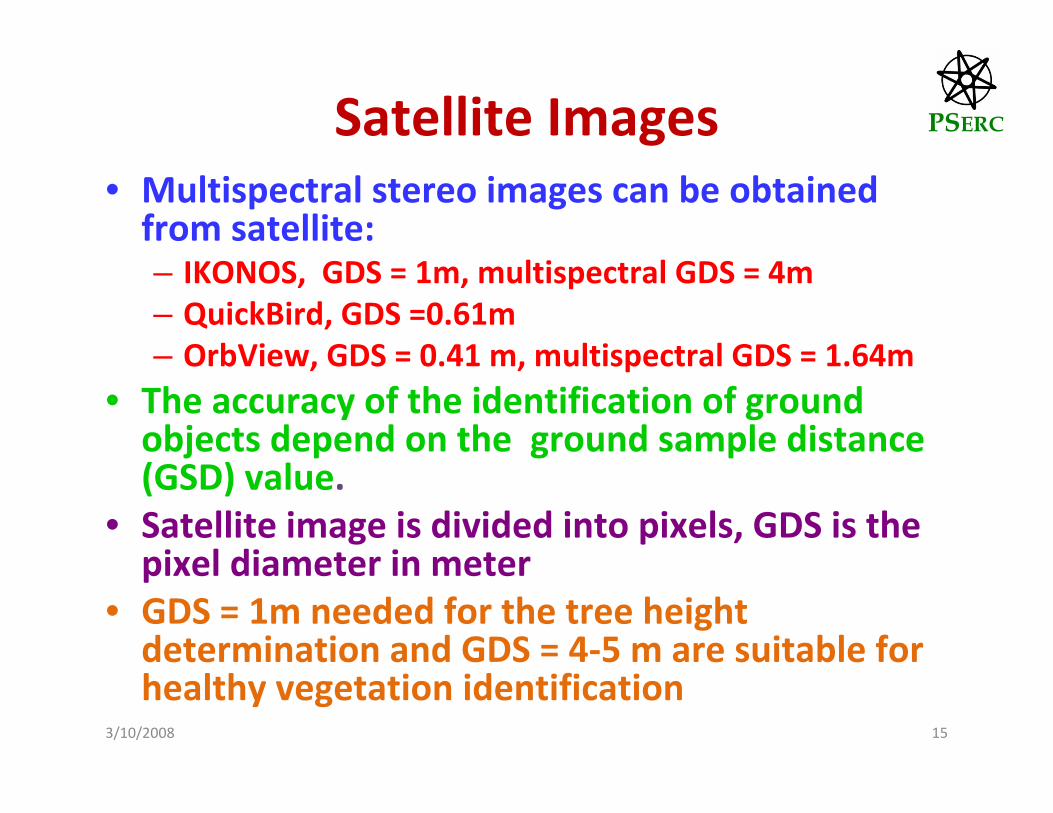
• Multispectral stereo images can be obtained from satellite:– IKONOS, GDS = 1m, multispectral GDS = 4m– QuickBird, GDS =0.61m– OrbView, GDS = 0.41 m, multispectral GDS = 1.64m
• The accuracy of the identification of ground objects depend on the ground sample distance (GSD) value.
• Satellite image is divided into pixels, GDS is the pixel diameter in meter
• GDS = 1m needed for the tree height determination and GDS = 4‐5 m are suitable for healthy vegetation identification

PSERCSoftware Development
3/10/2008 16
• The objective of software development is the determination of the distance between trees and conductors of a transmission line.
• The work is divided into three stages. – The first stage detects areas with healthy vegetation and trees using commercially available multispectral satellite images.
– The second stage is to estimate height of trees or vegetation close to the transmission line
– The third stage integrates the developed two computer tools for a practical code
PSERCSoftware Development
3/10/2008 18
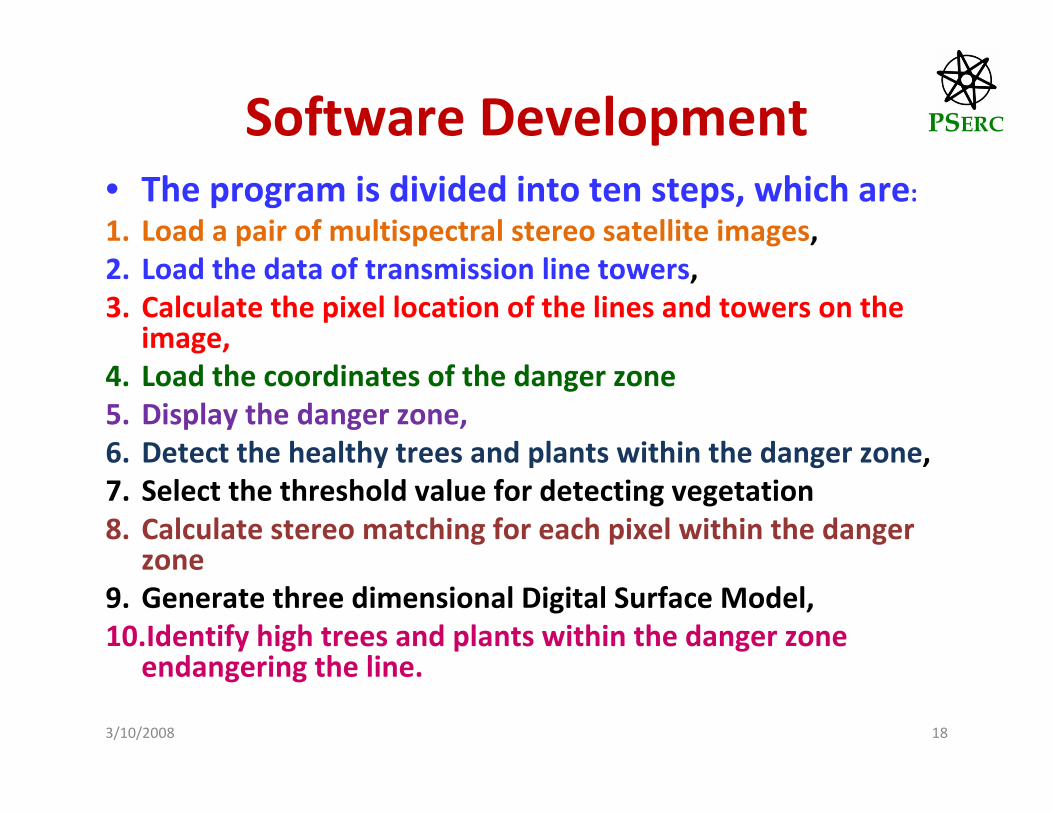
• The program is divided into ten steps, which are:1. Load a pair of multispectral stereo satellite images, 2. Load the data of transmission line towers, 3. Calculate the pixel location of the lines and towers on the
image, 4. Load the coordinates of the danger zone5. Display the danger zone, 6. Detect the healthy trees and plants within the danger zone, 7. Select the threshold value for detecting vegetation8. Calculate stereo matching for each pixel within the danger
zone9. Generate three dimensional Digital Surface Model, 10.Identify high trees and plants within the danger zone
endangering the line.

PSERCSoftware Development
3/10/2008 19
The software is implemented by using: • Java, one of the object‐oriented programming languages
• JAI (Java Advanced Imaging), which is one of Application Programming Interfaces for image processing in Java
• GUI, graphical user interfaces which are intended to interface the user with the actual satellite imagery.
• These programs permit the easy transfer and display of large satellite images through the network and allows the user to asses results

PSERCSoftware Development
3/10/2008 20
The graphical user interface• Main‐panel shows a
satellite image and overlays some results of analysis on it.
• Sub‐panel displays the transmission tower as a small circle and the transmission line as a line.
• Control‐panel gives index numbers which are used to interactively identify land type such as bare land, trees, and buildings.
• Info‐panel displays a table of the list of geographical coordinates of transmission towers
PSERCSoftware Development
3/10/2008 21
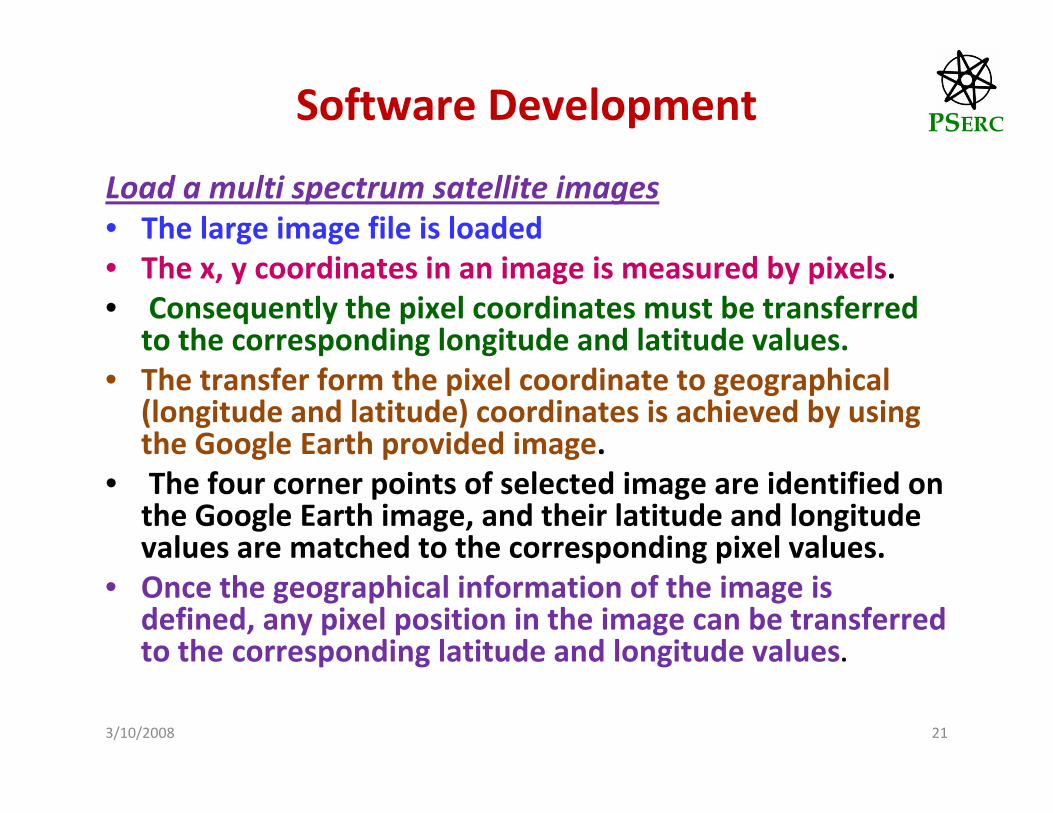
Load a multi spectrum satellite images • The large image file is loaded• The x, y coordinates in an image is measured by pixels.• Consequently the pixel coordinates must be transferred
to the corresponding longitude and latitude values. • The transfer form the pixel coordinate to geographical
(longitude and latitude) coordinates is achieved by using the Google Earth provided image.
• The four corner points of selected image are identified on the Google Earth image, and their latitude and longitude values are matched to the corresponding pixel values.
• Once the geographical information of the image is defined, any pixel position in the image can be transferred to the corresponding latitude and longitude values.

PSERCSoftware Development
3/10/2008 22
• Load the data of transmission line towers – This is a text file contains the latitude and longitude determining the tower location
• Calculate the pixel location of the conductors and towers on the image – The conductor latitude and longitude is expressed in pixels
• Displaying the danger zone– A circle around each tower is drawn using the half width of the danger zone.
– Two lines tangentially touching the circles determine the boundary of danger zone.
– These boundaries are displayed as white lines in the main‐panel
PSERCSoftware Development
3/10/2008 23
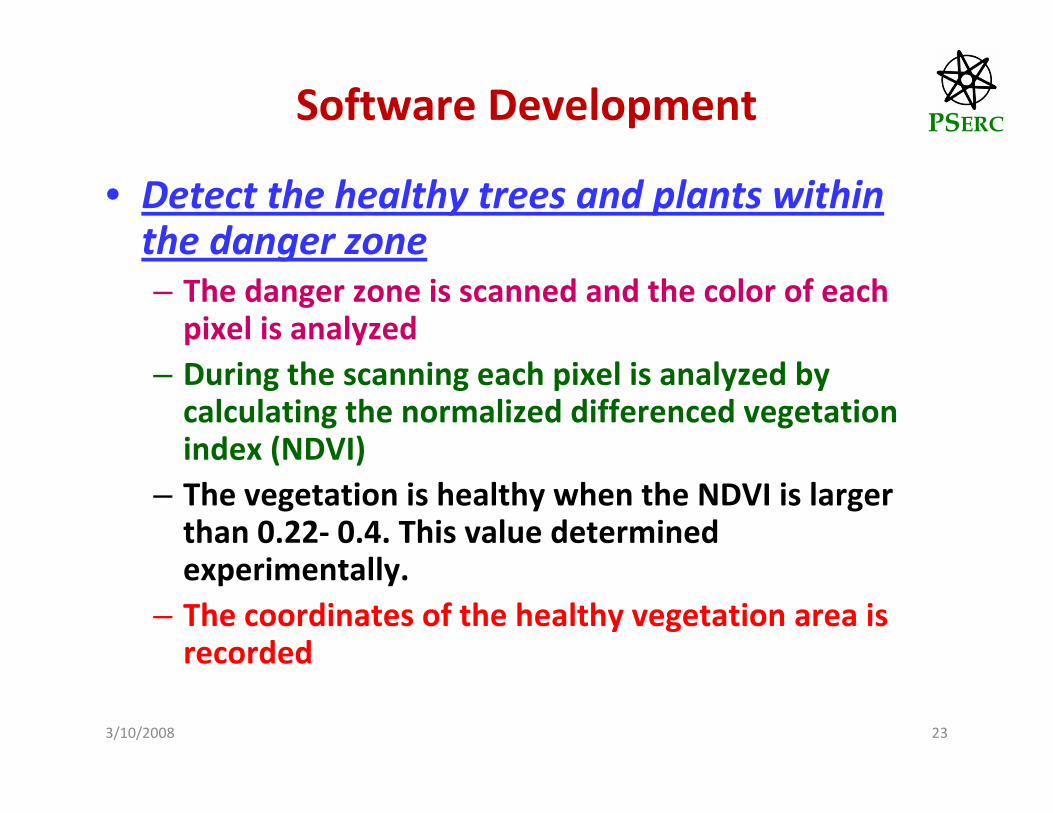
• Detect the healthy trees and plants within the danger zone – The danger zone is scanned and the color of each pixel is analyzed
– During the scanning each pixel is analyzed by calculating the normalized differenced vegetation index (NDVI)
– The vegetation is healthy when the NDVI is larger than 0.22‐ 0.4. This value determined experimentally.
– The coordinates of the healthy vegetation area is recorded

PSERCSoftware Development
3/10/2008 24
• Stereo Matching and DSM generation• The cross‐correlation is calculated as,
• where :– is the cross‐correlation value of the pixel position in the first image andthe pixel position on the second image
– The parameter, , is the template matrix around the position of in the image.
– is the mean value of template matrix ; – is the standard deviation of template matrix .
)*/()*),(*),(()),(),,(( 212122211222111 OOUUjiVjiVjiIjiIC i∑ −=
)),(),,(( 222111 jiIjiIC
),( 22 ji),( 11 ji 1I
2I),( kkk jiV
),( kk ji
kUkO
kVkV
PSERC
drBHh 0=
d
h
BH
0r
),( 11 ji ),( 22 ji
dr0
Software Development
3/10/2008 25
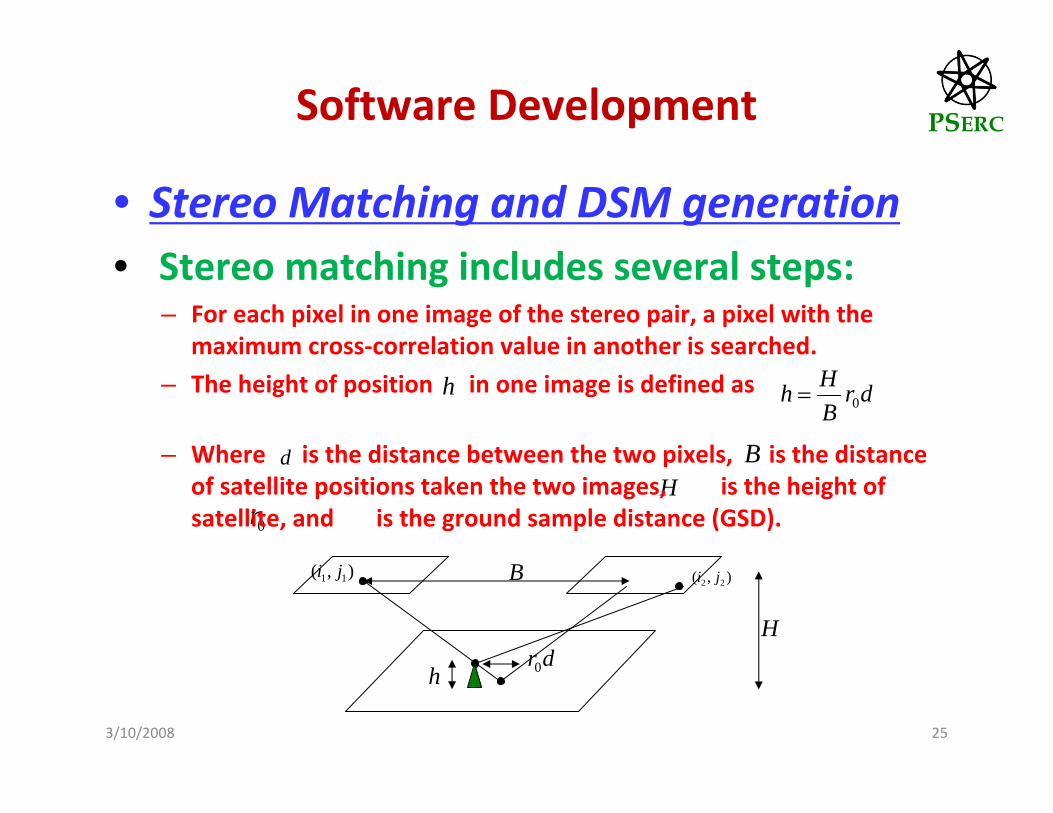
• Stereo Matching and DSM generation• Stereo matching includes several steps:
– For each pixel in one image of the stereo pair, a pixel with themaximum cross‐correlation value in another is searched.
– The height of position in one image is defined as
– Where is the distance between the two pixels, is the distance of satellite positions taken the two images, is the height of satellite, and is the ground sample distance (GSD).
B
H
h

PSERCSoftware Development
3/10/2008 26
• Identify high trees and plants within the danger zone endangering the line
• The distance between the pixels is scaled to define the height of the position by multiplying , where B, H, and r0 are constant.
• Finally, a image providing z value (height) in addition to the x, y coordinate for each pixel is saved as Digital Elevation Model (DEM) image.
0rBH
DEM

PSERCResults and Case Study 1
3/10/2008 27
•The figure illustrates the identification of areas with healthy vegetation
•QuickBird satellite image with a multispectral GDS = 0.61 meter was used
•Location Transmission line in Scottsdale, Arizona.
•The NDVI threshold value is set as 0.12.
•White points identify trees or healthy bushes

PSERCResults and Case Study 2
• Location transmission line in San Diego, California.
• IKONOS satellite images, GDS = 1m• The transmission towers are located in the opposite site of a freeway, and the lines cross it.
• There is a vegetation area in the north of freeway
• Danger zone is marked with the white lines
3/10/2008 28

PSERCResults and Case Study 2
3/10/2008 29
3/10/2008
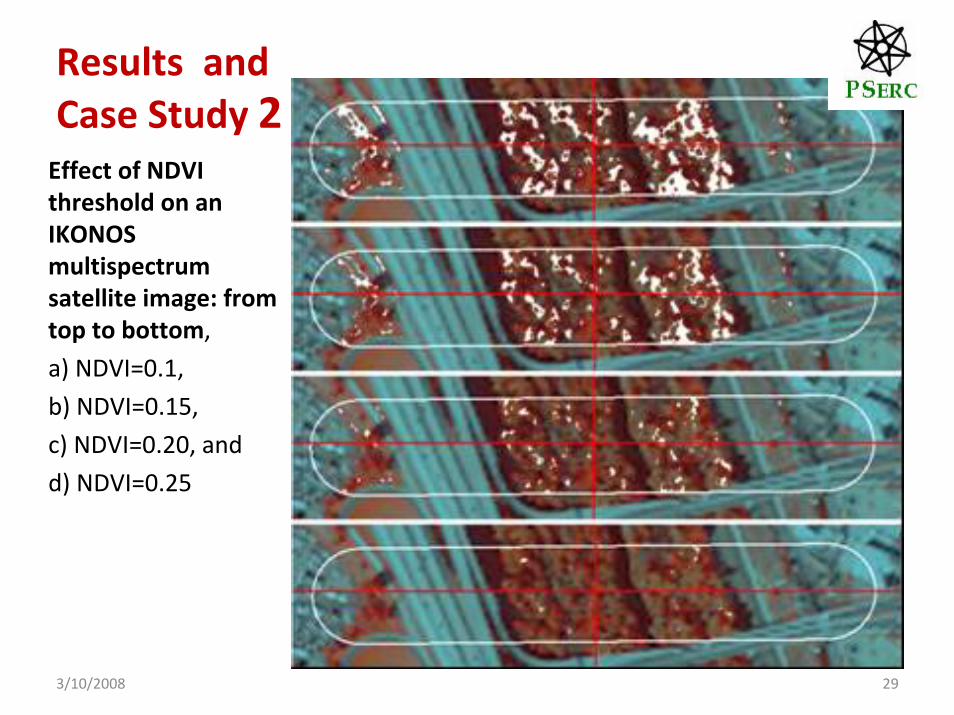
Results and Case Study 2Effect of NDVI threshold on an IKONOS multispectrumsatellite image: from top to bottom,
a) NDVI=0.1,
b) NDVI=0.15,
c) NDVI=0.20, and
d) NDVI=0.25
29
Results and Case Study 2
• After the selection of NDVI = 0.2 threshold value, the program generates a list of trees in the danger zone
• A tree is defined as a set of healthy vegetation pixels
• The list is displayed as a table with the information of latitude, longitude, and the distance to transmission lines for each extracted tree
3/10/2008 30

PSERCResults and Case Study 2
3/10/2008 32
ID Latitude Longitude Distance to Lines
0 32.759251042034705 117.19985426770678 40.78245
1 32.75928400942072 117.1998345690552 42.64533
2 32.75953096171785 117.19973683669522 32.101067
3 32.75918758139942 117.19980425768894 38.711155
4 32.759336868606894 117.1997209176232 42.473488
5 32.759566403240605 117.19962773072264 31.185623
6 32.75927090915831 117.19960498847946 47.045143
7 32.75929827272182 117.19955346662981 48.571705
8 32.759388466048144 117.1994966434048 26.227222
9 32.759457505829374 117.19942315017384 32.37095
10 32.75943572141182 117.19935116877471 32.37095
11 32.75932871661798 117.19931252240548 24.45303
12 32.75923663067426 117.19920341145091 54.78344

PSERCResults and Case Study 2
• NDVI=0.25 is selected and the height of the trees are calculated
• Cross section of the line with the elevation is shown below
3/10/2008 33

PSERCResults and Case Study 2
• Five Closest Trees to transmission lines is extracted from the tree list and marked on the figure .
3/10/2008 34

PSERCResults and Case Study 2
• Data of the Five Closest Trees to transmission lines
3/10/2008 35
ID Latitude Longitude Distance to Lines
26 32.76075890698922 117.19941638180457 24.293316
11 32.75932871661798 117.19931252240548 24.45303
8 32.759388466048144 117.1994966434048 26.227222
21 32.760715993703116 117.19948305684636 29.145893
40 32.76071223314489 117.1993065149341 30.106556
PSERCConclusion• An innovative new computerized method has been
developed to identify dangerous trees and plants on transmission rights of way using of multispectral stereo pair of satellite images
• The multispectral images of the right of way are scaned and the color of each pixel is analyzed. This identifies areas where healthy vegetation, which may contain trees endangering the line.
• Using the multispectral stereo images the height of each pixel is determined and the distance from the conductor is calculated
• When this distance is less than the danger zone surrounding the conductors, the identified object or tree endangers the line.
• Case studies using satellite images in the vicinity of Scottsdale, AZ and San Diego, CA demonstrate d the feasibility of the proposed method.
3/10/2008 36


![PSERC Webinar - September 27, 2011 · Results PSERC Webinar –September 27, 2011 10 . PSERC Webinar – September 27, 2011 11 Vehicle class c B c [kWh] Max Min 1 12 8 2 14 10 3 21](https://static.fdocuments.net/doc/165x107/5f55e17bc0a96a097e326b5e/pserc-webinar-september-27-2011-results-pserc-webinar-aseptember-27-2011-10.jpg)


