THE USER-REPORTED CRITICAL INCIDENT METHOD FOR … · 2020-01-22 · THE USER-REPORTED CRITICAL...
159
THE USER-REPORTED CRITICAL INCIDENT METHOD FOR REMOTE USABILITY EVALUATION By José C. Castillo Thesis Submitted to the Faculty of the Virginia Polytechnic Institute and State University in Partial Fulfillment of the Requirements for the Degree of Master of Science In Computer Science H. Rex Hartson, Chair Deborah Hix Mary Beth Rosson Robert C. Williges July, 1997 Blacksburg, Virginia Keywords: Remote Usability Evaluation, Usability Method, Critical Incidents, User-Initiated, User-Reported, Usability Data, Post Deployment Copyright 1997, José C. Castillo
Transcript of THE USER-REPORTED CRITICAL INCIDENT METHOD FOR … · 2020-01-22 · THE USER-REPORTED CRITICAL...

THE USER-REPORTEDCRITICAL INCIDENT METHOD
FOR REMOTE USABILITY EVALUATION
By
José C. Castillo
Thesis Submitted to the Faculty of theVirginia Polytechnic Institute and State University
in Partial Fulfillment of the Requirements for the Degree of
Master of ScienceIn
Computer Science
H. Rex Hartson, ChairDeborah Hix
Mary Beth RossonRobert C. Williges
July, 1997Blacksburg, Virginia
Keywords: Remote Usability Evaluation, Usability Method, Critical Incidents,User-Initiated, User-Reported, Usability Data, Post Deployment
Copyright 1997, José C. Castillo

THE USER-REPORTEDCRITICAL INCIDENT METHOD
FOR REMOTE USABILITY EVALUATIONby
José C. Castillo
(ABSTRACT)
Much traditional user interface evaluation is conducted in usability laboratories, where a smallnumber of selected users is directly observed by trained evaluators. However, as the networkitself and the remote work setting have become intrinsic parts of usage patterns, evaluators oftenhave limited access to representative users for usability evaluation in the laboratory and theusers’ work context is difficult or impossible to reproduce in a laboratory setting. These barriersto usability evaluation led to extending the concept of usability evaluation beyond the laboratory,typically using the network itself as a bridge to take interface evaluation to a broad range of usersin their natural work settings. The over-arching goal of this work is to develop and evaluate acost-effective remote usability evaluation method for real-world applications used by real usersdoing real tasks in real work environments. This thesis reports the development of such amethod, and the results of a study to:
• investigate feasibility and effectiveness of involving users with to identify and reportcritical incidents in usage,
• investigate feasibility and effectiveness of transforming remotely-gathered criticalincidents into usability problem descriptions, and
• gain insight into various parameters associated with the method.
DEDICATION
To my family, whose unconditional love and supportinspire me and keep me reaching for higher stars.
“¡Los quiero mucho!”
ACKNOWLEDGMENTS
I would like to thank my advisor and role model, Dr. H. Rex Hartson for his guidance throughoutmy graduate work, and Rieky Keeris for her caring and effort in ensuring I always had enough“research fuel” to keep on going with my work. Their sincerity, love, and friendship areinvaluable and I feel proud to be considered their “adopted son”. Dr. Deborah Hix, leadingmember of the “thesis demolition team”, kept my work focused and I thank her for her guidanceand devotion. I would also like to thank the other members of my committee, Dr. Mary BethRosson and Dr. Robert C. Williges, who have been helpful and supportive, and contributedgreatly to this document.
Many other people have contributed to the completion of this work, and I am happy to have anopportunity to thank them: John Kelso, who has worked in the remote evaluation project sincewe started, for being supportive and for being patient when things went wrong in the usabilitylab; Pawan Vora, for his help in revising the thesis and contributing to this document;Jürgen Koeneman, Jim Eales, Ray Reaux, Dennis Neale, Mike McGee, Jonathan Kies,Brian Amento, Joe Riess, Winfield Heagy, and other members of the HCI group, for their adviceand their help with my study; Dr. Wolfgang Dzida, for his assistance and for providing us withthe ERGOguide; Don Hameluck at IBM in Toronto, for his interest in collaborating with ourproject and providing us with UCDCam; Lúcio C. Tinoco, for being a good friend and for lettingme use his QUIZIT project in my research; all the people who participated as “subjects” for mythesis experiment, for their help and time; the secretaries of the Computer Science department,Tammi Johnston, Sharon Donahue, and Jessie Eaves, for giving me that smile that always keptmy days shining; my good friend Mourad Fahim, who saw me through my graduate years andwas always there for me, “muchas gracias, amigo”; Linda van Rens, my loyal lab partner, forsupporting me at all times and for your contributions to this document; and everyone else whosupported me and wondered why I was still in school, now you are holding the reason in yourhands.
Special thanks also go to my cousins from Floyd County, Benito and Irma Pastrana, for their loveand affection, and for accepting me as another son. To my family — Pepe, Dalila, Chelo, andRafi — who always believed in me… we made it! And to God, who blessed me with such agreat family… without You my victories are failures!

TABLE OF CONTENTS
LIST OF FIGURES .....................................................................................................................................................I
LIST OF TABLES....................................................................................................................................................IV
CHAPTER 1: INTRODUCTION...............................................................................................................................11.1 Problem statement .............................................................................................................................................1
1.2 Relevance of critical incident data ....................................................................................................................2
1.3 Research goals ..................................................................................................................................................2
1.3.1 Overall goal of the project..........................................................................................................................2
1.3.2 Steps and objectives ...................................................................................................................................2
1.4 Contribution of research....................................................................................................................................5
1.5 Overview of thesis .............................................................................................................................................6
CHAPTER 2: RELATED WORK .............................................................................................................................72.1 Traditional laboratory-based usability evaluation .............................................................................................7
2.2 The critical incident technique ..........................................................................................................................8
2.2.1 Definition of a critical incident ..................................................................................................................8
2.2.2 Origins of the critical incident technique ...................................................................................................8
2.2.3 Relevance of critical incident data .............................................................................................................8
2.2.4 Flanagan’s original critical incident technique ...........................................................................................9
2.2.5 Variations of the critical incident technique .............................................................................................10
2.2.6 Software tools to help identify critical incidents ......................................................................................12
2.2.7 Adaptation of the critical incident technique in this study .......................................................................14
2.3 Minimalist training ..........................................................................................................................................15
2.3.1 Need for critical incident training ............................................................................................................15
2.3.2 Using the minimalist approach to instructional design .............................................................................15
2.3.3 Principles for minimalist training .............................................................................................................15
CHAPTER 3: REMOTE USABILITY EVALUATION ........................................................................................173.1 Definition ........................................................................................................................................................17
3.2 Types of remote evaluation methods...............................................................................................................18
3.2.1 Remote questionnaire or survey ...............................................................................................................18
3.2.2 Live or collaborative remote evaluation ...................................................................................................18
3.2.3 Instrumented or automated data collection for remote evaluation............................................................19
3.2.4 User-reported critical incident method .....................................................................................................20
3.2.5 Commercial usability services ..................................................................................................................20
3.3 Classification of remote evaluation methods ...................................................................................................21
3.3.1 Types of users involved ............................................................................................................................22
3.3.2 Time and user location .............................................................................................................................22
3.3.3 Person who identifies critical incidents and problems during task performance ......................................24
3.3.4 Type of tasks and level of interaction during remote evaluation ..............................................................25

3.3.5 Types of data gathered .............................................................................................................................26
3.3.6 Type of equipment used and quantity of data gathered ............................................................................27
3.3.7 Cost to collect and analyze data ...............................................................................................................28
CHAPTER 4: THE USER-REPORTED CRITICAL INCIDENT METHOD .....................................................314.1 Overview of method ........................................................................................................................................31
4.2 Evolution of method........................................................................................................................................31
4.3 Relevance of critical incident information ......................................................................................................31
4.4 Relevance of user training ...............................................................................................................................32
4.5 The method .....................................................................................................................................................33
4.5.1 Description ...............................................................................................................................................33
4.5.2 Comparison with laboratory-based usability evaluation ...........................................................................33
4.5.3 Critical incident reporting tool .................................................................................................................34
4.5.4 Contextual factors for critical incident reports .........................................................................................35
4.5.5 Screen-sequence video clips and timing aspects ......................................................................................36
4.6 Possible applications of method ......................................................................................................................37
4.6.1 Early formative evaluation .......................................................................................................................37
4.6.2 Alpha, beta, and other field usability evaluation ......................................................................................37
4.6.3 Usability evaluation after software deployment .......................................................................................37
4.6.4 Customer support .....................................................................................................................................37
4.6.5 Marketing strategies .................................................................................................................................38
CHAPTER 5: FEASIBILITY CASE STUDY .........................................................................................................395.1 Goals of the case study....................................................................................................................................39
5.2 Questions addressed by the case study ............................................................................................................39
5.3 Steps of the case study ....................................................................................................................................40
5.4 Using videotapes as input to expert-subjects ..................................................................................................40
5.5 Reporting critical incidents .............................................................................................................................41
5.6 Critical incident contexts .................................................................................................................................41
5.7 Results, discussion, lessons learned ................................................................................................................42
CHAPTER 6: EXPLORATORY STUDY OF METHOD......................................................................................446.1 Goal and objectives .........................................................................................................................................44
6.2 Pilot study .......................................................................................................................................................44
6.3 Phase I: Critical incident gathering .................................................................................................................44
6.3.1 Participants ...............................................................................................................................................44
6.3.2 Location ...................................................................................................................................................45
6.3.3 Equipment ................................................................................................................................................45
6.3.4 Protocol....................................................................................................................................................51
6.3.5 Data collection .........................................................................................................................................55
6.3.6 Data analysis ............................................................................................................................................57
6.4 Phase II: Transformation of critical incident data into usability problem descriptions ..................................58
6.4.1 Participants ...............................................................................................................................................58

6.4.2 Location, equipment, and materials ..........................................................................................................58
6.4.3 Protocol and data collection.....................................................................................................................59
6.4.4 Data analysis ............................................................................................................................................59
CHAPTER 7: EXPECTATIONS, DISCUSSION, LESSONS LEARNED ...........................................................607.1 User-related research question: Can users report their own critical incidents and how well can they
do it? ...............................................................................................................................................................60
7.1.1 Issues about user-subject performance in identifying and reporting critical incidents .............................61
7.1.2 Subjective data about user-subject perceptions, preferences, and attitudes towards remotely-reporting critical incidents ........................................................................................................................76
7.2 Evaluator-related research question: Can evaluators use critical incident data to produce usabilityproblem descriptions and how well can they do it? .........................................................................................82
7.2.1 Ability of evaluator-subjects to analyze critical incident data ..................................................................82
7.2.2 Role of textual reports in data analysis .....................................................................................................83
7.2.3 Role of video in data analysis ...................................................................................................................84
7.2.4 Role of audio in data analysis ...................................................................................................................85
7.2.5 Time and effort required to analyze critical incident data ........................................................................86
7.2.6 Level of agreement with user-subject critical incident severity ratings ....................................................86
7.3 Method- and study-related research question: What are the variables and values that make themethod work best? ..........................................................................................................................................86
7.3.1 Preferred location for the critical incident reporting tool .........................................................................87
7.3.2 Using the Remote Evaluation Report window .........................................................................................89
7.3.3 Role of training in reporting critical incidents ..........................................................................................91
7.3.4 Verbal protocol issues ..............................................................................................................................95
7.3.5 Role of audio in reporting critical incidents .............................................................................................96
7.3.6 Role of video in the study ........................................................................................................................97
7.3.7 Storing and communicating critical incident data ....................................................................................98
7.3.8 Issues relating to the proximity of a critical incident and its cause ..........................................................98
7.4 Summary of results and lessons learned ..........................................................................................................98
CHAPTER 8: SUMMARY .....................................................................................................................................1008.1 Background...................................................................................................................................................100
8.2 Definition of remote usability evaluation ......................................................................................................100
8.3 Goal of this work...........................................................................................................................................101
8.4 Approach.......................................................................................................................................................101
8.5 Description of the user-reported critical incident method .............................................................................102
8.6 Exploratory study..........................................................................................................................................102
8.6.1 Objectives ..............................................................................................................................................102
8.6.2 Design, results, and lessons learned .......................................................................................................103
8.7 Remote versus local usability evaluation ......................................................................................................104
CHAPTER 9: FUTURE WORK ............................................................................................................................1069.1 Refining the method ......................................................................................................................................106
9.1.1 Role of video for contextual data in critical incident reports .................................................................106

9.1.2 Evaluating the new video clip trigger redesign ......................................................................................106
9.1.3 Determining the optimal length and starting point for a critical incident video clip .............................107
9.1.4 Critical incident training .........................................................................................................................107
9.1.5 Real users doing real tasks at their normal working environment ..........................................................108
9.1.6 Comparison of verbal and textual critical incident reporting .................................................................108
9.2 Comparisons with other methods ..................................................................................................................109
9.2.1 Comparison of the user-reported critical incident method with other remote evaluationtechniques...............................................................................................................................................109
9.2.2 Comparison of the user-reported critical incident method with traditional laboratory-basedusability evaluation ................................................................................................................................109
9.3 Further future work.......................................................................................................................................109
9.3.1 The user-reported critical incident method in the software life cycle .....................................................109
9.3.2 Usability Problem Classifier ..................................................................................................................110
9.3.3 Severity rating ........................................................................................................................................110
REFERENCES.........................................................................................................................................................112
APPENDICES ..........................................................................................................................................................115Appendix A: INFORMED Consent Forms ............................................................................................................115
A.1 Informed consent form for user-subjects ................................................................................................115
A.2 Informed consent form for evaluator-subjects ........................................................................................117
Appendix B: TASK-related documents .................................................................................................................119
B.1 Search tasks for user-subjects.................................................................................................................119
B.2 Participant answer sheet .........................................................................................................................119
Appendix C: QUESTIONNAIRES .......................................................................................................................120
C.1 Background questionnaire for user-subjects...........................................................................................120
C.2 Post-test questionnaire #1 for user-subjects ...........................................................................................121
C.3 Post-test questionnaire #2 for user-subjects ...........................................................................................122
C.4 Post-test questionnaire for evaluator-subjects who only analyzed critical incident reports ....................123
C.5 Post-test questionnaire for evaluator-subjects who analyzed both video clips and criticalincident reports.......................................................................................................................................124
Appendix D: SCRIPT of training videotape ..........................................................................................................125
D.1 Introduction............................................................................................................................................125
D.2 Deleting a document from a database ....................................................................................................125
D.3 Counting the number of penalties called on your favorite football team ................................................128
D.4 Formatting and labeling a diskette in Microsoft DOS format ................................................................129
D.5 Changing the Auto-save parameter of Microsoft Word to 1 ½ or 1.5 minutes.......................................130
VITA .........................................................................................................................................................................132

i
LIST OF FIGURES
Figure 1-1. Overview of the user-reported critical incident method .............................................................................5
Figure 2-1. Scenario of a typical laboratory-based usability evaluation session ...........................................................7
Figure 2-2. Four major principles and heuristics for designing minimalist instruction (van der Meij andCarroll, 1995) .........................................................................................................................................16
Figure 3-1. Scenario of a remote usability evaluation session ....................................................................................17
Figure 3-2. Characterization of types of users typically involved in remote evaluation .............................................22
Figure 3-3. Characterization of user location and time of evaluation .........................................................................23
Figure 3-4. Characterization of person who identifies and/or reports critical incidents and/or usabilityproblems during task performance .........................................................................................................24
Figure 3-5. Characterization of types of tasks performed by users and level of interaction between usersand evaluators during usability evaluation .............................................................................................25
Figure 3-6. Equipment required to collect data and quantity of data gathered by each remote evaluationmethod....................................................................................................................................................27
Figure 3-7. Relative costs to collect and analyze data ................................................................................................28
Figure 3-8. Quality of usability data by remote evaluation method ............................................................................29
Figure 4-1. Overview of process for improving interaction design .............................................................................32
Figure 4-2. Configuration for traditional laboratory-based usability evaluation .........................................................33
Figure 4-3. Setup for the user-reported critical incident method ................................................................................34
Figure 6-1. Equipment used for Phase I ......................................................................................................................45
Figure 6-2. User interface of main search page of the Internet Movie Database ........................................................46
Figure 6-4. Welcome window for remote evaluation study ........................................................................................48
Figure 6-5. User-subject selecting his name from the list (fictitious list here) ...........................................................48
Figure 6-6. Critical Incident Instructions window.......................................................................................................49
Figure 6-7. Remote Evaluation Control window.........................................................................................................49
Figure 6-8. Positioning of the Remote Evaluation Control window and the application window ..............................50
Figure 6-9. Snapshot of a user while performing the experimental tasks ...................................................................50
Figure 6-10. Remote Evaluation Report window........................................................................................................50
Figure 6-11. Positioning of the Remote Evaluation Report window and the application window .............................51
Figure 6-12. Critical incident found on a Web-based counter ....................................................................................53
Figure 6-13. Providing anonymity for user-subject critical incident reports ...............................................................55
Figure 6-14. Indication of user task and description of the critical incident ...............................................................56
Figure 6-15. Indication of how user got out of the situation, ability to recover and reproduce the criticalincident, and severity of the critical incident. .........................................................................................56
Figure 6-16. Suggestions for fixing the problem and location of the page with critical incident ...............................57
Figure 6-17. Critical incident report from User #X ....................................................................................................58
ii
Figure 7-1. Number of critical incidents reported by all 24 user-subjects ..................................................................61
Figure 7-2. Number of critical incidents identified by user-subjects and experimenter .............................................62
Figure 7-3. Number of critical incidents reported by user-subjects ............................................................................62
Figure 7-4. Number of critical incidents missed by user-subjects ..............................................................................63
Figure 7-5. Most critical incident reports were sent after task completion .................................................................66
Figure 7-6. Average delay in reporting after clear onset of critical incidents ............................................................67
Figure 7-7. New critical incident reporting tool ..........................................................................................................68
Figure 7-8. Average typing time for critical incident reports ......................................................................................69
Figure 7-9. Average typing time by instant of occurrence (during or after task performance) ..................................70
Figure 7-10. Average typing time by severity ranking ................................................................................................71
Figure 7-11. User-subject severity ratings compared to the experimenter’s rating ....................................................72
Figure 7-12. Indication from user-subjects that assigning severity ratings to critical incidents was easy todo............................................................................................................................................................72
Figure 7-13. Characterization of user-assigned severity ratings by severity ranking ..................................................73
Figure 7-14. Number of reported critical incidents by severity ranking .....................................................................75
Figure 7-15. Distribution by severity ranking of the critical incidents reported only by experimenter ......................75
Figure 7-16. User-subject indication of their desire as normal users to report critical incidents duringtask performance to evaluators ...............................................................................................................76
Figure 7-17. User-subjects generally did not prefer reporting critical incidents anonymously ...................................77
Figure 7-18. User-subject preference for receiving feedback from evaluators ...........................................................77
Figure 7-19. Expected time span for receiving feedback from evaluators, as indicated by user subjects ..................78
Figure 7-20. User-subject preference for being informed by evaluators of the progress in solving theproblem reported ....................................................................................................................................78
Figure 7-21. User-subject indication that identifying and reporting critical incidents did not interferewith task performance ............................................................................................................................80
Figure 7-22. User-subject preference for reporting negative critical incidents ...........................................................81
Figure 7-23. User-subject preference for reporting positive critical incidents ............................................................81
Figure 7-24. User-subject preference of being able to click on a Report Incident button to report criticalincidents during task performance to evaluators .....................................................................................87
Figure 7-25. User-subject preference for placing the critical incident reporting tool built into theapplication ..............................................................................................................................................88
Figure 7-26. User-subject preference for placing the critical incident reporting tool in a window separatefrom the application ................................................................................................................................88
Figure 7-27. Default buttons for manipulating windows in Windows95™ .................................................................89
Figure 7-28. User-subject indication that it was easy to report critical incidents using the RemoteEvaluation Report window.....................................................................................................................90
Figure 7-29. Number of critical incidents reported by user-subject of each group .....................................................91
Figure 7-30. Effect of training in reporting critical incidents ......................................................................................92

iii
Figure 7-31. User-subjects liked the idea of practicing, in training, both identification and reporting acritical incident with the same application being evaluated ....................................................................93
Figure 7-32. User-subject indication that the training helped them learn to recognize critical incidents ...................93
Figure 7-33. Indication from user-subjects that the training provided enough information ........................................94
Figure 7-34. User-subject indication that the training was easy to follow ..................................................................94
Figure 7-35. User-subject preference for reporting critical incidents verbally ............................................................96

iv
LIST OF TABLES
Table 3-1. Types of data gathered by each remote evaluation method .......................................................................26
Table 6-1. Structure of critical incident training .........................................................................................................52
Table 7-1. Objectives and research questions of the study .........................................................................................60
Table 7-2. Ranking of critical incident importance to fix ...........................................................................................74
José C. Castillo
1
CHAPTER 1:
INTRODUCTION
1.1 PROBLEM STATEMENT
Although existing lab-based formative evaluation is frequently and effectively applied toimproving usability of software user interfaces, it has limitations. Project teams want higherquality, more relevant, usability data – more representative of real world usage. The ever-increasing incidence of users at remote and distributed locations (often on the network) precludesdirect observation of usage. Further, transporting users or developers to remote locations can bevery costly. As the network itself and the remote work setting have become intrinsic parts ofusage patterns, the users’ work context is difficult or impossible to reproduce in a laboratorysetting. These barriers led to extending usability evaluation beyond the laboratory to the conceptof remote usability evaluation *, typically using the network itself as a bridge to take interfaceevaluation to a broad range of users in their natural work settings.
Perhaps the most significant impetus for remote usability evaluation methods, however, is theneed for a project team to continue formative evaluation downstream, after implementation anddeployment. Most software applications have a life cycle extending well beyond the first release.The need for usability improvement does not end with deployment, and neither does the value oflab-based usability evaluation, although it does remain limited to tasks that developers believe torepresent real usage. Fortunately, deployment of an application creates an additional source ofreal-usage usability data. However, these post deployment usage data are not available to becaptured locally in the usability lab. Thus, the need arises for a remote capture method.
In this regard, post-deployment evaluation often brings to mind alpha and beta testing, but thesekinds of testing usually do not qualify as formative usability evaluation. Typical alpha and betatesting in the field (Nielsen, 1993; Rubin, 1994) is accomplished by asking users to givefeedback in reporting problems encountered and commenting on what they think about asoftware application. This kind of post hoc data (e.g., from questionnaires and surveys) is usefulin determining user satisfaction and overall impressions of the software. It is not, however,detailed data observed during usage and associated closely with specific task performance – thekind of data required for formative usability evaluation.
* The term “usability testing” is often used to refer to the evaluation of the user interaction design of an application.However, users might misinterpret this term and think that they are being evaluated and not the application.For that reason, this study uses instead the term “usability evaluation”.
José C. Castillo Chapter 1: Introduction
2
1.2 RELEVANCE OF CRITICAL INCIDENT DATA
This detailed data, perishable if not captured immediately and precisely as it arises during usage,is essential for isolating specific usability problems within the user interaction design. This isexactly the kind of data one obtains from the usability lab, in the form of particular criticalincident data and usability problem descriptions. In real world task performance, users areperhaps in the best position to recognize critical incidents caused by usability problems anddesign flaws in the user interface. Critical incident identification is arguably the single mostimportant kind of information associated with task performance in a usability-oriented context.
1.3 RESEARCH GOALS
1.3.1 Overall goal of the project
Because of this vital importance of critical incident data and the opportunity for users to captureit, the over-arching goal of this work is to develop and evaluate a remote usability evaluationmethod for capturing critical incident data and satisfying the following criteria:
• tasks are performed by real users,• users are located in normal working environments,• users self-report own critical incidents,• data are captured in day-to-day task situations,• no direct interaction is needed between user and evaluator during an evaluation session,• data capture is cost-effective, and• data are high quality and therefore relatively easy to convert into usability problems.
Several methods have been developed for conducting usability evaluation without directobservation of a user by an evaluator (see Section 3.2 entitled “Types of remote evaluationmethods”). However, none of these existing remote evaluation methods (nor even traditionallaboratory-based evaluation) meets all the above criteria. The result of working toward this goalis the user-reported critical incident method, described in this thesis.
1.3.2 Steps and objectives
The over-all goal of developing and evaluating a new method for remote usability evaluation iscomprised of several steps, each representing a substantial project on its own:
1. feasibility case study to explore relevant issues, develop the operative research questions;
2. development of the user-reported critical incident method;
3. extensive exploratory study of the method to gain understanding and insight about themethod;

José C. Castillo Chapter 1: Introduction
3
4. controlled laboratory-based experiments validating research hypotheses; and
5. field studies conducted in real work environments, accounting for work context factors(e.g., noise, interruptions, multi-thread task performance).
Steps 1, 2, and 3 comprise the work completed for this thesis. The first step, the case studydescribed in Chapter 5, was reported in Hartson, Castillo, Kelso, Kamler, and Neale (1996),where the method was called semi-instrumented critical incident gathering. The objective of thisstep was to judge feasibility of the method. Based on the insights gained from the case study, inthe second step a new method for conducting remote usability evaluation was developed calledthe user-reported critical incident method. Step 3 is an in-depth exploratory study reported inChapters 4, 6, and 7.
Step 4 is a formal study to compare the effectiveness in producing usability problem descriptionsof the user-reported critical incident method for remote evaluation to traditional usabilitylaboratory-based evaluation. Originally, there was hope to include at least part of step 4 in thisthesis work, but it became clear, as work progressed, that steps 1, 2, and 3 each constituted a fullproject in their own right, and, thus, steps 4 and 5 are reserved for future work.
The exploratory study in step 3 was performed to gain insight and understanding (under practicalconstraints) about the strengths and weaknesses of the method. Since step 3 is the primary focusof this thesis work, it deserves a more detailed discussion here. In particular, the objectives were:
Objective 1: Investigate feasibility and effectiveness of employing users to identify andreport their own critical incidents during usage.
Objective 2: Investigate feasibility and effectiveness of transforming remotely gatheredcritical incident data into usability problem descriptions.
Objective 3 Gain insight into various parameters associated with the user-reported criticalincident method.
Each of these objectives, respectively, maps to a research question of the study, discussed indetail in Chapter 7.
Objective 1 translates to the following research question: Can users report their own criticalincidents and how well can they do it? In this study, Objective 1 is divided into the followingsub-objectives:
1. Explore issues about user-subject performance in identifying and reporting criticalincidents:
• User-subject ability to identify and report critical incidents during taskperformance
• User-subject activity sequencing and timing in reporting critical incidents• Level of time and effort required to report critical incidents

José C. Castillo Chapter 1: Introduction
4
• User-subject ability to rate severity of critical incidents• User-subject ability to identify high severity critical incidents as well as low and
medium severity critical incidents
2. Obtain subjective data about user-subject perceptions, preferences, and attitudes towardsremotely-reporting critical incidents:
• User-subject attitudes towards remotely-reporting critical incidents• User-subject preferences with respect to reporting critical incidents anonymously• User-subject perceptions with respect to interference with user tasks• User-subject preferences relating to reporting negative and positive critical
incidents
Objective 2 translates to the following research question: Can evaluators use critical incident datato produce usability problem descriptions and how well can they do it? In this study, Objective 2is divided into the following sub-objectives:
• Ability of evaluator-subjects to analyze critical incident data• Role of textual reports in data analysis• Role of video in data analysis• Role of audio in data analysis• Time and effort required to analyze critical incident data• Level of agreement with user-subject critical incident severity ratings
Objective 3 translates to the following research question: What are the variables and values thatmake the method work best? In this study, Objective 3 is divided into the followingsub-objectives:
• Preferred location for the critical incident reporting tool• Using the Remote Evaluation Report window• Role of training in reporting critical incidents• Verbal protocol issues• Role of audio in reporting critical incidents• Role of video in the study• Packaging critical incident data• Issues relating to the proximity of a critical incident and its cause

José C. Castillo Chapter 1: Introduction
5
1.4 CONTRIBUTION OF RESEARCH
This thesis reports on development of a new technique for conducting remote usabilityevaluation. Called the user-reported critical incident method, this new technique was designed tomeet all the criteria stated in Section 1.3.1. With this method, real users are located in their ownworking environment, working on everyday tasks, and reporting their own critical incidentswithout direct interaction with an evaluator.
An overview of the user-reported critical incident method is illustrated in Figure 1-1.
Contextualizedcritical incident
report
Textual reports[User]
Pre-sized
screen-seq
uence
video clip
[System]
Usabilityproblem
description
Analysis
[Evaluator]
Redesign solution
[Designer / Developer]
Screen capturecontrol
Timing andcontrol
Userinteraction
design
Usage
Criticalincident
Usabilityproblem
Recognition ofcritical incident
[User]
[System]
Constant recording
[User]
Figure 1-1. Overview of the user-reported critical incident method
Users identify and report critical incidents occurring during use. The user’s computer systemaugments critical incident reports with task context in the form of screen-sequence video clips.Evaluators analyze these contextualized critical incident reports to create a list of usabilityproblem descriptions. Outside the scope of this evaluation method, designers utilize usabilityproblem descriptions to feed redesign solutions back to the interaction design.
Because the captured data are centered around critical incidents during task performance, they areconcise and have the potential to eliminate the usual evaluator time and effort of separatingsignificant data (i.e., critical incidents) from the total flow of events in a user work session.Moreover, because the user identifies the critical incidents, and the user has the most backgroundknowledge of the problem, high quality incident reports are more likely, assisting conversion intousability problem descriptions.
José C. Castillo Chapter 1: Introduction
6
1.5 OVERVIEW OF THESIS
Following a review of related work in Chapter 2, a description of remote evaluation methodsappears in Chapter 3. Chapter 4 contains a description of the user-reported critical incidentremote usability evaluation method, followed by a description of an earlier case study of thismethod in Chapter 5. Chapter 6 reports a qualitative study to evaluate the method, leading to adiscussion of results and lessons learned in Chapter 7.

José C. Castillo
7
CHAPTER 2:
RELATED WORK
2.1 TRADITIONAL LABORATORY-BASED USABILITY EVALUATION
Traditional laboratory-based usability evaluation is included in this study as a class of benchmarkmethods for comparison with remote evaluation methods. Lab-based evaluation is usuallyconsidered “local evaluation” in the sense that user and evaluator are in the same or adjacentrooms at the same time (Figure 2-1). This kind of usability evaluation, conducted in a usabilitylaboratory, is quite formal, using predefined tasks and driven by quantitative usabilityspecifications (Whiteside, Bennett, and Holtzblatt, 1988). Sessions are usually videotaped forbackup and review.
Same or adjacent room /same time
User
Performsrepresentativetasks
Evaluators
Identify critical incidentsand analyze them to createa list of usability problemdescriptions
(local observers)
Usability laboratory
Figure 2-1. Scenario of a typical laboratory-based usability evaluation session
Data collected are both quantitative (e.g., task performance, time and error count, user preferencequestionnaire scores) and qualitative (e.g., critical incident descriptions and verbal protocol).Typically, quantitative data are used to determine if and when usability specifications are met sothat iteration can halt. Qualitative data serve to identify usability problems, their causes withinthe interface design, and potential redesign solutions (Hix and Hartson, 1993).

José C. Castillo Chapter 2: Related Work
8
2.2 THE CRITICAL INCIDENT TECHNIQUE
This section provides background information about critical incidents and a brief explanation ofthe original critical incident technique with some modern variations of the method.
2.2.1 Definition of a critical incident
Despite numerous variations in procedures for gathering and analyzing critical incidents,researchers and practitioners agree about the definition of a critical incident. A critical incidentis an event observed within task performance that is a significant indicator of some factordefining the objective of the study. Andersson and Nilsson (1964) defined a critical incident asan incident “in which the holder of a position in a certain occupation has acted in a way which,according to some criterion, has been of decisive significance for his success or failure in a task.”Thus, for example, in the context of safety studies, a critical incident is an event that indicatessomething significant about safety. In the context of formative usability evaluation, a criticalincident is an occurrence during user task performance that indicates something (positive ornegative) about usability.
2.2.2 Origins of the critical incident technique
The origins of the critical incident technique can be traced back to studies performed in theAviation Psychology Program of the Army Air Forces in World War II. The technique was firstformally codified by the work of Fitts and Jones (1947) for analyzing and classifying pilot errorexperiences in reading and interpreting aircraft instruments. Fitts and Jones used the term“errors” rather than “critical incidents”, gathered data retrospectively (accounts of errors wereobtained through recorded interviews and written reports from pilots), and based their analysis ofhuman performance on significant events that occurred while a task is performed. As opposed toFitts and Jones’ way of collecting data, data gathering during task performance is now considereda defining criterion for critical incident methods.
The work of Flanagan (1954) became the landmark critical incident technique, after his articleentitled “The Critical Incident Technique” appeared in the Psychological Bulletin. Since thispublication, the critical incident technique has been thoroughly described by other researchers(Andersson and Nilsson, 1964; Meister, 1985) , and has also become a common technique amonghuman factors practitioners, though it has often been modified.
2.2.3 Relevance of critical incident data
Critical incident data, which is perishable if not captured immediately and precisely as it arisesduring usage, is essential for isolating specific usability problems within the user interactiondesign. This is exactly the kind of data one obtains from the usability laboratory, in the form ofparticular critical incident data and usability problem descriptions.
In real world task performance, users are perhaps in the best position to recognize criticalincidents caused by usability problems and design flaws in the user interface. Critical incident

José C. Castillo Chapter 2: Related Work
9
identification is arguably the single most important kind of information associated with taskperformance in a usability-oriented context.
2.2.4 Flanagan’s original critical incident technique
Beyond this general agreement on what constitutes a critical incident, most discussion in theliterature has been devoted to describing Flanagan’s technique for gathering and analyzingcritical incidents as well as several variations of the technique for various purposes.Flanagan (1954) originally defined the critical incident technique as a set of procedures designedto describe human behavior by collecting descriptions of events having special significance andmeeting systematically defined criteria: “… only simple types of judgments are required of theobserver, reports from only qualified observers are included, and all observations are evaluatedby the observer in terms of an agreed upon statement of the purpose of the activity.”
Prior to the critical incident technique, field observations consisted mainly of retrospective andanecdotal reports by untrained observers operating under completely uncontrolled conditions.Flanagan provided a systematic way of collecting data from a variety of simple domains whileensuring some degree of validity. Using his method, observers could gather direct observationsof human behavior in a way to facilitate solving practical problems and developing psychologicalprinciples.
Flanagan envisioned trained observers, who were domain knowledgeable data collectors, makingobservations of ongoing activities in a user’s normal working environment. The technique calledfor collection of critical incidents as they occurred. He generally ruled out retrospectiveconstruction of critical incident data on events that had occurred previously. He was concernedthat the quantity and quality of data that could be obtained retrospectively could not support theanalysis needed within the critical incident method. That would mean, for example, thatreconstruction of events leading to an aircraft accident would not qualify as the critical incidentmethod, because no critical incident data were taken at the time of the accident; all data wouldhave been reconstructed. Presumably, however, critical incident analysis could be applied to themuch richer detail of a videotape made as a task was performed.
In addition, Flanagan encouraged using the critical incident technique for both research andapplication-oriented work, and generalization of data so inferences could be made for the largerpopulation. Domains cited by Flanagan (e.g., airplane cockpit, hospital operating room) were allopen to intrusive data collection (decades later, as is, the domain of human-computer interfaces).In these domains, most observers were supervisors trained in critical incident observationtechniques, and users were accustomed to being observed by these people. In sum, Flanagan’scritical incident technique, by focusing on events occurring in real task performance, broughttogether more closely the operational world of users and the human factors laboratory.

José C. Castillo Chapter 2: Related Work
10
2.2.5 Variations of the critical incident technique
Flanagan did not, however, see the critical incident technique as a single rigid procedure. He wasin favor of modifying this technique to meet different needs as long as the original criteria(Section 2.2.3) were met. In fact, 40 years after the introduction of Flanagan’s critical incidenttechnique, Shattuck and Woods (1994) reported a study that revealed this technique has rarelybeen used as originally published. Instead, variations of the method were found (as Flanagananticipated), each suited to a particular field of interest, often with constraining parameters.First, Shattuck and Woods reviewed materials commonly used to educate human factorspractitioners (e.g., textbooks, handbooks, professional journals, conferences) and found that littlemention was made of the critical incident technique. A survey conducted with practitioners-in-training to highlight some misconceptions concerning the critical incident technique found thatmany practitioners claimed to be familiar with the technique, and perhaps had even used it.But when they were asked to describe the methodology, it was often a much different versionthan that originated by Flanagan.
Human Factors practitioners today still find value in Flanagan’s work and have continued usingthe critical incident technique as a basis for their methodologies, modifying it to meet theirspecific requirements. Shattuck and Woods (1994), in this 40 year retrospective on the criticalincident technique, offer interesting details on several successful variations of the technique.
Who identifies critical incidents
One factor in the variability of the critical incident technique is the issue of who (which role)makes the critical incident identification. Flanagan originally used trained observers to collectcritical incident information while observing users performing tasks. In contrast, del Galdo,Williges, Williges, and Wixon (1986) involved users to identify critical incidents during taskperformance. The user-reported critical incident method is similar to that of del Galdo et al. inthis regard, but different in other ways that will become apparent in Chapter 4. Dzida, Wiethoff,and Arnold (1993) and Koenemman-Belliveau, Carroll, Rosson, and Singley (1994) adopt thestance that identifying critical incidents during task performance can be an individual process ora mutual process between user and evaluator.
Critical incidents and critical threads
Carroll, Koenemann-Belliveau, Rosson, and Singley (1993) and Koenemann-Belliveau et al.(1994) defined a critical incident in the context of human-computer interaction as an event thatstands out during usability evaluation (e.g., a major breakdown during task performance). In thatcontext, empirical usability evaluation, particularly formative evaluation, depends heavily onobserving and interpreting critical incidents during user task performance. This process is timeconsuming and laborious since evaluators need to observe users, collect and analyze data, andgeneralize results. The authors made the case for leveraging the work done in empiricalformative evaluation by generalizing and collecting data to gain more general knowledge andformulate theories about usability problems. To this end, they proposed an extension to thecritical incident technique that includes critical threads. Causes of a critical incident are notnecessarily found in the immediate context of its occurrence and can be distributed throughout a

José C. Castillo Chapter 2: Related Work
11
user’s prior experience. A set of earlier episodes, called critical threads, may occur, each ofwhich in isolation may not be noteworthy but together can explain a critical incident.
In the study of Koenemann-Belliveau et al., two participants spent 12 hours learning concepts ofthe Smalltalk/V® object-oriented language with either the Smalltalk standard tutorial or MiTTS(Minimalist Tutorial and Toolset for Smalltalk). After the learning phase, participants spentabout four hours on a series of six programming and software design projects. Learners werevideotaped and asked to “think aloud” (Lewis, 1982; Nielsen, 1992; Wright and Monk, 1991)during their whole activity. Trained observers (as in Flanagan’s technique) viewed the tapes andidentified critical incidents learners encountered. Although evaluators identified criticalincidents, Koenemann-Belliveau et al. agreed that users and/or evaluators could do the criticalincident identification process.
ERGOguide, The Quality Assurance Guide to Ergonomic Software
Dzida et al. (1993) define critical incidents (or error events) as circumstances that especially leadto failure or success in an individual’s action. They argue that errors should be taken seriouslynot only during heuristic inspections but primarily during day-to-day use of a system. They alsoindicate that there are two possible definitions of user errors: system-oriented errors(e.g., violating a system constraint) and user-oriented errors (e.g., blocking a user’s goalachievement).
User-oriented errors are identified with the help of a user, applying specific methods forobserving errors and eliciting users’ background information on cognitive processes during errorevents. These methods may be quite extensive and labor intensive, and an evaluator facilitatesthe procedure by post-session interviews of users based on videotapes showing criticalinteraction events. Dzida et al. claimed that, by seeing the videotape, users are stimulated torecall the mental events that occurred during their interaction with the system. This technique iscommonly known as retrospective verbal protocol taking (Bowers and Snyder, 1990;Ohnemus and Biers, 1993). During the interview, each user is asked to tell the experimenterwhat was going on “inside his or her head” during the session, as they watch the videotape.Contrary to what Flanagan presented, Dzida et al. adopted the perspective that identification ofcritical incidents is a mutual process between user and experimenter.

José C. Castillo Chapter 2: Related Work
12
2.2.6 Software tools to help identify critical i ncidents
Human factors and human-computer interaction researchers have developed software tools toassist identifying and recording critical incident information. Three such applications aredescribed here.
On-line critical incident tool
del Galdo et al. (1986) investigated use of critical incidents as a mechanism to collect end-userreactions for simultaneous design and evaluation of both on-line and hard-copy documentation.The method required user-subjects (not the trained observers of Flanagan’s technique) to reportcritical incidents involving both types of documentation after completing 19 benchmark tasks.A tool was designed to collect critical incidents from user-subjects. An experimenter monitoredall subject activity and prompted subjects when they neglected to report incidents (i.e., sending aone-line message stating: “Please remember to report all documentation incidents.”)
The on-line critical incident tool consisted of three components: format of questions for datacollection, procedure for data collection, and summary of incident data into lists of interfaceproblems and assets. The format of questions for data collection included both open-ended andchecklist style questions to include a description of the incident, an outcome classification of theincident (success or failure), and a severity rating of the incident (extremely critical to extremelynon-critical on a scale from 1 to 7).
Data collection involved presentation of an on-line questionnaire and collection of criticalincident data. The task and the tool were presented simultaneously, using two terminals, onewhich presented the software to be evaluated, and a second terminal which presented the onlinetool to collect critical incident data. Creating critical incident data included data summariesexamining problems contained within critical incidents, and prioritizing incidents by frequencyof occurrence within their outcome categories.
IDEAL
IDEAL (Ashlund and Hix, 1992; Hix and Hartson, 1994) is an interactive tool environment thatsupports user interaction development activities, especially focusing on formative evaluation.IDEAL is an integrated environment comprised of several different tools, each of which supportsa different activity in the user interaction development process, and users of IDEAL areexperienced usability evaluators. A typical configuration for IDEAL consists of a DECstation5000/133, two Sony video monitors, two Sony Hi-8 VISCA-controlled videotape decks, aheadset microphone for an evaluator to speak with a user and/or record comments on videotape,a video camera for recording a user’s face, a scan converter for recording screen actions, and alapel microphone for recording a user’s voice on videotape (the evaluator can also monitor thismicrophone so that the two microphones also function as an intercom).

José C. Castillo Chapter 2: Related Work
13
IDEAL supports:
• capture of evaluation session information such as user identification code, date, trialnumber, task description, associated usability specifications;
• control of recording and playback of both tape decks; and• creation and editing of critical incident records, each tagged to videotapes by time codes.
The feature of tagging critical incidents on the tapes allows evaluators to go directly to eachcritical incident for analysis without having to view tapes between critical incidents.
UCDCam
Researchers at IBM in Toronto developed a software system called UCDCam (Hameluck andVelocci, 1996), based on Lotus ScreenCam . This application, running in Windows3.1 ,is used for capturing digitized video of screen sequences during task performance, as part ofcritical incident reports.
When a user first activates UCDCam, the application opens a “Session Info” window to store theuser name, name of users’ organization, name of the product being evaluated, and the hard drivewhere video clips and reports would be stored. While users work with their normal tasks,UCDCam runs as a “background” process, continuously recording all screen activity in a currentbuffer, and it also retains a separate holding buffer that holds the two-minutes of screen activitythat occurred prior to the initialization of the current buffer. To report critical incidents, usersclick a button that opens an editor for entering comments about the problem. Users makeselections from various list-boxes to indicate what they were trying to do when the problemoccurred (i.e., user task) and to rate critical incident severity. List box entries (possible choices)are configurable by the evaluator. UCDCam also counts the number of reports sent by each user.
UCDCam automatically saves a screen-sequence clip of all activity that occurred for an intervalprior to clicking the button (current n-second buffer plus two-minute previous buffer if thecurrent buffer is less than one-minute long). Approximately 200 KB is required to store oneminute of screen action in the user's computer, depending on display resolution and amount ofscreen updates. If the user has not pressed the "Incident" button within the two-minute bufferinterval, then a new current buffer is initialized, and the old current buffer is used to replace theold holding buffer. That way, the most recent interval of screen action is always captured at anypoint in time, with screen-clips of 1 to 2 minutes in duration. Buffer duration is static, butconfigurable by the evaluators (up to 20 minutes in length).
The intention is that UCDCam will automatically package a screen-sequence clip with usercomments (textual report) and send this package of information via the network to evaluators.Evaluators then use UCDCam to watch the clips, analyze activity that occurred prior to when theuser reported an incident, and create usability problem descriptions.
As part of this thesis research, in fact, a beta version of UCDCam was investigated. However,continuous video was used to record users during evaluation sessions to analyze some timingproblems discussed in Chapter 7. This decision turned out fortunate, indeed, since much of the
José C. Castillo Chapter 2: Related Work
14
important data was outside the range of the capture interval we intended to use. This choice wasto meet requirements of the study and does not reflect a problem with UCDCam.
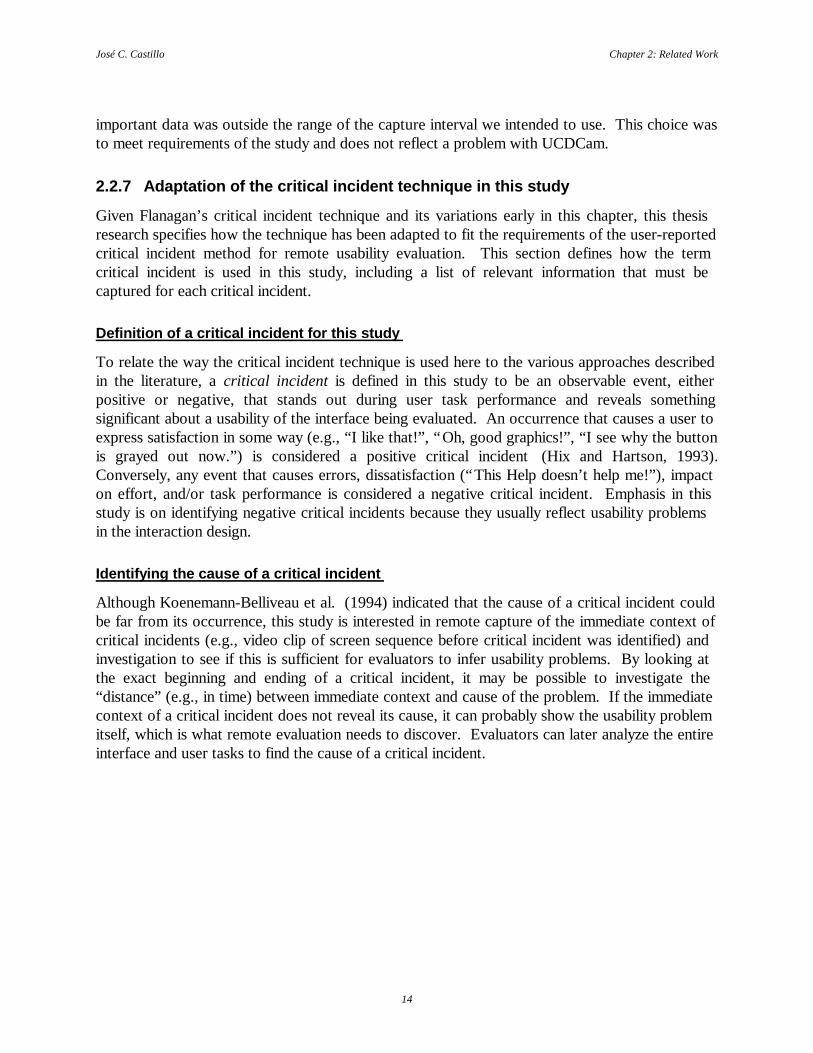
2.2.7 Adaptation of the critical incident technique in this study
Given Flanagan’s critical incident technique and its variations early in this chapter, this thesisresearch specifies how the technique has been adapted to fit the requirements of the user-reportedcritical incident method for remote usability evaluation. This section defines how the termcritical incident is used in this study, including a list of relevant information that must becaptured for each critical incident.
Definition of a critical incident for this study
To relate the way the critical incident technique is used here to the various approaches describedin the literature, a critical incident is defined in this study to be an observable event, eitherpositive or negative, that stands out during user task performance and reveals somethingsignificant about a usability of the interface being evaluated. An occurrence that causes a user toexpress satisfaction in some way (e.g., “I like that!”, “Oh, good graphics!”, “I see why the buttonis grayed out now.”) is considered a positive critical incident (Hix and Hartson, 1993).Conversely, any event that causes errors, dissatisfaction (“This Help doesn’t help me!”), impacton effort, and/or task performance is considered a negative critical incident. Emphasis in thisstudy is on identifying negative critical incidents because they usually reflect usability problemsin the interaction design.
Identifying the cause of a critical incident
Although Koenemann-Belliveau et al. (1994) indicated that the cause of a critical incident couldbe far from its occurrence, this study is interested in remote capture of the immediate context ofcritical incidents (e.g., video clip of screen sequence before critical incident was identified) andinvestigation to see if this is sufficient for evaluators to infer usability problems. By looking atthe exact beginning and ending of a critical incident, it may be possible to investigate the“distance” (e.g., in time) between immediate context and cause of the problem. If the immediatecontext of a critical incident does not reveal its cause, it can probably show the usability problemitself, which is what remote evaluation needs to discover. Evaluators can later analyze the entireinterface and user tasks to find the cause of a critical incident.

José C. Castillo Chapter 2: Related Work
15
2.3 MINIMALIST TRAINING
2.3.1 Need for critical incident training
Success of the user-reported critical incident method depends on the ability of typical users toeffectively recognize and consistently report critical incidents. Users cannot be expected to begenerally trained in human-computer interaction, but they can be given minimal training for thespecific task of identifying and reporting critical incidents.
2.3.2 Using the minimalist approach to instructional design
During the 1980s, a group at IBM Watson Research Center developed the minimalist approach toinstructional design (Carroll, 1984; Carroll, 1990). Using numerous psychological methods tostudy a variety of commercial systems, prototypes, and training approaches, they logged nearly1,000 hours of one-on-one observation of learner activities, and several thousand more hours ofless intensively monitored experimental studies of new user performance. In the years since itscreation, minimalist instruction has received widespread attention as an effective way to developtraining (van der Meij and Carroll, 1995) .
The minimalist approach consists of design of instruction in a way that is effective and sensiblefor a learner. Designing materials requires a balance between a learner’s need for knowledge(e.g., acquiring explanation information by reading manual or watching videotape) with alearner’s need for immediate opportunity to act (e.g., practice with real examples fromapplication).
2.3.3 Principles for minimalist training
To develop minimalist instructions, practitioners apply a set of principles and their correspondingheuristics (van der Meij and Carroll, 1995) as illustrated in Figure 2-2. These principles are notapplied as a strict set of rules, but as guidelines for instructional design.

José C. Castillo Chapter 2: Related Work
16
Principle 1: Choose an action-oriented approachHeuristic 1.1: Provide an immediate opportunity to actHeuristic 1.2: Encourage and support exploration and innovationHeuristic 1.3: Respect the integrity of the user's activity
Principle 2: Anchor the tool in the task domainHeuristic 2.1: Select or Design Instructional Activities that are Real TasksHeuristic 2.2: Components of the Instruction should Reflect the Task Structure
Principle 3: Support Error Recognition and RecoveryHeuristic 3.1: Prevent mistakes whenever possible.Heuristic 3.2: Provide error-information when actions are error-prone or when correction is difficult..Heuristic 3.3: Provide error-information that supports detection, diagnosis, and recovery.Heuristic 3.4: Provide on-the-spot error-information.
Principle 4: Support Reading to Do, Study, and LocateHeuristic 4.1: Be brief; don’t spell out everythingHeuristic 4.2: Provide closure for chapters
Figure 2-2. Four major principles and heuristics for designing minimalist instruction(van der Meij and Carroll, 1995)
Training was expected to be necessary for remote users to effectively identify their own criticalincidents during task performance. After considering various training techniques, minimalistinstruction principles were applied to design the training for user-subjects for the specific task ofidentifying and reporting critical incidents.

José C. Castillo
17
CHAPTER 3:
REMOTE USABILITY EVALUATION
3.1 DEFINITION
Remote evaluation is defined as usability evaluation where evaluators are separated in spaceand/or time from users (Hartson et al., 1996). For consistency of terminology throughout thisthesis, the term remote, used in the context of remote usability evaluation, is relative to thedevelopers and refers to users not at the location of developers. Similarly, the term local refers tolocation of the developers.
Sometimes developers hire outside contractors to do some usability evaluation in a usabilitylaboratory at the contractor’s site. Neither term (local or remote) per the above definitions,applies very well to these third-party consultants, but they (as surrogate developers) could haveremote users.
In traditional laboratory-based usability evaluation, users are observed directly by evaluators.However, remote and distributed location of users precludes the opportunity for directobservation in usability evaluation. Therefore, with remote evaluation (Figure 3-1), the networkserves as a bridge between users and evaluators, taking interface evaluation to a broad range ofnetworked users (e.g., representative population of users) in their natural work settings.
EvaluatorsUser
Normal workingenvironment
Network
Different placeand/or time
Performsrepresentativeand/or everydaytasks
Create list ofusability problemdescriptions
Usabilitylaboratory
Figure 3-1. Scenario of a remote usability evaluation session

José C. Castillo Chapter 3: Remote Usability Evaluation
18
3.2 TYPES OF REMOTE EVALUATION METHODS
Identifying and distinguishing various approaches to remote evaluation is useful to understandthe range of possibilities and to avoid comparison of unlike methods. No claim is made for thecompleteness of this list of types.
• Remote questionnaire or survey• Live or collaborative remote evaluation• Instrumented or automated data collection for remote evaluation• User-reported critical incident method• Commercial usability services
− Third-party laboratory evaluation− Third-party usability inspection
Some remote evaluation situations call for a portable usability evaluation unit, by means ofwhich the laboratory is taken to users in their normal work environment. Portable units oftencontain special usability evaluation equipment, including a laptop computer, video, and audioequipment. While this is an area of growing interest, it is outside the scope of this work.
3.2.1 Remote questionnaire or survey
Without any added instrumentation, evaluators can send questionnaires (Fleming, Kilgour, andSmith, 1993) to users (via mail or email) or can give users the URL to a Web-basedquestionnaire. In an approach more directly associated with usage, software applications can beaugmented to trigger the display of a questionnaire to gather subjective preference data about theapplication and its interface. Appearance of the questionnaire, requesting feedback related tousability, is triggered by an event (including task completion) during usage. Responses arebatched and sent to the developers.
As an example, the User Partnering (UP) Module from UP Technology (Abelow, 1993) usesevent-driven triggers to “awaken” dialogues that ask users questions about their usage.Approaches based on remote questionnaires have the advantage that they capture remote userreactions while they are fresh, but they are limited to subjective data based on questions pre-defined by developers or evaluators. Thus, many of the qualitative data normally acquired inlaboratory evaluation (i.e., the data directly useful in identifying specific usability problems) arelost.
3.2.2 Live or collaborative remote evaluation
In collaborative usability evaluation via the network (Hammontree, Weiler, and Nayak, 1994),evaluators (at a usability laboratory) and remote users (at their natural work setting) areconnected through the Internet and/or a dial-up telephone line, using commercially availableteleconferencing software as an extension of the video/audio cable (Hartson et al., 1996).Typical tools of this kind (e.g., Microsoft NetMeeting , Sun Microsystems ShowMe ),support several features including:

José C. Castillo Chapter 3: Remote Usability Evaluation
19
• real-time application sharing (e.g., the capability to open a word processor at the user’scomputer and share it with the evaluator, even when the evaluator does not have thatapplication installed, such that the user and evaluator take turns to modify a document);
• audio conferencing links for user and evaluators to talk during the evaluation session(e.g., audio could be sent via an Internet telephone tool or regular telephone);
• shared whiteboard with integrated drawing tool for viewing and editing graphic images inreal time (e.g., pointing out specific areas by using a remote pointer or highlighting tool,or taking a "snapshot" of a window and then pasting the graphic on whiteboard surface);and/or
• file transfer capabilities (e.g., the capability of a user to transfer a document includingsnapshots of the user interface being evaluated to the evaluators’ computer).
Using video teleconferencing software as a mechanism to transport video data in real time overthe network, perhaps, comes the closest to the effect of local evaluation. Currently, the primaryobstacle to this approach is the limited bandwidth of the network, occasioning communicationdelays and low video frame rates. However, evaluators are not confined to use teleconferencingsoftware since many software tools support the additional collaborative features mentionedabove.
TeamWave Software Ltd. (1997) is a collaborative tool that supports both synchronous andasynchronous collaboration for a work group. As in the case of real-life team meeting rooms, ashared space or virtual room may contain several objects (e.g., documents, screen shots) relevantto the team's work. The user and evaluator can be present in the room at the same time, so theyare working together synchronously in real-time, or they may be working in the room at differenttimes, so the user can leave things in that room for the evaluator to analyze asynchronously.This type of asynchronous collaboration gives the evaluator the flexibility to do the evaluation allat once or at a time that is convenient.
3.2.3 Instrumented or automated data collection for remote evaluation
An application and its interface can be instrumented with embedded metering code to collect andreturn a journal or log of data occurring as a natural result of usage in users’ normal workingenvironments. Data captured by such applications (e.g., the WinWhatWhere family ofproducts) represent various user actions made during task performance, are often very detailed,and include logging of:
• program usage (e.g., which programs users utilize most frequently),• project time (e.g., time spent working on specific application),• Internet usage (e.g., monitor use of on-line time),• comments to the system,• keystrokes and mouse movements, and• any other activity, producing custom-built reports.

José C. Castillo Chapter 3: Remote Usability Evaluation
20
The logs or journals of data are later analyzed using pattern recognition techniques(Siochi and Ehrich, 1991) to deduce where the usability problems have occurred. This approachhas the advantage of not interfering at all with work activities of the user and can provideautomated usability evaluation for certain kinds of usability problems. However, for formativeevaluation it can be difficult to infer some types of usability problems effectively. This methodhas been used successfully for summative evaluation, marketing trials, and beta evaluation.
As an example, the ErgoLight family of products (ErgoLight™ Usability Software, 1997),used to enhance the usability of Windows applications, provides detailed and statisticalinformation regarding a variety of usability problems. ErgoLight records user actions whenoperating the application, identifies the points of user confusion, and prompts the user to storerecords of his/her intention at these points. Based on the correlation between the user intentionand the actual actions, ErgoLight extracts information, which is useful for understanding thecircumstances of user confusion. The extracted information includes reports on problems in theuser documentation and Help system, statistics on user confusion, and backtracks analysis ofthese circumstances. ErgoLight also integrates the data collected at the testing stage with theevaluator's comments, classifies the knowledge by organizational roles and provides reportsadequate for changing the user model, the user interface design, and user documentation.
3.2.4 User-reported critical incident method
This method applies selective data collection triggered directly by users while performing tasksin their normal work context (Hartson et al., 1996). Users are trained to identify critical incidentsand report specific information about these events (e.g., description and severity of problem).The reports are transmitted to developers along with context information about the user task(i.e., what user was trying to do when problem occurred) and the system itself (e.g., name and/orlocation of screen where problem occurred), as well as video clips containing screen-sequenceactions. Evaluators use these data, approximating the qualitative data normally taken in theusability laboratory, to produce usability problem descriptions.
The user-reported critical incident method for remote usability evaluation, which is the subject ofthe work reported here, has potential for cost-effectiveness, since the user gathers the data andevaluators look (at least in theory) only at data that relate to usability problems.
3.2.5 Commercial usability services
A number of commercial usability evaluation services are now available to software developers.Developers use the network to communicate design documents, software samples, and/orprototypes to remote contractual evaluators, but the network is not used to connect to remoteusers. The evaluation is local to the contractual evaluators and remote from the developers, withresults being returned via the network.
Contractual evaluation services can be a good bargain for developer groups who have onlyoccasional need for usability evaluation and cannot afford their own facilities. However, thequality of these services can vary, the methods can be ad hoc (e.g., intuitive inspection without

José C. Castillo Chapter 3: Remote Usability Evaluation
21
use of guidelines), and the process is not always suitable for the specific needs of a developmentgroup. Two possible variations of local evaluation at remote sites are described below.
Third-party laboratory evaluation
Formal laboratory-based usability evaluation offered by consulting groups provides usabilityevaluation with representative users and tasks. Results include quantitative performancemeasures, user opinions and satisfaction ratings, recommendations for application improvement,and sometimes even a copy of evaluation session videotapes for review by the development team .
Third-party usability inspection
Some developers send their designs to remote contractors who perform local evaluation using adhoc, intuitive interface inspection, drawing on design guidelines, user profiles, and softwarestandards. Without empirical observation of users and a more formal process, results can varydepending on the knowledge and skills of the evaluators. As an example, this kind of evaluationis done by Vertical Research, Inc. (1997) for Microsoft Windows -based products.
3.3 CLASSIFICATION OF REMOTE EVALUATION METHODS
Remote usability evaluation encompasses several methods for evaluating user interfaces at adistant location. Since it is useful to understand how each method works under differentsituations, this section presents a classification that distinguishes among the characteristics ofeach remote evaluation method. The classifications made here are not absolute, but are relativeand representative, and are based on insight gained during this study, offered to promote anintuitive comparison of the methods. The following attributes of remote usability evaluationmethods are considered:
• type of users involved,• time of evaluation,• user location during evaluation,• person or role who identifies critical incidents and/or problems during task performance,• type of tasks (user’s own tasks or tasks predefined by evaluator),• level of interaction between user and evaluator,• type of data gathered,• type of equipment used for collecting data (e.g., videotape),• cost to collect data,• cost to analyze data and create usability problem descriptions, and• quality or usefulness of collected data.
Laboratory-based usability evaluation is included in each classification as a benchmark methodfor comparison with the remote evaluation methods.
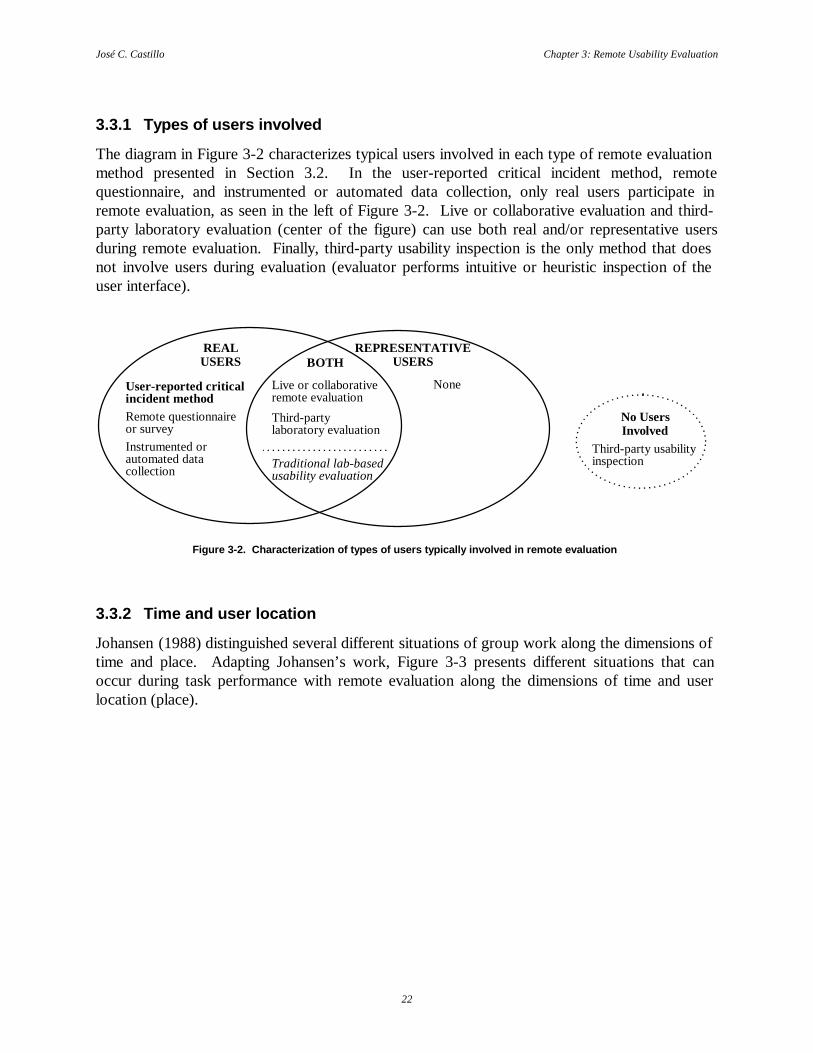
José C. Castillo Chapter 3: Remote Usability Evaluation
22
3.3.1 Types of users involved
The diagram in Figure 3-2 characterizes typical users involved in each type of remote evaluationmethod presented in Section 3.2. In the user-reported critical incident method, remotequestionnaire, and instrumented or automated data collection, only real users participate inremote evaluation, as seen in the left of Figure 3-2. Live or collaborative evaluation and third-party laboratory evaluation (center of the figure) can use both real and/or representative usersduring remote evaluation. Finally, third-party usability inspection is the only method that doesnot involve users during evaluation (evaluator performs intuitive or heuristic inspection of theuser interface).
REAL USERS
REPRESENTATIVEUSERS
Third-party usabilityinspection
No UsersInvolved
BOTH
Instrumented orautomated datacollection
User-reported criticalincident methodRemote questionnaireor survey
Live or collaborative remote evaluation
Traditional lab-basedusability evaluation
Third-partylaboratory evaluation
None
Figure 3-2. Characterization of types of users typically involved in remote evaluation
3.3.2 Time and user location
Johansen (1988) distinguished several different situations of group work along the dimensions oftime and place. Adapting Johansen’s work, Figure 3-3 presents different situations that canoccur during task performance with remote evaluation along the dimensions of time and userlocation (place).

José C. Castillo Chapter 3: Remote Usability Evaluation
23
Instrumented or automateddata collection
User-reported criticalincident method
Remote questionnaireor surveyLive or collaborative remote evaluation
Live or collaborative remote evaluation
Different(Asynchronous)
Same(Synchronous)
TIME OF EVALUATIONU
ser’
s ow
n w
orki
ngen
viro
nmen
tC
ontr
olle
den
viro
nmen
t
USE
R L
OC
AT
ION
N/A
Third-party laboratoryevaluation
Traditional lab-basedusability evaluation
Neither Time or Location Applicable
Third-party usabilityinspection
Figure 3-3. Characterization of user location and time of evaluation
In the user-reported critical incident method, instrumented data collection, and remotequestionnaire, remote evaluation occurs within the user’s normal work setting. Time ofevaluation is asynchronous, meaning that evaluators participate at a different time than do users.User critical incident reports, log files, and questionnaires, respectively, are collected duringusage, and evaluators later analyze them to create a list of usability problem descriptions.Third-party laboratory evaluation involves local evaluation with representative users at thethird-party contractor/evaluator’s usability laboratory (i.e., controlled environment). As intraditional lab-based usability evaluation (same time/controlled environment quadrant), users andevaluators are located in the same place and time.
Because of the generality of the concept, live or collaborative remote evaluation is the onlymethod than spans across more than one quadrant. Generally, collaborative remote evaluationoccurs when user and evaluator are connected in real-time (i.e., synchronously) over the network.When using teleconferencing software, user and evaluator are examining the user interface at thesame time from different locations (e.g., adjacent rooms or distant geographical locations), wherethe video and audio cable (or wireless or network communication) operates as an extension ofthe usability laboratory. The evaluator can also use software (e.g., Compaq Carbon Copy ) toremotely control the user’s computer to observe the user interface. In the asynchronous mode forthis method, the user can leave information (e.g., snapshot of one screen of the user interface) ina place known by the evaluator (e.g., screens directory), and the evaluator later connects to theuser’s computer to retrieve the information. Third-party usability inspection is not included in

José C. Castillo Chapter 3: Remote Usability Evaluation
24
the table on the left of the figure because it does not involve users during evaluation of the userinterface.
In the current research, the “different time / user’s own working environment” quadrant was ofmost interest because the “different time” characteristic means the evaluator is not present,making the cost of data gathering very low (relative to traditional lab-based usability evaluation).The “user’s working environment” characteristic can yield more realistic qualitative data, sinceoccurs within the user’s natural work setting.
3.3.3 Person who identifies critical incidents and problems during taskperformance
The diagram in Figure 3-4 presents a characterization of the person who identifies and/or reportscritical incidents and/or usability problems during evaluation of the user interface.
Third-party usabilityinspectionInstrumented or automateddata collection
USER EVALUATORBOTH
Third-party laboratory evaluation
Live or collaborative remote evaluation
Traditional lab-basedusability evaluation
User-reported criticalincident methodRemote questionnaire or survey
Figure 3-4. Characterization of person who identifies and/or reports critical incidents and/orusability problems during task performance
In the user-reported critical incident method, the user both identifies and reports critical incidentsduring task performance and the evaluator analyzes these reports to create a list of usabilityproblem descriptions. When answering remote questionnaires or surveys, users providesubjective data and may indicate problems that they encounter during task performance.Collaborative remote evaluation and third-party laboratory evaluation involve both the user andthe evaluator (trained in human-computer interaction and usability methods) to identify criticalincidents and/or usability problems during task performance. For instrumented data collection,the evaluator analyzes log files of usage data and deduces possible usability problemsencountered by users. Finally, third-party usability inspection exclusively involves only theevaluator in identifying and reporting critical incidents during task performance.

José C. Castillo Chapter 3: Remote Usability Evaluation
25
3.3.4 Type of tasks and level of interactio n during remote evaluation
The diagram shown in Figure 3-5 characterizes various situations that can occur alongdimensions for type of tasks and level of interaction between users and evaluators during remoteevaluation. Unlike Figure 3-3, none of the remote evaluation methods span quadrants of thistable.
User-reported criticalincident method
Instrumented or automated data collection
Remote questionnaireor survey
none
none
Third-party laboratoryevaluation
Live or collaborative remote evaluation
Traditional lab-basedusability evaluation
None Significant
LEVEL OF INTERACTION BETWEENUSERS AND EVALUATORS
Rea
l or
ever
yday
task
sR
epre
sent
ativ
e ta
sks
(pre
defin
ed b
yev
alua
tor)T
YPE
S O
F T
ASK
S
Neither type of tasks norlevel of interaction applicable
Third-party usabilityinspection
Figure 3-5. Characterization of types of tasks performed by users and level of interactionbetween users and evaluators during usability evaluation
The top left quadrant of this table contains methods (user-reported critical incident method,instrumented data collection, and remote questionnaire or survey) in which remote evaluationoccurs while users perform real or everyday tasks, with no interaction with evaluators during taskperformance and/or evaluation. Similar to laboratory-based usability evaluation, the lower rightquadrant includes remote evaluation methods (third-party laboratory evaluation and collaborativeremote evaluation) in which users generally perform representative tasks (predefined byevaluator) and significantly interact with evaluators during usability evaluation. Again,third-party usability inspection is located outside the table on the left of the figure because thismethod does not involve users during evaluation of the user interface.
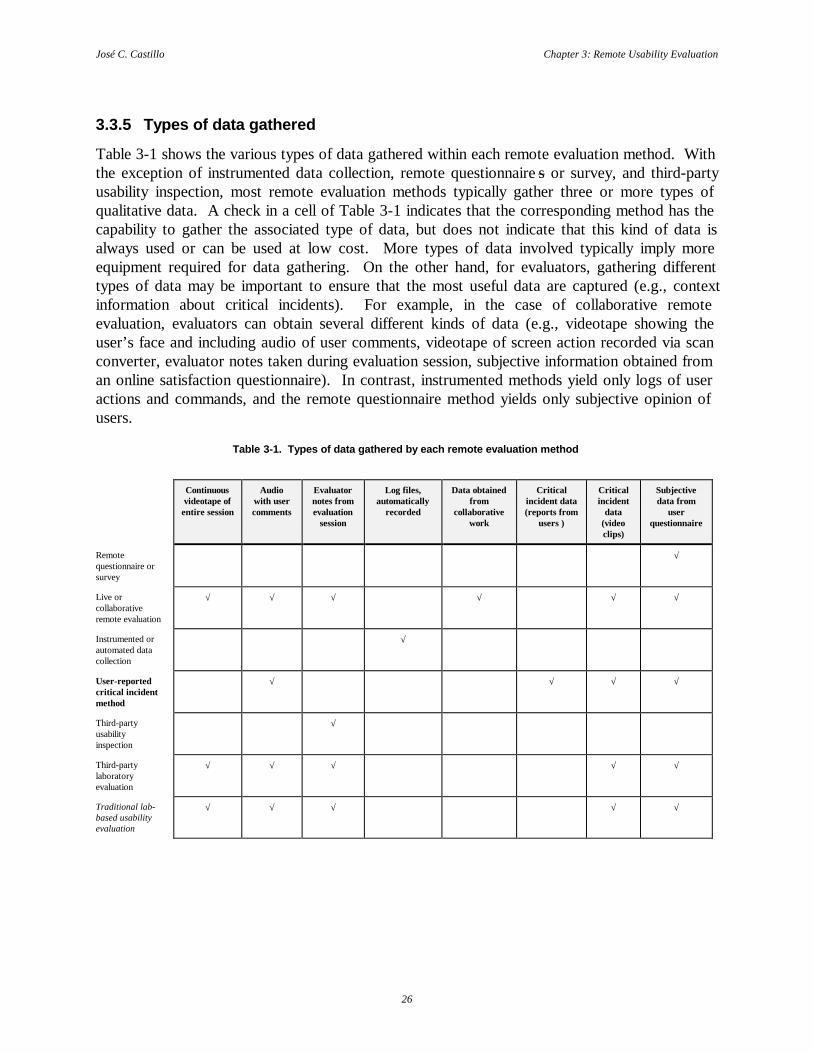
José C. Castillo Chapter 3: Remote Usability Evaluation
26
3.3.5 Types of data gathered
Table 3-1 shows the various types of data gathered within each remote evaluation method. Withthe exception of instrumented data collection, remote questionnaire s or survey, and third-partyusability inspection, most remote evaluation methods typically gather three or more types ofqualitative data. A check in a cell of Table 3-1 indicates that the corresponding method has thecapability to gather the associated type of data, but does not indicate that this kind of data isalways used or can be used at low cost. More types of data involved typically imply moreequipment required for data gathering. On the other hand, for evaluators, gathering differenttypes of data may be important to ensure that the most useful data are captured (e.g., contextinformation about critical incidents). For example, in the case of collaborative remoteevaluation, evaluators can obtain several different kinds of data (e.g., videotape showing theuser’s face and including audio of user comments, videotape of screen action recorded via scanconverter, evaluator notes taken during evaluation session, subjective information obtained froman online satisfaction questionnaire). In contrast, instrumented methods yield only logs of useractions and commands, and the remote questionnaire method yields only subjective opinion ofusers.
Table 3-1. Types of data gathered by each remote evaluation method
Continuousvideotape ofentire session
Audiowith usercomments
Evaluatornotes fromevaluation
session
Log files,automatically
recorded
Data obtainedfrom
collaborativework
Criticalincident data(reports from
users )
Criticalincident
data(videoclips)
Subjectivedata from
userquestionnaire
Remotequestionnaire orsurvey
√
Live orcollaborativeremote evaluation
√ √ √ √ √ √
Instrumented orautomated datacollection
√
User-reportedcritical incidentmethod
√ √ √ √
Third-partyusabilityinspection
√
Third-partylaboratoryevaluation
√ √ √ √ √
Traditional lab-based usabilityevaluation
√ √ √ √ √

José C. Castillo Chapter 3: Remote Usability Evaluation
27
3.3.6 Type of equipment used and quantity of data gathered
Figure 3-6 illustrates how the equipment required to collect data and the quantity of datacollected vary among remote evaluation methods.
Instrumented orautomated datacollection
Third-partyusability inspection
User-reportedcritical incidentmethod
Remote questionnaireor survey
Live or collaborativeremote evaluationThird-party laboratoryevaluation
Traditional lab-basedusability evaluation
Less
Less
More
More
QU
AN
TIT
Y O
FC
OL
LE
CT
ED
DA
TA
EQUIPMENT REQUIREDTO COLLECT DATA
Figure 3-6. Equipment required to collect data and quantity of data gatheredby each remote evaluation method
To illustrate the concept, collaborative remote evaluation, third-party laboratory evaluation, andtraditional lab-based evaluation all require a relatively high level of equipment (e.g., video andaudio equipment) to collect data and each provides a large quantity of data. Therefore, this groupof similar methods appears in the upper right portion of Figure 3-6. In contrast, instrumentedapproaches require a low level of equipment (e.g., embedded metering code to collect a log ofdata including information such as keystrokes and mouse movements) but also yield largequantities of data. Thus, instrumented methods appear in the upper left portion of the figure.
Remote questionnaires and surveys require almost no added equipment, but produce only a smallamount of data. This constraint on the amount of data stands for the need to minimize workloadfor users and interference with task performance. Remote questionnaires typically containrelatively few questions, not extensive surveys. Therefore, this method appears in the lower leftof the figure. The user-reported critical incident method requires somewhat less total equipmentand produces somewhat less data than traditional lab-based evaluation, so this method appearsroughly in the middle of the figure.

José C. Castillo Chapter 3: Remote Usability Evaluation
28
3.3.7 Cost to collect and analyze data
Figure 3-7 illustrates the relationship between cost to collect data and cost to analyze it, for eachremote evaluation method. Cost is limited to those incurred by an “in house” development team(mainly referring to evaluators). Developers are only “in house” personnel” and not, forexample, a third party retained to perform external evaluation. Costs to the development team,which, however, include fees to third-party evaluators, include:
• equipment and technology,• time and effort (person-hours),• external services (third party),• training (all, including developer and user training for evaluation),• travel and time of user-subjects, and• travel and time for developers to visit user sites.
Instrumented orautomated datacollection
Third-partyusabilityinspection
Less
Less
More
More
RE
LA
TIV
E C
OST
TO
CO
LL
EC
T D
AT
A
RELATIVE COSTTO ANALYZE DATA
User-reportedcritical incidentmethod
Remote questionnaireor survey
Live or collaborativeremote evaluationThird-party laboratoryevaluation
Traditional lab-basedusability evaluation
Figure 3-7. Relative costs to collect and analyze data
Remote questionnaire or survey appears again in the lower left of the figure because the cost tocollect data are low and, since there is a small amount of data, the cost to analyze it is also low.The group of methods similar to traditional lab-based evaluation appear again in the upper rightbecause the cost for both collection and analysis of data are high relative to the other methods.Instrumented data collection methods are somewhat an extreme case in that they are probably the

José C. Castillo Chapter 3: Remote Usability Evaluation
29
lowest in cost to collect data and possibly among the highest to analyze them. In the user-reported critical incident method, the cost for collecting data is higher than third-party usabilityinspection, but significantly lower than the traditional-lab based method. Although analysis isvery similar, the cost for analyzing data for the user-reported critical incident method is lowerthan the lab-based methods. Interestingly, third-party usability inspection appears to make agood compromise in terms of cost when resources are limited.
Figure 3-8 shows a comparison of total data cost (i.e., collection and analysis) for a single projectagainst quality or usefulness of data in identifying usability problems. Remote questionnaire orsurvey appears again in the lowest left of the figure, and once more, the group related totraditional lab-based evaluation appear in the upper right because they are the most costly butalso yield the most useful data. The user-reported critical incident method is somewhat lower oneach axis, costing less but producing data that are almost as useful. Third-party usabilityinspection appears somewhat in the middle of the graph, once again representing a possiblecompromise when resources are limited.
QU
AL
ITY
(USE
FUL
NE
SS) O
F D
AT
A
Low
Low
High
HighTOTAL COST OF DATA
(COLLECT AND ANALYZE)
Instrumented orautomated datacollection
User-reportedcritical incidentmethod
Third-partyusabilityinspection
Remote questionnaireor survey
1
23
4
5
Live or collaborativeremote evaluationThird-party laboratoryevaluation
Traditional lab-basedusability evaluation
Figure 3-8. Quality of usability data by remote evaluation method

José C. Castillo Chapter 3: Remote Usability Evaluation
30
The interesting aspect of Figure 3-8* is the slope of the lines from the origin to each method.This slope is a measure of a kind of efficiency, namely the quotient of quality or usefulness perunit cost, of data collected by each method. In the graph, a higher slope suggests higherefficiency. Interestingly, remote questionnaire or survey has the steepest slope in the graph.Thus it has high efficiency. However, the high slope comes from a quotient from low usefulnessand low cost. This limited usefulness may not alone be sufficient for the needs of thedevelopment team. On one hand, if the budget is extremely limited, some data are better thannothing. But a questionnaire only produces subjective data and, as Elgin (1995) states,“Subjective feedback is generally harder to interpret than objective feedback in a knownsetting… ” The next most efficient method according to the graph is the user-reported criticalincident method. It was, in fact, a goal of this research to develop critical incident reporting as anefficient remote evaluation method, one that was less costly than traditional lab-based evaluationbut still maintained its usefulness in determining usability problems. Third-party usabilityinspection comes next, perhaps, again as a middle-of-the-road possibility.
Group 4, the group of remote evaluation methods related to traditional lab-based usabilityevaluation, appears a bit less of a bargain, despite the high usefulness of data, because of thehigher cost. Because costs portrayed here are costs for one project, they include amortization ofequipment, lab facilities, and training costs over several projects. Thus, the relative differencebetween the slopes of method 3 and the group represented by 4, and indeed the methods withingroup 4, can vary depending on how these fixed costs are amortized. In particular, if they are notwell amortized, third-party laboratory evaluation or third-party usability inspection might bemore attractive than setting up a traditional lab-based facility. Additionally, both traditional lab-based approaches and third-party usability evaluation can be quite expensive in terms of traveland time for representative users to visit the laboratory. Thus, these two methods of group 4could have decreased slopes due to this factor.
* Of course, this graph is based on intuitive reasoning and represents general characteristics of the methods asqualified by the rationale set forth in this chapter. In specific instances of these methods as used by particulardevelopment groups, the results can vary.

José C. Castillo
31
CHAPTER 4:
THE USER-REPORTEDCRITICAL INCIDENT METHOD
4.1 OVERVIEW OF METHOD
The user-reported critical incident method is a usability evaluation method that involves realusers located in their own working environment, doing everyday tasks, and reporting criticalincidents (after receiving minimal training) without direct interaction with evaluators. Criticalincident reports are augmented with task context in the form of screen-sequence video clips andevaluators analyze these contextualized critical incident reports, transforming them into usabilityproblem descriptions.
4.2 EVOLUTION OF METHOD
The first step in the development of the user-reported critical incident method was to conduct afeasibility case study, described in Chapter 5, with the objective of judging feasibility of themethod. This study was reported by Hartson et al. (1996), where the method was calledsemi-instrumented critical incident gathering. Based on the insights gained from the case study,the second step was an exploratory study, to which a new method for conducting remote usabilityevaluation was developed called the user-reported critical incident method.
4.3 RELEVANCE OF CRITICAL INCIDENT INFORMATION
In real world task performance, users are perhaps in the best position to recognize criticalincidents (specifically negative critical incidents) caused by usability problems and design flawsin the user interface (Figure 4-1). Critical incident identification is arguably the single mostimportant kind of information associated with task performance in a usability-oriented context.This detailed data, perishable if not captured immediately and precisely as it arises during usage,is essential for isolating specific usability problems within the user interaction design. Whethergathered by users or evaluators, once critical incident information is collected, evaluators analyzeit and create a list of usability problem descriptions used by interaction designers to determinedesign solutions and correct the problem.

José C. Castillo Chapter 4: The User-Reported Critical Incident Method
32
transform redesignCritical incident
Usabilityproblem
description
Interpretation of incident
Solution
Remedy for this problem
what happenedto the user
description of whatis wrong with the design
how to fixthe problem
Usability problem
something wrongwith the user interface
Cause of critical incident
produce
User Designer/Developer
Evaluator
Figure 4-1. Overview of process for improving interaction design
4.4 RELEVANCE OF USER TRAINING
Success of the user-reported critical incident method depends on the ability of typical users torecognize and report critical incidents effectively, but there is no reason to believe that all usershave this ability naturally. Therefore, this study was designed with the assumption that sometraining would be required, an expectation supported by an initial case study discussed inChapter 5.
Fitts and Jones (1947) obtained detailed factual information about “pilot-error” experiences inreading and interpreting aircraft instruments from people not trained in the critical incidenttechnique (i.e., an eyewitness or the pilot who made the error). In contrast, Flanagan (1954)employed trained observers (not users), who were domain knowledgeable data collectors, makingobservations of ongoing activities in the user’s normal working environment. Laboratory-basedformative usability evaluation has critical incident identification done by an evaluator trained inhuman-computer interaction, which might lead to skepticism about casting a user in that role.However, in fact, the critical incident technique has been successfully adapted for human-computer interaction so that critical incidents are identified by untrained users during their owntask performance (del Galdo et al., 1986). Although users cannot be expected to be generallytrained in human-computer interaction, the work reported here shows that users can play a morevaluable role in usability evaluation if they are given minimal training for the specific task ofidentifying and reporting critical incidents.

José C. Castillo Chapter 4: The User-Reported Critical Incident Method
33
4.5 THE METHOD
4.5.1 Description
As mentioned in Section 1.3.1, the user-reported critical incident method is a remote usabilityevaluation method for capturing critical incident data and satisfying the following criteria:
• tasks are performed by real users,• users are located in normal working environments,• users self-report own critical incidents,• data are captured in day-to-day task situations,• no direct interaction is needed between user and evaluator during an evaluation session,• data capture is cost-effective, and• data are high quality and therefore relatively easy to convert into usability problems.
Critical incident reports are augmented with task context in the form of screen-sequence videoclips and evaluators analyze these contextualized critical incident reports, transforming them intousability problem descriptions.
4.5.2 Comparison with laboratory-based usability evaluation
Figure 4-2 depicts a view of the traditional laboratory-based formative evaluation process forcomparison with the setup for the user-reported critical incident method.
Evaluator notes andvideotape of user
(including user comments)
Usability laboratory /Tasks predefined byevaluator
Identificationprocess
A’
Transformationprocess
C’
Usabilityproblem
EvaluatorEvaluator
User
Usabilityproblem
description
Criticalincident
Same time and place
Figure 4-2. Configuration for traditional laboratory-based usability evaluation
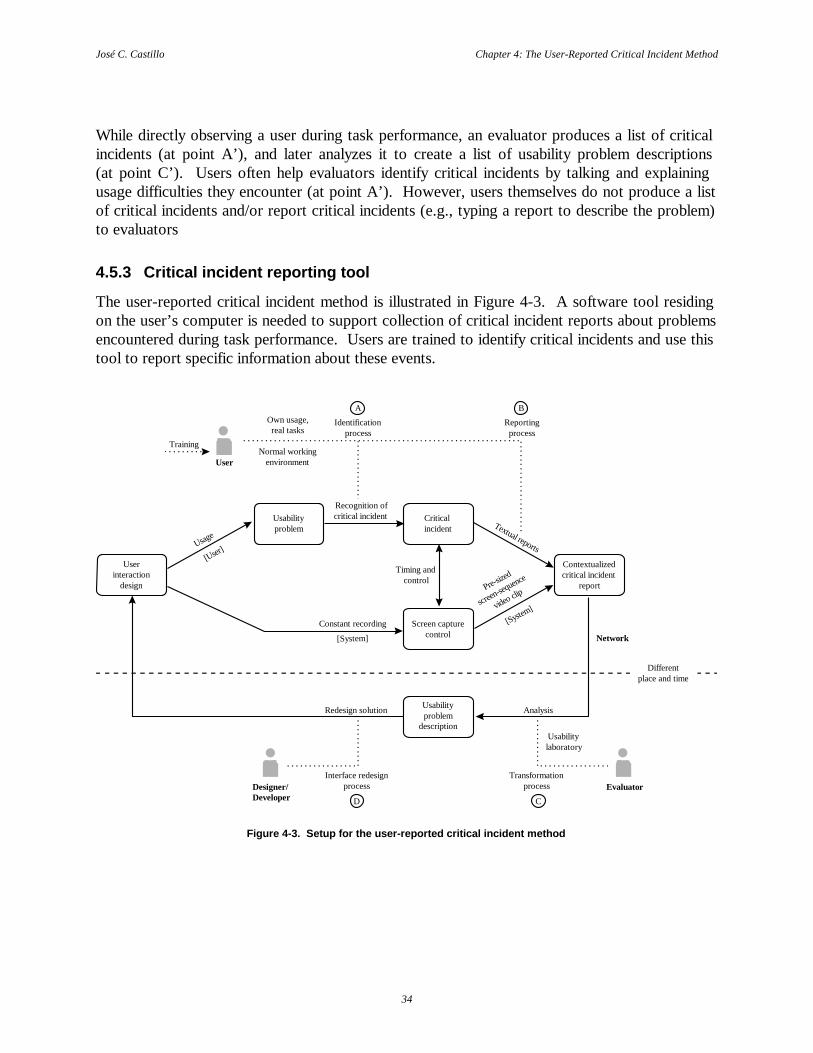
José C. Castillo Chapter 4: The User-Reported Critical Incident Method
34
While directly observing a user during task performance, an evaluator produces a list of criticalincidents (at point A’), and later analyzes it to create a list of usability problem descriptions(at point C’). Users often help evaluators identify critical incidents by talking and explainingusage difficulties they encounter (at point A’). However, users themselves do not produce a listof critical incidents and/or report critical incidents (e.g., typing a report to describe the problem)to evaluators
4.5.3 Critical incident reporting tool
The user-reported critical incident method is illustrated in Figure 4-3. A software tool residingon the user’s computer is needed to support collection of critical incident reports about problemsencountered during task performance. Users are trained to identify critical incidents and use thistool to report specific information about these events.
User
Training
Own usage,real tasks
Normal workingenvironment
Identificationprocess
A
Reportingprocess
B
Transformationprocess Evaluator
C
Differentplace and time
Designer/Developer
Interface redesignprocess
D
Usabilitylaboratory
Contextualizedcritical incident
report
Textual reports
Pre-sized
screen-seq
uence
video clip
[System]
Usabilityproblem
description
AnalysisRedesign solution
Screen capturecontrol
Timing andcontrol
Userinteraction
design
Usage
Criticalincident
Usabilityproblem
Recognition ofcritical incident
[System]
Constant recording
[User]
Network
Figure 4-3. Setup for the user-reported critical incident method

José C. Castillo Chapter 4: The User-Reported Critical Incident Method
35
Users are located in their own working environment, identifying critical incidents as they occurduring the normal course of on-the-job task performance (at point A). Whenever usage difficultyis encountered, users click on a Report Incident button (at point B), a single interface objectavailable from every screen of the application being evaluated. The click activates aninstrumentation routine external to the application that:
• opens a textual form, in a separate window from the application, for users to enter astructured report about the critical incident encountered, and
• causes the user’s computer to store a screen-sequence video clip showing screen activityimmediately prior to clicking the button for the purpose of capturing the critical incidentand events leading up to it*.
This package of data, the critical incident report and the screen-sequence clip taken together, iscalled a contextualized critical incident report and is sent asynchronously via the network toevaluators to be analyzed into usability problem descriptions (at point C). Outside the scope ofthis evaluation method, designers use problem descriptions to drive redesign solutions(at point D), which go back into the interaction design.
4.5.4 Contextual factors for critical incident reports
Dzida et al. (1993) discussed various contextual factors that can be associated with a criticalincident. This present study also uncovered some other similar factors, resulting in the combinedlist that follows:
• Specific beginning and ending of critical incident• Screen or URL (i.e., Web location) where user encountered critical incident• Description of user task in progress when critical incident occurred• Expectations of user about what system was supposed to do when critical incident
occurred• Detailed description of critical incident (what happened and why user thought it
happened)• Indication of whether user could recover from critical incident and, if so, description of
how user did so• Indication of user’s ability to reproduce critical incident• Severity rating of critical incident• Additional comments or suggested solutions to problem
* This describes the way the tool is intended for normal use. In order to capture more complete data in our presentstudy, screen activity was captured continuously via a scan converter and videotape.
José C. Castillo Chapter 4: The User-Reported Critical Incident Method
36
4.5.5 Screen-sequence video clips and timing aspects
One challenge for this study was to collect screen-sequence video clips containing meaningfulinformation about usability problems that caused critical incidents. To ensure that the capturedinformation was useful, it was necessary to determine:
• an effective point in time to start recording the clip, and• an effective length of the clip.
The effective clip length is reserved for future study. In any case, the recording time of screensequences must be of fixed length because the screen sequence capture software(e.g., IBM UCDCam, Lotus ScreenCam ) cannot be adaptive in the field (i.e., cannotproduce video clips of varying length depending on the type of critical incident). Longer lengthgives a higher probability that the most useful data will be included. Shorter length allowsevaluators to spend less time and effort analyzing the clip into usability problem descriptions,and requires less bandwidth to transmit each clip (e.g., at least 200 KB per minute of clip) overthe network.
The user-reported critical incident method sends, as part of a contextualized critical incidentreport, a screen-sequence clip of action occurring just before the user clicks the Report Incidentbutton. For that reason, a mechanism is required to ensure that this recent history of user andsystem actions is available for capture when the user does click the button. To accomplish this,an instrumentation routine continuously records all screen actions in a background process.When the user clicks the Report Incident button, the routine stores (in the user’s computer) avideo clip containing, say, the last two minutes of screen usage.
The chronology of events associated with a user-reported critical incident starts the moment auser begins to have difficulty with a task. At this point, the user may not yet have recognized itas a critical incident. Eventually, the user recognizes that the situation or event is a criticalincident, but has not yet sent a report.
After the user is sure this event is a critical incident, and after enough is known about it to makea report, the user clicks on the Report Incident button and an interval of screen-sequence actionoccurring just prior to that point is captured as the video clip component of the report. Storageand bandwidth requirements impose economic pressure to keep the clip length short. Thus, thekey factor in getting the most useful data (in terms of being able to identify the associatedusability problem) is the starting point of the clip. Unfortunately, in practice the best startingpoint can occur over a broad range of time, and no method can be devised to automatically detectthis ideal reporting point. As discovered in this study, users often wait until the most usefulscreen-sequence data have disappeared before they initiate a report.
A possible solution to solve this problem is to separate the act of identifying critical incidentsfrom the act of reporting them, and to encourage users to click a button labeled to the effect of“I am just starting to recognize the occurrence of a critical incident” immediately after theyrecognize the critical incident (close to the effective beginning of the critical incident), but toclick on the Report Incident button to report the incident (i.e., create a report) at a later time when

José C. Castillo Chapter 4: The User-Reported Critical Incident Method
37
more is known about the nature of the critical incident. See Section 7.1.1 for more discussion ofthis difficult problem.
4.6 POSSIBLE APPLICATIONS OF METHOD
4.6.1 Early formative evaluation
Early in the software development process (i.e., after paper prototyping during iterativedevelopment), selected users can be involved in evaluating prototypes remotely. These userswould identify critical incidents during performance of tasks they choose to represent their ownwork patterns and a set of representative tasks predefined by evaluators, while using the user-reported critical incident method to convey critical incidents to developers.
4.6.2 Alpha, beta, and other field usability evaluation
Before new software is released to the market, selected users can assist in evaluation of alpha andbeta versions. Rather than the usual “Try it and let us know what you think”, remote users, usingthe user-reported critical incident method, can send data about software bugs and criticalincidents of usage that are potentially as useful as qualitative data collected in a usabilitylaboratory.
4.6.3 Usability evaluation after software deployment
Perhaps the most significant impetus for the user-reported critical incident method is the need fora project team to continue formative evaluation downstream, after deployment. The usual kindsof alpha and beta testing do not qualify as formative usability evaluation because they do notyield detailed data observed during usage and associated closely with specific task performance.Critical incident identification is arguably the single most important source of this kind of data.Consequently, the user-reported critical incident method was developed as a cost-effectiveremote usability evaluation technique, based on real users self-reporting critical incidentsencountered in real tasks performed in their normal working environments.
4.6.4 Customer support
After software is released to the market, the user-reported critical incident method can be utilizedto assist in customer support services (e.g., help desk application). Instead of calling a customersupport telephone number or sending email to developers, remote users, via this method, nowhave a more immediate and direct channel for feedback to developers, giving developers moredetailed and specific information about systems and interface weaknesses while getting the helpthey need. The appropriate person or team of developers can receive the report, solve thespecific problem, and email solutions back to users.

José C. Castillo Chapter 4: The User-Reported Critical Incident Method
38
4.6.5 Marketing strategies
Subjective data (e.g., from a satisfaction questionnaire) can be broadened by marketing personnelinto market-oriented product reviews revealing:
• user needs,• new features users want added to the application,• features that have not been used, and• ideas to make new products.
José C. Castillo
39
CHAPTER 5:
FEASIBILITY CASE STUDY
5.1 GOALS OF THE CASE STUDY
Step 1 of the overall research plan of the user-reported critical incident method, stated inSection 1.4, was a case study, the primary goal of which was to judge feasibility of auser-reported critical incident method. Assessing feasibility involved
• determining if this new method could provide approximately the same quantity andquality of qualitative data that can be obtained from laboratory-based formativeevaluation, and
• determining if this is possible in a way that was cost-effective for both evaluator(e.g., minimal resources for data collection and analysis) and user (e.g., minimalinterference with work).
The case study, reported in detail in Hartson et al. (1996), is summarized here.
5.2 QUESTIONS ADDRESSED BY THE CASE STUDY
The case study employed two kinds of subjects, user-subjects and expert-subjects. User-subjectshad no prior training in usability methods, and, as part of the study, were given minimal trainingto recognize critical incidents during their own usage (five minutes of lecture and a 10-minutedemonstration). Expert-subjects were interface developers, who were already trained in usabilitymethods and who performed evaluations in a usability laboratory.
Assessing feasibility, as stated in Section 5.1, translated into two research questions related to thehypotheses for the method:
1. Can user-subjects identify critical incidents approximately as well as expert-subjects?
2. How easily can expert-subjects transform contextualized critical incident data(e.g., screen-sequence clips with verbal critical incident reports in the audio) fromuser-subjects into usability problem descriptions?

José C. Castillo Chapter 5: Feasibility Case Study
40
5.3 STEPS OF THE CASE STUDY
The case study consisted of several steps:
1. Three user-subjects not knowledgeable in usability methods were trained to identifycritical incidents during their own task performance.
2. Sessions of these user-subjects performing tasks and simultaneously identifying criticalincidents were videotaped. The experimental application was one for viewing andmanipulating images from a digital still camera.
3. A panel of three expert-subjects viewed the tapes together to detect any critical incidentsmissed by user-subjects.
4. The experimenters edited the tapes into sets of video clips (sequences of video withverbal reports in the audio relating to a single critical incident), each centered around thecritical incident.
5. Two expert-subjects (different from the first three) analyzed the video clips, convertingthem into usability problem descriptions.
6. Experimenters compared the usability problem descriptions of user-subjects with those ofexpert-subjects.
Results of Step 3 provided answers to Question 1 (“Identifying critical incidents”)and results ofStep 5 gave answers to Question 2 (“Transforming critical incidents”).
5.4 USING VIDEOTAPES AS INPUT TO EXPERT-SUBJECTS
Traditional laboratory-based evaluation uses evaluators (i.e., experts in human-computerinteraction and usability methods) recording their own lists of critical incidents while observingusers in the usability laboratory. For evaluation, and excluding possible interaction with theusers, experts viewing complete tapes of users obtain data essentially equivalent to that obtainedfrom observing them in real-time via video monitors in an adjacent room.
In the case study, two tapes were made simultaneously during each user subject’s taskperformance. One video camera was used to record user-subjects (e.g., facial expressions),including audio of user-subject comments. The second tape captured screen activity via a scanconverter connected to the computer monitor. The experimenter set up the hardware andsoftware such that user-subjects were in a controlled setting in a laboratory, with nointerruptions.
It was necessary to make direct comparisons, between expert-subjects in the laboratory-basedcase and user-subjects in the remote case, of exactly the same critical incidents. The best way toaccomplish this was for expert-subjects to view tapes of user-subjects performing tasks andencountering critical incidents, without seeing user-subjects identify the critical incidents.However, critical incident identification could not be edited from the tapes without gaps or"glitches" in the tape, thus still revealing the presence of critical incidents. The experimentercould have masked this effect somewhat by introducing additional "decoy" glitches, but it wasfelt that would unnecessarily interfere with the case study. This meant that expert-subjects would
José C. Castillo Chapter 5: Feasibility Case Study
41
have had to view the tape of each entire usability session with user-subjects identifying their owncritical incidents. The expert-subjects could not ignore this aspect of user-subject behavior.Thus, the study settled on using expert-subjects to judge user-subject performance in criticalincident identification. It was felt that this produced results essentially equivalent to a directcomparison, especially for the most important case of critical incidents not found by user-subjects.
To address Question 1 (“Identifying critical incidents”), the three expert-subjects viewedunedited tapes on a pair of monitors, watching user-subjects identify their own critical incident asthey performed tasks, especially looking for critical incidents user-subjects failed to identify.Anything considered by a user-subject to be a critical incident was deemed so, by definition.Thus, expert-subjects did not look for any "false positive" identifications.
Incidentally, the experimenter found that IDEAL (Ashlund and Hix, 1992; Hix and Hartson,1994), a tool designed to support laboratory-based formative user interface evaluation, was alsouseful in supporting evaluation methods research. IDEAL provided controls for marking,viewing, editing, and synchronizing the videotapes. IDEAL also supported marking tapes wherecritical incidents began and end, allowing rapid wind/rewind to view and analyze a given criticalincident. Critical incidents could also be annotated in IDEAL by any of the expert-subjects.
5.5 REPORTING CRITICAL INCIDENTS
The user-reported critical incident method requires software instrumentation to gather criticalincident reports from users. For the case study, the instrumentation was easily simulated. First,to simulate clicking of the software Report Incident button, user-subjects pushed the space bar onthe keyboard, which was programmed to produce a “gong” sound that could be heard in the audioportion of the tape. As a substitute for entering text in a dialogue box (for example) to describe acritical incident, user-subjects gave a verbal description that was captured on the audio track ofthe videotape. Verbal descriptions (which use a non-visual output channel) did not interfere, tothe extent that typing might, with task performance during capture and observation duringevaluation.
5.6 CRITICAL INCIDENT CONTEXTS
The videotapes, including verbal comments by user-subjects, provided a complete history of useractivity. To address Question 2 (“Transforming critical incidents”), the context of each criticalincident was "packaged" by editing a short clip from the tapes. By informal experimentation itwas determined to use a 60-second video clip centered around the critical incident. This intervalprovided economical coverage for most of the data in this study. The tradeoff betweenbandwidth requirements to transmit clips on the network and richness of context was reserved fora future study. Expert-subjects reviewed the contextualized critical incidents captured from user-subjects and tried to transform each one into more specific usability problem descriptions, whilethe experimenter judged how well they did this.
José C. Castillo Chapter 5: Feasibility Case Study
42
5.7 RESULTS, DISCUSSION, LESSONS LEARNED
Although the case study was exploratory and no quantitative data were recorded, it did yieldconsiderable understanding of problems and solutions regarding the user-reported criticalincident remote evaluation method and did lend insight useful in directing future studies.
User-subjects liked the idea of having a sounding mechanism for reporting critical incidents,activated by pressing the space bar. A "gong" sound was chosen to distinguish it from all othersystem sounds, a choice that user-subjects liked because they said it was a bit like "gonging out”the designer for bad parts of the interface. User-subjects indicated a preference for using thesame sound to report both positive and negative critical incidents but user-subjects rarely, if ever,identified positive critical incidents. Also, user-subjects usually reserved the “gong” for the mostsevere critical incidents where task performance was blocked and often did not “gong” for lesssevere situations where they could perform the task but it was awkward or confusing.For example, most user-subjects had minor trouble rotating an image, but they all eventuallyfigured it out and none signaled an associated critical incident. Expert-subjects did see thistrouble with rotation as a lower severity critical incident, an example of a critical incidentrecognized by expert-subjects but not by user-subjects. There was also one case of a criticalincident identified by the experimenter but missed by all user-subjects and expert-subjects. Tosummarize the results for Question 1 (“Identifying critical incidents”), expert-subjects found veryfew critical incidents missed by user-subjects, and those problems missed were ones of lessimportance.
Of the two video sources, the tape of the scan-converted screen provided the most valuable datafor the expert-subjects and the experimenter. The camera on the user-subjects was onlyoccasionally useful for revealing when a user-subject was struggling or frustrated (e.g., poundingon the “gong” key).
The principal problem exposed by the case study was the need to prompt users continually forverbal protocol that is so essential in the tape clips for establishing task context for the criticalincidents. Even though user-subjects were asked up-front to give a continual verbal commentary,“thinking aloud”, they generally did not speak much without prompting. This problem isexacerbated in the case of remote evaluation, since an observer will not be present and the usermust be self-actuated in talking. In the case study, verbal protocol was essential for expert-subjects to establish for each critical incident what the task was, what the user-subject was tryingto do, and why the user-subject was having trouble.
A second major area where insight was gained involved the question of how to "package"contextualized critical incidents in the most cost-effective way with respect to networktransmission cost (e.g., bandwidth) and usefulness to developers. The case-study indicated theneed to examine the use of screen capture only. For remote evaluation, contextualized criticalincident packages are sent over the network from users to developers. Existing digital screencapture programs can overlay audio and text (e.g., for task descriptions) on screen images,requiring less storage and bandwidth to transmit than continuous video. One further problemwith automatically packaging contextualized critical incidents is that different kinds of criticalincidents need different intervals. For example, it is not surprising to find that showing more
José C. Castillo Chapter 5: Feasibility Case Study
43
time of the beginning of a critical incident is needed to establish clear context for morecomplicated goal-related problems than for simpler user action-level or cosmetic problems.
Results for Question 2 (“Transforming critical incidents”) showed that when task informationwas not given (i.e., expert-subjects were not told what user-subject was trying to do), expert-subjects expectedly had difficulty guessing what was happening and did not do well inidentifying usability problems associated with a critical incident. When critical incident clipswere augmented with verbal protocol about intended task and context of where the user-subjectwas in the task when the critical incident occurred, expert-subjects were generally able to identifyassociated usability problems and design flaws that led to them.
José C. Castillo
44
CHAPTER 6:
EXPLORATORY STUDY OF METHOD
6.1 GOAL AND OBJECTIVES
A detailed outline of the steps and objectives of this research were presented in Section 1.2.An exploratory study, step 3 of the overall research plan, is the primary focus of this thesis work.The study is described as exploratory because, although quantitative data was obtained, it was notthe kind of summative study that uses statistically significant results to prove or refute anexperimental hypothesis. Rather, it was an exploratory study to gain insight and understanding,under practical operating conditions, about the strengths and weaknesses of the method. Inparticular, objectives of the exploratory study were to:
• investigate feasibility and effectiveness of involving users with the user-reported criticalincident method to identify and report critical incidents in usage,
• investigate feasibility and effectiveness of transforming remotely-gathered criticalincidents into usability problem descriptions, and
• gain insight into various parameters associated with the user-reported critical incidentmethod.
6.2 PILOT STUDY
Three volunteer pilot subjects assisted in pre-testing for this study. Two pilot subjects, who werehuman-computer interaction researchers trained in usability methods, helped the experimenterevaluate the overall setup of the study. A third pilot subject, an undergraduate student who hadno prior training in usability methods, pre-tested the evaluation tasks to ensure that typical userscould perform them. In addition, this pilot subject tested a Web-based tool that user-subjectswould use to report critical incidents during performance of the evaluation tasks.
6.3 PHASE I: CRITICAL INCIDENT GATHERING
6.3.1 Participants
Twenty-four students (6 female and 18 male, 22 undergraduate and 2 graduate) participated inthe study as volunteer user-subjects. These user-subjects came from a variety of academicdisciplines including Accounting and Information Systems, Chemistry, Child Development,Computer Science, Economics, English, Engineering, Management Science, Math, Nutrition andDietetics, Philosophy, and Psychology.
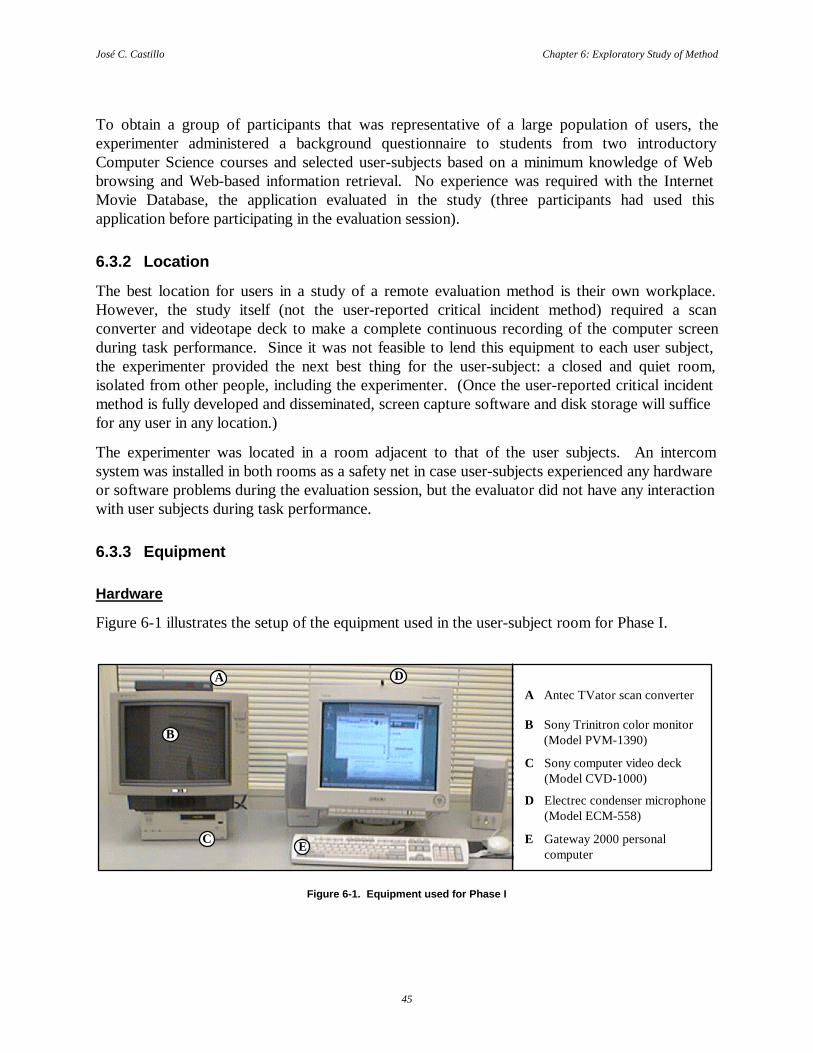
José C. Castillo Chapter 6: Exploratory Study of Method
45
To obtain a group of participants that was representative of a large population of users, theexperimenter administered a background questionnaire to students from two introductoryComputer Science courses and selected user-subjects based on a minimum knowledge of Webbrowsing and Web-based information retrieval. No experience was required with the InternetMovie Database, the application evaluated in the study (three participants had used thisapplication before participating in the evaluation session).
6.3.2 Location
The best location for users in a study of a remote evaluation method is their own workplace.However, the study itself (not the user-reported critical incident method) required a scanconverter and videotape deck to make a complete continuous recording of the computer screenduring task performance. Since it was not feasible to lend this equipment to each user subject,the experimenter provided the next best thing for the user-subject: a closed and quiet room,isolated from other people, including the experimenter. (Once the user-reported critical incidentmethod is fully developed and disseminated, screen capture software and disk storage will sufficefor any user in any location.)
The experimenter was located in a room adjacent to that of the user subjects. An intercomsystem was installed in both rooms as a safety net in case user-subjects experienced any hardwareor software problems during the evaluation session, but the evaluator did not have any interactionwith user subjects during task performance.
6.3.3 Equipment
Hardware
Figure 6-1 illustrates the setup of the equipment used in the user-subject room for Phase I.
Sony computer video deck(Model CVD-1000)
C
Sony Trinitron color monitor(Model PVM-1390)
B
Gateway 2000 personal computer
E
Antec TVator scan converterA
Electrec condenser microphone(Model ECM-558)
D
C
B
E
A D
Figure 6-1. Equipment used for Phase I
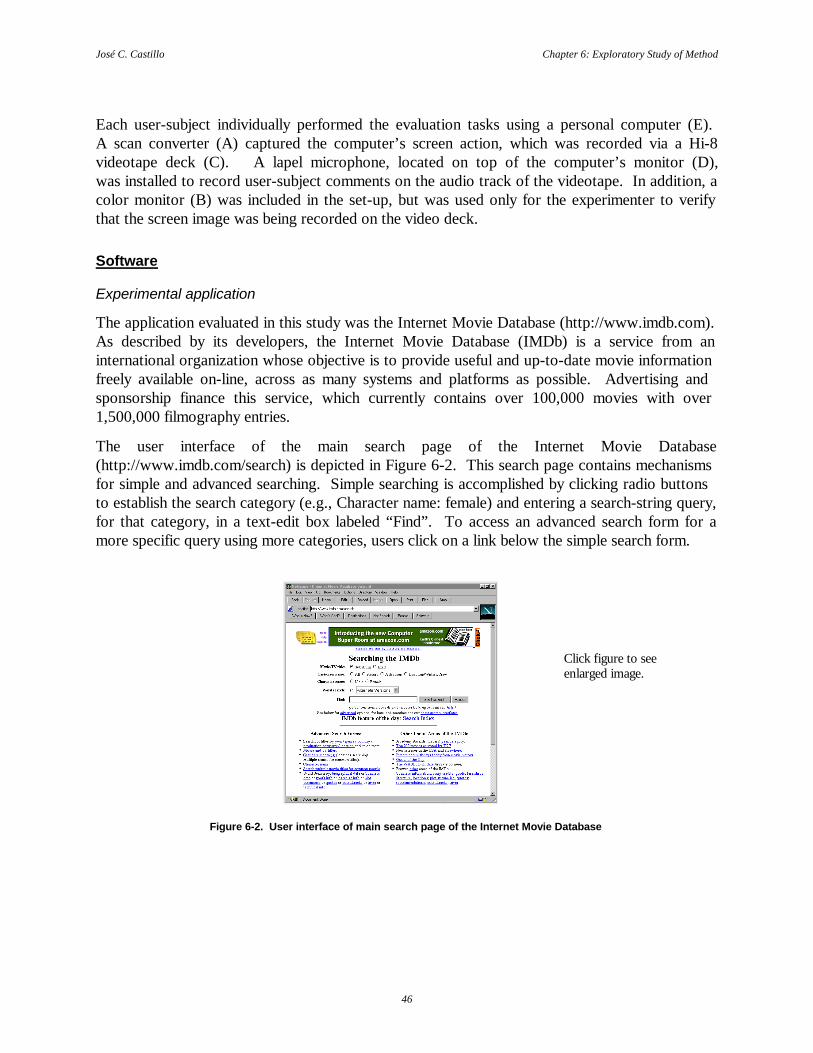
José C. Castillo Chapter 6: Exploratory Study of Method
46
Each user-subject individually performed the evaluation tasks using a personal computer (E).A scan converter (A) captured the computer’s screen action, which was recorded via a Hi-8videotape deck (C). A lapel microphone, located on top of the computer’s monitor (D),was installed to record user-subject comments on the audio track of the videotape. In addition, acolor monitor (B) was included in the set-up, but was used only for the experimenter to verifythat the screen image was being recorded on the video deck.
Software
Experimental application
The application evaluated in this study was the Internet Movie Database (http://www.imdb.com).As described by its developers, the Internet Movie Database (IMDb) is a service from aninternational organization whose objective is to provide useful and up-to-date movie informationfreely available on-line, across as many systems and platforms as possible. Advertising andsponsorship finance this service, which currently contains over 100,000 movies with over1,500,000 filmography entries.
The user interface of the main search page of the Internet Movie Database(http://www.imdb.com/search) is depicted in Figure 6-2. This search page contains mechanismsfor simple and advanced searching. Simple searching is accomplished by clicking radio buttonsto establish the search category (e.g., Character name: female) and entering a search-string query,for that category, in a text-edit box labeled “Find”. To access an advanced search form for amore specific query using more categories, users click on a link below the simple search form.
Click figure to seeenlarged image.
Figure 6-2. User interface of main search page of the Internet Movie Database

José C. Castillo Chapter 6: Exploratory Study of Method
47
Critical incident reporting tool
The critical incident reporting tool was a Web-based tool that allowed user-subjects to report, ina structured way, all critical incidents that they identified during their experimental session.Figure 6-3 depicts the sequencing relationships among the critical incident reporting tool screensand the application screen. The two windows that appear at the top of the figure providepreliminary information about the session (e.g., general instructions for the study, information onreporting critical incidents). After reading these introductory windows, user-subjects are able toaccess the experimental application and a window containing the Report Incident button.This latter window contains an instrumentation routine that allows user-subjects to report andstore critical incident data.
Internet Movie Database
Welcome windowfor evaluation session
Critical incident instructions window
Remote EvaluationControl window
Remote EvaluationReport window
Click figure to seeenlarged image.
Figure 6-3. Sequencing relationships among the screens for Phase I
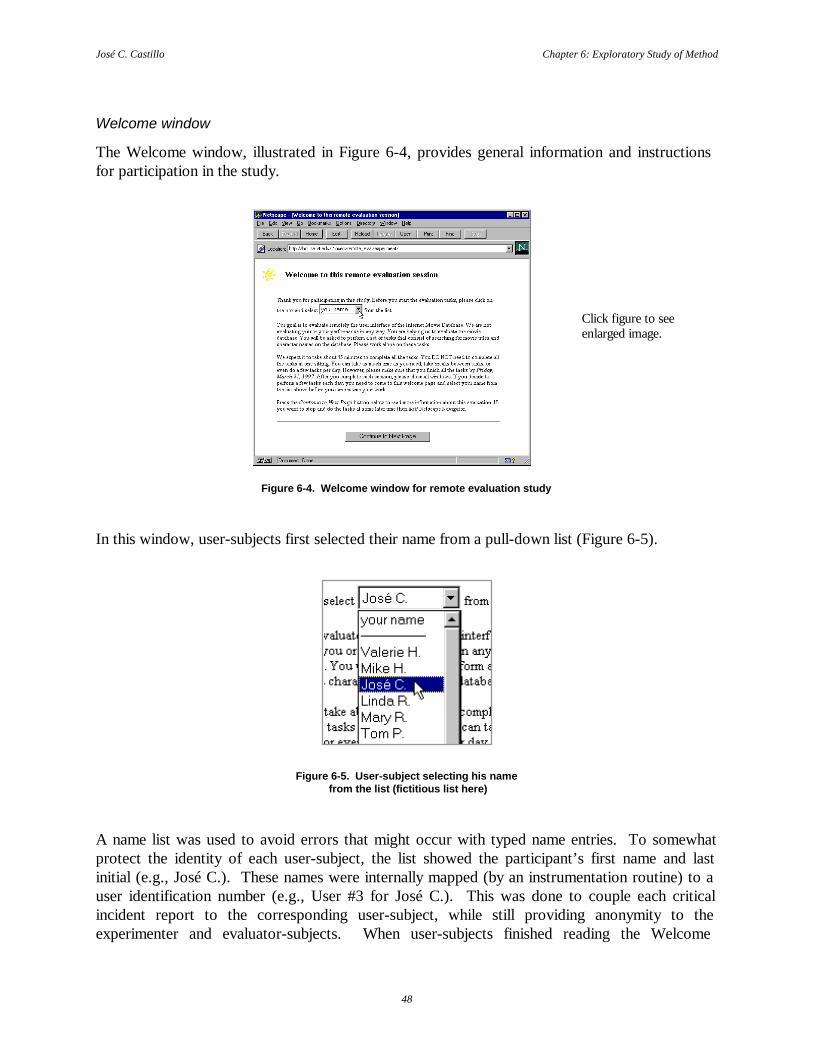
José C. Castillo Chapter 6: Exploratory Study of Method
48
Welcome window
The Welcome window, illustrated in Figure 6-4, provides general information and instructionsfor participation in the study.
Click figure to seeenlarged image.
Figure 6-4. Welcome window for remote evaluation study
In this window, user-subjects first selected their name from a pull-down list (Figure 6-5).
Figure 6-5. User-subject selecting his name from the list (fictitious list here)
A name list was used to avoid errors that might occur with typed name entries. To somewhatprotect the identity of each user-subject, the list showed the participant’s first name and lastinitial (e.g., José C.). These names were internally mapped (by an instrumentation routine) to auser identification number (e.g., User #3 for José C.). This was done to couple each criticalincident report to the corresponding user-subject, while still providing anonymity to theexperimenter and evaluator-subjects. When user-subjects finished reading the Welcome

José C. Castillo Chapter 6: Exploratory Study of Method
49
window, they clicked on the Continue to Next Page button at the bottom of the screen, to accessanother introductory page with information about reporting critical incidents.
Critical Incident Instructions window
The window illustrated in Figure 6-6 provides general information about reporting criticalincidents during task performance.
Click figure to seeenlarged image.
Figure 6-6. Critical Incident Instructions window
Remote Evaluation Control window
Figure 6-7 illustrates the Remote Evaluation Control window.
Click figure to seeenlarged image.
Figure 6-7. Remote Evaluation Control window
To begin the tasks, a user-subject clicked the Start Evaluation button in the Critical IncidentInstructions window (Figure 6-6), which opened the application window (with the Internet MovieDatabase) and the Remote Evaluation Control window. As shown in Figure 6-8, the RemoteEvaluation Control window “floated” on the desktop, running independently from theapplication. When both windows were on the screen, user-subjects could use the mouse toarrange the application window and the control window so that they could see some of eachwindow on the screen.

José C. Castillo Chapter 6: Exploratory Study of Method
50
Click figure to seeenlarged image.
Figure 6-8. Positioning of the Remote Evaluation Controlwindow and the application window
Whenever user-subjects clicked on the Report Incident button, an instrumentation routine wasactivated that opened the Remote Evaluation Report window, for user-subjects to report criticalincident information.
Remote Evaluation Report window
User-subjects, as shown in Figure 6-9, used the Remote Evaluation Report window (Figure 6-10)to report all critical incidents they identified during task performance.
Click figure to see enlarged image.
Figure 6-9. Snapshot of a user whileperforming the experimental tasks
Figure 6-10. Remote Evaluation Report window
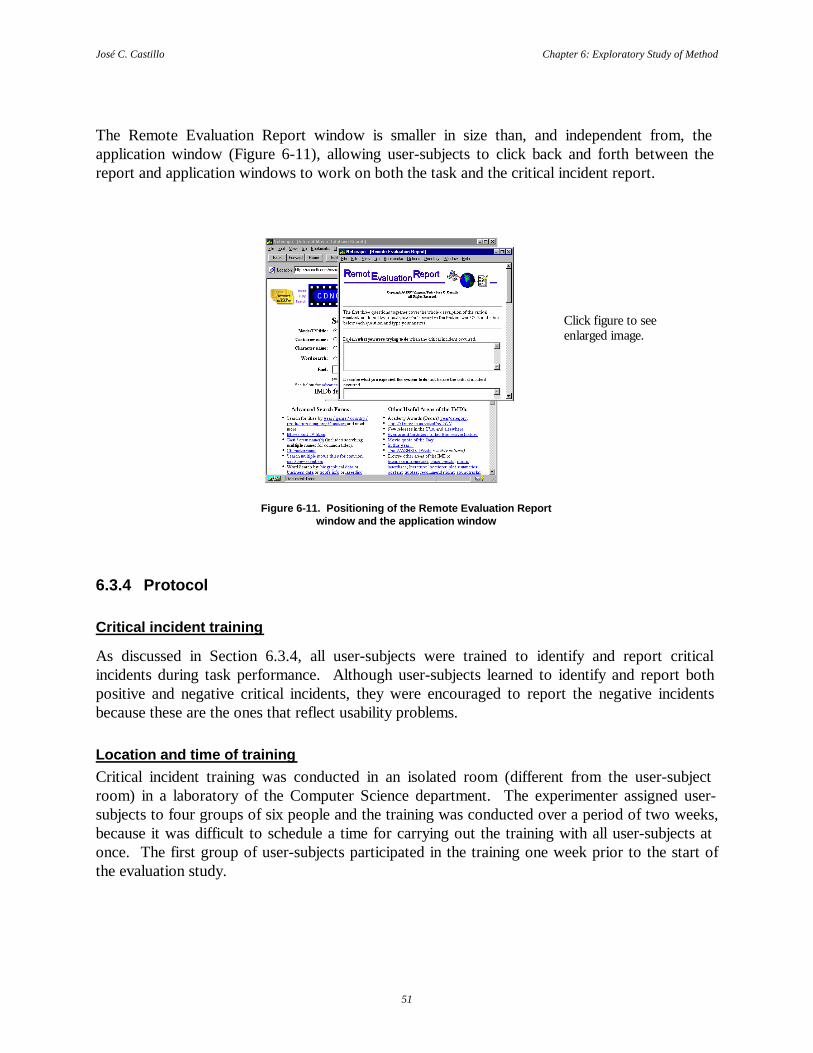
José C. Castillo Chapter 6: Exploratory Study of Method
51
The Remote Evaluation Report window is smaller in size than, and independent from, theapplication window (Figure 6-11), allowing user-subjects to click back and forth between thereport and application windows to work on both the task and the critical incident report.
Click figure to seeenlarged image.
Figure 6-11. Positioning of the Remote Evaluation Reportwindow and the application window
6.3.4 Protocol
Critical incident training
As discussed in Section 6.3.4, all user-subjects were trained to identify and report criticalincidents during task performance. Although user-subjects learned to identify and report bothpositive and negative critical incidents, they were encouraged to report the negative incidentsbecause these are the ones that reflect usability problems.
Location and time of training Critical incident training was conducted in an isolated room (different from the user-subjectroom) in a laboratory of the Computer Science department. The experimenter assigned user-subjects to four groups of six people and the training was conducted over a period of two weeks,because it was difficult to schedule a time for carrying out the training with all user-subjects atonce. The first group of user-subjects participated in the training one week prior to the start ofthe evaluation study.

José C. Castillo Chapter 6: Exploratory Study of Method
52
Assignment of user-subjects to type of training User-subjects were randomly assigned to two separate groups, twelve people in each group.Group 1 watched a training videotape (discussed below), but Group 2 did not. Both groupsreceived a brief explanation (about five minutes) of identifying and reporting critical incidentsand immediately, in a practice session, identified and reported critical incidents while performinga representative task using the Internet Movie Database.
Table 6-1 summarizes the division of critical incident training into video presentation andpractice for the two groups.
Table 6-1. Structure of critical incident training
SESSION DESCRIPTION TIME (MIN.)
VideoPresentation
(Group 1 only)
Video with extensive explanation and examples about identifying criticalincidents
20
Practice (Both Groups)
Brief review and discussion about both identifying and reporting criticalincidents Immediate practice for identifying and reporting critical incidents whiledoing a representative task on the movie database
5
20
Total, Group 1 Total, Group 2
45 min. 25 min.
Video-presentation session The experimenter developed a 20-minute videotape for a consistent presentation aboutidentifying critical incidents (not including information about reporting critical incidents).Only user-subjects of Group 1 saw the videotape, which showed a narrator first playing the roleof a user who was identifying critical incidents while working on the following tasks:
• deleting a file in a personal document retrieval system,• formatting a diskette in DOS format using a Macintosh computer, and• counting game penalties using a Web-based counter (Figure 6-12).

José C. Castillo Chapter 6: Exploratory Study of Method
53
Critical Incident: User accidentally clicked the Reset button instead of the + button.
Solution: Redesign buttons such that the + button is separate from and larger than the other (less often used) buttons.
Click figure to seeenlarged image.
Figure 6-12. Critical incident found on a Web-based counter
After encountering each critical incident, the narrator of the video changed his role from a user toa knowledgeable evaluator, who carefully explained:
• the reason why that particular situation was considered a critical incident,• the severity of the critical incident, and• a possible solution to fix the problem.
The last part of the videotape showed the user experiencing critical incidents while doing a fourthtask, changing the auto-save option in Microsoft Word to store the file every1 ½ minutes. The experimenter stopped the videotape before it revealed the explanation of thecritical incidents and initiated a discussion so that user-subjects, as a group, identified andexplained the critical incidents that occurred during that particular task.
Practice session The practice session, taken by all 24 user-subjects, gave hands-on experience in reporting criticalincidents using the Web-based tool. The practice session for Group 1 was given immediatelyafter they watched the training videotape. Practice began with a five-minute review by theexperimenter of identifying and reporting critical incidents. This brief review and discussion wasfollowed by a twenty-minute session, where user-subjects performed a representative task withthe Internet Movie Database (i.e., Find the biography of actor Denzel Washington) and practicedidentifying and reporting critical incidents with the Web-based tool.
Search tasks
Each user-subject performed the same six search tasks using the Internet Movie Database.The experimenter created the tasks shown below to approximate tasks that a typical user wouldperform with the movie database.
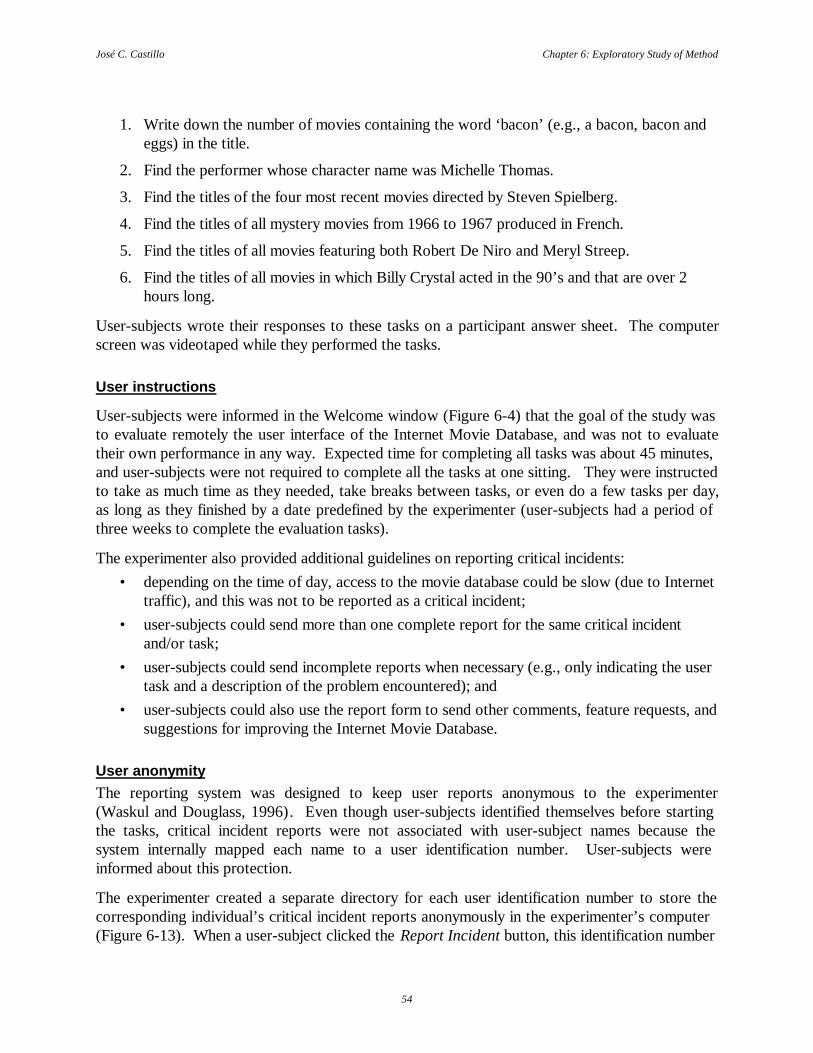
José C. Castillo Chapter 6: Exploratory Study of Method
54
1. Write down the number of movies containing the word ‘bacon’ (e.g., a bacon, bacon andeggs) in the title.
2. Find the performer whose character name was Michelle Thomas.
3. Find the titles of the four most recent movies directed by Steven Spielberg.
4. Find the titles of all mystery movies from 1966 to 1967 produced in French.
5. Find the titles of all movies featuring both Robert De Niro and Meryl Streep.
6. Find the titles of all movies in which Billy Crystal acted in the 90’s and that are over 2hours long.
User-subjects wrote their responses to these tasks on a participant answer sheet. The computerscreen was videotaped while they performed the tasks.
User instructions
User-subjects were informed in the Welcome window (Figure 6-4) that the goal of the study wasto evaluate remotely the user interface of the Internet Movie Database, and was not to evaluatetheir own performance in any way. Expected time for completing all tasks was about 45 minutes,and user-subjects were not required to complete all the tasks at one sitting. They were instructedto take as much time as they needed, take breaks between tasks, or even do a few tasks per day,as long as they finished by a date predefined by the experimenter (user-subjects had a period ofthree weeks to complete the evaluation tasks).
The experimenter also provided additional guidelines on reporting critical incidents:• depending on the time of day, access to the movie database could be slow (due to Internet
traffic), and this was not to be reported as a critical incident;• user-subjects could send more than one complete report for the same critical incident
and/or task;• user-subjects could send incomplete reports when necessary (e.g., only indicating the user
task and a description of the problem encountered); and• user-subjects could also use the report form to send other comments, feature requests, and
suggestions for improving the Internet Movie Database.
User anonymity The reporting system was designed to keep user reports anonymous to the experimenter(Waskul and Douglass, 1996). Even though user-subjects identified themselves before startingthe tasks, critical incident reports were not associated with user-subject names because thesystem internally mapped each name to a user identification number. User-subjects wereinformed about this protection.
The experimenter created a separate directory for each user identification number to store thecorresponding individual’s critical incident reports anonymously in the experimenter’s computer(Figure 6-13). When a user-subject clicked the Report Incident button, this identification number
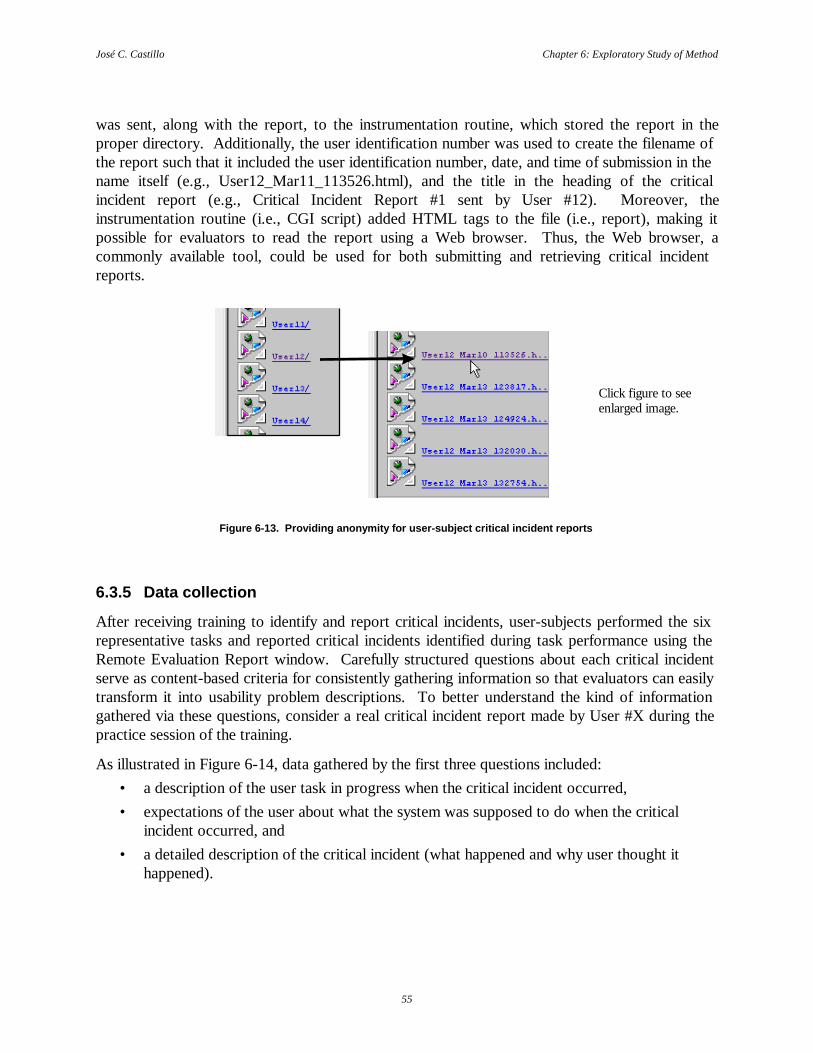
José C. Castillo Chapter 6: Exploratory Study of Method
55
was sent, along with the report, to the instrumentation routine, which stored the report in theproper directory. Additionally, the user identification number was used to create the filename ofthe report such that it included the user identification number, date, and time of submission in thename itself (e.g., User12_Mar11_113526.html), and the title in the heading of the criticalincident report (e.g., Critical Incident Report #1 sent by User #12). Moreover, theinstrumentation routine (i.e., CGI script) added HTML tags to the file (i.e., report), making itpossible for evaluators to read the report using a Web browser. Thus, the Web browser, acommonly available tool, could be used for both submitting and retrieving critical incidentreports.
Click figure to seeenlarged image.
Figure 6-13. Providing anonymity for user-subject critical incident reports
6.3.5 Data collection
After receiving training to identify and report critical incidents, user-subjects performed the sixrepresentative tasks and reported critical incidents identified during task performance using theRemote Evaluation Report window. Carefully structured questions about each critical incidentserve as content-based criteria for consistently gathering information so that evaluators can easilytransform it into usability problem descriptions. To better understand the kind of informationgathered via these questions, consider a real critical incident report made by User #X during thepractice session of the training.
As illustrated in Figure 6-14, data gathered by the first three questions included:• a description of the user task in progress when the critical incident occurred,• expectations of the user about what the system was supposed to do when the critical
incident occurred, and• a detailed description of the critical incident (what happened and why user thought it
happened).

José C. Castillo Chapter 6: Exploratory Study of Method
56
Click figure to seeenlarged image.
Figure 6-14. Indication of user task and description of the critical incident
The pilot study revealed that, for some user-subjects, it was not obvious that the Report windowcontained more than three questions; thus, the experimenter instructed user-subjects not to writeall the explanation of the critical incident in the answer to the first question and to use thescrollbar to find the remaining questions.
The next four questions (Figure 6-15) were used to gather the following data:• an indication of whether the user could recover from the critical incident and, if so, a
description of how the user did so,• an indication of the user’s ability to reproduce the critical incident, and• a severity rating of the critical incident.
Click figure to seeenlarged image.
Figure 6-15. Indication of how user got out of the situation, ability to recover andreproduce the critical incident, and severity of the critical incident.

José C. Castillo Chapter 6: Exploratory Study of Method
57
With the last two questions, shown in Figure 6-16, user-subjects were asked to:• send additional comments, suggestions, or possible solutions for fixing the problem, and• enter the URL (or location) of the page where the user-subject found the critical incident.
Click figure to seeenlarged image.
Figure 6-16. Suggestions for fixing the problem and location ofthe page with critical incident
After typing a critical incident report, user-subjects were able to send the report to theexperimenter or to discard it (i.e., by clicking Do Not send report button). Following theevaluation session, all 24 user-subjects completed a satisfaction questionnaire (Appendix C.2)asking about their experience as remote users. During data analysis (Section 6.3.6), theexperimenter found that he needed more information from user-subjects, so he administered asecond questionnaire (Appendix C.3), but only 18 user-subjects completed it.
6.3.6 Data analysis
After all data gathering was completed, the experimenter reviewed the 24 one-hour videotapestwice, tagging and coding critical incident data, to determine:
• the specific instant at which user-subjects identified the critical incidents (before or aftercompleting a task),
• the quantity and severity ratings of critical incidents missed by user-subjects,• the relevance of audio for the method, and• any other useful information relevant to help identify critical incidents.
Additionally, the experimenter produced contextualized critical incident packages, for evaluator-subjects in Phase II to transform into usability problem descriptions, by:
• randomly selecting critical incident reports and videotapes from six user-subjects whoparticipated in both the videotape training and practice session of the training,
• carefully selecting one good (i.e., complete and precise) report for each of the tasks(one report per user-subject), and

José C. Castillo Chapter 6: Exploratory Study of Method
58
• using a video mixer and controller to edit each videotape and create a new tape containingsix screen-sequenced clips of fixed length (three minutes long) mapping to the criticalincident reports.
Regarding the latter point, the earlier case study (Hartson et al., 1996) used two-minute clipssuccessfully. Three-minute clips were used in this thesis study to determine if the extra lengthwould provide more useful information. From feedback of evaluator-subjects, discussed later,two minutes probably would have been enough.
6.4 PHASE II: TRANSFORMATION OF CRITICAL INCIDENT DATA INTOUSABILITY PROBLEM DESCRIPTIONS
6.4.1 Participants
Four volunteer participants (two graduate students from Computer Science and two fromIndustrial and Systems Engineering all trained in usability methods) served as evaluator-subjects.Their role was to analyze critical incident reports sent by user-subjects and convert them intousability problem descriptions.
6.4.2 Location, equipment, and materials
Since evaluator-subjects did not require any special equipment to analyze critical incident data,they were able to do the analysis at their place of preference (e.g., home, office). The onlyequipment used by two of the evaluator-subjects (the other two did not need it, as discussedbelow) was a VCR and a video monitor to watch video clips containing critical incident data.
Critical incident reports were presented to all evaluator subjects on paper. Because criticalincident reports were accessed as hypertext documents, it was essential to ensure that thesereports were easy to read with a minimum of scrolling. Figure 6-17 illustrates how criticalincident information was organized for the report sent by User #X discussed in Section 6.3.5.
Heading of critical incident report
Body of criticalincident report
#X
Click figure to seeenlarged image.
Figure 6-17. Critical incident report from User #X

José C. Castillo Chapter 6: Exploratory Study of Method
59
A critical incident report consists of two parts: the heading and the body. The heading includesthe number or sequence of the report (e.g., Report #1), the sender (e.g., User #X), the date andtime of submission (e.g., Mon Mar 10 11:35:26 1997), and the amount of time the user-subjectspent typing the critical incident report (e.g., 5 minutes 29 seconds). The body contains contentinformation, answers to the questions, an specific information about the critical incident.
6.4.3 Protocol and data collection
The experimenter reviewed all 74 critical incident reports to select six reports from differentuser-subjects, each report mapping to one of the tasks and containing information of good quality(considering the completeness and accuracy of the report). After carefully selecting these reports,the experimenter edited the videotape corresponding to each of the reports to create a short 3-minute clip for each critical incident. Each clip was manually determined by the experimenter tobe the 3-minute interval most useful in identifying the usability problem associated with thecritical incident. The end product was a VHS tape containing six critical incident clips.
Two independent evaluator-subjects each analyzed six contextualized critical incident packages(i.e., a paper copy of each critical incident report and the tape containing the critical incidentclips) and created a list of usability problem descriptions. Two other independent evaluator-subjects analyzed only the critical incident reports (no video clips) to create a list of usabilityproblem descriptions. In addition, all four evaluator-subjects completed a satisfactionquestionnaire (Appendices C.3 and C.4) asking about their experience as evaluators in a remoteusability situation.
6.4.4 Data analysis
The experimenter compared the four lists of usability problem descriptions created by evaluator-subjects and analyzed their answers to the questionnaire to determine:
• the feasibility (i.e., time and effort) of transforming remotely-reported critical incidentdata into usability problem descriptions;
• the level of agreement about severity ratings of critical incidents between user-subjectsand evaluator-subjects;
• the quality of the content of the critical incident reports; and• the role of video, text, and audio during analysis of critical incident data.
José C. Castillo
60
CHAPTER 7:
EXPECTATIONS, DISCUSSION,LESSONS LEARNED
Section 1.3.2, Steps and objectives, contains a summary of the objectives of the exploratory studyof the user-reported critical incident method. Each of these objectives, respectively, maps to aresearch question (Table 7-1), discussed in detail here.
Table 7-1. Objectives and research questions of the study
Objective Type of question Question
1 User-related Can users report their own critical incidents and how well can they do it?
2 Evaluator-related Can evaluators use critical incident data to produce usability problemdescriptions and how well can they do it?
3 Method- andstudy-related
What are the variables and values that make the method work best?
7.1 USER-RELATED RESEARCH QUESTION: CAN USERS REPORT THEIR OWNCRITICAL INCIDENTS AND HOW WELL CAN THEY DO IT?
Objective 1 of Section 1.2.2 translates to the following research question: Can users report theirown critical incidents and how well can they do it? In this study, Objective 1 is divided into thefollowing sub-objectives:
1. Explore issues about user-subject performance in identifying and reporting criticalincidents:
• User-subject ability to identify and report critical incidents during taskperformance
• User-subject activity sequencing and timing in reporting critical incidents• Level of time and effort required to report critical incidents• User-subject ability to rate severity of critical incidents• User-subject ability to identify high severity critical incidents as well as low and
medium severity critical incidents

José C. Castillo Chapter 7: Expectations, Discussion, Lessons Learned
61
2. Obtain subjective data about user-subject perceptions, preferences, and attitudes towardsremotely-reporting critical incidents:
• User-subject attitudes towards remotely-reporting critical incidents• User-subject preferences with respect to reporting critical incidents anonymously• User-subject perceptions with respect to interference with user tasks• User-subject preferences relating to reporting negative and positive critical
incidents
Each of these sub-objectives is discussed here.
7.1.1 Issues about user-subject performance in identifying and reporting criticalincidents
User-subject ability to identify and report critical incidents during task performance
Expectation #1: User-subjects will be able to report their own critical incidents during task performance.
For each user-subject, the experimenter watched full videotapes to identify the number of criticalincidents that each participant encountered and reported during task performance (Figure 7-1).
0
2
4
6
1 2 3 4 5 6 7 8 9 10 11 12 13 14 15 16 17 18 19 20 21 22 23 24
User-subject identification number
Reported by user-subject
Identified by experimenter
Tota
l num
ber
of
criti
cal i
ncid
ents
Figure 7-1. Number of critical incidents reported by all 24 user-subjects

José C. Castillo Chapter 7: Expectations, Discussion, Lessons Learned
62
Across all user-subjects, the experimenter found 97 critical incidents (Figure 7-2): 66 reported byboth experimenter and user-subjects and 31 identified only by the experimenter (mostly of lowseverity – see Figure 7-15). User-subjects sent a total of 74 critical incident reports (mean: 3.1reports per user-subject, standard deviation: 1.7). Interestingly, 8 low severity critical incidentswere reported by user-subjects in cases where the experimenter did not recognize from reviewtapes that user-subjects were experiencing a critical incident. The experimenter did not,however, consider these as gratuitous reports sent to please the experimenter, concluding thatthese critical incidents were known in the minds of the user-subjects but not evident visually inthe videotapes. Nevertheless, these 8 reports were not considered during data analysis.
8 66 31
User-subjectsonly
Both user-subjects and experimenter
Experimenteronly
User-subjects: 74
Experimenter: 97
Figure 7-2. Number of critical incidents identifiedby user-subjects and experimenter
Figure 7-3 illustrates a characterization of the number of critical incidents reported by user-subjects: 9 user-subjects reported more than 3 critical incidents, 7 user-subjects reported 3 criticalincidents, and 8 user-subjects reported less than 3 incidents.
1
43
7
5
1
3
0
2
4
6
8
none 1 2 3 4 5 6
Number of critical incidents reported by user-subjects
Num
ber
of
user
-sub
ject
s
Figure 7-3. Number of critical incidents reported by user-subjects

José C. Castillo Chapter 7: Expectations, Discussion, Lessons Learned
63
Four user-subjects reported all experimenter-identified critical incidents, 10 user-subjects missed1 critical incident, 9 user-subjects missed 2 critical incidents, and 1 user-subject missed 3 criticalincidents (Figure 7-4). Although one user-subject (see user-subject #24 in Figure 7-1) did notreport any critical incident, the experimenter identified two critical incidents (of low and mediumseverity) from watching the videotape for that user-subject.
4
109
1
0
4
8
12
none 1 2 3
Num
ber
of
user
-sub
ject
s
Number of critical incidents
Figure 7-4. Number of critical incidentsmissed by user-subjects
Results indicated that users, even when working in their daily job environment and lackinginteraction with evaluators, are capable of self-reporting critical incidents encountered duringtask performance.
Expectation #2: Only a few user-subjects may call the experimenter for assistance in solving a problemand/or task.
In real life situations, users located in their natural work setting lack the means to contactevaluators (or application developers) when critical incidents occur. To simulate this lack ofinteraction in the study, user-subjects were isolated and told they were on their own during theevaluation session. The experimenter was located in a room adjacent to that of the user-subjects.An intercom system was installed in both rooms as a safety net and user-subjects were instructedto use it only when they experienced hardware or software problems that prevented them fromcontinuing with the tasks. Regardless of this restriction, it was expected that a few user-subjectsmight still call the experimenter for assistance in solving a problem and/or task.
During the sessions, two user-subjects (out of 24) experienced sufficient dissatisfaction whileworking on the final search task to leave the user-subject room and ask the experimenter forassistance in solving the task. Another user-subject left the testing room and asked theexperimenter how to reinstate the Remote Evaluation Control window (containing the ReportIncident button) which had been accidentally closed. Only one user-subject used the intercomsystem to ask the experimenter for assistance, and this occurred when the Web browser crashed.

José C. Castillo Chapter 7: Expectations, Discussion, Lessons Learned
64
User-subject activity sequencing and timing in reporting critical incidents
Expectation #3: User-subject activity for reporting a critical incident will be somewhat structured(i.e., following the sequence of going to the Remote Evaluation Report window and answering allquestions, returning to the application window only to copy the URL of the Web page with theusability problem).
Contrary to expectations, user-subjects exhibited considerable variation in the ways they reportedcritical incidents. Following are some examples of this:
• placing the Remote Evaluation Report window on top of the application, answering allquestions of the report window, and clicking back the application window only to copythe URL of the Web page where the critical incident was found,
• placing the Remote Evaluation Report window and the application window side-by-sideto click back and forth between the windows and complete the critical incident report,
• placing the Remote Evaluation Report window and the application window side-by-sideand clicking back and forth between the windows to continue working on the task andalso answering the questions of the critical incident report,
• minimizing the Remote Evaluation Report window, recreating the steps followed whenthe critical incident occurred with the application, and reporting each step in detail,
• sending incomplete reports (i.e., not answering all questions on the Remote EvaluationReport window), and
• sending consecutive reports (i.e., two reports with no intervening task performance).
Expectation #4: User-subjects will send one report per critical incident.
The expectation for one report per critical incident was not met by all user-subjects. Only twouser-subjects sent one report per critical incident. On six occasions, user-subjects sentconsecutive critical incident reports (i.e., two reports with no intervening task performance):
• to report multiple critical incidents encountered while working on the same task,• to add extra information a user may have forgotten to include in a previous critical
incident report (about the same or different task), and• to report critical incidents that occurred while working on different tasks.
In an example of this latter point, one user-subject sent two consecutive critical incident reportsabout two different tasks. The second report was about an incident that occurred 20 minutesearlier while working on a task that the user-subject never completed. Apparently something inthe first of the two reports lead the user to remember the earlier incident, or perhaps the user-subject was “batching” reports.
Expectation #5: Implicit in the questions of the Remote Evaluation Report window is the assumption that asingle reporting format fits all reporting needs.
Contrary to expectations, user-subjects indicated the need for more than one reporting format.For example, 3 user-subjects indicated that a few situations seemed too insignificant to meritsending a complete critical incident report. Other user-subjects sent incomplete critical incident
José C. Castillo Chapter 7: Expectations, Discussion, Lessons Learned
65
reports because they could not answer some of the questions (e.g., a user-subject nevercompleted a task and, therefore, could not answer the question about how to get out of thesituation). Further, some user-subjects suggested the need for sending quick questions orcomments about the application, when the detailed questions in the formal critical incident reportwere not appropriate or warranted. This outcome led to redesign of the critical incident reportingtool. A more detailed explanation of this topic is presented in the lessons learned for Expectation#6.
Expectation #6: The flow of the reports during task performance will be somewhat structured(i.e., following the sequence of task performance, critical incident, and report)
The expectation for a structured flow of reports during task performance (e.g., task performance,critical incident identification, and reporting) was not met by all user-subjects. Not surprisingly,high severity critical incidents had the most disruptive impact on task performance and flow ofactivities. Eleven user-subjects sent high severity critical incident reports for tasks they nevercompleted. Sometimes when encountering a critical incident, user-subjects gave up andcontinued to the next task without any effort to complete the current task. Sometimes theyjumped to the next task but later came back to work on the troublesome task (with or withoutsuccess).
For example, one user-subject could not find the answer to corresponding to a particular retrievaltask and continued with the next task. After completing the last task, the user-subject came backto work on a previous unfinished task but became frustrated (user-subject comments: “Forget it.I give up!”) and sent a critical incident report, still without completing the task. Another user-subject could not complete the last three tasks and worked with them on and off at random timesinstead of one after the other which lead to unordered critical incident reports.
Expectation #7: Most users-subjects will report critical incidents immediately after they occur.
Substantial variation was observed in user-subject behavior with regard to timing of criticalincident reports. User-subjects reported critical incidents during task performance, immediatelyafter the task ended, at a later time, or never did report the critical incident. Although user-subjects were directed to send a report immediately after encountering a critical incident, theysent 52 (or 70%) of all 74 critical incidents reports (Figure 7-5) after the task ended:
• with successful completion,• with incorrect results (unknown to user-subject), or• as an abandoned task with no results.
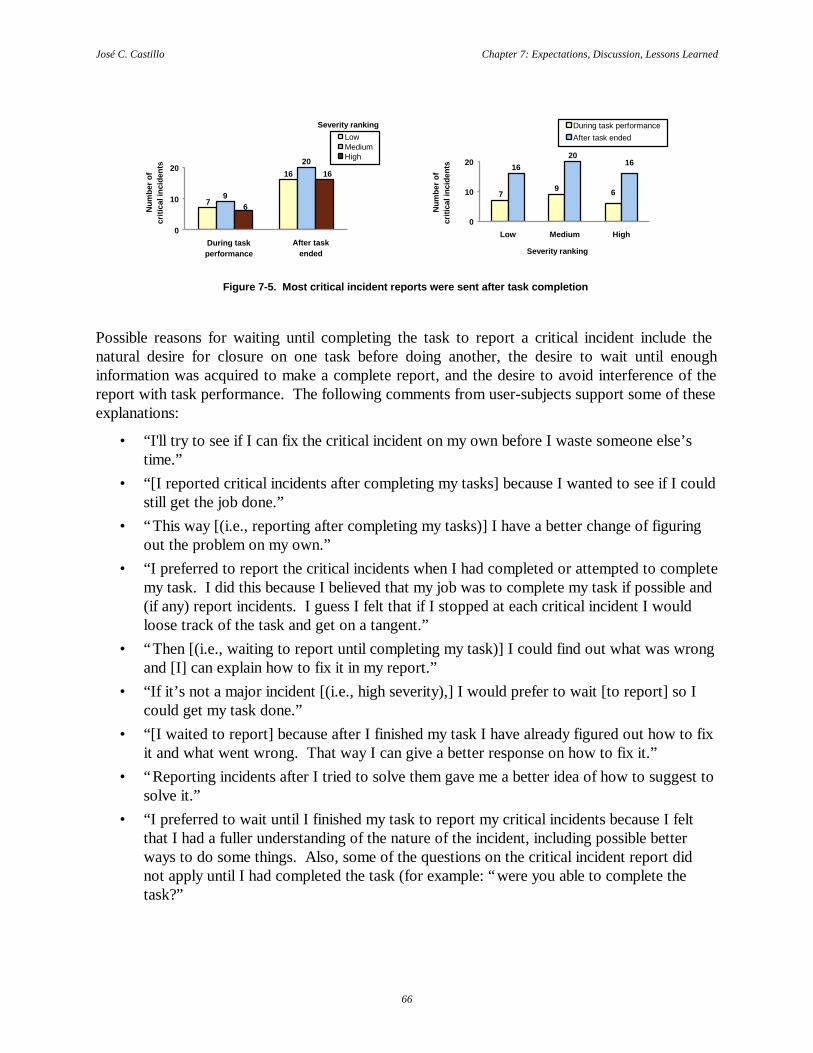
José C. Castillo Chapter 7: Expectations, Discussion, Lessons Learned
66
7
16
9
20
6
16
0
10
20
LowMediumHigh
Num
ber
of
criti
cal i
ncid
ents
Severity ranking
During taskperformance
After taskended
6
16
79
1620
0
10
20
Low Medium High
During task performanceAfter task ended
Num
ber
of
criti
cal i
ncid
ents
Severity ranking
Figure 7-5. Most critical incident reports were sent after task completion
Possible reasons for waiting until completing the task to report a critical incident include thenatural desire for closure on one task before doing another, the desire to wait until enoughinformation was acquired to make a complete report, and the desire to avoid interference of thereport with task performance. The following comments from user-subjects support some of theseexplanations:
• “I'll try to see if I can fix the critical incident on my own before I waste someone else’stime.”
• “[I reported critical incidents after completing my tasks] because I wanted to see if I couldstill get the job done.”
• “This way [(i.e., reporting after completing my tasks)] I have a better change of figuringout the problem on my own.”
• “I preferred to report the critical incidents when I had completed or attempted to completemy task. I did this because I believed that my job was to complete my task if possible and(if any) report incidents. I guess I felt that if I stopped at each critical incident I wouldloose track of the task and get on a tangent.”
• “Then [(i.e., waiting to report until completing my task)] I could find out what was wrongand [I] can explain how to fix it in my report.”
• “If it’s not a major incident [(i.e., high severity),] I would prefer to wait [to report] so Icould get my task done.”
• “[I waited to report] because after I finished my task I have already figured out how to fixit and what went wrong. That way I can give a better response on how to fix it.”
• “Reporting incidents after I tried to solve them gave me a better idea of how to suggest tosolve it.”
• “I preferred to wait until I finished my task to report my critical incidents because I feltthat I had a fuller understanding of the nature of the incident, including possible betterways to do some things. Also, some of the questions on the critical incident report didnot apply until I had completed the task (for example: “were you able to complete thetask?”

José C. Castillo Chapter 7: Expectations, Discussion, Lessons Learned
67
• “[I report critical incidents after completing my task to] see if anything happens along theway.”
• “Then I can see what impact the incident had on my task.”
Two user-subjects, however, indicated preference for reporting each critical incident immediatelyafter its occurrence so they do not forget to report the incident (user-subject comments: “[I preferto report a critical incident immediately after it occurs] so [the situation] is fresh in my mind,otherwise I would probably forget to report it”).
In an attempt to learn more about the nature of the timing issues, the experimenter watched all24 videotapes yet again. For each critical incident report, the experimenter determined the pointin time when it was first evident that a critical incident had occurred. As illustrated inFigure 7-6, the average time interval between this time and the point of reporting was 2 minutesand 42 seconds (standard deviation of 5.5). The shortest delays occurred when reporting lowseverity critical incidents the longest for high severity ones.
0 2 4
A verage report ing delay in minutes
All reports2 min 42 sec
Low severity 24 sec
Medium severity2 min 30 sec
High severity4 min 30 sec
Severityranking
Mean(reporting time)
Standarddeviation
Low 2 min. 42 sec. 5.5Medium 24 sec. 0.5
High 4 min. 30 sec. 6.6
Figure 7-6. Average delay in reportingafter clear onset of critical incidents
Delays roughly corresponded with severity of the critical incident. The presumption is that amore severe critical incident requires more information to report and, therefore, results in a largerdelay before reporting.
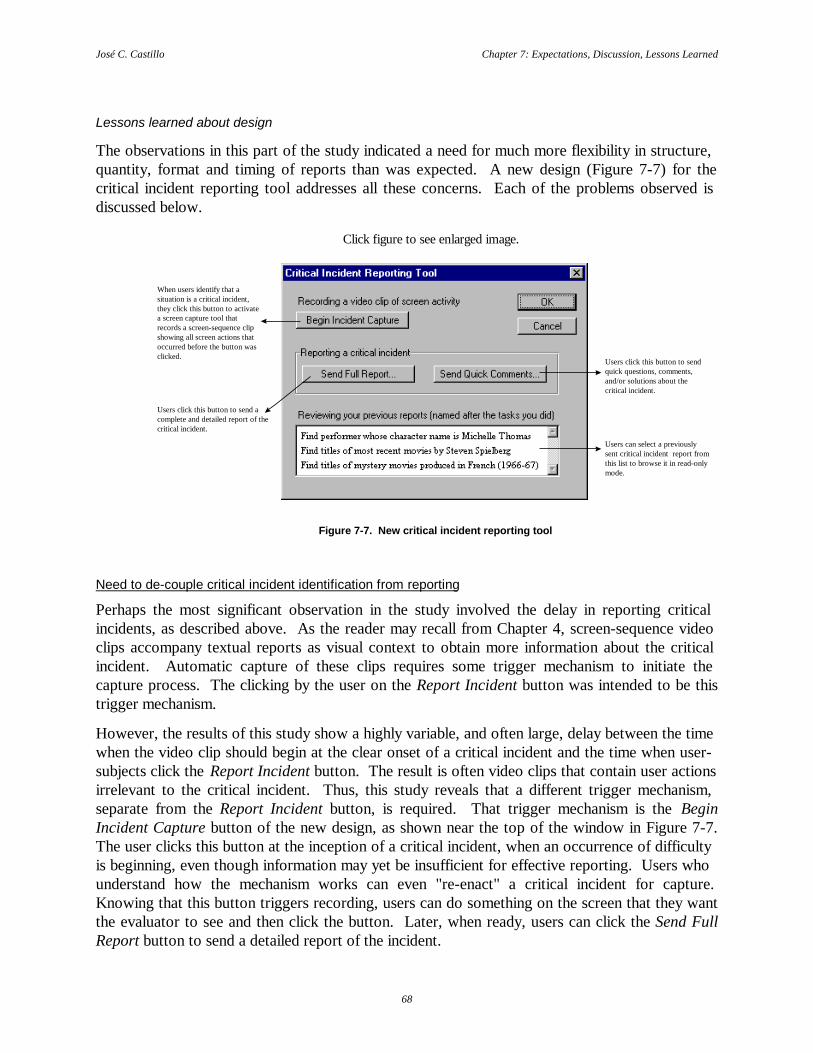
José C. Castillo Chapter 7: Expectations, Discussion, Lessons Learned
68
Lessons learned about design
The observations in this part of the study indicated a need for much more flexibility in structure,quantity, format and timing of reports than was expected. A new design (Figure 7-7) for thecritical incident reporting tool addresses all these concerns. Each of the problems observed isdiscussed below.
Click figure to see enlarged image.
Users click this button to sendquick questions, comments,and/or solutions about thecritical incident.
Users click this button to send acomplete and detailed report of thecritical incident.
When users identify that asituation is a critical incident,they click this button to activatea screen capture tool thatrecords a screen-sequence clipshowing all screen actions thatoccurred before the button wasclicked.
Users can select a previouslysent critical incident report fromthis list to browse it in read-onlymode.
Figure 7-7. New critical incident reporting tool
Need to de-couple critical incident identification from reporting
Perhaps the most significant observation in the study involved the delay in reporting criticalincidents, as described above. As the reader may recall from Chapter 4, screen-sequence videoclips accompany textual reports as visual context to obtain more information about the criticalincident. Automatic capture of these clips requires some trigger mechanism to initiate thecapture process. The clicking by the user on the Report Incident button was intended to be thistrigger mechanism.
However, the results of this study show a highly variable, and often large, delay between the timewhen the video clip should begin at the clear onset of a critical incident and the time when user-subjects click the Report Incident button. The result is often video clips that contain user actionsirrelevant to the critical incident. Thus, this study reveals that a different trigger mechanism,separate from the Report Incident button, is required. That trigger mechanism is the BeginIncident Capture button of the new design, as shown near the top of the window in Figure 7-7.The user clicks this button at the inception of a critical incident, when an occurrence of difficultyis beginning, even though information may yet be insufficient for effective reporting. Users whounderstand how the mechanism works can even "re-enact" a critical incident for capture.Knowing that this button triggers recording, users can do something on the screen that they wantthe evaluator to see and then click the button. Later, when ready, users can click the Send FullReport button to send a detailed report of the incident.
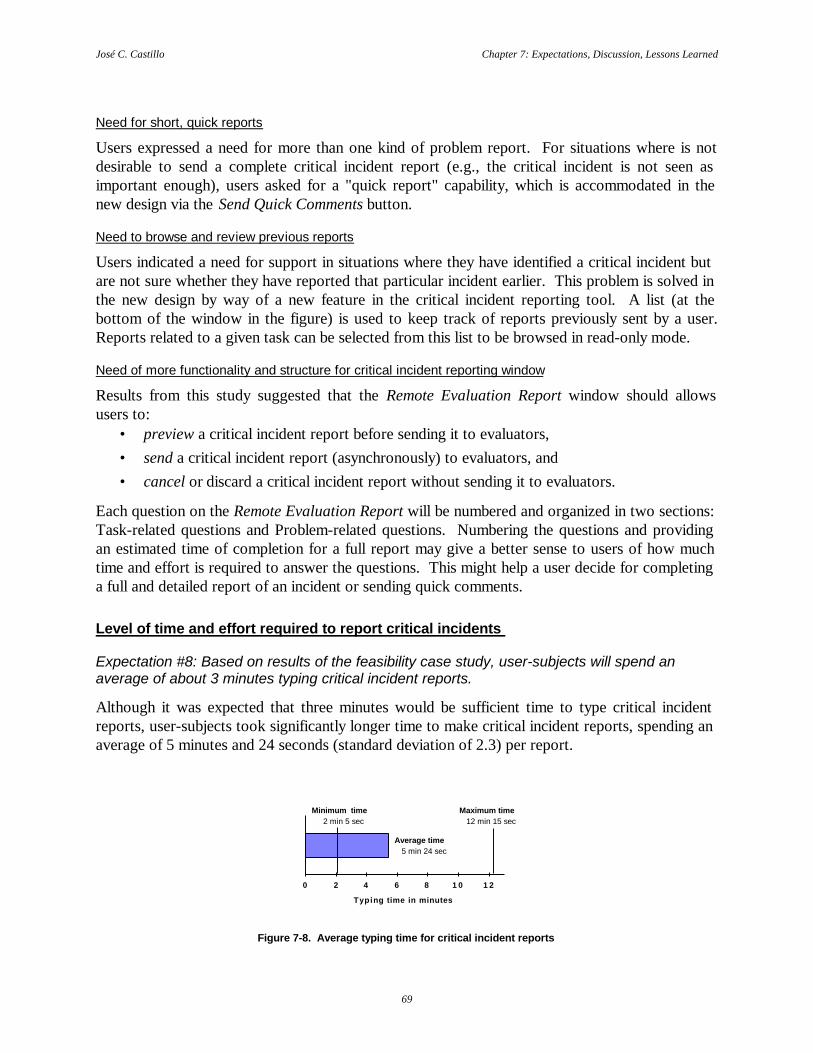
José C. Castillo Chapter 7: Expectations, Discussion, Lessons Learned
69
Need for short, quick reports
Users expressed a need for more than one kind of problem report. For situations where is notdesirable to send a complete critical incident report (e.g., the critical incident is not seen asimportant enough), users asked for a "quick report" capability, which is accommodated in thenew design via the Send Quick Comments button.
Need to browse and review previous reports
Users indicated a need for support in situations where they have identified a critical incident butare not sure whether they have reported that particular incident earlier. This problem is solved inthe new design by way of a new feature in the critical incident reporting tool. A list (at thebottom of the window in the figure) is used to keep track of reports previously sent by a user.Reports related to a given task can be selected from this list to be browsed in read-only mode.
Need of more functionality and structure for critical incident reporting window
Results from this study suggested that the Remote Evaluation Report window should allowsusers to:
• preview a critical incident report before sending it to evaluators,• send a critical incident report (asynchronously) to evaluators, and• cancel or discard a critical incident report without sending it to evaluators.
Each question on the Remote Evaluation Report will be numbered and organized in two sections:Task-related questions and Problem-related questions. Numbering the questions and providingan estimated time of completion for a full report may give a better sense to users of how muchtime and effort is required to answer the questions. This might help a user decide for completinga full and detailed report of an incident or sending quick comments.
Level of time and effort required to report critical incidents
Expectation #8: Based on results of the feasibility case study, user-subjects will spend anaverage of about 3 minutes typing critical incident reports.
Although it was expected that three minutes would be sufficient time to type critical incidentreports, user-subjects took significantly longer time to make critical incident reports, spending anaverage of 5 minutes and 24 seconds (standard deviation of 2.3) per report.
0 2 4 6 8 1 0 1 2
Typing time in minutes
Average time 5 min 24 sec
Minimum time 2 min 5 sec
Maximum time 12 min 15 sec
Figure 7-8. Average typing time for critical incident reports
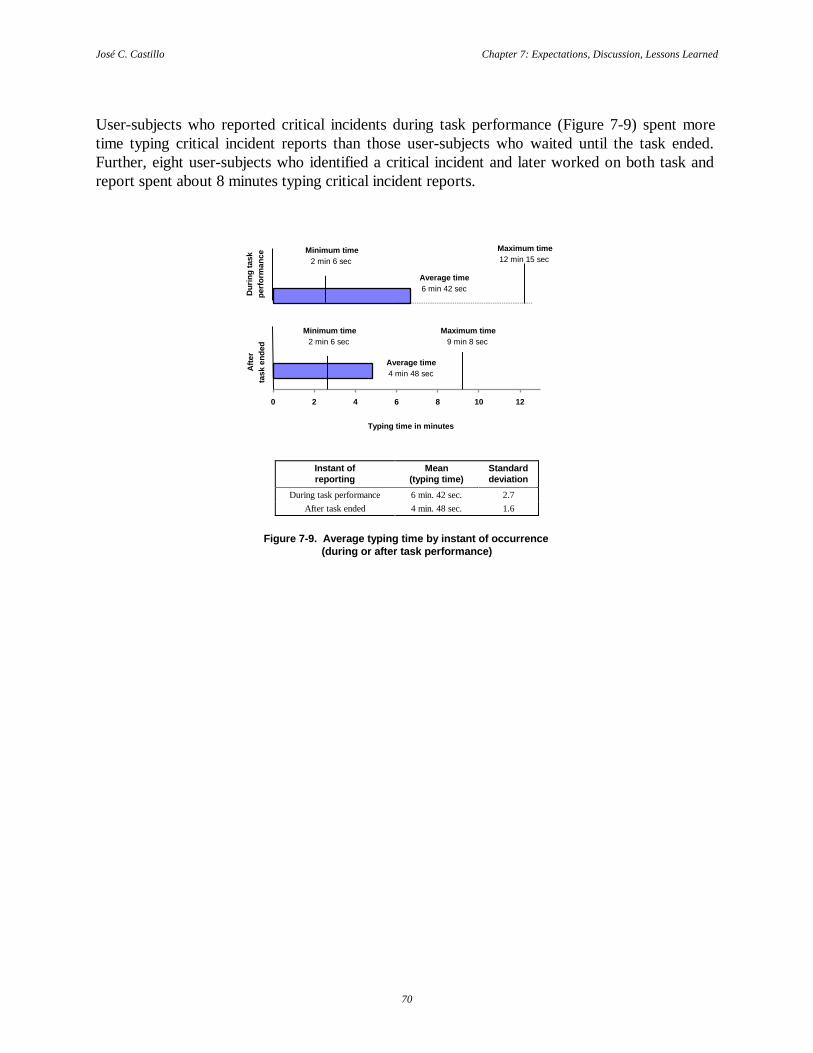
José C. Castillo Chapter 7: Expectations, Discussion, Lessons Learned
70
User-subjects who reported critical incidents during task performance (Figure 7-9) spent moretime typing critical incident reports than those user-subjects who waited until the task ended.Further, eight user-subjects who identified a critical incident and later worked on both task andreport spent about 8 minutes typing critical incident reports.
0 2 4 6 8 10 12
Average time6 min 42 sec
Average time4 min 48 sec
Dur
ing
task
pe
rfor
man
ceA
fter
task
end
ed
Minimum time2 min 6 sec
Maximum time9 min 8 sec
Minimum time2 min 6 sec
Maximum time12 min 15 sec
Typing time in minutes
Instant ofreporting
Mean(typing time)
Standarddeviation
During task performance 6 min. 42 sec. 2.7After task ended 4 min. 48 sec. 1.6
Figure 7-9. Average typing time by instant of occurrence(during or after task performance)

José C. Castillo Chapter 7: Expectations, Discussion, Lessons Learned
71
Expectation #9: User-subjects will spend longer time typing reports for high severity critical incidents thanfor low or medium severity critical incidents.
Contrary to expectations, user-subjects spent more time reporting low severity critical incidents(Figure 7-10) than medium severity incidents or high severity critical incidents.The experimenter was unable to explain this effect.
Severityranking
Mean(typing time)
Standarddeviation
Low 6 min. 6 sec. 2.8Medium 4 min. 54 sec. 1.8
High 5 min. 18 sec. 1.9
Figure 7-10. Average typing time by severity ranking
It was noticed that user-subjects appeared to take less time to report critical incidents as theygained some experience with the reporting process. During pre-testing, two pilot subjects(trained in human-computer interaction and usability methods) spent longer time reporting theirfirst critical incident than subsequent critical incidents. This also happened during theexperimental session to 13 out of 24 (or 54%) user-subjects who sent more than one criticalincident report.
0 2 4 6 8 10 12
Minutes
Maximum time7 min 42 sec
Minimum time3 min 36 sec
Maximum time5 min 27 sec
Average time6 min 6 sec
Average time5 min 18 sec
Minimum time4 min 24 sec
Minimum time2 min 24 sec
Maximum time12 min 15 sec
Average time 4 min 54 sec
LowSeverity
MediumSeverity
HighSeverity
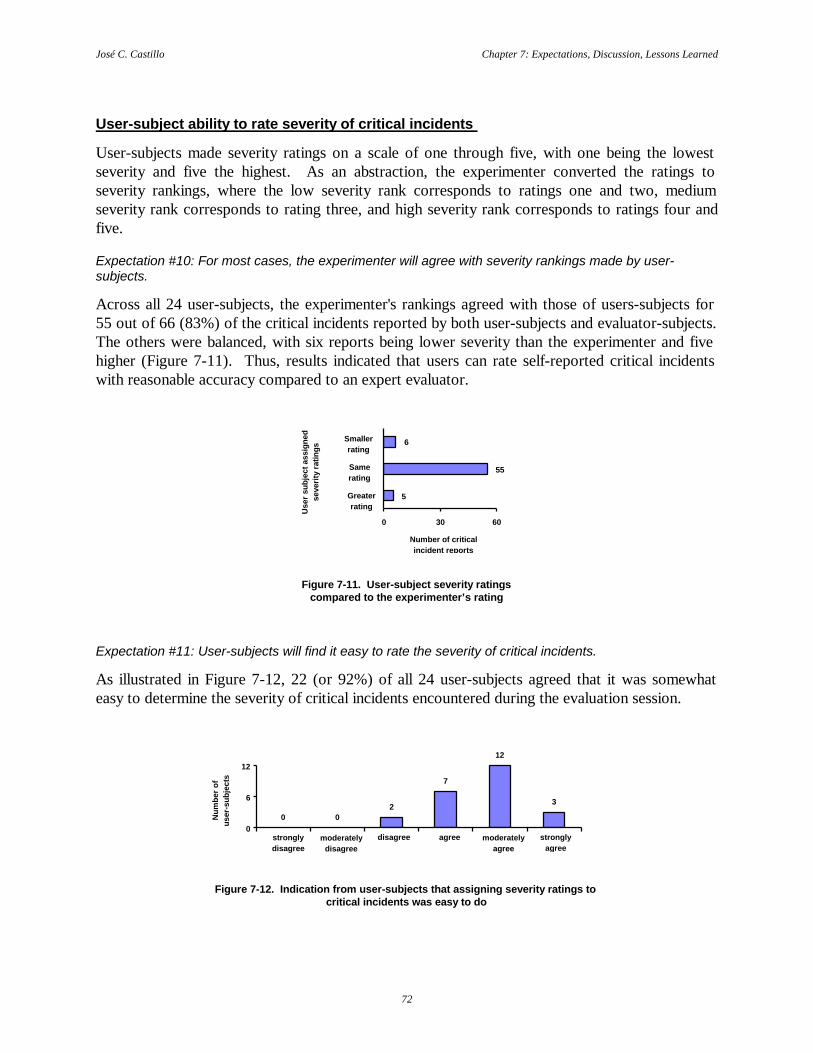
José C. Castillo Chapter 7: Expectations, Discussion, Lessons Learned
72
User-subject ability to rate severity of critical incidents
User-subjects made severity ratings on a scale of one through five, with one being the lowestseverity and five the highest. As an abstraction, the experimenter converted the ratings toseverity rankings, where the low severity rank corresponds to ratings one and two, mediumseverity rank corresponds to rating three, and high severity rank corresponds to ratings four andfive.
Expectation #10: For most cases, the experimenter will agree with severity rankings made by user-subjects.
Across all 24 user-subjects, the experimenter's rankings agreed with those of users-subjects for55 out of 66 (83%) of the critical incidents reported by both user-subjects and evaluator-subjects.The others were balanced, with six reports being lower severity than the experimenter and fivehigher (Figure 7-11). Thus, results indicated that users can rate self-reported critical incidentswith reasonable accuracy compared to an expert evaluator.
55
6
5
0 30 60
Smaller rating
Same rating
Greater ratingU
ser
subj
ect a
ssig
ned
seve
rity
rat
ings
Number of critical incident reports
Figure 7-11. User-subject severity ratingscompared to the experimenter’s rating
Expectation #11: User-subjects will find it easy to rate the severity of critical incidents.
As illustrated in Figure 7-12, 22 (or 92%) of all 24 user-subjects agreed that it was somewhateasy to determine the severity of critical incidents encountered during the evaluation session.
0 02
7
12
3
0
6
12
Num
ber
of
user
-sub
ject
s
moderatelydisagree
disagree agree moderatelyagree
stronglyagree
stronglydisagree
Figure 7-12. Indication from user-subjects that assigning severity ratings tocritical incidents was easy to do

José C. Castillo Chapter 7: Expectations, Discussion, Lessons Learned
73
However, some user-subjects still had difficulties rating critical incident severity. The followingmay be why this happened:
• uncertainty about rating low critical incident properly (user-subject comments: “I’m usedto try[ing] things four or five times in different ways to get something done, and if I makeit work after a couple of tries, I might forget the details of the initial difficulties”);
• unwillingness to read long descriptions for each severity rating option; and• users’ inclination to select the middle point of the scale (Figure 7-13) when uncertain
about which option to choose (about 35% of critical incidents reported by user-subjectswhere medium severity ones).
5
10
19
129
0
5
10
15
20
1 2 3 4 5
Num
ber
of
user
-sub
ject
s
Severity ratings
Severity rankings Low HighMedium
Figure 7-13. Characterization of user-assigned severity ratings by severity ranking
Lessons learned
Even though many user-subjects indicated that it was somewhat easy to rate the severity ofcritical incidents, the experimenter observed that a significant number of user-subjects actuallyfound severity rating to be difficult. In retrospect, it is possible that lack of granularity of a five-point scale for identifying specific areas affected by the critical incident (e.g., satisfaction, effort)and verbose rating descriptions were the main factors contributing to this difficulty.
The odd number of rating levels probably contributed to the large number of choices in favor ofthe middle rating. A larger set of rating numbers might address the need for higher granularity.Previous researchers have used 6-point (Andersson and Nilsson, 1964) and 7-point scalesdel Galdo et al. (1986) to indicate critical incident severity.
In retrospect, it has become clear that severity rating is only part of what is needed to classify acritical incident within a usability development environment. Severity is only one part of theusability engineering concept of “importance to fix” (Hix and Hartson, 1993).
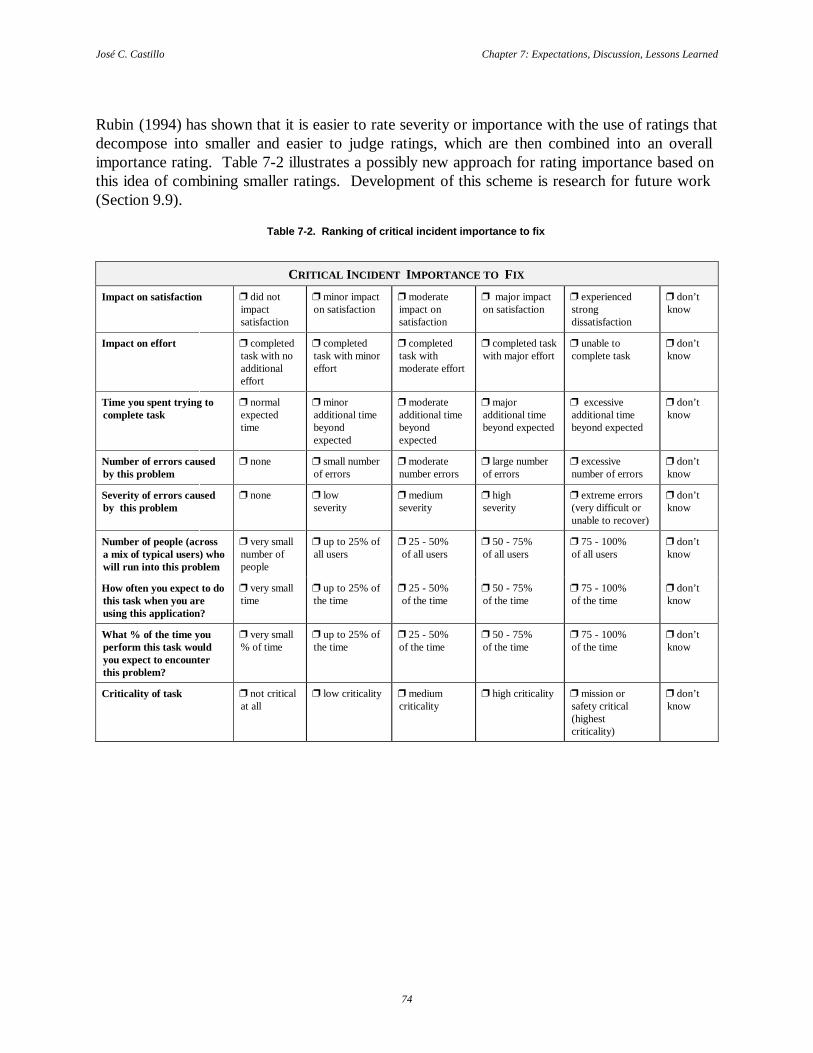
José C. Castillo Chapter 7: Expectations, Discussion, Lessons Learned
74
Rubin (1994) has shown that it is easier to rate severity or importance with the use of ratings thatdecompose into smaller and easier to judge ratings, which are then combined into an overallimportance rating. Table 7-2 illustrates a possibly new approach for rating importance based onthis idea of combining smaller ratings. Development of this scheme is research for future work(Section 9.9).
Table 7-2. Ranking of critical incident importance to fix
CRITICAL INCIDENT IMPORTANCE TO FIX
Impact on satisfaction p did notimpactsatisfaction
p minor impacton satisfaction
p moderateimpact onsatisfaction
p major impacton satisfaction
p experiencedstrongdissatisfaction
p don’tknow
Impact on effort p completedtask with noadditionaleffort
p completedtask with minoreffort
p completedtask withmoderate effort
p completed taskwith major effort
p unable tocomplete task
p don’tknow
Time you spent trying tocomplete task
p normalexpectedtime
p minoradditional timebeyondexpected
p moderateadditional timebeyondexpected
p majoradditional timebeyond expected
p excessiveadditional timebeyond expected
p don’tknow
Number of errors causedby this problem
p none p small numberof errors
p moderatenumber errors
p large numberof errors
p excessivenumber of errors
p don’tknow
Severity of errors causedby this problem
p none p lowseverity
p mediumseverity
p highseverity
p extreme errors(very difficult orunable to recover)
p don’tknow
Number of people (acrossa mix of typical users) whowill run into this problem
p very smallnumber ofpeople
p up to 25% ofall users
p 25 - 50% of all users
p 50 - 75%of all users
p 75 - 100%of all users
p don’tknow
How often you expect to dothis task when you areusing this application?
p very smalltime
p up to 25% ofthe time
p 25 - 50% of the time
p 50 - 75%of the time
p 75 - 100%of the time
p don’tknow
What % of the time youperform this task wouldyou expect to encounterthis problem?
p very small% of time
p up to 25% ofthe time
p 25 - 50%of the time
p 50 - 75%of the time
p 75 - 100%of the time
p don’tknow
Criticality of task p not criticalat all
p low criticality p mediumcriticality
p high criticality p mission orsafety critical(highestcriticality)
p don’tknow

José C. Castillo Chapter 7: Expectations, Discussion, Lessons Learned
75
User-subject ability to identify high severity critical incidents as well as low and mediumseverity critical incidents
Expectation #12: User-subjects will identify the majority of critical incidents, at all severity levels, asidentified by the experimenter.
User-subjects met expectations by reporting 21 out of 28 (75%) of the critical incidents identifiedby the experimenter as high severity (Figure 3), 19 out of 24 (79%) medium severity criticalincidents, and 15 out of 45 (33%) low severity ones, as ranked by the experimenter(Figure 7-14).
15
45
1924
21
28
0
25
50
LowMediumHigh
Num
ber
of
criti
cal i
ncid
ents
Severity ranking
User-subjects Experimenter
2128
1519
45
24
0
25
50
Low Medium High
User-subjectsExperimenter
Num
ber
of
criti
cal i
ncid
ents
Severity ranking
Figure 7-14. Number of reported critical incidents by severity ranking
User-subjects identified 40 out of 52 (77%) of the important (medium and high severity) criticalincidents. Further, the experimenter found that 26 of the 31 critical incidents not reported byuser-subjects were of low severity, the least important ones (Figure 7-15). In any usabilityevaluation setting, of course, the high severity critical incidents are the most important.
1
4
26
0 10 20 30
Number of critical incidents
Sev
erity
ran
king
L
ow
Med
ium
Hig
h
Figure 7-15. Distribution by severity ranking of thecritical incidents reported only by experimenter
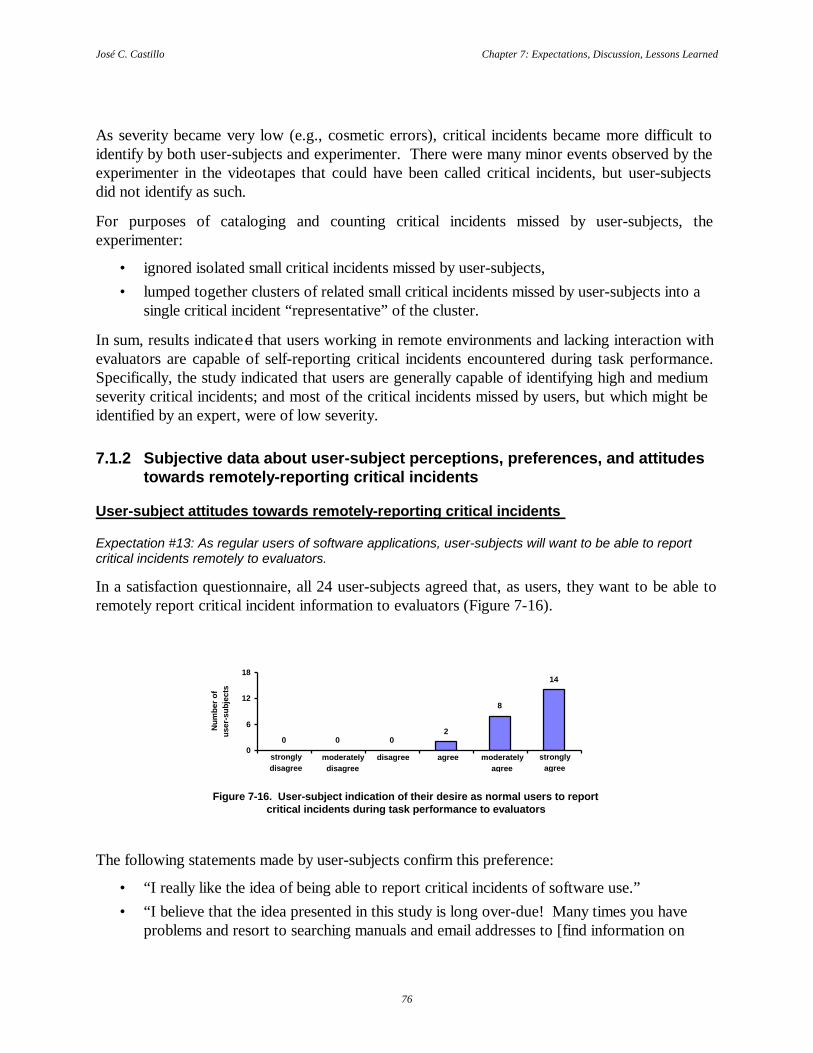
José C. Castillo Chapter 7: Expectations, Discussion, Lessons Learned
76
As severity became very low (e.g., cosmetic errors), critical incidents became more difficult toidentify by both user-subjects and experimenter. There were many minor events observed by theexperimenter in the videotapes that could have been called critical incidents, but user-subjectsdid not identify as such.
For purposes of cataloging and counting critical incidents missed by user-subjects, theexperimenter:
• ignored isolated small critical incidents missed by user-subjects,• lumped together clusters of related small critical incidents missed by user-subjects into a
single critical incident “representative” of the cluster.
In sum, results indicated that users working in remote environments and lacking interaction withevaluators are capable of self-reporting critical incidents encountered during task performance.Specifically, the study indicated that users are generally capable of identifying high and mediumseverity critical incidents; and most of the critical incidents missed by users, but which might beidentified by an expert, were of low severity.
7.1.2 Subjective data about user-subject perceptions, preferences, and attitudestowards remotely-reporting critical incidents
User-subject attitudes towards remotely-reporting critical incidents
Expectation #13: As regular users of software applications, user-subjects will want to be able to reportcritical incidents remotely to evaluators.
In a satisfaction questionnaire, all 24 user-subjects agreed that, as users, they want to be able toremotely report critical incident information to evaluators (Figure 7-16).
0 0 02
8
14
0
6
12
18
Num
ber
of
user
-sub
ject
s
moderatelydisagree
disagree agree moderatelyagree
stronglyagree
stronglydisagree
Figure 7-16. User-subject indication of their desire as normal users to reportcritical incidents during task performance to evaluators
The following statements made by user-subjects confirm this preference:
• “I really like the idea of being able to report critical incidents of software use.”• “I believe that the idea presented in this study is long over-due! Many times you have
problems and resort to searching manuals and email addresses to [find information on

José C. Castillo Chapter 7: Expectations, Discussion, Lessons Learned
77
how to] fix them. It would be wonderful to let developers know what you have problemswith and not what happens in testing. The real world is full of different people andproblems that most certainly are not covered [with an evaluation session conducted in ausability laboratory].”
• “I like the idea of being able to immediately send reports of problems that you mighthave. This could be a good plan for big businesses like Microsoft if there was some waythat they could guarantee a quick response.”
• “It also allows me to feel better knowing that I told someone about the problemencountered, and I don’t get as frustrated”.
• “It would make me feel like filling out a [critical incident] report does really make adifference.”
User-subject preferences with respect to reporting critical incident anonymously
Expectation #14: In general, user-subjects will want to report critical incidents anonymously.
Contrary to the expectations of this study, 17 (or 71%) of the 24 user-subjects disagreed thatanonymity was important for them, mainly because the desire for feedback was incompatiblewith anonymity (Figure 7-17).
1
79
5
02
0
6
12
Num
ber
of
user
-sub
ject
s
moderatelydisagree
disagree agree moderatelyagree
stronglyagree
stronglydisagree
Figure 7-17. User-subjects generally did not prefer reporting critical incidents anonymously
Ten out of the 18 (or about 56%) user-subjects who completed the second questionnairemoderately or strongly agreed they would like to receive feedback (e.g., via email) in response toreports sent to evaluators (Figure 7-18).
21
23
5 5
0
6
Num
ber
of
user
-sub
ject
s
moderatelydisagree
disagree agree moderatelyagree
stronglyagree
stronglydisagree
Figure 7-18. User-subject preference for receiving feedback from evaluators
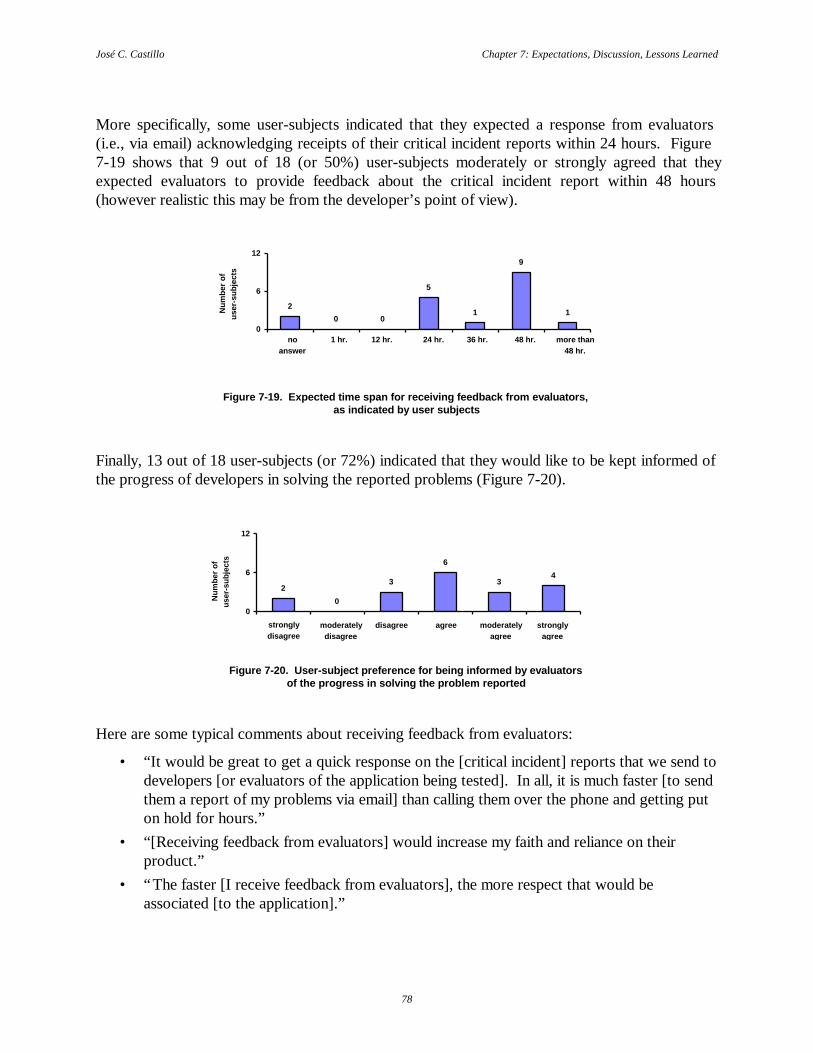
José C. Castillo Chapter 7: Expectations, Discussion, Lessons Learned
78
More specifically, some user-subjects indicated that they expected a response from evaluators(i.e., via email) acknowledging receipts of their critical incident reports within 24 hours. Figure7-19 shows that 9 out of 18 (or 50%) user-subjects moderately or strongly agreed that theyexpected evaluators to provide feedback about the critical incident report within 48 hours(however realistic this may be from the developer’s point of view).
2
0 0
5
1
9
1
0
6
12
Num
ber
of
user
-sub
ject
s
no answer
1 hr. 36 hr. 24 hr.12 hr. 48 hr. more than48 hr.
Figure 7-19. Expected time span for receiving feedback from evaluators,as indicated by user subjects
Finally, 13 out of 18 user-subjects (or 72%) indicated that they would like to be kept informed ofthe progress of developers in solving the reported problems (Figure 7-20).
2
0
3
6
34
0
6
12
Num
ber
of
user
-sub
ject
s
moderatelydisagree
disagree agree moderatelyagree
stronglyagree
stronglydisagree
Figure 7-20. User-subject preference for being informed by evaluatorsof the progress in solving the problem reported
Here are some typical comments about receiving feedback from evaluators:
• “It would be great to get a quick response on the [critical incident] reports that we send todevelopers [or evaluators of the application being tested]. In all, it is much faster [to sendthem a report of my problems via email] than calling them over the phone and getting puton hold for hours.”
• “[Receiving feedback from evaluators] would increase my faith and reliance on theirproduct.”
• “The faster [I receive feedback from evaluators], the more respect that would beassociated [to the application].”

José C. Castillo Chapter 7: Expectations, Discussion, Lessons Learned
79
• “I can wait more than 48 hours [to receive feedback for my critical incident report.Nonetheless,] I would like to know if they [(the evaluators)] changed something becauseof my comments, rather than if they received my comments or not.”
• “[How soon I want to receive feedback from evaluators] depends on the severity of theincident (and whether it was impeding my use of the application).”
• “Maybe a [message from evaluators saying] ‘we received your report and will look into itright away’ [is good enough], but no real response [is necessary] for a while.”
• “[I would like to receive feedback from evaluators] only if [they have to tell me]something big [or important about the problem and/or its solution]. I don’t want to knowfor 6 months what they are doing to fix it.”
• “[I] would just rather have them [(developers)] fix it [(the problem)].”
Lessons learned
Given the interest of users in feedback from evaluators or developers (e.g., via email), the criticalincident reporting tool should have an optional mechanism for gathering contact information.The first time the critical incident reporting tool is activated, it should open a configurationscreen to store voluntary contact information (e.g., name, email, phone, fax) from users. Anyother time the user activates the tool (i.e., user clicks Report Incident button), the system canautomatically attach this contact information to the critical incident report.
As suggested by Elgin (1995), the best way to get users interested in reporting critical incidents isby getting immediate responses back to them. Responses to users could be sent via email byknowledgeable support personnel (e.g., developer who is “owner” of the screen containingusability problems) of the application being evaluated. Another medium to provide suchresponses could be a public area (e.g., Frequently Asked Question/Problems and Solutions Webpage) where users and evaluators post messages about problems found with the application, andeven possible suggestions and solutions to solve those problems.
Evaluators and application developers can encourage users to report critical incidents byrewarding those users who help them most (e.g., reporting largest amount of critical incidents,reporting incidents of highest severity).

José C. Castillo Chapter 7: Expectations, Discussion, Lessons Learned
80
User-subject perceptions with respect to interference with user tasks
Usage problem reporting by remote users working on real tasks for real work has considerablepotential to interfere with task performance. As Elgin (1995) stated, “A big question [in remoteevaluation] is [to determine] how to help them [(users)] remember this interaction[(e.g., by reporting critical incidents)] while not seeming to violate their own sense of intrusion.”
Expectation #15: An indication from some user-subjects is expected that identifying and reporting criticalincidents interfered with their tasks (i.e., at least in some cases of high severity critical incidents), and thatlonger reports would lead to a stronger perception of interference.
Contrary to expectations, 19 (or 79%) of the 24 user-subjects moderately or strongly agreed thatidentifying and reporting critical incidents was not intrusive and did not interfere with their tasks(Figure 7-21). This counter-intuitive result was reinforced by the fact that some of the best andmost complete critical incident reports came from user-subjects who said that they felt thatreporting did not interfere much. Perhaps the feeling of interference was offset by thesatisfaction of being able to identify and report problems. One explanation is that user-subjects(i.e., university students) for this experimental session were not in a real work setting, where theywould have to get something done, and therefore did not feel any intrusion to their tasks.
1 0 0 13
6
13
0
6
12
18
Num
ber
of
user
-sub
ject
s
moderatelydisagree
disagree agree moderatelyagree
stronglyagree
stronglydisagree
noanswer
Figure 7-21. User-subject indication that identifying and reporting critical incidentsdid not interfere with task performance
User-subject preferences relating to reporting negative and positive critical incidents
As discussed in Section 6.3.4, all user-subjects were trained to identify and report criticalincidents during task performance. Although user-subjects learned to identify and report bothpositive and negative critical incidents, they were encouraged to report the negative incidentsbecause these reflect usability problems.
Expectation #16: User-subjects will be more motivated to identify negative critical incidents than positivecritical incidents.
During the experimental sessions, user-subjects experienced both positive and negative criticalincidents, but nevertheless reported only the negative ones. In the questionnaire, 16 out of 18(or 89%) user-subjects moderately or strongly agreed they were motivated to report negativecritical incidents (Figure 7-22), and only 7 out of 18 (or 39%) user-subjects agreed to be
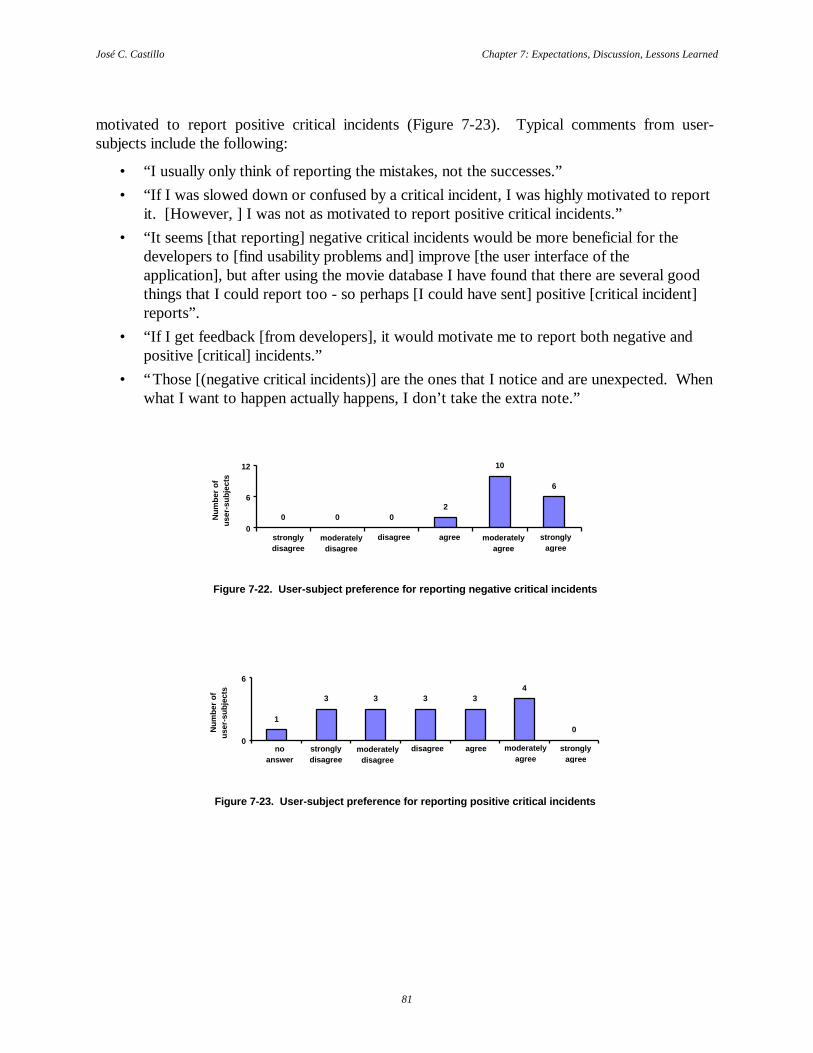
José C. Castillo Chapter 7: Expectations, Discussion, Lessons Learned
81
motivated to report positive critical incidents (Figure 7-23). Typical comments from user-subjects include the following:
• “I usually only think of reporting the mistakes, not the successes.”• “If I was slowed down or confused by a critical incident, I was highly motivated to report
it. [However, ] I was not as motivated to report positive critical incidents.”• “It seems [that reporting] negative critical incidents would be more beneficial for the
developers to [find usability problems and] improve [the user interface of theapplication], but after using the movie database I have found that there are several goodthings that I could report too - so perhaps [I could have sent] positive [critical incident]reports”.
• “If I get feedback [from developers], it would motivate me to report both negative andpositive [critical] incidents.”
• “Those [(negative critical incidents)] are the ones that I notice and are unexpected. Whenwhat I want to happen actually happens, I don’t take the extra note.”
0 0 02
10
6
0
6
12
Num
ber
of
user
-sub
ject
s
moderatelydisagree
disagree agree moderatelyagree
stronglyagree
stronglydisagree
Figure 7-22. User-subject preference for reporting negative critical incidents
1
3 3 3 34
00
6
Num
ber
of
user
-sub
ject
s
moderatelydisagree
disagree agree moderatelyagree
stronglyagree
stronglydisagree
noanswer
Figure 7-23. User-subject preference for reporting positive critical incidents

José C. Castillo Chapter 7: Expectations, Discussion, Lessons Learned
82
7.2 EVALUATOR-RELATED RESEARCH QUESTION: CAN EVALUATORS USECRITICAL INCIDENT DATA TO PRODUCE USABILITY PROBLEM DESCRIPTIONSAND HOW WELL CAN THEY DO IT?
For data analysis in Phase II of the study (Section 6.4), two evaluator-subjects (report-onlyevaluator-subjects), working independently of each other, analyzed six contextualized criticalincident reports to create a list of usability problem descriptions. Two other evaluator-subjects(clip-and-report evaluator-subjects), again working independently, analyzed six critical incidentreports and six video clips to create a list of usability problem descriptions. In addition, all fourevaluator-subjects completed a satisfaction questionnaire about their experience as evaluators ina remote usability situation.
As a general matter, the small number of evaluator-subjects and individual differences amongthem strongly colored the results of this phase of the study, implying a low significance ofresults. Therefore, the “results” obtained here are only hypotheses and not conclusions, and willserve as expectations for a future study.
Phase II of this study was conducted to investigate Objective 2 in Section 1.2.2, which translatesto the following research question: Can evaluators use critical incident data to produce usabilityproblem descriptions and how well can they do it? In this study, Objective 2 is divided into thefollowing:
• Ability of evaluator-subjects to analyze critical incident data• Role of textual reports in data analysis• Role of video in data analysis• Role of audio in data analysis• Time and effort required to analyze critical incident data• Level of agreement with user-subject critical incident severity ratings
Each of these sub-objectives is discussed here.
7.2.1 Ability of evaluator-subjects to analyze critical incident data
Generally, all evaluator-subjects were capable of analyzing critical incident data to produceusability problem descriptions. For example, report-only evaluator-subjects reported similar orrelated usability problem descriptions for five out of six critical incident reports. The exceptionto this was the usability problem encountered by a particular user-subject while working on task#3 (i.e., Find the titles of the four most recent movies directed by Steven Spielberg):
Report-only evaluator-subject #1:
“[The] usability problem [for this task was] caused by network speed. [The Web] page[with information about Steven Spielberg] would have come up with the director’s filmslisted in chronological order, starting at the top of the page, but because the network wasslow and the logical top of the page was really the middle of a larger page, other information

José C. Castillo Chapter 7: Expectations, Discussion, Lessons Learned
83
was shown while the page was loading. [To fix this problem, developers] need to make thetop of the page more clear for users that unexpectedly see it first.”
Report-only evaluator-subject #2:
• “[I found various usability problems in this task:]• External links and internal links (to within the current page) are not differentiated, giving
no spatial cues for a flat information space.• Extraneous information not relevant to task [is] displayed, cluttering [the] screen and the
user’s information model, requiring the user to perform unwanted [information] filtering.
• Multiple information types [are] displayed in same information space. They should beseparated.”
Clip-and-report evaluator-subjects showed similar results in their ability to produce usabilityproblem descriptions. However, differences in the lists of usability problem descriptions amongthe 4 evaluator-subjects made it difficult to compare them (e.g., one evaluator-subject’s listdescribed usability problems found for each task while the other list described usability problemsfound in the user interface as a whole).
7.2.2 Role of textual reports in data analysis
Expectation #17: All evaluator-subjects might agree that analyzing critical incident reports into usabilityproblem descriptions is easy to do.
Report-only evaluator-subjects somewhat or strongly agreed that it was indeed easy to analyzecritical incident reports and create a list of usability problems descriptions. However, there wasno concurrence among clip-and-report evaluator-subjects about the ease of analyzing criticalincident reports without having videotape clips to create a list of usability problems descriptions.The experimenter was unable to explain this difference.
Expectation #18: All evaluator-subjects may agree that the content of critical incident reports is of highquality (e.g., completeness, accuracy).
Report-only evaluator-subjects moderately or strongly agree that it was easy to understand thecontent of critical incident reports. There was no concurrence among clip-and-report evaluator-subjects about this question. Interestingly, clip-and-report evaluator-subjects frequently read thereport before watching the video clip to get some context about the task and critical incident.
Expectation #19: All evaluator-subjects may prefer to read the online version of critical incident reportsinstead of paper copy.
Evaluator-subjects from both groups indicated a preference in reading the critical incident reportson paper instead of an online version.

José C. Castillo Chapter 7: Expectations, Discussion, Lessons Learned
84
7.2.3 Role of video in data analysis
Expectation #20: Clip-and-report evaluator-subjects might indicate that it is easy to create usabilityproblems descriptions based on analysis of textual reports and video clips.
Clip-and-report evaluator-subjects somewhat or strongly disagreed that it was easy to create a listof usability problem descriptions after analyzing both the critical incident reports and videotapeclips (evaluator-subject comment: “It was somewhat difficult to match the two together.”).
Expectation #21: Clip-and-report evaluator-subjects might prefer to determine usability problemdescriptions analyzing only the videotape clips (i.e., video and audio, no textual reports).
Clip-and-report evaluator-subjects did not concur on a preference for determining usabilityproblem descriptions by analyzing only the videotape clips, but both considered textual reports tobe essential. The following are comments from evaluator-subjects about this matter:
• “No way! … it was difficult/impossible to tell the problem without the [paper] reports.”• “[Task #1:] I had no idea what was occurring on the screen when I started. In addition I
could not read the text very well.”• “[Task #2:] I read the report first to get some context. It was difficult to tell [just from
watching the clip] if the user was waiting for the system, reading, thinking, or what.”• “[Task #5:] I would have had no idea the user was looking for movies with Meryl Streep
from the video clip.”• “[Task #6:] I could not tell from the video that the user was searching for ‘time’. It was
difficult … to see if the user was getting the information needed.”
Expectation #22: Clip-and-report evaluator-subjects might prefer to determine usability problemdescriptions without using videotape clips (i.e., only with critical incident reports).
Clip-and-report evaluator-subjects did not concur on a preference for determining usabilityproblem descriptions without using the videotape clips (only with critical incident reports). Oneevaluator-subject indicated the following in the questionnaire: “[I’m] not sure how I would haveliked just reading the critical incident reports.”
Expectation #23: Clip-and-report evaluator-subjects might indicate that the videotape clips play animportant role in understanding critical incidents.
There was no concurrence among clip-and-report evaluator-subjects about the videotape clipsplaying an important role in understanding critical incidents. However, these evaluator-subjectsmentioned that:
• “ [The video clips] helped [me] clarify [the] order of events… ”• “… much of user strategy [while doing the evaluation tasks] (e.g., searching menus)
would have been lost [without the clips].”

José C. Castillo Chapter 7: Expectations, Discussion, Lessons Learned
85
Expectation #24: It was expected that three-minute video clips would show enough information about thecritical incidents.
There was no agreement among clip-and-report evaluator-subjects about whether 3 minutes is theappropriate length to show enough information for determining usability problem descriptions:
Clip-and-report evaluator-subject #1:
“In most cases, less [than three minutes] would be fine. Of course, it always depends on thesituation and the nature of the critical incident. [Actually,] two minutes would be fine.”
Clip-and-report evaluator-subject #2:
“Some clips started in the middle of the task (e.g., after initial search). [To store enoughinformation, the clips need] the amount of time necessary to capture the entire task for whichthe critical incident occurred.”
Expectation #25: Report-only evaluator-subjects might indicate that video clips (with audio) of screenaction, in addition to the critical incident reports, could have helped them better determine the usabilityproblem descriptions.
Report-only evaluator-subjects moderately or strongly agreed that they believed video clips (withaudio) of screen action, in addition to the critical incident reports, would have helped them createusability problem descriptions.
Lessons learned
When an evaluator-subject mentioned that it was somewhat difficult to match a critical incidentreport with the videotape clip, the experimenter went back to review each tape and experiencedthis reality. In general, it was expected that videotape clips would be a necessary supplement towritten reports to understand the task context leading up to the critical incident but, frankly, theexperimenter was later inclined to agree that video might not be as useful as expected. However,this small amount of data was not sufficient to rule out the usefulness of video and it should be ahigh priority to explore this in a future study. If it is found that video is not very useful tounderstand critical incident data, that would certainly make the user-reported critical incidentmethod even less expensive.
7.2.4 Role of audio in data analysis
Expectation #26: All evaluator-subjects might prefer listening to verbal critical incident reports (i.e., audiowith user’s voice) rather than reading textual reports.
Clip-and-report evaluator-subjects strongly agreed on a preference for listening to verbal criticalincident reports rather than reading textual reports (evaluator-subject comments: “Yes! I thoughtexactly this while reading the critical incident reports.”). However, report-only evaluator-subjects somewhat or strongly disagreed with a preference for verbal critical incident reporting.The experimenter does not have enough data to explain this disagreement.

José C. Castillo Chapter 7: Expectations, Discussion, Lessons Learned
86
7.2.5 Time and effort required to analyze critical incident data
Expectation #27: Because of the additional data, it was expected more analysis effort required of clip-and-report evaluator-subjects than of report-only evaluator-subjects.
Contrary to expectations, clip-and-report evaluator-subjects took somewhat less analysis time onaverage than report-only evaluator-subjects. Report-only evaluator-subjects spent an average of1 hour and five minutes analyzing all six critical incident reports into usability problemdescriptions (average 10 minutes and 50 seconds analyzing each report). On the other hand, clip-and-report evaluator-subjects spent an average of 50 minutes analyzing critical incident data(textual reports and videotape clips) and creating a list of usability problem descriptions (averageof 8 minutes and 20 seconds analyzing each pair of critical incident reports and videotape clips).It is possible that report-only evaluator-subjects had to spend more time analyzing criticalincident data because they had less information, and therefore needed more time to understandthe critical incidents.
7.2.6 Level of agreement with user-subject critical incident severity ratings
For the most part, it was expected that evaluator-subjects and user-subjects would agree aboutseverity ratings. Clip-and-report evaluator-subjects somewhat disagreed with user-subject ratings(evaluator-subject comment: “I usually rated critical incidents less severe than user-subjects.”),but there was no concurrence among report-only evaluator-subjects about this matter.
7.3 METHOD- AND STUDY-RELATED RESEARCH QUESTION: WHAT ARE THEVARIABLES AND VALUES THAT MAKE THE METHOD WORK BEST?
Objective 3 of Section 1.2.2 translates to the following research question: What are the variablesand values that make the method work best? In this study, Objective 3 is divided into thefollowing:
• Preferred location for the critical incident reporting tool• Using the Remote Evaluation Report window• Role of training in reporting critical incidents• Verbal protocol issues• Role of audio in reporting critical incidents• Role of video in the study• Packaging critical incident data• Issues relating to the proximity of a critical incident and its cause
Each of these sub-objectives is discussed here.
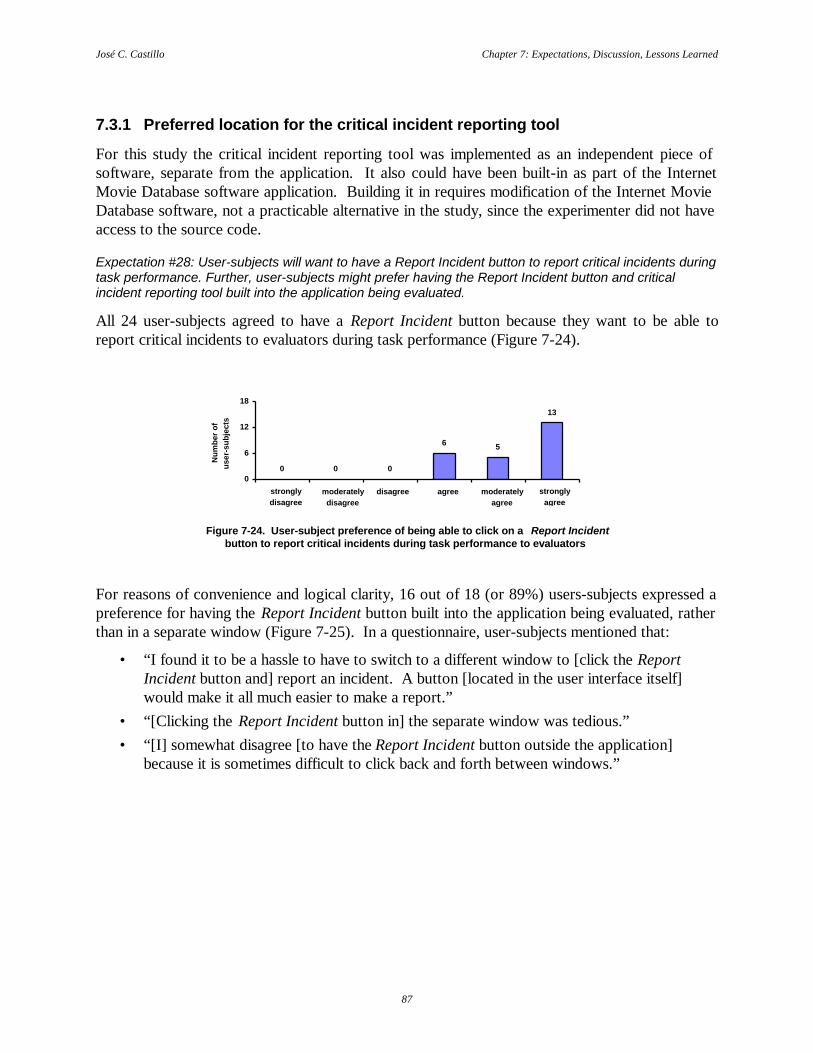
José C. Castillo Chapter 7: Expectations, Discussion, Lessons Learned
87
7.3.1 Preferred location for the critical incident reporting tool
For this study the critical incident reporting tool was implemented as an independent piece ofsoftware, separate from the application. It also could have been built-in as part of the InternetMovie Database software application. Building it in requires modification of the Internet MovieDatabase software, not a practicable alternative in the study, since the experimenter did not haveaccess to the source code.
Expectation #28: User-subjects will want to have a Report Incident button to report critical incidents duringtask performance. Further, user-subjects might prefer having the Report Incident button and criticalincident reporting tool built into the application being evaluated.
All 24 user-subjects agreed to have a Report Incident button because they want to be able toreport critical incidents to evaluators during task performance (Figure 7-24).
0 0 0
6 5
13
0
6
12
18
Num
ber
of
user
-sub
ject
s
moderatelydisagree
disagree agree moderatelyagree
stronglyagree
stronglydisagree
Figure 7-24. User-subject preference of being able to click on a Report Incidentbutton to report critical incidents during task performance to evaluators
For reasons of convenience and logical clarity, 16 out of 18 (or 89%) users-subjects expressed apreference for having the Report Incident button built into the application being evaluated, ratherthan in a separate window (Figure 7-25). In a questionnaire, user-subjects mentioned that:
• “I found it to be a hassle to have to switch to a different window to [click the ReportIncident button and] report an incident. A button [located in the user interface itself]would make it all much easier to make a report.”
• “[Clicking the Report Incident button in] the separate window was tedious.”• “[I] somewhat disagree [to have the Report Incident button outside the application]
because it is sometimes difficult to click back and forth between windows.”
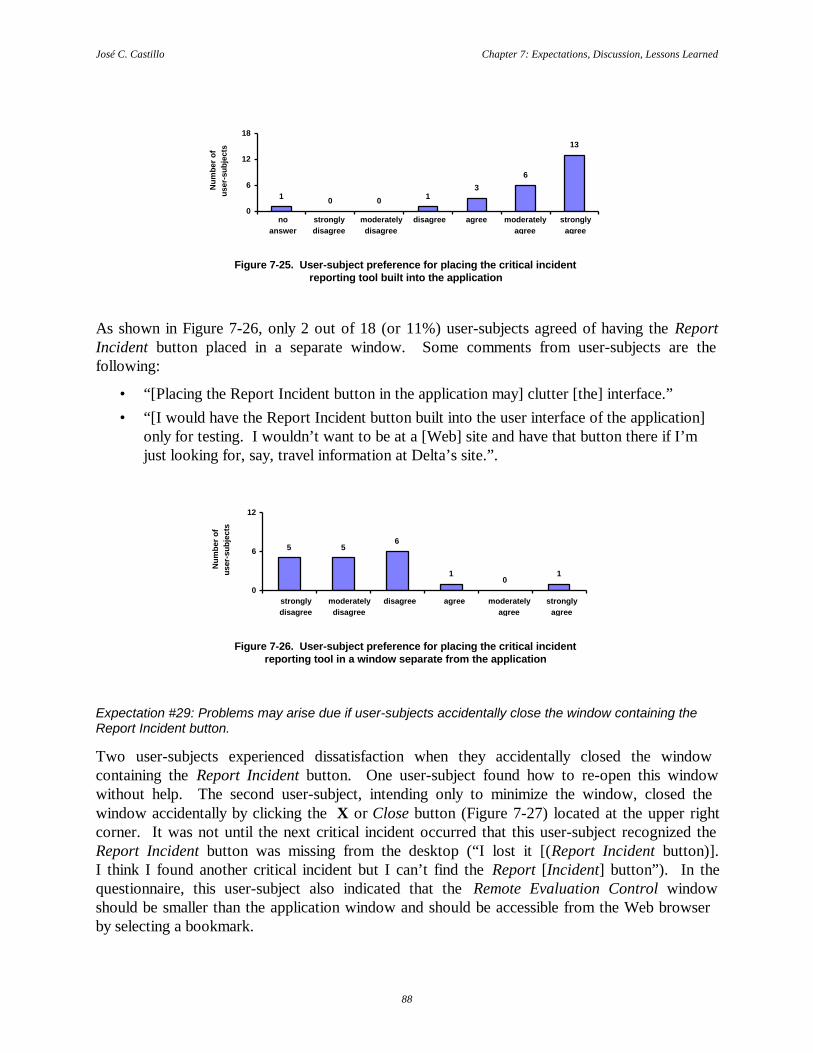
José C. Castillo Chapter 7: Expectations, Discussion, Lessons Learned
88
1 0 0 13
6
13
0
6
12
18
Num
ber
of
user
-sub
ject
smoderately
disagreedisagree agree moderately
agreestrongly
agreestronglydisagree
noanswer
Figure 7-25. User-subject preference for placing the critical incidentreporting tool built into the application
As shown in Figure 7-26, only 2 out of 18 (or 11%) user-subjects agreed of having the ReportIncident button placed in a separate window. Some comments from user-subjects are thefollowing:
• “[Placing the Report Incident button in the application may] clutter [the] interface.”• “[I would have the Report Incident button built into the user interface of the application]
only for testing. I wouldn’t want to be at a [Web] site and have that button there if I’mjust looking for, say, travel information at Delta’s site.”.
5 56
10
1
0
6
12
Num
ber
of
user
-sub
ject
s
moderatelydisagree
disagree agree moderatelyagree
stronglyagree
stronglydisagree
Figure 7-26. User-subject preference for placing the critical incidentreporting tool in a window separate from the application
Expectation #29: Problems may arise due if user-subjects accidentally close the window containing theReport Incident button.
Two user-subjects experienced dissatisfaction when they accidentally closed the windowcontaining the Report Incident button. One user-subject found how to re-open this windowwithout help. The second user-subject, intending only to minimize the window, closed thewindow accidentally by clicking the X or Close button (Figure 7-27) located at the upper rightcorner. It was not until the next critical incident occurred that this user-subject recognized theReport Incident button was missing from the desktop (“I lost it [(Report Incident button)].I think I found another critical incident but I can’t find the Report [Incident] button”). In thequestionnaire, this user-subject also indicated that the Remote Evaluation Control windowshould be smaller than the application window and should be accessible from the Web browserby selecting a bookmark.

José C. Castillo Chapter 7: Expectations, Discussion, Lessons Learned
89
minimizemaximize
close
Figure 7-27. Default buttons for manipulating windows in Windows95™
Two other user-subjects accidentally clicked the Netscape Navigator mail icon at the lower rightcorner of the browser while intending to open the Remote Evaluation Control window, whichthey minimized earlier while working on the tasks. None of the 24 user-subjects lost the RemoteEvaluation Control window from accidentally exiting the Web browser.
7.3.2 Using the Remote Evaluation Report window
The Remote Evaluation Report window contained a form that user-subjects used to enter preciseinformation about the critical incident. This report form consisted of the following eightquestions:
1. Explain what you were trying to do when the critical incident occurred.
2. Describe what you expected the system to do just before the critical incident occurred.
3. In as much detail as possible, describe the critical incident that occurred and why youthink it happened.
4. Describe what you did to get out of the critical incident.
5. Where you able to recover from the critical incident?
6. Are you able to reproduce the critical incident and make it happen again?
7. Indicate in your opinion the severity of this critical incident.
8. What suggestions do you have to fix the critical incident? You can also include othercomments, feature requests, or suggestions.
Expectation #30: The majority of user-subjects will find it easy to report critical incidents using the RemoteEvaluation Report window.
As expected in the study, 23 of the 24 user-subjects agreed that it was easy to report criticalincidents using the Remote Evaluation Report window (Figure 7-28). User-subjects liked thatthis window was smaller in size and separate from the application, allowing them to click backand forth between the windows.

José C. Castillo Chapter 7: Expectations, Discussion, Lessons Learned
90
0 0 1
4
12
7
0
6
12
18
Num
ber
of
user
-sub
ject
smoderately
disagreedisagree agree moderately
agreestrongly
agreestronglydisagree
Figure 7-28. User-subject indication that it was easy to report critical incidentsusing the Remote Evaluation Report window
Two user-subjects indicated that the questions “what you expected the system to do” and “whatyou did to get out of the situation” were confusing. Another user-subject mentioned that thosequestions could be eliminated from the report form because, in user-subject’s opinion, “wereunnecessary and could take too long to answer for a common user”.
Expectation #31: User-subjects might accidentally close the Remote Evaluation Report windowaccidentally before sending the report.
Although some user-subjects closed the Remote Evaluation Report window as a successful wayto discontinue a report, one user-subject did inadvertently close the window and lost a report.This user-subject answered the first few questions and then tried to minimize this window to goback to the application and read an error message that resulted from a search query made earlier.But instead this user-subject accidentally clicked the Close button (see Figure 7-27) on the upperright corner of the window. This was the only critical incident report lost during the entireevaluation session. The user-subject experienced frustration but did not want to call theexperimenter for assistance for a second time — this is the same user-subject who accidentallyclosed the window containing the Report Incident button (Section 7.3.1). In the questionnaire,this user-subject mentioned that Remote Evaluation Report window should fit in the screen sideby side with the application window. Finally, none of the user-subjects lost the RemoteEvaluation Report window from accidentally exiting the Web browser.
In general, user-subjects found it easy to report critical incidents using the Remote EvaluationReport window. However, some of them spent longer time typing answers for the followingquestions:
1. describe the critical incident and why you think it happened,
2. what you expected the system to do before the critical incident occurred, and
3. how you got out of the situation.
The answer to the first question is essential because it yields context information of the criticalincident and could probably reveal the cause of that problem. Novice users (novice at workingwith the application being evaluated) may take longer time than experienced users to reportcritical incidents and probably would be more difficult for them to answer the last two questions.Thus, these type of users can be allowed to send a quick comment or question (i.e., by clicking

José C. Castillo Chapter 7: Expectations, Discussion, Lessons Learned
91
the Send Quick Comments button in Figure 7-7) instead of completing a formal critical incidentreport.
Users prefer the Remote Evaluation Report window separate and smaller in size than theapplication window. This allows them to click back to the two windows, for example, if a userwants to read an error message in the application window and later clicked on the report windowto explain the situation. Further, the data collection tool should automatically capture the name,title, and/or location (e.g., URL for Web-based applications) of screen where user encounteredcritical incidents.
7.3.3 Role of training in reporting critical incidents
Minimal instruction principles were applied to design critical incident training for user-subjects.The critical incident training consisted of two parts (video presentation and practice session),presented to user-subjects separately. To investigate the role of training (Section 6.3.4) for usersto identify and report critical incidents effectively, user-subjects were randomly assigned to twoseparate groups, twelve people in each group. Group 1 watched a training videotape withinformation about identifying critical incidents, but Group 2 did not. Both groups received abrief explanation (five minutes) about both identifying and reporting critical incidents andimmediately after, in a practice session, identified and reported critical incidents whileperforming a representative task using the Internet Movie Database.
Expectation #32: User-subjects in Group 1 (with video presentation) may report a larger number of criticalincidents than users-subjects in Group 2.
Across all participants of each group, user-subjects of Group 1 (with video presentation) reported30 critical incidents and user-subject of Group 2 reported 25 incidents (Figure 7-29).
0
2
4
6
1 2 5 9 10 14 15 17 19 20 22 24 3 4 6 7 8 11 12 13 16 18 21 23
User-subject identification number
Group 1: Total of 30 incidents
Group 2: Total of 25 incidents
Num
ber
of
criti
cal i
ncid
ents
Figure 7-29. Number of critical incidents reported by user-subject of each group

José C. Castillo Chapter 7: Expectations, Discussion, Lessons Learned
92
User-subjects of Group 1 reported 8 low severity incidents, 11 of medium severity, and 11 ofhigh severity, finding 31% of the critical incidents identified by the experimenter across all user-subjects (Figure 7-30). Similarly, user-subjects of Group 2 reported 7 low severity criticalincidents, 8 of medium severity, and 10 of high severity, finding 26% of the critical incidentsidentified by the experimenter.
45
2428
8 11 117 8 10
0
25
50
Low Medium High
ExperimenterGroup 1Group 2
Num
ber
of
criti
cal i
ncid
ents
Severity ranking
45
8 7
24
11 8
28
11 10
0
25
50
Experimenter Group 1 Group 2
LowMediumHigh
Num
ber
of
criti
cal i
ncid
ents
Severity ranking
Figure 7-30. Effect of training in reporting critical incidents
Contrary to expectations, user-subjects from both groups reported a similar number of criticalincidents for the various severity ratings. An interesting observation is that one user-subject ofGroup 2 mentioned feeling qualified to identify and report critical incidents after onlyparticipating in the practice session: “Although I received the less thorough training, I feel that itwas more than adequate to allow me to complete the tasks and report the incidents”. To furtherinvestigate this matter, a future study will be conducted to determine the best way to train users(training only about reporting critical incidents versus training about both identifying andreporting critical incidents) and the effect of training in the number of critical incidents reportedby users.
Expectation #33: User-subjects in Group 1 (with video presentation) may produce reports of better quality(e.g., accuracy and completeness) than user-subjects in Group 2.
To investigate the quality of critical incident reports, the experimenter randomly selected onecritical incident report from each user-subject. Two pilot subjects (researchers trained in human-computer interaction and usability methods) carefully examined the accuracy and completenessof these reports and agreed that there was no significant difference in the quality of the reports.Thus, it seems that the video presentation did not have a significant effect on the quality ofcritical incidents reported by user-subjects. However, some of those user-subjects who watchedthe videotape indicated that they felt better prepared to identify and report critical incidents afterwatching the tape (user-subject comments: “Although the critical incident examples [shown onthe tape] were fairly common sense, I found the video useful in finding incidents that I mightnormally not report and just struggle through time after time.)” To investigate further this matter,a future study will be conducted to determine the effect of training in the quality of criticalincident reports.
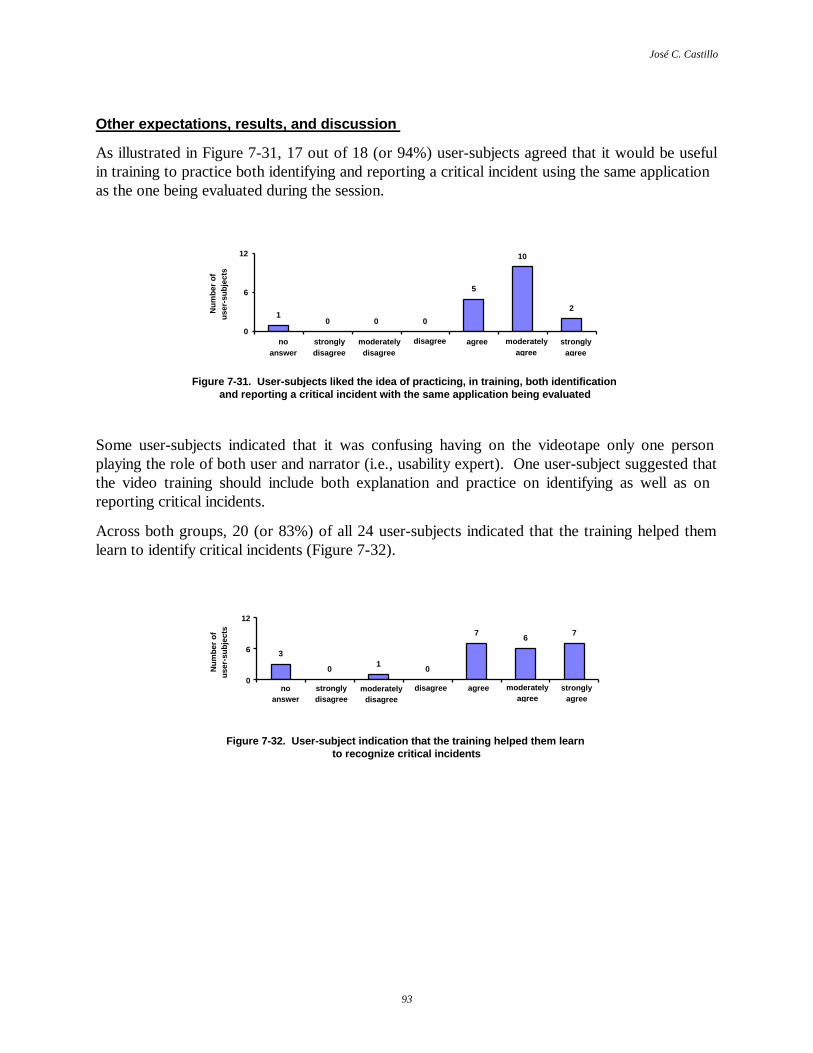
José C. Castillo
93
Other expectations, results, and discussion
As illustrated in Figure 7-31, 17 out of 18 (or 94%) user-subjects agreed that it would be usefulin training to practice both identifying and reporting a critical incident using the same applicationas the one being evaluated during the session.
10 0 0
5
10
2
0
6
12
Num
ber
of
user
-sub
ject
s
moderatelydisagree
disagree agree moderatelyagree
stronglyagree
stronglydisagree
noanswer
Figure 7-31. User-subjects liked the idea of practicing, in training, both identificationand reporting a critical incident with the same application being evaluated
Some user-subjects indicated that it was confusing having on the videotape only one personplaying the role of both user and narrator (i.e., usability expert). One user-subject suggested thatthe video training should include both explanation and practice on identifying as well as onreporting critical incidents.
Across both groups, 20 (or 83%) of all 24 user-subjects indicated that the training helped themlearn to identify critical incidents (Figure 7-32).
3
01
0
76
7
0
6
12
Num
ber
of
user
-sub
ject
s
moderatelydisagree
disagree agree moderatelyagree
stronglyagree
stronglydisagree
noanswer
Figure 7-32. User-subject indication that the training helped them learnto recognize critical incidents

José C. Castillo Chapter 7: Expectations, Discussion, Lessons Learned
94
Across both groups, 22 (or 92%) of all 24 user-subjects indicated that the training providedenough information (Figure 7-33).
1 0 0 1 2
13
7
0
6
12
18N
umbe
r of
us
er-s
ubje
cts
moderatelydisagree
disagree agree moderatelyagree
stronglyagree
stronglydisagree
noanswer
Figure 7-33. Indication from user-subjects that the training provided enough information
Across both groups, 23 (or 96%) of the 24 user-subjects indicated that the training was easy tofollow (Figure 7-34).
1 0 0 0 1
5
17
0
6
12
18
Num
ber
of
user
-sub
ject
s
moderatelydisagree
disagree agree moderatelyagree
stronglyagree
stronglydisagree
noanswer
Figure 7-34. User-subject indication that the training was easy to follow
Lessons learned
The main advantage of using videotape as the medium for conveying training material is that allusers receive exactly the same presentation. This training material can be made more modular(e.g., one video clip per type of usability problem) and more broadly available by placing videoclips on the Web, allowing users to obtain self-paced training by downloading the clips.
As Wiedenbeck, Zila, and McConnell (1995) point out, hands-on practice during training maycontribute to better user task performance. This motivates a future study to investigate furtherthe effect of the practice part of the training (i.e., practice identifying and reporting a criticalincident, preferably using the same application being evaluated) in user task performance.

José C. Castillo
95
Possible ways to improve the training include the following:• the training videotape should include examples of a user both identifying and reporting
critical incidents during task performance (instead of only identifying critical incidents),two different people should play the roles of user and narrator respectively, and
• training should more strongly emphasize that users should click the Begin IncidentCapture button (Figure 7-7) immediately after a critical incident occurs in order to recorduseful critical incident data.
7.3.4 Verbal protocol issues
One problem exposed in the feasibility case study (Section 5.7) was the need to prompt userscontinually for verbal protocol to establish task context for the critical incidents. For the mostpart, verbal protocol was essential for the expert-subjects to establish for each critical incidentwhat the task was, what the use was trying to do, and why the user was having trouble.
In the exploratory study, however, because it is very difficult to prompt users for verbal protocolin real world remote conditions and because critical incident reports capture information aboutthe task context, user-subjects were not prompted for verbal protocol. Nonetheless, amicrophone was installed to record the user’s voice (in the audio portion of the videotape) duringthe evaluation session in case of spontaneous verbal comments.
Expectation #34: Evaluator-subjects will not consider verbal comments essential in analyzing criticalincident reports.
Two users-subjects made comments that showed signs of frustration (i.e., tapping fingers ontable, “Oh my God!”, “Ugh!”) and confusion (e.g., “It wasn’t supposed to do that”; “I still don’tknow what I’m doing”). Verbal explanations from another participant helped the experimenterbetter understand a critical incident rather than just from watching the videotape without audio.The user-subject, who was searching for a particular movie title on the database, typed the moviename at a Find text box. Next, the user-subject had to choose between two radio buttons(substring and fuzzy search) to determine a specific search method (user-subject comment:“Hum!”). The user-subject selected the fuzzy search radio button (user-subject comments “Well,I don’t know what fuzzy search means.”) and clicked the Search button. The result from thatsearch was a system message remarking that the title was not found on the movie database. Afterreading the system message, the user-subject clicked a tips link to read more information aboutsearching hints but did not find it very useful (user-subject comment: “That didn’t help meeither!”).
Clip-and-report evaluator-subjects did not agree about the usefulness of verbal protocol inanalyzing critical incident reports:
Clip-and-report evaluator-subject #1:
“Not having verbal protocol made it difficult [to understand the critical incidents]”.

José C. Castillo Chapter 7: Expectations, Discussion, Lessons Learned
96
Clip-and-report evaluator-subject #2:
“[The audio on the tape was] totally useless; there wasn’t any [verbal input], except fortyping and mumbling.”
Verbal protocol did not play a vital role in determining critical incidents in this study.User-subjects were not particularly encouraged to talk aloud during task performance and onlythree user-subjects gave spontaneous comments. Verbal protocol might still be consideredvaluable in identifying critical incidents and future work should include finding an effectivetechnique for prompting users to provide verbal explanations of the critical incidents encounteredduring task performance.
7.3.5 Role of audio in reporting critical incidents
Verbal descriptions of critical incidents are an alternative for entering text in a dialogue box(e.g., Remote Evaluation Report window). Verbal descriptions (Ericsson and Jones, 1990),which use a non-visual output channel, might not interfere with task performance as much astyping does. Further, reporting critical incidents verbally would normally take less time thantyping. Disadvantages of verbal reporting include the cost of adding adequate audio equipment(e.g., microphone) for recording verbal comments and the possibility of interfering with tasks ofother users located in quiet environments (e.g., library, cubicles).
Expectation #35: For the most part, user-subjects may indicate a preference to reporting critical incidentsverbally rather than typing.
In the feasibility case study (Section 5.5), user-subjects gave a verbal description of the criticalincident that was captured on an audio track of the videotape. Those user-subjects indicated thatproviding verbal descriptions did not interfere with their tasks. Consequently, it was expected inthis study that the majority of user-subjects would like the idea of reporting critical incidentsverbally (e.g., recording comments using a microphone) rather than typing them. However, only11 (or 46%) of all 24 user-subjects agreed that they preferred to provide verbal critical incidentreports (Figure 7-35). Despite these results, a future study should explore use of audio in theuser-reported critical incident method with other kinds of users, like telephone operators (Mulleret al., 1995), who would normally use a non-visual output channel for communicating duringtheir everyday work and possibly would benefit more from reporting critical incidents verbally.
3
7
3
5
3 3
0
6
12
Num
ber
of
user
-sub
ject
s
moderatelydisagree
disagree agree moderatelyagree
stronglyagree
stronglydisagree
Figure 7-35. User-subject preference for reporting critical incidents verbally

José C. Castillo Chapter 7: Expectations, Discussion, Lessons Learned
97
7.3.6 Role of video in the study
For obtaining video clips in contextualized critical incident reports, the experimenter consideredusing UCDCam (Section 2.2.5) to record screen-sequence video clips containing critical incidentdata. But, as learned from the feasibility case study, to provide the maximum raw data inexperimental studies, it is more useful to use normal continuous video to capture user actionsduring the entire evaluation session. For that reason, for each user-subject in the study, theexperimenter recorded all the screen activity via a scan converter and videotape deck.
Expectation #36: Videotaping of user-subject screen activity during the entire session will be helpful inobtaining relevant information (e.g., severity of critical incidents missed by user) that could have beenmissed by only observing screen-sequence clips.
Reviewing videotapes of the entire evaluation session was essential to gather the necessary dataabout the critical incidents encountered during the evaluation session. It was necessary for theexperimenter to review all videotapes (24 one-hour tapes) to tag and code all critical incidents,and brief, selected video clips would have been grossly inadequate for this task.
Watching the videotapes was not enough to understand the exact problems that some user-subjects experienced. In two cases, critical incidents were observed by the experimenter andreported by user-subjects, but user-subjects reported the critical incident to be something elsethan what the experimenter had expected. In one situation the experimenter thought numerousnetwork delay messages were disturbing a user-subject, but what the user-subject reported waswanting to hit the “Return” or “Enter” key to activate a search query rather than clicking the“Search” button on the interface. In eight other cases, user-subjects reported low severity criticalincidents, but the experimenter did not perceive them to be critical incidents from watching thetapes. In such cases laboratory-based usability evaluation has the advantage that the evaluatorcan engage them in dialogue and elicit more understanding about the situation. However, thesecases are mostly limited to low severity problems.
As mentioned by one evaluator-subject who watched video clips to analyze critical incident data,one drawback of using the scan converter was that the computer’s screen resolution had to belowered to 640x480 pixels to satisfy the maximum available resolution for the scan converter:“The entire screen was not visible to me because of the scan converter clipping the image. Iwould have missed this critical incident if not for the report (e.g., scrollbar movement was notvisible).” Lowering the screen resolution increased the size of all objects (e.g., windows, text),making some objects too long to fit on the screen and making it difficult for experimenter todetermine what some user-subjects where typing, clicking, or pointing at.
In sum, the overall data obtained from the videotapes gave good insight about the user-reportedcritical incident method. The study yielded a wide variety of useful data that would have beenmissed by only observing screen-sequence video clips. Thus, for experiments it is essential touse continuous video for recording the entire usability evaluation session as a baseline forcomparison, rather than only storing screen-sequence video clips for each critical incident.
For deployment within the user-reported critical incident method in remote user locations, it ismore cost-effective (for both data collection and analysis) to use software tools (e.g., UCDCam)for capturing screen usage and collecting information from users. Instead of having real

José C. Castillo Chapter 7: Expectations, Discussion, Lessons Learned
98
evaluators spend long hours videotaping users, analyzing the data, and editing the observationaltapes into video clips, it is more effective for them to receive automatically recorded clipsfocused on critical incidents.
Adding a video camera to the setup of the user-reported critical incident method for recording theuser’s face would not be cost-effective because it would make the data gathering process morecostly and complex (e.g., adding hardware and software, larger network traffic caused byincreased size and number of video clips, longer time to analyze critical incident information),while adding less useful information.
7.3.7 Storing and communicating critical incident data
The normal mode of operation for the remote-reporting mechanism is having users connectedonline while using the application being evaluated. When the user is not connected online, thecritical incident reporting tool can store contextualized critical incident reports (i.e., textualreports and screen-sequence video clips) locally in the user’s computer. When the user next goesonline, the tool can automatically download reports and video clips to the evaluator’s computeror send them as email attachments. Further, the reporting tool can also wait until network delaypeak hours are over (e.g., midnight) to send the reports.
7.3.8 Issues relating to the proximity of a critical incident and its cause
Koenemann-Belliveau et al. (1994) claim that the cause of some critical incidents can be far fromthe occurrence (in time and task thread steps). This claim would seem to work against the user-reported critical incident method, implying that contextualized critical incident data does notalways reveal the cause of a critical incident. However, the objective of the method is only toidentify usability problems of the user interface, and is the responsibility of the evaluator(e.g., usability expert) to find what causes them. Future work will be conducted on approaches tocapture the contextualized critical incident data in a way that facilitates analysis and deduction ofthe causes of usability problems.
7.4 SUMMARY OF RESULTS AND LESSONS LEARNED
Results indicated that users, even when working in their daily job environment and lackinginteraction with evaluators, are capable of self-reporting high, medium, and low severity criticalincidents encountered during task performance. Results also showed that users can rateself-reported critical incidents with reasonable accuracy compared to an expert evaluator.
The user-reported critical incident method includes automatic and continuous scan-converted(or digital) video capture of screen activity during task performance. From this, the systemextracts contextualized critical incidents, short video clips of screen activity just momentspreceding the point at which a critical incident is reported. It was expected that these clips, whenreviewed by an evaluator in conjunction with reading the reports, to help explain the criticalincidents. However, because of the reporting delay just described, video clips often wereirrelevant to the critical incident. A solution to this problem is to de-couple the time of critical
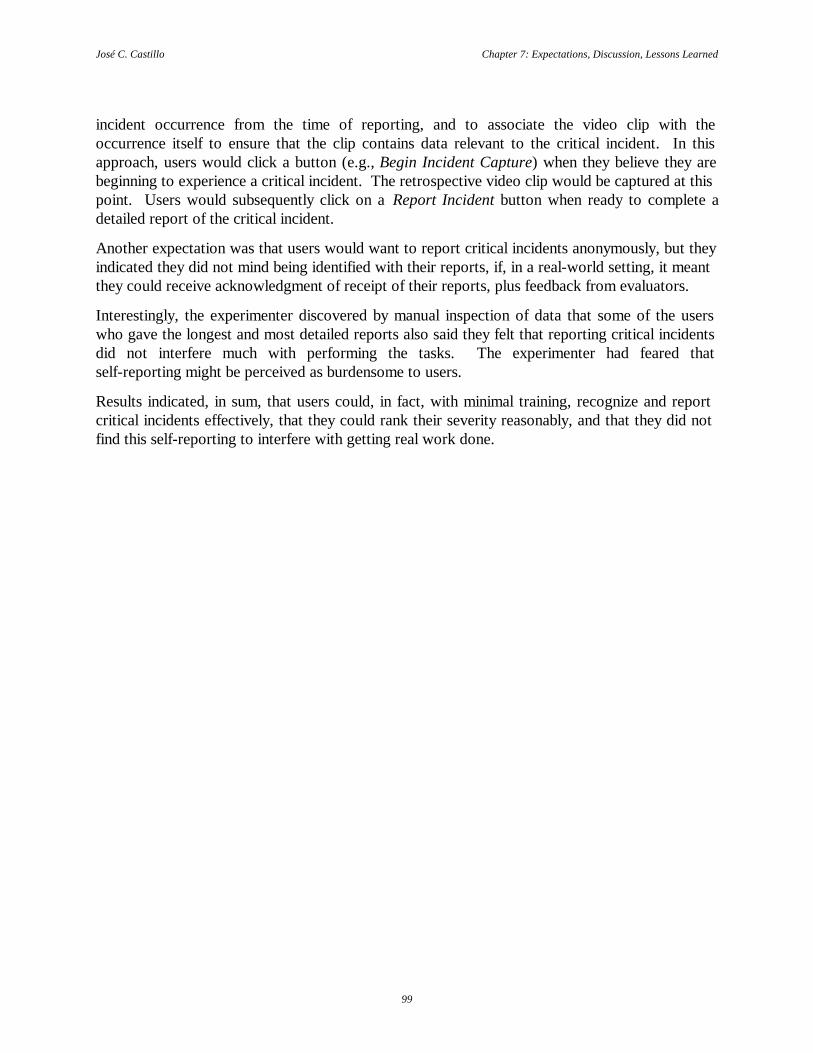
José C. Castillo Chapter 7: Expectations, Discussion, Lessons Learned
99
incident occurrence from the time of reporting, and to associate the video clip with theoccurrence itself to ensure that the clip contains data relevant to the critical incident. In thisapproach, users would click a button (e.g., Begin Incident Capture) when they believe they arebeginning to experience a critical incident. The retrospective video clip would be captured at thispoint. Users would subsequently click on a Report Incident button when ready to complete adetailed report of the critical incident.
Another expectation was that users would want to report critical incidents anonymously, but theyindicated they did not mind being identified with their reports, if, in a real-world setting, it meantthey could receive acknowledgment of receipt of their reports, plus feedback from evaluators.
Interestingly, the experimenter discovered by manual inspection of data that some of the userswho gave the longest and most detailed reports also said they felt that reporting critical incidentsdid not interfere much with performing the tasks. The experimenter had feared thatself-reporting might be perceived as burdensome to users.
Results indicated, in sum, that users could, in fact, with minimal training, recognize and reportcritical incidents effectively, that they could rank their severity reasonably, and that they did notfind this self-reporting to interfere with getting real work done.
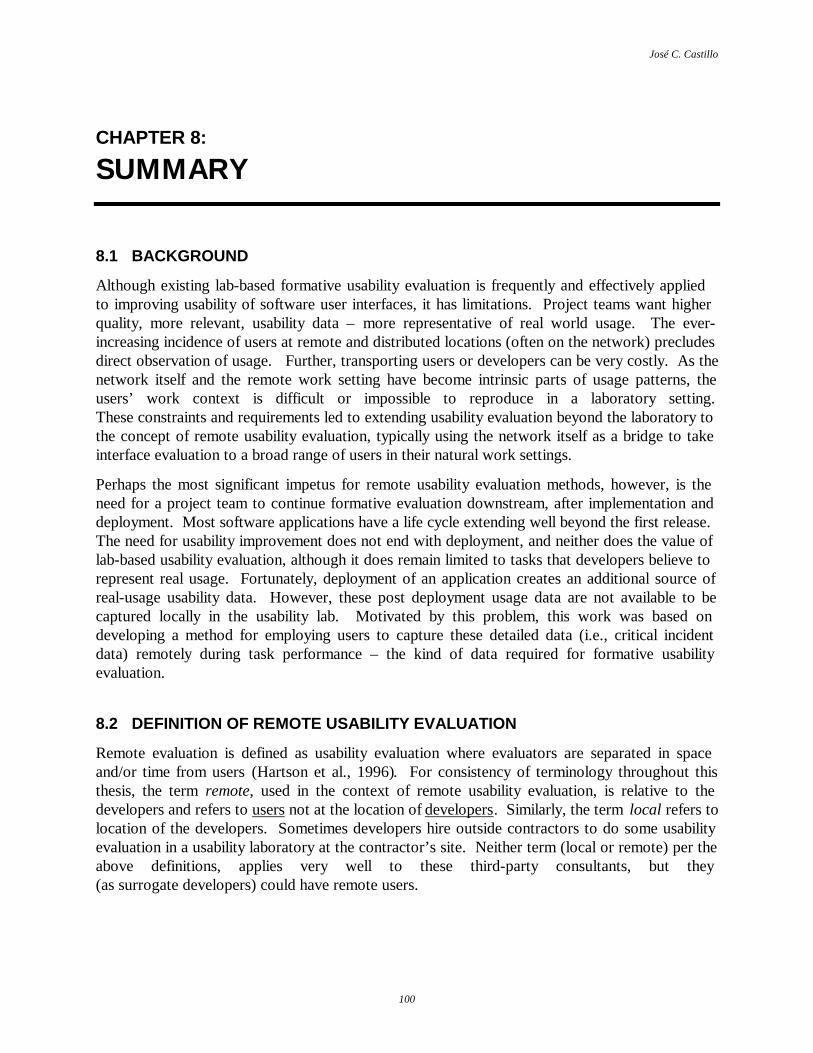
José C. Castillo
100
CHAPTER 8:
SUMMARY
8.1 BACKGROUND
Although existing lab-based formative usability evaluation is frequently and effectively appliedto improving usability of software user interfaces, it has limitations. Project teams want higherquality, more relevant, usability data – more representative of real world usage. The ever-increasing incidence of users at remote and distributed locations (often on the network) precludesdirect observation of usage. Further, transporting users or developers can be very costly. As thenetwork itself and the remote work setting have become intrinsic parts of usage patterns, theusers’ work context is difficult or impossible to reproduce in a laboratory setting.These constraints and requirements led to extending usability evaluation beyond the laboratory tothe concept of remote usability evaluation, typically using the network itself as a bridge to takeinterface evaluation to a broad range of users in their natural work settings.
Perhaps the most significant impetus for remote usability evaluation methods, however, is theneed for a project team to continue formative evaluation downstream, after implementation anddeployment. Most software applications have a life cycle extending well beyond the first release.The need for usability improvement does not end with deployment, and neither does the value oflab-based usability evaluation, although it does remain limited to tasks that developers believe torepresent real usage. Fortunately, deployment of an application creates an additional source ofreal-usage usability data. However, these post deployment usage data are not available to becaptured locally in the usability lab. Motivated by this problem, this work was based ondeveloping a method for employing users to capture these detailed data (i.e., critical incidentdata) remotely during task performance – the kind of data required for formative usabilityevaluation.
8.2 DEFINITION OF REMOTE USABILITY EVALUATION
Remote evaluation is defined as usability evaluation where evaluators are separated in spaceand/or time from users (Hartson et al., 1996). For consistency of terminology throughout thisthesis, the term remote, used in the context of remote usability evaluation, is relative to thedevelopers and refers to users not at the location of developers. Similarly, the term local refers tolocation of the developers. Sometimes developers hire outside contractors to do some usabilityevaluation in a usability laboratory at the contractor’s site. Neither term (local or remote) per theabove definitions, applies very well to these third-party consultants, but they(as surrogate developers) could have remote users.

José C. Castillo Chapter 8: Summary
101
8.3 GOAL OF THIS WORK
Because of the vital importance of critical incident data and the opportunity for users to captureit, the over-arching goal of this work is to develop and evaluate a remote usability evaluationmethod for capturing critical incident data and satisfying the following criteria:
• tasks are performed by real users,• users are located in normal working environments,• users self-report own critical incidents,• data are captured in day-to-day task situations,• no direct interaction is needed between user and evaluator during an evaluation session,• data capture is cost-effective, and• data are high quality and therefore relatively easy to convert into usability problems.
Several methods have been developed for conducting usability evaluation without directobservation of a user by an evaluator (see Section 3.2 entitled “Types of remote evaluationmethods”). However, none of these existing remote evaluation methods (nor even traditionallaboratory-based evaluation) meets all the above criteria. The result of working toward this goalis the user-reported critical incident method, described in this thesis.
8.4 APPROACH
The over-all goal of developing and evaluating a new method for remote usability evaluation iscomprised of several steps, each representing a substantial project on its own:
1. feasibility case study to explore relevant issues, develop the operative research questions;
2. development of the user-reported critical incident method;
3. extensive exploratory study of the method to gain understanding and insight about themethod;
4. controlled laboratory-based experiments validating research hypotheses; and
5. field studies conducted in real work environments, accounting for work context factors(e.g., noise, interruptions, multi-thread task performance).
Steps 1, 2, and 3 comprise the work completed for this thesis. The first step, the case studydescribed in Chapter 5, was reported in Hartson et al. (1996), where the method was calledsemi-instrumented critical incident gathering. The objective of this step was to judge feasibilityof the method — determining if this new method could provide approximately the same quantityand quality of qualitative data that can be obtained from laboratory-based formative evaluation,and determining if this is possible in a way that was cost-effective for both evaluator(e.g., minimal resources for data collection and analysis) and user (e.g., minimal interferencewith work). Based on the insights gained from the case study, in the second step a new methodfor conducting remote usability evaluation was developed called the user-reported critical
José C. Castillo Chapter 8: Summary
102
incident method. Step 3 is an in-depth exploratory study reported in Chapters 4, 6, and 7.Steps 4 and 5 are reserved for future work.
8.5 DESCRIPTION OF THE USER-REPORTED CRITICAL INCIDENT METHOD
The user-reported critical incident method is a usability evaluation method that involves realusers located in their own working environment, doing everyday tasks, and reporting criticalincidents (after receiving minimal training) without direct interaction with evaluators. Criticalincident reports are augmented with task context in the form of screen-sequence video clips andevaluators analyze these contextualized critical incident reports, transforming them into usabilityproblem descriptions.
8.6 EXPLORATORY STUDY
8.6.1 Objectives
As mentioned in Section 8.4, the exploratory study in step 3 was performed. The study isdescribed as exploratory because, although quantitative data was obtained, it was not the kind ofsummative study that uses statistically significant results to prove or refute an experimentalhypothesis. Rather, it was an exploratory study to gain insight and understanding, under practicaloperating conditions, about the strengths and weaknesses of the method. In particular, theobjectives were:
Objective 1: Investigate feasibility a nd effectiveness of employing users to identify andreport their own critical incidents during usage.
Objective 2: Investigate feasibility and effectiveness of transforming remotely gatheredcritical incident data into usability problem descriptions.
Objective 3 Gain insight into various parameters associated with the user-reported criticalincident method.
Objective 1 translates to the following research question: Can users report their own criticalincidents and how well can they do it? In this study, Objective 1 is divided into the followingsub-objectives:
1. Explore issues about user-subject performance in identifying and reporting criticalincidents:
• User-subject ability to identify and report critical incidents during taskperformance
• User-subject activity sequencing and timing in reporting critical incidents• Level of time and effort required to report critical incidents• User-subject ability to rate severity of critical incidents

José C. Castillo Chapter 8: Summary
103
• User-subject ability to identify high severity critical incidents as well as low andmedium severity critical incidents
2. Obtain subjective data about user-subject perceptions, preferences, and attitudes towardsremotely-reporting critical incidents:
• User-subject attitudes towards remotely-reporting critical incidents• User-subject preferences with respect to reporting critical incidents anonymously• User-subject perceptions with respect to interference with user tasks• User-subject preferences relating to reporting negative and positive critical
incidents
Objective 2 translates to the following research question: Can evaluators use critical incident datato produce usability problem descriptions and how well can they do it? In this study, Objective 2is divided into the following sub-objectives:
• Ability of evaluator-subjects to analyze critical incident data• Role of textual reports in data analysis• Role of video in data analysis• Role of audio in data analysis• Time and effort required to analyze critical incident data• Level of agreement with user-subject critical incident severity ratings
Objective 3 translates to the following research question: What are the variables and values thatmake the method work best? In this study, Objective 3 is divided into the followingsub-objectives:
• Preferred location for the critical incident reporting tool• Using the Remote Evaluation Report window• Role of training in reporting critical incidents• Verbal protocol issues• Role of audio in reporting critical incidents• Role of video in the study• Packaging critical incident data• Issues relating to the proximity of a critical incident and its cause
8.6.2 Design, results, and lessons learned
The exploratory study was divided in two phases: critical incident gathering (Phase I in Section6.3) and transformation of critical incident data into usability problem descriptions (Phase II inSection 6.4). Results from Phase I (Section 7.1) revealed that users, with only brief training canidentify, report, and rate the severity level of their own critical incidents. Observations alsoindicated a need for much more flexibility in structure, quantity, format, and timing of reportsthan expected.
José C. Castillo Chapter 8: Summary
104
Screen-sequence video clips accompany textual reports as visual context to obtain moreinformation about each critical incident. Automatic capture of these clips requires some triggermechanism to initiate the capture process. The clicking by the user on the Report Incident buttonwas intended to be this trigger mechanism. However, the most significant observation in thestudy was a highly variable, and often large, delay between the time when the video clip shouldbegin (at the clear onset of a critical incident) and the time when user-subjects click the ReportIncident button. The result is often video clips that contain user actions irrelevant to the criticalincident. Thus, this study reveals that a different trigger mechanism, separate from the ReportIncident button, is required.
User-subjects who voluntarily participated in Phase I of the study were university students andnot real application users working on real tasks in their normal working environment. To finduser-subjects representative of a large population of users, the experimenter administered abackground questionnaire to students. All 24 user-subjects came from a variety of academicdisciplines and had minimum knowledge of Web browsing and Web-based information retrieval.No experience was required with the Internet Movie Database, the application evaluated in thestudy. User-subjects performed six search tasks predefined by the experimenter.The experimenter selected these tasks considering what he considered representative usage (i.e.,search tasks) of the Internet Movie Database by real users. We find students to be crediblerepresentative users of a movie database, and we have no reason to believe that either theirbehavior or their performance would be significantly different from other, non-student, users.
In real life situations, users located in their natural work setting lack the means to contactevaluators (or application developers) when critical incidents occur. To simulate this lack ofinteraction in the study, user-subjects were isolated and told they were on their own during theevaluation session. Despite the fact that the study was not conducted in a real remote evaluationsituation with real users, real tasks, and a real remote working environment, the experimentconsiders that results identified in this thesis are valid and that user-subjects did not providegratuitous critical incident reports sent to please the experimenter.
As a general matter, the small number of evaluator-subjects and individual differences amongthem strongly colored the results of Phase II of the study, presumably contributing to the lowsignificance of its results. Therefore, the “results” obtained are hypotheses and not conclusions,and will serve as expectations for a future study.
8.7 REMOTE VERSUS LOCAL USABILITY EVALUATION
Will remote evaluation ever replace the traditional lab-based usability evaluation? Remoteusability evaluation methods are not a direct replacement for lab-based evaluation. Interactivesoftware development groups have large investments in usability labs, employing established andeffective evaluation process. The face-to-face contact between users and evaluators in atraditional usability evaluation setting is crucial to help identify critical incidents that wouldotherwise be missed by only watching video clips or reading reports. It is also essential ineliciting verbal protocol data. However, these high quality data are produced at a high cost.

José C. Castillo Chapter 8: Summary
105
Additionally, lab-based evaluation is the only realistic alternative for early prototypes, before aworking version is available remotely.
However, once the earliest version of a software system is deployed, remote evaluation methodspick up where lab-based evaluation often leaves off. Perhaps, the most significant impetus forremote usability evaluation methods is the need for a project team to continue formativeevaluation downstream, after implementation and deployment. Most software applications havea life cycle extending well beyond the first release. The need for usability improvement does notend with deployment, and neither does the value of lab-based usability evaluation, although itdoes remain limited to tasks that developers believe to represent real usage. Deployment of anapplication creates an additional source of real-usage usability data, however, these postdeployment usage data are not available to be captured locally in the usability lab. Fortunately,the user-reported critical incident method can be employed to capture these data and at a lowercost than lab-based evaluation.
Further, as many of the basic and more obvious usability problems have been removed via theusability lab process and software becomes deployed, project teams seek higher quality usabilitydata, more relevant to, and more representative of, real world usage. The ever-increasingincidence of users at remote and distributed locations (often on the network) precludes directobservation of usage. As the network itself and the remote work setting have become intrinsicparts of usage patterns, the users’ work context is difficult or impossible to reproduce in alaboratory setting. Further, transporting users or developers to remote locations can be verycostly. These barriers led to extending usability evaluation beyond the laboratory to the conceptof remote usability evaluation, typically using the network itself as a bridge to take interfaceevaluation to a broad range of users in their natural work settings.
Finally, remote evaluation methods have the potential to vastly improve other post-deploymentactivities such as field support and customer help lines. While these activities have a significantimpact on overall usability in the long term, possibly because they are not perceived asglamorous as the up-front design and evaluation activities, they have not received much attentionfrom the HCI community. Remote usability evaluation can provide a remedy to this, tying theseactivities back to the usability development cycle.

José C. Castillo
106
CHAPTER 9:
FUTURE WORK
The topics for future work are introduced in approximate order of chronology.
9.1 REFINING THE METHOD
The future work activities in the following subsections are partly to follow-up on study results,partly to extend method.
9.1.1 Role of video for contextual data in critical incident reports
In general, it was expected that evaluator-subjects would consider video clips to be a necessarysupplement to written reports in understanding the task context leading up to the critical incident.Although the results of this study do not support this expectation, the experimenter strongly feltthat this small amount of data was not sufficient to rule out those expectations, and this issueshould be of high priority to explore in a future study. Therefore, a formal study will beconducted to investigate the usefulness of video clips in analyzing critical incident data.
This study will require two kinds of participants: user-subjects (not trained in usability methods)and evaluator-subjects (trained in human-computer interaction and usability methods).User-subjects will perform representative tasks and report critical incidents during taskperformance. Evaluator-subjects will analyze contextualized critical incident data in the form oftextual critical incident reports and video clips to provide subjective feedback about:
• whether evaluator-subjects prefer having both textual reports and video clips for dataanalysis, over having only one of these two;
• effort required to map a video clip to the corresponding critical incident report;• time and effort required to analyze both video clips and critical incident reports to create a
list of usability problem descriptions; and• usefulness of video in helping to understand the critical incident.
9.1.2 Evaluating the new video clip trigger redesign
Assuming that video clips are useful to convey critical incident data, a formal study will beconducted to evaluate the video clip trigger mechanism (i.e., Begin Incident Capture button) ofthe critical incident reporting tool (Figure 7-7). This study will require two kinds of participants:user-subjects and evaluator-subjects.
During the evaluation sessions, the computer screen will be recorded using continuous videowhile user-subjects perform representative tasks. Users will click the Begin Incident Capture

José C. Castillo Chapter 9: Future Work
107
button at the inception of each critical incident (i.e., when an occurrence of difficulty isbeginning), even though information may yet be insufficient for effective reporting. Users whounderstand how the mechanism works can even "re-enact" a critical incident for capture.Knowing that this button triggers recording of screen-sequence video clips, users can dosomething on the screen that they want the evaluator to see on the clip and then click the button.Later, when ready, users will click the Send Full Report button to send a detailed report of theincident. Following the evaluation session, user-subjects will complete a questionnaire todescribe their experience as remote users, including information about their perceived ability torecognize (i.e., clicking Begin Incident Capture button) and report critical incidents (i.e., clickingSend Full Report button).
For each user-subject, evaluator-subjects will watch a full videotape with task performance todetermine the exact time of reporting critical incidents (i.e., during or after task performance).After watching all videotapes, evaluator-subjects will then watch screen-sequence video clips foreach user-subject to provide subjective feedback about the relevance of critical incident datacontained on the clips and their usefulness for creating usability problem descriptions.
9.1.3 Determining the optimal length and starting point for a critical incidentvideo clip
A formal case study will be conducted to determine the optimal length and starting point forproducing critical incident video clips of good quality (i.e., containing useful information aboutthe critical incident). This study will require two different types of participants: user-subjectsand expert-subjects (trained in human-computer interaction and usability methods). Afterreceiving critical incident training, user-subjects will perform a set or representative tasks andremotely-report critical incidents. The computer screen for each user-subject will be videotapedduring the entire evaluation session (e.g., 45 min. of videotape per user-subject), and after alluser-subjects are videotaped, a panel of expert-subjects will review the tapes to determine a goodapproximation for the best length and starting point for producing critical incident video clips.After deciding the optimal length and starting point for a video clip, a study will be conducted todetermine a way to automate capture of screen-sequence video clips (e.g., using UCDCam).
9.1.4 Critical incident training
Success of the user-reported critical incident method depends on the ability of typical users torecognize and report critical incidents effectively, but there is no reason to believe that all usershave this ability naturally. This study was designed with the assumption that some trainingwould be required — 12 user-subjects received extensive explanation on identifying criticalincidents, all 24 user-subjects received a brief explanation on identifying and reporting criticalincidents, and a practice on reporting critical incidents.
Results in Section 7.3.3 seem to indicate that there was no significant difference in the qualityand quantity of critical incident reports among all user-subjects, however, further research isnecessary to investigate whether users need to be trained to identify and report critical incidentseffectively. If results of this research reveal the need for training, a study can be conducted to:

José C. Castillo Chapter 9: Future Work
108
• determine the appropriate content and amount of critical incident training (i.e., provideinformation about both identifying and reporting critical incidents or only aboutidentifying critical incidents, emphasize that users should click the Begin IncidentCapture button immediately after a critical incident occurs in order to record usefulcritical incident data), and
• investigate further the effect of the practice part of the training (i.e., practice identifyingand reporting a critical incident, preferably using the same application being evaluated) inuser task performance.
Videotape has proven to be a consistent medium for conveying training to users, employing twodifferent people playing the roles of user and narrator respectively. In the future, critical incidenttraining can also be developed as a series of video clips that a broader range of users can accessvia a Web browser. With this kind of self-paced training users will be capable of taking trainingat their own speed and downloading clips for different types of usability problems.
9.1.5 Real users doing real tasks at their normal working environment
Once the new video clip trigger mechanism is evaluated and critical incident training isredesigned, the next step is to conduct a formal study to confirm results found in this thesis in areal remote usability evaluation setting. This study will require user-subjects and evaluator-subjects. User-subjects will be real application users, working on day-to-day tasks in theirnormal working environment. During the study, user-subjects will be asked to identify andreport critical incidents during task performance using a Remote Evaluation window. Criticalincident reports will be sent to evaluator-subjects, whose role is to analyze these reports intousability problem descriptions and compare results found with those reported by this thesis.
9.1.6 Comparison of verbal and textual critical incident reporting
A formal study will be conducted to investigate user preference in verbal or textual criticalincident reporting. This study will require two kinds of participants: user-subjects and evaluator-subjects. First, user-subjects will perform a set of representative tasks and report critical incidentusing a textual form. The same group of user-subjects (i.e., within-subjects design) will alsoperform a similar set of tasks but this time reporting critical incidents verbally. During taskperformance, the experimenter will determine the time and effort of user-subjects in reportingcritical incidents under both conditions. After the experimental session is conducted, each user-subject will complete a questionnaire to indicate his or her preference in reporting criticalincidents.
A group of evaluator-subjects will receive both kinds of critical incident reports (verbal andtextual) and analyze them to create a list of usability problem descriptions for each condition.Finally, evaluator-subjects will complete a questionnaire to indicate:
• the time an effort required to analyze both kinds of data,• their preference about analyzing textual or verbal critical incident reports, and/or

José C. Castillo Chapter 9: Future Work
109
• the usefulness of verbal and textual data (i.e., which condition provides data of higherquality and accuracy?).
9.2 COMPARISONS WITH OTHER METHODS
9.2.1 Comparison of the user-reported critical incident method with othe r remoteevaluation techniques
Empirical studies can be similarly conducted to compare the user-reported critical incidentmethod with the various remote evaluation techniques described in Section 3.2. The purpose ofeach study will be to investigate advantages, disadvantages, similarities, and differences betweenthe user-reported critical incident method and the corresponding remote evaluation technique.Every study will require three types of participants: user-subjects (performing representativetasks), evaluator-subjects (creating usability problem descriptions), and expert-subjects (usingusability problem descriptions and other kinds of data to compare the user-reported criticalincident method with the respective remote evaluation technique).
9.2.2 Comparison of the user-reported critical incident method with traditionallaboratory-based usability evaluation
An empirical study will be conducted to compare the quality and correctness of usability problemdescriptions obtained from the user-reported critical incident method with usability problemsdescriptions obtained from laboratory-based evaluation, the traditional yardstick for comparisonwith new usability methods. This study will involve three types of participants: user-subjects,evaluator-subjects, and expert-subjects.
User-subjects and evaluator-subjects will be divided into two groups (i.e., remote and laboratory-based condition). In the remote condition, a group of user-subjects will identify and reportcritical incidents during task performance. Evaluator-subjects for the remote condition willindependently analyze contextualized critical incident reports sent by user-subjects to create a listof usability problem descriptions. In the local evaluation condition, another group of user-subjects will talk-aloud aloud during task performance, while different evaluator-subjectsindependently create a list of critical incidents. These evaluator-subjects will later analyzecritical incident data obtained during the evaluation sessions (e.g., videotape, evaluator notes) tocreate a list of usability problem descriptions. As a final step, a panel of expert-subjects willcompare the lists of usability problem descriptions obtained from evaluator-subjects of bothconditions to determine similarities and differences among them.
9.3 FURTHER FUTURE WORK
9.3.1 The user-reported critical incident method in the software life cycle
A qualitative study will be conducted to investigate the place of the user-reported critical incidentmethod in the overall software and user interface life cycles and determine which types of

José C. Castillo Chapter 9: Future Work
110
applications are more suitable to be evaluated remotely. A survey will be sent to a number ofusability specialists, human-factor practitioners, software engineers, and managers to obtainsubjective data about this subject matter.
In general, the user-reported critical incident method could be applied in the following stages, towhich results produced by the method will be different from one software stage to another:
• early formative evaluation;• alpha, beta, and other field usability evaluation;• post-deployment;• field and customer support; and• marketing strategies.
One complete untapped area that could benefit from remote usability evaluation is customersupport. In this regard, a new whole domain of applications of the user-reported critical incidentmethod can be explored, for example, to allow customers to talk about very specific points ofusability problems of software, instead of just generalities. It also has potential to get feedbackfrom evaluators back to the users.
9.3.2 Usability Problem Classifier
The Usability Problem Classifier (van Rens, 1997), a method for classifying usability problems,provides evaluators with structured guidance in creating usability problem descriptions forproblem reporting. This guidance ensures that descriptions are complete and well-structured,thereby improving their quality. A study will be conducted to explore the possible integration ofthe Usability Problem Classifier with the user-reported critical incident method. This study willrequire two types of participants: user-subjects and evaluator-subjects. User-subjects willperform representative tasks and report critical incidents encountered during task performance.Evaluator-subjects, on the other hand, will analyze critical incident data and use the UsabilityProblem Classifier to create usability problem descriptions. Results of this study will also helpdetermine what additional information is needed from the user-reported critical incident methodto support high quality usability problem reporting and complete classification.
9.3.3 Severity rating
In this study (Section 7.1.8), many user-subjects indicated that it was somewhat easy to rate theseverity of critical incidents. However, some user-subjects still found various difficulties inrating critical incidents using a 5-point scale. Previous researchers used 6-point and 7-pointscales to indicate critical incident severity, but this study showed that it is quite difficult to makea comprehensive and reliable scale. In fact, instead of rating critical incidents by severity, theultimate goal is to find the importance to fix of critical incidents, which is influenced by severalfactors (e.g., impact on satisfaction, impact on performance, severity of errors caused by thecritical incident). For that reason, a study will be conducted to create a comprehensive way todetermine the importance to fix of critical incidents by allowing users to indicate the degree to
José C. Castillo Chapter 9: Future Work
111
which each factor influenced their task performance (e.g., did not impact satisfaction, unable tocomplete task, high severity critical incidents).

José C. Castillo
112
REFERENCES
Abelow, D. (1993). Automating Feedback on Software Product Use. CASE Trends, 15-17.
Andersson, B.-E., and Nilsson, S.-G. (1964). Studies in the Reliability and Validity of theCritical Incident Technique. Journal of Applied Psychology, 48(6), 398-403.
Ashlund, S., and Hix, D. (1992). IDEAL: A Tool to Enable User-Centered Design. Proceedingsof the CHI Conference on Human Factors in Computing Systems (Posters and ShortTalks Supplement to Proceedings), 119-120.
Bowers, V.A., and Snyder, H.L. (1990). Concurrent Versus Retrospective Verbal Protocol forComparing Window Usability. Proceedings of the 34th Annual Meeting of the HumanFactors Society, 1270-1274.
Carroll, J.M. (1984). Minimalist Training. Datamation, 30(18), 125-136.
Carroll, J.M. (1990). An Overview of Minimalist Instruction. Proceedings of the 23rd AnnualMeeting of the Human Factors Society. (IEEE Computer Society Press Reprint,December 1994, 210-219).
Carroll, J.M., Koenemann-Belliveau, J., Rosson, M.B., and Singley, M.K. (1993). CriticalIncidents and Critical Themes in Empirical Usability Evaluation. Proceedings of theHCI-93 Conference, 279-292.
Compaq Corporation. (1997). Compaq Carbon Copy. Internet WWW page at:http://www.microcom.com/products/sas/cc/index.html [Accessed:7/1/97].
del Galdo, E.M., Williges, R.C., Williges, B.H., and Wixon, D.R. (1986). An Evaluation ofCritical Incidents for Software Documentation Design. Proceedings of the 30th AnnualHuman Factors Society Conference, 19-23.
Dzida, W., Wiethoff, M., and Arnold, A.G. (1993). ERGOGuide: The Quality Assurance Guideto Ergonomic Software . Joint internal technical report of GMD (Germany) and DelftUniversity of Technology (The Netherlands).
Elgin, B. (1995). Subjective Usability Feedback from the Field over a Network. SIGCHI Bulletin,27(4), 43-44.
ErgoLight™ Usability Software. (1997). ErgoLight™ Usability Software Home Page. InternetWWW page at: http://www.ergolight.co.il/ [Accessed:7/1/97].
Ericsson, K.A., and Jones, R.E. (1990). Verbal reports as data. Psychological Review, 87, 215-251.
Fitts, P.M., and Jones, R.E. (1947). Psychological Aspects of Instrument Display: Analysis ofFactors Contributing to 460 "Pilot Error" Experiences in Operating Aircraft Controls. In

José C. Castillo References
113
H.W. Sinaiko (Ed.), Selected Papers on Human Factors in the Design and Use of ControlSystems (1961) (pp. 332-358). New York: Dover Publications, Inc.
Flanagan, J.C. (1954). The Critical Incident Technique. Psychological Bulletin, 51(4), 327-358.
Fleming, S.T., Kilgour, A.C., and Smith, C. (1993). Computer Support for Evaluation Studies.Proceedings of the INTERCHI'93 Conference on Human Factors in Computing Systems,201-202.
Goodman, D. (1996). JavaScript Handbook. California: IDG Books Worldwide, Inc.
Hameluck, D.E., and Velocci, V.V. (1996). Buffered screen capturing software tool for usabilitytesting of computer applications . Submitted by IBM Canada Limited to Canadian PatentOffice (CA9-96-016).
Hammontree, M., Weiler, P., and Nayak, N. (1994). Remote Usability Testing. Interactions, 21-25.
Hartson, H.R., Castillo, J.C., Kelso, J., Kamler, J., and Neale, W.C. (1996). Remote Evaluation:The Network as an Extension of the Usability Laboratory. Proceedings of the CHIConference on Human Factors in Computing Systems, 228-235.
Hix, D., and Hartson, H.R. (1993). Developing User Interfaces: Ensuring Usability ThroughProduct & Process. New York: John Wiley & Sons, Inc.
Hix, D., and Hartson, H.R. (1994). IDEAL: An Environment for User-Centered Development ofUser Interfaces. Proceedings of the EWHCI'94: Fourth East-West InternationalConference on Human-Computer Interaction, 195-211.
Johansen, R. (1988). Groupware: Computer Support for Business Systems. New York: The FreePress.
Koenemann-Belliveau, J., Carroll, J.M., Rosson, M.B., and Singley, M.K. (1994). ComparativeUsability Evaluation: Critical Incidents and Critical Threads. Proceedings of the CHIConference on Human Factors in Computing Systems, 245-251.
Lewis, C. (1982). Using the "Thinking-aloud" Method in Cognitive Interface Design (ResearchReport RC 9265 (#40713)). Yorktown Heights: IBM Thomas J. Watson Research Center.
Meister, D. (1985). Behavioral Analysis and Measurement Methods. New York: John Wiley &Sons, Inc.
Microsoft Corporation. (1997). Microsoft NetMeeting: Overview. Internet WWW page at:http://www.microsoft.com/netmeeting/ [Accessed:7/1/97].
Muller, M.J., Carr, R., Ashworth, C., Diekmann, B., Wharton, C., Eickstaedt, C., and Clonts, J.(1995). Telephone Operators as Knowledge Workers: Consultants Who Meet CustomerNeeds. Proceedings of the CHI Conference on Human Factors in Computing Systems,130-137.

José C. Castillo References
114
Nielsen, J. (1992). Evaluating the Thinking-Aloud Technique for Use by Computer Scientists. InH.R. Hartsonand H. Hix (Eds.), Advances in Human-Computer Interaction (Vol. 3, pp.69-82). New Jersey: Ablex Publishing Corporation.
Nielsen, J. (1993). Usability Engineering. San Diego: Academic Press, Inc.
Ohnemus, K.R., and Biers, D.W. (1993). Retrospective versus Concurrent Thinking-Out-Loud inUsability Testing. Proceedings of the 37th Annual Meeting of the Human Factors Society,1127-1131.
Rubin, J. (1994). Handbook of Usability Testing. New York: John Wiley & Sons, Inc.
Shattuck, L.W., and Woods, D.D. (1994). The Critical Incident Technique: 40 Years Later.Proceedings of the 38th Annual Meeting of the Human Factors Society, 1080-1084.
Siochi, A.C., and Ehrich, R.W. (1991). Computer Analysis of User Interfaces Based onRepetition in Transcripts of User Sessions. ACM Transactions on Information Systems,9(4), 309-335.
Sun Microsystems. (1997). ShowMe Product Overview. Internet WWW page at:http://www.sun.com/products-n-solutions/sw/ShowMe/ [Accessed:7/1/97].
TeamWave Software Ltd. (1997). TeamWave Workplace Overview. Internet WWW page at:http://www.teamwave.com/overview.html [Accessed:7/1/97].
van der Meij, H., and Carroll, J.M. (1995, Second Quarter). Principles and Heuristics forDesigning Minimalist Instruction. Technical Communication, 243-261.
van Rens, L.S. (1997). Usability Problem Classifier. Unpublished Master's Thesis, InformationSystems, Tilburg University, Tilburg, The Netherlands (work done at the Department ofComputer Science, Virginia Tech, Blacksburg, VA, USA).
Vertical Research, I. (1997). About our Remote Inspection Service. Internet WWW page at:http://www.vrix.com/serv/rem_insp.htm [Accessed:7/1/97].
Waskul, D., and Douglass, M. (1996). Considering the Electronic Participant: Some PolemicalObservations on the Ethics of On-line Research. Information Society, 12(2), 129-139.
Whiteside, J., Bennett, J., and Holtzblatt, K. (1988). Usability Engineering: Our Experience andEvolution. In M. Helander (Ed.), Handbook of Human-Computer Interaction (pp. 791-817). Amsterdam: Elsevier North-Holland.
Wiedenbeck, S., Zila, P.L., and McConnell, D.S. (1995). End-User Training: An EmpiricalStudy Comparing On-line Practice Methods. Proceedings of the CHI Conference onHuman Factors in Computing Systems, 74-81.
WinWhatWhere Corporation. (1997). Welcome to WinWhat Where: What does W3 do? InternetWWW page at: http://www.winwhatwhere.com/bsiwww1.htm [Accessed:7/1/97].
Wright, P.C., and Monk, A.F. (1991, December). The use of Thinking-Aloud EvaluationMethods in Design. SIGCHI Bulletin, 23, 55-57.

José C. Castillo
115
APPENDICES
APPENDIX A: INFORMED CONSENT FORMS
A.1 Informed consent form for user-subjects
I. PURPOSE OF THIS RESEARCH
You are invited to participate in a study that investigates a method for evaluating software remotely. The studyinvolves experimentation for the purpose of evaluating and improving the user interface of the Internet MovieDatabase. The Internet Movie Database is an international organization whose objective is to provide useful and upto date movie information freely available on-line, across as many systems and platforms as possible. It currentlycovers over 75,000 movies with over 1,000,000 filmography entries and is expanding continuously. Advertising andsponsorship support their service.
II. PROCEDURES
You will be asked to perform a set of tasks using the Internet Movie Database. These tasks consist of variousprocedures for searching movie titles and character names on the database. Your role in this test is that of evaluatorof the software. We are not evaluating you or your performance in any way; you are helping us to evaluate oursystem. All information that you help us attain will remain anonymous.
You DO NOT need to complete all the tasks at one sitting. You can take as much time as you need, take breaksbetween tasks, or even do a few tasks per day. However, please make sure that you finish the tasks by Friday, March21, 1997. After the usability test you will be asked to complete a satisfaction questionnaire about your usage of thesystem.
The session will last about one hour. There are no risks to you. The tasks are not very tiring, but you are welcometo take rest breaks as needed. If you prefer, the session may be divided into two shorter sessions.
III. RISKS
There are no known risks to the subjects of this study.
IV. BENEFITS OF THIS PROJECT
Your participation in this project will provide information that may be used to improve the usability of the InternetMovie Database. No guarantee of benefits has been made to encourage you to participate. You may receive asynopsis summarizing this research when completed. Please leave a self-addressed envelope with the experimenterand a copy of the results will be sent to you.
You are requested to refrain from discussing the evaluation with other people who might be in the candidate poolfrom which other participants might be drawn.
V. EXTENT OF ANONYMITY AND CONFIDENTIALITY
The results of this study will be kept strictly confidential. Your written consent is required for the researchers torelease any data identified with you as an individual to anyone other than personnel working on the project. Theinformation you provide will have your name removed and only a subject number will identify you during analysesand any written reports of the research.
The screen actions of your usage will be videotaped. The tapes will be stored securely, viewed only by theexperimenters (Dr. H. Rex Hartson, José C. Castillo, Denis Neale, Jonathan Kies), and erased after 3 months. If the

José C. Castillo Appendices
116
experimenters wish to use a portion of your videotape for any other purpose, they will get your written permissionbefore using it. Your signature on this form does not give them permission to show your videotape to anyone else.
VI. COMPENSATION
Your participation is voluntary and unpaid.
VII. FREEDOM TO WITHDRAW
You are free to withdraw from this study at any time for any reason.
VIII. APPROVAL OF RESEARCH
This research has been approved, as required, by the Institutional Review Board for projects involving humansubjects at Virginia Polytechnic Institute and State University, and by the Department of Computer Science.
IX. SUBJECTS RESPONSIBILITIES AND PERMISSION
I voluntarily agree to participate in this study, and I know of no reason I cannot participate. I have read andunderstand the informed consent and conditions of this project. I have had all my questions answered. I herebyacknowledge the above and give my voluntary consent for participation in this project. If I participate, I maywithdraw at any time without penalty. I agree to abide by the rules of this project

José C. Castillo Appendices
117
A.2 Informed consent form for evaluator-subjects
I. PURPOSE OF THIS RESEARCH
You are invited to participate in a study that investigates a method for evaluating software remotely. The studyinvolves experimentation for the purpose of evaluating and improving the user interface of the Internet MovieDatabase. The Internet Movie Database is an international organization whose objective is to provide useful and upto date movie information freely available on-line, across as many systems and platforms as possible. It currentlycovers over 75,000 movies with over 1,000,000 filmography entries and is expanding continuously. Advertising andsponsorship support their service.
II. PROCEDURES
You will be asked to study a series of critical incident reports sent by user-subjects. User-subjects made thesereports when performing a set of tasks using the Internet Movie Database. The tasks consisted of differentprocedures of searching for movie titles and character names on the database. You will be asked to analyze thecritical incident reports and create a usability problem list. You can take as much time as you want to create theusability problem list, as long as you finish by February 21, 1997. You will also be asked to complete a questionnairerelating to your experience analyzing the critical incident reports.
Your role in this test is that of evaluator of the software. We are not evaluating you or your performance in any way;you are helping us to evaluate our system. All information that you help us attain will remain anonymous.
III. RISKS
There are no known risks to the subjects of this study.
IV. BENEFITS OF THIS PROJECT
Your participation in this project will provide information that may be used to improve the usability of the InternetMovie Database. No guarantee of benefits has been made to encourage you to participate. You may receive asynopsis summarizing this research when completed. Please leave a self-addressed envelope with the experimenterand a copy of the results will be sent to you.
You are requested to refrain from discussing the evaluation with other people who might be in the candidate poolfrom which other participants might be drawn.
V. EXTENT OF ANONYMITY AND CONFIDENTIALITY
The results of this study will be kept strictly confidential. Your written consent is required for the researchers torelease any data identified with you as an individual to anyone other than personnel working on the project. Theinformation you provide will have your name removed and only a subject number will identify you during analysesand any written reports of the research.
The experiment may be videotaped. If it is taped, the tapes will be stored securely, viewed only by the experimenters(Dr. H. Rex Hartson, José C. Castillo), and erased after 3 months. If the experimenters wish to use a portion of yourvideotape for any other purpose, they will get your written permission before using it. Your signature on this formdoes not give them permission to show your videotape to anyone else.
VI. COMPENSATION
Your participation is voluntary and unpaid.
VII. FREEDOM TO WITHDRAW
You are free to withdraw from this study at any time for any reason.

José C. Castillo Appendices
118
VIII. APPROVAL OF RESEARCH
This research has been approved, as required, by the Institutional Review Board for projects involving humansubjects at Virginia Polytechnic Institute and State University, and by the Department of Computer Science.
IX. SUBJECTS RESPONSIBILITIES AND PERMISSION
I voluntarily agree to participate in this study, and I know of no reason I cannot participate. I have read andunderstand the informed consent and conditions of this project. I have had all my questions answered. I herebyacknowledge the above and give my voluntary consent for participation in this project. If I participate, I maywithdraw at any time without penalty. I agree to abide by the rules of this project.

José C. Castillo Appendices
119
APPENDIX B: TASK-RELATED DOCUMENTS
B.1 Search tasks for user-subjects1. Write down the number of movies whose titles contain the word ‘bacon’ (e.g., the bacon, bacon and
eggs).
2. Find the performer whose character name was Michelle Thomas.
3. Find the titles of the four most recent movies directed by Steven Spielberg.
4. Find the titles of all mystery movies from 1966 to 1967 produced in French.
5. Find the titles of all movies featuring both Robert De Niro and Meryl Streep.
6. Find the titles of all movies in which Billy Crystal acted in the 90’s and that are over 2 hours long.
B.2 Participant answer sheet
Instructions: For each task that you complete, please write your answers at the Your Answer column. Remember that we are notevaluating you or your performance in any way; you are helping us to evaluate our system. Don’t be concerned ifyou can not finish a task or get any answers. Please return this sheet to the secretary of the Computer Sciencedepartment (McBryde 660) with attention to José C. Castillo.
TASK YOUR ANSWER
1 Write down the number of movies whose titles contain the word ‘bacon’(e.g., a bacon, bacon and eggs).
Number of movies whose titles contain the word‘bacon’:
2 Find the performer whose character name was Michelle Thomas. Performer’s name:
3 Find the titles of the four most recent movies directed by Steven Spielberg. Movie titles:
4 Find the titles of all mystery movies from 1966 to 1967 produced inFrench.
Titles of all French mystery movies from 1966 to 1967:
5 Find the titles of all movies featuring both Robert De Niro and MerylStreep.
Titles of movies featuring both Robert De Niro andMeryl Streep:
6 Find the titles of all movies in which Billy Crystal acted in the 90’s andthat are over 2 hours long.
Movie titles:
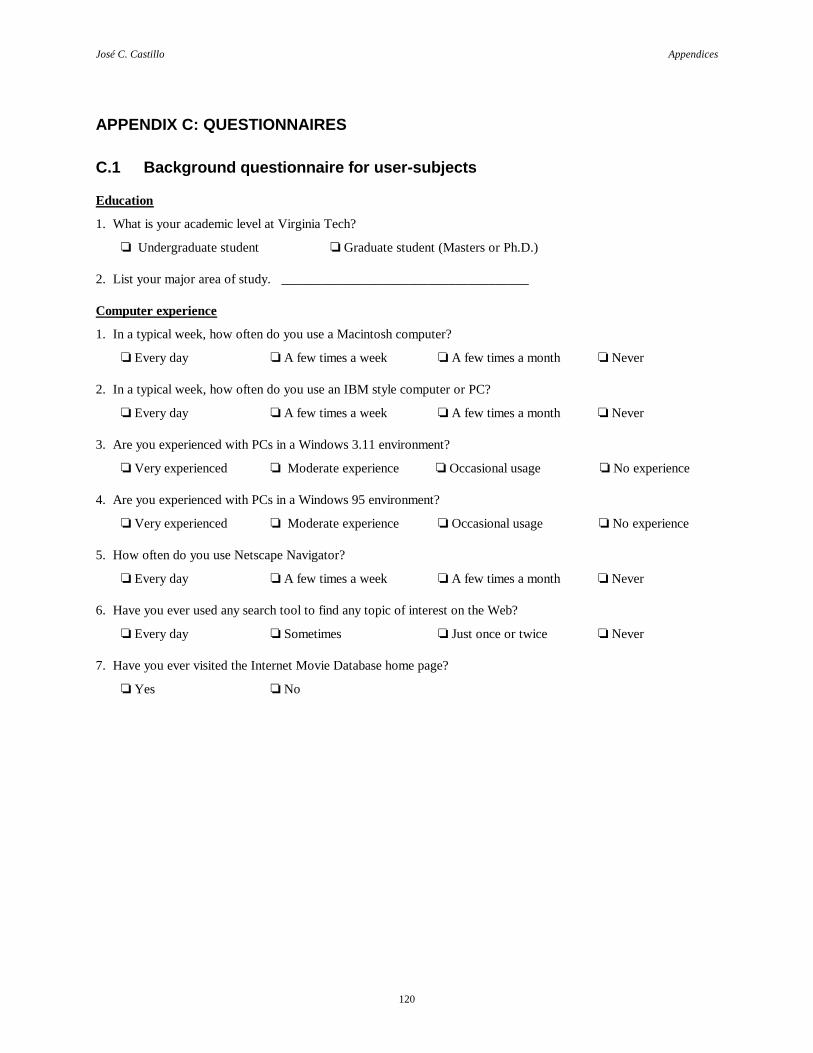
José C. Castillo Appendices
120
APPENDIX C: QUESTIONNAIRES
C.1 Background questionnaire for user-subjects
Education
1. What is your academic level at Virginia Tech?
o Undergraduate student o Graduate student (Masters or Ph.D.)
2. List your major area of study. _____________________________________
Computer experience
1. In a typical week, how often do you use a Macintosh computer?
o Every day o A few times a week o A few times a month o Never
2. In a typical week, how often do you use an IBM style computer or PC?
o Every day o A few times a week o A few times a month o Never
3. Are you experienced with PCs in a Windows 3.11 environment?
o Very experienced o Moderate experience o Occasional usage o No experience
4. Are you experienced with PCs in a Windows 95 environment?
o Very experienced o Moderate experience o Occasional usage o No experience
5. How often do you use Netscape Navigator?
o Every day o A few times a week o A few times a month o Never
6. Have you ever used any search tool to find any topic of interest on the Web?
o Every day o Sometimes o Just once or twice o Never
7. Have you ever visited the Internet Movie Database home page?
o Yes o No

José C. Castillo Appendices
121
C.2 Post-test questionnaire #1 for user-subjects
The critical incident training provided enough information.Stronglydisagree
p1
p2
p3
p4
p5
p6
Stronglyagree
pN/A
The training was easy to follow.Stronglydisagree
p1
p2
p3
p4
p5
p6
Stronglyagree
pN/A
The training helped me learn to recognize critical incidents.Stronglydisagree
p1
p2
p3
p4
p5
p6
Stronglyagree
pN/A
I like the idea of remote-reporting critical incident information to developers.Stronglydisagree
p1
p2
p3
p4
p5
p6
Stronglyagree
pN/A
Reporting critical incidents anonymously is important for me.Stronglydisagree
p1
p2
p3
p4
p5
p6
Stronglyagree
pN/A
It was easy to report critical incidents using the Remote Evaluation Report window.Stronglydisagree
p1
p2
p3
p4
p5
p6
Stronglyagree
pN/A
It was easy to determine the severity of critical incidents that I encountered.Stronglydisagree
p1
p2
p3
p4
p5
p6
Stronglyagree
pN/A
I would like to have a Report Incident button built into the software applications that I use.
Stronglydisagree
p1
p2
p3
p4
p5
p6
Stronglyagree
pN/A
If possible, I prefer to report incidents verbally (e.g., recording comments using a microphone) rather than typing.Stronglydisagree
p1
p2
p3
p4
p5
p6
Stronglyagree
pN/A
Reporting critical incidents did not interfere with my tasks.Stronglydisagree
p1
p2
p3
p4
p5
p6
Stronglyagree
pN/A
Additional comments about your experience as a remote user.
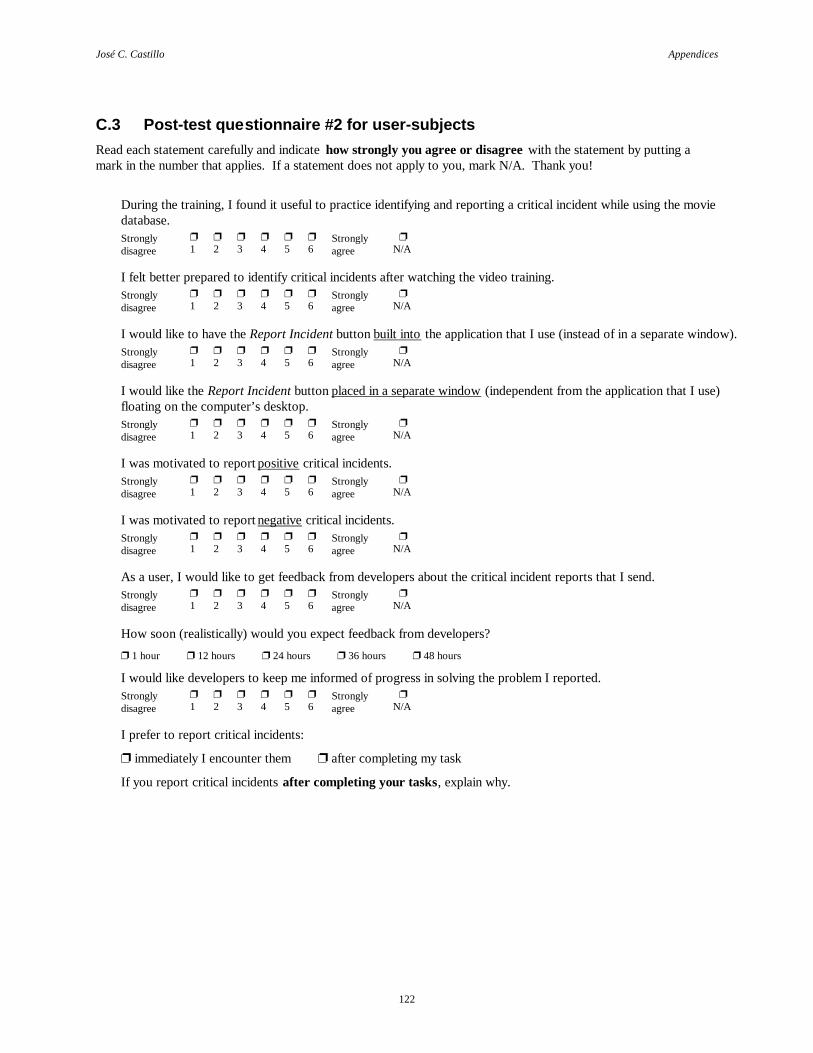
José C. Castillo Appendices
122
C.3 Post-test questionnaire #2 for user-subjectsRead each statement carefully and indicate how strongly you agree or disagree with the statement by putting amark in the number that applies. If a statement does not apply to you, mark N/A. Thank you!
During the training, I found it useful to practice identifying and reporting a critical incident while using the moviedatabase.Stronglydisagree
p1
p2
p3
p4
p5
p6
Stronglyagree
pN/A
I felt better prepared to identify critical incidents after watching the video training.Stronglydisagree
p1
p2
p3
p4
p5
p6
Stronglyagree
pN/A
I would like to have the Report Incident button built into the application that I use (instead of in a separate window).Stronglydisagree
p1
p2
p3
p4
p5
p6
Stronglyagree
pN/A
I would like the Report Incident button placed in a separate window (independent from the application that I use)floating on the computer’s desktop.Stronglydisagree
p1
p2
p3
p4
p5
p6
Stronglyagree
pN/A
I was motivated to report positive critical incidents.Stronglydisagree
p1
p2
p3
p4
p5
p6
Stronglyagree
pN/A
I was motivated to report negative critical incidents.Stronglydisagree
p1
p2
p3
p4
p5
p6
Stronglyagree
pN/A
As a user, I would like to get feedback from developers about the critical incident reports that I send.Stronglydisagree
p1
p2
p3
p4
p5
p6
Stronglyagree
pN/A
How soon (realistically) would you expect feedback from developers?
p 1 hour p 12 hours p 24 hours p 36 hours p 48 hours
I would like developers to keep me informed of progress in solving the problem I reported.Stronglydisagree
p1
p2
p3
p4
p5
p6
Stronglyagree
pN/A
I prefer to report critical incidents:
p immediately I encounter them p after completing my task
If you report critical incidents after completing your tasks, explain why.

José C. Castillo Appendices
123
C.4 Post-test questionnaire for evaluator-subjects who only analyzed criticalincident reports
Indicate the time you spent analyzing the critical incident reports and video clips into a list of usability problems.____ hours _____ min.
I generally agreed with the severity ratings user-subjects gave to critical incident reports.Stronglydisagree
p1
p2
p3
p4
p5
p6
Stronglyagree
pN/A
It was easy to understand the content of the critical incident reports.Stronglydisagree
p1
p2
p3
p4
p5
p6
Stronglyagree
pN/A
It was easy to create a list of usability problems using critical incident reports (without any supporting videotapeclips).Stronglydisagree
p1
p2
p3
p4
p5
p6
Stronglyagree
pN/A
I think that video clips (with audio) of screen action, in addition to the critical incident reports, would have helpedme determine usability problem descriptions.Stronglydisagree
p1
p2
p3
p4
p5
p6
Stronglyagree
pN/A
I would prefer to listen to verbal critical incident reports (i.e., audio with user’s voice) rather than reading textualreports.Stronglydisagree
p1
p2
p3
p4
p5
p6
Stronglyagree
pN/A
I would prefer to read the online version of the critical incident reports instead of paper copy.Stronglydisagree
p1
p2
p3
p4
p5
p6
Stronglyagree
pN/A

José C. Castillo Appendices
124
C.5 Post-test questionnaire for evaluator-subjects who analyzed both videoclips and critical incident reports
Indicate the time you spent analyzing the critical incident reports and video clips into a list of usability problems.____ hours _____ min.
I generally agreed with the severity ratings user-subjects gave to critical incident reports.Stronglydisagree
p1
p2
p3
p4
p5
p6
Stronglyagree
pN/A
It was easy to understand the content of the critical incident reports.Stronglydisagree
p1
p2
p3
p4
p5
p6
Stronglyagree
pN/A
It was easy to create a list of usability problems using the critical incident reports and the videotape clips.Stronglydisagree
p1
p2
p3
p4
p5
p6
Stronglyagree
pN/A
The videotape clips played an important role in understanding critical incidents.Stronglydisagree
p1
p2
p3
p4
p5
p6
Stronglyagree
pN/A
The audio portion of the videotape clips played an important role in understanding critical incidents.Stronglydisagree
p1
p2
p3
p4
p5
p6
Stronglyagree
pN/A
I could have determined the usability problems without using the videotape clips (only with the critical incidentreports).Stronglydisagree
p1
p2
p3
p4
p5
p6
Stronglyagree
pN/A
I would prefer to determine the usability problem descriptions without using the videotape clips (only with thecritical incident reports).Stronglydisagree
p1
p2
p3
p4
p5
p6
Stronglyagree
pN/A
I would prefer to listen to verbal critical incident reports (i.e., audio with user’s voice) rather than reading textualreports.Stronglydisagree
p1
p2
p3
p4
p5
p6
Stronglyagree
pN/A
I would prefer to determine the usability problem descriptions only using the videotape clips (i.e., video and audio,no textual reports).Stronglydisagree
p1
p2
p3
p4
p5
p6
Stronglyagree
pN/A
I would prefer to read the online version of the critical incident reports instead of paper copy.Stronglydisagree
p1
p2
p3
p4
p5
p6
Stronglyagree
pN/A
The length of the videotape clips (3 min.) showed enough information to help me determine usability problems.Stronglydisagree
p1
p2
p3
p4
p5
p6
Stronglyagree
pN/A
If 3 min. was not the best length for you, what is your desired length? _______ min.

José C. Castillo Appendices
125
APPENDIX D: SCRIPT OF TRAINING VIDEOTAPE
D.1 Introduction
“The training lecture conveys explanation content about critical incidents. You will be watchinga videotape of a user who experiences usability problems while performing tasks with varioussoftware applications. Your job is to listen what he has to say about the situations that heencounters and why these are considered as critical incidents. Do you have any questions beforewe play the tape?”
D.2 Deleting a document from a database
Hi, I’m Rex Hartson in the Virginia Tech Usability Methods Lab. In this scene I play the role of auser working on a personal document retrieval system. I’m browsing through some documentshere and I see some information on the screen for a document that I already discarded in thepaper version, so now I want to delete the record from the database.
User remarks[In Browse, go to document #1235.]It looks pretty easy here.I see a button that says Delete Document.I click on that… [A dialog box comes up.]Oh, wait a minute!I got a dialog box that says “Are you sure you want to delete?”.OK, that makes sense to me as a user… to be cautious.But what is this funny looking stick of dynamite here. I’m not sure what it means, except thatprobably is some kind of warning. Looks too dangerous; scary.
Explanation of critical incidentThis is a minor critical incident. The icon is inappropriate for the situation. OK, lets continue on.
User remarks[Still at same dialog box.]But, the next sentence confuses me. It says “This marks the record for deletion.”Well, I didn’t ask the system to mark it. I asked the system to delete it.And there is another button here that also says “delete”. So I guess I should click on that to seewhat happens.[Dismiss dialog box.]Well, nothing happened. The record is still there.OK, yeah. Up here it says marked for delete.
José C. Castillo Appendices
126
Explanation of critical incidentThis usability problem is of intermediate importance. There is no good feedback and the messageis not visible enough. OK, now back to the user.User remarksNow, I’m really confused even more. I don’t know whether I deleted it or not.I still see the document here, but maybe if I go backwards by one, and then come back, maybe itwill be gone.No, it’s still there. It still says marked for delete.So, I don’t really understand what it takes to actually delete it. It looks like it only marked it fordelete. And I really don’t know what that means.[Pause and click the “Undelete” button].
Explanation of critical incidentTo explain, this one is a major critical incident. The user is confused about the model of how thesystem works for deletion.The interface doesn’t help the user understand that model.The way it really works is, when you click on this button to delete a document, it actually justmarks it for deletion.In the next dialog box, it alludes to this but doesn’t really explain it. That leads to confusion. Iffact, you can still undelete it by clicking on the undelete button, any time you want to up until thetime that you use a function called “Permanently delete from the database”. And that actuallydeletes all of the records that are marked for deletion and permanently removes them from thedatabase.At that point, they are unrecoverable.There is a second somewhat minor usability issue related to these two buttons. Instead of havingtwo buttons, we could combine the two into a single button and toggle back and forth betweenthe two labels, for Delete and Undelete.OK, let’s assume that we have just told the user all about how deletion works and pick up thattask from here to go ahead and get rid of the record. Again, I’ll play the part of the user.
User remarksNow that I know how this works, I’ll select “Permanently Delete from Database”.And now it says that it will permanently delete records that are marked.OK, so following what was explained to me, then this makes more sense.Now, here is a sentence though that says: “After deletion is done, delete button will be disabled.”What does that mean I should do? I don’t get it.

José C. Castillo Appendices
127
Explanation of critical incidentTo explain this critical incident, that’s useless information. Designers should get rid of it. Is notuser centered. The result is further confusion on the part of the user.Now back to the user.
User remarksI’m not really sure where I am or what I want to do now.I feel like if click on Delete now it could do some damage that I can’t recover from.I guess I need to go and find out more about how this works.So, that means for the moment I do not want to delete. I want to change my mind and back out ofthis.But, there is not way to do that.There is no Cancel button, or Escape button; there is no way to get out of this.So know I really don’t know what to do. I’m stuck.
Explanation of critical incidentIt needs another button. Probably not cancel, but just “Return to MADAM database”, orsomething like that.This is a case of a missing navigational feature. Designers should always allow a way to back outwithout committing to do the delete.

José C. Castillo Appendices
128
D.3 Counting the number of penalties called on your favorite football team
In this example I play the part of a person who is watching on TV one of the final football gamesof the season. I’m disappointed because my favorite team is getting called for many penaltiesduring the game. I know they are capable of winning, but the penalties are holding them back.To take my mind of this dilemma, I decide to count the team’s penalties for myself. So at halftime of the game, I quickly programmed with HTML and JavaScript (Goodman, 1996) a tool tocount the number of penalties.
User remarksSo here we have a penalty counter. You can see that if you click the plus [“+”] button, it putsone in the penalty count. Hitting the minus [“-“] button subtracts and plus adds. I can also resetthe counter by clicking on the Reset button. So, now let’s get on with the game.So here we go, I’m sitting back enjoying the game and out of the sudden, “Oh no!, my team getsa penalty”. So I run up here, click the “+” and we have a penalty of one. So, I’m relaxed againwatching again, and after some chips and soda I realized, “Ugh!, another penalty, too bad, but atleast I’m counting them now.And this goes on as we go through the game, until one time I’m too excited and I clicked up here[Reset button], “Oh no!, what I have done!”. I missed the “+” button over here and actuallyclicked the Reset button by accident. That means that the penalty counter now is reset to zero,and I don’t remember what it was. So, I really made a user error on my little interface.
Explanation of critical incidentThe usability problem here is that the “+” button, which is the most frequently used button, oughtto be featured more prominently and not, in fact, stuck graphically closely in here between theseother two buttons [(i.e., Reset and “-“buttons)]. So, if the “+” button is the more frequently used,we want to make it bigger for one thing, and we want to get it away from this close proximity tothese other two buttons.So, I make a second design which looks like this. In this new design, I now have the “+” buttonway out here on the left side, not buried between two buttons as they were in the first example.Now I have it in left side here and much larger size. It is also far away enough from the Resetbutton so that error that I made is extremely unlikely.

José C. Castillo Appendices
129
D.4 Formatting and labeling a diskette in Microsoft DOS format
In this scene I am a user who is working on a presentation on my Macintosh computer at home. Ineed to take that presentation to work tomorrow, but the computer at my office uses only DOSand can’t read Macintosh diskettes. So I want to reformat one of my diskettes to DOS format,save the document on it, and take that diskette to my office tomorrow.
User remarksSo, I put the diskette in, and a dialog box comes up here.So I choose the format here to be the DOS format.And now I want to assign this a name since this is for my presentation, so I am going to type inthe title “Presentation 1997”.[Start typing. After typing “Presentatio”, a beep sounds.]Ugh! It beeped there in “Presentatio”.I’m not sure why it didn’t…[Type another letter and a beep sounds.]Oh. It beeped again.What I want to do is type this in…[Type another letter and a beep sounds.][Dialog box appears on screen.]Ha! At last, a message here: “Cannot add more characters to the name, because DOS disk namesare limited to 11 characters in length”.Yes, that’s right. I did forget DOS uses shorter names.OK, well. I’ll get rid of that.And go back here and call it “Presn97” to shorten it up.
Explanation of critical incidentTo explain, the usability problem was that the length of this box indicates that I can put a lotmore than 11 characters in here, even though is selected as a DOS format down here.[Highlight extra space of text box].This extra space is a misleading visual cue. The long highlighted text field makes me think I cantype more in, but I really can’t.The solution for this, which would have facilitated my task and help eliminate errors, would havebeen to change the size of this text box to just 11 characters when I selected the DOS formathere. Then I could have seen that I am running out of space for the name when I ran into the endof the box, and I would have known immediately why it was beeping.

José C. Castillo Appendices
130
D.5 Changing the Auto-save parameter of Microsoft Word to 1 ½ or 1.5 minutes
In this scene I am a user who is writing a paper using Microsoft Word on a Macintosh computer.There have been electrical storms going on, and the power sort of has been flickering. But I reallyhave a deadline and the work is going very slowly because it’s hard to think what I want to writewhen I’m worried that maybe the power might fail and I’ll loose my document. So what I want todo is to use “Autosave” and I want to set it so that is very short time between saves. So I’m goingto pick something arbitrary like 1 ½ minutes or something like that.
User remarks[A Word document is already open.]So, I’m in Word right now.[User is looking at different menu options.]I want to do “Autosave” here, so I’m looking at all these different things here.[User is looking at “File” menu option.]Looks like it has to do with this menu up here because it really is about files.So let me look and see if there is anything about “Autosave” .No… there is “Save”, “Save as… ”, all that kind of stuff, but there is nothing about “Autosave”.Is not about editing, I don’t think. No…Not “View”, “Insert”, “Format”.Well, I don’t really think of it as a “Tool”, but … .I guess … ..Yeah, that’s the one right there because it is really about a preference; setting a preference.I bet that’s it!I never would have guessed that it was under “Tools”, but… .Oh yeah.. “Open and Save”. It’s sure about that.Yeah, there we are.
Explanation of critical incidentTo explain, there is a somewhat minor usability problem in providing easy access or affordancein locating the “Autosave” command. With the large number of Word commands, designers can’tput them all on the menus. But maybe the names could be labeled better, or bring out“Preferences” on its own menu. Now lets continue with the user.
User remarksOK, I want to click on “Autosave”; save every reminder.It looks like 15 minutes is the default, but that’s way too long for this electrical storm.So I’m going to put 1.5 minutes; about 90 seconds.OK. Let’s dismiss that box and we can go back to typing.[A beep sounds and an error message box appears on screen.]

José C. Castillo Appendices
131
Oh! OK. Wait a minute here.When I was dismissing the box, I get an error message that says: “Not a valid number”, but atthat point I wasn’t dealing with a number. I was just trying to get rid of the dialog box.The only thing I can think of is that this must refer back to the thing that I did the step before.So the timing is not very good for that message.Also… hang on here, the message is telling me what’s wrong, but doesn’t tell me what I shoulddo.[Click OK button].So I click on OK and get another message that says: “Number must be between 1 and 120”.Well, 1.5 is between 1 and 120!So, I still don’t understand exactly what’s wrong.Anyway, I guess it must be because of the decimal point.So, I better put something like 2 there.[Dismiss box.]Ha! It takes that. OK.[Pause and bring “Preferences” dialog box again.]
Explanation of critical incidentAll right. In this scenario, we ran into several usability problems.First, there was the difficulty of finding the “Autosave” settings.Now, we got here and if you remember I put 1.5 here, and nothing happened, but when I tried toleave the message box, then I didn’t get any immediate feedback, but a delayed feedback for theprevious action.So the timing there was not so good, because really you want an error message closely associatedin time with the action that caused the error.[Try to close dialog box. First error message box appears on screen].And this first error message is simply not very informative.It says: “Not a valid number”.But. A good error message should be constructive and say what is a valid number, and what youcould do to get one.[Click “OK” button and second error message box appears on screen.]So, I get rid of that anyway, and now it tries to give me a little bit of information: “Number mustbe between 1 and 120”.And, in fact, 1.5 is in this range, but the problem is not that 1.5 is not on that range.But, of course, as we found the real problem was it has to be an integer or a whole numberbetween 1 and 120.It doesn’t say that.The problem is that it is in the wrong type.

VITA
José Carlos Castillo, also called Charlie by his family and friends, was born to José andDalila Castillo on September 24, 1972 in San Juan, Puerto Rico. In his senior year ofhigh school, he held the position of battalion commander and the highest rank among allcadets from Antilles Military Academy, where he graduated in May 1989. In August ofthe same year, he entered the Computer Engineering program at University ofPuerto Rico in Mayagüez, Puerto Rico. There he became interested in the area of human-computer interaction and worked as research assistant in several projects related to thisfield. He also worked during four summers as a Software Engineer for Motorola Inc. inSchaumburg, Illinois. He graduated in May 1994 with a Bachelor of Science degree inComputer Engineering.
Castillo continued in pursuit of a Master of Science degree in Computer Science atVirginia Polytechnic Institute and State University, with a concentration in human-computer interaction. Upon completion of this degree in July 1997, he will start workingfull-time as a Human Factors Engineer for U S WEST Information Technologies inDenver, Colorado. He also plans to continue research in human-computer interaction,Web technologies, and remote usability evaluation.


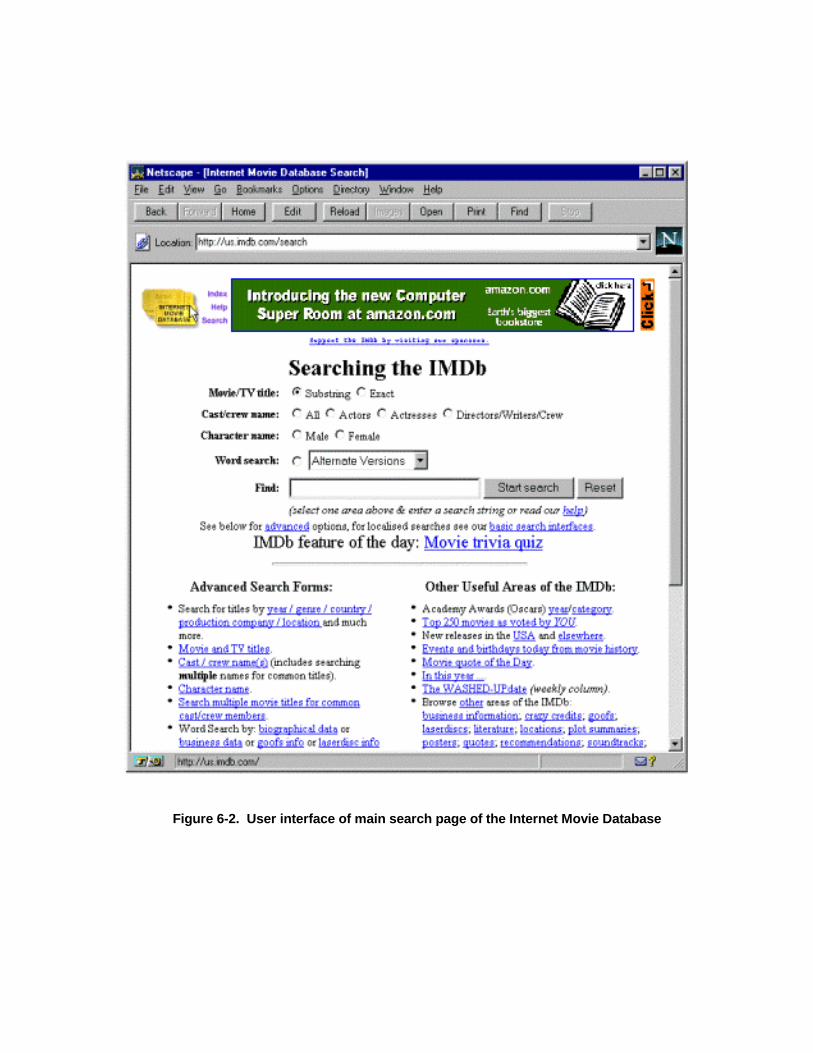
Figure 6-2. User interface of main search page of the Internet Movie Database

Figure 6-3. Sequencing relationships among the screens for Phase I
,QWHUQHW�0RYLH�'DWDEDVH
�:HOFRPH�ZLQGRZIRU�HYDOXDWLRQ�VHVVLRQ
&ULWLFDO�LQFLGHQWLQVWUXFWLRQV�ZLQGRZ
5HPRWH�(YDOXDWLRQ&RQWURO��ZLQGRZ
5HPRWH�(YDOXDWLRQ5HSRUW��ZLQGRZ

Figure 6-4. Welcome window for remote evaluation study

Figure 6-6. Critical Incident Instructions window
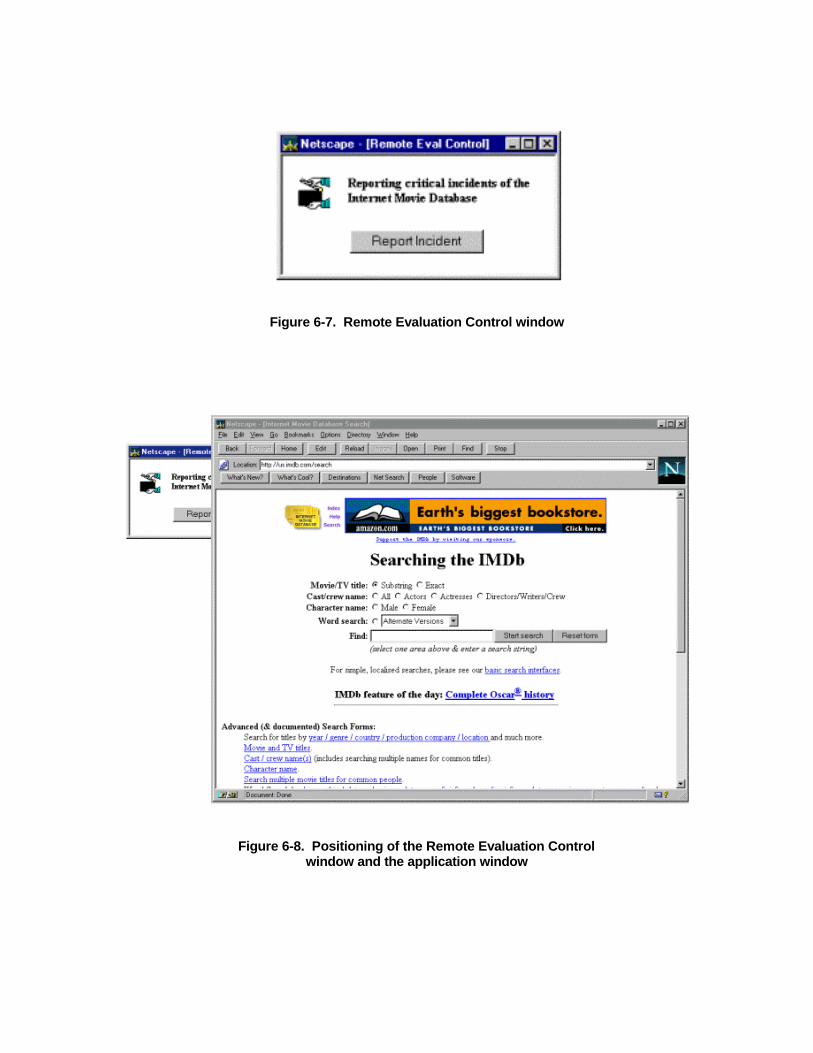
Figure 6-7. Remote Evaluation Control window
Figure 6-8. Positioning of the Remote Evaluation Controlwindow and the application window

Figure 6-10. Remote Evaluation Report window

Figure 6-11. Positioning of the Remote Evaluation Reportwindow and the application window

Figure 6-12. Critical incident found on a Web-based counter
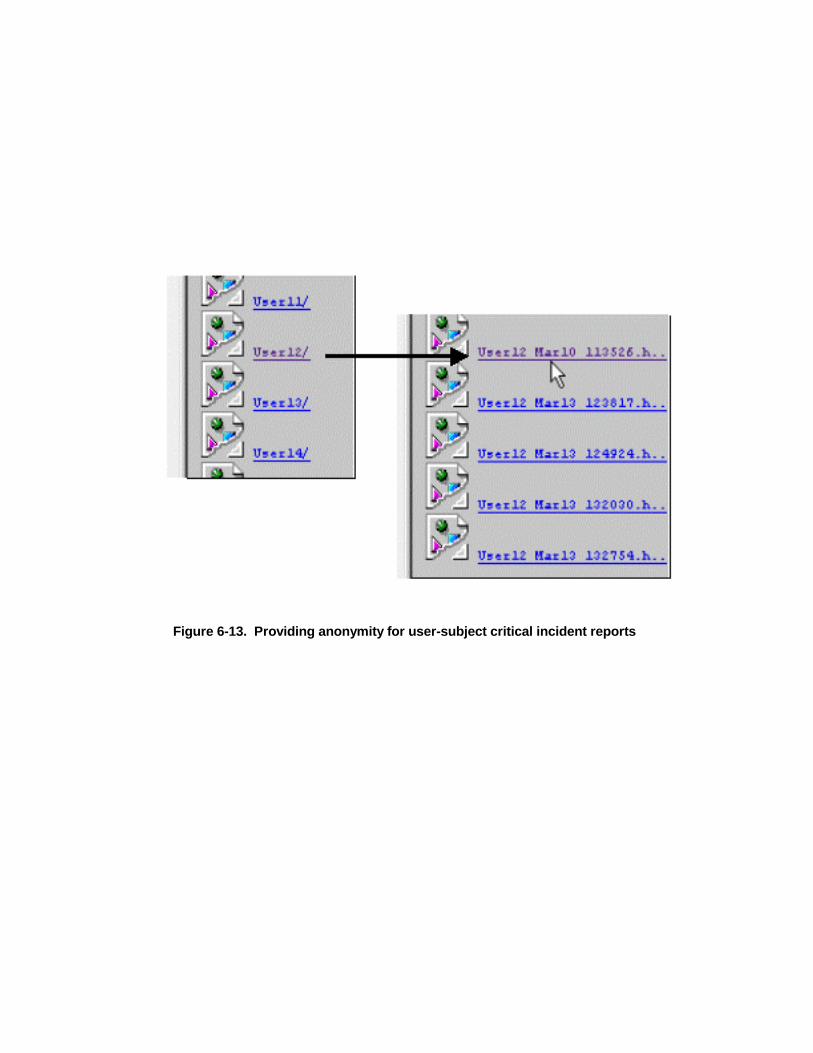
Figure 6-13. Providing anonymity for user-subject critical incident reports

Figure 6-14. Indication of user task and description of the critical incident

Figure 6-15. Indication of how user got out of the situation, ability to recover andreproduce the critical incident, and severity of the critical incident.

Figure 6-16. Suggestions for fixing the problem and location ofthe page with critical incident
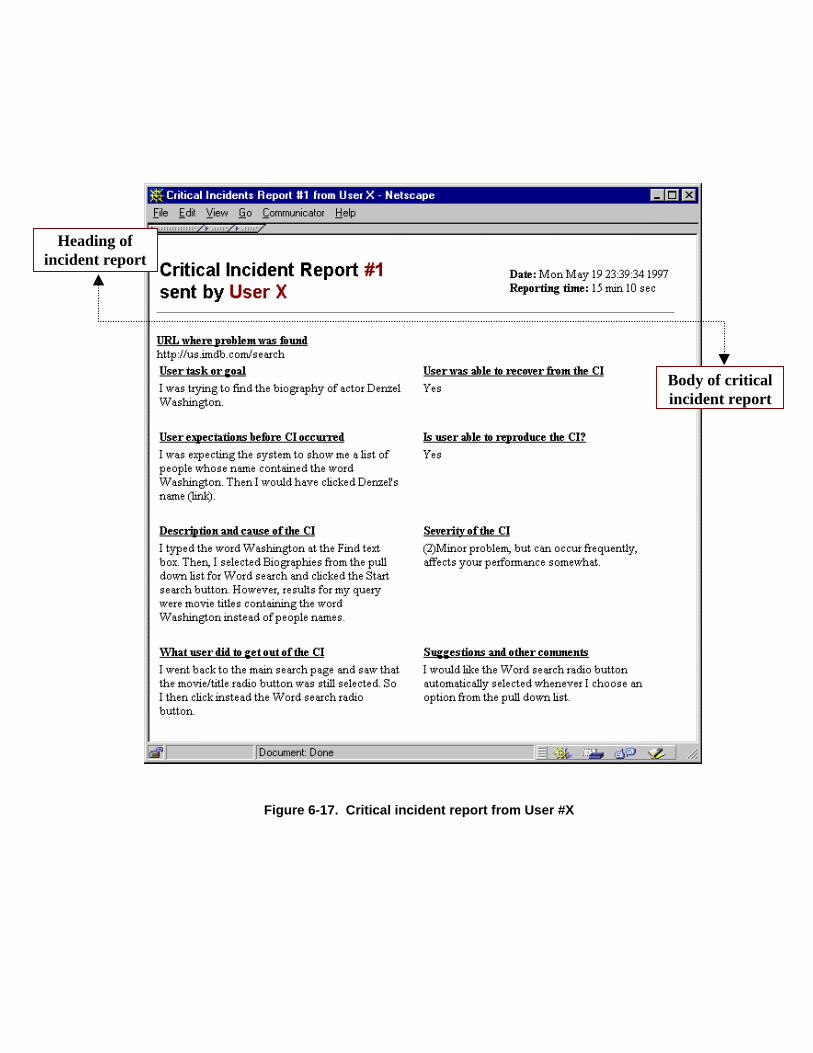
Figure 6-17. Critical incident report from User #X
Body of criticalincident report
Heading ofincident report

Figure 7-7. New critical incident reporting tool
Users click this buttonto send a complete anddetailed report of thecritical incident.
When users identifythat a situation is acritical incident, theyclick this button toactivate a screencapture tool thatrecords a screen-sequence clip showingall screen actions thatoccurred before thebutton was clicked.
Users click this buttonto send quickquestions, comments,and/or solutions aboutthe critical incident.
Users can select apreviously sent criticalincident report fromthis list to browse it inread-only mode.